Article

Multi-Objective Optimization Scheduling for Electric Vehicle Charging and Discharging: Peak-Load Shifting Strategy Based on Monte Carlo Sampling

1
State Grid Shandong Electric Power Company, Dezhou Power Supply Branch, Dezhou 253000, China
2
Institute of the Building Environment & Sustainability Technology, School of Human Settlements and Civil Engineering, Xi’an Jiaotong University, Xi’an 710049, China
*
Authors to whom correspondence should be addressed.
Designs 2025, 9(2), 51; https://doi.org/10.3390/designs9020051
Submission received: 11 March 2025 / Revised: 2 April 2025 / Accepted: 7 April 2025 / Published: 17 April 2025
(This article belongs to the Topic Advanced Electric Vehicle Technology, 2nd Volume)

Abstract

:
The uncoordinated charging behaviors of electric vehicles (EVs) challenge the stable operation of the grid, e.g., increasing the peak-to-valley ratio of the grid and diminishing power supply reliability. A Monte Carlo sampling method is employed to develop a charging behavior model for EVs to solve the problems raised by random charge mode. The probability densities of daily driving distance, initial charging time, charging power, and charging duration are incorporated and analyzed. The proposed model enables multiple random sample values for EVs, considering varying weather conditions and time-of-use electricity prices. For charge and discharge optimization, an EV charge and discharge scheduling model is constructed, aiming to balance multiple objective functions, including battery degradation costs, user charging costs, grid load fluctuations, and peak-to-valley differences. The weighting method is applied to transform the multi-objective framework into a single-objective comprehensive solution, facilitating the identification of optimal charge and discharge strategies. Results demonstrate that the Monte Carlo sampling can satisfactorily generate datasets with realistic characteristics on the driving range and charging initiation time of the EVs. Furthermore, the load results achieved through multi-objective optimization demonstrate that the proposed strategy effectively mitigates peak-to-valley disparities. The peak load reduction and trough load increment are 27.6% and 160.1%, respectively. Through post-peak load balancing, the average costs of each EV for daily charging and battery degradation are reduced to be 7.58 yuan and 15.68 yuan, respectively. This approach can significantly enhance the grid stability, simultaneously address the economic interests of users, and extend battery lifespan.

1. Introduction

With the achievement of the global goals of “carbon peak and carbon neutrality”, electric vehicles (EVs) have become a key part of promoting the transportation sector’s sustainable development due to their energy storage capacity [1] and energy utilization efficiency [2]. This marks a shift in global consumption patterns to sustainable development while alleviating energy shortages and environmental pollution crises [3,4].
The White Paper on the Development of China’s New Energy Vehicle Power Battery Industry (2024) showed that the global delivery of EVs reached 14.061 million units in 2023, a year-on-year increase of 33.4% [5]. Additionally, the “2024 Global Electric Vehicle Outlook” predicts that by 2024, global EV sales will reach 17 million units, accounting for over 20% of total global vehicle sales [6]. It is expected that the global EV sales in China, Europe, and the United States will account for 45%, 25%, and over 11%, respectively. The widespread adoption and promotion of EVs globally are essential for reducing the consumption of traditional fossil fuels and lowering carbon emissions. However, the uncoordinated charging behavior associated with a large influx of EVs results in a significant increase in electricity load [7], adversely affecting power quality—evidenced by issues such as harmonic pollution [8], voltage drops, and three-phase imbalances [9]—as well as operational economy and reliability, which include increased distribution network losses and a reduction in the service life of distribution transformers [10]. Therefore, it is imperative to systematically guide and manage the charging behavior of large-scale EVs, develop rational charging and discharging strategies, and mitigate their negative impact on the distribution network.
To mitigate the impact of EV charging on the power grid, previous research has focused on optimizing charging infrastructure by employing various forecasting methods tailored to different types of EVs, energy supply modalities, and user charging behaviors. For instance, Shahriar et al. [11] evaluated the predictive efficacy of supervised learning, unsupervised learning, statistical approaches, and deep learning techniques in analyzing EV charging behavior. Lee et al. [12] investigated the frequency of use for household and public Type 2 charging facilities among EV users. Esteban et al. [13] examined the variations in efficiency, power transmission, and electromagnetic compatibility across diverse power supply architectures utilized in EV charging systems. Furthermore, studies by Franke and Krems [14], along with Wang et al. [15], sought to understand the charging behavior and preferences of EV users, providing valuable data for optimizing charging services and infrastructure layout.
Currently, the primary applications of EVs can be categorized into private cars, buses, and taxis. Notably, private cars represent the largest segment and exhibit the highest levels of randomness in charging behavior, resulting in a pronounced impact on the power grid. Their scheduling flexibility and potential for optimization are similarly substantial [16]. Consequently, enhancing the charging strategies for private cars is paramount. Sorensen et al. [17] assessed the energy flexibility potential of electric private cars in residential areas using actual charging reports and smart meter data, revealing that charging time distribution and user travel patterns significantly influence EV energy flexibility. Zhou et al. [18] developed a bus charging scheduling optimization model for a single public transport route, accounting for the nonlinear charging curve and battery degradation effects. They validated the model’s effectiveness and feasibility through practical examples, thus providing a scientific foundation and decision support for the charging scheduling of electric buses in actual operations.
Gairola et al. [19] have aimed to address critical challenges in electric bus operations, including vehicle routing, charging station placement, and scheduling of charging times, with the goal of optimizing both operational efficiency and costs. Keawthong et al. [20] constructed an optimization model for determining the location of electric taxi charging stations in Bangkok by integrating operational data, traffic flow metrics, urban geographic information, and relevant infrastructure data. Their findings indicate that ideal charging station locations are near transportation hubs, commercial centers, and densely populated areas, where the demand for electric taxi charging is substantial. This strategic placement not only enhances the efficiency of charging stations but also reduces the driving distance and waiting duration for taxis seeking to charge.
In addition, various charging control strategies such as decentralized, centralized and hierarchical control have been developed [21,22]. Among these, the decentralized control strategy is particularly advantageous for managing large-scale deployments of EVs that may exceed the computational capabilities of centralized control approaches [23]. For instance, to address the privacy concerns of EV owners, Lu et al. [24] proposed an ordered potential game framework for the decentralized pricing of EV charging stations. This framework transformed the Nash equilibrium into a single-objective optimization problem by constructing ordered potential functions. Similarly, Paudel et al. [25] introduced a fully decentralized control strategy that operates without a coordination center, utilizing consensus concepts to safeguard user privacy during charging. Additionally, Moschella et al. [26] proposed a stochastic decentralized control strategy grounded in additive increase/multiplicative decrease (AIMD) mechanisms to allocate available power to large-scale EVs.
While decentralized control strategies reduce computational and communication demands, they do not ensure that the optimization results will reach a global optimum. Hierarchical coordination combines the global optimization benefits of centralized control with the reduced communication and computational needs of decentralized methods, making it widely applicable to power system optimization challenges [27]. For example, Xu et al. [28] performed multi-objective optimization on load fluctuations and operating costs within distribution networks, as well as the profit margins from EV charging, through hierarchical coordination. Their results demonstrated that the total profit for aggregators was nearly equivalent under both hierarchical and myopic charging strategies—approximately three times greater than that achieved under uncoordinated charging strategies.
The time-of-use (TOU) pricing model for EV charging and discharging represents a crucial research area within the integrated development of smart grids and transportation electrification, as it effectively encourages users to engage in off-peak charging. Gao et al. [29] developed a charging and discharging load model for EVs under the TOU framework, demonstrating that the strategic implementation of TOU pricing can reduce the charging load during peak hours of the power grid by a significant margin, typically in the range of 20% to 30%. Simultaneously, this approach may result in a reduction of charging costs for EV users by approximately 15% to 20%, thereby creating a beneficial scenario for both the grid and the users. Yang et al. [30] applied intelligent algorithms to enhance the TOU scheme, achieving notable improvements in its effectiveness. On the grid side, the optimized TOU strategy can lead to a decrease in peak load by around 15% to 20%, thereby alleviating supply pressure on the power grid.
Despite advancements in relevant research, significant opportunities remain for enhancing high-precision load calculations through Monte Carlo sampling and multi-objective optimization scheduling strategies that account for multiple benefits. This study addresses the implications of unordered charging and discharging of EVs on the power grid by establishing a comprehensive multi-objective optimal scheduling model. This model incorporates various factors, including battery degradation costs, user charging expenses, fluctuations in grid load, and differences between peak and valley periods, with the aim of optimizing EV operations for peak shaving and valley filling. Our approach fills this gap by using Monte Carlo sampling to simulate charging randomness and optimize multiple objectives, including battery degradation, user cost, grid stability, and multi-objective optimization. This is in contrast to existing EV charging and discharge models, which typically concentrate on deterministic scheduling or consider the influence of a single target factor and tend to ignore the combination of EV random behavior and multi-objective optimization. In contrast to earlier models, our framework exhibits notable improvements in peak-load transfer and can adjust to various energy demand scenarios.
The Monte Carlo sampling datasets (including information on charging start times, driving ranges, charging durations, and charging loads of private EVs) were utilized to accurately describe the charging and discharging behaviors of existing EV clusters. Furthermore, to evaluate the grid demands of typical building clusters and single hotel buildings, the multi-objective optimization analysis of charging and discharging was used. The research results provide theoretical support and practical solutions for the coordinated and efficient operation of EVs and the power grid.

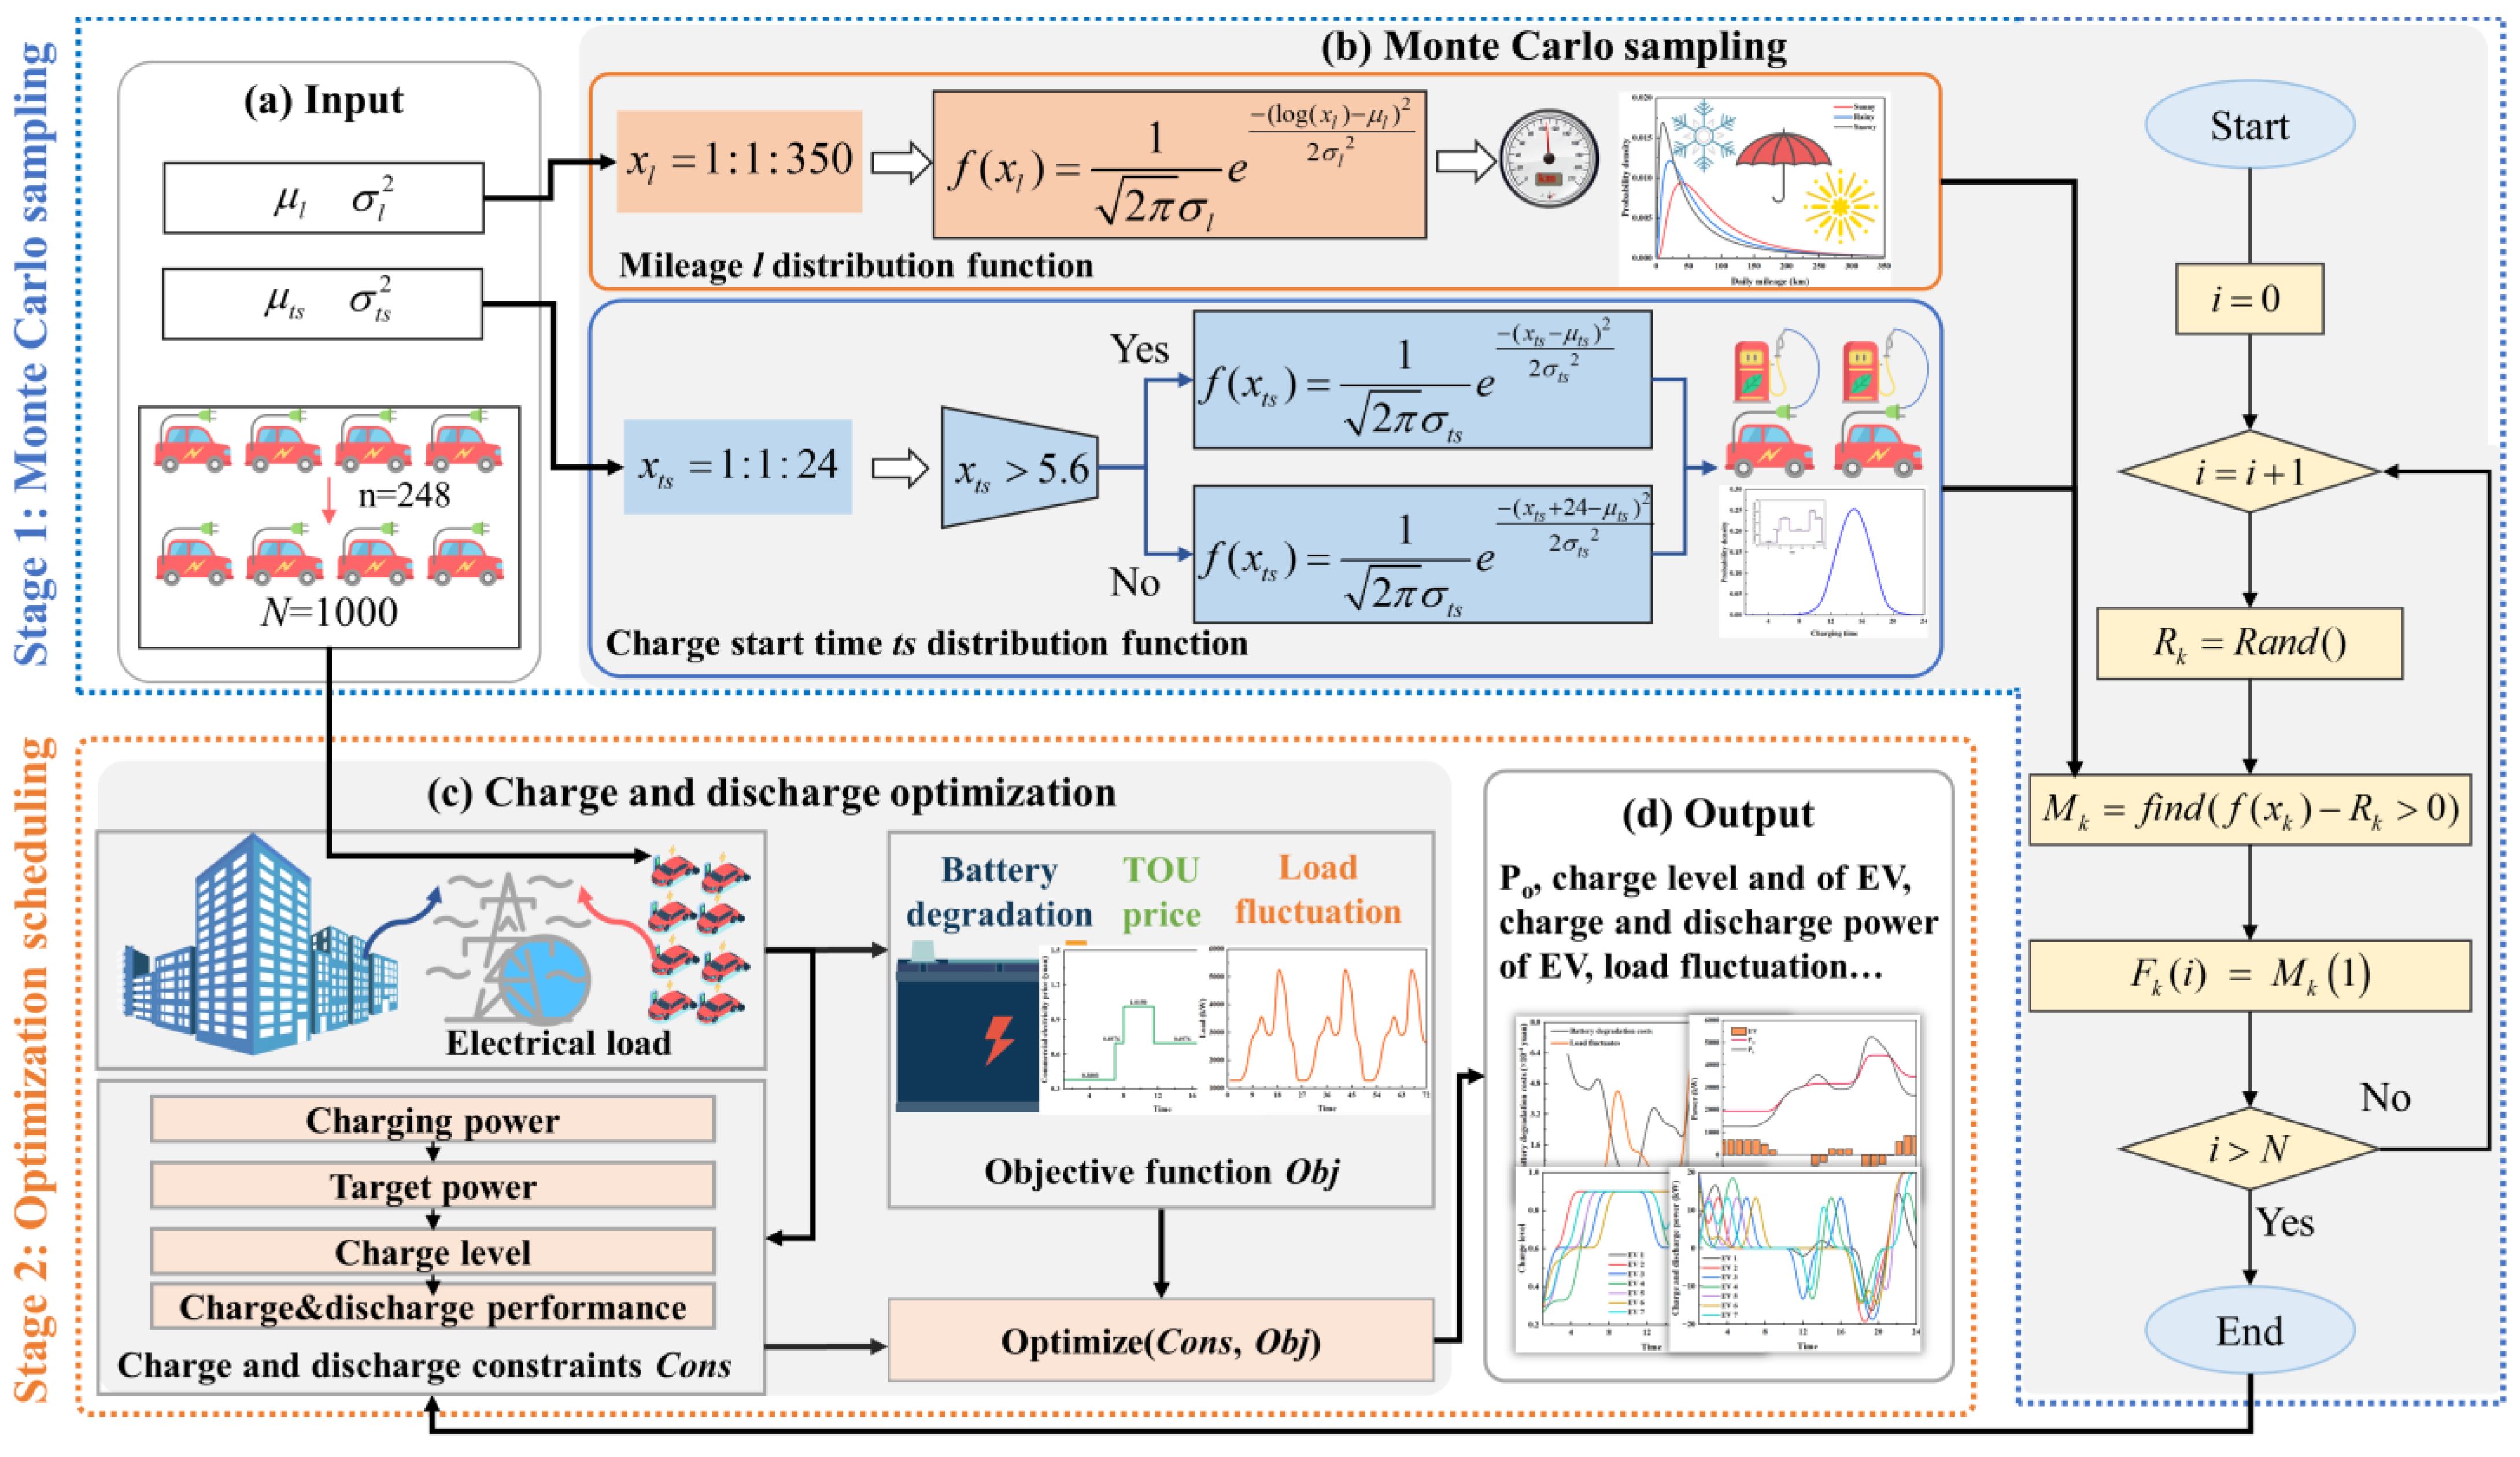
2. Charge and Discharge of EV Scheduling Optimization Model

Figure 1 shows the flowchart of EVs charging and discharging optimal scheduling. The process can be divided into two stages: Monte Carlo sampling and optimizing the scheduling model. In the first stage, the distribution function is constructed according to the specific distribution characteristics, and then the random samples are generated, which include the distribution parameters of daily driving mileage and charging start time.
Utilizing the input probability density function, the Monte Carlo method generates a random sample of EVs, specifically a sample size of N = 1000. From this, a dataset comprising daily driving mileage and charging start times is obtained through Monte Carlo random sampling, serving as essential input data for the subsequent optimization scheduling stage. This stage offers foundational support and critical information for the optimized operation of the overall system.
In Stage 2, various factors are taken into account, including charging power, target power, battery levels, charging and discharging performance, as well as charging and discharging constraints (denoted as Cons). The objective function (denoted as Obj) aimed at comprehensive cost minimization is formulated by considering key factors such as battery degradation costs, time-of-use (TOU) pricing, user charging costs, grid load fluctuations, and the peak-to-valley difference. Subsequently, the constraints and the objective function are input into the genetic optimization algorithm, facilitating the optimization of Obj while strictly adhering to Cons. The final output includes the optimized EV charging levels, charging and discharging power, load fluctuations, and other significant information, thus providing precise and effective guidance for practical charging and discharging scheduling. This ultimately contributes to the stable operation of the power grid.

2.1. Daily Mileage Probability Density Function

Plotz et al. [31] and Zhang et al. [32] showed that the daily mileage of EVs follows a lognormal distribution:
f s ( x ) = 1 x σ s 2 π e ( ln x μ s ) 2 2 σ s 2
where μ s and σ s 2 are the mean and standard deviation of the log of the variable, respectively.
These two parameters are closely related to factors such as vehicle type, urban population proportion and car habit. In this work, Xi’an City, Shaanxi Province, China, is used as the research site, μ s and σ s 2 are obtained based on the travel conditions observed in the study area, with values of 4.3 and 0.8, respectively. In addition, it is worth noting that weather conditions can significantly affect the travel intention of car owners. This paper further investigates the distribution of daily mileage for EV owners under three typical weather conditions: sunny, rainy, and snowy. Specifically, the effects of weather factors on daily mileage are adjusted to accurately reflect the travel characteristics of vehicle owners across these different conditions. The settings for the impact factors ( i f w , μ s and σ s 2 ) under various weather conditions are presented in Table 1.

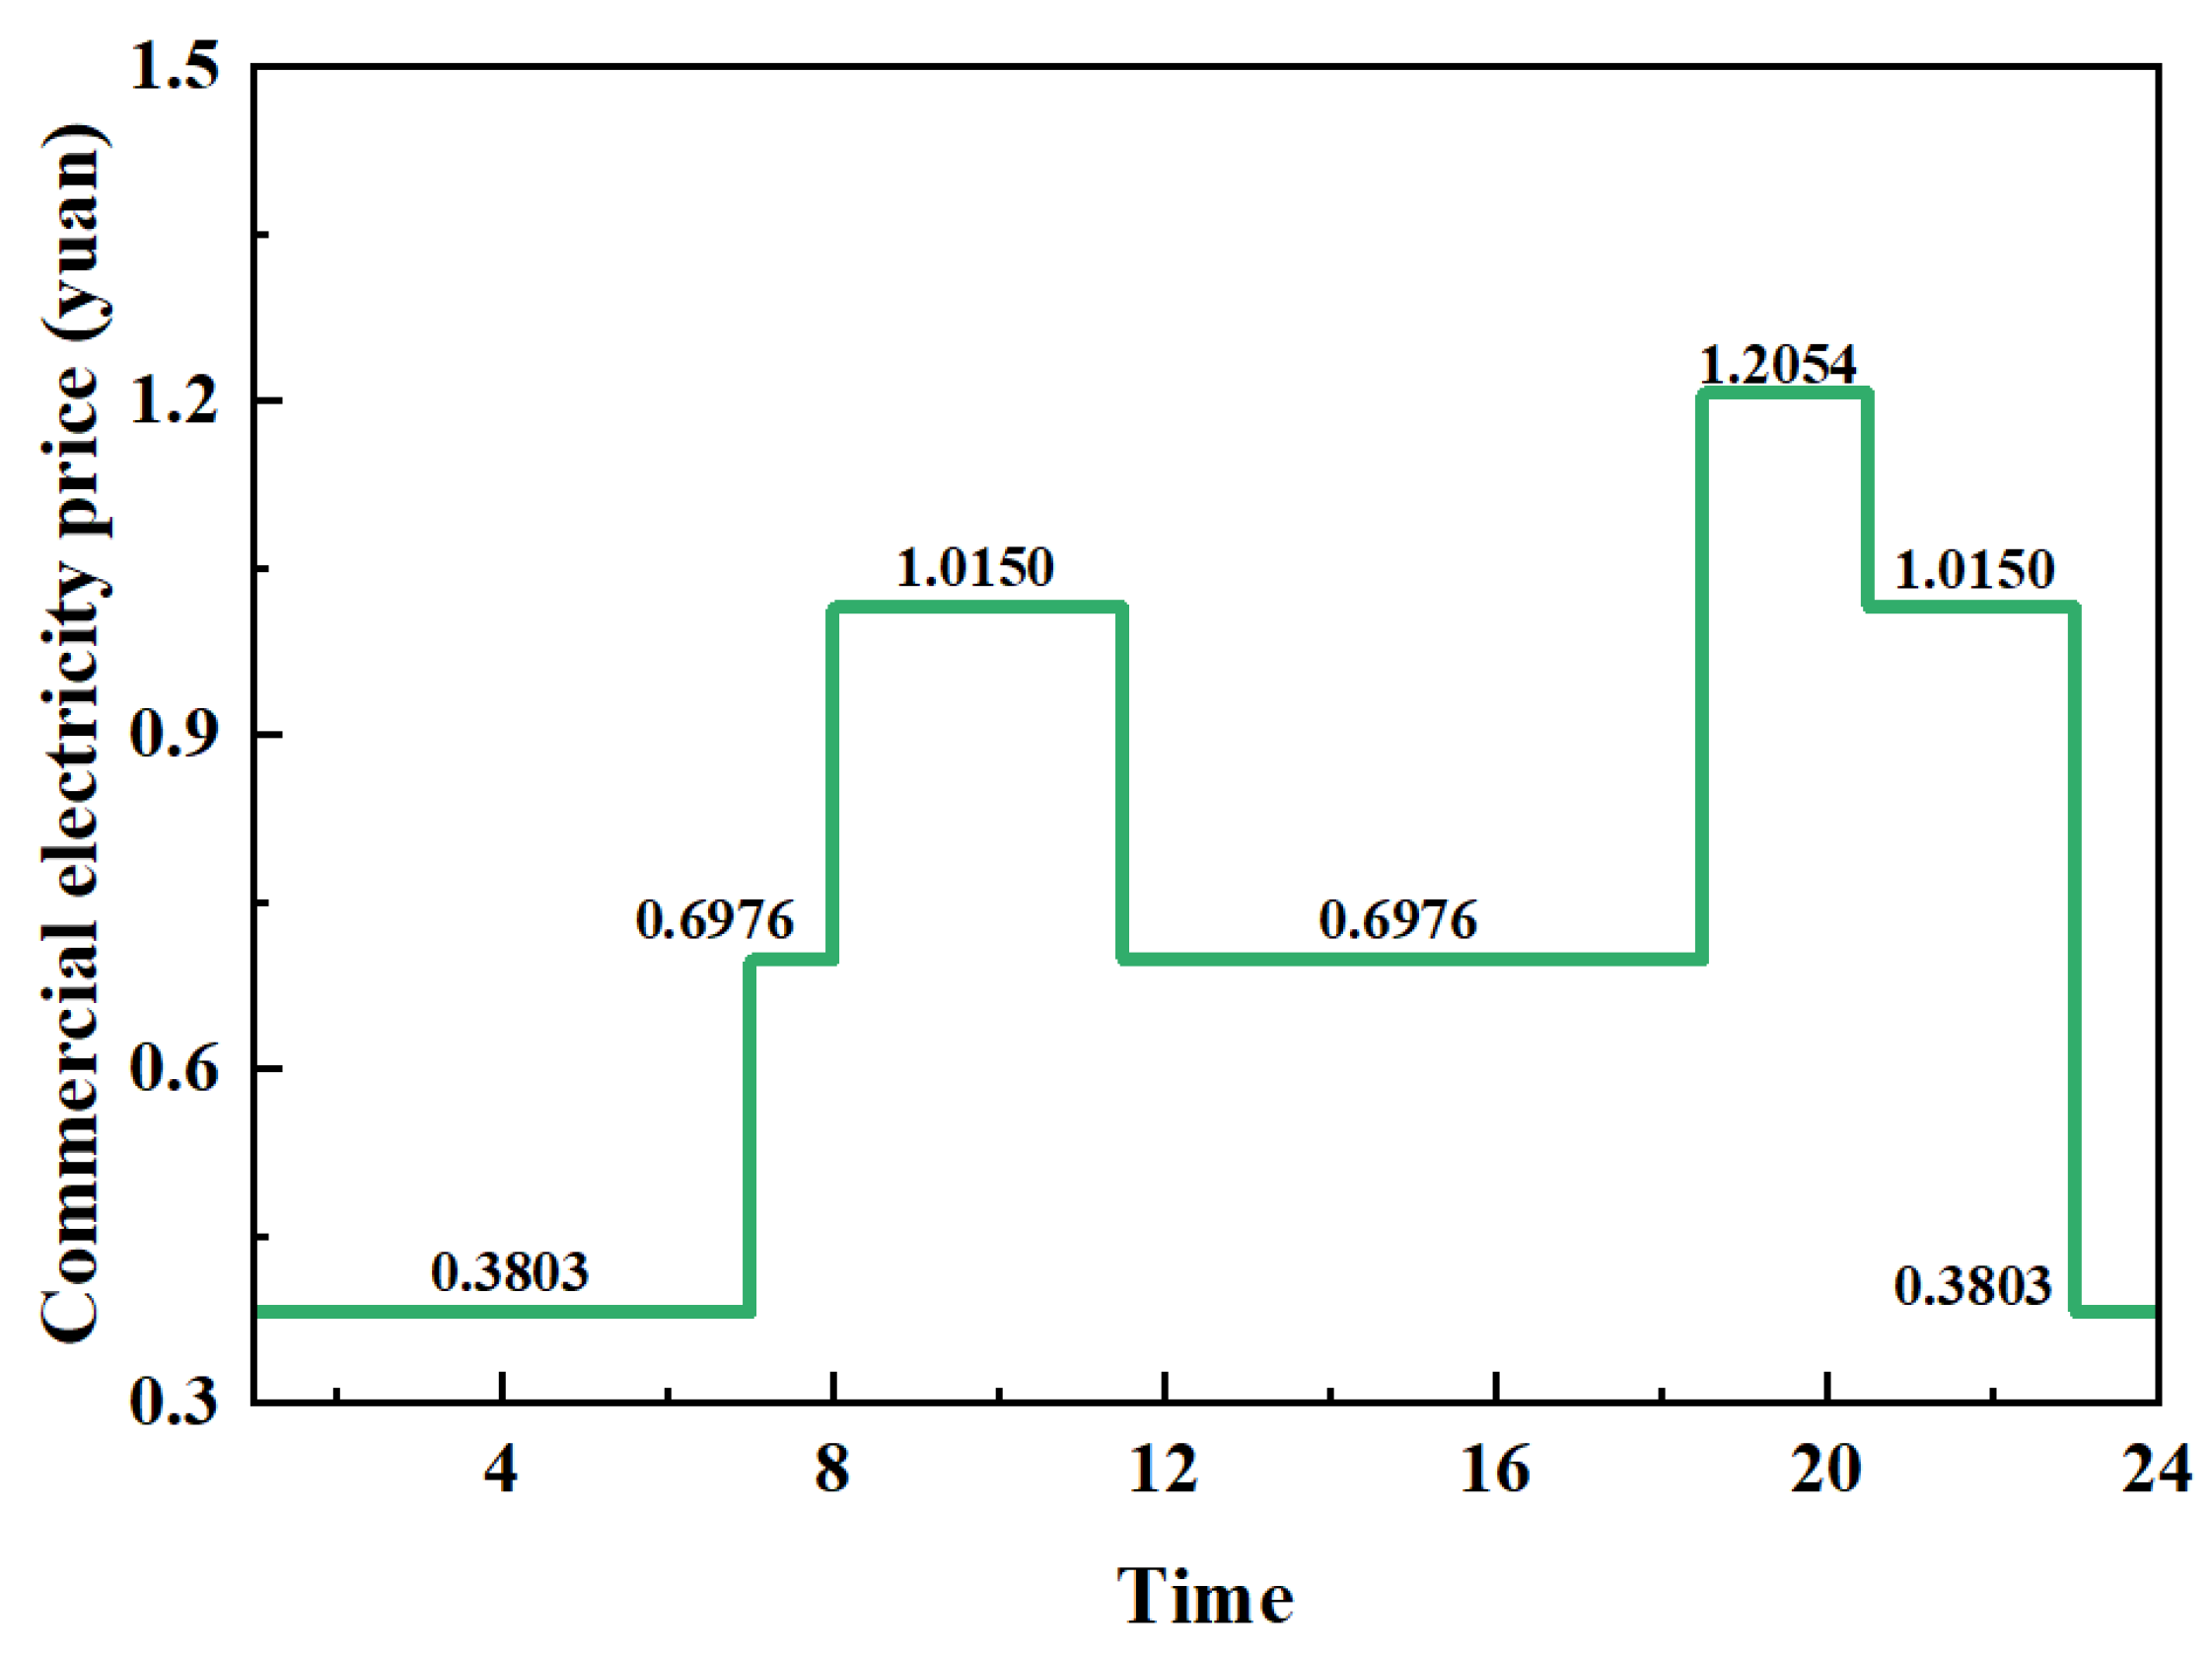
2.2. Initial Charging Time Considering TOU Density Function

Charging start time ts is an important control parameter in EV charging management process, and it is very important to accurately establish its distribution function for grid load optimization. Research and practical experience show that ts at the start time of private EV charging conforms to a normal distribution [33]. However, ts is affected by many factors, including the difference between weekdays and weekends, daily travel habits, and personal charging needs. In addition, it is worth noting the impact of the TOU pricing policy in Xi’an on the charging behavior of car owners, which is because most car owners tend to charge during the time period when the cost is lower. Therefore, the probability density function of charging start time is constructed by combining user charging habits and TOU effects, and the following is obtained.
f E ( t ) = 1 C ( t ) σ t 2 π exp ( t μ t ) 2 2 σ t 2 , ( μ t 12 ) < t 24 1 C ( t ) σ t 2 π exp ( t + 24 μ t ) 2 2 σ t 2 , 0 < t < ( μ t 12 )
where μ t and σ t 2 represent the mean and variance of the ts distribution, set at 13.5 and 3.0, respectively. C t denotes the electricity price at time t.

2.3. Monte Carlo Sampling EVs Charging Power and Duration

Monte Carlo sampling is a stochastic simulation technique used to solve complex uncertainty problems [34]. The randomness within the system is captured by repeatedly sampling from a probability distribution. Factors such as driving range, charging start time, and charging duration of EVs in a region are complex and random; therefore, Monte Carlo sampling is very suitable for the simulation of realistic EV dynamics. To obtain EVs daily mileage l, an initial parameter of 1000 was set, and a random function uniformly distributed between 0 and 1 was generated. Subsequently, the cumulative distribution function of a pre-specified lognormal distribution, in conjunction with defined parameters ( μ s and σ s 2 ), was employed to determine the corresponding mileage value, 1.0. Each simulation cycle produced the daily mileage data for one EV, leading to the generation of daily mileage data for a total of 1000 EVs. Additionally, charging start time data for these vehicles was also derived using the Monte Carlo sampling method, thus providing critical input for the subsequent simulation calculations of charging loads, as illustrated in Figure 1b. Furthermore, based on the driving range and charging start time data collected through Monte Carlo sampling, the corresponding charging power (W) and charging time (h) datasets were obtained. The calculations are detailed in Equations (3) and (4). This simulation framework comprehensively captures the complexity of EV charging loads and offers a more scientific and accurate foundation for decision making in EV charging load management.
W = l l e
h = W p
where le and p are respectively the mileage per unit power, and the charging power. The unit mileage of EVs varies according to the brand, model and use. In this paper, the value of le is 7.5 km·kW−1·h−1. The charging power varies according to the charging method of EVs, the type of charging pile and the acceptance capacity of the battery. Among them, the power range of DC fast-charging pile is usually 20~150 kW [35], and the maximum charging power value of p in this paper is 20 kW [36].

2.4. Charging and Discharging Optimization Model of EV

In this study, we propose a multi-objective optimal scheduling model for the charging and discharging of EVs, with the goal of converting numerous dispersed EVs into schedulable mobile energy storage units. This transformation enables the EVs to participate in peak-load shaving and helps stabilize the grid during fluctuations in load. Discharging EVs during peak power grid hours serves to mitigate supply deficits and reduce the risk of grid overload, while charging occurs during off-peak periods to absorb surplus electricity and smooth the load curve.
The primary objective of the optimization model is to establish a comprehensive multi-objective scheduling framework that adapts to real-time load variations and time-of-use pricing. This framework takes into account several factors, including load costs, battery degradation costs, the peak-valley load differential, and load fluctuations. To address the inherent trade-offs between multiple objective functions, we employ a weighted method to consolidate these objectives into a single comprehensive objective function for optimization, as illustrated in Figure 1c. In this analysis, six operating conditions, detailed in Table 2, will be examined. These conditions are derived from the combination of two electric load scenarios (the iHARBOUR campus and Manlan Hotel in Western China) and four varying numbers of EVs (100, 200, 300, and 400). Through the implementation of this optimized charging and discharging strategy, we aim to not only reduce battery degradation and charging costs for EVs but also to facilitate the effective utilization of renewable energy resources. Ultimately, this approach promotes the sustainable development of smart grid systems and the integration of EVs.

2.4.1. Constraint Condition

Battery capacity, charging state restrictions, and grid stability requirements all have an impact on the EV charging and discharging power constraints that are incorporated into the model. The charging and discharging power of any EV P in any time period satisfies:
P min   P P max
where P min and P max represent the minimum and maximum of charging and discharging power, respectively, and are determined by factors such as charger type, EV standards, and grid limits.
The battery power of any EV P b i , t satisfies:
S m i n E c P b i , t S m a x E c
where S m i n = 0.1 and S m a x = 0.9 represent the minimum and maximum charging levels of the battery, respectively [37], and E c is the battery capacity. This constraint can effectively ensure the state of charge of the vehicle battery in a reasonable and safe range, avoid excessive charge and discharge damage to the battery, and prolong the service life.
The initial battery level of the EV E o i , 1 is randomly generated within the range of the minimum and maximum charge level data of the battery thermal capacity:
E o i , 1 0.3 E c + N 0 , 2 , S m a x E c
where N 0 , 2 is Gaussian noise, which is used to simulate random fluctuations in the initial battery charge [38].
The battery capacity of the EV at t time E i , t can be expressed as the comprehensive effect result of the battery capacity at the previous time and the current charging and discharging power, namely:
E i , t = E i , t 1 + P i , t 1 η
where η is the charging and discharging efficiency coefficient, which is usually 0.95, considering the vehicle battery’s charge state is in a reasonably safe range to avoid damage to the battery caused by overcharge and over-discharge, and prolong the battery’s service life.
Through the setting of the above constraints, the rationality and feasibility of the charging and discharging optimization model are ensured, which ensures that the EV can give full play to its role as a mobile energy storage unit and effectively regulate the grid load while meeting the charging demand.

2.4.2. Objective Function

To address the peak-valley difference issue resulting from EV charging on the power grid, the development of a scientifically sound and rational optimal scheduling strategy model is essential. From the perspective of power suppliers, implementing such a model can significantly reduce peak load, lower the expansion costs of power supply infrastructure, and enhance the operational efficiency of the power grid. For consumers, this approach can decrease personal charging expenses, thereby yielding economic benefits. Furthermore, by mitigating the frequency of battery overcharging and over-discharging, the model can extend battery life, maximizing the combined environmental and economic advantages.
Consequently, multi-objective optimization scheduling should not only aim to flatten the grid load curve and alleviate power supply pressures during peak hours but also consider several additional objectives, including user charging costs and battery lifespan. In the EV charging and discharging optimization model proposed in this study, the design of the objective function seeks to comprehensively evaluate various factors, such as battery degradation costs, EV user charging costs, peak-valley load differentials, and load fluctuations, ultimately facilitating the collaborative optimization scheduling of EVs and the grid.
Considering the volatility of time-of-use (TOU) pricing, the overall charging cost ( C c o s t ) is calculated by summing the products of the charging and discharging power of the EV during different time periods and the corresponding electricity prices. This relationship is expressed as follows:
C c o s t = i = 1 n t = 1 24 P i , t C t  
where n is the number of EVs, P i , t is the charging and discharging power of the i EV at time t (charging is positive, discharging is negative).
Battery degradation loss results from the frequent charging and discharging of EVs, leading to a reduction in battery life. The cost associated with this degradation is typically proportional to both the charging and discharging power and the overall usage of the battery. Assuming a direct correlation, the degradation loss cost ( C d e g ) can be expressed as follows:
C d e g = c i = 1 n t = 1 24 P i , t   C c E c
where c denotes the battery degradation coefficient, C c  represents the degradation loss cost per unit battery capacity.
The charging and discharging activities of EVs significantly impact grid load; therefore, fluctuations in grid load must be accounted for during the optimization process. To maintain a balance between supply and demand within the grid, it is essential to minimize excessive load fluctuations. Load variation is represented by the change in grid load ( F l f   ), denoted as:
F l f   = t = 1 24 ( P 0   + i = 1 n P i , t   ) ( P 0   + i = 1 n P i , t + 1   )
where P 0 is the base grid load and i = 1 n P i , t is the sum of charging and discharging power of all EVs in time period t.
Furthermore, the maximum difference of grid load between different time periods needs to be controlled. The calculation method of load peak-valley difference F p v   is as follows.
F p v   = m a x ( P 0   + i = 1 n P i , t   ) m i n ( P 0   + i = 1 n P i , t + 1   )
where m a x and m i n represent the maximum and minimum values of the power grid load within 24 h, in respective.
To facilitate the optimization process, the multiple objective functions are consolidated into a single comprehensive objective function using a weighting method. In this framework, the weight coefficients of charging cost, battery degradation, grid load variation, and grid load peaking and valley difference, denoted as α 1 , α 2 , α 3 , and α 4 , with values of 0.2, 0.3, 0.3, and 0.2, respectively, are assigned based on practical requirements to balance the significance of the various objectives. This results in the final optimization objective:
O b j = α 1 C c o s t + α 2 C d e g + α 3 F l f + α 4 F p v
By minimizing this comprehensive objective function, an optimal EV charging and discharging strategy can be determined, which not only reduces battery degradation losses and charging costs but also balances grid load, thus ensuring both the stability and economic efficiency of grid operations.

3. Results and Discussion

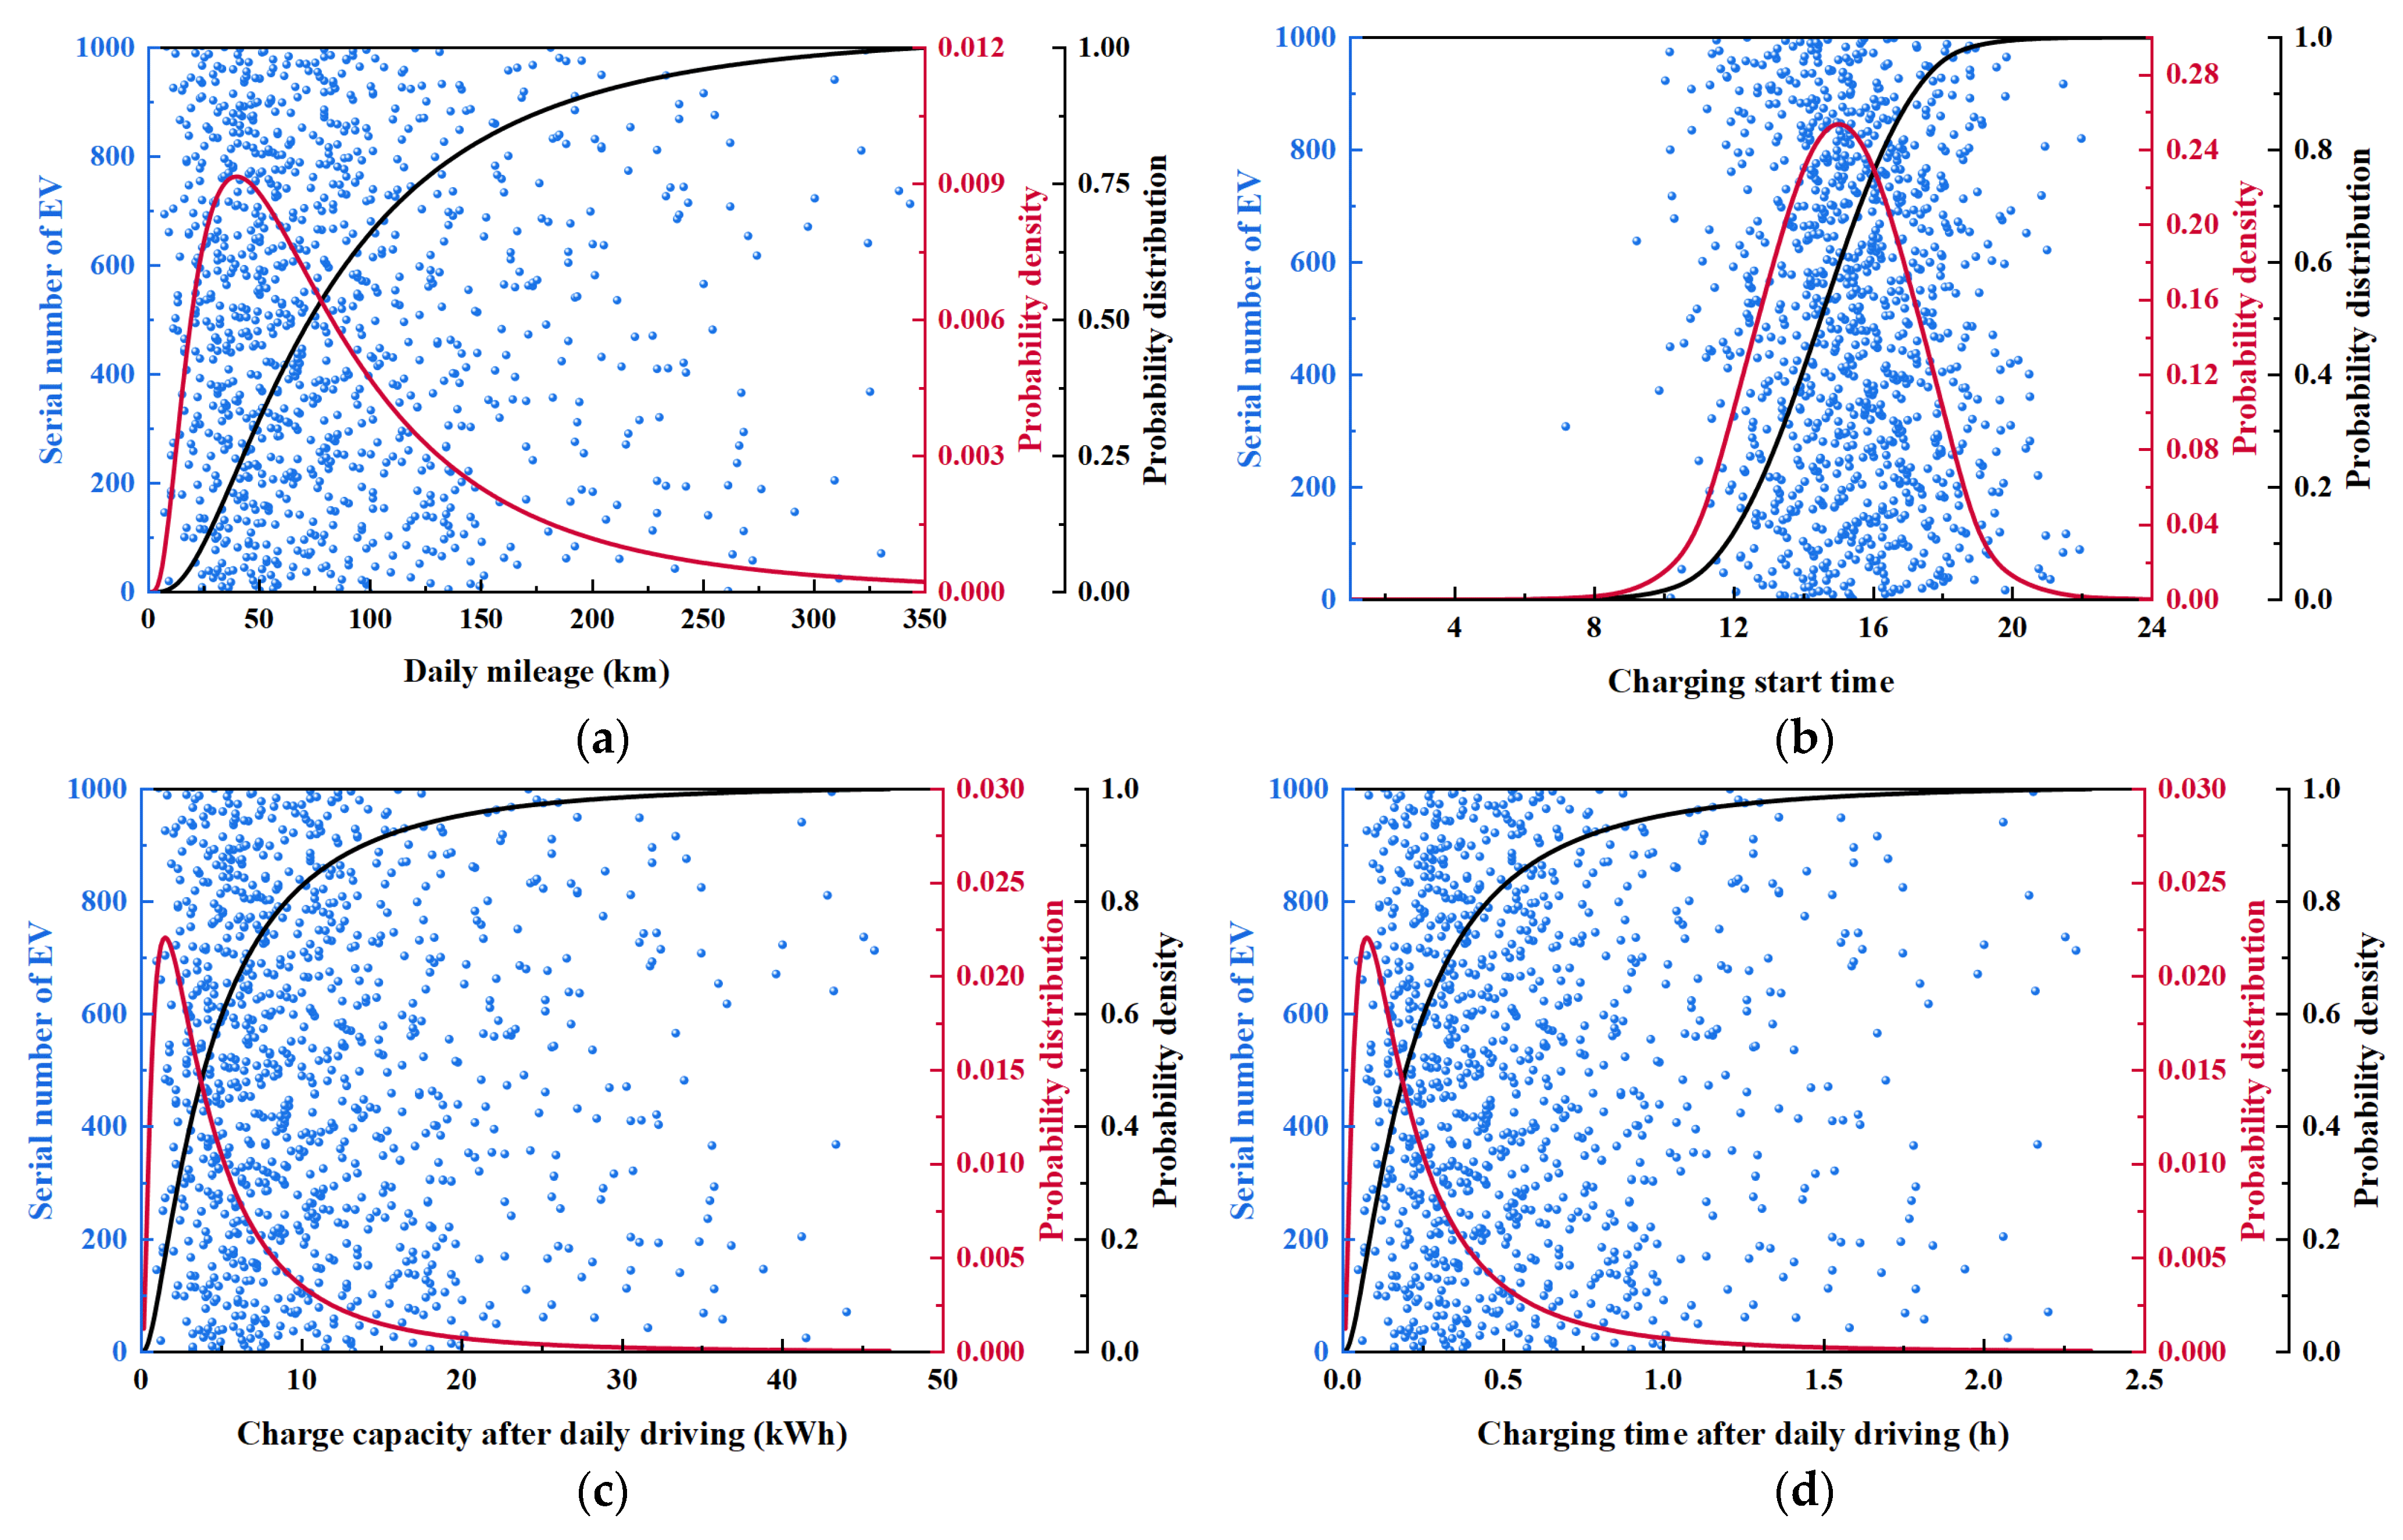
3.1. Monte Carlo EV Cluster Features

3.1.1. Daily Mileage l

Figure 2a illustrates the distribution of daily driving mileage for each EV. Additionally, it presents both the probability distribution curve and the probability density curve derived from 1000 discrete results. Notably, the probability density curve approximates a log-normal distribution, thereby confirming the validity of the findings. Specifically, approximately 80% of EVs exhibit a daily driving mileage of less than 50 km, while around 15% fall within the 50 to 100 km range. Only a small fraction of vehicles surpass the 100 km mark. The peak of the density curve is located at 50 km, with a peak height of 0.009.
Figure 3 illustrates the probability distribution curves and probability density curves of daily driving mileage for EVs under varying weather conditions. As depicted in Figure 3b, during sunny weather, the peak position is situated toward the right, approximately at 50 km. In contrast, the peak positions for rainy and snowy weather shift progressively to the left, with offsets of 20 km and 30 km, respectively. Notably, the peak height for sunny weather reaches its lowest level, slightly below 0.01, while the peak heights for rainy and snowy conditions increase by approximately 0.003 and 0.008, respectively.

3.1.2. Charging Start Time ts

According to the electricity price list for industrial and commercial users in Xi’an, Shaanxi Province, published by the State Grid in August 2024, electricity prices in Xi’an exhibit differentiated distributions across various time periods (as illustrated in Figure 4). Specifically, the valley electricity price period occurs nightly from 23:00 to 07:00 the following day, while the normal electricity price periods are delineated from 07:00 to 08:00 and from 12:00 to 18:00. The peak electricity price periods are defined from 08:00 to 11:30 and from 20:30 to 23:00, with the ultra-peak electricity price period occurring from 18:30 to 20:30. The respective electricity prices for these four categories are 0.3803, 0.6976, 0.0150, and 1.2054 yuan per kilowatt-hour. The TOU pricing is factored into the user charging cost function of the charging optimization model, and the car owners are incentivized to charge during off-peak hours to lower the user charging costs and lessen the grid pressure.
Figure 2b presents the distribution of charging start times for each EV, taking the time-of-use electricity pricing into consideration. Based on 1000 discrete results, the probability distribution and probability density curves of the charging start times for EVs have been generated. The probability density curve closely approximates a normal distribution, thus validating the integrity of the results. The findings indicate that the probability distribution of charging start times for EVs demonstrates the characteristics of an evening rush hour. Specifically, less than 5% of vehicles initiate charging before 12:00, while approximately 80% commence charging prior to 16:00. The majority of vehicles finalize their charging start times before 20:00, with the most concentrated distribution period occurring between 14:00 and 18:00. The peak of the probability density is situated around 15:00, reaching a height of 0.25. This concentrated distribution period (from 12:00 to 18:00) effectively utilizes the relatively moderate normal period electricity prices, which not only helps lower users’ charging costs but also satisfies the charging and usage needs of vehicle owners during standard daytime hours. This alignment fosters a beneficial connection and equilibrium between the electricity pricing policy and users’ charging behaviors.

3.1.3. Charge Power Required After Daily Driving

This study utilizes the Great Wall C30 EV, commercially available, as a case example. This vehicle has an efficiency of approximately 7.5 km traveled per kilowatt-hour (kWh) of electricity consumed. Utilizing the driving mileage data presented in Figure 2a, the power consumption can be calculated in reverse, thereby determining the required charging amount for each EV following daily use. Figure 2c depicts a scatter plot representing the required charging amounts for 1000 EVs after daily driving, along with its corresponding probability distribution curve and probability density curve.
Data analysis reveals that approximately 80% of the vehicles require less than 10 kWh of charge after daily operation, indicating that the daily power consumption for the majority of vehicles is comparatively low. Around 10% of the vehicles require between 10 and 20 kWh, while only a small number necessitate up to 30 kWh, with an extremely limited number exceeding 30 kWh. The probability density peak for charging is positioned within the range of 1 to 2 kWh, reaching a height above 0.020. This suggests that the charging requirements of most vehicles are concentrated at relatively low levels, a phenomenon likely related to the prevalence of daily short-distance driving scenarios.

3.1.4. Charge Time Required After Daily Driving

A further investigation was conducted to analyze the charging duration required for 1000 vehicles following their daily operation. For this analysis, the charging power of each EV was standardized to 20 kW. By dividing the required charging amount by the charging power of 20 kW, the charging time necessary for each EV was calculated. The corresponding scatter plot in Figure 2d effectively illustrates the distribution trends of charging duration across the sample of EVs, providing an intuitive representation of the variations in charging duration among different vehicles. Additionally, the probability distribution curve and probability density curve are presented based on the discrete results.
Analysis shows that about 80% of the vehicles take less than 0.5 h to charge after daily use, indicating that most vehicles have fast charging speed. About 10% of the vehicles have a charging time of 0.5 to 1 h; although the time is relatively long, it is still within a reasonable range. A few vehicles can take up to 1.5 h to charge, while the vast majority take less than 2 h. This indicates that the charging time distribution of vehicles is relatively concentrated, and most of them can efficiently complete charging. In addition, the probability density curve peak of charging duration appears at around 0.1 h, with a peak height exceeding 0.02, which may be related to factors such as battery technology progress, charging equipment compatibility, and users’ charging habits.

3.2. Electric Vehicle Charge Level

The study aims to optimize the charging and discharging scheduling of EVs, with the goal of reducing overall load costs, decreasing peak-valley differences, and depleting fluctuations. An optimization algorithm was used to develop the optimal charging and discharging strategies by simulating the random behaviors (such as arrival and departure times) of EVs and combining them with a time-of-use electricity pricing model. Finally, the power status and load power data before and after optimization of EVs were analyzed and displayed.
The simulation effectively schedules the charging and discharging of seven EVs within 24 h by utilizing techniques such as the Monte Carlo method, constraint condition limitations, and multi-objective optimization. This scheduling plan aims to optimize peak valley reduction, cost reduction, battery life extension, and other objectives. The arrival time t i 0 , departure time t i d , and initial power E i 0 for these seven vehicles are modeled to follow a normal distribution. Following rounding and interval adjustments, these parameters are constrained to fall within the rational time interval of [24].
Using this information, the grid connection periods for each vehicle are determined, followed by the definition of the upper and lower limits for charging and discharging power P c h a r , P d i s , the initial power E i 0 , and the desired power E i d , as well as the upper and lower limits for the states of charge ( S O C i , max , S O C i , min ). Subsequently, the constraint conditions are formulated. First, the charging and discharging power must be constrained between defined limits ( P d i s and P c h a r ). Second, the sum of the initial power and the cumulative charging and discharging power losses must satisfy the owner’s desired power ( E i d ). Third, it is ensured that the state of charge ( S O C i , t ) remains within predefined maximum and minimum value intervals. Finally, a power-state recurrence relationship is established to characterize the changes in power at adjacent intervals in relation to the charging and discharging power.
The essence of vehicle-to-grid (V2G) technology lies in utilizing the charging and discharging behaviors of EVs to mitigate the fluctuations in the power grid load. Based on the electrical load data from the iHARBOUR campus, Figure 5a simulates the variations in the state of charge of seven EVs throughout the dispatching process, while Figure 5b illustrates the charging and discharging power changes for each of the seven vehicles. Collectively, the EVs display a state of two charging periods and two discharging periods. During the intervals from 14:00 to 17:00 and from 22:00 to 08:00 the following day, the EVs predominantly remain in a charging state. The night represents the primary charging period, allowing the state of charge of the EVs to increase from approximately 0.2 to about 0.9, thus fulfilling the desired power requirements of vehicle owners for daytime usage. The charging power reaches a peak of 20 kW around midnight. Conversely, during the periods from 11:00 to 14:00 and from 17:00 to 22:00, the EVs predominantly operate in a discharging state. Nighttime also serves as the main discharging period, resulting in a decrease in the state of charge from a peak of 0.9 to nearly 0.2. The limited charging and discharging power during the day averages around 15 kW, with each event lasting approximately 2 h, contributing to a state of charge variation of about 0.3. This charging and discharging activity primarily supports the regulation of the power grid.

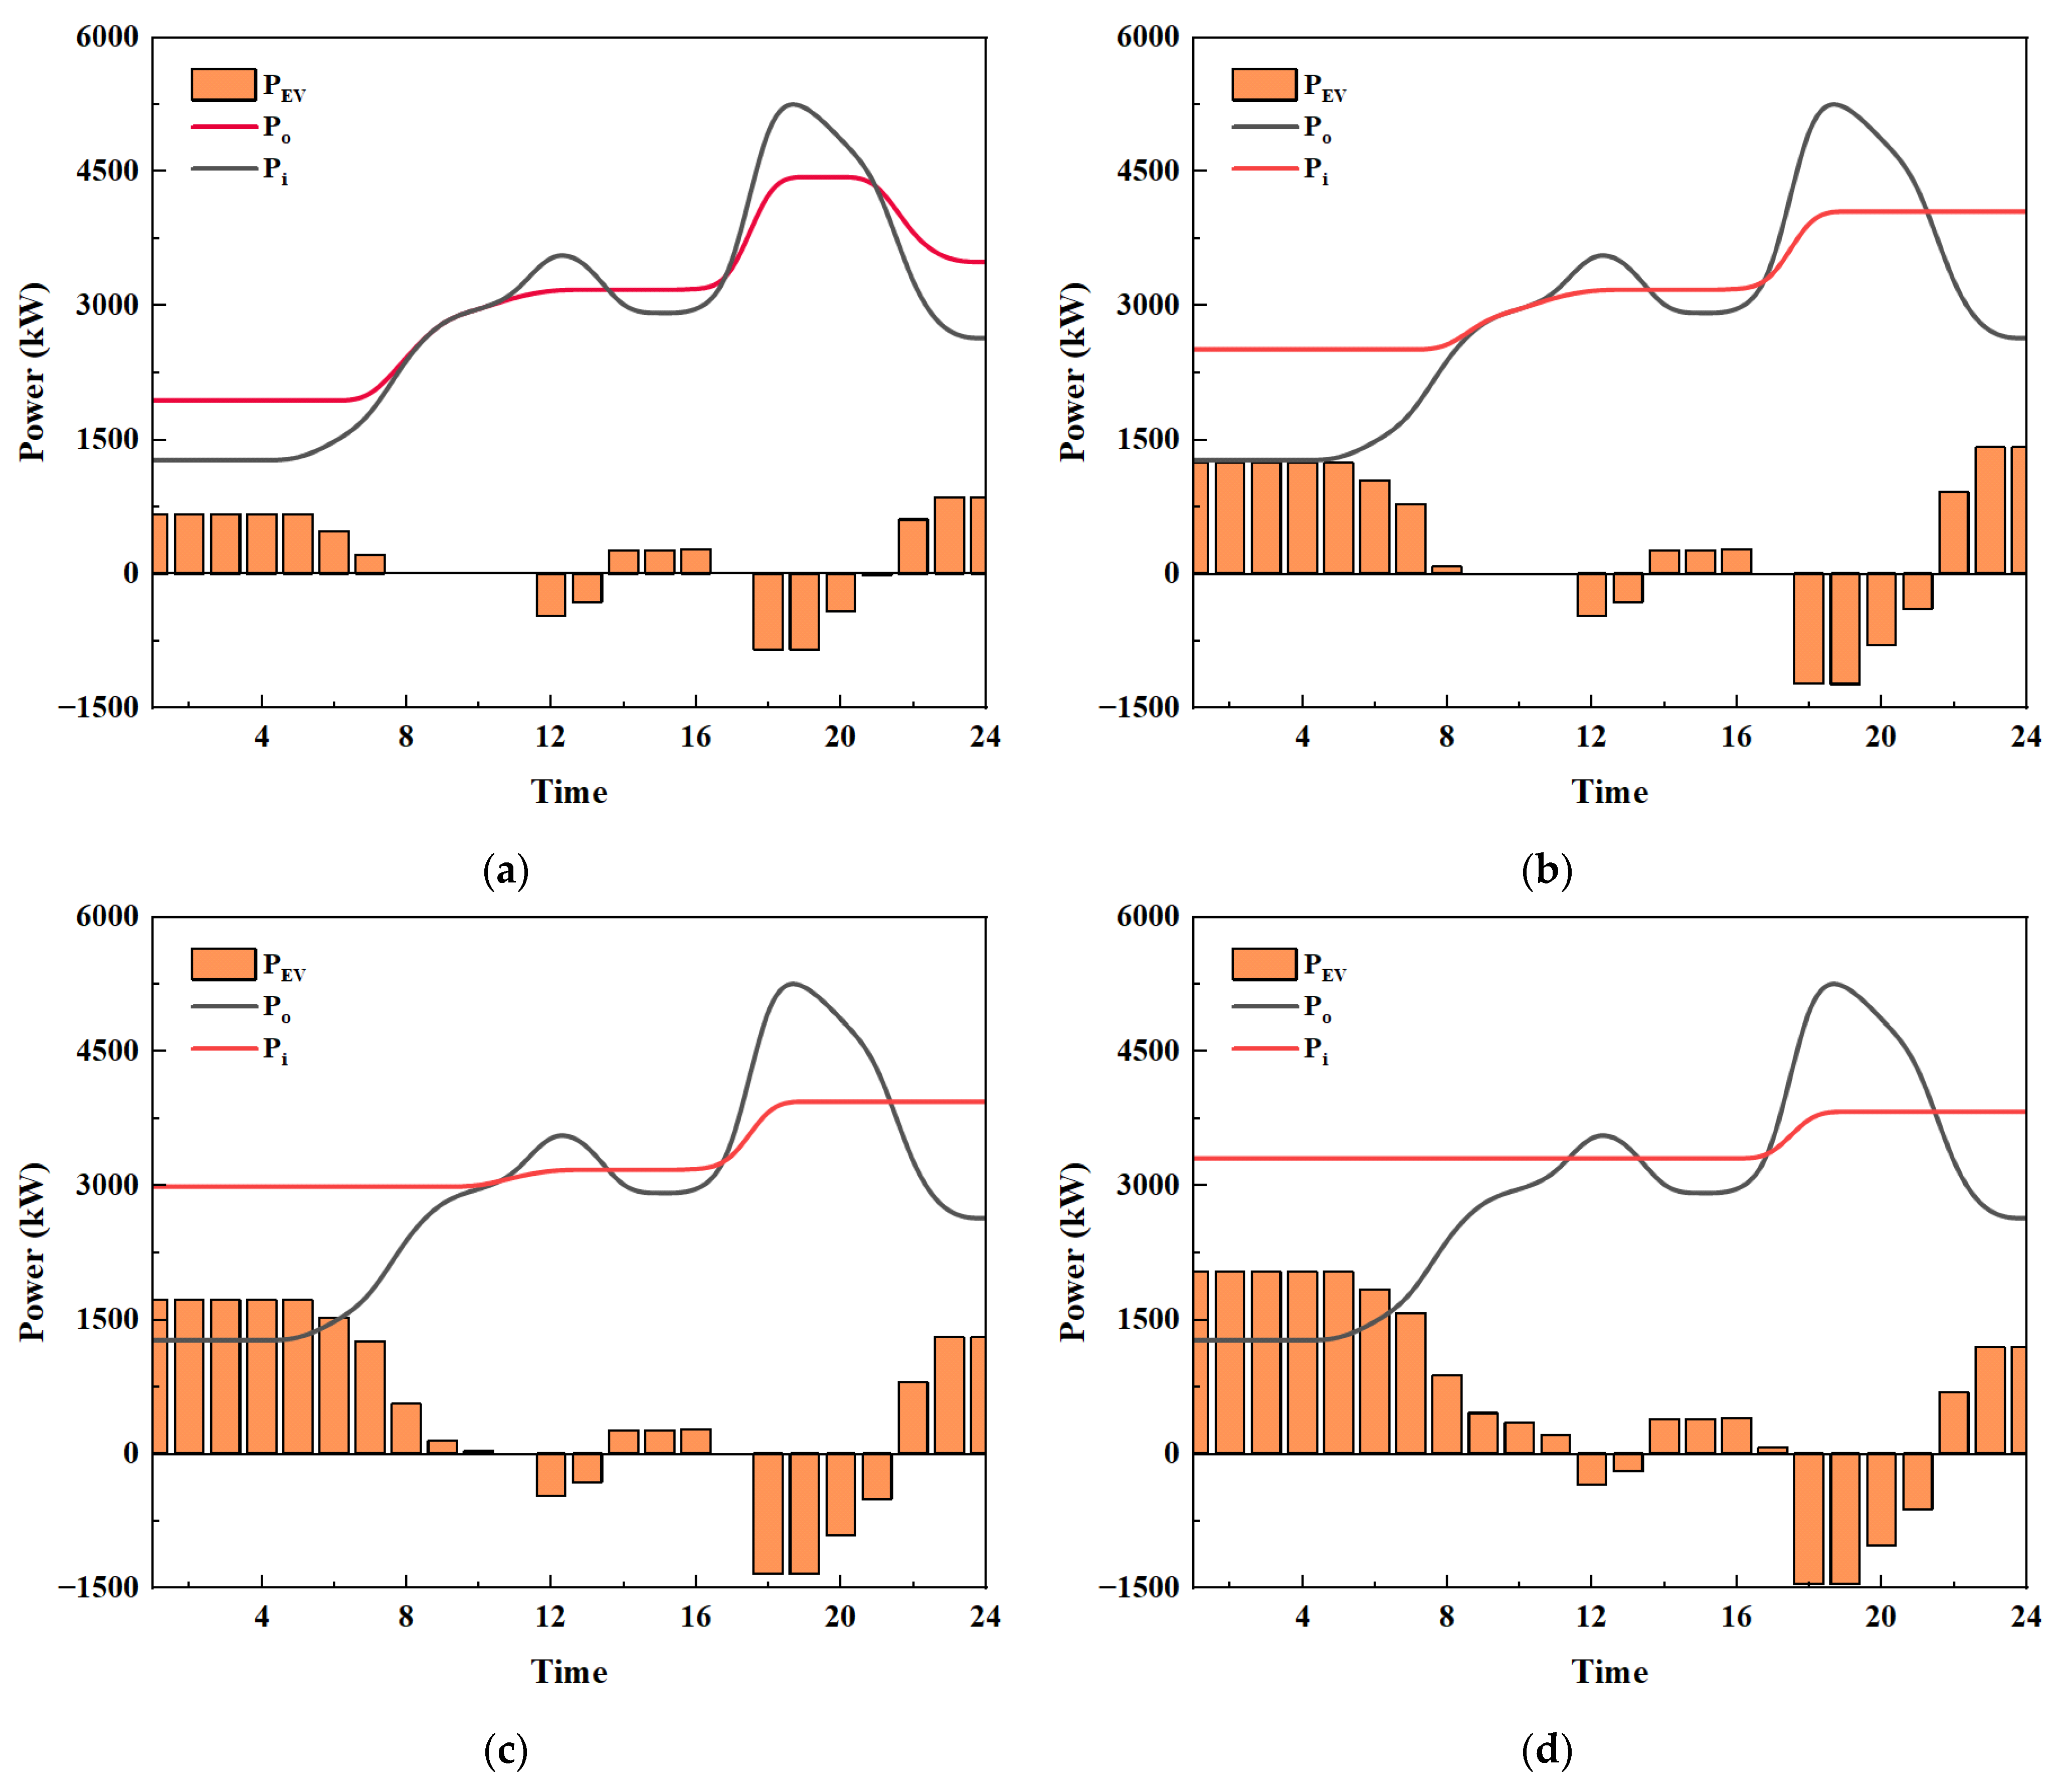
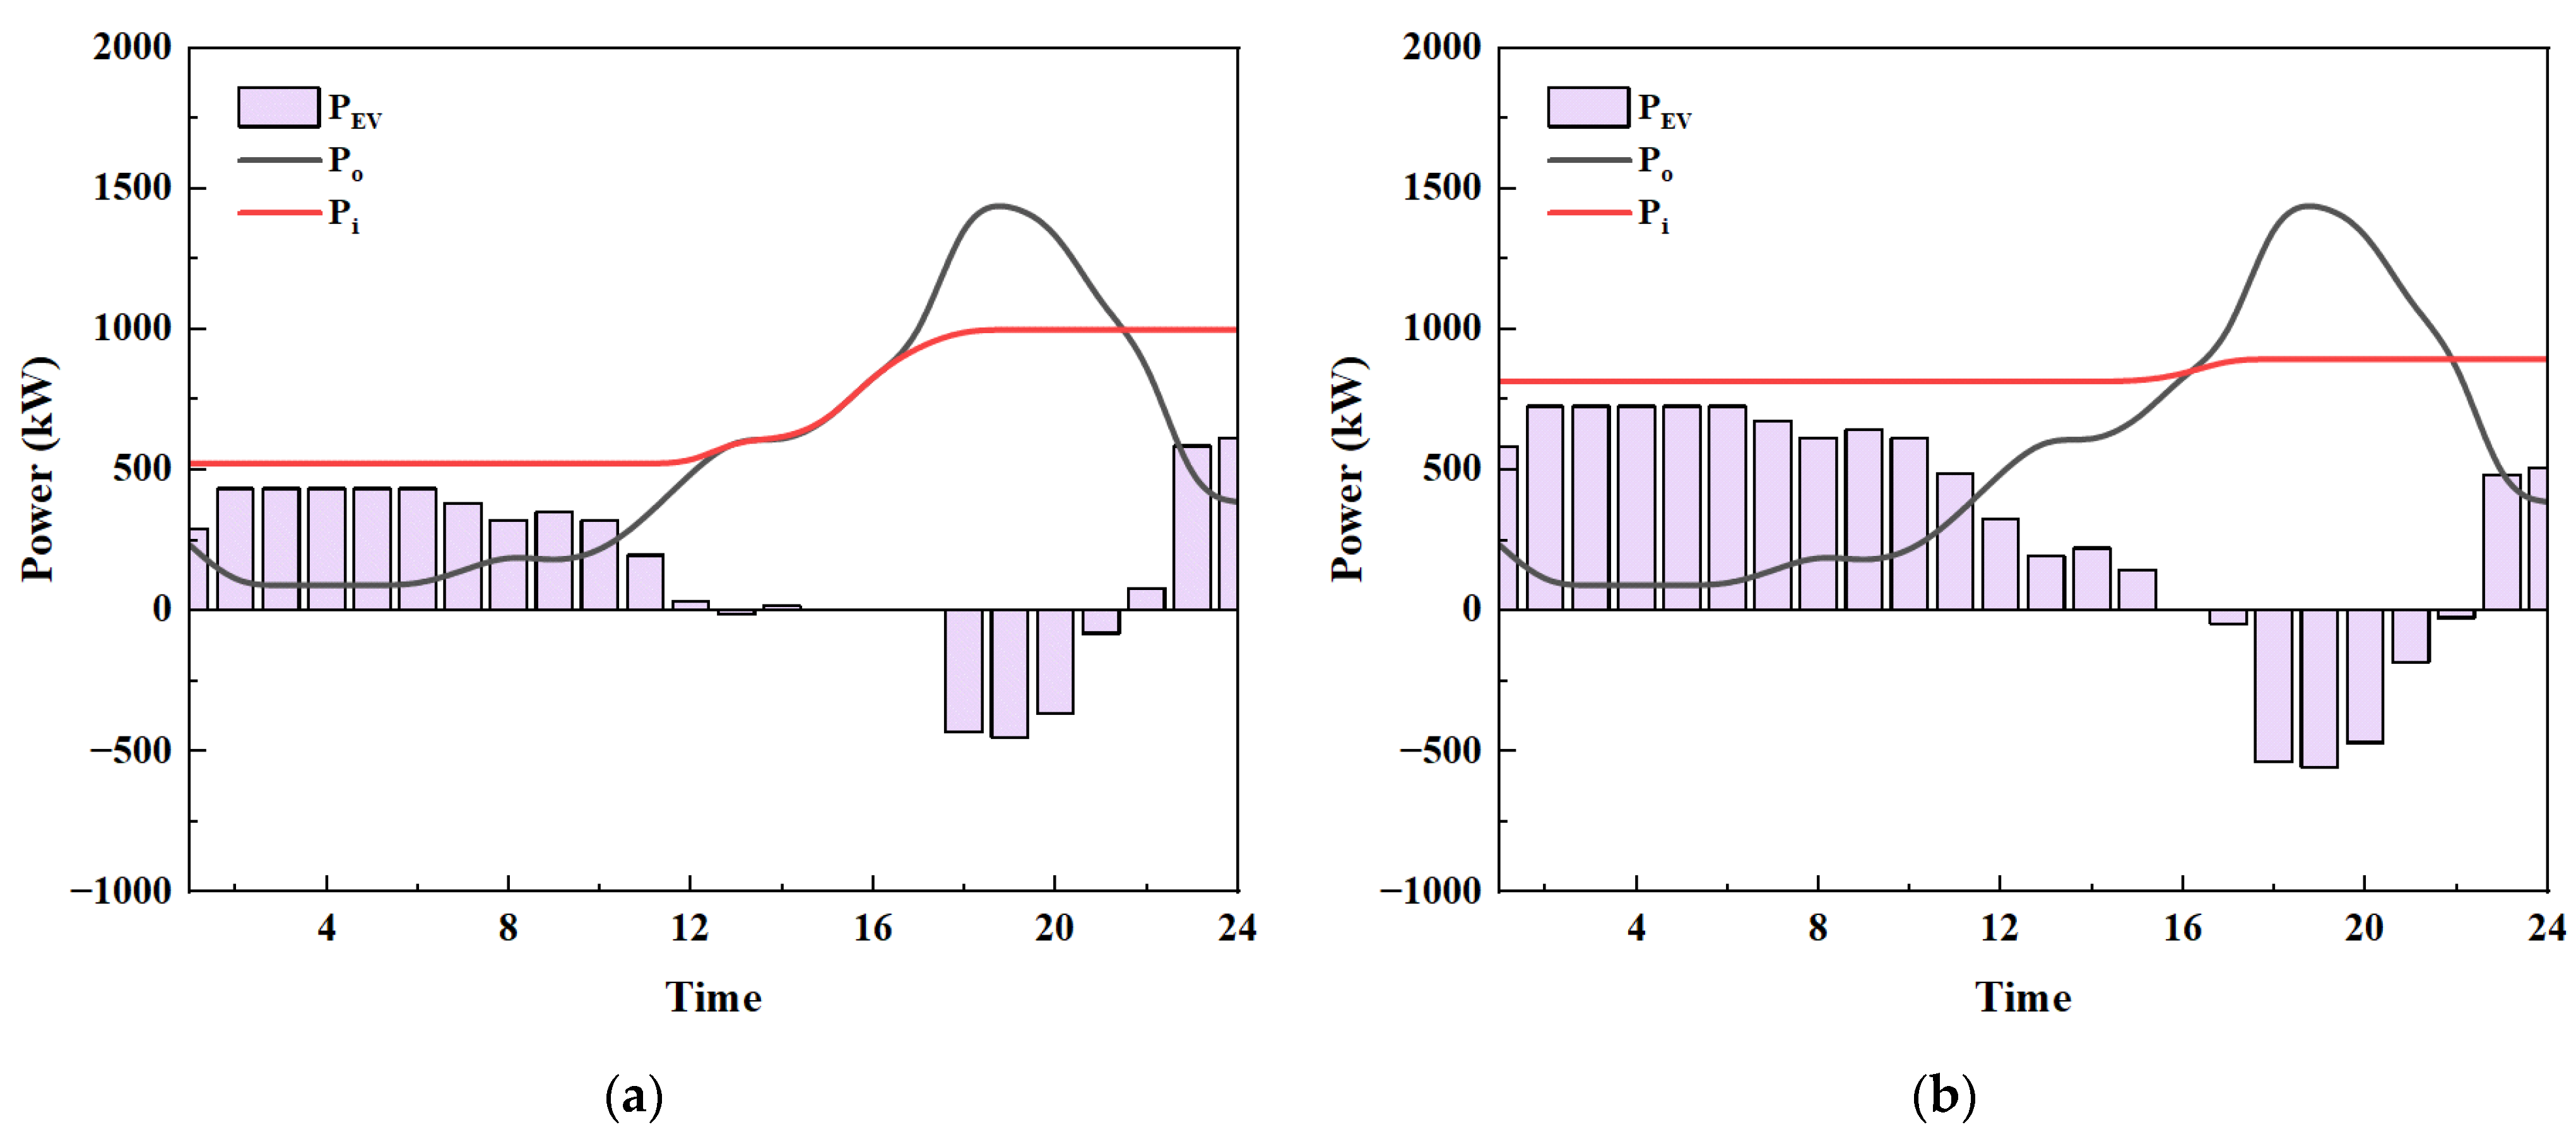
3.3. Charging and Discharging Power of Electric Vehicles

The optimized dispatching strategy facilitates a systematic variation in the state of charge of EVs, effectively mitigating the risks of overcharging and over-discharging. This method helps with peak shaving, valley filling, and lowering grid load fluctuations in addition to extending battery life. Specifically, the strategy encompasses two key operational periods: (1) Valley-period charging occurs between 14:00 and 17:00 and from 21:00 to 08:00 the following day, a time frame characterized by low power grid demand. During these periods, EVs capitalize on lower electricity prices to augment their energy reserves. (2) Peak-period discharging takes place from 11:00 to 14:00 and from 17:00 to 21:00, coinciding with the power grid’s peak demand periods. In this context, EVs discharge stored energy back to the grid, thereby alleviating supply pressure during peak periods and assisting in the overall objective of balancing energy demand and supply. Additionally, the iHARBOUR campus saw a 27.6% reduction in grid peak load following optimization, which successfully eased the strain on the power supply during peak hours; the Manlan Hotel saw a significant decrease in load curve fluctuation following optimization, as well as a reduction in peak load, which enhanced power grid operation stability. This suggests that the study’s charge and discharge optimization approach fosters a decrease in peak load, which is crucial for the power grid’s steady operation.

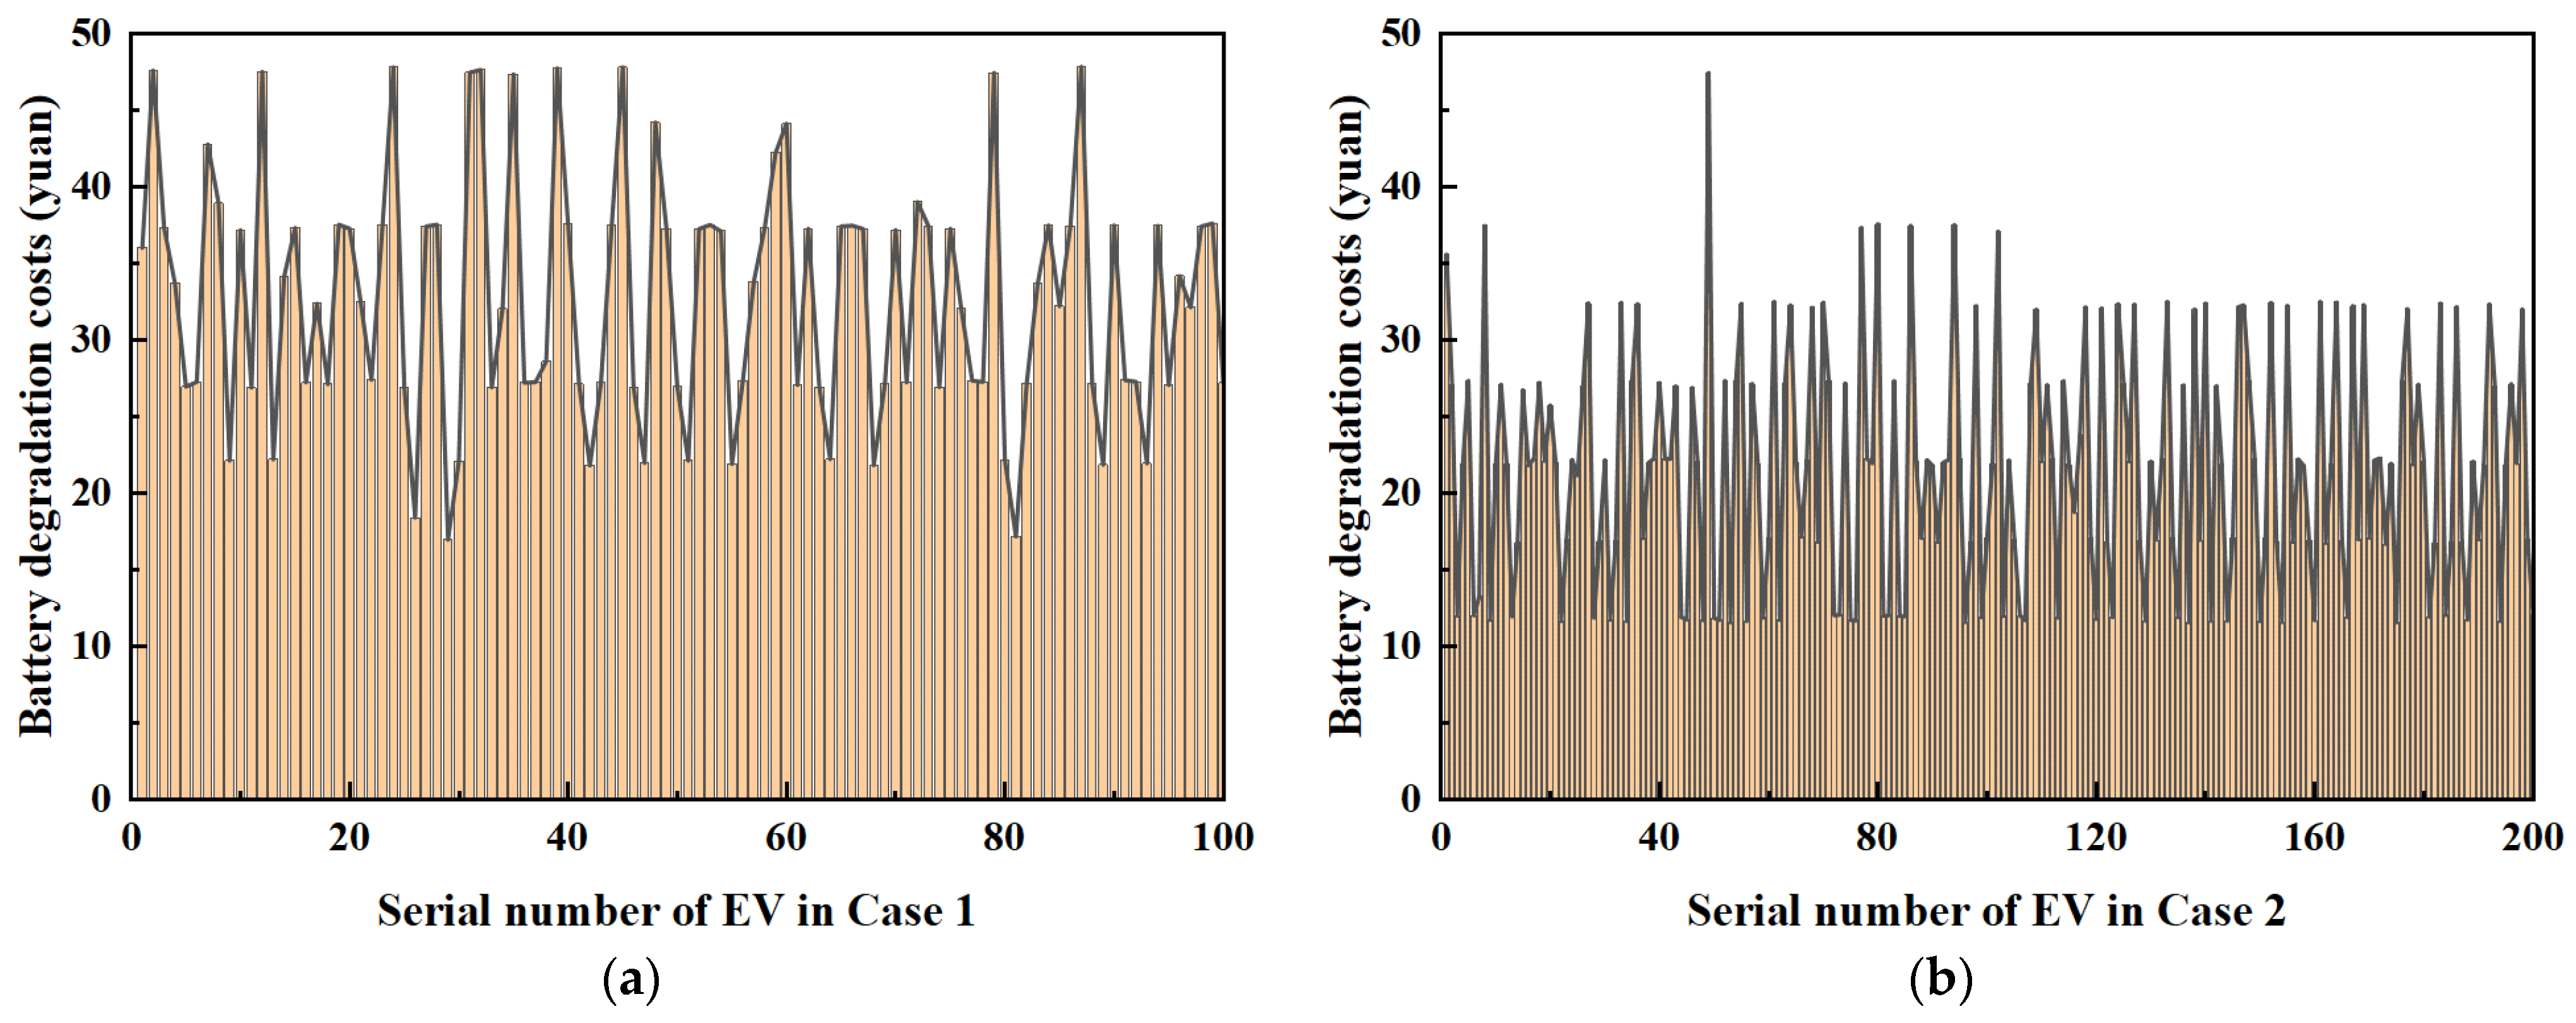
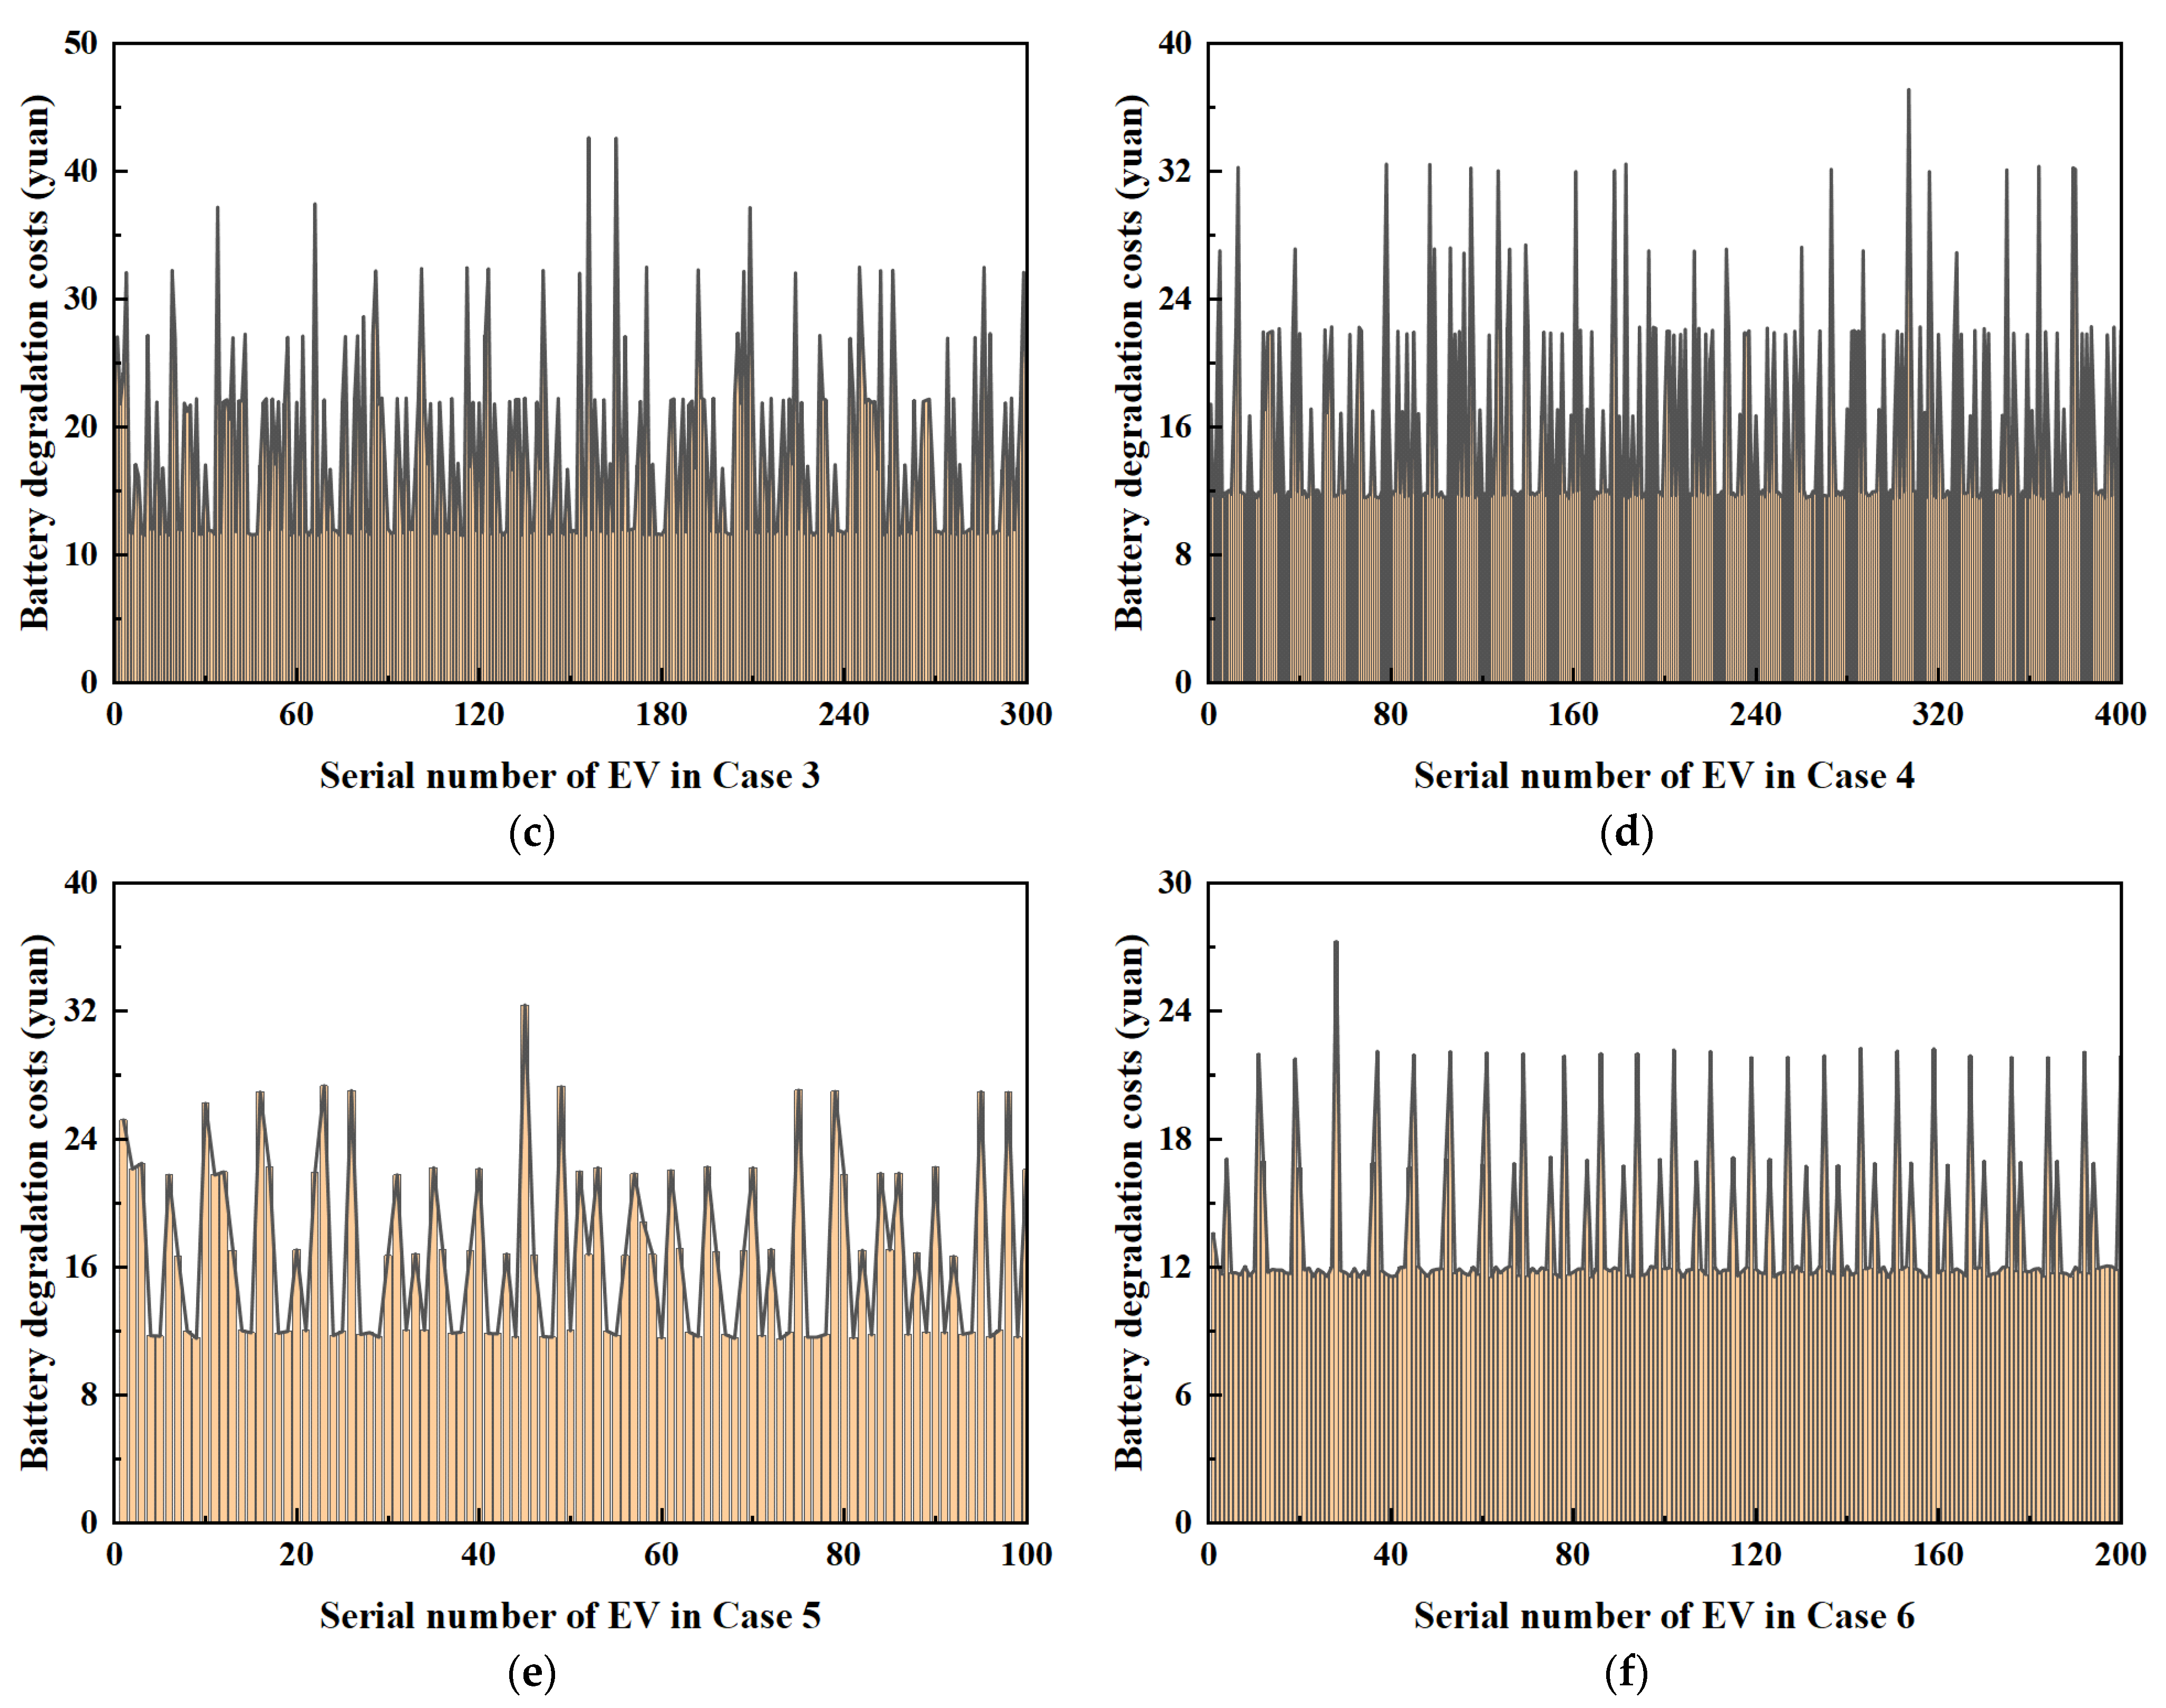
3.4. Battery Loss and Load Fluctuation Costs

As illustrated in Figure 6, the battery loss costs over a 24-h period are analyzed under six distinct operational conditions. In working condition 1, the battery loss cost for each vehicle fluctuates between 20 and 50 yuan, with a stable average around 40 yuan. In working condition 2, the fluctuation range reduces to 10 to 35 yuan, although costs for some vehicles may reach 40 or even 50 yuan. For working condition 3, the battery loss costs fluctuate between 12 and 22 yuan, with a few vehicles exceeding 30 yuan and some surpassing 40 yuan. In working condition 4, costs range from 12 to 24 yuan, with a few vehicles attaining 32 yuan and individual vehicles exceeding 35 yuan. Working condition 5 exhibits battery loss costs between 12 and 24 yuan, while a small number of vehicles incur costs ranging from 24 to 32 yuan. Under working condition 6, the fluctuations again range from 12 to 22 yuan, with very few vehicles costing approximately 27 yuan.
Figure 7 presents the predicted fluctuations in power grid load under the six working conditions considering dual-objective optimization. The trends of the curves reveal a pronounced “double-peak” pattern, particularly evident during the time intervals of 04:00–12:00 and 12:00–20:00, which correspond to significant peaks in load fluctuations. It is noteworthy that higher battery degradation costs are associated with smaller load fluctuations, and conversely, lower degradation costs yield larger fluctuations. Detailed values are provided in Table 3.

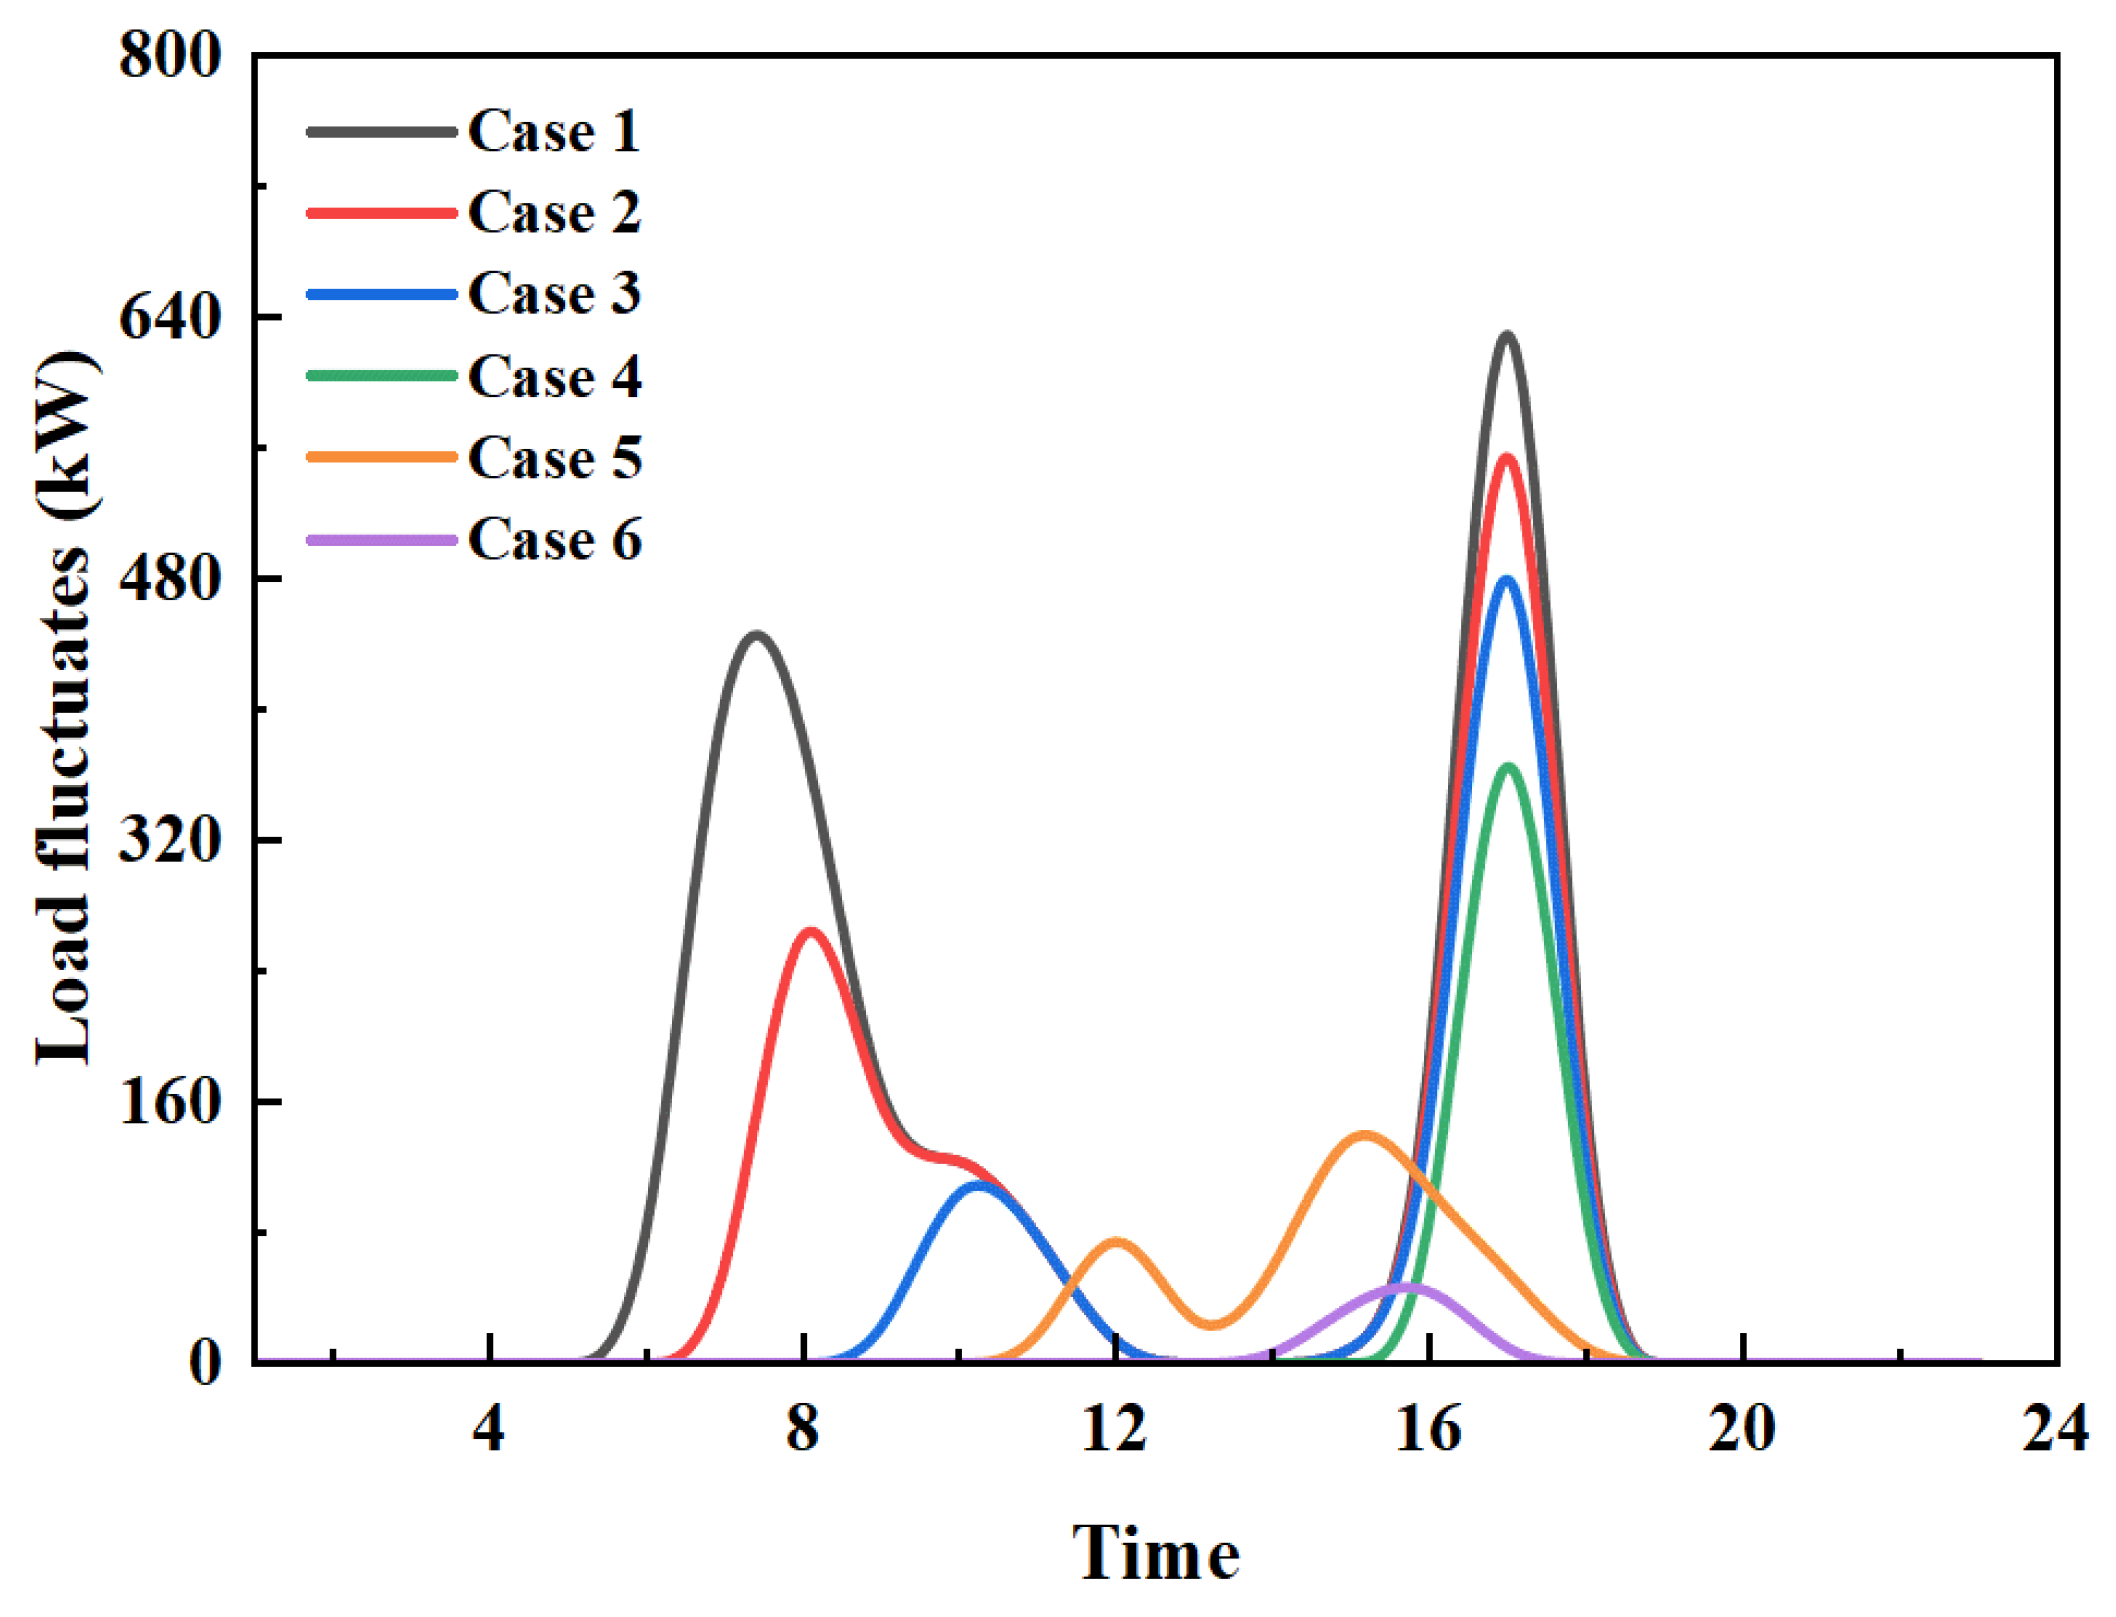
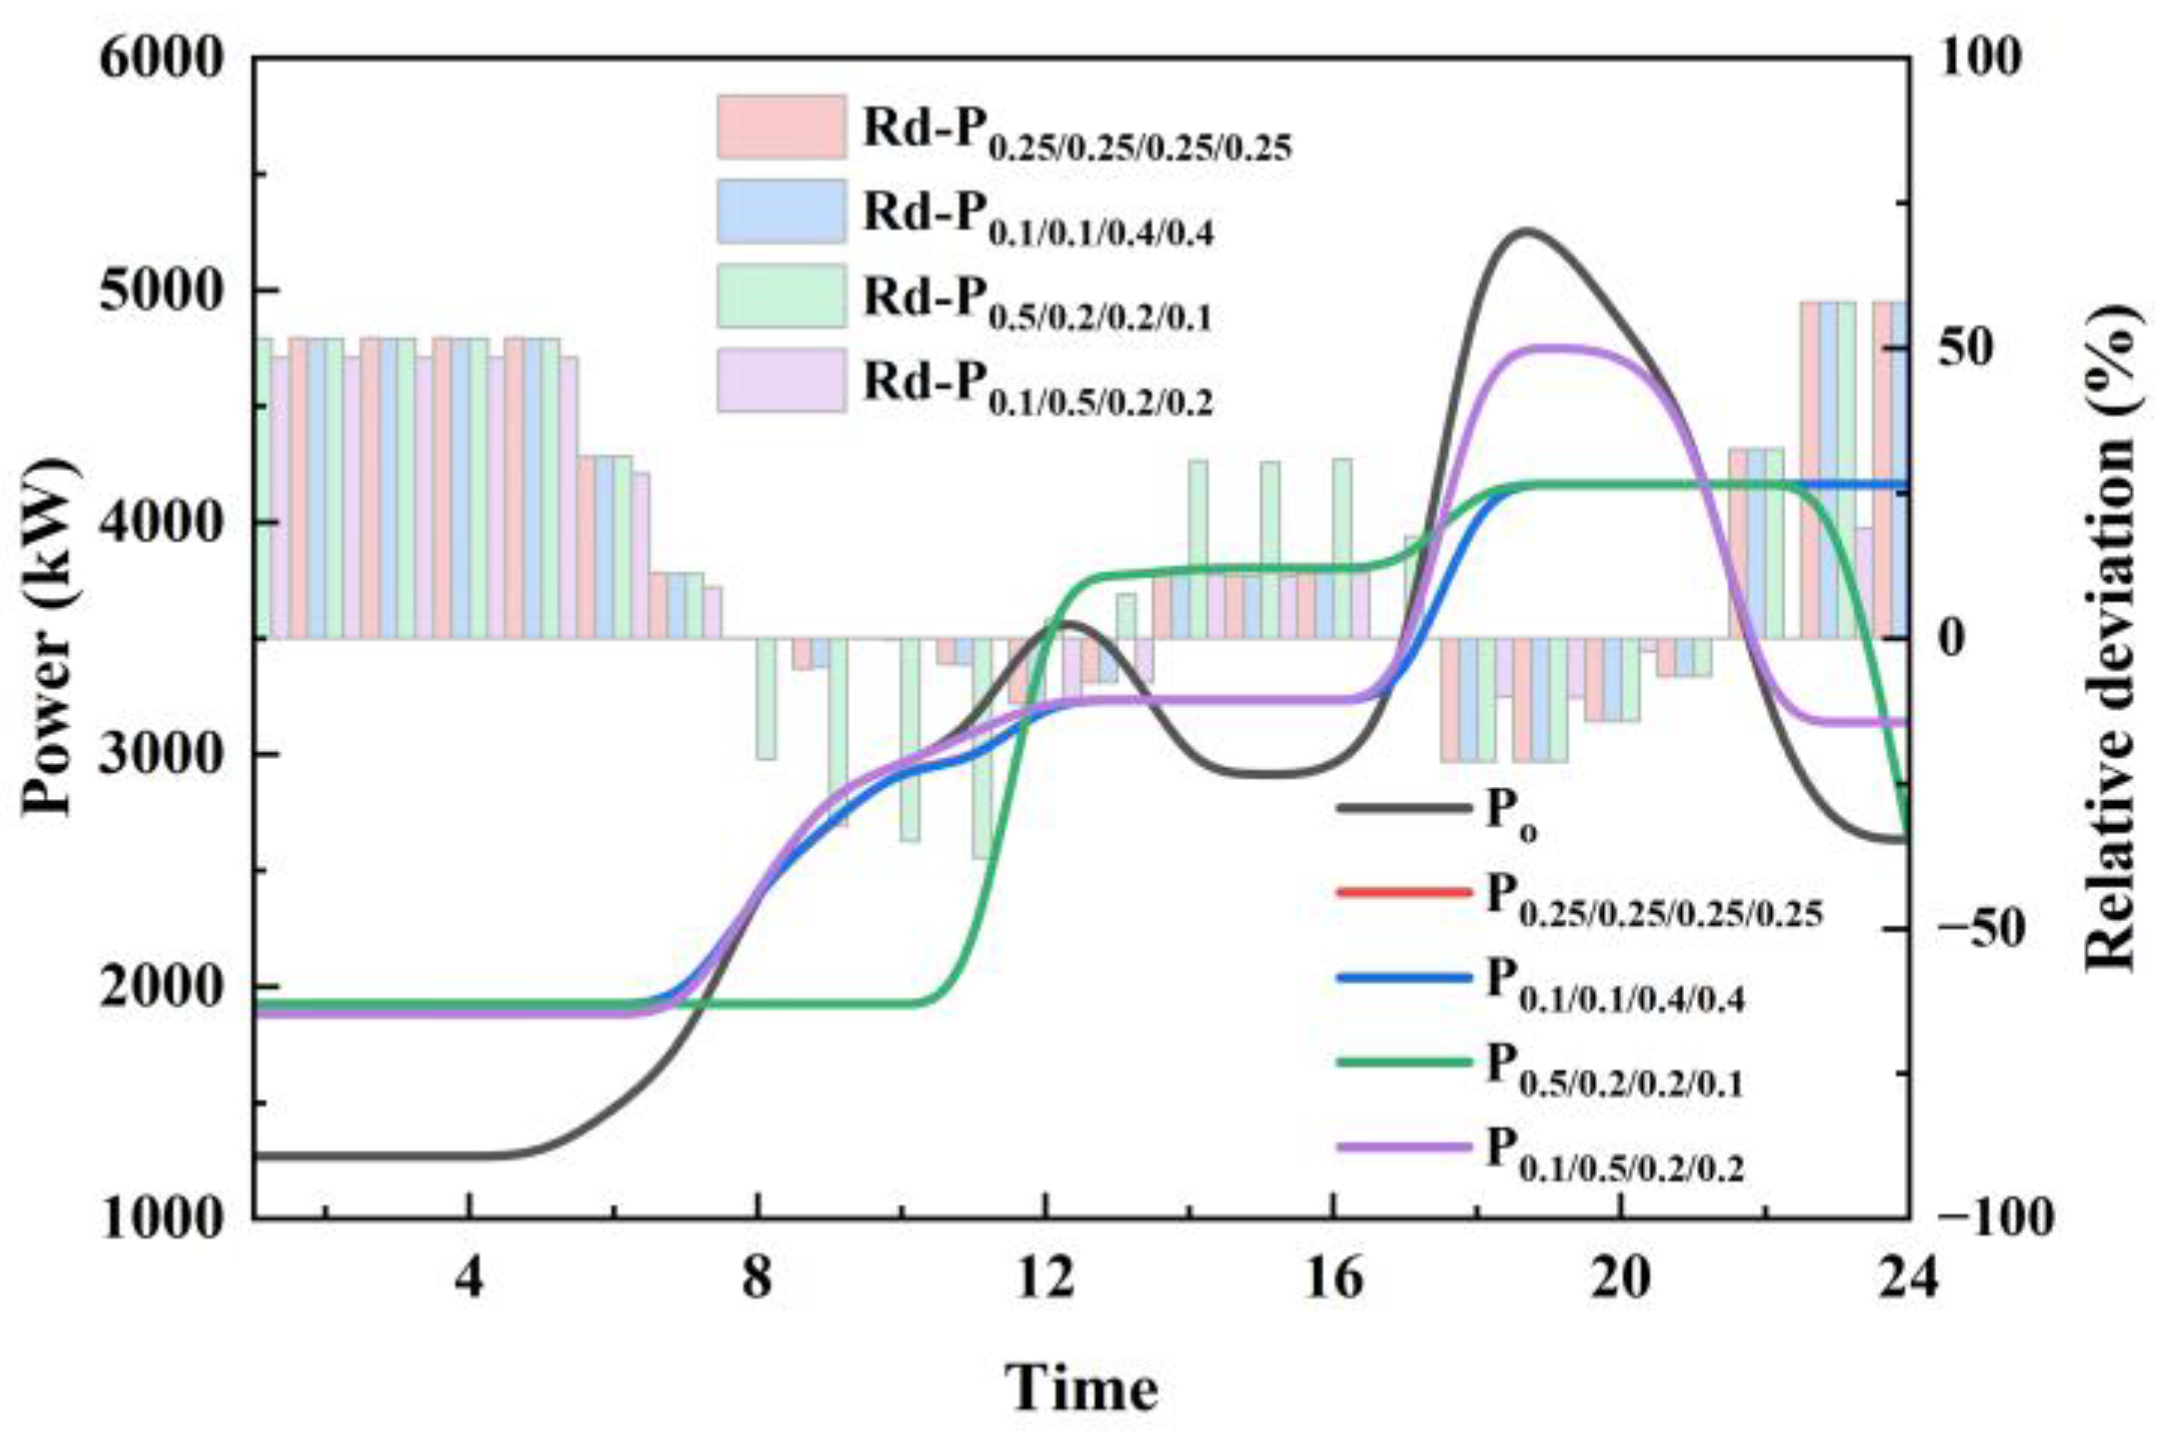
3.5. The Combined Load Power After Dispatching

The variations in comprehensive load power following the dispatching of 100, 200, 300, and 400 EVs are illustrated in Figure 8, which provides a comparison of load power before and after optimization. It is evident that the optimization strategy positively influences the daily load patterns on this campus, thereby affirming the effectiveness and feasibility of the proposed optimized dispatching strategy in real-world applications.
Further analysis reveals that the typical daily baseline load exhibits significant fluctuation characteristics. The initial load is approximately 1300 kW, remaining largely stable from 00:00 to 05:00, which represents the principal valley period of the daily load profile. Beginning at 05:00, the load enters a rapid upward trajectory, soaring to around 3000 kW by 09:00. Thereafter, from 09:00 to 11:00, the load continues to rise gently. By 12:00, the load reaches a minor peak at approximately 3500 kW, followed by a slight decline. Between 14:00 and 16:00, the load gradually decreases, stabilizing around 3000 kW and forming a secondary valley period. Subsequently, from 16:00 to 18:00, the load escalates rapidly once more, attaining the highest peak of the day, nearing 5500 kW. After this peak, the load progressively declines, reaching approximately 2600 kW by midnight.
In comparison to the original daily load profile, the comprehensive load following optimized dispatching exhibits significantly reduced fluctuations and demonstrates a notable capability for peak shaving and valley filling. Taking Figure 8a as an illustration, the initial load after optimization is increased to 2000 kW. From 00:00 to 07:00, the load remains nearly constant at approximately 700 kW higher than pre-optimization levels, thereby effectively achieving “valley filling” during nighttime and mitigating the depth of load valleys. During the period from 07:00 to 12:00, the load exhibits a gentle upward trajectory, ultimately reaching 3000 kW, which is approximately 500 kW lower than the pre-optimization peak. Notably, this period is devoid of significant peaks observed in the pre-optimization scenario, resulting in a smoother load curve that is critical for maintaining the stable operation of the power grid. Following this, the load remains relatively flat until 16:00, and thereafter, significant fluctuations in the load curve are minimal. It is particularly important to highlight that between 16:00 and 18:00, the load surges rapidly to nearly 4500 kW, subsequently maintaining a flat trajectory for approximately two hours. This peak is notably “smoothed out” compared to the highest peak before optimization, resulting in a reduction of approximately 1000 kW and effectively alleviating pressure on the power grid during peak periods. After 21:00, the load begins a gradual decline, although the rate of decline is significantly lower. Ultimately, the load stabilizes around 3500 kW, continuing to reflect the benefits of night valley filling until the early hours of the following day. This process further optimizes load distribution and enhances the stability and reliability of power grid operations.
The observed optimization effects stem from the strategic adjustment of the charging and discharging power of the EV cluster. From 00:00 to 08:00, the EVs engage in charging activities, with total power consumption reaching 600–700 kW. Between 08:00 and 12:00, the EVs are not utilized for grid connection adjustments, leading to load alterations on the campus primarily influenced by its own electricity consumption patterns. From 12:00 to 13:00, the EVs discharge energy on a limited scale, with discharge power approximately at 500 kW. This period coincides with a relatively low load at noon, and the discharging operations further reduce the valley depth of the comprehensive load, contributing to a smoother load curve and mitigating excessive declines in load, thereby establishing a foundation for stable subsequent load variations. From 14:00 to 16:00, the EVs resume charging on a small scale, with a total power of about 200 kW, further optimizing load distribution and maintaining a continuous smooth trend on the load curve. Between 18:00 and 20:00, the EV cluster operates in a discharging mode, with power levels reaching 500–1000 kW. During this time, the campus’s baseline load surges to approximately 5500 kW, marking the highest peak of the day. The high-power discharging activities of the EVs effectively mitigate load growth during this peak period. After 22:00, the EVs charge intensively until the next day, continuing to facilitate night valley filling. The EVs execute well-timed charging and discharging operations across various periods, playing a critical role in adjusting the comprehensive load. During the nighttime low-load period, the vehicles charge and absorb excess electrical energy. In contrast, during daytime peak periods, vehicle charging power is controlled within a specific range to prevent excessive load increases. During the low-load period at noon, limited charging by the EVs further decreases the valley depth of the comprehensive load. Consequently, the optimized load curve exhibits greater smoothness than the basic load curve. The charging and discharging activities of the EVs effectively diminish the peak-to-valley difference, alleviate power supply pressure on the grid during peak periods, and enhance the stability and reliability of power grid operations.
Figure 8b–d depicts a progressive increase in the number of EVs involved in the dispatching process. When 200 EVs are utilized, significant changes in load regulation are observed compared to the scenario with 100 EVs. Specifically, during peak periods, the load is reduced by approximately 1800 kW, representing a further decrease of 800 kW compared to the dispatch of 100 EVs. Conversely, during valley periods, the load is increased by about 1200 kW, reflecting an increase of 500 kW relative to the situation with 100 EVs. As the number of EVs rises to 300, the load during the valley period is elevated to 3000 kW. From 00:00 to 16:00, load fluctuations remain minimal. The load during peak periods decreases to 3800 kW, and it remains relatively stable after 18:00. Under these dispatching conditions, the daily load fluctuations generally exhibit a two-stage pattern, with a peak-to-valley difference of only 800 kW. When the number of EVs used for dispatching reaches 400, the load fluctuations become even smoother, with the peak-to-valley difference diminishing to approximately 500 kW. Therefore, the number of EVs selected for dispatch can be reasonably determined based on actual demand to achieve optimized load regulation.
Figure 9 further illustrates the optimized load dispatching scenarios for various building types. Focusing on the Manlan Hotel, located on the east side of the iHARBOUR campus, the comprehensive load prior to optimization exhibits pronounced single-peak characteristics, peaking at approximately 1500 kW around 20:00. Through simulations involving varying numbers of dispatched EVs, the results indicate that when 100 EVs are dispatched (see Figure 9a), the load peak decreases to 1000 kW, representing a reduction of 500 kW. Concurrently, the load valley increases from approximately 100 kW to 500 kW, an improvement of 400 kW. As a result, the overall fluctuation of the load curve is significantly diminished, with the peak-to-valley difference reduced substantially from 1400 kW to 500 kW. When the number of dispatched EVs is increased to 200 (see Figure 9b), the load curve stabilizes, maintaining an average level of approximately 800 kW throughout the day, with load fluctuations becoming nearly negligible.
Building upon the analysis of grid load characteristics and user behavior patterns, this study develops optimization strategies for peak shaving and valley filling tailored to various scenarios. Since the basic electric load varies depending on the situation, we enter the relevant basic electric load data during the model application process and adjust the number of EVs participating in the regulation based on the actual demand. Because the bimodal and unimodal load scenarios under investigation are located in the same TOU pricing zone, the TOU price remains constant during the model’s execution. The weights given to each objective function also stay the same, as does the study’s optimization goal. The final optimization results are shown in detail in Table 4. The operational mechanisms of these strategies are elucidated through specific case studies described below:
In contexts such as university campuses, where dual-peak electricity consumption patterns are observed in the morning and evening, a combined optimization strategy of “moderate charging during midday and discharging during the evening peak” is employed. In particular, moderate EV charging is scheduled for the daylight hours of 14:00–17:00, when the grid has less demand. Charging at this time can not only prevent a significant impact on the grid but also use inexpensive electric energy to supplement the vehicle’s electricity to meet the needs of subsequent use because the grid load is relatively low during this time and the price of electricity is also within a reasonable range. The main charging period is the following day from 21:00 to 8:00 p.m., when the grid load is at its lowest and many EVs are charged centrally. This allows the grid to fully utilize its remaining power supply capacity and also accomplish “valley filling” to increase grid load stability. EVs are expected to discharge between 17:00 and 21:00, which is the evening peak electricity usage period. The demand for electricity on campus is currently rising rapidly, and the power grid is under a lot of load pressure. EVs discharge into the power grid, effectively relieving power supply strain and balancing the load on the grid. At the same time, during the morning peak of electricity consumption from 11:00 to 14:00, some vehicles are scheduled to discharge, but the discharge power and duration are limited in comparison to the evening peak to avoid interfering with subsequent vehicle use.
Furthermore, with an increase in the number of EVs, the advantages of discharging during the evening peak significantly exceed those of discharging during the morning peak. In scenarios such as hotels, where a pronounced single electricity load peak occurs in the evening, the strategy is primarily designed to address sudden surges in electricity consumption. The charging process is divided into two distinct stages: charging in the morning and centralized charging at night. By prioritizing the use of low-cost electricity periods, user expenses can be effectively reduced. Additionally, following a sudden surge in electricity load, a portion of the stored electrical energy is proactively released, resulting in a reduction in power fluctuations by over 50%. This strategy facilitates the smoothing of the electricity load purely through optimized scheduling, thereby eliminating the need for additional hardware investments. Table 5 shows the computation timings for examples 1 through 6, which are 45, 99, 72, 94, 133, and 157 s, respectively. Cases 1 and 3 had 100 EVs and 75 and 72 s of computation time, respectively, with only a 3-s difference. Cases 4, 5, and 6 have 2, 3, and 4 times the number of EVs as Case 3, respectively, with computation times of 1.31, 1.85, and 2.18 times. Thus, it is clear that even if the volume of data increases by a factor, scalability for larger-scale EV optimization is guaranteed because the order of magnitude is small and the increase in calculation time is negligible.
To investigate the sensitivity of the objective function’s weights more thoroughly and exhaustively, we build optimization models with various weight combinations. Battery deterioration, charging cost, power grid load change, and power grid load peak-valley difference have the following weights: 0.25/0.25/0.25/0.25, 0.1/0.1/0.4/0.4, 0.5/0.2/0.2/0.1, 0.1/0.5/0.2/0.2, and 0.1/0.5/0.2/0.2, in that order. The power load optimization effect and relative deviation under various weight combinations are displayed in Figure 10. Except for the fact that it is 9.69 kW higher at 9 points than P0.1/0.1/0.4/0.4 and 4.84 kW lower at 10:00 and 11:00, there is not much of a difference between P0.25/0.25/0.25/0.25 and P0.1/0.1/0.4/0.4. P0.5/0.2/0.2/0.1 exhibits a surge phenomenon between 10 and 12 o’clock, and the valley filling effect is at its peak between 12 and 17 o’clock. This is because the TOU price is at its lowest during this time, which is consistent with the optimization objective of prioritizing user expenses. Since minimizing battery loss is its desired outcome, P0.1/0.5/0.2/0.2 exhibits the same trend as P0.25/0.25/0.25/0.25 and P0.1/0.1/0.4/0.4 from 1 to 17 o’clock. However, after 17 o’clock, the electric load is greater than other weight conditions, and the peak clipping effect is at its worst. Battery loss will grow with excessive discharge, making it unable to perform its peak shaving function during peak hours. Moreover, the average relative deviations for P0.25/0.25/0.25/0.25, P0.1/0.4/0.1/0.4, P0.5/0.1/0.2/0.2, and Po are 45.72%, 45.69%, 37.95%, and 37.85%, respectively. The mean values of the negative relative deviations were −11.46%, −10.19%, −23.62%, and −8.26%, also. It demonstrates how the electric load optimization effect is significantly impacted by various weight arrangements. Therefore, to achieve real-time optimal management of electrical demands, the weight configuration can be dynamically altered in conjunction with the actual application scenarios and requirements.

4. Conclusions

This study presents a comprehensive framework for optimizing the charging and discharging schedules of EVs (EVs) through Monte Carlo sampling and multi-objective optimization. By integrating stochastic modeling of EV behaviors with time-of-use (TOU) electricity prices and grid load dynamics, the proposed strategy effectively addresses challenges related to peak-valley differences, battery degradation costs, and user charging expenses. Furthermore, our results suggest scalable charging solutions that are customized for various loads to further facilitate extensive EV grid integration. The key findings are summarized as follows:
(1)
The optimized strategy, achieved through coordinated off-peak charging and peak-hour discharging, resulted in a 27.6% reduction in grid peak load and a 160.1% increase in valley load. Simulations demonstrated strong scalability; as the number of dispatched EVs increased from 100 to 400 units, the peak-valley load difference diminished from 2236 kW to 545 kW, thereby confirming the strategy’s effectiveness for large-scale applications.
(2)
The model managed to reduce user charging costs to 7.58 yuan per day while maintaining daily battery degradation costs at 15.68 yuan. A significant negative correlation was identified between battery degradation costs and load fluctuations. Consequently, EV owners in the Innovation Port region are advised to discharge between 6 and 8 p.m.
(3)
Comparative case analyses indicate that different EV dispatching methods should be implemented depending on the load profile. For scenarios characterized by double-peak loads (e.g., iHARBOUR campus), EVs should be charged and discharged twice, whereas in scenarios with single-peak loads (e.g., Manlan Hotel), charging and discharging should occur only once.

Author Contributions

Conceptualization, J.Z., C.W. and Z.L. (Zeguang Lu); methodology, C.W. and J.Z.; software, C.W. and J.Z.; validation, C.W., J.Z., Z.L. (Zeguang Lu), Z.Z., J.C. and Z.L. (Zhengguang Liu); formal analysis, Z.L. (Zeguang Lu) and G.L.; investigation, C.W., Z.Z. and J.C.; resources, X.Y.; data curation, X.Y.; writing—original draft preparation, J.Z.; writing—review and editing, G.L., X.Y. and Z.L. (Zhengguang Liu); visualization, J.C.; supervision, X.Y.; project administration, Z.L. (Zhengguang Liu); funding acquisition, X.Y. All authors have read and agreed to the published version of the manuscript.

Funding

This research was supported by Research and Application of Flexible Load Aggregation Mining and Flexible Control Technology for Electric Vehicles Based on Swarm Intelligence (520608240005).

Data Availability Statement

No new data were created or analyzed in this study. Data are contained within the article.

Conflicts of Interest

Authors Jian Zheng, Jinglan Cui, Zhongmei Zhao, Guocheng Li, Cong Wang and Zeguang Lu are employed by the company State Grid Shandong Electric Power Company Dezhou Power Supply Company. The remaining author declare that the research was conducted in the absence of any commercial or financial relationships that could be construed as a potential conflict of interest.

Abbreviations

The following abbreviations are used in this manuscript:
EVElectric vehicle
IEAInternational Energy Agency
GISGeographic information system
TOUTime-of-use electricity pricing
ifwImpact factors under various weather
ConsCharging and discharging constraints
ObjObjective function
V2GVehicle-to-grid
fs(x)Probability density function of daily mileage
µsMean of the probability density function of daily miles traveled
σs2Variance of the probability density function of daily miles traveled
fE(t)Probability density function of the charging start time
µtMean of the probability density function at the start time of charging
σt2Variance of the probability density function at the start time of charging
tTime
leMileage per unit power (km·kW−1·h−1)
pCharging power (kW)
PCharging and discharging power of any EV
PminMinimum of charging and discharging power
PmaxMaximum of charging and discharging power
Pb(i,t)Battery power of any EV
SminMinimum charging levels of the battery
SmaxMaximum charging levels of the battery
EcBattery capacity
Eo(i,t)Initial battery level of the EV
N(0,2)Gaussian noise
E(i,t)Battery capacity of the EV at t time
ηCharging and discharging efficiency coefficient
CcostCharging cost
P(i,t)Charging and discharging power of the i EV at time t
CdegDegradation loss cost
cBattery degradation coefficient
CcDegradation loss cost per unit battery capacity
FlfVariation of grid load
PoBase grid load
FpvLoad peak-valley difference
maxMaximum values of the power grid load within 24 h
minMinimum values of the power grid load within 24 h

References

  1. Yadlapalli, R.T.; Kotapati, A.; Kandipati, R.; Koritala, C.S. A Review on Energy Efficient Technologies for Electric Vehicle Applications. J. Energy Storage 2022, 50, 104212. [Google Scholar] [CrossRef]
  2. Veerendra, A.S.; Mohamed, M.R.B.; García Márquez, F.P. Energy Management Control Strategies for Energy Storage Systems of Hybrid Electric Vehicle: A Review. Energy Storage 2024, 6, e573. [Google Scholar] [CrossRef]
  3. Chen, L.; Ma, R. Clean Energy Synergy with Electric Vehicles: Insights into Carbon Footprint. Energy Strategy Rev. 2024, 53, 101394. [Google Scholar] [CrossRef]
  4. Richardson, D.B. Electric Vehicles and the Electric Grid: A Review of Modeling Approaches, Impacts, and Renewable Energy Integration. Renew. Sustain. Energy Rev. 2013, 19, 247–254. [Google Scholar] [CrossRef]
  5. Al-Romeedy, B.S. Green Human Resource Management in Egyptian Travel Agencies: Constraints of Implementation and Requirements for Success. J. Hum. Resour. Hosp. Tour. 2019, 18, 529–548. [Google Scholar] [CrossRef]
  6. Sankhwar, P. Evaluation of Transition to 100% Electric Vehicles (Evs) by 2052 in the United States. Sustain. Energy Res. 2024, 11, 35. [Google Scholar] [CrossRef]
  7. Liu, H.; Xing, Z.; Zhao, Q.; Liu, Y.; Zhang, P. An Orderly Charging and Discharging Strategy of Electric Vehicles Based on Space–Time Distributed Load Forecasting. Energies 2024, 17, 4284. [Google Scholar] [CrossRef]
  8. Megha, A.; Mahendran, N.; Elizabeth, R. Analysis of Harmonic Contamination in Electrical Grid Due to Electric Vehicle Charging. In Proceedings of the 2020 Third International Conference on Smart Systems and Inventive Technology (ICSSIT), Tirunelveli, India, 20–22 August 2020; pp. 608–614. [Google Scholar]
  9. Jain, V.; Kewat, S.; Singh, B. Three Phase Grid Connected Pv Based Ev Charging Station with Capability of Compensation of Reactive Power. IEEE Trans. Ind. Appl. 2022, 59, 367–376. [Google Scholar] [CrossRef]
  10. Azmi, K.H.M.; Radzi, N.A.M.; Azhar, N.A.; Samidi, F.S.; Zulkifli, I.T.; Zainal, A.M. Active Electric Distribution Network: Applications, Challenges, and Opportunities. IEEE Access 2022, 10, 134655–134689. [Google Scholar] [CrossRef]
  11. Shahriar, S.; Al-Ali, A.-R.; Osman, A.H.; Dhou, S.; Nijim, M. Machine Learning Approaches for Ev Charging Behavior: A Review. IEEE Access 2020, 8, 168980–168993. [Google Scholar] [CrossRef]
  12. Lee, J.H.; Chakraborty, D.; Hardman, S.J.; Tal, G. Exploring Electric Vehicle Charging Patterns: Mixed Usage of Charging Infrastructure. Transp. Res. Part D Transp. Environ. 2020, 79, 102249. [Google Scholar] [CrossRef]
  13. Esteban, B.; Sid-Ahmed, M.; Kar, N.C. A Comparative Study of Power Supply Architectures in Wireless Ev Charging Systems. IEEE Trans. Power Electron. 2015, 30, 6408–6422. [Google Scholar] [CrossRef]
  14. Franke, T.; Krems, J.F. Understanding Charging Behaviour of Electric Vehicle Users. Transp. Res. Part F Traffic Psychol. Behav. 2013, 21, 75–89. [Google Scholar] [CrossRef]
  15. Wang, Y.; Yao, E.; Pan, L. Electric Vehicle Drivers’ Charging Behavior Analysis Considering Heterogeneity and Satisfaction. J. Clean. Prod. 2021, 286, 124982. [Google Scholar] [CrossRef]
  16. Han, X.; Wei, Z.; Hong, Z.; Zhao, S. Ordered Charge Control Considering the Uncertainty of Charging Load of Electric Vehicles Based on Markov Chain. Renew. Energy 2020, 161, 419–434. [Google Scholar] [CrossRef]
  17. Sørensen, Å.L.; Lindberg, K.B.; Sartori, I.; Andresen, I. Analysis of Residential Ev Energy Flexibility Potential Based on Real-World Charging Reports and Smart Meter Data. Energy Build. 2021, 241, 110923. [Google Scholar] [CrossRef]
  18. Zhou, Y.; Meng, Q.; Ong, G.P. Electric Bus Charging Scheduling for a Single Public Transport Route Considering Nonlinear Charging Profile and Battery Degradation Effect. Transp. Res. Part B Methodol. 2022, 159, 49–75. [Google Scholar] [CrossRef]
  19. Gairola, P.; Nezamuddin, N. Optimization Framework for Integrated Battery Electric Bus Planning and Charging Scheduling. Transp. Res. Part D Transp. Environ. 2023, 118, 103697. [Google Scholar] [CrossRef]
  20. Keawthong, P.; Muangsin, V.; Gowanit, C. Location Selection of Charging Stations for Electric Taxis: A Bangkok Case. Sustainability 2022, 14, 11033. [Google Scholar] [CrossRef]
  21. Wang, L.; Dubey, A.; Gebremedhin, A.H.; Srivastava, A.K.; Schulz, N. MPC-Based Decentralized Voltage Control in Power Distribution Systems with EV and PV Coordination. IEEE Trans. Smart Grid 2022, 13, 2908–2919. [Google Scholar] [CrossRef]
  22. Boccella, A.R.; Centobelli, P.; Cerchione, R.; Murino, T.; Riedel, R. Evaluating Centralized and Heterarchical Control of Smart Manufacturing Systems in the Era of Industry 4.0. Appl. Sci. 2020, 10, 755. [Google Scholar] [CrossRef]
  23. Ma, Z.; Callaway, D.S.; Hiskens, I.A. Decentralized Charging Control of Large Populations of Plug-In Electric Vehicles. IEEE Trans. Control. Syst. Technol. 2011, 21, 67–78. [Google Scholar] [CrossRef]
  24. Lu, C.; Wu, J.; Wu, C. Privacy-Preserving Decentralized Price Coordination for EV Charging Stations. Electr. Power Syst. Res. 2022, 212, 108355. [Google Scholar] [CrossRef]
  25. Paudel, A.; Hussain, S.A.; Sadiq, R.; Zareipour, H.; Hewage, K. Decentralized Cooperative Approach for Electric Vehicle Charging. J. Clean. Prod. 2022, 364, 132590. [Google Scholar] [CrossRef]
  26. Moschella, M.; Murad, M.A.A.; Crisostomi, E.; Milano, F. Decentralized Charging of Plug-In Electric Vehicles and Impact on Transmission System Dynamics. IEEE Trans. Smart Grid 2020, 12, 1772–1781. [Google Scholar] [CrossRef]
  27. Guo, F.; Wen, C.; Mao, J.; Chen, J.; Song, Y.-D. Hierarchical Decentralized Optimization Architecture for Economic Dispatch: A New Approach for Large-Scale Power System. IEEE Trans. Ind. Inform. 2017, 14, 523–534. [Google Scholar] [CrossRef]
  28. Xu, Z.; Hu, Z.; Song, Y.; Zhao, W.; Zhang, Y. Coordination of PEVs Charging across Multiple Aggregators. Appl. Energy 2014, 136, 582–589. [Google Scholar] [CrossRef]
  29. Gao, Y.; Wang, C.; Wang, Z.; Liang, H. Research on Time-of-Use Price Applying to Electric Vehicles Charging. In Proceedings of the IEEE PES Innovative Smart Grid Technologies, Tianjin, China, 21–24 May 2012; pp. 1–6. [Google Scholar]
  30. Yang, S.Y.; Woo, J.; Lee, W. Assessing Optimized Time-of-Use Pricing for Electric Vehicle Charging in Deep Vehicle-Grid Integration System. Energy Econ. 2024, 138, 107852. [Google Scholar] [CrossRef]
  31. Plötz, P.; Jakobsson, N.; Sprei, F. On the Distribution of Individual Daily Driving Distances. Transp. Res. Part B Methodol. 2017, 101, 213–227. [Google Scholar] [CrossRef]
  32. Zhang, J.; Yan, J.; Liu, Y.; Zhang, H.; Lv, G. Daily Electric Vehicle Charging Load Profiles Considering Demographics of Vehicle Users. Appl. Energy 2020, 274, 115063. [Google Scholar] [CrossRef]
  33. Das, H.S.; Rahman, M.M.; Li, S.; Tan, C.W. Electric Vehicles Standards, Charging Infrastructure, and Impact on Grid Integration: A Technological Review. Renew. Sustain. Energy Rev. 2020, 120, 109618. [Google Scholar] [CrossRef]
  34. Rubinstein, R.Y.; Kroese, D.P. Simulation and the Monte Carlo Method; John Wiley & Sons: Hoboken, NJ, USA, 2016. [Google Scholar]
  35. Zhou, K.; Wu, Y.; Wu, X.; Sun, Y.; Teng, D.; Liu, Y. Research and Development Review of Power Converter Topologies and Control Technology for Electric Vehicle Fast-Charging Systems. Electronics 2023, 12, 1581. [Google Scholar] [CrossRef]
  36. Papamanolis, P.; Krismer, F.; Kolar, J.W. 22 Kw Ev Battery Charger Allowing Full Power Delivery in 3-Phase as Well as L-Phase Operation. In Proceedings of the 2019 10th International Conference on Power Electronics and ECCE Asia (ICPE 2019-ECCE Asia), Busan, Republic of Korea, 27–30 May 2019; pp. 1–8. [Google Scholar]
  37. Chen, Z.; Shu, X.; Sun, M.; Shen, J.; Xiao, R. Charging Strategy Design of Lithium-Ion Batteries for Energy Loss Minimization Based on Minimum Principle. In Proceedings of the 2017 IEEE Transportation Electrification Conference and Expo, Asia-Pacific (ITEC Asia-Pacific), Harbin, China, 7–10 August 2017; pp. 1–6. [Google Scholar]
  38. Helstrom, C.W. The Resolution of Signals in White, Gaussian Noise. Proc. IRE 1955, 43, 1111–1118. [Google Scholar] [CrossRef]
Figure 1. Charging and discharging optimization scheduling framework for EVs.
Designs 09 00051 g001
Figure 2. Monte Carlo simulation results for generating the driving mileage; (a) the start time of charging; (b) the required charging amount; (c) and the required charging duration; (d) of multiple EVs.
Designs 09 00051 g002
Figure 3. (a) Probability distribution and (b) probability density of the daily driving mileage of EV under different weather conditions.
Designs 09 00051 g003
Figure 4. The electricity price distribution in different time periods in Xi’an city.
Designs 09 00051 g004
Figure 5. Distribution of (a) charging level and (b) charging and discharge power states over time for EV.
Designs 09 00051 g005
Figure 6. Battery loss costs under different working conditions, (a) Case 1, (b) Case 2, (c) Case 3, (d) Case 4, (e) Case 5, (f) Case 6.
Designs 09 00051 g006aDesigns 09 00051 g006b
Figure 7. Optimization of power grid load fluctuations (considering battery degradation cost and power grid load fluctuations).
Designs 09 00051 g007
Figure 8. The power grid loads under the optimized dispatching of different numbers of EV in the iHARBOUR campus. (a) 100 EV, (b) 200 EV, (c) 300 EV, (d) 400 EV.
Designs 09 00051 g008
Figure 9. The comprehensive load power of Manlan Hotel after dispatching. (a) 100 EV, (b) 200 EV.
Designs 09 00051 g009
Figure 10. Load optimization effect and relative deviation of the model under different weight configurations.
Designs 09 00051 g010
Table 1. Parameter values of probability density functions under different weather conditions.
Weatherifwµsσs2
Sunny1.04.320.6
Rainy0.84.091.0
Snowy0.63.811.2
Table 2. Research conditions.
ParametersCase 1Case 2Case 3Case 4Case 5Case 6
Load soursiHARBOUR campusiHARBOUR campusiHARBOUR campusiHARBOUR campusManlan HotelManlan Hotel
Number of EV100200300400100200
Table 3. Electricity cost and power grid load fluctuations under different conditions.
ParametersCase 1Case2Case 3Case 4Case 5Case 6
Total power cost (yuan)435.6753 1291.1119 2346.0935 3972.6903 1299.2096 3032.9731
Max P-V diff (kW)2236.9248 1569.5937 977.7419 545.6145 486.4014 94.4252
Table 4. Summary of the scenario characteristics and optimization strategies.
Scenario CharacteristicsOptimization Strategy
Double-peak load scenarioModerate midday charging + evening peak discharge
Single-peak load scenarioMorning charging + nighttime concentrated charging
Table 5. The computation time for cases 1 to 6.
Case123456
Computational time (s)75997294133157
Disclaimer/Publisher’s Note: The statements, opinions and data contained in all publications are solely those of the individual author(s) and contributor(s) and not of MDPI and/or the editor(s). MDPI and/or the editor(s) disclaim responsibility for any injury to people or property resulting from any ideas, methods, instructions or products referred to in the content.

