Article

Design of an Experimental System for the Assessment of the Drug Loss in Drug-Coated Balloons Due to Washing Off During Tracking

by
Dimitrios Zantzas
1,†,
Elena Bianchi
1,†,
Francesca Berti
1,*,
Mohammad Akrami-Hasan-Kohal
2,
Tahmer Sharkawi
2 and
Giancarlo Pennati
1
1
Department of Chemistry, Materials and Chemical Engineering “G. Natta” (LaBS), Politecnico di Milano, Piazza Leonardo da Vinci 32, 20133 Milano, Italy
2
Institut Charles Gerhardt (ICGM), CNRS, ENSCM, Université Montpellier, 34095 Montpellier, France
*
Author to whom correspondence should be addressed.
These authors contributed equally to this work.
Designs 2025, 9(2), 37; https://doi.org/10.3390/designs9020037
Submission received: 17 January 2025 / Revised: 14 March 2025 / Accepted: 19 March 2025 / Published: 24 March 2025

Abstract

:
Drug-coated balloons (DCBs) are designed to deliver an anti-proliferative drug to the stenotic vessel to combat restenosis after an angioplasty treatment. However, significant drug loss can occur during device navigation toward the lesion site, thus reducing the delivery efficiency and increasing the off-target drug loss. In this framework, this study aimed to design a novel in vitro setup to estimate the drug loss due to blood flow–coating interaction during tracking. The system consists of a millifluidic chamber, able to host small drug-coated flat patches representative of DCBs, connected at the inlet to a syringe pump able to provide an ad hoc flow and, at the outlet, to a vial collecting the testing fluid with possible drug removed from the specimen. Unlike other studies, the device presented here uniquely evaluates flow-related drug loss from smaller-scale DCB samples, making it a precise, easy-to-use, and efficient assessment tool. In order to define proper boundary conditions for these washing off tests, computational fluid dynamics (CFD) models of a DCB in an idealized vessel were developed to estimate the wall shear stresses (WSSs) experienced in vivo by the device when inserted into leg arteries. From these simulations, different target WSSs were identified as of interest to be replicated in the in vitro setup. A combined analytical–CFD approach was followed to design the testing system and set the flow rates to be imposed to generate the desired WSSs. Finally, a proof-of-concept study was performed by testing eight coated flat specimens and analyzing drug content via high-performance liquid chromatography (HPLC). Results indicated different amounts of drug loss according to the different imposed WSSs and confirmed the suitability of the designed system to assess the washing off resistance of different drug coatings for angioplasty balloons.

1. Introduction

Atherosclerosis, the major cause of cardiovascular diseases, is defined as the narrowing of arteries due to plaque development through the years due to lipid accumulation and inflammation of the arteries [1]. Peripheral arterial disease ranks as the third most common atherosclerotic vascular morbidity, following coronary heart disease and stroke, affecting an estimated global population of over 200 million people [2]. Narrowing of arteries leads to reduced blood flow in the affected limb (specifically, the arteries of the legs, such as the superficial femoral artery) and subsequently causes ischemia. The choice of treatment varies depending on the occlusion’s severity and the plaque’s properties. The first step to combat the disease involves medication, which can help slow down the progression of the disease and, in some cases, alleviate the pain, but without curing it. If medication is deemed ineffective, the subsequent treatment step is endovascular treatment, which means inserting percutaneously through a catheter a proper device able to reach, minimally invasively, the lesion site and to execute a noninvasive procedure, e.g., an angioplasty balloon followed by the implantation of a drug-eluting stent [3], to restore the lumen patency. The anti-proliferative drug released by the stent has the primary goal of controlling the healing process of the arterial wall that was damaged during the angioplasty treatment and avoiding re-occlusion of the lumen in the subsequent months.
Recently, there has been increasing interest in using drug-coated balloons (DCBs) in such endovascular procedures rather than relying on drug-eluting stents. The rationale behind this comes from the overall preference for the “leave nothing behind” philosophy (that of angioplasty balloons) rather than having an everlasting device implanted in the body, as in the case of a stent [4,5]. DCB is a plain angioplasty balloon coated with a thin layer of anti-proliferative drugs and excipients, with the same goal of controlling the healing process of the arterial wall. Its functioning is based on the coating transfer from the device’s surface to the target lesion to exert its therapeutic effect [6]. Before being inserted percutaneously into the vasculature, the DCB is folded to reduce its diameter, enabling navigation through narrow, tortuous, or blocked arteries. However, studies on the efficacy of DCBs indicate that the success of the treatment differs across DCB types with different coating technologies, with only a small proportion of the drug transferred to the vessel, ranging from 8% to 40% [7]. Depending on the manufacturer, the coating technology may be applied either before or after folding, greatly affecting the coating homogeneity and, hence, the drug distribution [8]. Moreover, the assumption that all the drug loaded onto the coating reaches the target lesion should be better discussed. Indeed, during the procedure, the folded balloon is inserted percutaneously into the vasculature through a hemostatic valve and advanced to the target lesion (this phase is known as “tracking”). During tracking, part of the coating is lost due to (i) unwanted contacts and friction with the walls and (ii) the effect of the blood flow “washing off” the drug from the balloon, which is also critical for causing the drug to be released into the bloodstream, raising concerns about the risk of toxicity [9]. Upon arrival at the lesion site, the DCB is inflated for 1–3 min, allowing the drug-coating transfer to the artery walls, and then it is deflated and retracted.
Several in vitro bench-top setups have been developed to assess the impact of drug loss during tracking before arriving at the target lesion [8,10,11,12,13,14]. These studies have focused on device scale, primarily examining the interaction with the vessels and guiding catheters [8]. This approach, suggested by technical standards for DCBs [15], might be realistic, but it requires access to several devices (one for each experiment) and articulated testing systems able to maintain controlled and standardized conditions representative of the in vivo situation. However, studies have not distinguished whether drug loss results from tissue interaction or blood flow dynamics. During tracking, frictional forces from tissue contact and shear forces from blood flow–device interaction can both contribute to drug loss. In silico modeling, such as finite element modeling for tissue–device interaction and computational fluid dynamics (CFD) for blood flow–device interaction, has proven to be a valuable tool in estimating the forces acting on the device. These models help bridge the gap between real in vivo conditions and in vitro setups, ensuring more accurate experimental design.
Based on this, our group recently proposed a novel in vitro methodology for investigating on-target coating transfer from DCBs to the arterial wall, not at the full-device scale (based on whole-balloon inflation), but scaling down on a more local level (referred to as “mesoscale”) [16]. The design of a coupled experimental–computational workflow at a smaller scale of investigation allowed the preparation and testing of multiple specimens from a single DCB device to have a better insight into the role of contact pressures in effective coating transfer.
Following the same rationale, but focusing on a different DCB issue, and inspired by the concept described in the standards [15], we aim to propose a mesoscale approach to design an in vitro experimental setup to test flat drug-coated specimens representative of commercial DCBs (those usually adopted in the developing phase of new drug-coating strategies/formulations [17]). This will be achieved by subjecting them to controlled fluid flows, generating proper wall shear stresses as derived from in silico simulation, and assessing the undesired drug loss through high-performance liquid chromatography (HPLC) mimicking the conditions in tracking.

2. Materials and Methods

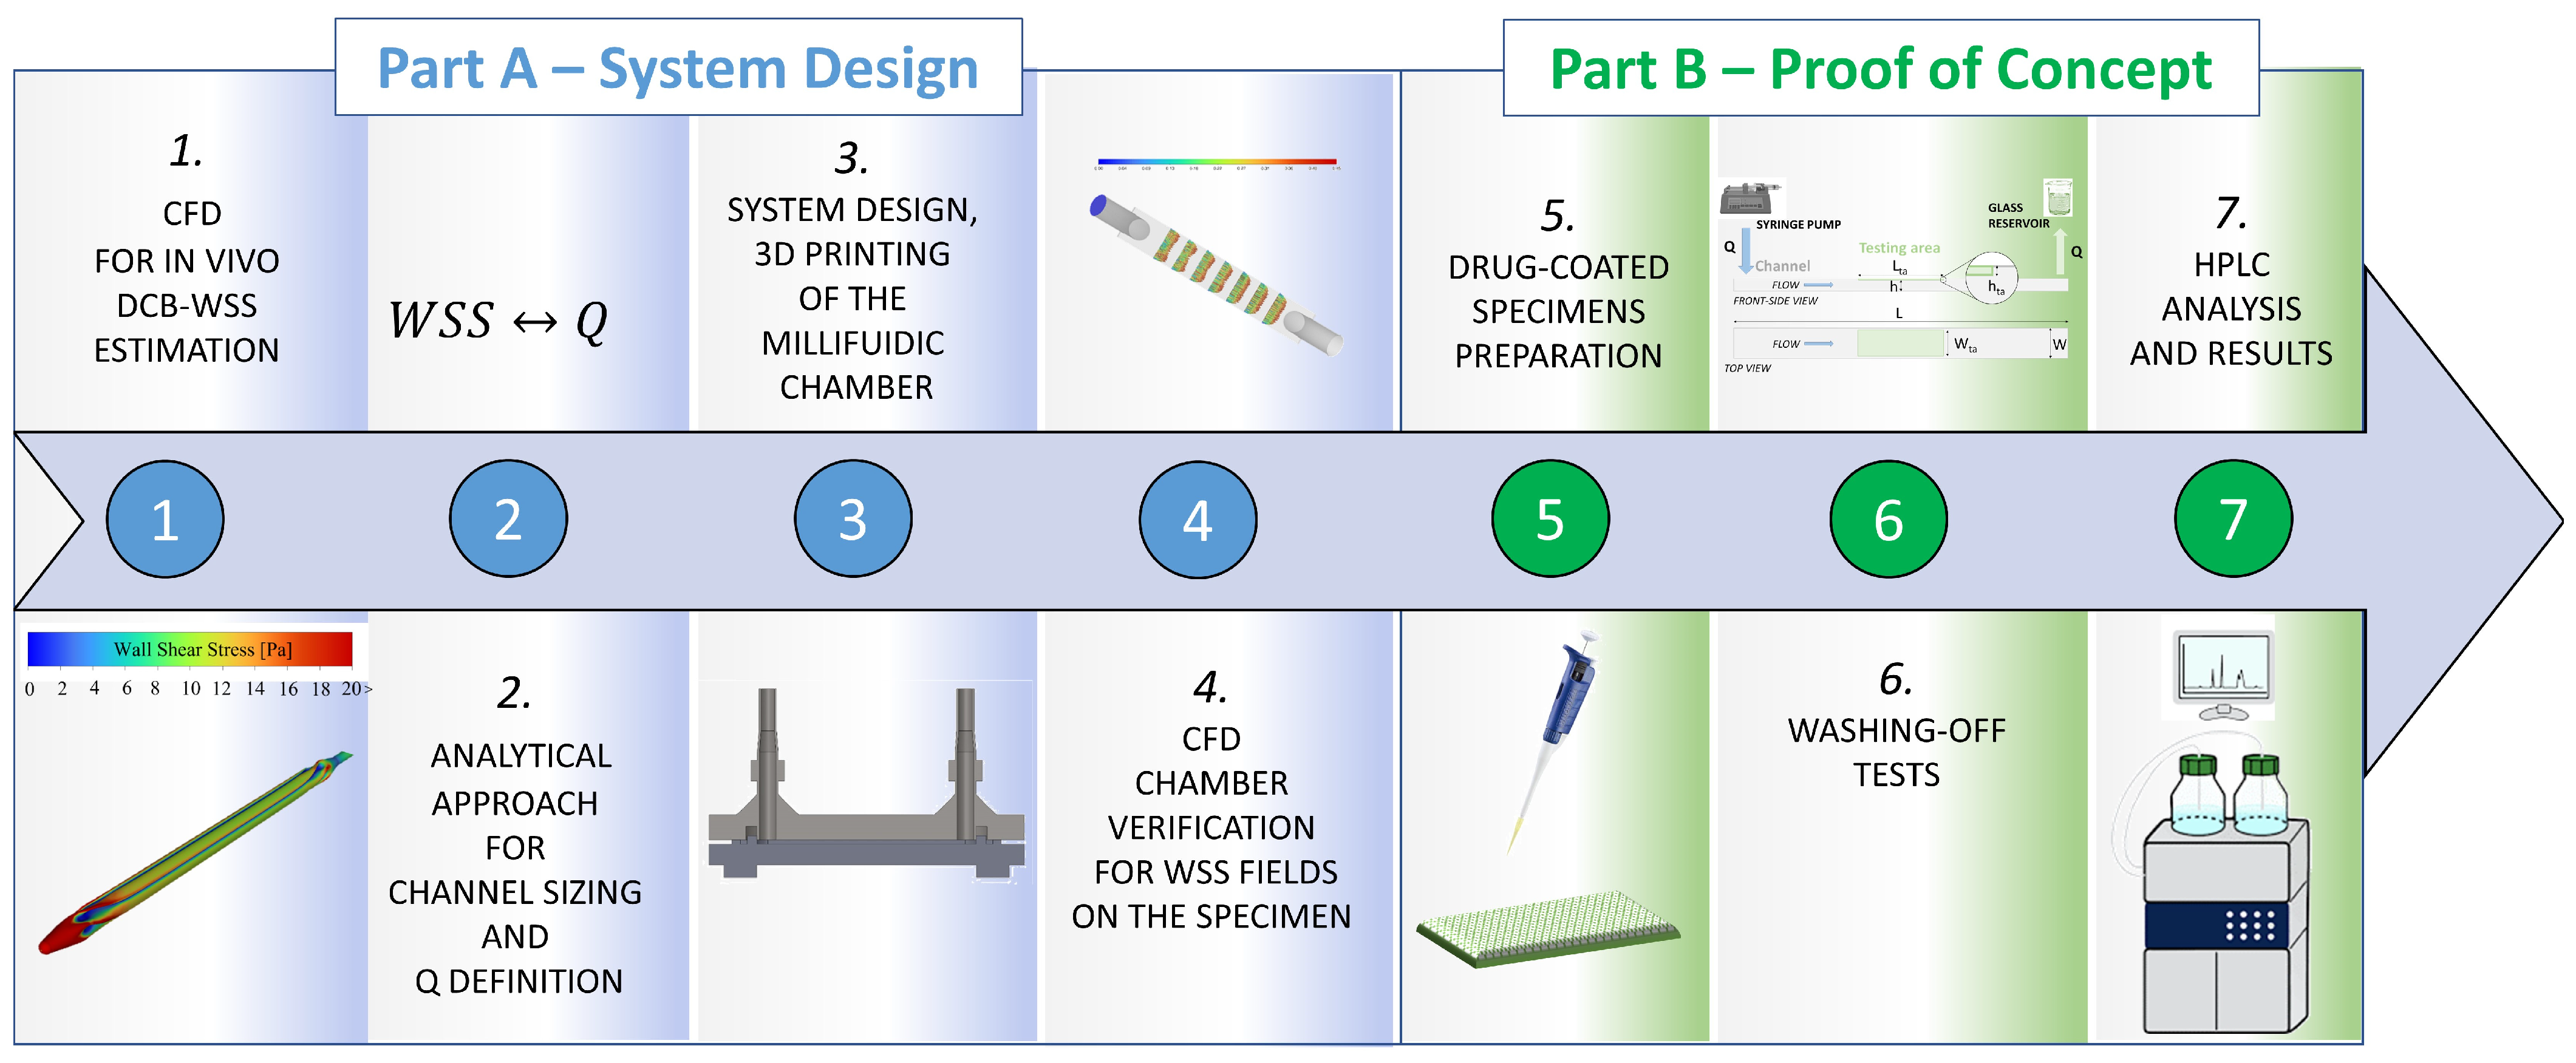
2.1. General Concept and Workflow of the Study

The setup for the drug-coating washing-off tests was conceived as an open-loop flow system, easy to use, where a chamber hosting the coated specimen is connected to a syringe pump at its inlet and to a reservoir at the outlet (Figure 1). Since flat patches were used as specimens, a parallel-plate flow chamber (creating a channel with length L and rectangular cross-section W × h with a high aspect ratio) was selected to generate a laminar steady flow parallel to the specimen surface, where the imposed wall shear stress (WSS) can be straightforwardly controlled [18,19,20,21]. An open-loop configuration is feasible since limited volumes of the testing fluid are processed. Indeed, a millifluidic chamber was designed wherein low flow rates are applied for short times, as generally, the in vivo device tracking time is less than one minute.
The syringe pump generates a suitable steady flow rate Q, inducing for a fixed time a controlled field of WSSs onto the drug-coated specimen, to be related to the amount of drug loss within the testing fluid and to evaluate the resistance of the coating to washing off. At the end of the test, the percentage of drug loss due to washing off can be obtained by measuring through HPLC both the drug content within the collected fluid in the reservoir and that remaining on the tested specimen.
Normally, coated specimens consist of a two-layer system including a drug coating (thickness from 10 to 50 μm [11,16]) and an elastomeric substrate (typically, thickness of about 50 μm [22]). In our case, a different system is considered: (i) a double-tape layer (typically, thickness from 100 to 200 μm) is added to firmly fix the sample to the plate, and (ii) the coated region is in the central part of the specimen only. Hence, we have a flat patch with three layers in the center (a whole thickness of about 200–300 μm) and two layers at the ends. The absence of drug coating at the ends allows safe handling without affecting the coated area to be tested. The specimen is designed to occupy the full length of the chamber to leave a tiny step corresponding to the sole coating thickness hta (Figure 1), considered negligible compared with h. Moreover, the specimen is located on the plate where both inlet and outlet tubes are connected. This configuration leaves the opposite side totally free for possible positioning under a microscope for real-time visualization during the test.
To limit entrance and exit effects as well as lateral wall effects, the testing area (where the coating exists and WSSs are controlled) is smaller (Wta × Lta) compared with the channel and is located centrally to the plate. A single millifluidic chamber, with a fixed parallel plate distance (H), is designed to host samples with different thicknesses, creating a range for the channel height h < H.
Figure 2 shows the workflow for designing and testing the washing off system. Two parts can be identified: (A) system design, including four steps, and (B) proof-of-concept of washing off tests, consisting of three steps.
In Part A, the first step of the study involved estimating the value of WSS generated in vivo by the blood flow on the DCB during its navigation within the vasculature (i.e., during tracking). To achieve this, three-dimensional (3D) CFD simulations were developed, incorporating a DCB in its folded configuration inserted into a cylindrical vessel (representative of the superficial femoral artery) and subjected to pulsatile flow consistent with the in vivo condition. Indeed, it is mandatory to decrease the device diameter through pleating and folding to mount it on a catheter and allow it to navigate and reach the target lesion. There, it is inflated with a prescribed pressure, allowing the distension and the coating transfer onto the wall.
The second step, based on an analytical solution for flows in a parallel-plate chamber, was focused on setting the different values of Q to obtain the desired WSS, taking into account several additional design requirements.
In the third step, once the design was finalized by including proper sealing components and inlet–outlet connectors, the system was 3D-printed and underwent preliminary assembly and sealing verifications. Finally (fourth step), the internal fluid dynamics and the WSS field applied to the coated specimen were verified by a 3D CFD approach describing the in vitro system.
In Part B, as a proof of concept, the developed system was used for performing some washing-off tests, applying different WSS conditions on a small group of drug-coated specimens and measuring the drug loss with HPLC analyses.

2.2. Part A—System Design

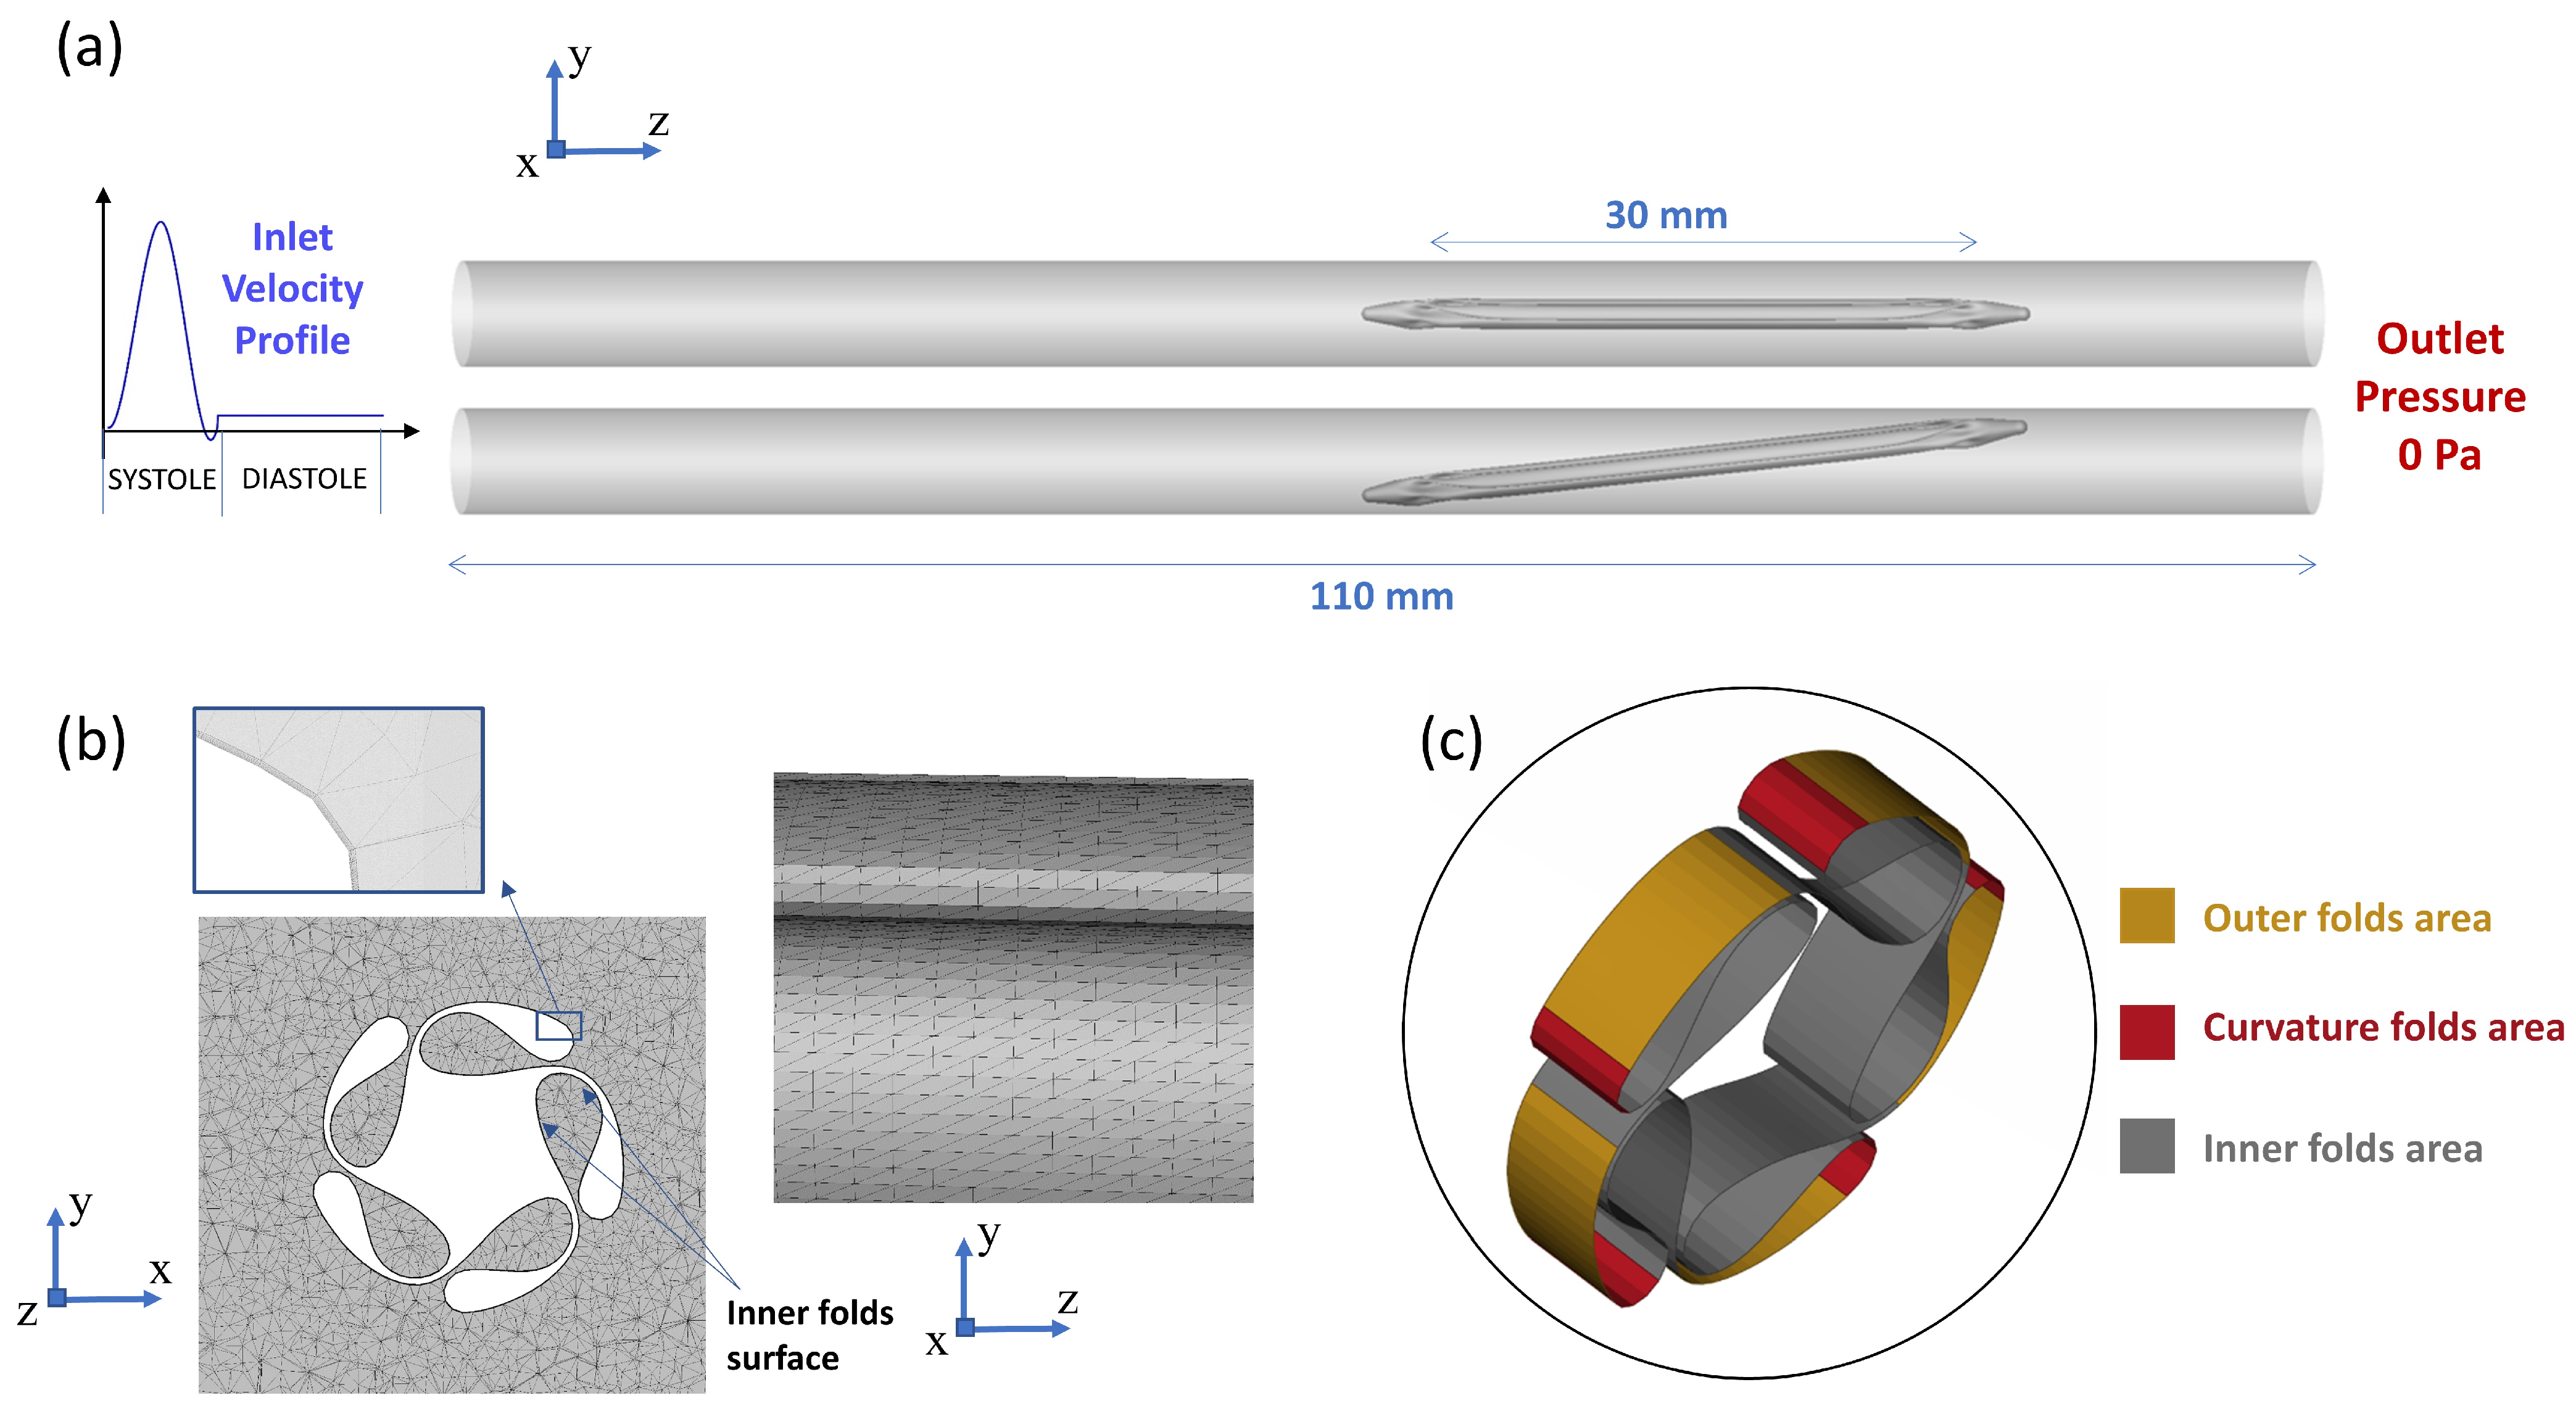
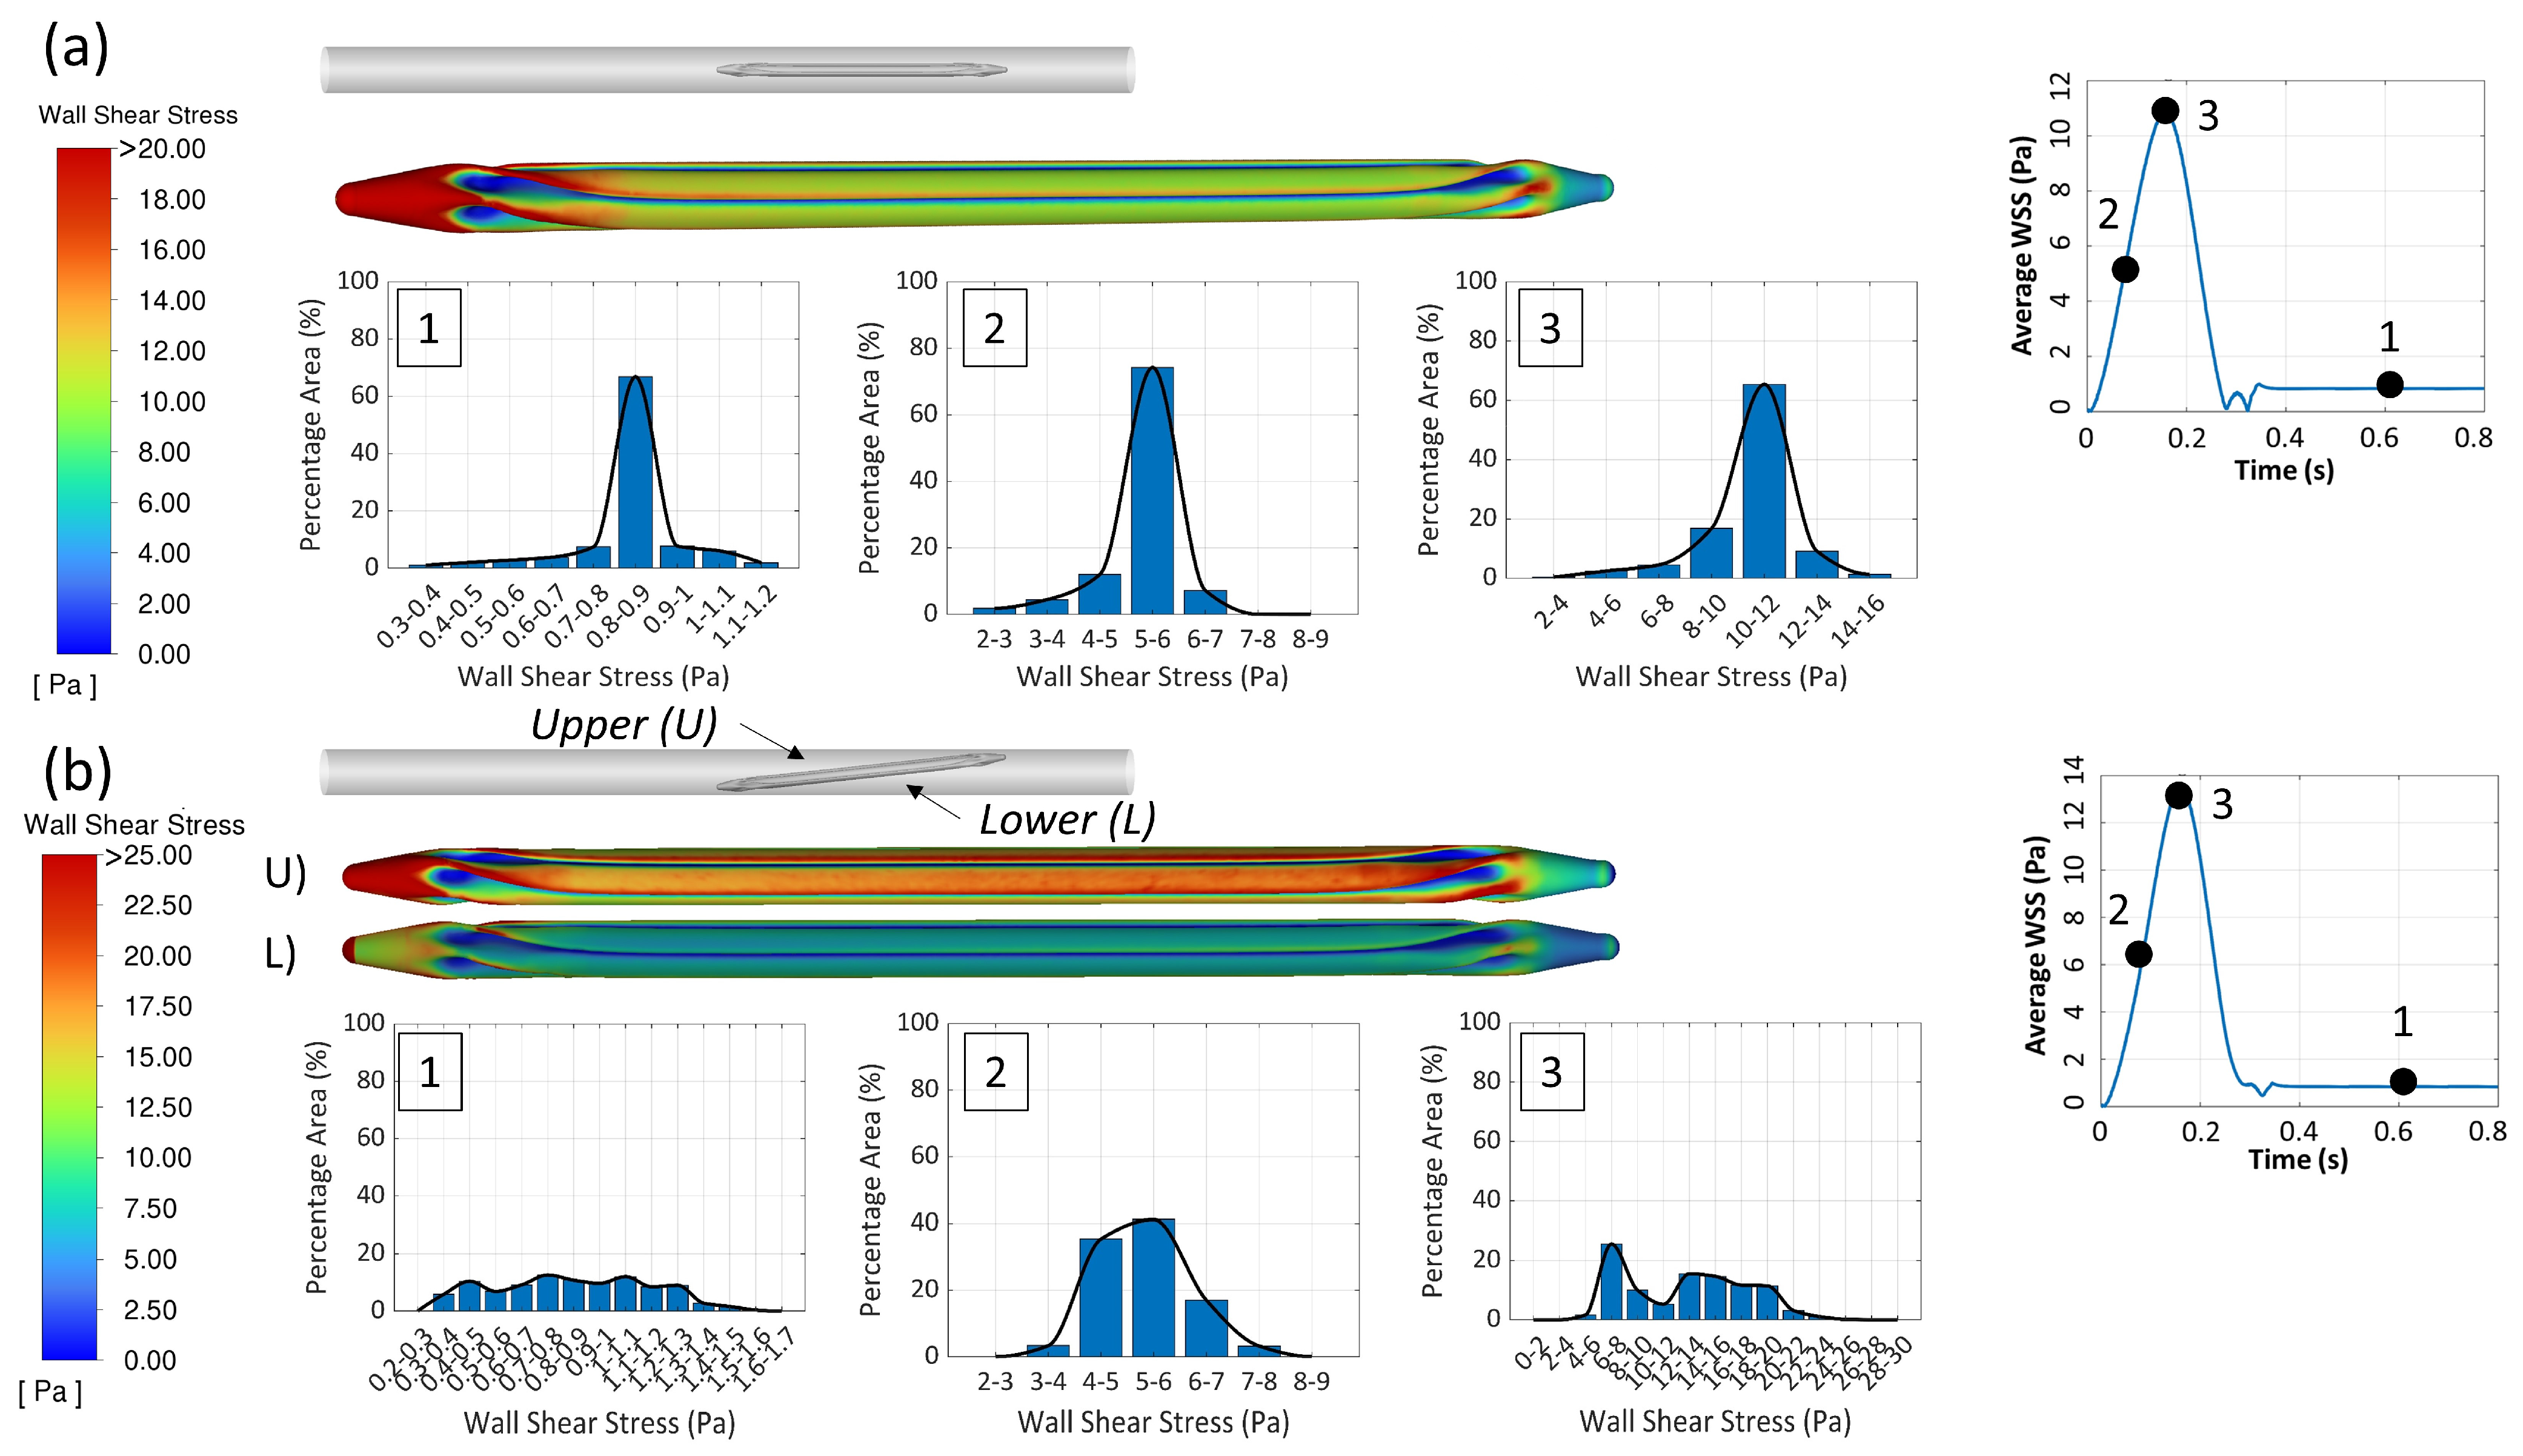
2.2.1. The 3D CFD Simulation of the Folded Balloon During Tracking

The folded DCB geometry used in this study was adapted from a previous DCB modeling work by [22]. The considered DCB has a folded diameter of 1.5 mm and a working length of 30 mm plus the two tapered ends (Figure 3a). Although once distended, the DCB is circular, its folded geometry presents a peculiar shape with a number of folds (in this case five, but other designs involve different numbers of folds) needed to reduce its transversal size during tracking. In each fold, three distinct regions can be identified (Figure 3b,c): (i) the outer area, always coated and with a high risk of washing off, being well exposed to the blood flow, (ii) the inner area, where two adjacent parts of the folded balloon membrane create a sort of very narrow conduit, highly protected although not excluded from contact with the bloodstream, and (iii) curved transition areas between the inner and outer areas (curvature). Depending on the coating technology, commercial DCBs may be entirely coated or have coating only on some areas (the outer areas and sometimes the curvatures).
For the hemodynamic simulation to derive the in vivo WSSs, the DCB was positioned within a straight, 5 mm diameter vessel representing an idealized human superficial femoral artery [23]. The artery model was 110 mm long, providing sufficient length for flow development, with the DCB positioned 60 mm from the flow inlet. Namely, as shown in Figure 3a, two three-dimensional (3D) CFD models were developed, with the DCB in two different configurations, i.e., aligned or angled with respect to the centerline of the vessel. The computational geometry was discretized using a tetrahedral mesh, which was selected following a mesh sensitivity analysis.
Since the tracking speed of the DCB is negligible compared with the blood velocities, the movement of the DCB during tracking was disregarded. Both the DCB and artery were modeled as rigid, with no-slip boundary conditions applied to their surfaces. A pulsatile flow was specified at the inlet, using a flat velocity profile with values (peak velocity of 0.577 m/s) derived from in vivo data [23]. The imposed time velocity tracing refers to an idealized (but representative) description of blood flow through the superficial femoral artery and can be divided into two distinct phases: systole and diastole. During systole, lasting about one-third of the cardiac cycle, a steep increase in the velocity is achieved up to a peak as a result of the heart’s contraction. In contrast, during diastole, the velocity stabilizes at a nearly constant value, driven by the flow resulting from the elastic recoil of the vessel walls. A zero-pressure boundary condition was applied at the outlet (right end in Figure 3).
The numerical model incorporated the continuity equation and the 3D unsteady Navier–Stokes equations for incompressible flow solved using a segregated solver in ANSYS Fluent (2023-R2, Ansys Inc., Canonsburg, PA, USA). The equations were discretized using a transient-time finite-volume solver, employing a second-order upwind scheme to minimize numerical diffusion. Blood flow was modeled as laminar, with blood treated as Newtonian, having a density of 1056 kg/m3 and a dynamic viscosity of 0.0035 Pa·s [24].
Convergence was achieved by reducing residuals to 10−5 at each time step. The cases were initialized with results from a steady-state simulation and run for five cardiac cycles (each lasting 0.8 s) to eliminate transient initial conditions. All simulations were performed on a computer node with 16 CPUs of 112 Intel(R) Xeon(R) Gold 6238R (Intel Corp., Santa Clara, CA, USA) at Politecnico di Milano.
The results of these simulations, both in the “ideal” and inclined DCB configurations, were analyzed in terms of variable WSS fields both in time (systole vs. diastole) and space (different DCB surface regions). For this purpose, to assess the conditions experienced by the different areas of the DCB during tracking, three key time points within the cardiac cycle were selected, and WSS histograms with spatial distributions were calculated for each one. The first time point corresponded to the average systolic phase, representing the mean WSS experienced during systole. The second was the peak systolic phase, capturing the brief period of maximum velocity and WSS. Finally, the average diastolic phase was evaluated to reflect the WSS during diastole, which constitutes approximately 70% of the cardiac cycle. The two tapered ends of the DCB were excluded from the analysis, as these areas are usually not coated. The resulting WSS histograms were used to identify proper WSS ranges to be used in the further design phase of the washing off experiments to assess the proper flow rates to prescribe as the inlet boundary conditions to the chamber.

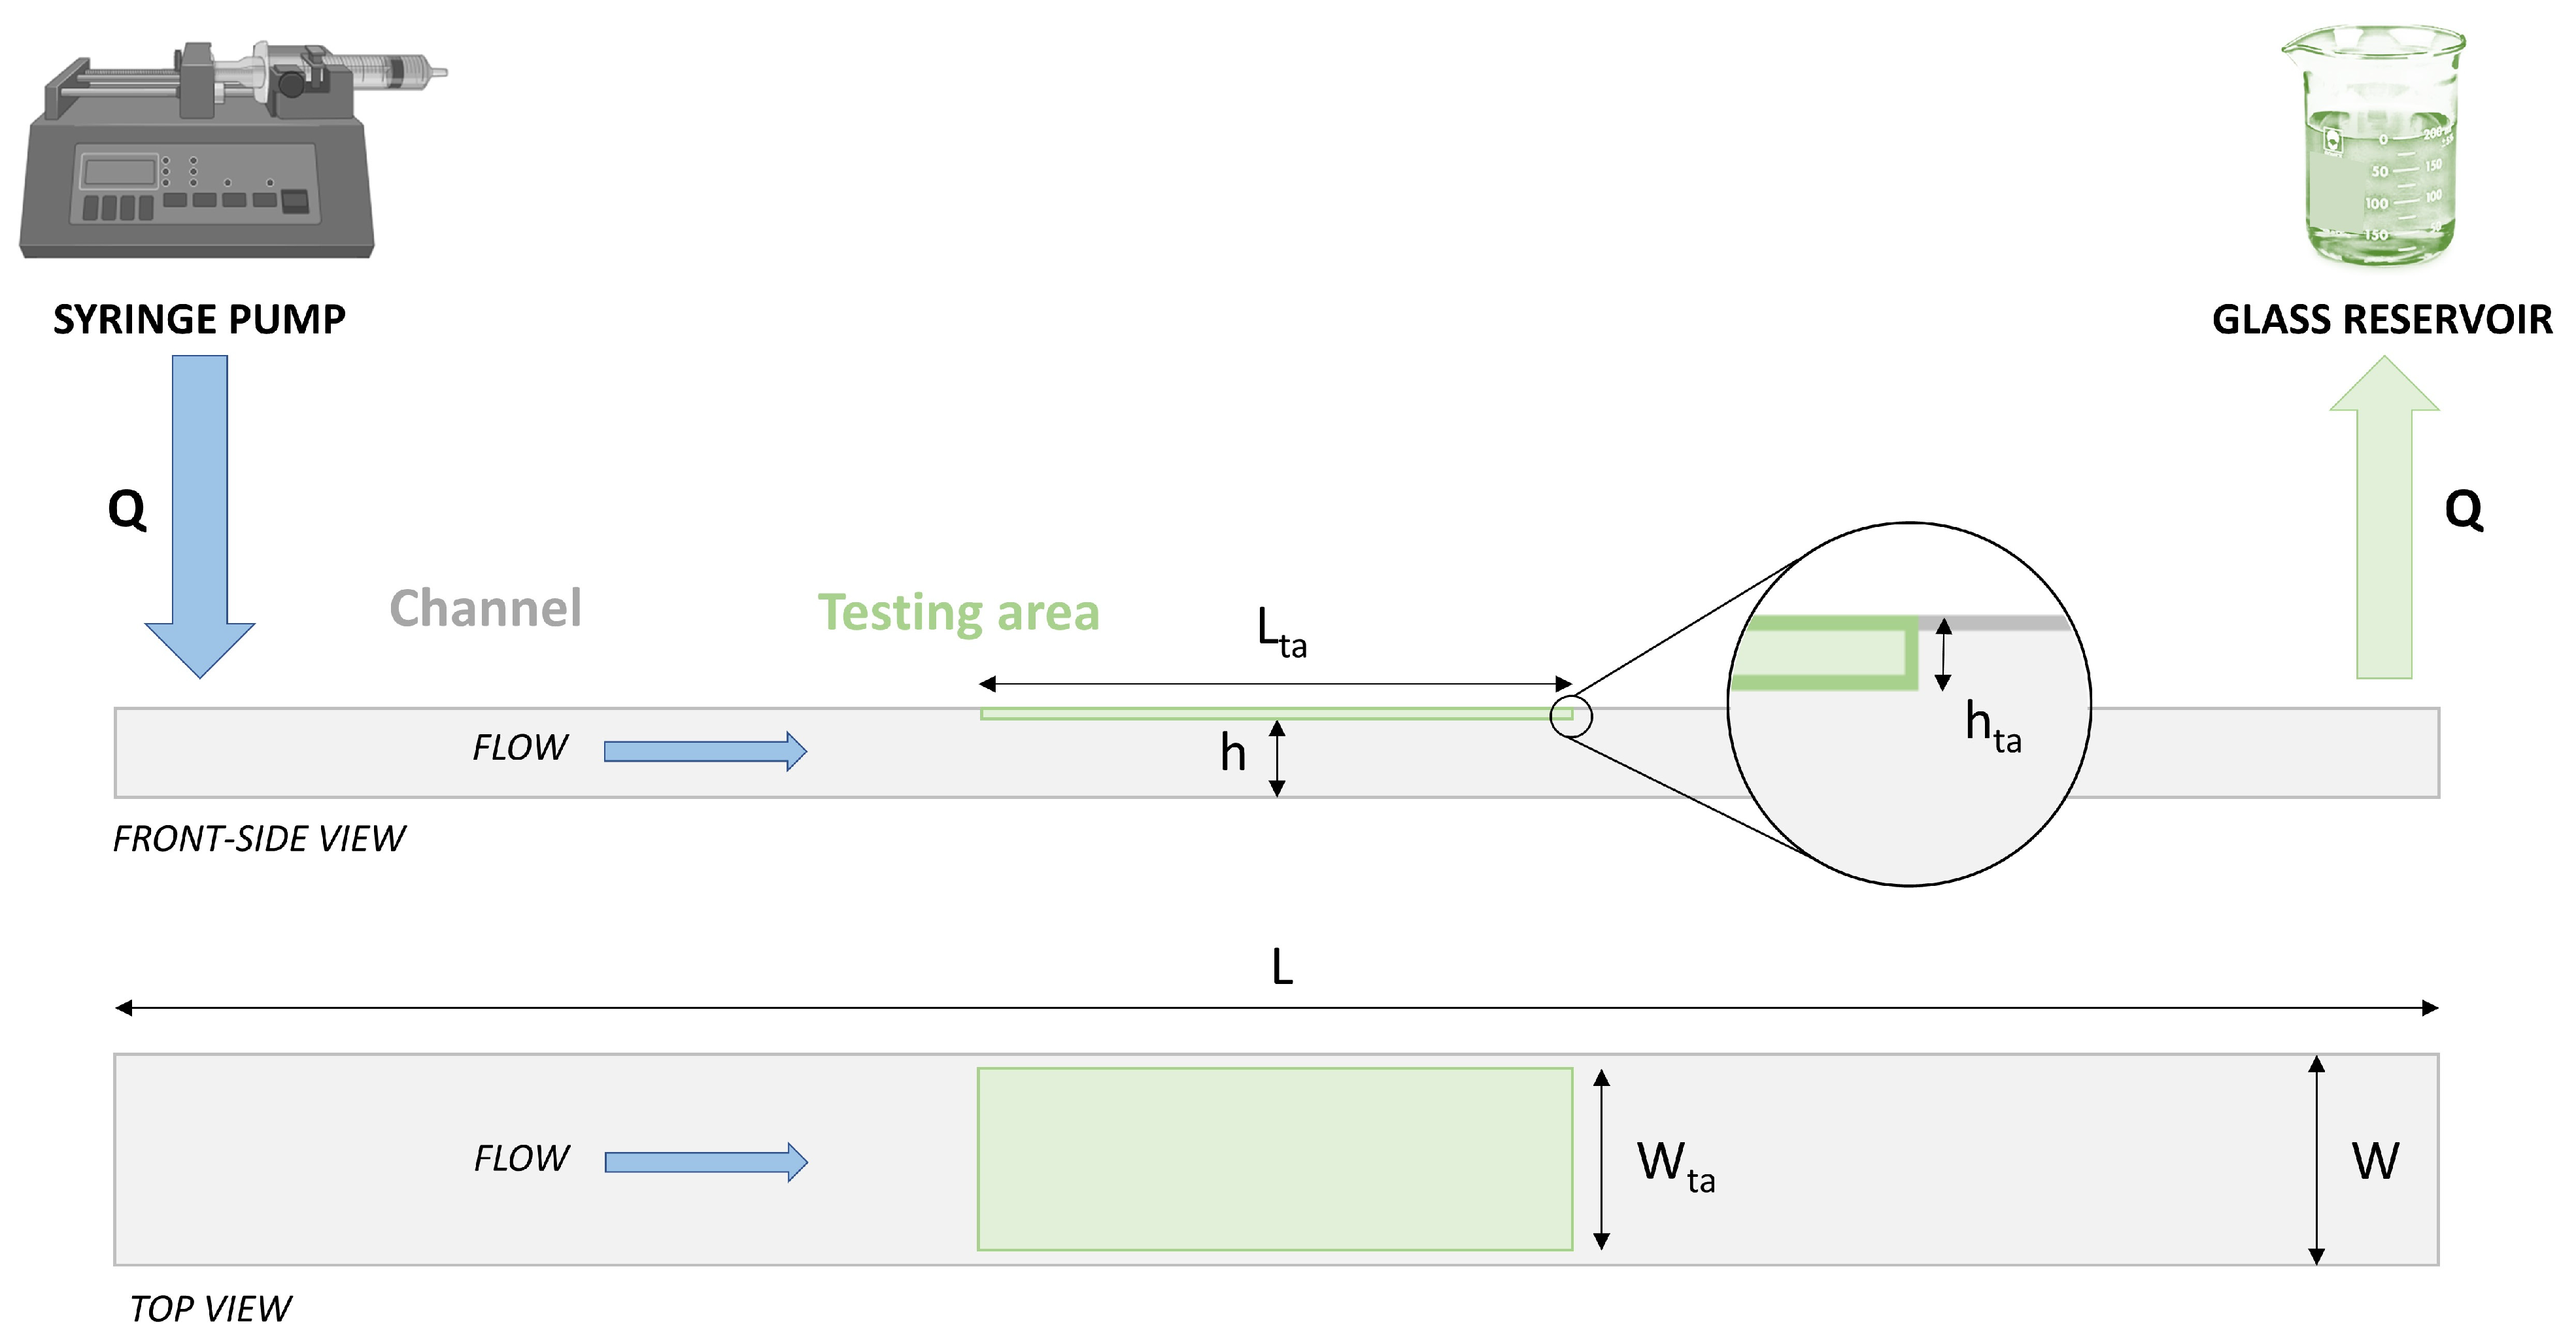
2.2.2. Analytical Approach for Channel Sizing and Q Definition

The testing region of the in vitro setup consisted of a channel with a rectangular cross-section (W × h) and length L, in which the specimen to be tested is located in one of its largest faces (W × L). The relationship between WSS for a steady laminar developed flow and the design parameters in a planar parallel plate setup with W >> h can be expressed analytically as follows:
W S S = 6 μ Q W h 2
where WSS is the shear stress on the two walls spaced by h, μ is the dynamic viscosity of the fluid, and Q is the volumetric flow rate [25].
Hence, for a fixed cross-section (W × h) and fluid viscosity μ, the desired WSS values (obtained as results of the 3D CFD analysis on the whole DCB in the previous step) can be imposed by suitably setting the inlet flow rate Q. Nevertheless, when high WSSs have to be imposed, some limits may exist on Q, which cannot be increased too much, since a laminar flow within the test section has to be guaranteed, and the end effects have to be limited.
The Reynolds number within the test section can be calculated as [26,27]
R e = 2 ρ Q μ ( W + h ) ,
where ρ is the fluid density. To ensure laminar flow in the channel, Re has to remain below a threshold (for rectangular channels, a value of 2700 is suggested [26]).
Since WSS increases the μQ product, while Re increases with the Q/μ ratio, the use of testing fluids with lower viscosity μ would require a larger value of flow rate Q to obtain a specified value of WSS, with some possible issues for the flow laminarity. For the sake of simplicity, deionized water was used for the washing-off tests. Nevertheless, since μ values for water are 0.89 at 25 °C [28], there can be foreseen an increase in the testing fluid dynamic viscosity to reduce Re, if needed to apply high WSS. For instance, a four-times water viscosity of 0.00356 Pa∙s mimics the blood well. Increasing the fluid viscosity, and, in turn, reducing Re, accounts also for shorter entrance length and reduced lateral wall impact.
The sizing of the channel was guided by the following considerations:
  • h was set to 0.7–0.8 mm: this range is a reasonable compromise between (i) the need to use small flow rates Q to generate the WSS field (WSSQ/h2) on coated specimens (to minimize the fluid to be collected in the vial to be analyzed by HPLC) and (ii) the possibility to neglect the variability of the specimen thickness (h much larger than the flat-coated specimen thickness variation, expected to be about 20 μm) and the hta step (see Figure 1);
  • W was set to 5 mm: this value is a reasonable compromise between (i) the need to test sufficiently large coated areas (to have measurable amounts of drug loss) and (ii) the need to use small flow rates to generate the WSS field (WSSQ/W) on coated specimens; moreover, this W guarantees a W/h ratio high enough to ensure almost homogeneous WSS along the specimen width W [29];
  • L was set to 40 mm: this value is a reasonable compromise between (i) the need to ensure adequate flow control on the testing region and (ii) the need to limit overall dimensions for easy manual assembly and handling; the specimen to test is planned to occupy the full length of the chamber, whereas the coated area covers only a central part of 20 mm, and two uncoated 10 mm lengths are located close to the inlet and the outlet, where WSS values cannot be controlled.
Based on Equation (1) and the three levels (low, mean, peak) of the in vivo WSS to be deduced with CFD simulations in Section 2.2.1, corresponding values of flow rates Q were calculated for μ equal to 0.00089 Pa∙s and 0.00356 Pa∙s.
Concerning the end effects in rectangular channels, [27] proposes a semi-analytical solution for the development of a flat velocity profile in steady conditions:
L e = Φ · D e · R e
where D e = 2 ( W · h ) / ( W + h ) , and Φ is a coefficient depending on the channel aspect ratio. For the selected W and h values, Φ is about 0.025. Although this Le value cannot be rigorously applied to our channel, expecting more complex inlet velocity profiles, it can provide an indication of the reliability of the WSS values based on Equation (1).

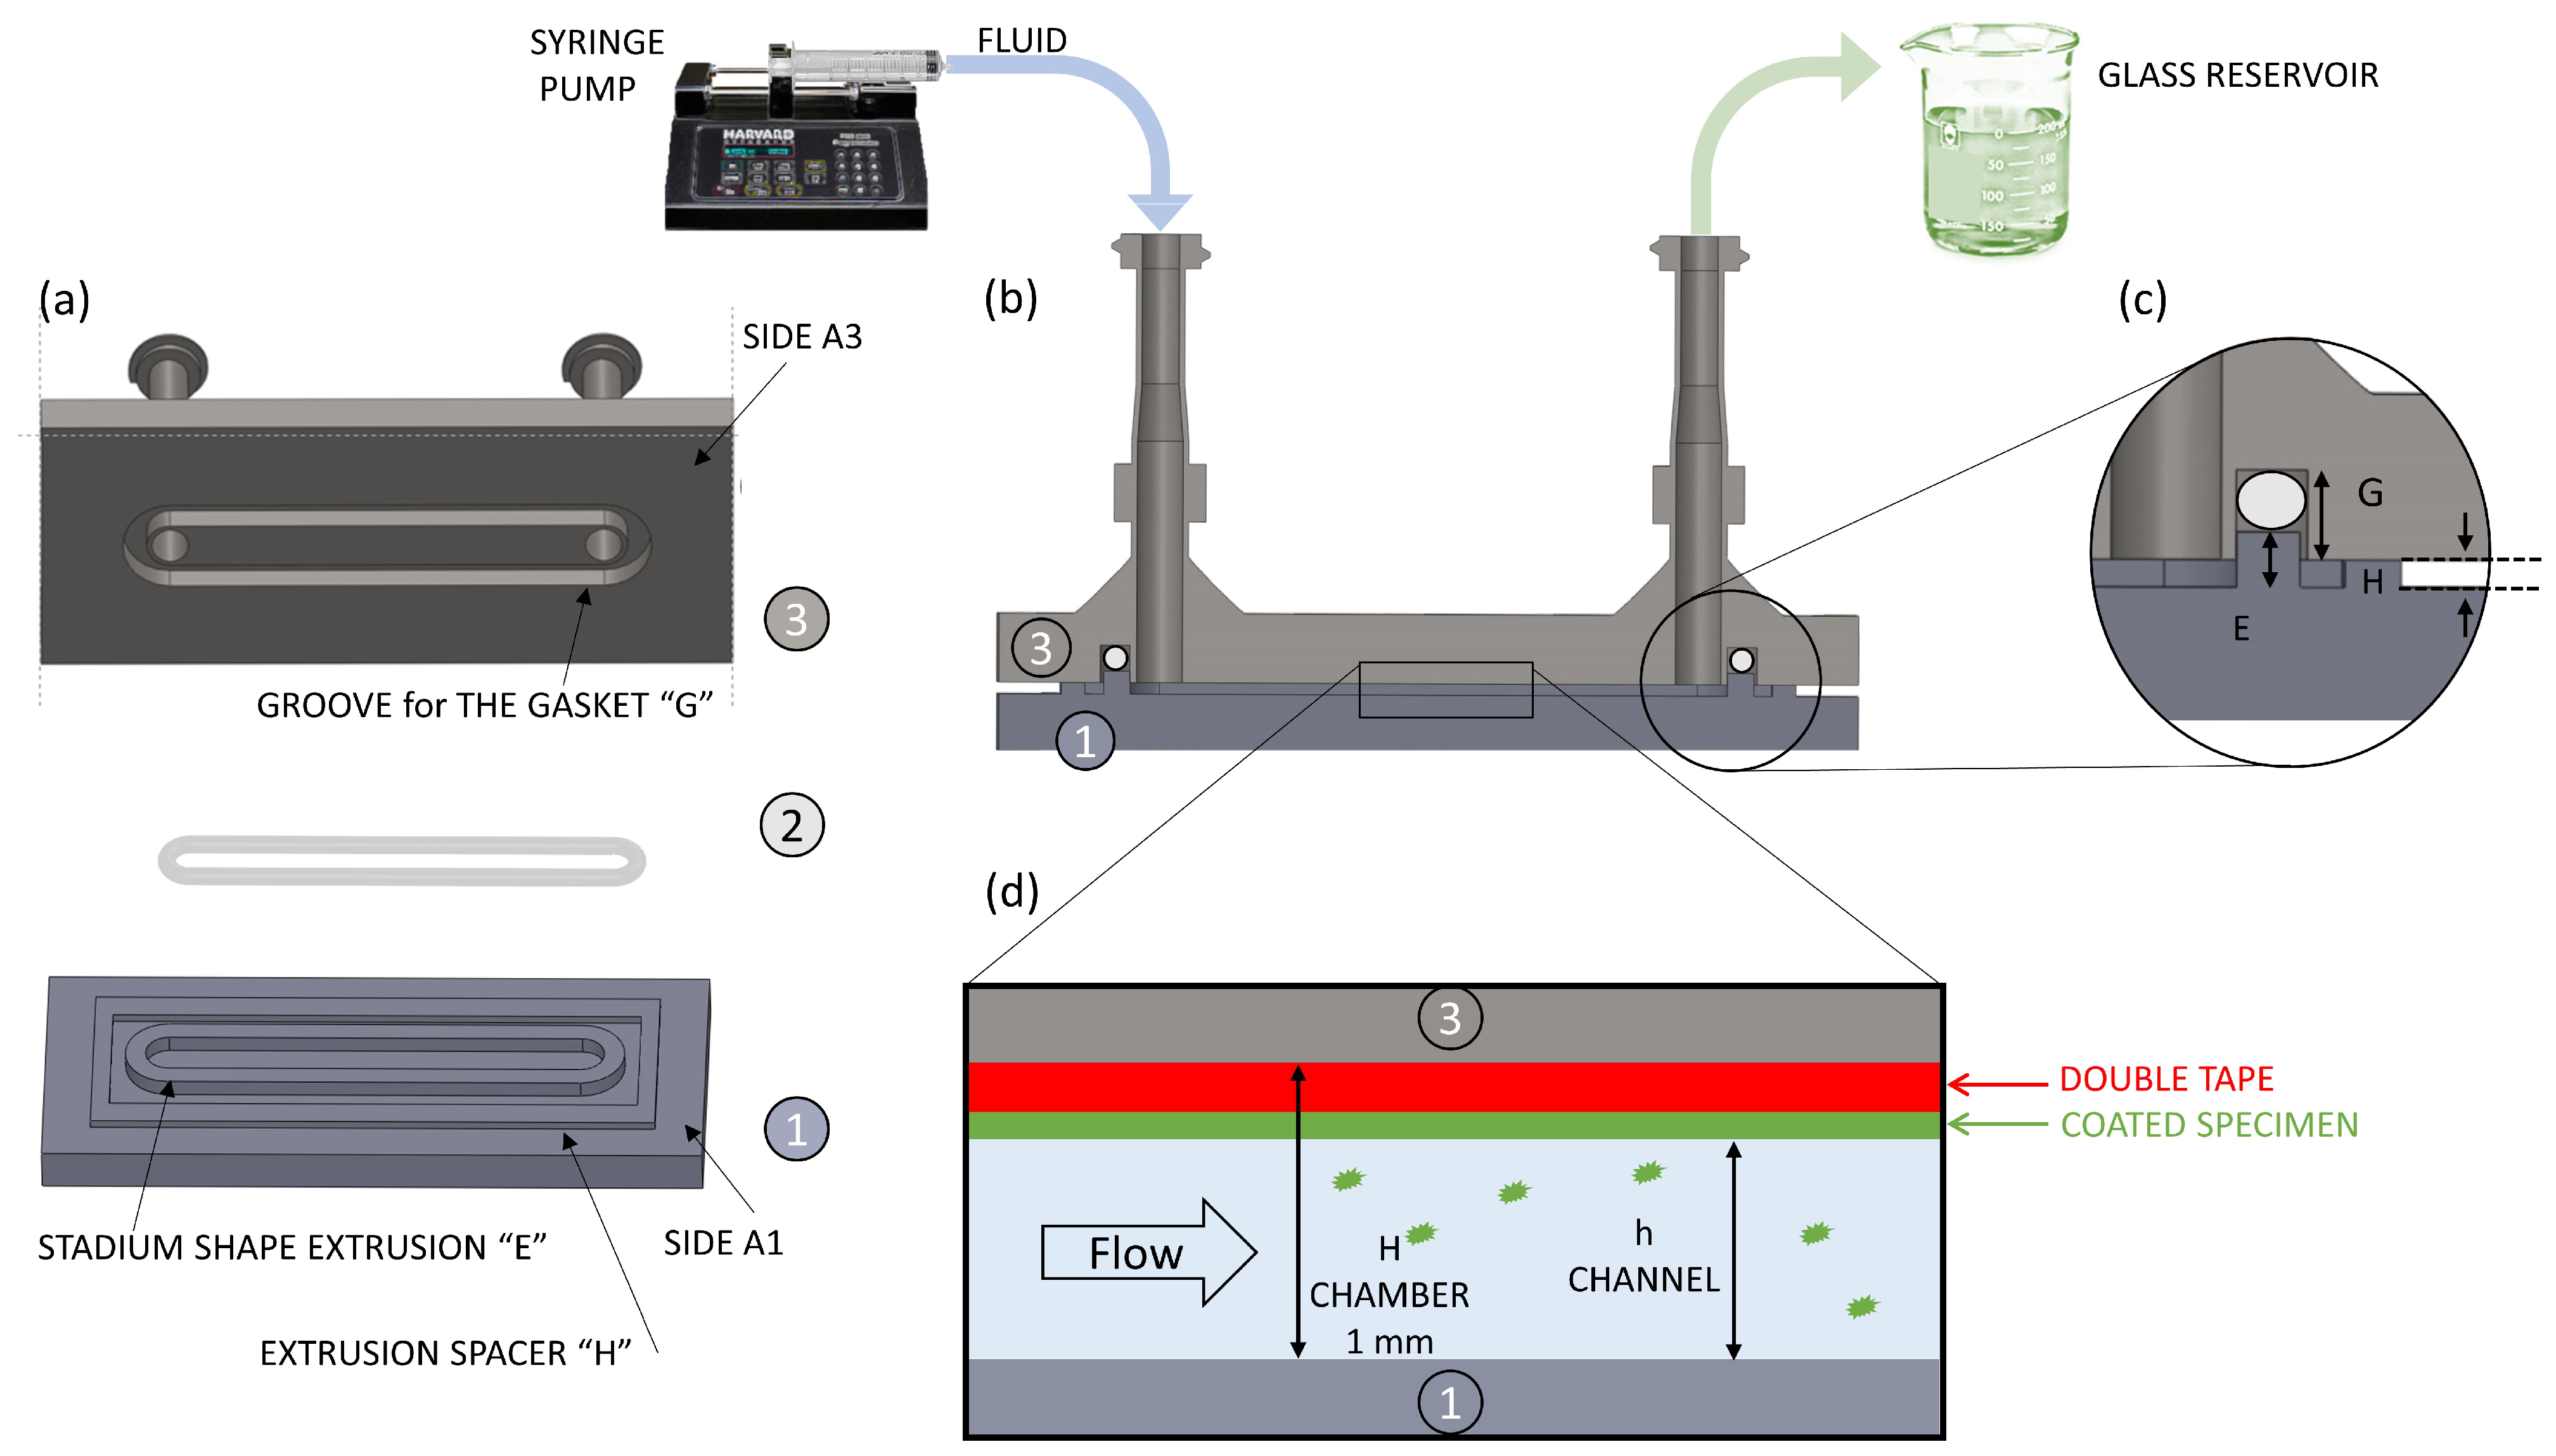
2.2.3. System Design, 3D Printing of a Prototype, and Sealing Testing

The testing millifluidic chamber was created by assembling two components (Part 1—bottom and Part 3—top), with an interposed gasket (Part 2) designed to ensure proper alignment and sealing (Figure 4). Parts 1 and 3 were produced by 3D printing (Formlabs, Form 3B+, Clear Resin) and show matching elements for proper assembly. Both the parts are plate-shaped components (80 × 10 × 6 mm). On one side of Part 1 (A3), there was an elongated rounded rectangle extrusion “E” (1.5 mm in width × 2 mm in thickness, stadium-shaped), designed to match the corresponding stadium-shaped groove “G” of Part 3, A1 side (1.88 mm in width × 2.13 mm in thickness) where the gasket was inserted. On the A1 side, another rectangular extrusion “H” was created to be the spacer between A1 and A3, defining the height H of the internal fluidic chamber. The width of the chamber was 5 mm, as defined in the previous section. The fluidic chamber was defined as the volume inside the stadium-shaped extrusion. The sealing of the two parts was achieved with the placing of a silicone O-ring (Quarkzman, silicone, 37 mm inner diameter, 40 mm outer diameter, circular section, 1.5 mm thickness) inside the stadium-shaped groove specifically designed to host it in the deformed configuration. To ensure an effective gasket compression and a controlled H, Part 1 and Part 3 have to behave as rigid compared with the gasket. The gasket was selected in soft silicone (usually shore A 50–70), considering the low-pressure operation of the chamber and the limited stiffness of the compressing parts, built in a polymeric resin. Matching groove and stadium-shaped extrusion were designed to obtain the sealing with a 13% gasket deformation.
In Part 3, side A3, placed at the lateral extremes inside the area of the groove, there were two through-holes (4 mm in diameter) connected to two other cylindrical extrusions on the opposite side, with the function of fluidic connectors to the inlet and the outlet of the fluidic chamber provided with female Luer® adapters. The distance between the inlet and outlet channel was 40 mm, as defined in the previous section.
The specimen test had to be placed and secured to surface A3 inside the chamber, secured by double tape (Figure 4c). Since the whole thickness of the multilayer specimen was expected to be in the range 0.2–0.3 mm, the height of the spacer H was set to 1 mm in order to obtain a fluidic channel with h in the range of 0.7–0.8 mm.
To apply proper gasket compression and seal the entire setup, two suitable clamps were used. In the fluidic system, the chamber was connected to a syringe pump (PHD 2000, Harvard Apparatus, Holliston, MA, USA) equipped with a syringe (Terumo Shibuya, Tokyo, Japan, 60 mL). The pump was connected to the inlet port of the chamber through 3 mm internal diameter tubing, L = 30 cm (Polytetrafluoroethylene, PTFE). A second portion of tubing, L = 30 cm, was then connected from the outlet port of the chamber to a collection reservoir. All the connections of the tube to the syringe or to the chambers were made with barbed Luer connections (Polypropylene, Masterflex® Union Fittings, Avantor, Radnor Township, PA, USA).
The selection of the syringe pump was based on its ability to run experiments within a short time frame while providing accurate flow control. The pump’s maximum flow rate is 220 mL/min with one syringe of 140 mL (datasheet values). The biggest syringe size available on the market, with a Luer connection, is the 60 mL (Terumo), which allows a maximum flow rate of 110 mL/min, a value that can be doubled by using two parallel syringes. To provide the set of high flow rates, two syringes were employed in conjunction with a Y-connector. Since the fluid operating pressure condition was low, the syringe pump (max linear force 23 kg) was able to provide the whole range of computed flow rates.
Taking into account that the O-ring (circular shape) was deformed to be adapted to the stadium-shaped groove, a preliminary sealing test was performed to verify its effectiveness. Preliminary sealing tests were conducted with water on the assembled system with a flow rate of 180 mL/min imposed by the syringe pump. The sealing behavior, verified by checking the perimeter of the chamber for 1 min tested with a paper towel, was perfect.

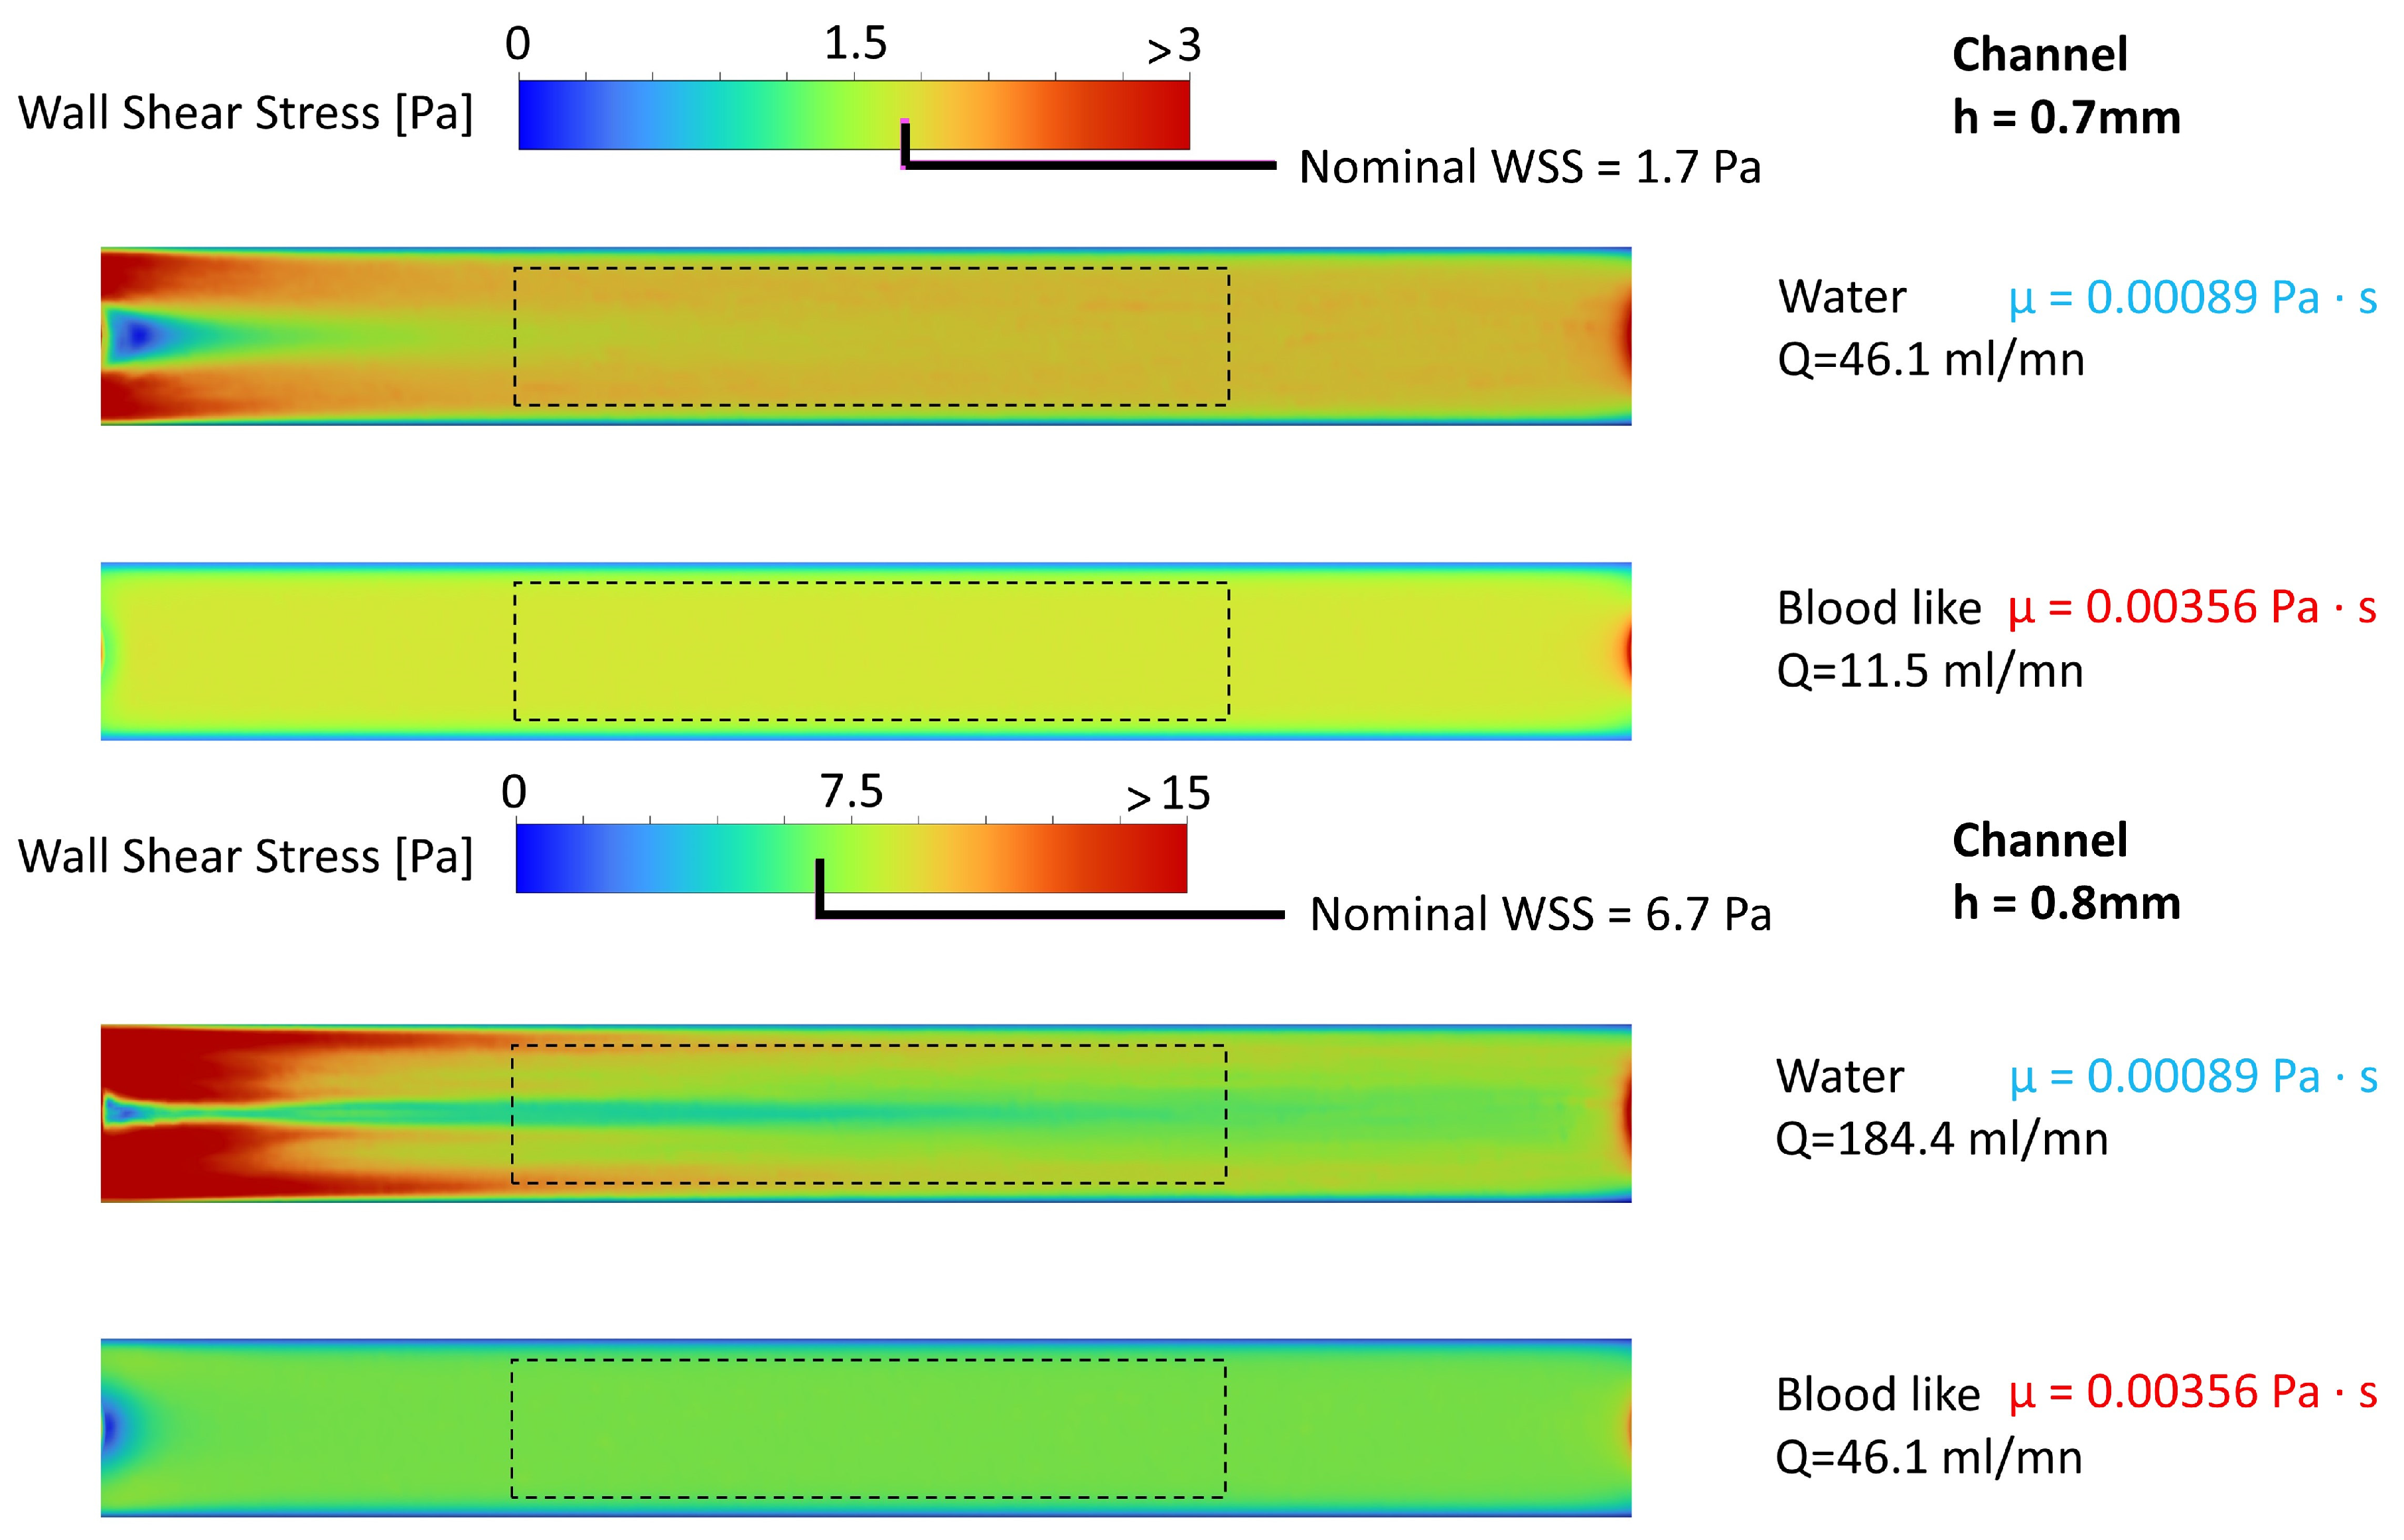
2.2.4. CFD Chamber Verification

To verify the WSS field within the chamber and possible deviations with respect to the values provided by the analytical approach (Equation (1) in Section 2.2.2), a 3D CFD model of the designed testing channel with inlet and outlet tubes was developed in ANSYS Fluent. Steady-state simulations were conducted imposing the flow rates obtained as a result of the analytical approach (see Section 2.2.2) to assess the ability to recreate appropriate WSS values in the testing area of the coated specimens. The computational domain included the inlet and outlet (two cylinders) and the channel (a box), properly connected according to the millifluidic chamber design. A mass flow rate Q was applied at the inlet, while the outlet was set to zero pressure. The mass flow rate values and fluid properties were selected for several conditions to examine the capabilities and limitations of the design parameters. The flow was modeled as laminar, with the fluid treated as Newtonian. For water (T = 25 °C), the fluid properties were a density of 1000 kg/m3 and a dynamic viscosity of 0.00089 Pa∙s, while for a blood-like fluid, the density was 1056 kg/m3 and the dynamic viscosity was 0.00356 Pa∙s, as defined in Section 2.2.2. The computational grid domain for the flow chamber used tetrahedral mesh (main size 0.1 mm with 8 layers of boundary-layer grid and 4 to 4.25 million volume mesh elements, depending on the channel height of 0.7 or 0.8, respectively). WSS analyzed values were those related to the testing surface.

2.3. Part B—Proof of Concept

2.3.1. Drug-Coated Specimen Preparation

Several drug-coated specimens were prepared according to the work of [17]. Namely, PEBAX® 7233 pellets (generously donated by Arkema, Colombes, France) were used to obtain thin-film substrates to resemble commercial balloon surfaces, as it is the most common material for this application. As a drug, Everolimus (EVE) was adopted (C_53 H_83 NO_14 MW 958.224 g/mol, kindly provided by Boston Scientific Limited, Galway, Ireland) properly combined with Pluronic P123 (P123, Mn~5800 from Sigma Aldrich, St. Louis, MO, USA) as an excipient.
The PEBAX® films were created by placing 2 g of pellets under a heat press machine between thin Teflon sheets and compressing at 210 °C and 200 bar for 5 min. This process allowed the obtaining of films that were coated with EVE-loaded P123 coating in 90:10 P123 to EVE ratio via micro-pipetting. Previous analyses by Optical Coherence Tomography (OCT) (not reported here) indicated a thickness of about 67 ± 16 μm and 107 ± 23 μm for the uncoated and coated membranes, respectively. According to Section 2.2.2, the coating was deposited, creating rectangular areas (4 × 20 mm) surrounded by uncoated portions. Then, eight specimens with proper size (40 mm × 5 mm with a 20 mm × 4 mm coated area in the central region) were obtained to be subjected to the subsequent washing off tests. The coating thickness was calibrated to have a specific drug concentration. The target dose of EVE was 2.5 μg/mm2 but, since the coating technology was applied manually by an operator using micro-pipetting, varying amounts of drug may have been deposited on the surface of each specimen. The actual quantities were measured for each specimen at the end of the washing off tests (see Section 2.3.3).

2.3.2. Experiments

As a proof of concept for the capabilities of the developed washing off setup, the eight specimens were inserted in the millifluidic chamber and subjected to different fluid flow conditions (considering four specimens for each condition) to assess the impact of WSS on drug loss, namely Q1 and Q2. These flows were defined on the basis of the analytical–numerical analyses in the design phase (Section 3.1.2). For each experiment, the specimen was placed and fixed into the chamber using a commercially available double tape (3M, Maplewood, MN, USA) of 190 μm thickness, suggesting a full specimen thickness of 297 μm (190 + 107 μm), as in Section 2.3.1.
After assembling all parts, a tube was connected to the inlet (connected to the syringe pump) and outlet, where a reservoir was placed to collect the fluid coming out from the system. During the chamber filling phase, a volume of 2.3 mL of water at room temperature was introduced at a low flow rate to ensure no bubbles were present in the testing region, which could interfere with the developed conditions inside the chamber.
Hence, flow rate values previously calculated for a channel height of 0.7 mm could be reasonably generated by the syringe pump injecting distilled water at room temperature into the chamber for 30 s to assess washing off.
At the end of each test, both the coated specimen and the collected fluid were analyzed for drug content by using HPLC-UV analysis. After each experiment, the chamber was cleaned with 70% ethanol for two minutes, followed by two minutes of rinsing with clear water, ensuring no residual drug from previous experiments remained in the chamber.

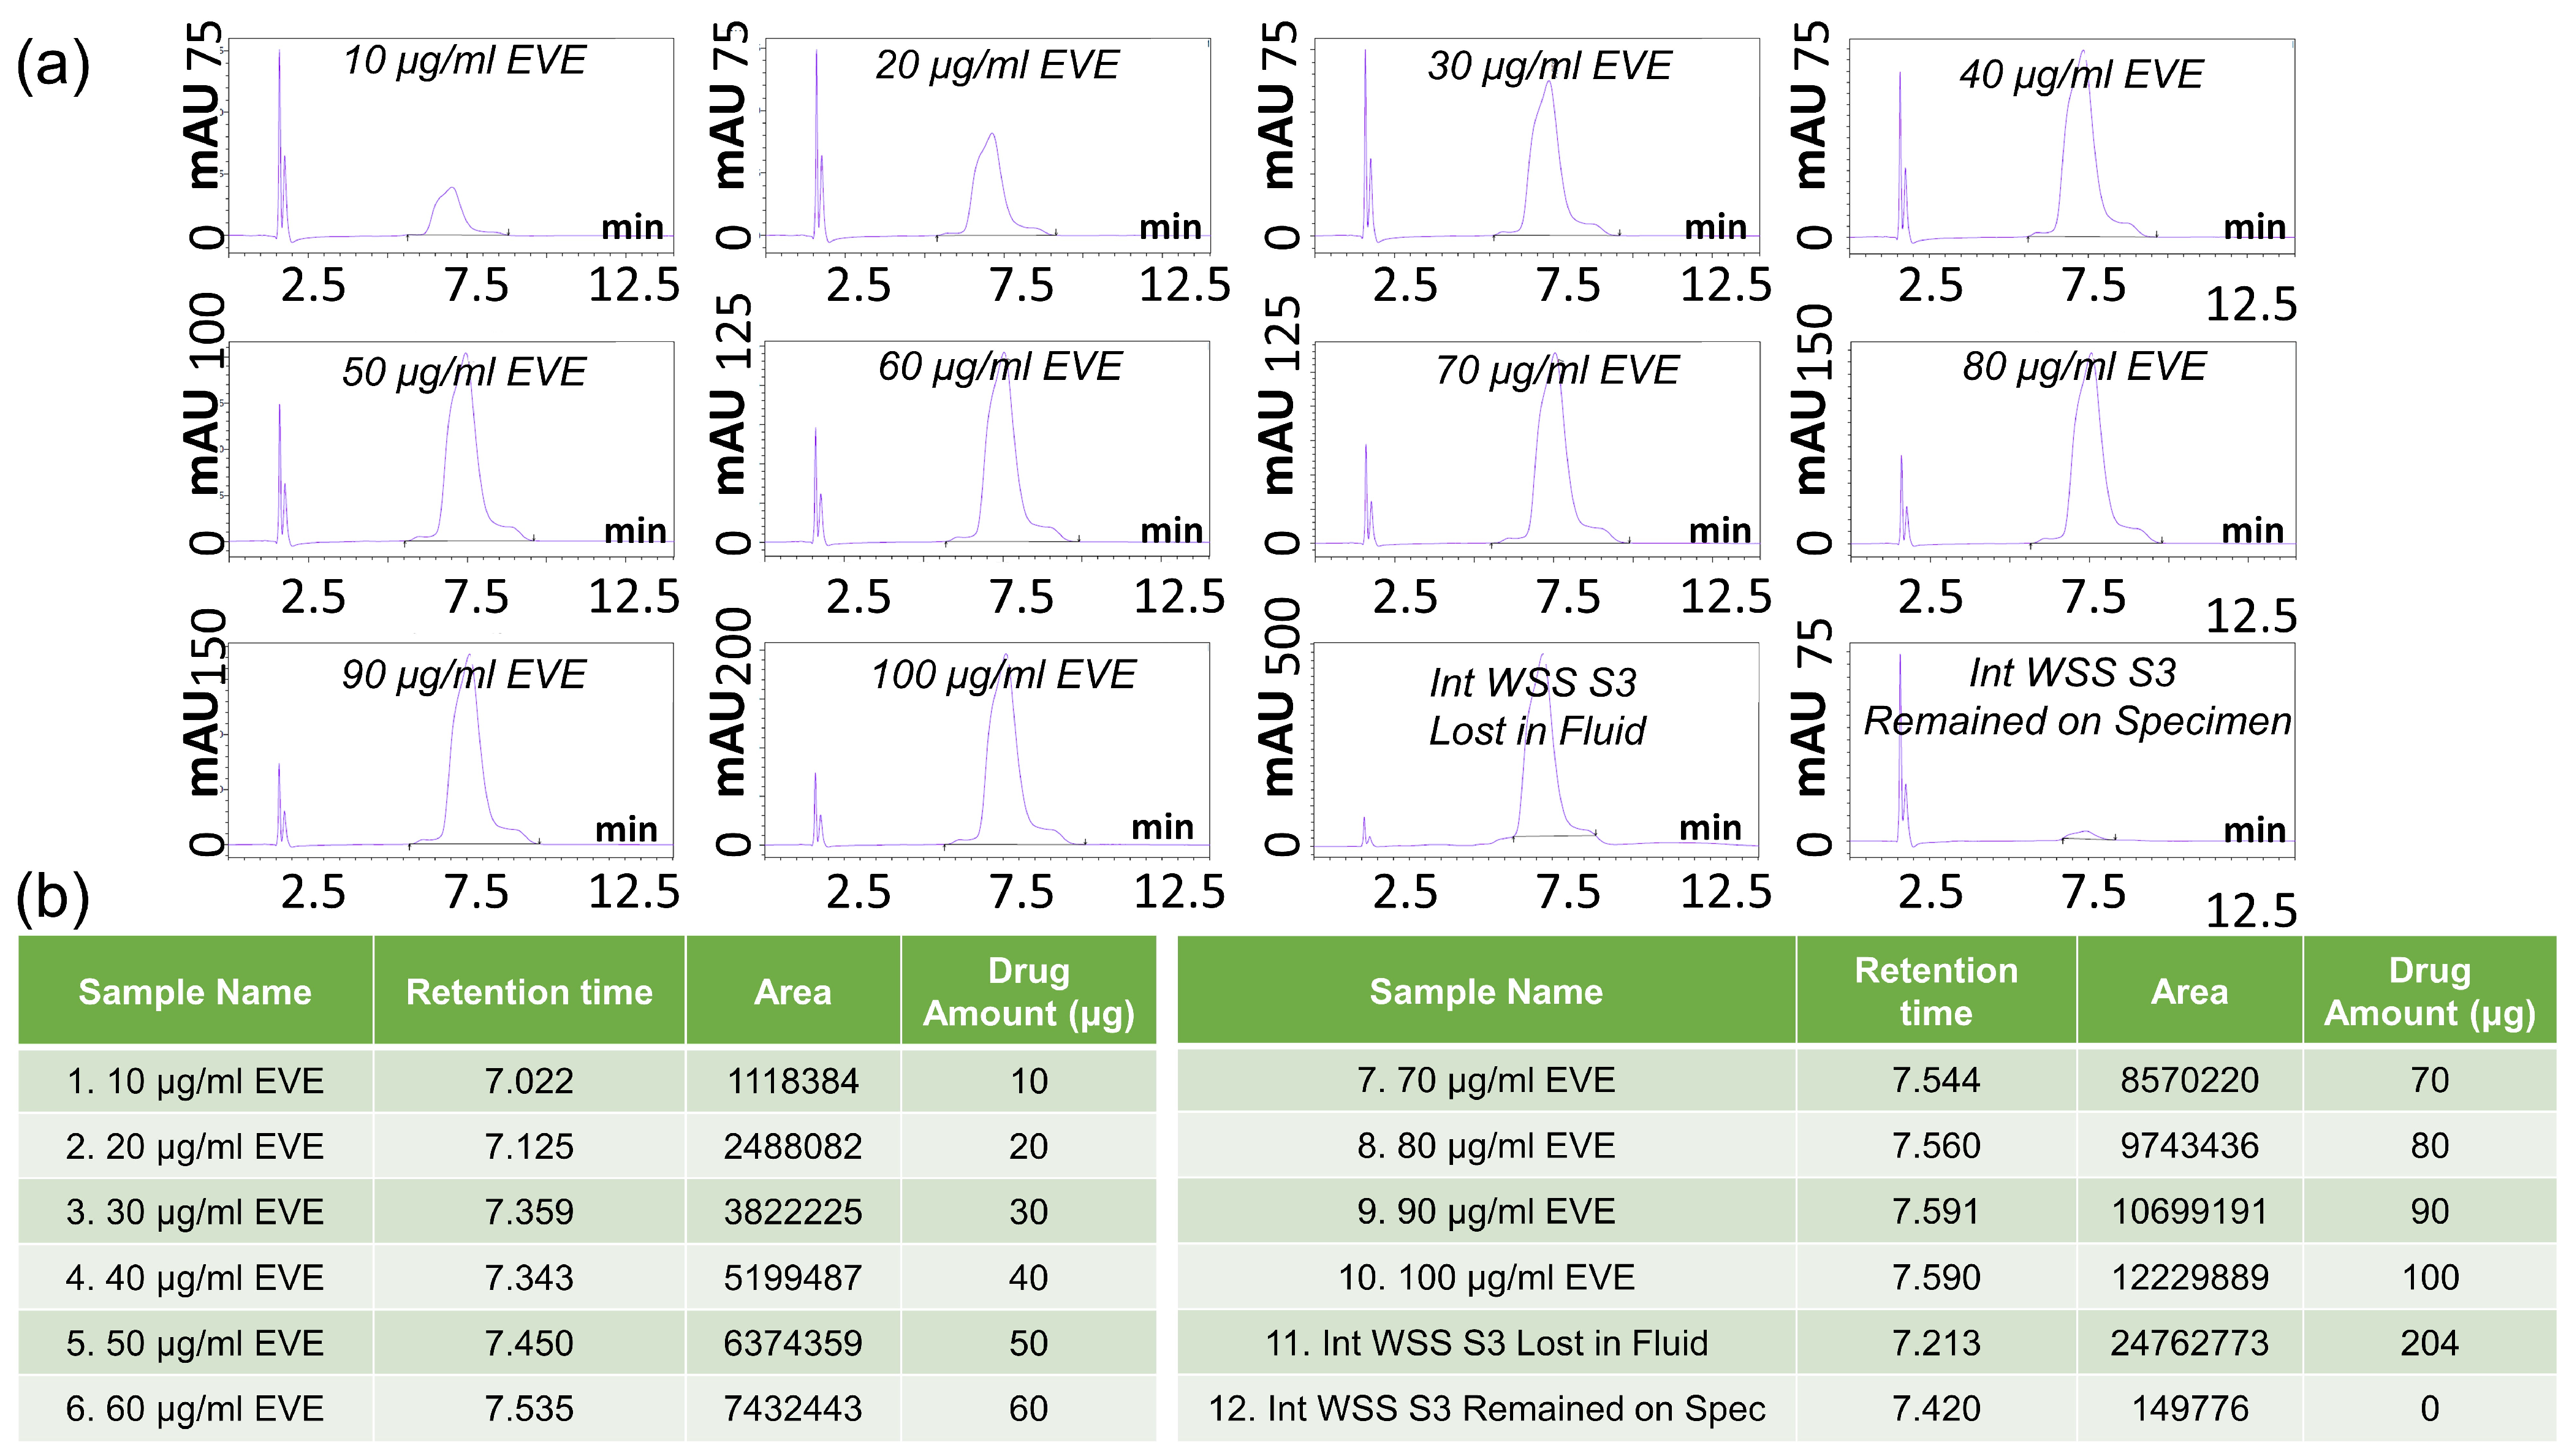
2.3.3. HPLC-UV Measurements and Data Processing

Chromatographic analysis was performed using an HPLC-UV system as previously reported [17]. The system was equipped with a Kinetex™ 2.6 μm Phenyl-Hexyl reverse-phase column (2.1 × 50 mm, Phenomenex, Aschaffenburg, Germany) maintained at 25 °C. An isocratic elution method was employed for all analyses, with a constant mobile phase composition. The mobile phase consisted of two components: 20% mobile phase A (a mixture of 20 mmol/L ammonium formate in water + 0.1% formic acid) and 80% methanol as mobile phase B. The flow rate was set at 0.4 mL/min, and the target compound, EVE, was detected at a wavelength of 277 nm using UV detection. For each analysis, a 10 μL aliquot of the testing sample was injected into the HPLC system, and the run time was 15 min per sample.
The HPLC method was applied to the two types of samples collected after the experiments. The first sample was given by the drug remaining in the flat specimen, which was removed from the flow chamber after the experiment. The remaining drug was dissolved in 2 mL of ethanol for 4 h. From this solution, a 1 mL aliquot was sampled for HPLC analysis. The second sample was given by the drug released in the fluid during the experiment. The fluid was collected in the balloon placed at the outlet of the setup and was immediately freeze-dried and lyophilized to remove the solvent. The resulting residue was dissolved in 1 mL of ethanol for 4 h, and this solution was analyzed by HPLC. To quantify drug content within experimental samples, a calibration curve was established using known concentrations of EVE ranging from 10 to 100 µg/mL dissolved in ethanol. The resulting HPLC peak areas of the chromatograms were plotted to construct this calibration curve. Experimental sample concentrations were determined by interpolating their respective peak areas.
Based on these measurements, the absolute values (μg) of both drug amounts that remained in the coating and those lost in the fluid were evaluated as well as the original drug content of each sample (sum of the two previous quantities) and the percentage drug loss due to washing off. The choice of considering the percentage value is for the sake of comparison among samples characterized by intrinsic variability.

3. Results and Discussion

3.1. Part A—System Design

3.1.1. The 3D CFD Simulation of the Balloon Tracking

The computational time for both the 3D CFD simulations was around 3 days (15 h for each simulated cardiac cycle). Figure 5 collects the results in terms of WSS extracted from the 3D CFD simulations on the DCBs in different configurations. The WSS contour plots of both the DCB models were extracted during the peak systolic phase of the cardiac cycle, namely when the arterial velocity reaches its maximum. It is possible to notice very different values of WSS according to the considered DCB area, influenced by the irregular geometry of the folds.
It was decided to consider the results extracted from the outer folds area, namely the external surface of the DCB that is expected to be fully drug-coated and to be directly affected by the blood flow and, therefore, more susceptible to drug loss. Indeed, the inner surface area between consecutive folds (please refer to Figure 3c) experiences significantly lower WSS (of about one order of magnitude less) due to high resistance to blood flow penetration caused by the geometry itself; moreover, this area together with the curvature area (Figure 3c) may have less coating due to the coating technique used, and hence was discarded from subsequent analyses.
The spatial average WSS on the outer folds was computed both in the case of the DCB aligned and inclined to the vessel centerline, reporting values at peak systolic flow up to 11 Pa and 13.4 Pa, respectively (Figure 5, right side, point “3”). Focusing on the aligned DCB configuration, WSS values at this timeframe ranged from 2 to 16 Pa, with almost 65% of the area exhibiting values between 10 and 12 Pa. During mean systolic flow (Figure 5a, right side, point “2”), WSS ranged from 2 to 7 Pa, with 75% of the area experiencing values between 5 and 6 Pa. At the selected mid-diastolic time point (Figure 5a, right side, point “1”), WSS values were between 0.7 and 1.1 Pa, with 67% of the area experiencing a value between 0.8 and 0.9 Pa. Considering the inclined DCB model, similar results can be deduced, however, showing more sparse distributions around similar average values (Figure 5b), which is a situation motivated by the configuration itself.
According to the aforementioned results, three different values of WSS could be identified. These were used as targets to assess the proper flow rates to prescribe as inlet boundary conditions to the chamber: (i) 13.4 Pa, labeled as high WSS and similar to the peak value at the systole; (ii) 6.7 Pa, which is half of the previous value and is representative of the mean systolic condition; and (iii) 1.7 Pa, which is one-fourth of the previous value and on the same order of magnitude of WSS experienced during diastole. It is worth considering that the peak of the systolic phase corresponds to the highest WSS up to 26 Pa, potentially causing significant coating deterioration and subsequent drug loss. On the other hand, this condition of high velocity is maintained for a very small fraction of the total time of a cycle, and hence, it is not suitable to be investigated in a steady-state experiment.

3.1.2. Analytical Equations Results

Table 1 collects the results of the analytical approach, which allowed us to calculate the flow rates to meet the target WSS defined in the previous section. For each case, the associated Reynolds number (Re) and entrance length (Le) were calculated according to Equations (2) and (3). As already mentioned, Re is crucial: it affects the testing area as Re > 2700 results in a non-laminar flow and an increase in the entrance length, preventing WSS homogeneity on the specimen. From the table, the low and intermediate WSS conditions could be addressed for both channel heights by using water, while for the high WSS values, we found a working point not feasible with water due to the high Reynolds numbers.
Even when the Reynolds number is that of a laminar flow (Re < 2700), as in the 0.8 height channel and intermediate WSS scenario, attention should be paid to the high values of Le affecting the WSS homogeneity in the testing area of the coated specimen.

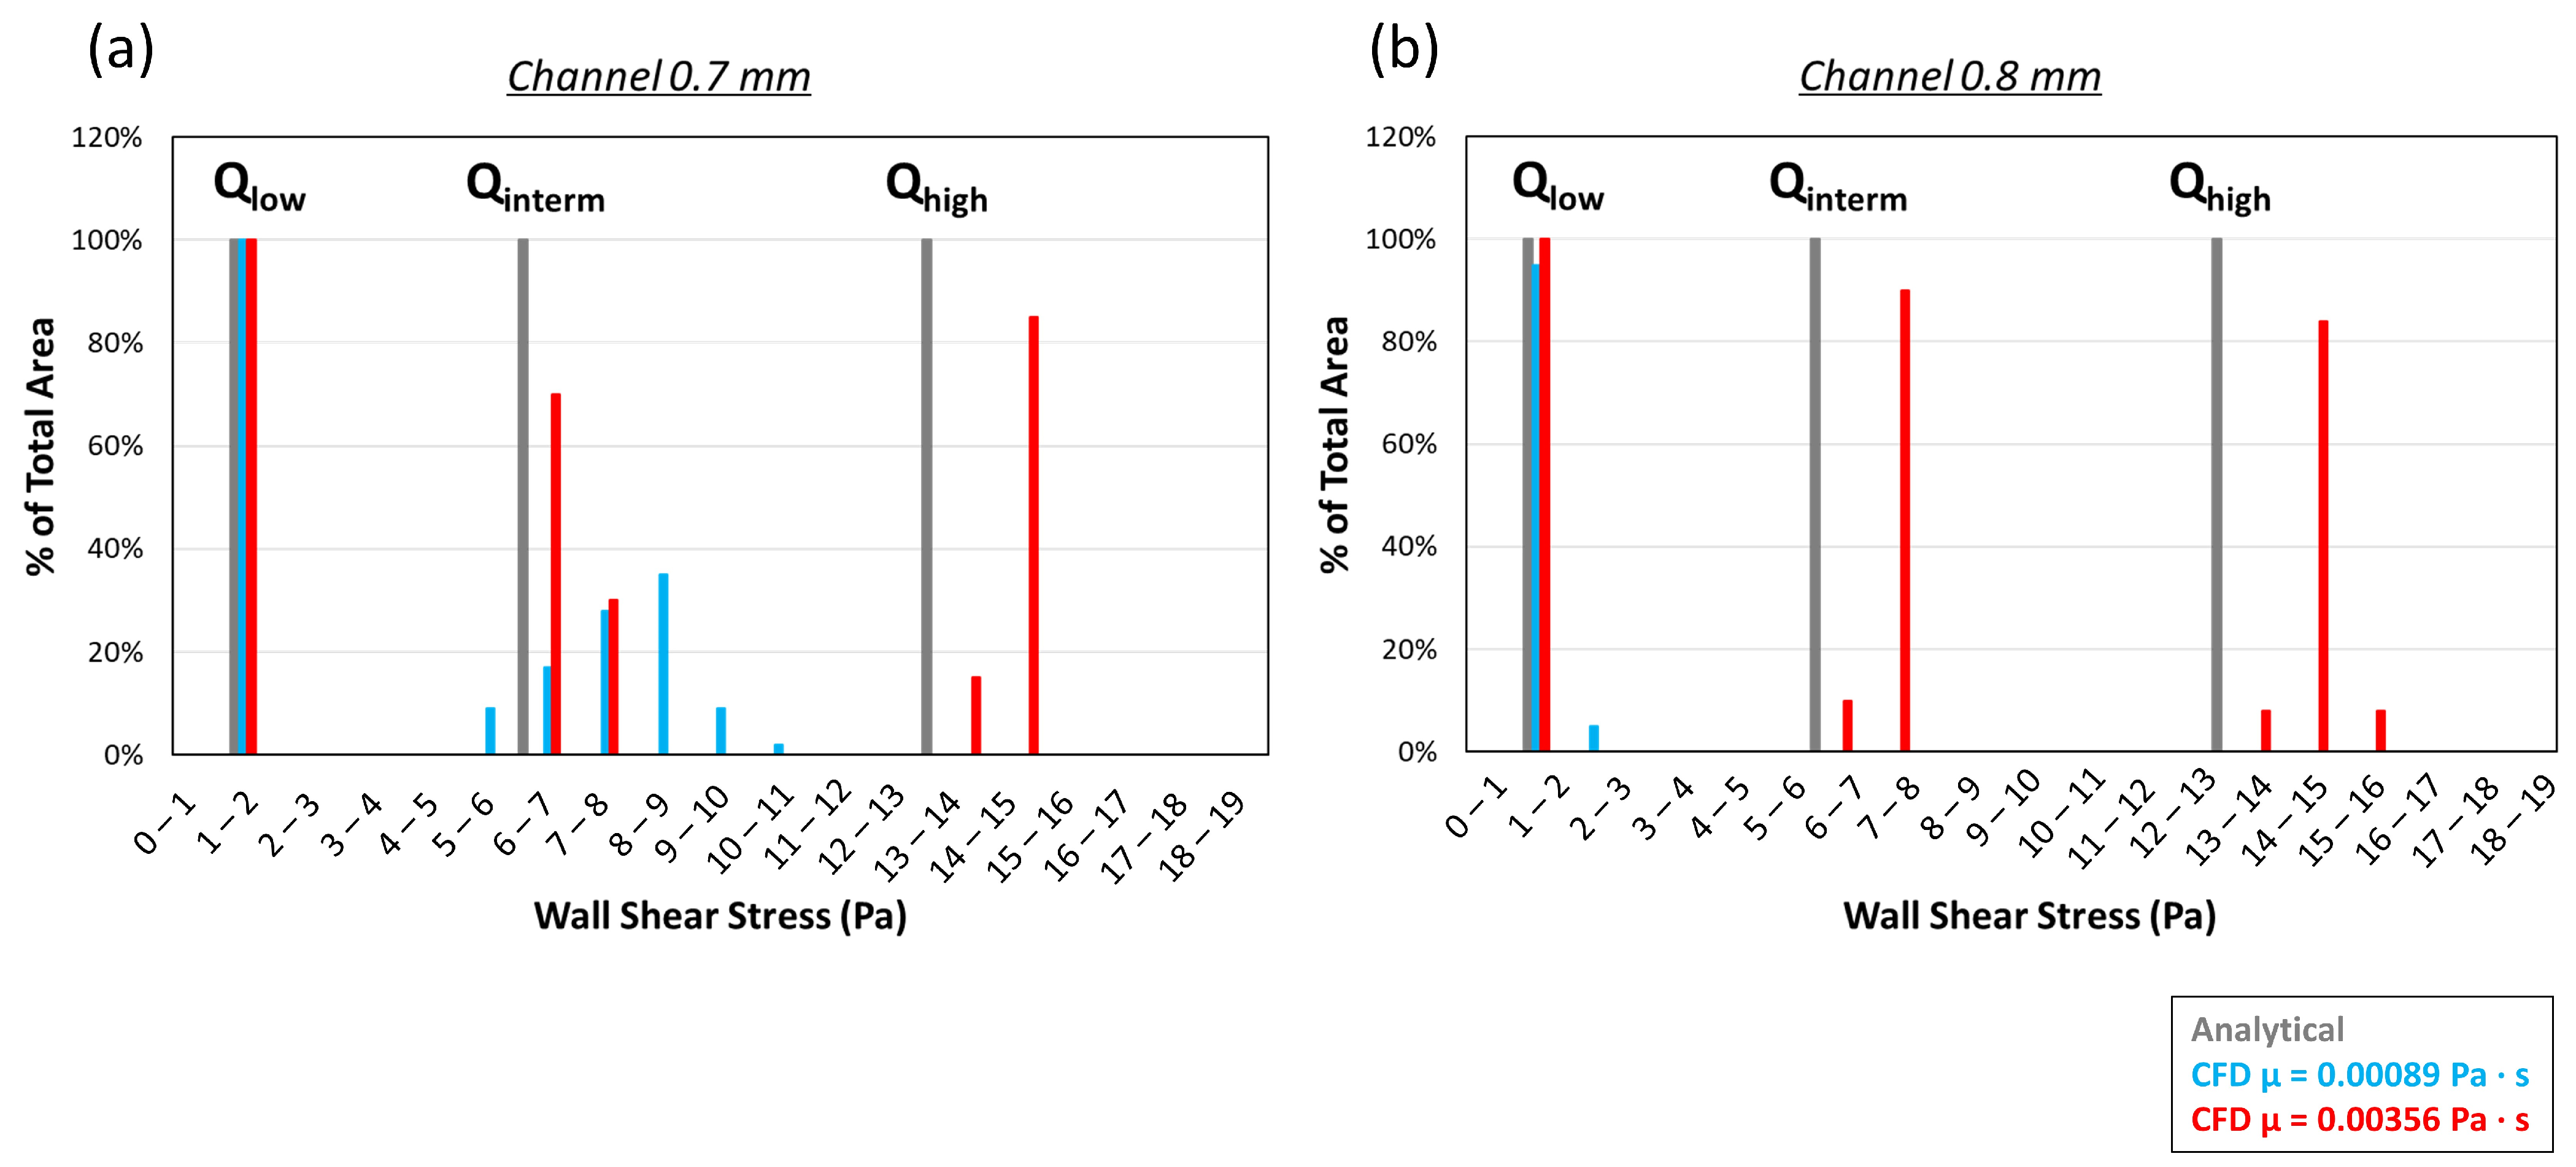
3.1.3. CFD Chamber Verification

Following the indications provided by the analytical approach (Table 1), CFD simulations considering both the 0.7 and 0.8 mm channel heights were performed, excluding those cases with high Reynolds numbers (namely, higher than 2000) and incompatible Le (higher than 40).
The analytical CFD modeling approach allowed identification of the exact WSS values and their distribution in the testing area. Figure 6 shows the contour plots of the WSS on the channel’s surface (in the case of 0.7 mm height) where the specimen is placed when different fluids and flow rates (Q) are considered. By generating the same WSS, both in the case of 1.7 Pa and 6.7 Pa, the use of different fluids highlighted the role of the viscosity in influencing the homogeneity distributions and end effects (the higher the viscosity, the more homogeneous the distribution and the lower the end effects).
Figure 7 shows the WSS values experienced by the testing area under different flow rates (Q) and considering different fluid viscosities (μ) according to both analytical and CFD models. In the case of high viscosity, the WSS ranges were narrow and close to the analytical values; in contrast, higher dispersion, which is, however, compatible with the in vivo condition, was found in the case of lower viscosity and intermediate flow rate (in agreement with the results shown in Figure 6). Considering low flow rates, the analytical and CFD results matched, especially in the case of higher viscosity.

3.2. Part B—Proof of Concept

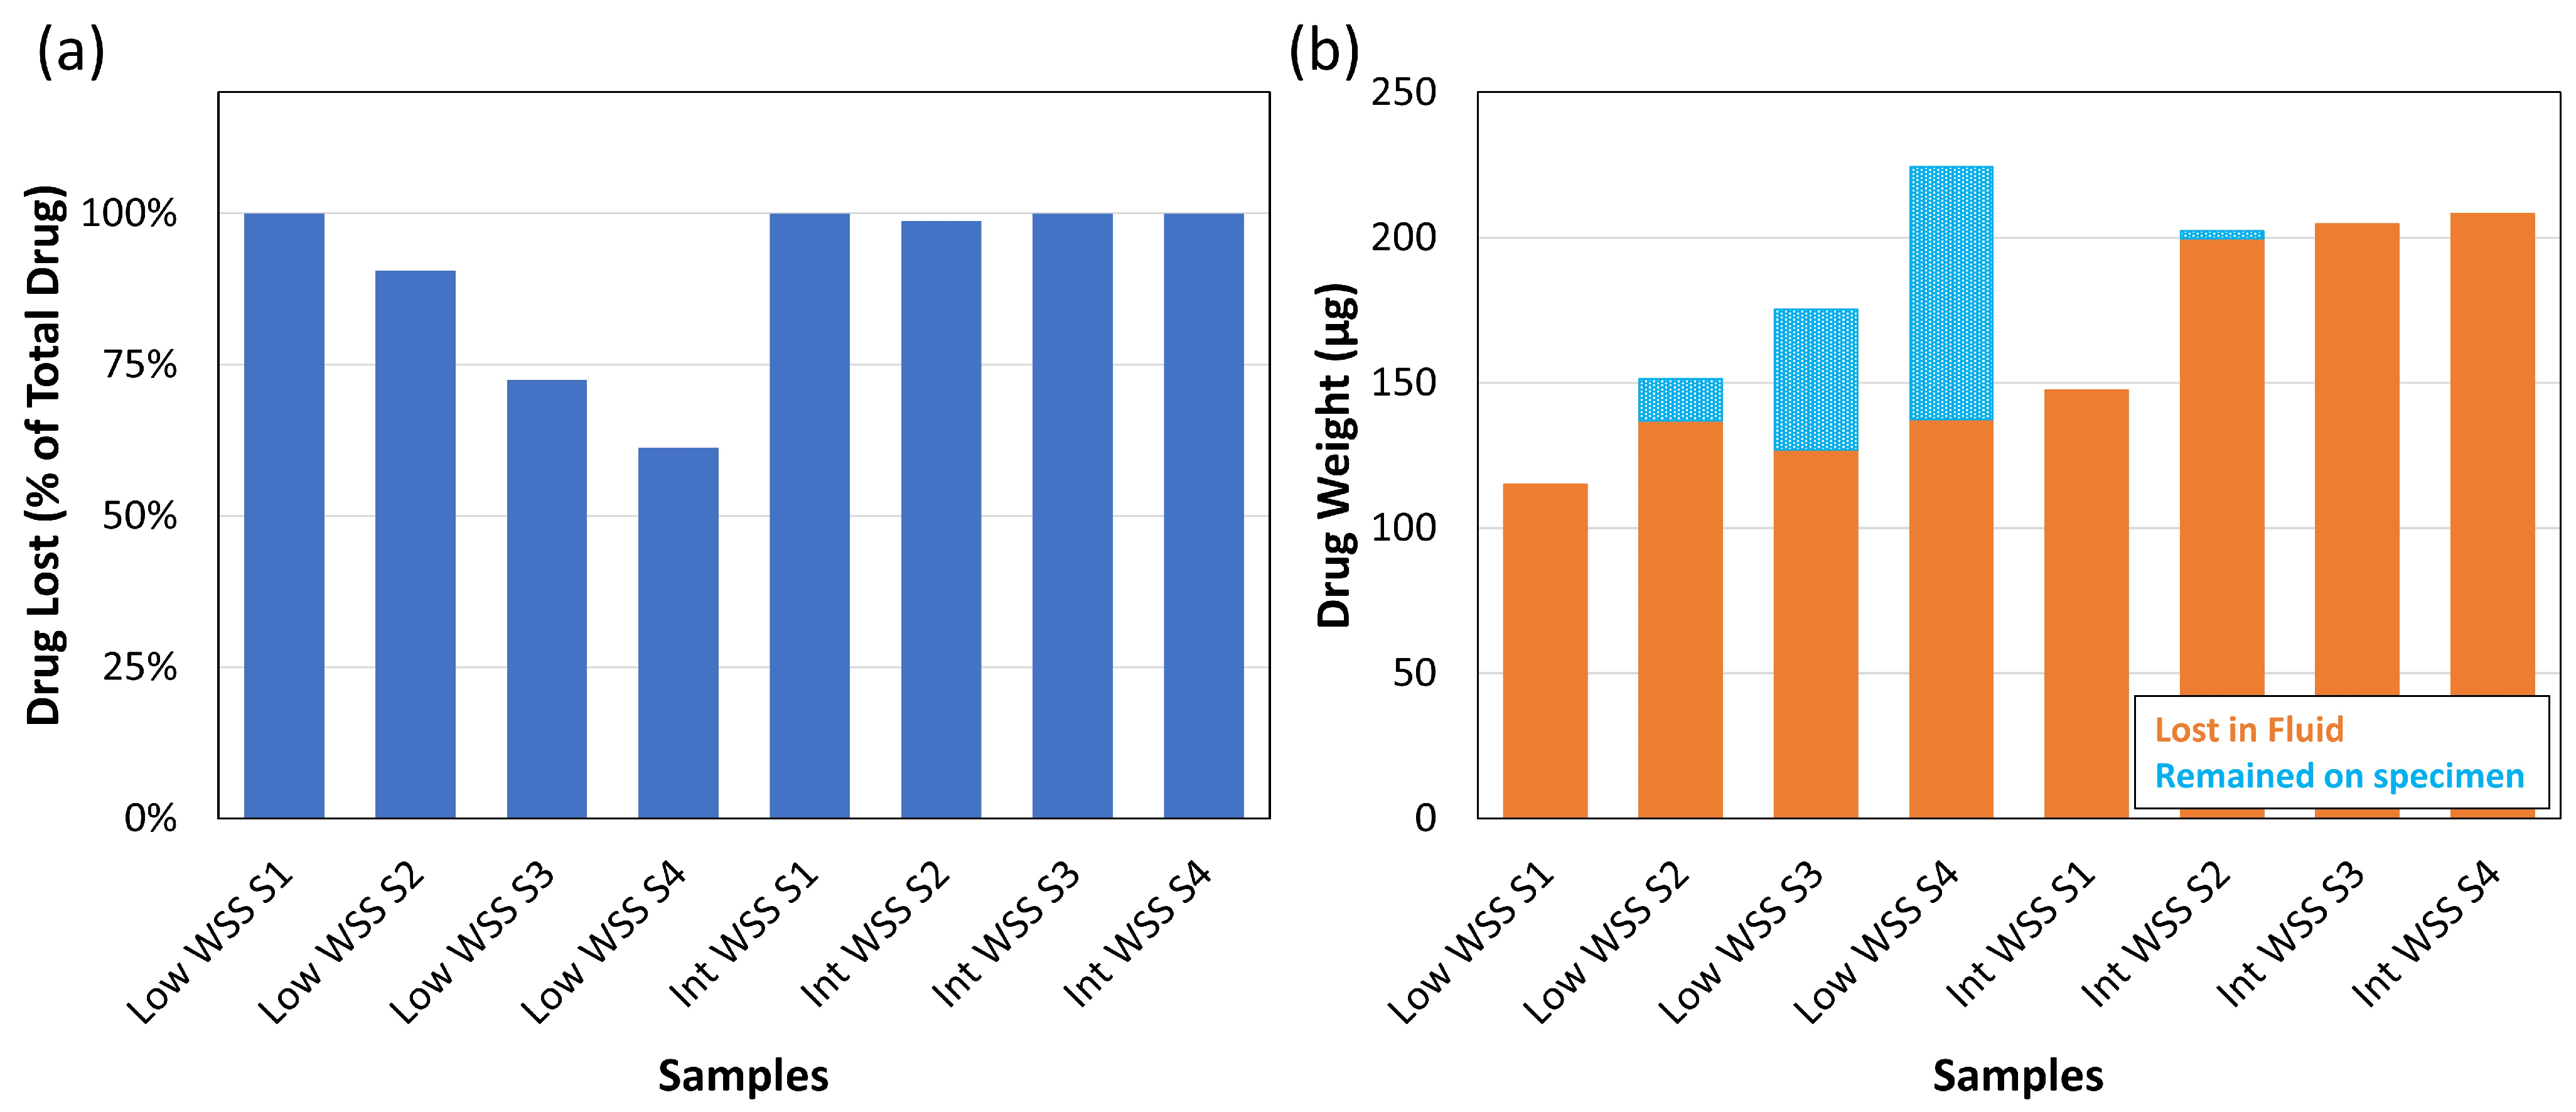
Experiments and HPLC Analysis

From the previous considerations (Section 3.1.2), experiments were conducted by imposing two different flow rates (Q1 = 46.1 mL/min and Q2 = 184.4 mL/min, as in Table 1) corresponding to low and intermediate WSS values acting on the specimens.
As for the HPLC analysis, the retention times observed for both calibration standards and experimental specimens ranged consistently between 7.05 and 7.56 min. Representative chromatograms of the calibration standards (10–100 µg/mL) and a typical experimental specimen as well as the corresponding data of retention times, peak areas, and quantified drug amounts (µg) for each analyzed sample are shown in Figure 8.
Figure 9a collects for each specimen the percentage of drug lost in the fluid, calculated with respect to the overall initial drug present on the specimen, as specified in Section 2.3.3. The application of the low WSS condition led to the washing off of a significant amount of drug in all the specimens, which can be assessed to be around 80% on average. Consistently with this, the other WSS condition (associated with an intermediate value of fluid flow) led to the complete drug washing off in all conditions. From a preliminary investigation (not reported here), we could assess a drug loss of about 15% in weight due to steady immersion in water at room temperature. Hence, although there is inter-specimen variability, we can conclude that the most significant amount of drug lost in the flow is related to the effect of the WSS.
The ideal drug-coating balloon has a coating that is persistent enough to guarantee no drug loss during navigation (when the DCB is subjected to WSS due to blood flow), but total coating transfer once arrived and expanded at the target lesion (due to contact pressure with the artery wall). The results of this study show that, in the case of this specific coating, the WSS experienced by the device during tracking might hinder an effective coating transfer on-site, because it is partially or totally lost in the flow. Even if the percentage values of washing off might differ among different formulations, it is crucial to take into account such a phenomenon when developing a new coating, even if it is not easy to balance the aforementioned design requirements. Figure 9b describes the results of the HPLC analysis in terms of total drug content for each specimen, incorporating the amount of drug lost in the fluid and the amount that remained on the specimen after the experiments. Considering the low-WSS tested specimens, the HPLC analysis of the drug weight lost in the fluid showed an almost constant value. The measure of the remaining amount was instead characterized by sensible variability: this probably could be caused by differences in the total amount of drug initially deposited on the specimen, hence the coating thickness. Indeed, the micro-pipetting method used for preparing this specific coating was proved repeatable within a thickness variability range of 20 μm, which is consistent for our research purposes but obviously must require revision for scaling up toward industrialization.

4. Conclusions

Ongoing innovation in the field of drug-eluting devices contributes to better patient care, reduced healthcare costs, and an overall improvement in the quality of patient life [30]. Assessing drug loss from DCBs during tracking is crucial for understanding both the device’s condition before reaching the target lesion and the potential drug loss into the circulation. The benefits are that it will give insight into the amount of drug available for transfer to the vessel and the potential for systemic toxicity. The novel in vitro setup presented in this study was designed to replicate the in vivo conditions that affect the device due to blood flow during DCB tracking. The major findings can be summarized as follows:
  • This setup, by testing coated flat patches resembling DCBs, is the first to isolate the effects of blood flow on drug loss, distinguishing it from the losses that arise due to device–vessel interactions;
  • The millifluidic approach allowed performing multiple tests on small specimens, hence reducing the amounts of reagents needed;
  • The system is highly versatile in replicating different in vivo environments that must be required by several configurations of balloons, arteries, and DCBs by simply adjusting parameters such as flow rate or fluid properties;
  • This open-loop system allows for the collection of fluid at multiple time points, providing insights into how the coating deteriorates over time. The use of HPLC analysis allowed direct measurements of the eluted drug, increasing the reliability of the pipeline.
In conclusion, this in vitro setup and the associated methodologies represent significant advancements in the ability to assess DCB drug loss under conditions that closely mimic the in vivo environment. These innovations enhance our understanding of drug-delivery dynamics and provide critical insights for optimizing DCB design and clinical outcomes. Moreover, since the current standard regulation on the topic is limited, the further development of this work as part of the European Union’s Horizon 2020 research and innovation program, the MSCA “DECODE” project, might contribute to the progress of a dedicated one.

Author Contributions

Conceptualization, G.P.; methodology, D.Z., E.B., F.B. and G.P.; software, D.Z. and E.B.; formal analysis, D.Z., E.B., F.B. and M.A.-H.-K.; investigation, D.Z., E.B. and F.B.; resources, T.S. and G.P.; data curation, D.Z., E.B., F.B. and G.P.; writing—original draft preparation, D.Z., E.B., F.B., M.A.-H.-K., T.S. and G.P.; writing—review and editing, D.Z., E.B., F.B., M.A.-H.-K., T.S. and G.P.; visualization, E.B., F.B. and G.P.; supervision, E.B., F.B., T.S. and G.P.; project administration, G.P.; funding acquisition, T.S. and G.P. All authors have read and agreed to the published version of the manuscript.

Funding

The project leading to this application has received funding from the European Union’s Horizon 2020 research and innovation program under the Marie Skłodowska-Curie DECODE (drug-coated balloon simulation and optimization system for the improved treatment of peripheral artery disease) Grant Agreement No 956470. This article reflects only the authors’ views, and the Commission is not responsible for any use that may be made of the information it contains. F.B. was funded by the National Plan for NRRP Complementary Investments (PNC, established with the decree-law 6 May 2021, n. 59, converted by law n. 101 of 2021) in the call for the funding of research initiatives for technologies and innovative trajectories in the health and care sectors (Directorial Decree n. 931 of 06-06-2022)—project n. PNC0000003—AdvaNced Technologies for Human-centrEd Medicine (project acronym: ANTHEM). This work reflects only the authors’ views and opinions; neither the Ministry for University and Research nor the European Commission can be considered responsible for them.

Data Availability Statement

Data will be provided upon request to the corresponding author.

Acknowledgments

The authors would like to thank Ivan Dell’Acqua and Martina Clerici for their help in the preliminary investigations for this work, and Anna Pia Bonuomo for the technical support.

Conflicts of Interest

The authors declare no conflicts of interest.

References

  1. Klimchak, A.C.; Patel, M.Y.; Iorga, Ş.R.; Kulkarni, N.; Wong, N.D. Lipid treatment and goal attainment characteristics among persons with atherosclerotic cardiovascular disease in the United States. Am. J. Prev. Cardiol. 2020, 1, 100010. [Google Scholar] [CrossRef] [PubMed]
  2. Fowkes, F.G.R.; Rudan, D.; Rudan, I.; Aboyans, V.; Denenberg, J.O.; McDermott, M.M.; Norman, P.E.; Sampson, U.K.A.; Williams, L.J.; Mensah, G.A.; et al. Comparison of global estimates of prevalence and risk factors for peripheral artery disease in 2000 and 2010: A systematic review and analysis. Lancet 2013, 382, 1329–1340. [Google Scholar]
  3. Laird, J.R.; Loja, M.N. Drug-eluting stents in the superficial femoral artery: Seeing is believing. EuroIntervention 2016, 12, 1443–1445. [Google Scholar] [CrossRef]
  4. Giacoppo, D.; Cassese, S.; Harada, Y.; Colleran, R.; Michel, J.; Fusaro, M.; Kastrati, A.; Byrne, R.A. Drug-Coated Balloon Versus Plain Balloon Angioplasty for the Treatment of Femoropopliteal Artery Disease. JACC Cardiovasc. Interv. 2016, 9, 1731–1742. [Google Scholar]
  5. Shishehbor, M.H.; Scheinert, D.; Jain, A.; Brodmann, M.; Tepe, G.; Ando, K.; Krishnan, P.; Iida, O.; Laird, J.R.; Schneider, P.A.; et al. Comparison of Drug-Coated Balloons vs Bare-Metal Stents in Patients With Femoropopliteal Arterial Disease. J. Am. Coll. Cardiol. 2023, 81, 237–249. [Google Scholar] [CrossRef] [PubMed]
  6. Xiong, G.M.; Ang, H.; Lin, J.; Lui, Y.S.; Phua, J.L.; Chan, J.N.; Venkatraman, S.; Foin, N.; Huang, Y. Materials technology in drug eluting balloons: Current and future perspectives. J. Control. Release 2016, 239, 92–106. [Google Scholar] [CrossRef]
  7. Bukka, M.; Rednam, P.J.; Sinha, M. Drug-eluting balloon: Design, technology and clinical aspects. Biomed. Mater. 2018, 13, 032001. [Google Scholar] [CrossRef]
  8. Heinrich, A.; Engler, M.S.; Güttler, F.V.; Matthäus, C.; Popp, J.; Teichgräber, U.K.M. Systematic evaluation of particle loss during handling in the percutaneous transluminal angioplasty for eight different drug-coated balloons. Sci. Rep. 2020, 10, 17220. [Google Scholar] [CrossRef]
  9. Katsanos, K.; Spiliopoulos, S.; Kitrou, P.; Krokidis, M.; Karnabatidis, D. Risk of death following application of paclitaxel-coated balloons and stents in the femoropopliteal artery of the leg: A systematic review and meta-analysis of randomized controlled trials. J. Am. Hear. Assoc. 2018, 7, e011245. [Google Scholar] [CrossRef]
  10. Bandomir, J.; Kaule, S.; Schmitz, K.P.; Sternberg, K.; Petersen, S.; Kragl, U. Usage of different vessel models in a flow-through cell: In vitro study of a novel coated balloon catheter. RSC Adv. 2015, 5, 11604–11610. [Google Scholar] [CrossRef]
  11. Kaule, S.; Minrath, I.; Stein, F.; Kragl, U.; Schmidt, W.; Schmitz, K.P.; Sternberg, K.; Petersen, S. Correlating coating characteristics with the performance of drug-coated balloons—A comparative in vitro investigation of own established hydrogel- and ionic liquid-based coating matrices. PLoS ONE 2015, 10, e0116080. [Google Scholar]
  12. Speck, U.; Häckel, A.; Schellenberger, E.; Kamann, S.; Löchel, M.; Clever, Y.P.; Peters, D.; Scheller, B.; Trog, S.; Bettink, S. Drug Distribution and Basic Pharmacology of Paclitaxel/Resveratrol-Coated Balloon Catheters. Cardiovasc. Interv. Radiol. 2018, 41, 1599–1610. [Google Scholar]
  13. Bienek, S.; Kusmierczuk, M.; Mittag, A.; Bettink, S.; Scheller, B. Novel, vessel anatomy adjusting drug-coated balloon—Preclinical evaluation in peripheral porcine arteries. Catheter. Cardiovasc. Interv. 2020, 95, 319–328. [Google Scholar] [CrossRef]
  14. Bettink, S.; Löchel, M.; Peters, D.; Haider, W.; Speck, U.; Scheller, B. Efficacy and safety of a magnesium stearate paclitaxel coated balloon catheter in the porcine coronary model. Int. J. Cardiol. 2021, 331, 46–56. [Google Scholar] [CrossRef]
  15. ASTM F3320-18; Standard Guide for Coating Characterization of Drug Coated Balloons. ASTM International: West Conshohocken, PA, USA, 2018. [CrossRef]
  16. Stratakos, E.; Tscheuschner, L.; Vincenzi, L.; Pedrinazzi, E.; Sigala, F.; D’Andrea, L.; Gastaldi, D.; Berti, F.; Tzafriri, A.R.; Pennati, G. A Novel In Silico–Ex Vivo Model for Correlating Coating Transfer to Tissue with Local Drug-Coated Balloon-Vessel Contact Pressures. Ann. Biomed. Eng. 2024, 53, 740–757. [Google Scholar] [CrossRef] [PubMed]
  17. Akrami-Hasan-Kohal, M.; Chouchou, A.; Blanquer, S.; Sharkawi, T. Everolimus-encapsulation in Pluronic P123 self-assembled micelles as drug delivery systems for drug-coated balloons. Int. J. Pharm. X 2024, 7, 100230. [Google Scholar] [CrossRef]
  18. Zheng, Q.; Chu, Z.; Li, X.; Kang, H.; Yang, X.; Fan, Y. The Effect of Fluid Shear Stress on the In Vitro Release Kinetics of Sirolimus from PLGA Films. Polymers 2017, 9, 618. [Google Scholar] [CrossRef] [PubMed]
  19. Campos, O.A.; Garcia-Herreros, A.; Sánchez, A.L.; Fineman, J.R.; Pawlak, G. A Multichamber Pulsating-Flow Device with Optimized Spatial Shear Stress and Pressure for Endothelial Cell Testing. J. Biomech. Eng. 2024, 147, 011006. [Google Scholar] [CrossRef]
  20. Nile, M.; Folwaczny, M.; Kessler, A.; Wichelhaus, A.; Rankovic, M.J.; Baumert, U. Development of a Custom Fluid Flow Chamber for Investigating the Effects of Shear Stress on Periodontal Ligament Cells. Cells 2024, 13, 1751. [Google Scholar] [CrossRef]
  21. Molteni, R.; Bianchi, E.; Patete, P.; Fabbri, M.; Baroni, G.; Dubini, G.; Pardi, R. A novel device to concurrently assess leukocyte extravasation and interstitial migration within a defined 3D environment. Lab Chip 2015, 15, 195–207. [Google Scholar]
  22. Stratakos, E.; Antonini, L.; Poletti, G.; Berti, F.; Tzafriri, A.R.; Petrini, L.; Pennati, G. Investigating Balloon-Vessel Contact Pressure Patterns in Angioplasty: In Silico Insights for Drug-Coated Balloons. Ann. Biomed. Eng. 2023, 51, 2908–2922. [Google Scholar]
  23. Shchetynska-Marinova, T.; Gerdes, L.; Hohneck, A.L.; Winter, L.; Amendt, K.; Schwenke, K.; Gerken, A.L.H.; Du, Y.; Dürschmied, D.; Sigl, M. First experiences of ultrasound vector flow imaging at the femoropopliteal artery in peripheral arterial disease. Vasa-Eur. J. Vasc. Med. 2023, 52, 394–401. [Google Scholar]
  24. Ninno, F.; Chiastra, C.; Colombo, M.; Dardik, A.; Strosberg, D.; Aboian, E.; Tsui, J.; Bartlett, M.; Balabani, S.; Díaz-Zuccarini, V. Modelling lower-limb peripheral arterial disease using clinically available datasets: Impact of inflow boundary conditions on hemodynamic indices for restenosis prediction. Comput. Methods Programs Biomed. 2024, 251, 108214. [Google Scholar]
  25. Bos, R.; Van Der Mei, H.C.; Busscher, H.J. Physico-chemistry of initial microbial adhesive interactions—Its mechanisms and methods for study. FEMS Microbiol. Rev. 1999, 23, 179–230. [Google Scholar] [CrossRef] [PubMed]
  26. Song, G.; Sun, R.; Zhang, D.; Su, G.H.; Tian, W.; Qiu, S. Experimental study on flow characteristics of rectangular narrow channel. Int. J. Adv. Nucl. React. Des. Technol. 2020, 2, 60–68. [Google Scholar] [CrossRef]
  27. Han, L.S. Hydrodynamic Entrance Lengths for Incompressible Laminar Flow in Rectangular Ducts. J. Appl. Mech. 1960, 27, 403–409. [Google Scholar] [CrossRef]
  28. Fröhlich, C.; Grabiger, S.; Schwefel, D.; Faelber, K.; Rosenbaum, E.; Mears, J.; Rocks, O.; Daumke, O. Structural insights into oligomerization and mitochondrial remodelling of dynamin 1-like protein. EMBO J. 2013, 32, 1280–1292. [Google Scholar]
  29. Detry, J.G.; Deroanne, C.; Sindic, M. Hydrodynamic systems for assessing surface fouling, soil adherence and cleaning in laboratory installations. Biotechnol. Agron. Soc. Environ. 2009, 13, 427–439. [Google Scholar]
  30. Alshimaysawee, S.; Fadhel Obaid, R.; Al-Gazally, M.E.; Alexis Ramírez-Coronel, A.; Bathaei, M.S. Recent Advancements in Metallic Drug-Eluting Implants. Pharmaceutics 2023, 15, 223. [Google Scholar] [CrossRef]
Figure 1. Schematics of the in vitro setup highlighting the most relevant parts and dimensions. Details created in BioRender Bianchi, E. (2025) https://BioRender.com/h44q935 (accessed on 18 March 2025).
Designs 09 00037 g001
Figure 2. Workflow of the study.
Designs 09 00037 g002
Figure 3. (a) The different configurations of the 3D CFD models, with highlighted the inlet and outlet boundary conditions; (b) details of the mesh refinement; (c) color scheme for the different area of the DCB folds.
Designs 09 00037 g003
Figure 4. Components of the in vitro setup: (a) Parts of the test chamber assembly; (b) Fluidic system; (c) Inset of the region addressed to alignment and sealing; (d) Inset of the fluidic chamber.
Designs 09 00037 g004
Figure 5. WSS field as a result of the 3D CFD analyses in the case of (a) idealized position of the DCB aligned with the tube centerline, and (b) inclined DCB, for which the upper (U) and lower (L) surfaces are reported. In both cases, the spatial average WSS was computed during the whole cardiac cycle. Characteristic time points (1: diastolic phase, 2: acceleration phase of systole, and 3: peak systolic phase) within the cycle were selected to estimate WSS values on the device’s outer surface, expressed as the percentage of the total surface area.
Designs 09 00037 g005
Figure 6. Contour plots of the WSS in the channel when different fluid viscosities (μ) and flow rates (Q) are considered. Dashed lines identify the testing area, corresponding to the portion of the chamber where the coating sample was inserted.
Designs 09 00037 g006
Figure 7. WSS values experienced by the chamber testing area under different flow rates (Q) and considering different fluid viscosities (μ) (reported in different colors) according to the analytical and CFD models using channel heights of (a) 0.7 mm and (b) 0.8 mm.
Designs 09 00037 g007
Figure 8. (a) HPLC-UV chromatograms of EVE; (b) Retention time, area, and drug amount of calibration standards from 10 to 100 µg/mL and representative experimental sample (Int WSS S3 lost in fluid and Int WSS S3 remaining on specimen).
Designs 09 00037 g008
Figure 9. Results of the HPLC analysis on the specimens in terms of (a) the percentage of drug lost in the fluid (compared with the initial drug content deposited on the specimen), and (b) the total drug content associated with each specimen, with repartition of the amount that was lost in fluid or remained on the specimen after testing.
Designs 09 00037 g009
Table 1. Results in terms of possible flow rates (Q mL/min) to be applied as boundary conditions in the in vitro setup as a function of the channel height (h) and fluid viscosity (μ). For each case, the associated Reynolds number and entrance length Le (mm) are reported. * Flow condition discarded in further analyses due to incompatible Le. ** Flow condition discarded in further analyses due to high Re.
Low WSS
(1.7 Pa)
Int WSS
(6.7 Pa)
High WSS
(13.4 Pa)
h (mm)μ
(Pa·s)
QReLeQReLeQReLe
0.70.0008946.13039184.4121237368.9 **242474
0.0035611.519146.176292.21515
0.80.0008960.238913240.9 *155654481.8 **3111107
0.0035615.124160.2973120.41947
Disclaimer/Publisher’s Note: The statements, opinions and data contained in all publications are solely those of the individual author(s) and contributor(s) and not of MDPI and/or the editor(s). MDPI and/or the editor(s) disclaim responsibility for any injury to people or property resulting from any ideas, methods, instructions or products referred to in the content.

