Abstract
Sustainability-related information affects people’s choices and evaluation. The literature has made significant efforts to understand the best ways of delivering this kind of information to shape consumer behavior. However, while most studies have focused on packaged products and direct information provided through eco-labels, preferences could be formed differently in other design domains. The paper investigates the effect of the perceived amount of indirect information on the evaluation of an architectural artefact. A sample of 172 participants visited a locally produced mobile tiny house, made with a considerable amount of sustainable materials. The same participants answered a questionnaire about their perceived knowledge, quality, appropriateness and sustainability of the tiny house. The general level of knowledge of the tiny house was used as a proxy of the amount of indirect information received. Although the knowledge of the tiny house was generally low, ratings regarding the other dimensions were overall extremely positive. In particular, no evident relation was found between knowledge of the tiny house and sustainability, while the latter is significantly linked to quality aspects. These outcomes deviate from the evidence from other studies; this might be due to indirect vs. direct information and the peculiarity of the study carried out in the field of buildings. The gathered demographic and background data of the participants make it possible to highlight the role played by gender and age in affecting the evaluations, but the absence of a significant impact of experience in the field, education and origin. The results are compared with findings related to the evaluation of sustainable products and green buildings in particular.
1. Introduction
The success of sustainable products or solutions in the market is strongly affected by consumers’ behavioural attitudes and individual environmental sensitivity [1]. Design for sustainability supports the development of sustainability-related product features, so to favour these pro-environmental preferences and attitudes [2]. Therefore, a strong contribution is expected by designers and product developers, who can follow eco-design directions to guide people towards more sustainable choices. Otherwise said, the design process should be steered to meet the goal of ecologising product ideas without falling into mere greenwashing [3].
As a result, the foci of design for sustainability include the development of sustainable features at the product level that can arouse awareness at an individual or collective level. However, tailored design methods to affect those behaviours are not mature yet, as witnessed by the fact that the systematic integration of people’s behaviour into design processes for sustainable products has only recently been outlined [4].
Among the first attempts to affect consumer behaviour, priming [5,6] is an experimental design technique adaptable to a sustainability-related context. The use of visual primers could indeed facilitate positive outcomes from the consumers’ decision-making processes regarding the evaluation or choice of sustainable products over standard alternatives. MacDonald and She [7] proposed a model to enhance a proper consumer-driven approach and provide designers with sustainability-oriented recommendations to exploit the full potential of the use of sustainable information. A similar approach was adopted in [8], where Shades of Green were proposed to help designers, researchers and industries in structuring their sustainability communication.
It should also be highlighted that social awareness in terms of sustainability could be enhanced not only by priming and steering people’s preferences, but also by spreading knowledge about sustainability. According to [9], a proper diffusion of knowledge about sustainability issues could indeed affect consumers’ perception of their individual impact on the environment, possibly raising their willingness to make more informed and ecological choices. As a consequence, considering sustainability information in design processes is critical to the success of sustainable products on the market [10]. The impact of elicited sustainability information on consumers’ thoughts and choices has been widely studied by many design scholars. Shared conclusions can be summarised as follows.
First, clear sustainable information can positively affect people’s sustainable behaviours, e.g., buying a sustainable product [11,12]. Consumers tend to evaluate sustainable products more favourably if a sustainable solution or advertisement is clearly presented [13]. According to [14], consumers are more prone to contribute actively to sustainable development with such clear and informed sustainability knowledge. These conclusions are consistent with [15], which stated that transparent sustainable product features touch the social and moral responsibility of consumers, hence involving them in the greening of consumption.
Second, making sustainability-related product features apparent results in a more eco-conscious product evaluation [16]. The intentional omission of key sustainability information could result in an inaccurate communication of the environmental benefits of a product, leading to its failure on the market. Declared or implicit omission should only be adopted for customary product choices, which sustainable products do not usually range within, e.g., [17].
Third, the consideration of sustainability-related performance in the early stages of the design process commonly leads to a raised social and moral awareness about sustainability issues [18].
However, it is worth stressing that the provision of sustainability-related information is controlled in most studies, especially in the design field. This situation is not common in real-world scenarios, especially in some domains such as the building industry (see Section 2 for more details). Designers might face situations in which the evaluation of their developed products is affected by uncontrolled circumstances and exchanges of information, e.g., [19], including sustainability-related performance. The paper swivels on this core aspect and originally investigates the impact of the uncontrolled provision of knowledge on people’s evaluation, along with a number of factors that are more traditionally considered and manipulated. The experiment in the present study regards a prototype of a green building as a paradigm of a newly developed product benefitting from people’s evaluation. In the experiment, information about the prototype’s features was provided to participants in an uneven, uncontrolled and indirect way.
The specific objectives and research questions are presented in Section 2, following a literature review. The subsequent sections are as follows. After an overview of the methodology (Section 3), the results are shown in Section 4. While Section 5 includes discussions, the conclusions are drawn in Section 6.
2. Literature Review
2.1. Forms of Sustainable Information and Other Factors Affecting Preference and Choice of Products
As reported in the literature, sustainability information can be presented and communicated mainly in direct and indirect forms.
As regards direct forms, the sustainable features of a product can be made visible through visual cues, the use of which has been deeply investigated in the literature regarding their actual effectiveness and impact on consumers’ perception, e.g., [20]. A typical example of direct forms is represented by eco-labels, which represent an intuitive and easy-to-construct way of sharing knowledge visually. They constitute a functioning logic to indicate the enhanced environmental performance of sustainable products over their standardised versions. As a result, their contribution to sustainable development has been extensively addressed by researchers [21]. Studies on the impact of sustainability labelling on purchase intentions and the quality perception of products can be found in [22,23]. D’Souza and colleagues [24] developed a framework of cognitive perspectives of sustainable products to possibly increase the impact and effectiveness of unclear or difficult to understand eco-labels. Indeed, sustainability information should always be coupled with direct and empathic effects on consumers’ attitudes and choices. In this regard, an eye-tracking experiment was conducted in [25] to detect the amount of visual attention given by participants to different eco-labels. They showed that labels generated a perception of compliance with sustainable aspects in most participants. Therefore, it is imperative for eco-labels to connect with consumers’ individual environmental perception. An effective improvement of their use could focus on enhancing their visibility and their diffusion in consumers’ habitual purchasing habits [20].
Indirect or diffused forms of sharing knowledge could be adopted too—placing eco-labels on packaging cannot apply to all forms and categories of designs. In-depth studies about this typology of sustainability-related information sharing are fewer. An example is presented in [3], where participants were provided with a set of information about different typologies of the same product, which did not directly refer to their environmental impact. Therefore, the sustainability-related characteristics should have been inferred here. Another example is [26], which deals with the communication of sustainable information related to a university campus by managing sustainability communication based on a combination of marketing strategies and surveys’ submissions. Similarly, Saber and Weber [27] investigated the sustainability communication in supermarkets and retailers.
Beyond the presentation of information through design, it has already been highlighted in Section 1 that collective and individual factors play a role too.
As for collective and social factors, research has paid great attention to cultural aspects; cases in point are [28,29]. A more complex network of contextual and social factors affecting design evaluation is illustrated in [30].
In relation to individual aspects, a large amount of literature has focused on the background and demographic data of the evaluators, e.g., [31,32,33]. Liu and colleagues [34] show the psychological factors affecting the choice of green buildings. Great emphasis is given here to environmental attitude and general knowledge. In relation to personal knowledge and understanding, the effects on product evaluation are also studied in terms of familiarity [35], expectations [36,37], and, more broadly, values [38]. Here, it is to be highlighted that the concept of knowledge differs from mere information acquisition, e.g., [39]. In most of the studies illustrated above with regard to forms of sustainability-related communication, it is hard to infer if the provided information has been properly processed by individuals.
2.2. Perception and Evaluation in the Field of Constructions and the Built Environment
The previous subsection has shown that forms of information delivery might differ and that the effect of its elaboration is hard to study. Most research is conducted in simulated laboratory settings and the validity of results might be challenged in real-world scenarios. It can be also hypothesised that different design domains have typical ways of exposing potential consumers to products and offering information. In the present paper, particular attention is paid to the building industry. This domain lends itself to the development of designs where direct (sustainability-related) information is hardly included in the representation of the products, which is seldom considered according to the previous subsection.
Table 1 summarises how previous literature has dealt with the evaluation of buildings and the built environment (markedly urban spaces) where sustainable aspects were involved. The columns of Table 1 report the following aspects, respectively.
- The considered source.
- How participants have interacted with the designs so as to compare the case studies with real-world situations and to infer how they could shape their evaluation.
- The methods used to extract perception and evaluation data.
- The size of the sample and characteristics of participants.
- Additional critical information about the way the studies have been conducted and other relevant data, markedly about knowledge, collective and individual aspects.

Table 1.
Summary of extant literature contributions dealing with the evaluation of sustainable designs within buildings and the built environment.
Table 1.
Summary of extant literature contributions dealing with the evaluation of sustainable designs within buildings and the built environment.
| Source | Representation and Interaction Mode | Investigation Method | Participants’ Sample | Research Protocol and Relevant Data |
|---|---|---|---|---|
| [40] | Real user experience collected in traditional and modern buildings in Cameroon | Questionnaire | 1750 questionnaires were answered depending on the residents’ geographical area | - the participants were aware of the characteristics of the residential area - data about socio-demographic questions and residential experience was collected |
| [41] | Rendering and 3D models of a future neighborhood redevelopment project | Questionnaire | 269 respondents selected in a specific neighborhood | - the participants were not aware of the characteristics of the future buildings - data about socio-demographic questions and residential experience was collected - preferences evaluation was based on an 11-point rating scale |
| [42] | Rendering and picture of a post-industrial landscape renovation | Questionnaire | 450 residents randomly selected | - the participants were aware of the characteristics of the residential area - data about socio-demographic questions and residential experience was collected |
| [34] | Experiences with green buildings | Online survey | 342 residents (valid answers) | - the participants reported an experience a posteriori; no evaluation of a new design - data about background and some demographic factors were collected |
| [43] | Real-world experiments at the Department of Civil Engineering of the University of Aveiro, Portugal. | Questionnaire | 150 random users among students, researchers, professors, and administrative staff | - direct questionnaires were administered with enquiries about water consumption behaviour and preferences - the participants were not aware of the characteristics of sustainable water consumption behaviours - no socio-demographic or background questions were asked |
| [44] | User experience of life in a temporary house | Questionnaire and interviews | 32 families interviewed and 181 questionnaires collected | - the participants were aware of the characteristics of the buildings; - no socio-demographic or background analysis was performed - interview and questionnaire made to understand the importance of the space and the sustainability of the used material |
| [45] | Rendering and pictures of 32 scenario of built environment design | Questionnaire | 752 respondents divided into three different groups of target population that included building users/building owners, road users | - the participants were not aware of the characteristics of the buildings - socio-demographic and background information was collected |
| [46] | Two real buildings for demonstration scopes | Interviews | 61 participants with different degrees of experience | - the participants were aware of the characteristics of the buildings - 32 in-depth, semi-structured interviews with building professionals were conducted - 29 shorter interviews with building users were conducted |
| [47] | Pictures of six selected urban streets in the city of Seoul | Interviews | Six experts in public space, transportation, and behaviour | - the participants were not aware of the characteristics of the urban streets - no socio-demographic or background analysis was performed - sustainability, amenity, placeness and accessibility of the urban streets based on open questions were evaluated |
| [48] | Five scenarios (electricity production; vegetable; green roof implementation and rainwater harvesting) of future development of a residential area in Barcelona | Questionnaire | 60 respondents selected among residents, experts and public institutions | - the participants were not aware of the characteristics of the residential area - no socio-demographic or background questions were asked - respondents used a 5-point ranking of the scenario considering sustainability, environmental, economic and social indicators |
| [49] | Rendering and pictures of 160 wood constructions | Questionnaire | 159 respondents selected among wood construction users | - the participants were aware of the characteristics of the building - background and demographic questions were asked - open questions were added - sustainability and economic criteria were evaluated |
2.3. Literature Gap and Objectives
The collected literature shows that:
- Most of the designs were evaluated by experts or people with a significant awareness of the contextual factors related to buildings and urban spaces. The evaluation of ordinary people is rarely dealt with, while their views are critical when it comes to preferences, choices and purchases.
- In a few cases, real-world situations were studied; among them, very peculiar aspects were focused upon, see [43]. Conversely, the experience found with designs, especially if they present innovative features, is much more reliable if actual artefacts are involved [50]. In the case of green buildings or sustainable-oriented architectural interventions, it is assumed that new characteristics are included to fulfil the requirements of increased sustainability.
- The knowledge of the presented designs is dissimilar across participants of different studies but poorly considered as a factor affecting evaluation and acceptance in those contributions with participants having different degrees of awareness.
- A large number of studies consider demographic and background data, which have proven critical to evaluations.
In this context, an appropriate study for the evaluation of a green building should include:
- The use of a real building or realistic prototype even though this may be inconvenient because of the size of artefacts in the construction industry.
- The involvement of ordinary people.
- The consideration of people’s knowledge and its effect on evaluations and perception, where information is provided in an indirect way, which is more realistic in a real-case scenario.
- The consideration of people’s background and demographic data, along with their effect on evaluations and perception.
The present study is organised consistently with the above requirements, where the consideration of bullets 1 to 3 represents an original aspect, since they are not found contextually in the extant literature.
The objectives of the paper are to study the following:
- Ordinary people’s overall perception and evaluation of a real green building;
- To what extent the (perceived) knowledge of the properties of a sustainable building affects evaluation and perceived sustainability, which contribute to product desirability and choice as shown above;
- The effect of background and demographic data on perception and evaluation;
- The interplay between multiple evaluation criteria to get more insight into the evaluation phenomenon.
3. Methodology and Context of the Study
3.1. Research Design
The study was conducted within the project “Tiny FOP MOB—A Real World Laboratory made of wood and hemp travelling through the Vinschgau Valley”. The acronym FOP MOB (in German, FOrschungs- und Praxis-MOBil) recalls the main objective of this research project, namely, to design and develop a mobile Real-world Laboratory (RwL). The concept of the RwL has gained traction in the last decade and is breaking into the design domain too [51]. The building prototype (hereinafter Tiny FOP MOB) is therefore a mobile tiny house that was designed and constructed to represent a sustainable example in the building sector because of the materials used and their local origin (see below).
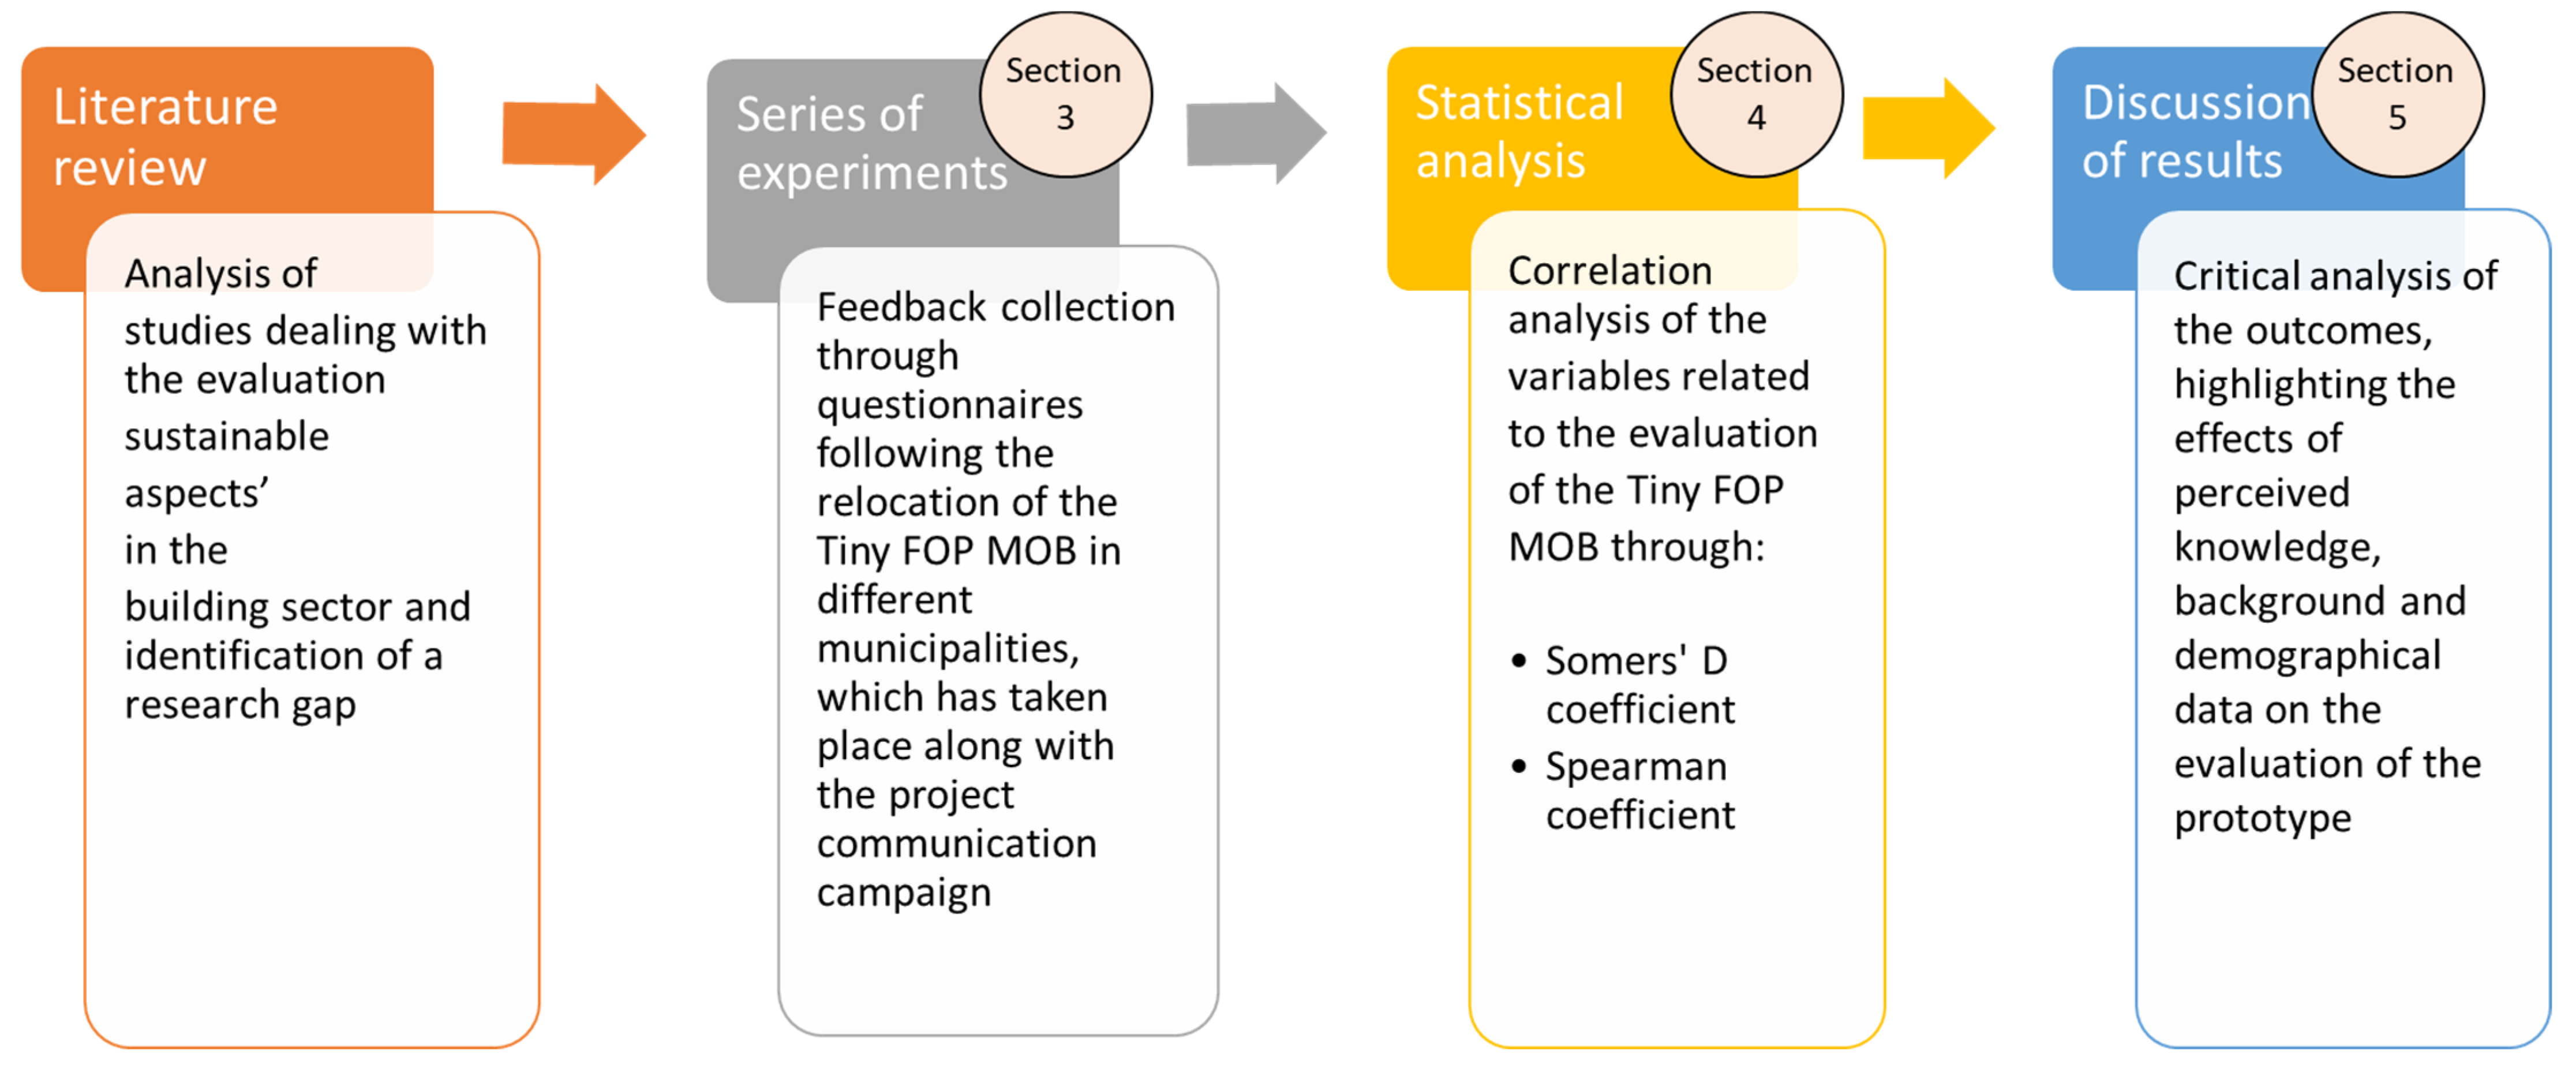
The project scopes align with the pursuance of the research objectives and the prototype has been used as a case study to address the objectives. The research procedure is shown in Figure 1, where the major steps are indicated along with the paper’s sections where these steps are described. In particular, an experiment involving volunteer participants was designed and conducted, made more apparent in the following subsections. Participants were asked to visit the prototype and provide feedback by means of a questionnaire. Experiments were initially approved by the statistical office of the project leader (EURAC Research) and the ethical commission of the Free University of Bozen-Bolzano, Bolzano, Italy. Both these institutions are located in South Tyrol, a bilingual (German and Italian) region in Italy. Questionnaires’ outcomes were subsequently collected to conduct a statistical analysis, intended to correlate variables of interest related to the evaluation of perception of the Tiny FOP MOB and relevant according to research objectives. A correlation analysis was carried out to capture the links across a large number of variables; regressions were not used, as the goal was not to predict evaluations based on potential causal factors. Correlation functions (Spearman, Somer’s D) were chosen based on the involved variables—details are to be found in Section 4. As aforementioned, results were critically discussed (Section 5) with a focus on the effects of perceived knowledge, background and demographical data on the evaluation of the prototype, consistent with the research objectives.

Figure 1.
Research procedure schematised into steps and the following sections mostly devoted to illustrating such steps.
3.2. Product and Characteristics Thereof
The Tiny FOP MOB was designed and manufactured by two local companies of South Tyrol, Italy, more specifically of the Vinschgau Valley. The prototype was produced with natural materials, e.g., a mixture of hemp, lime and water for the building blocks, wood for external coatings and furniture elements. Sustainable peculiarities of the Tiny FOP MOB include the materials utilised, which are almost zero-kilometre, but also the entire process of development and construction. The environmental impact of the building blocks is CO2 negative based on preliminary estimates. As a result, the Tiny FOP MOB was supposed to stimulate people to think about sustainability in the building sector and provided a concrete example thereby. Its use as a RwL further stressed its sustainable orientation from a social viewpoint.
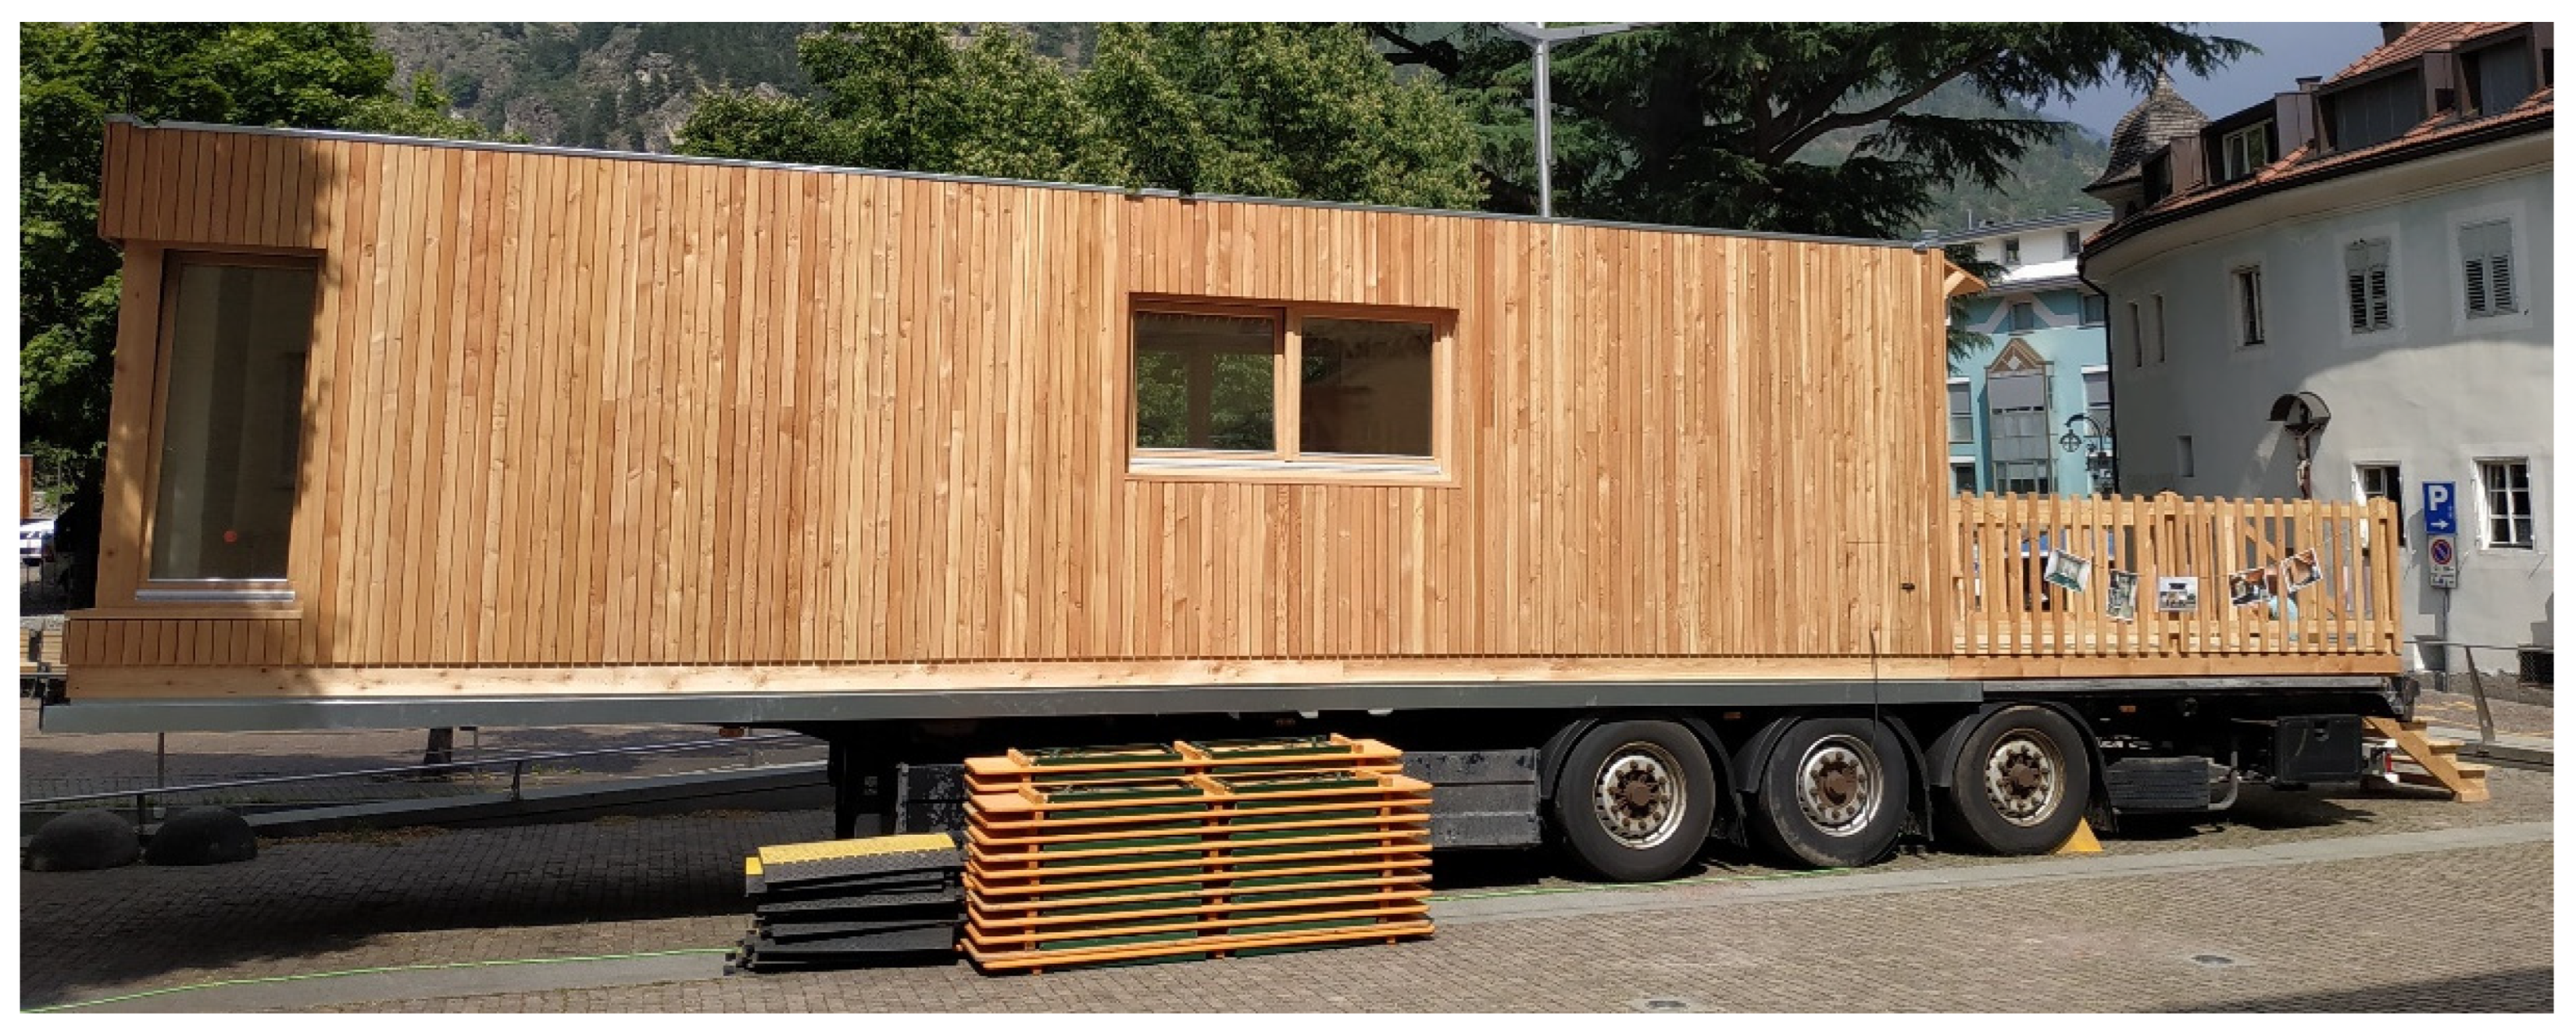
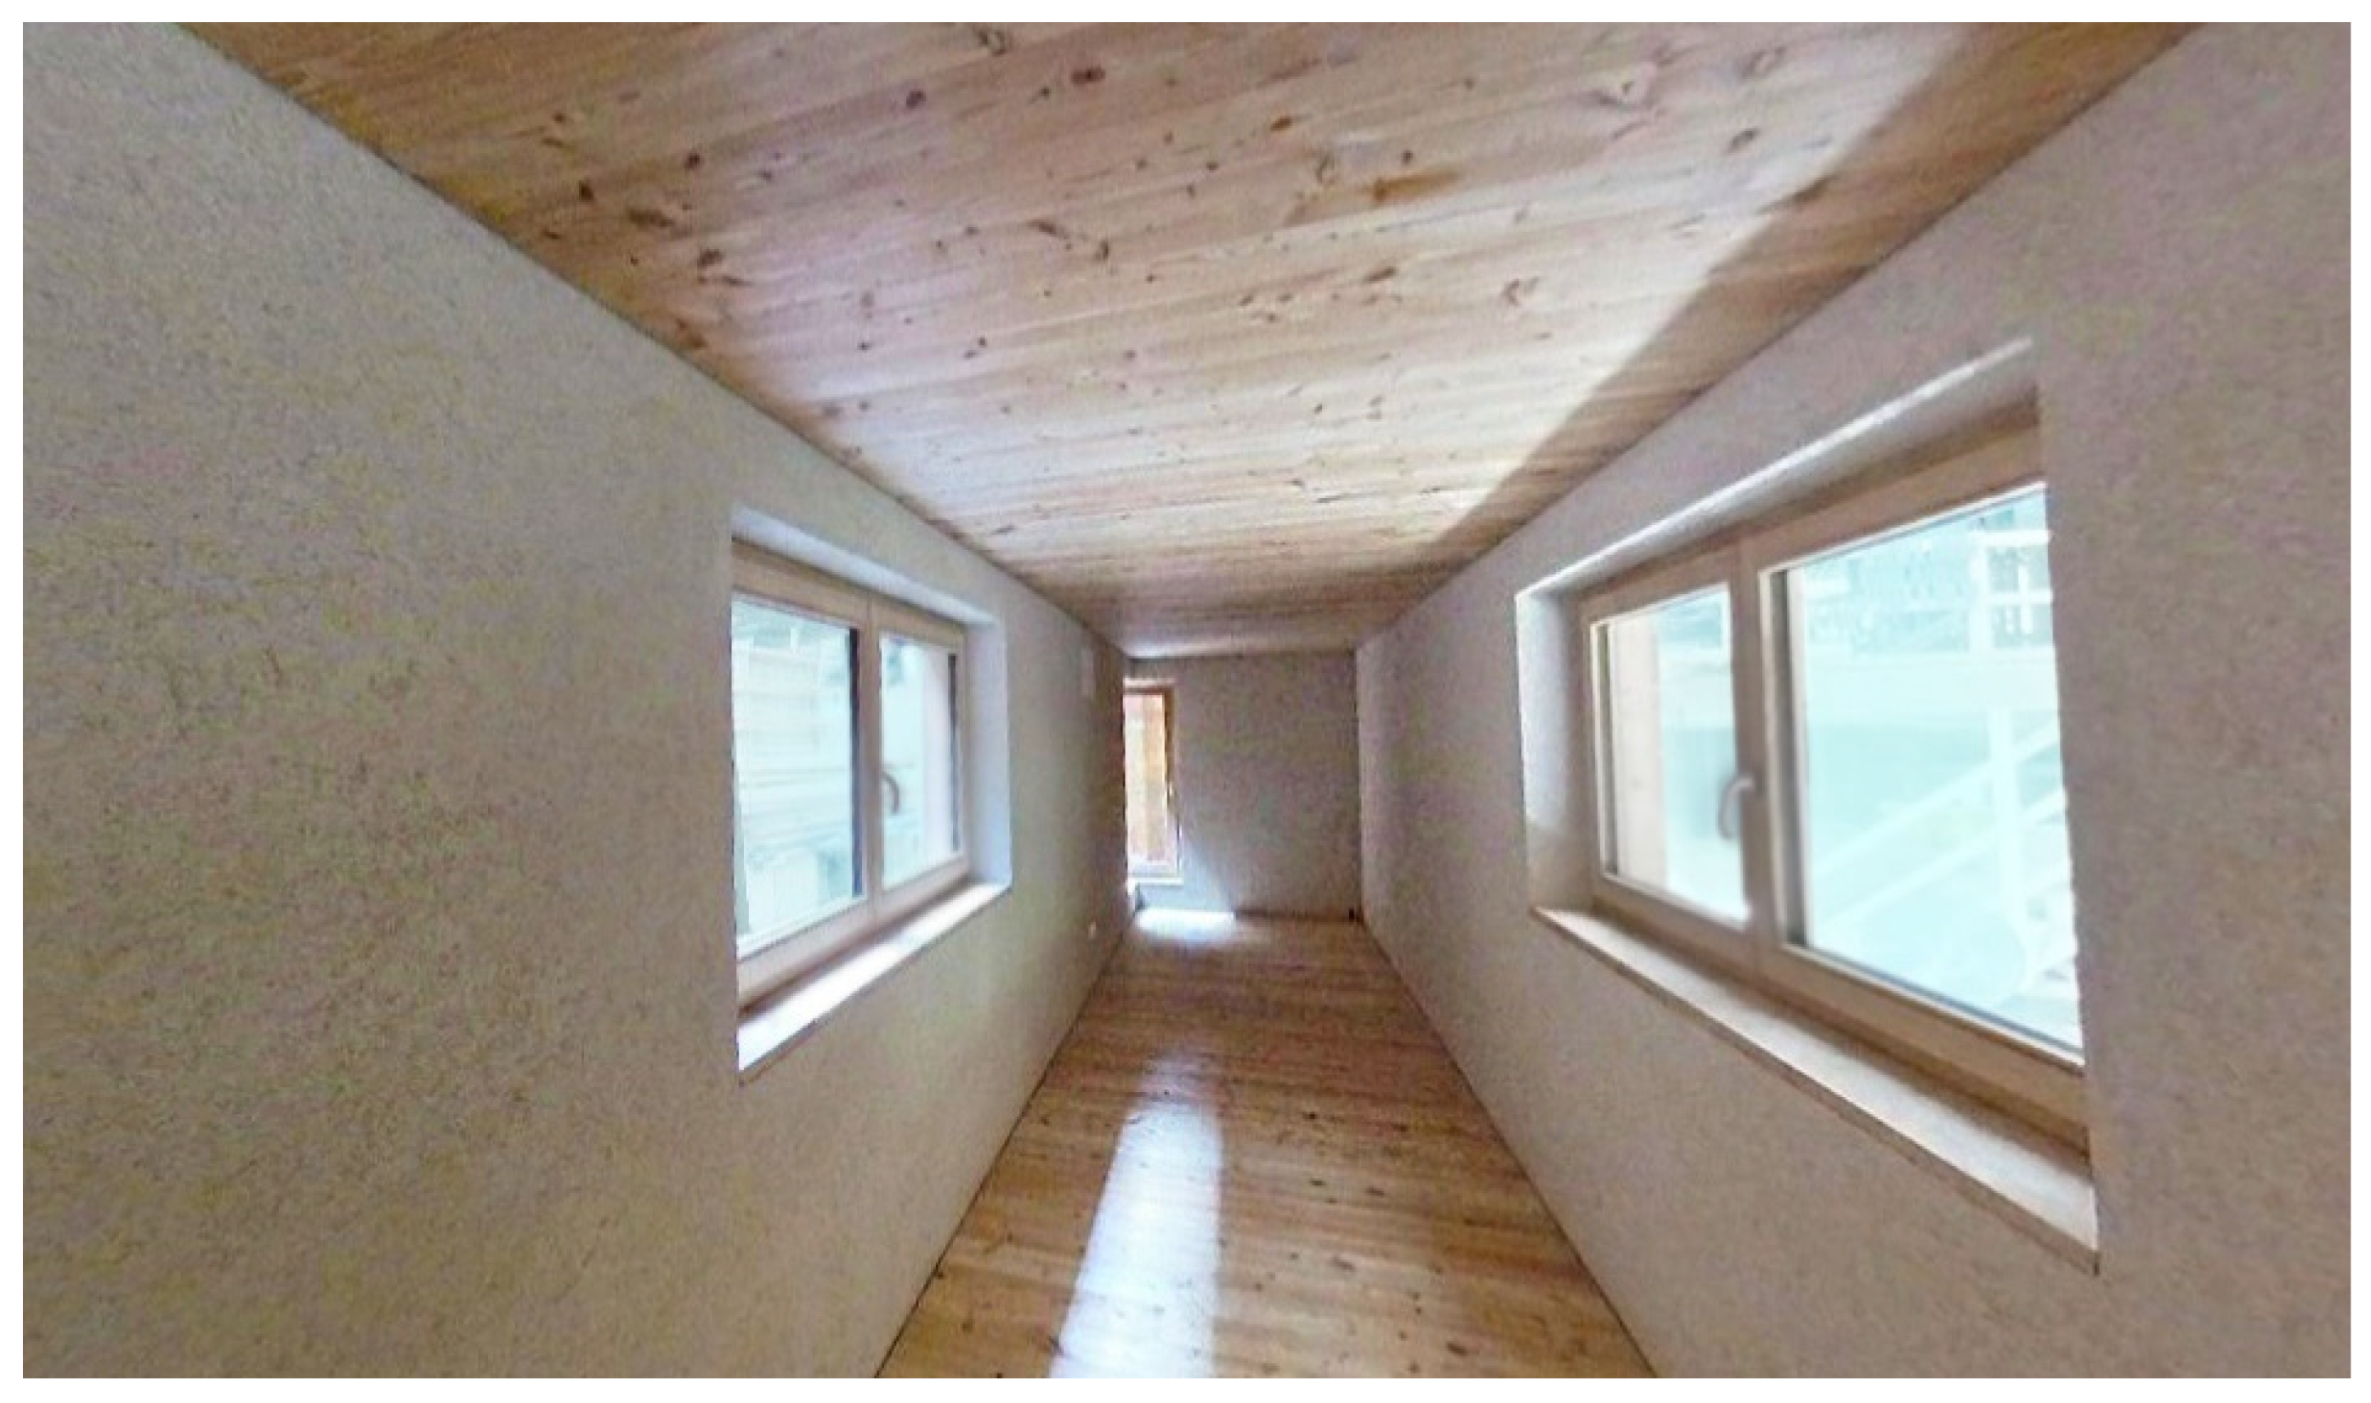
The Tiny FOP MOB is mounted on a trailer, and, thanks to this feature, it could be transported in different towns of the Vinschgau Valley (see the next subsection). The prototype is illustrated in Figure 2 (outside) and Figure 3 (inside).
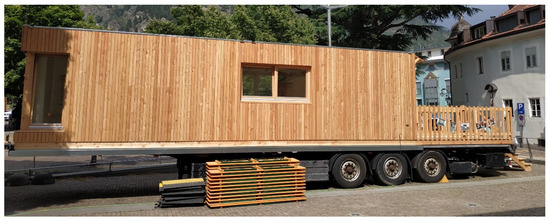
Figure 2.
The Tiny FOP MOB prototype (exterior view).

Figure 3.
The Tiny FOP MOB prototype (interior view).
3.3. Relevant Information about the Project
The mobility of the Tiny FOP MOB mirrors its scope to work as an RwL and matches its ability to spread knowledge about sustainability and related research outside major towns in South Tyrol, where research facilities are located. Consequently, a shared travel calendar was established in order to stop the Tiny FOP MOB in five pilot locations in the Vinschgau Valley, following consultations with local authorities. The prototype was moved to the localities of Schlanders, Mals, Latsch, Prad am Stilfserjoch and Graun im Vinschgau in the period of July–November, 2021. Additional tests were performed in spring 2022 in Schlanders where the Tiny FOP MOB is currently parked at the time of writing (June 2022). The prototype route throughout the Vinschgau Valley, as well as key information about the project’s objectives, were described in newspaper articles by the local press, on the project website and in informative materials distributed in the above towns. Materials were made available in the surroundings of the prototype (in the form of informative posters) in line with the instructions reported in the next subsection. A number of initiatives about sustainability with specific reference to the building sector were organised too. It follows that participants’ awareness of the project, the design requirements of the Tiny FOP MOB and, mainly, the delivery of information about sustainability-related aspects, could not be controlled and was uneven across participants. These circumstances justify the research objective (see Section 2) of understanding the impact of sustainability information shared at a social level, in indirect forms, and to different extents, across participants. In other words, the sustainability information addressed in this work can be indicated as diffuse and indirect, in contrast with the direct form provided, for instance, by eco-labels.
3.4. Participants and Relevant Aspects of the Experimental Procedure
The sample of convenience for this study was formed by 172 participants who took part in the experiment. Participants were directly recruited on the location sites of the prototype. All adults represented potential participants irrespective of their background, education, gender, reason for being in the Vinschgau Valley, e.g., residence, tourism, work. Participation was voluntary; all passers-by in the five localities in Vinschgau Valley were invited to visit the Tiny FOP MOB and answer the questionnaire (see below). Participants just had to confirm being at least 18 years old due to ethical and legal issues. After recruitment, participants were informed of the following guidelines and rules of conduct.
- Specific information about product peculiarities would have been given only after the visit unless this was explicitly requested to the experimenters before or during the visit; as well, paper-based or online informative material about the project and the Tiny FOP MOB was given to participants based on their requests.
- A scheduled timetable was not planned by providing participants with the chance to observe the prototype as long as they wanted and needed. If the Tiny FOP MOB was free at the time of recruitment, the visit could take place immediately.
- A limitation on the number of simultaneous visitors was imposed, together with the rule of wearing a mask inside the Tiny FOP MOB, due to the COVID-19 pandemic situation at the time of the experiments.
Background, personal and demographic data was also requested, which included:
- Gender;
- Age range (options: 18–30, 31–40, 41–50, 51–60, 61–70, 71+);
- Origin, markedly if the participant lived in a South Tyrolean municipality;
- Education (options: primary school, secondary school, high school, second-level vocational school, University degree, Ph.D.);
- Job.
Participants were left free to skip some answers if they believed the provided data could violate their privacy. Apart from missing information, the final sample was constituted by:
- 63 men and 79 women;
- 39 people aged 18–30; 24 people aged 31–40; 22 people aged 41–50; 38 people aged 51–60; 9 people aged 61–70; 8 people aged 71 or older;
- 84 South Tyroleans and 59 people whose residency was outside South Tyrol;
- 2 people with primary school; 10 people with secondary school; 44 people with high school; 17 people with vocational school; 54 people with an University degree; 15 people with a Ph.D. degree;
- 14 people working as architects, engineers, urban planners, entrepreneurs or managers in the building or wood industry, who could be considered experts in the field; 129 non-experts.
3.5. Questionnaires and Extracted Variables
As evident from Table 1, questionnaires have turned out to be the most used method to acquire information about people’s evaluations, especially in the building industry. As aforementioned, questionnaires were also used in the present research.
The questionnaires were developed and used during the whole duration of the experiments in German and in Italian. Participants could choose to fill in questionnaires either paper-based or online. The main purpose of the questionnaire was to investigate comfort, perception of the Tiny FOP MOB and participants’ opinions concerning global challenges beyond personal and background data. The total time needed to complete the questionnaire was approximately 15 min; no data potentially leading to the identification of respondents was collected.
With regard to the addressed objective of the paper, this subsection, along with the paper as a whole, presents the questionnaire’s part (translated in English) concerning the perception of the quality and sustainability of the Tiny FOP MOB. The Institution the authors belong to was in charge of the design of this part of the questionnaire and analysed the corresponding results. This part of the questionnaire included 13 different statements (see Table 1) to be evaluated by means of a Likert scale ranging from 1 (“Totally disagree”) to 5 (“Totally agree”). The statements in Table 2 are reported alongside the name of the corresponding variables that are manipulated in the next sections.
Table 2.
Questionnaire’s list of statements and variable names related to knowledge, perception, quality and sustainability.
The first statement directly enquires about the different levels of knowledge about the product and the project itself. The variable “Knowledge” has provided the authors with an indication of whether participants were aware of the project’s characteristics and scopes, but without specific details about how they acquired this knowledge due to the project’s limitations. This kind of information is strictly related to the need to pursue the second objective mentioned in Section 2.3.
The questions concerning quality (2 to 6) were taken from an already available list of statements [10], which survey the quality perception in the domain of sustainable products. These questions address a number of aspects aimed at forming choice and preference of sustainable products over alternatives. These questions target primarily the first objective mentioned in Section 2.3.
The questionnaire is integrated with bespoke statements related to the project and the investigated product, i.e.,
- Brand identity (7), as a measure of the product’s capability to fit and represent the South Tyrolean territory, similar to [52];
- Suitability for different purposes (8 to 12) in order to assess the perceived capability of prototype to serve some of the scopes it could potentially fulfil, as in [53];
- Perception of sustainability (question 13), which is closely targeted in the present work because of its dealing with sustainable design. Precedents of investigating the perception of designs’ sustainability can be found in [54,55].
The variables 7 to 13 can complement the quality perception in the pursuance of the paper’s objectives, markedly the fourth one, reported in Section 2.3.
4. Results
4.1. Objective 1: Overall Perception and Evaluation of a Green Building
Beyond the participants’ perception of knowledge, the questionnaire was intended to reveal a number of aspects related to the evaluation of the Tiny FOP MOB. Consistently with the objectives, ordinary people were involved in the evaluation, as the general description of the sample and the fact they were passers-by should suggest.
Table 3 includes the number and the frequency (in percentage terms) of answers for each variable. The median is also reported. Some participants skipped some questions; therefore, the totals of the rows slightly differ. A statistical analysis was performed with the software SPSS, PASW Statistics version 26 (IBM Corporation) by using data of each participant—the same software application was used for all the statistical analyses. Regarding the distribution of the results, the median and mode of the variable [Knowledge] is 1, which means that most of the participants seemingly had little to no information about the project before and during their participation in the experiment. As for the rest of the variables, the values are predominantly mainly between 3 and 5. While all these variables denote an overall positive perception of the Tiny FOP MOB, the high values attributed to [Sustainability] and [Creativity] are particularly noteworthy.
Table 3.
Number of answers for each variable of the perception questionnaire reported along with percentages and medians.
4.2. Objective 2: Effect of the Perceived Knowledge on the Evaluation of the Prototype
Based on the paper’s objectives, particular focus has been given to the relationship between the previous knowledge about the Tiny FOP MOB project [Knowledge] and the perception of the tiny house after the visit. This objective has been addressed by calculating the Spearman’s correlation between [Knowledge] and the other variables. Here, this association function has been chosen because of its suitability for ordered variables.
Given the focus of the research, specific attention was paid to the effect of [Knowledge] on [Sustainability]. However, it emerged that the correlation between the variables [Knowledge] and [Sustainability] was 0.068. Hence, this correlation was almost absent according to Landis and Koch’s [56] interpretation and non-significant (p = 0.391).
The correlations between [Knowledge] and the other variables were also weak and non-significant, as for example [Knowledge] and [Preference] (0.129).
4.3. Objective 3: Effect of Background and Demographic Data on the Evaluation of the Prototype
The individual and demographic data described in Section 3.4 were used as background variables. They were correlated with the perception variables described in Section 3.5 in order to study how the background of the participants affected the results.
The statistical functions used to analyze the correlations between these groups of variables were Somers’ D coefficient and Spearman correlation, due to the nature of the variables. Somers’ D was used to compare ordinal and nominal variables (gender, origin and job), while Spearman correlation has been used for pairs of ordered variables in compliance with [57]. The significant correlations found between the background and the evaluation variables can be seen in Table 4. The third column indicates the category or the property associated to the background variable for which larger values of the corresponding evaluation variables were obtained.
Table 4.
Number of answers for each variable of the perception questionnaire reported along with percentages and medians.
The gender of participants displayed the largest number of significant relationships with the variables. In all the nine cases for which significant correlations were found, women tended to assign higher values to evaluation variables. On the other hand, origin, job and education were not significantly associated with any of the evaluation variables, and, as such, are not present in Table 4. The age of the participants was significant for four of the variables studied: lack of disadvantages, brand, holidays and sustainability. In all these cases, younger people tended to provide higher evaluations to the Tiny FOP MOB.
4.4. Objective 4: Interplay among Evaluation Criteria
In order to compare the evaluation variables, a Spearman’s Correlation analysis was performed, as they were all order variables. The results of the analysis are presented in Table 5, which includes the magnitude and the significance of the correlation. In this respect, the option was adopted of the SPSS software to flag the correlations at the p-value thresholds 0.01 (**) or 0.05 (*), as a common rule of thumb.
Table 5.
Correlations among evaluation variables.
No correlations across all the variables presented negative values showing the absence of inverse relations.
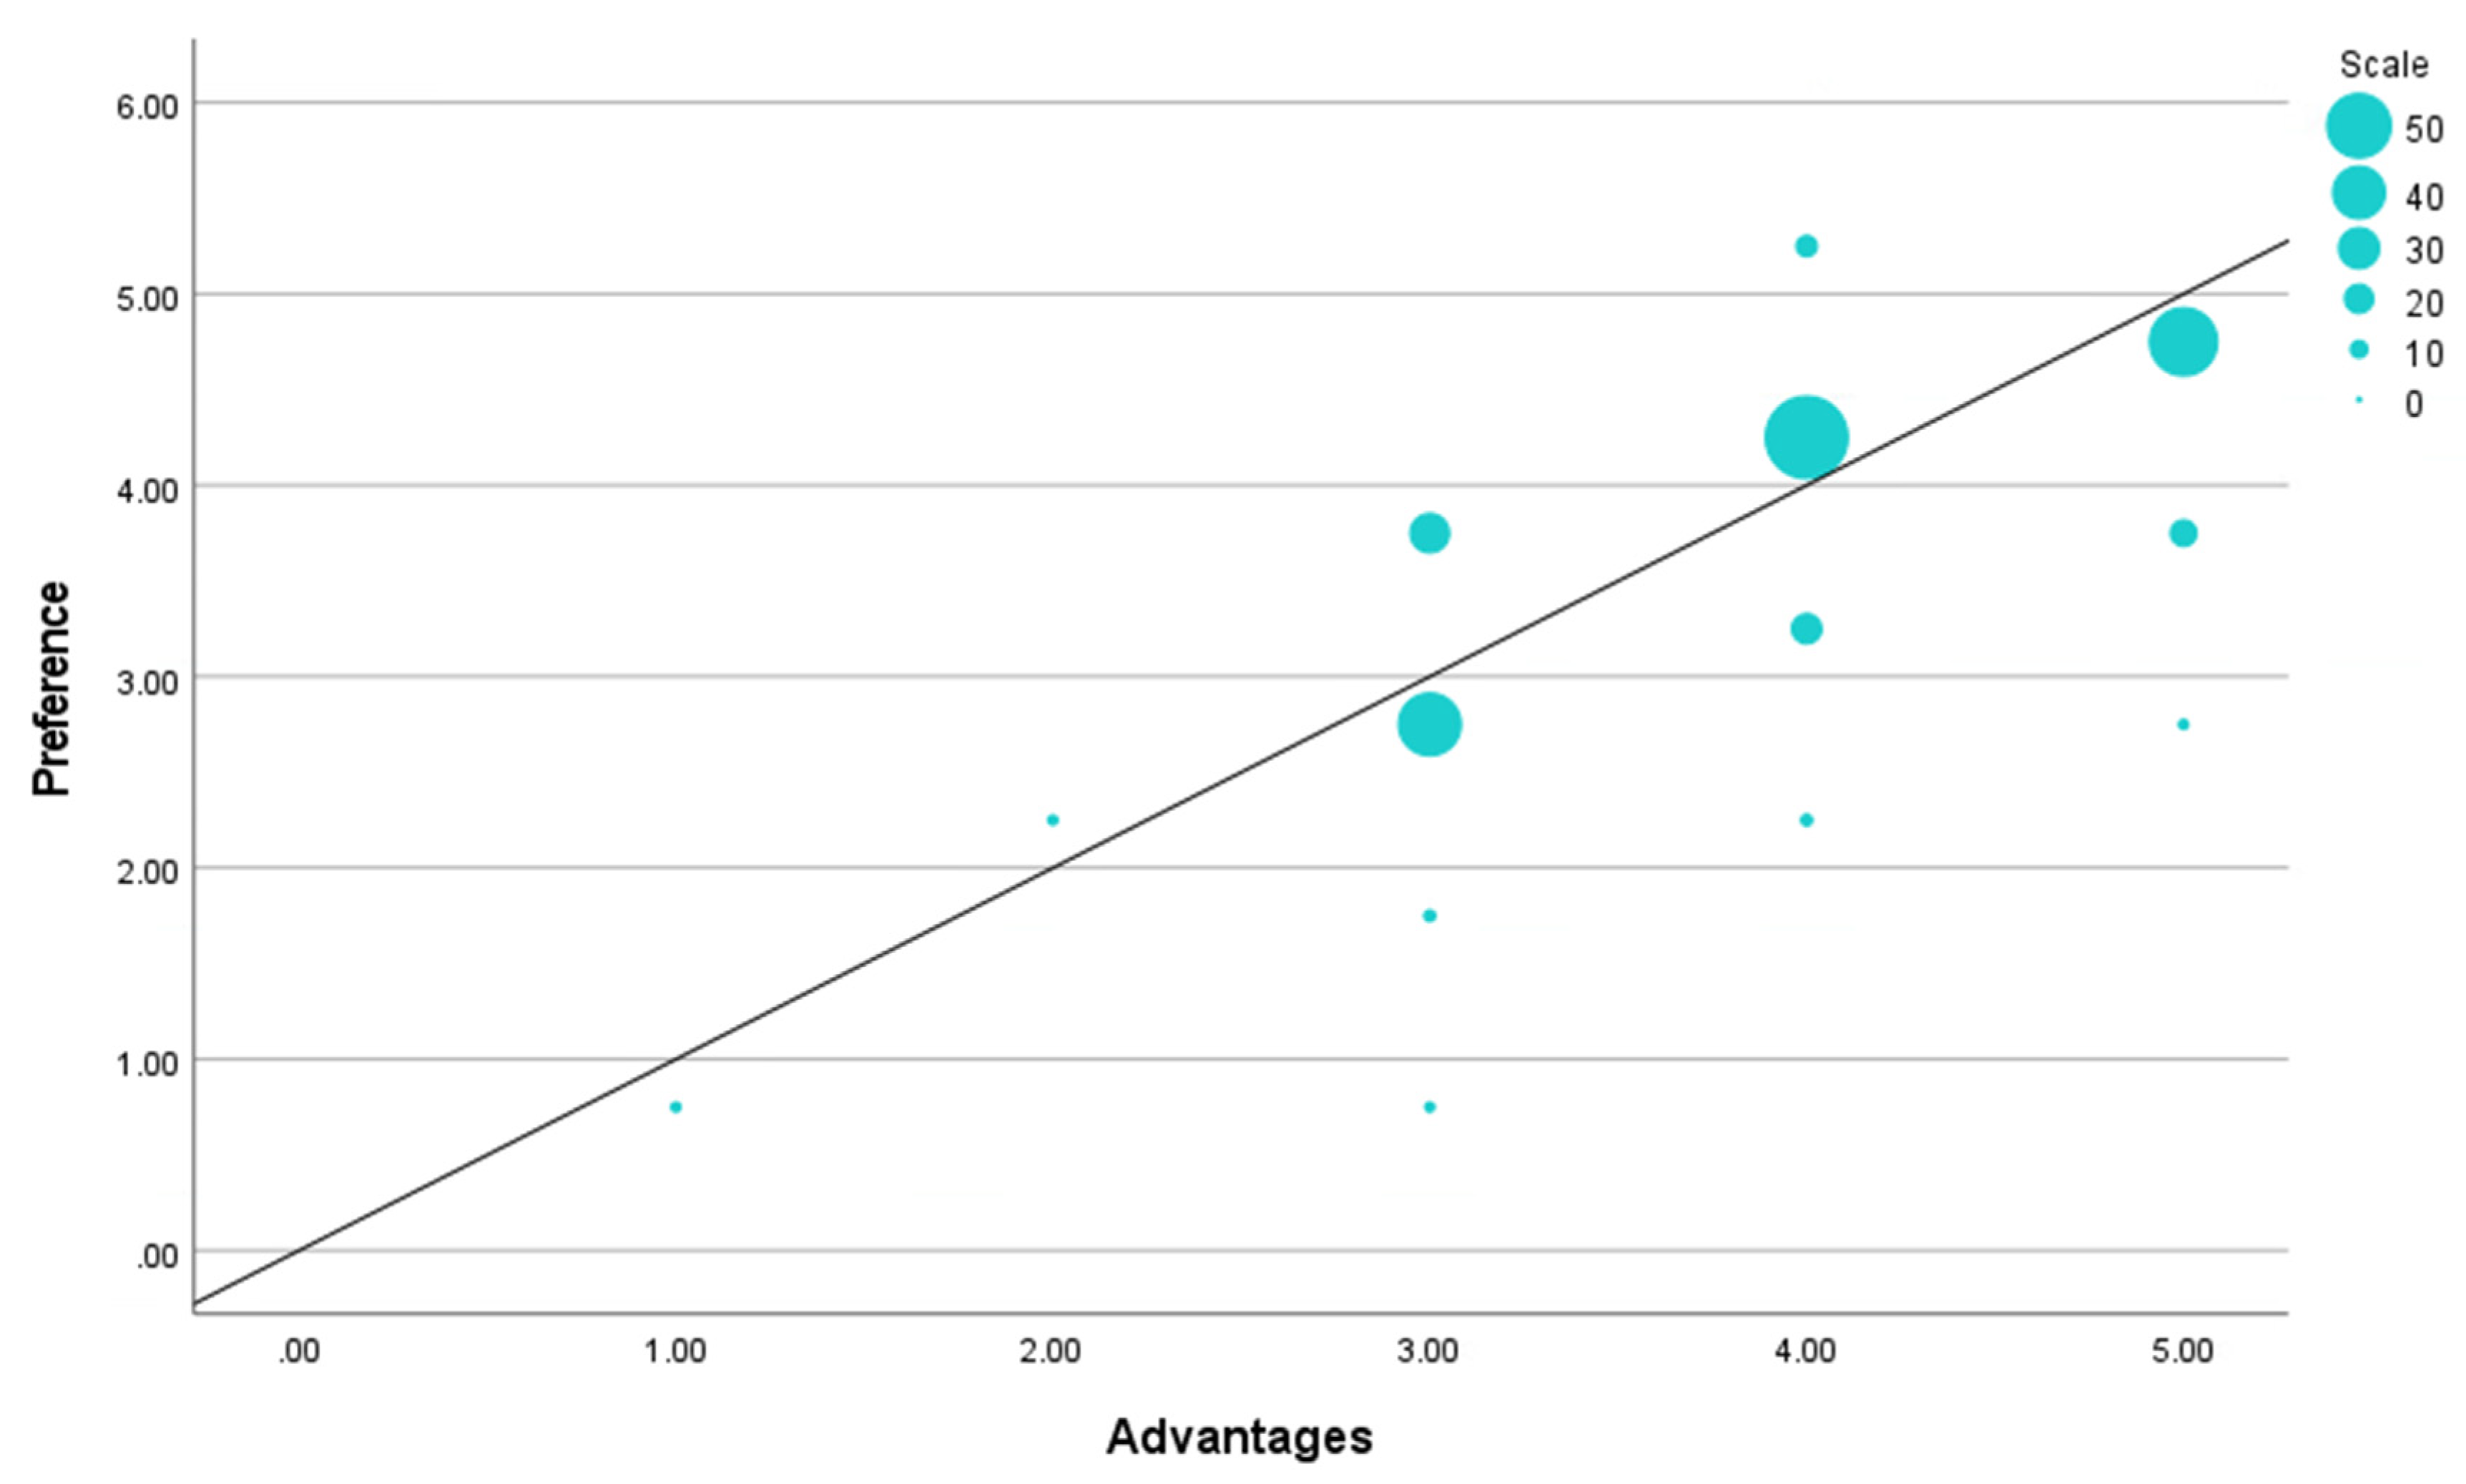
Through Figure 4, Figure 5 and Figure 6, it was possible to gain insight into some of the strong correlations emerging in the analysis. These figures show, by means of the size of bubbles, the number of co-occurrences of values attributed to the considered pairs of variables. In particular, the highest correlation could be found between [Advantages] and [Preference] (0.717) (Figure 4), which led us to consider these quality dimensions possibly redundant, although they are, in principle, distinct.
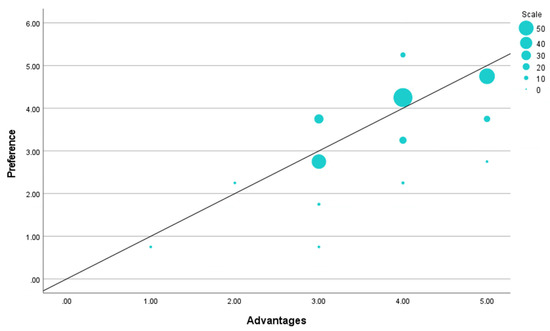
Figure 4.
Relationship between Preference and Advantages.

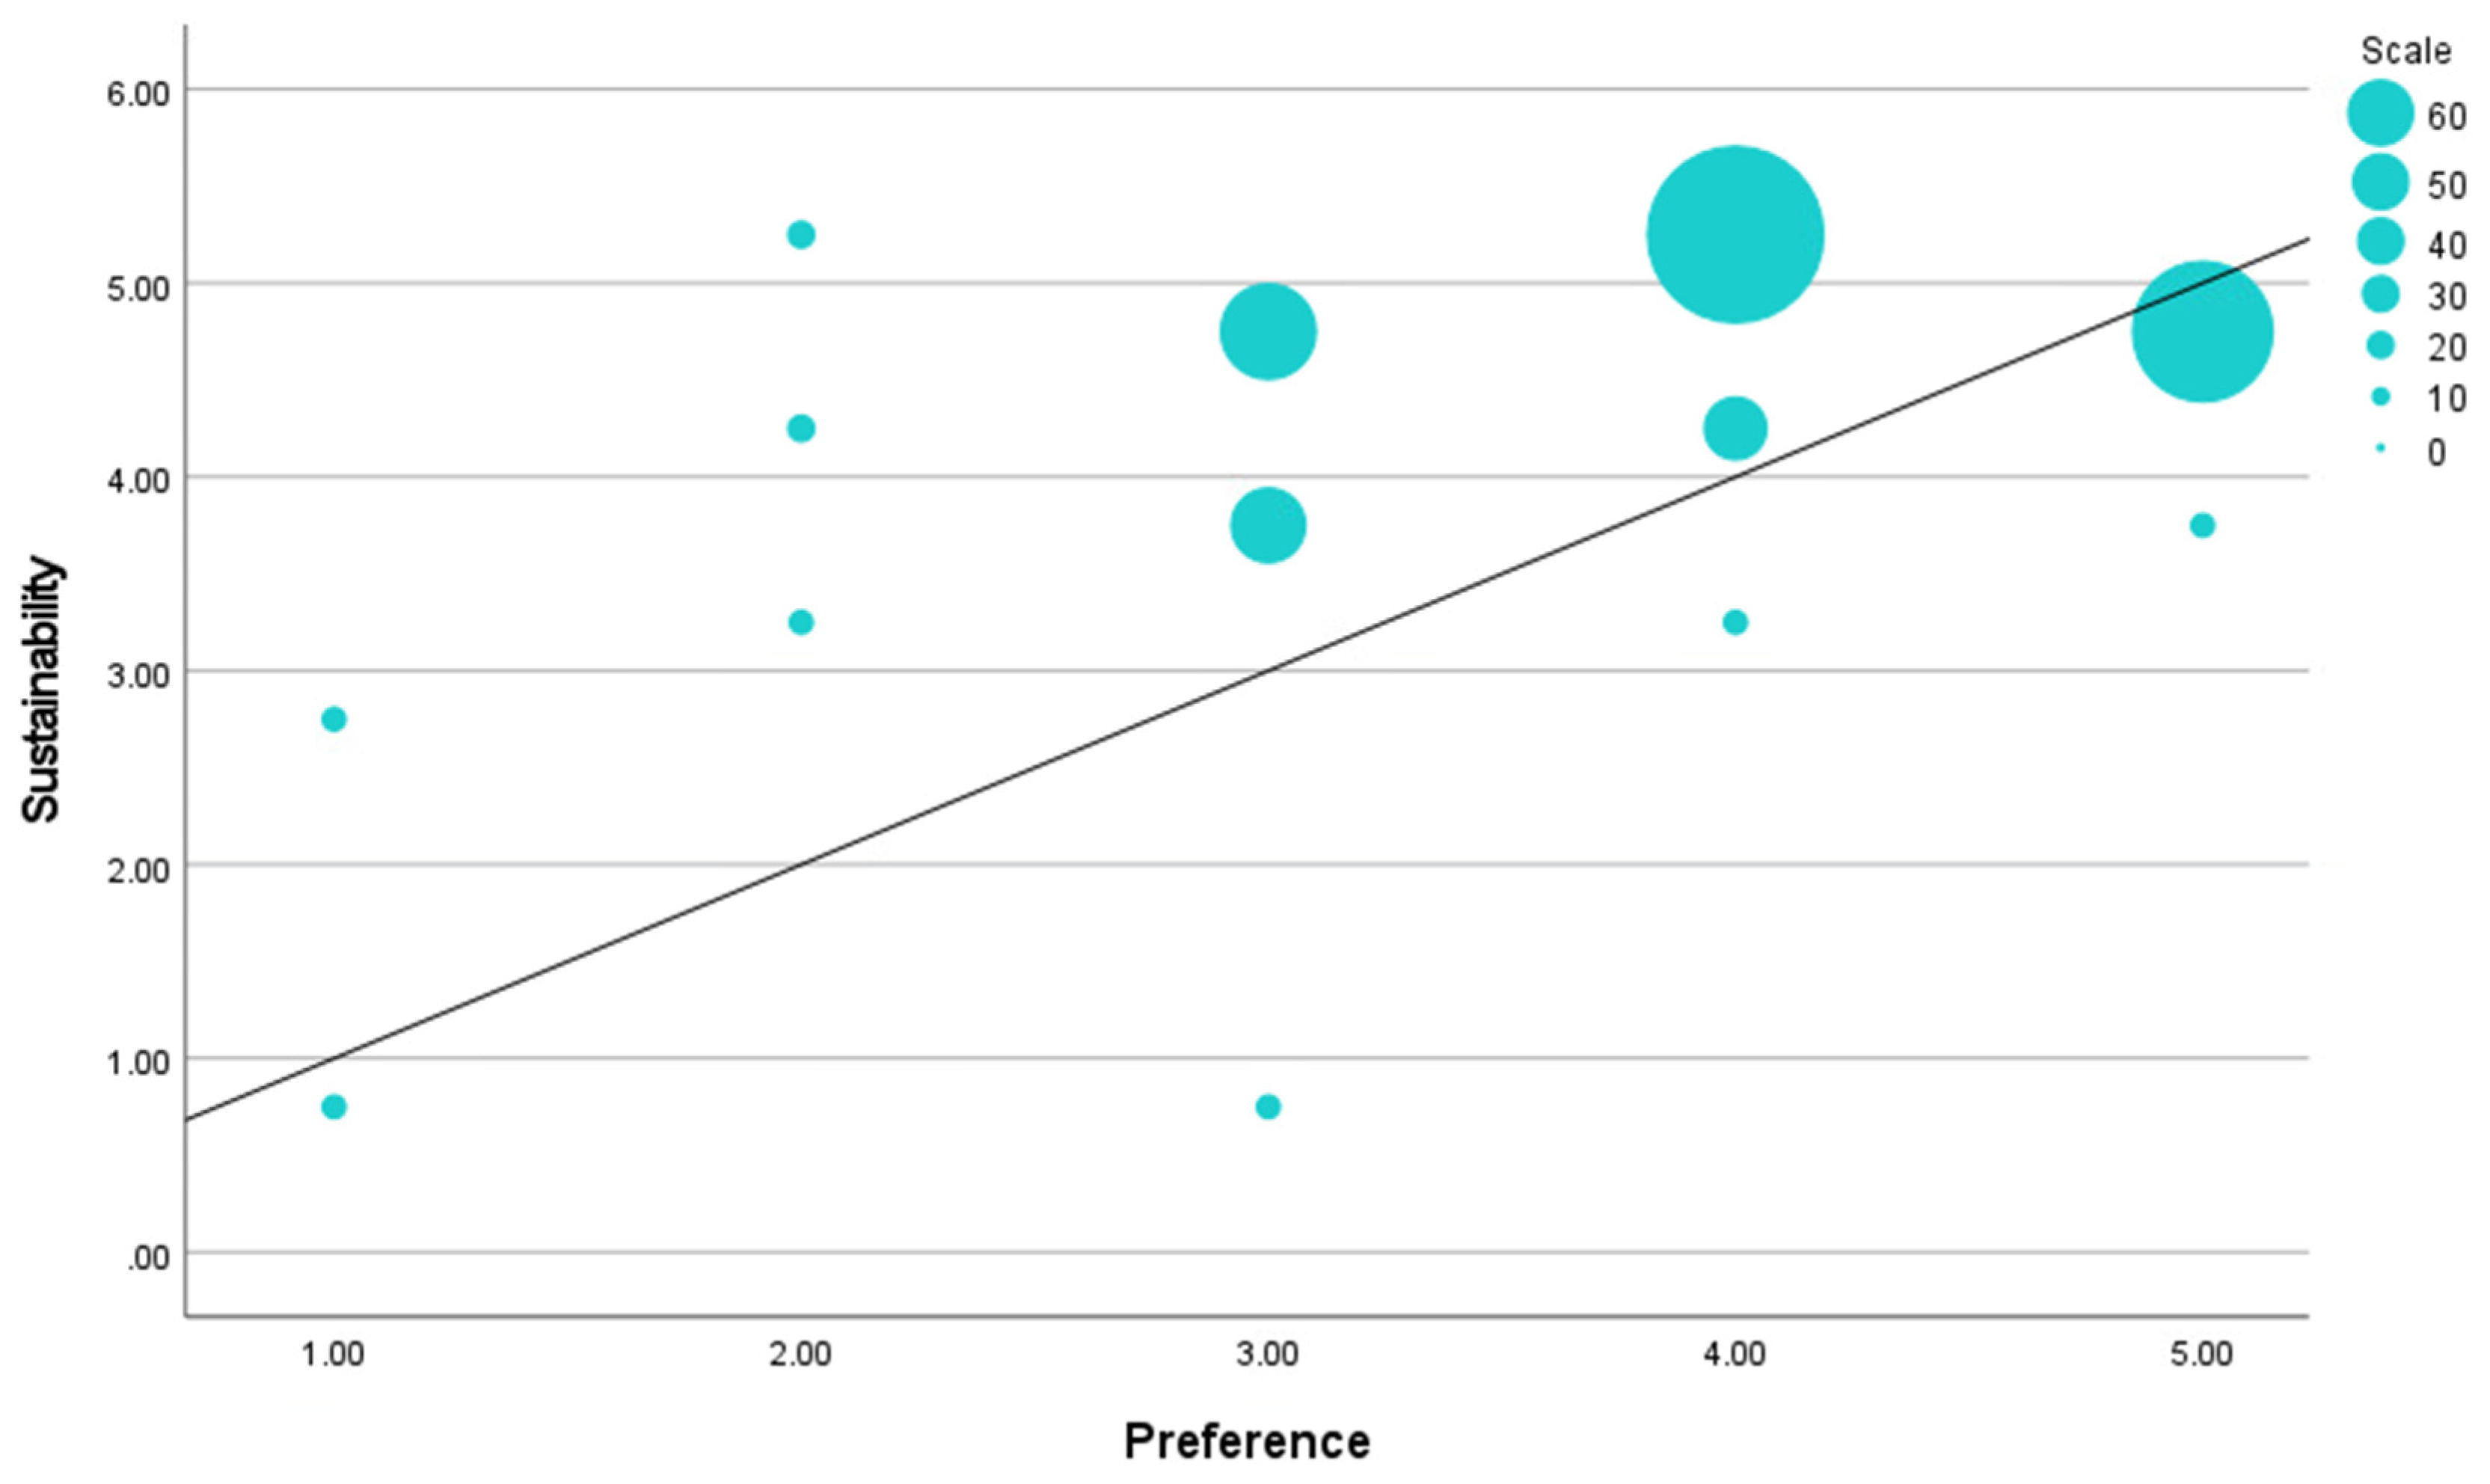
Figure 5.
Relationship between Sustainability and Preference.
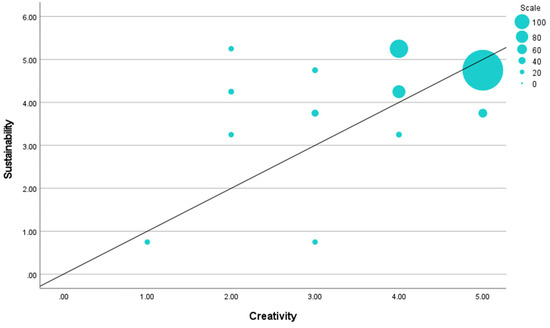
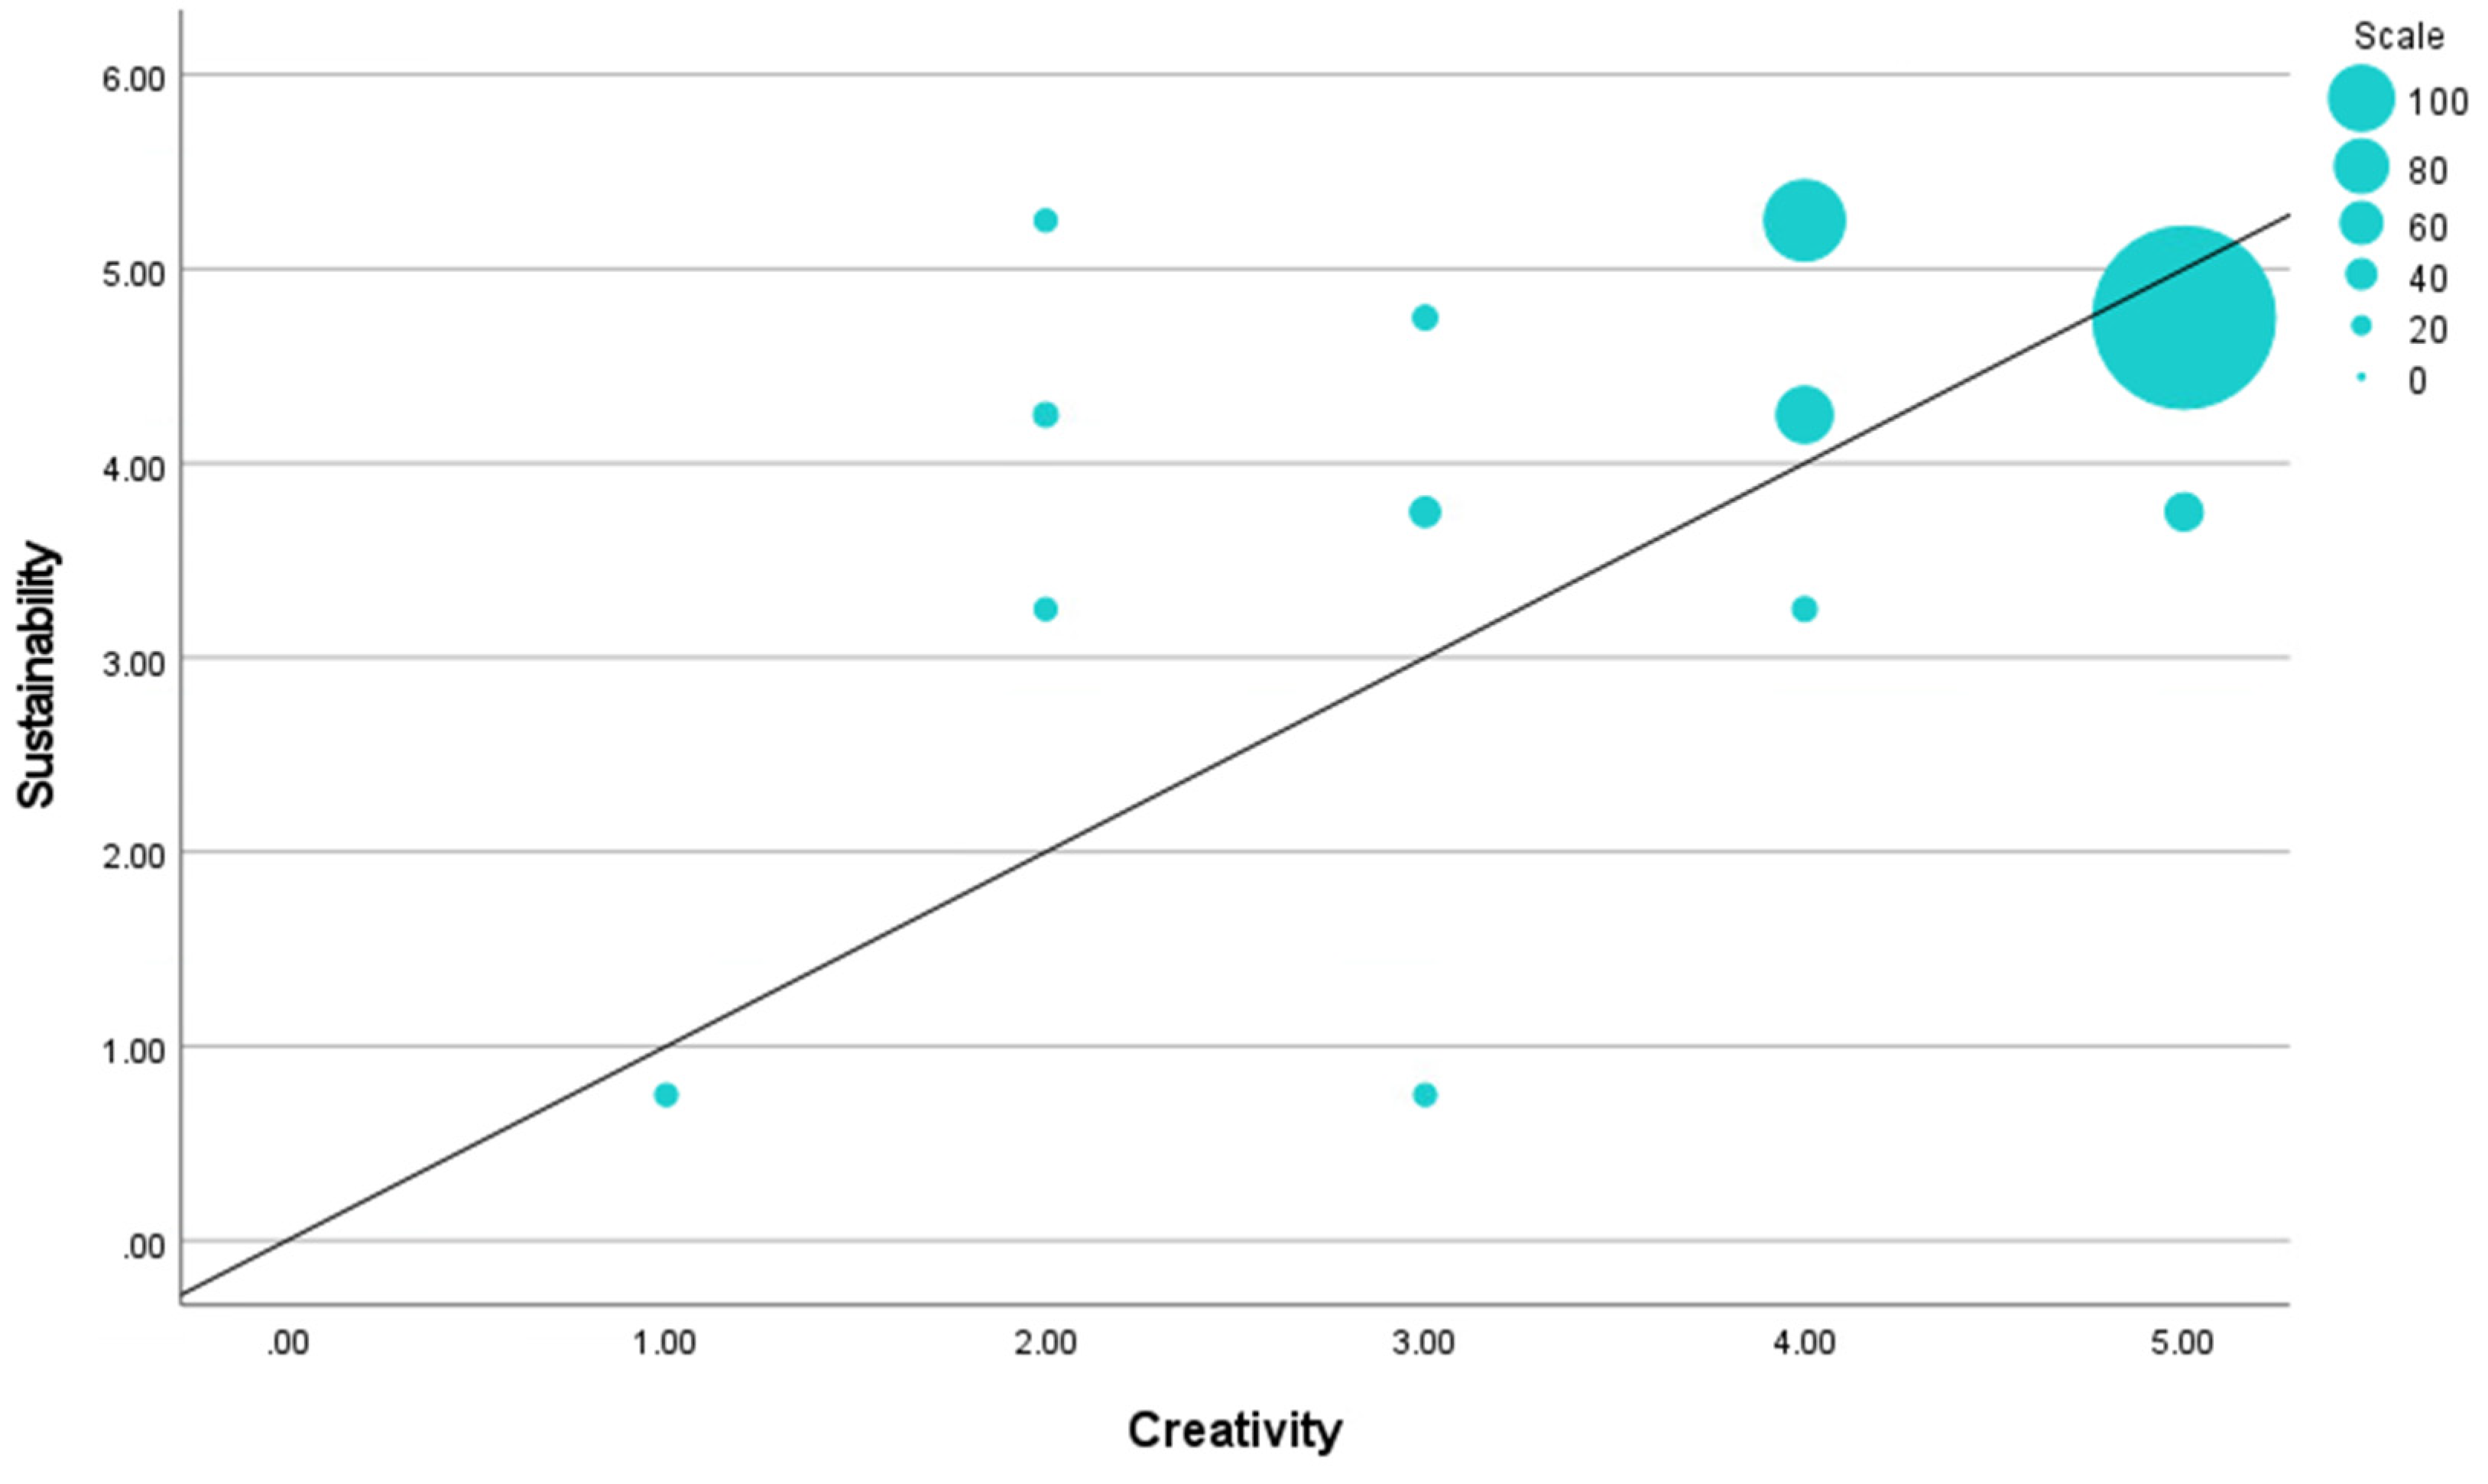
Figure 6.
Relationship between Sustainability and Creativity.
The correlations of [Sustainability] with other variables were significant in many cases. The measures of association between [Sustainability] and the other evaluation variables varied between 0.194 ([Seminars]) and 0.475 ([Creativity]). The perception of sustainability was significantly correlated with all the other variables, especially with [Preference] (Spearman correlation 0.414) and [Creativity] (Spearman correlation 0.475) (Figure 5 and Figure 6). Regarding the association between the variables concerning quality and appropriateness, they mainly exhibited slight to moderate correlation.
5. Discussions
The present section is devoted to critically discussing the outcomes of the study and suggesting their interpretation and implications. The original aspects of the study and the requirements for a thorough investigation of a green building, recalled in Section 2.3, prevent the comparison with very similar studies. Therefore, comparisons of the findings are largely affected by a large number of contextual factors and differences in the settings of the studies.
5.1. Objective 1: Overall Perception and Evaluation of a Green Building
As regards the first stated objective, the aim was to study ordinary people’s overall perception of a physical building implementing sustainable characteristics. The results showed that the evaluation of the Tiny FOP MOB prototype was very positive across a considerable number of evaluation criteria ranging from identification of advantages to appropriateness, creativity and sustainability.
These results support the positive attitude towards green buildings across several factors that were found in [34], where participants were surveyed after living and having experienced green buildings. However, post-occupancy evaluations of green buildings do not always show high satisfaction levels, e.g., in [58]. Likely, the characteristics of what makes a building greener or more sustainable might play a role in this respect and more research is therefore needed. When switching the attention to sustainable products and other forms of designs, evaluations differ substantially as well, e.g., in [10].
With reference to the attainment of this objective, it must be nevertheless noted that the sample of participants was random, but the volunteer participation could make it poorly representative of “ordinary people”. It could be hypothesised here that those willing to participate had an aprioristic positive view of the presented design, which justifies the high evaluations shown in Table 3. This might explain why the knowledge of the product acquired by participants did not affect their perception of sustainability and quality (see Section 5.3).
5.2. Objective 2: Effect of the Perceived Knowledge on the Evaluation of the Prototype
In relation to this focal research objective, the results conflict with past research findings (see the abundant literature presented in Section 1 and Section 2.1) where the role of knowledge and awareness of the sustainable properties of products has largely affected the perception of sustainability and preferences. The possible causes of misalignment with previous studies are discussed below along with pointing out some peculiarities and limitations of the study.
- The aforementioned peculiar contextual factors, such as unevenness of information given to participants, knowledge possibly coming from different sources and in different modalities, etc., are candidates to explain the divergence of the presented results from previous work.
- While all the analysed answers are inherently subjective, this might particularly apply to knowledge, as each participant could have evaluated differently the amount of information processed and the lack of necessary knowledge to assess the prototype in a fully aware manner. In other words, the impossibility of verifying the metrics used by participants to provide [Knowledge] values represents an important limitation of the paper, besides being a difference with respect to most previous literature.
- An additional hypothesis is that a tiny house, clearly built with natural materials, might be considered per se a sustainable product; hence, details about the project, such as the planned use of the Tiny FOP MOB for an RwL or the origin of materials, could have poorly oriented evaluations. In other terms and with a closer look at the design research, the product considered could lend itself to effective indirect communication of sustainable aspects.
5.3. Objective 3: Effect of Background and Demographic Data on the Evaluation of the Prototype
With regard to the role played by factors concerning the participants in the experiment, few significant correlations were found. The effect of demographic factors emerged overall as greater than the impact of background factors, such as experience in the field and education.
On the one hand, the fact that gender and age affected the evaluation of a green building is in line with [59], where experience was targeted. Additional similarities with [59] include the fact that correlations with occupation were not found and that more positive evaluations were typically given by women and younger people. Nevertheless, while the factors significantly affected by age and gender differed, the results of the present study showed that some impacted factors were shared here, notably including the perception of sustainability.
On the other hand, a major dissimilarity of the present study with respect to past literature and a counterintuitive aspect concerns the undetected effect of background variables. Different results can be found markedly in [34,58].
As an additional factor considered despite the absence of significant correlations, people’s origin cannot be considered as a factor underlying strong cultural differences (all the participants were European with Italians, Germans and Austrians constituting nearly the whole sample). Therefore, it would be inappropriate to compare the achieved results with studies treating the effects of cultural aspects.
5.4. Objective 4: Interplay among Evaluation Criteria
The variety of questions and the considerable number of participants allow further reflections beyond the relation between knowledge and perceived sustainability. As [Sustainability] has proved to be largely correlated with quality and appropriateness variables, one might conclude that sustainability is increasingly considered as a necessary design requirement, at least for a subset of people. A consequence might be that the frequent design need to find a trade-off between quality and sustainability is nowadays alleviated. The data gathered in this work conversely suggest that sustainability is a prerequisite for quality and positive experiences. The strong relation between [Creativity], a plainly important dimension in the design field, and [Sustainability] has already been underlined. This link is confirmed by abundant literature stating that people more prone to novelty are also expected to welcome changes driven by sustainability requirements [60].
As far as quality variables are concerned, the degrees of correlation have resulted much larger than in other studies where different evaluation criteria were compared against each other, for instance, in [10]. More research is needed in this area in order to standardize evaluation procedures for sustainable products and use a comprehensive and non-redundant number of questions for characterizing the participants’ experience.
6. Conclusions
The paper has investigated the relationship between the perceived knowledge and sustainability of a sustainable product along with other evaluation criteria. From a methodological point of view, the objective was pursued through a questionnaire, which included the quality evaluation of a tiny house prototype, followed by correlation analysis. As aforementioned, sustainable information was provided in an indirect and diffuse form, differently from most cases presented in the literature, which deal with a direct form of sustainability-related information, e.g., eco-labels (see Section 2).
In relation to the four objectives declared in the present study, the most significant findings are listed below:
- The tiny house received consistently positive evaluations concerning its perceived quality, creativity, appropriateness and sustainability. The majority of evaluators were randomly selected volunteers with a limited number of experts in the field. As such, the involved sample could be considered as well representative of a group of ordinary people despite the participants’ likely intrinsic interest towards the product and their probable sustainable attitude.
- Prior knowledge about the tiny house and the project within which it was designed, developed and built played no evident role in the evaluations.
- People’s background did not affect evaluations significantly either. In contrast, some evaluation variables were affected by gender and age, where women and younger people overall rated the tiny house better in terms of sustainability and other factors.
- The chosen evaluation criteria were shown to be significantly correlated with a remarkable association between perceived sustainability vs. preference and creativity.
Future work includes the attempt to overcome the limitations mentioned in Section 5, as well as to launch new experiments to understand the role of contextual factors and methodological choices. In particular, an experiment in a laboratory environment is ongoing where the visit of the physical prototype is substituted by a virtual tour and the provision of information is controlled. Possible differences in the results will be used to assess the extent to which user experience changes in a virtual environment (which was assumed in the present paper) and the effect of changing the way information is supplied to participants.
Author Contributions
Conceptualization, C.N., S.A. and Y.B.; methodology, S.A. and Y.B.; validation, A.B. and L.R.-P.; formal analysis, C.N. and A.B.; investigation, C.N., A.B., L.R.-P. and Y.B.; data curation, S.A. and L.R.-P.; writing—original draft preparation, C.N., A.B. and L.R.-P.; writing—review and editing, S.A. and Y.B.; supervision, Y.B.; project administration, Y.B.; funding acquisition, Y.B. All authors have read and agreed to the published version of the manuscript.
Funding
The work is fully supported by the project “Tiny FOP MOB—A Real World Laboratory made of wood and hemp travelling through the Vinschgau Valley”, funded by the European Regional Development Fund (ERDF) Investment for Growth and Jobs Programme 2014–2020, 5th call in the Axis 1 “Research and Innovation” of the Autonomous Province of Bolzano-South Tyrol, grant FESR1161.
Data Availability Statement
Not applicable.
Acknowledgments
The authors would like to thank the project partners, and markedly the colleagues from the Center of Advanced Studies at Eurac Research, for their contribution to the present research and the collection of data.
Conflicts of Interest
The authors declare no conflict of interest.
References
- She, J.; MacDonald, E.F. Exploring the Effects of a Product’s Sustainability Triggers on Pro-Environmental Decision-Making. J. Mech. Des. 2017, 140, 011102. [Google Scholar] [CrossRef]
- MacDonald, E.; Whitefoot, K.; Allison, J.T.; Papalambros, P.Y.; Gonzalez, R. An Investigation of Sustainability, Preference, and Profitability in Design Optimization. In Proceedings of the ASME 2010 International Design Engineering Technical Conferences and Computers and Information in Engineering Conference, Montreal, QC, Canada, 15–18 August 2010; pp. 715–728. [Google Scholar] [CrossRef] [Green Version]
- Goucher-Lambert, K.; Cagan, J. The Impact of Sustainability on Consumer Preference Judgments of Product Attributes. J. Mech. Des. 2015, 137, 081401. [Google Scholar] [CrossRef]
- Balikci, A.; Borgianni, Y.; Maccioni, L.; Nezzi, C. A Framework of Unsustainable Behaviors to Support Product Eco-Design. Sustainability 2021, 13, 11394. [Google Scholar] [CrossRef]
- Mandel, N.; Johnson, E. When Web Pages Influence Choice: Effects of Visual Primes on Experts and Novices. J. Consum. Res. 2002, 29, 235–245. [Google Scholar] [CrossRef] [Green Version]
- She, J.; MacDonald, E. Priming Designers to Communicate Sustainability. J. Mech. Des. 2013, 136, 011001. [Google Scholar] [CrossRef] [Green Version]
- MacDonald, E.F.; She, J. Seven cognitive concepts for successful eco-design. J. Clean. Prod. 2015, 92, 23–36. [Google Scholar] [CrossRef]
- Turunen, L.L.M.; Halme, M. Communicating actionable sustainability information to consumers: The Shades of Green instrument for fashion. J. Clean. Prod. 2021, 297, 126605. [Google Scholar] [CrossRef]
- Leire, C.; Thidell, A. Product-related environmental information to guide consumer purchases—A review and analysis of research on perceptions, understanding and use among Nordic consumers. J. Clean. Prod. 2005, 13, 1061–1070. [Google Scholar] [CrossRef]
- Maccioni, L.; Borgianni, Y.; Basso, D. Value Perception of Green Products: An Exploratory Study Combining Conscious Answers and Unconscious Behavioral Aspects. Sustainability 2019, 11, 1226. [Google Scholar] [CrossRef] [Green Version]
- Shao, J.; Li, W.; Aneye, C.; Fang, W. Facilitating mechanism of green products purchasing with a premium price—Moderating by sustainability-related information. Corp. Soc. Responsib. Environ. Manag. 2021, 29, 686–700. [Google Scholar] [CrossRef]
- Chiu, M.-C.; Tu, Y.-L.; Kao, M.-C. Applying deep learning image recognition technology to promote environmentally sustainable behavior. Sustain. Prod. Consum. 2022, 31, 736–749. [Google Scholar] [CrossRef]
- Cho, Y.-N. Different Shades of Green Consciousness: The Interplay of Sustainability Labeling and Environmental Impact on Product Evaluations. J. Bus. Ethics 2014, 128, 73–82. [Google Scholar] [CrossRef]
- Stöckigt, G.; Schiebener, J.; Brand, M. Providing sustainability information in shopping situations contributes to sustainable decision making: An empirical study with choice-based conjoint analyses. J. Retail. Consum. Serv. 2018, 43, 188–199. [Google Scholar] [CrossRef]
- Goucher-Lambert, K.; Moss, J.; Cagan, J. Inside the Mind: Using Neuroimaging to Understand Moral Product Preference Judgments Involving Sustainability. J. Mech. Des. 2017, 139, 041103. [Google Scholar] [CrossRef]
- Cho, Y.-N.; Soster, R.L.; Burton, S. Enhancing Environmentally Conscious Consumption through Standardized Sustainability Information. J. Consum. Aff. 2017, 52, 393–414. [Google Scholar] [CrossRef]
- Wang, J.; Shen, M.; Chu, M. Why is green consumption easier said than done? Exploring the green consumption attitude-intention gap in China with behavioral reasoning theory. Clean. Responsible Consum. 2021, 2, 100015. [Google Scholar] [CrossRef]
- Woodhouse, A.; Davis, J.; Pénicaud, C.; Östergren, K. Sustainability checklist in support of the design of food processing. Sustain. Prod. Consum. 2018, 16, 110–120. [Google Scholar] [CrossRef]
- Raghupathi, D.; Yannou, B.; Farel, R.; Poirson, E. Customer sentiment appraisal from user-generated product reviews: A domain independent heuristic algorithm. Int. J. Interact. Des. Manuf. 2015, 9, 201–211. [Google Scholar] [CrossRef]
- Song, L.; Lim, Y.; Chang, P.; Guo, Y.; Zhang, M.; Wang, X.; Yu, X.; Lehto, M.R.; Cai, H. Ecolabel’s role in informing sustainable consumption: A naturalistic decision making study using eye tracking glasses. J. Clean. Prod. 2019, 218, 685–695. [Google Scholar] [CrossRef]
- Iraldo, F.; Griesshammer, R.; Kahlenborn, W. The future of ecolabels. Int. J. Life Cycle Assess. 2020, 25, 833–839. [Google Scholar] [CrossRef] [Green Version]
- Chekima, B.; Wafa, S.A.W.S.K.; Igau, O.A.; Chekima, S.; Sondoh, S.L., Jr. Examining green consumerism motivational drivers: Does premium price and demographics matter to green purchasing? J. Clean. Prod. 2016, 112, 3436–3450. [Google Scholar] [CrossRef]
- De Andrade Silva, A.R.; Bioto, A.S.; Efraim, P.; de Castilho Queiroz, G. Impact of sustainability labeling in the perception of sensory quality and purchase intention of chocolate consumers. J. Clean. Prod. 2017, 141, 11–21. [Google Scholar] [CrossRef]
- D’Souza, C.; Taghian, M.; Lamb, P. An empirical study on the influence of environmental labels on consumers. Corp. Commun. Int. J. 2006, 11, 162–173. [Google Scholar] [CrossRef] [Green Version]
- Pérez-Belis, V.; Agost, M.J.; Vergara, M. Consumers’ visual attention and emotional perception of sustainable product information: Case study of furniture. In Proceedings of the 7th International Conference on Kansei Engineering and Emotion Research 2018, Kuching, Malaysia, 19–22 March 2018; Springer: Singapore, 2018; pp. 239–248. [Google Scholar] [CrossRef]
- Franz-Balsen, A.; Heinrichs, H. Managing sustainability communication on campus: Experiences from Lüneburg. Int. J. Sustain. High. Educ. 2007, 8, 431–445. [Google Scholar] [CrossRef]
- Saber, M.; Weber, A. How do supermarkets and discounters communicate about sustainability? A comparative analysis of sustainability reports and in-store communication. Int. J. Retail Distrib. Manag. 2019, 47, 1181–1202. [Google Scholar] [CrossRef]
- Sauer, J.; Sonderegger, A.; Álvarez, M.A.H. The influence of cultural background of test participants and test facilitators in online product evaluation. Int. J. Human-Comput. Stud. 2018, 111, 92–100. [Google Scholar] [CrossRef]
- Lin, C.-L.; Chen, S.-J.; Hsiao, W.-H.; Lin, R. Cultural ergonomics in interactional and experiential design: Conceptual framework and case study of the Taiwanese twin cup. Appl. Ergon. 2016, 52, 242–252. [Google Scholar] [CrossRef]
- Carbon, C.C. Psychology of design. Des. Sci. 2019, 5, E26. [Google Scholar] [CrossRef] [Green Version]
- Park, S.J.; Choi, S.; Kim, E.J. The relationships between socio-demographic variables and concerns about environmental sustainability. Corp. Soc. Responsib. Environ. Manag. 2012, 19, 343–354. [Google Scholar] [CrossRef]
- Edinger-Schons, L.M.; Sipilä, J.; Sen, S.; Mende, G.; Wieseke, J. Are Two Reasons Better Than One? The Role of Appeal Type in Consumer Responses to Sustainable Products. J. Consum. Psychol. 2018, 28, 644–664. [Google Scholar] [CrossRef]
- Liu, C.-H. Conducting qualitative and quantitative analyses of sustainable behaviour. J. Retail. Consum. Serv. 2021, 60, 102474. [Google Scholar] [CrossRef]
- Liu, Y.; Hong, Z.; Zhu, J.; Yan, J.; Qi, J.; Liu, P. Promoting green residential buildings: Residents’ environmental attitude, subjective knowledge, and social trust matter. Energy Policy 2018, 112, 152–161. [Google Scholar] [CrossRef]
- Blanco, C.F.; Sarasa, R.G.; Sanclemente, C.O. Effects of visual and textual information in online product presentations: Looking for the best combination in website design. Eur. J. Inf. Syst. 2010, 19, 668–686. [Google Scholar] [CrossRef]
- Pettersson, I. Travelling from fascination to new meanings: Understanding user expectations through a case study of autonomous cars. Int. J. Des. 2017, 11, 11. [Google Scholar]
- Becattini, N.; Borgianni, Y.; Cascini, G.; Rotini, F. Investigating users’ reactions to surprising products. Des. Stud. 2020, 69, 100946. [Google Scholar] [CrossRef]
- Puska, P. Does Organic Food Consumption Signal Prosociality? An Application of Schwartz’s Value Theory. J. Food Prod. Mark. 2018, 25, 207–231. [Google Scholar] [CrossRef]
- Zins, C. Conceptual approaches for defining data, information, and knowledge. J. Am. Soc. Inf. Sci. Technol. 2007, 58, 479–493. [Google Scholar] [CrossRef]
- Nematchoua, M.K.; Tchinda, R.; Orosa, J.A. Thermal comfort and energy consumption in modern versus traditional buildings in Cameroon: A questionnaire-based statistical study. Appl. Energy 2014, 114, 687–699. [Google Scholar] [CrossRef]
- Verso, V.R.M.L.; Fregonara, E.; Caffaro, F.; Morisano, C.; Peiretti, G.M. Daylighting as the Driving Force of the Design Process: From the Results of a Survey to the Implementation into an Advanced Daylighting Project. J. Daylighting 2014, 1, 36–55. [Google Scholar] [CrossRef] [Green Version]
- Loures, L.; Panagopoulos, T.; Burley, J.B. Assessing user preferences on post-industrial redevelopment. Environ. Plan. B Plan. Des. 2015, 43, 871–892. [Google Scholar] [CrossRef]
- Meireles, I.; Sousa, V.; Adeyeye, K.; Silva-Afonso, A. User preferences and water use savings owing to washbasin taps retrofit: A case study of the DECivil building of the University of Aveiro. Environ. Sci. Pollut. Res. 2017, 25, 19217–19227. [Google Scholar] [CrossRef] [PubMed] [Green Version]
- Hosseini, S.A.; Yazdani, R.; de la Fuente, A. Multi-objective interior design optimization method based on sustainability concepts for post-disaster temporary housing units. Build. Environ. 2020, 173, 106742. [Google Scholar] [CrossRef]
- Adeel, A.; Notteboom, B.; Yasar, A.; Scheerlinck, K.; Stevens, J. Sustainable Streetscape and Built Environment Designs around BRT Stations: A Stated Choice Experiment Using 3D Visualizations. Sustainability 2021, 13, 6594. [Google Scholar] [CrossRef]
- Blasberg, L.A. Business Models for Smart Sustainability: A Critical Perspective on Smart Homes and Sustainability Transitions. In Business Models for Sustainability Transitions; Palgrave Macmillan: Cham, Switzerland, 2021; pp. 273–302. [Google Scholar] [CrossRef]
- Seo, M.; Kim, S. A Comparative Evaluation of Utility Value Based on User Preferences for Urban Streets: The Case of Seoul, Korea. Sustainability 2021, 13, 5073. [Google Scholar] [CrossRef]
- Toboso-Chavero, S.; Madrid-López, C.; Durany, X.G.; Villalba, G. Incorporating user preferences in rooftop food-energy-water production through integrated sustainability assessment. Environ. Res. Commun. 2021, 3, 065001. [Google Scholar] [CrossRef]
- Švajlenka, J.; Kozlovská, M. Perception of the Efficiency and Sustainability of Wooden Building. In Efficient and Sustainable Wood-Based Constructions; Springer: Berlin/Heidelberg, Germany, 2022; pp. 35–57. [Google Scholar]
- Berni, A.; Borgianni, Y. Making Order in User Experience Research to Support Its Application in Design and Beyond. Appl. Sci. 2021, 11, 6981. [Google Scholar] [CrossRef]
- Pregernig, M.; Rhodius, R.; Winkel, G. Design Junctions in Real-World Laboratories: Analyzing Experiences Gained from the Project Knowledge Dialogue Northern Black Forest. GAIA-Ecol. Perspect. Sci. Soc. 2018, 27, 32–38. [Google Scholar] [CrossRef]
- Xiao, N.; Lee, S.H.M. Brand identity fit in co-branding: The moderating role of CB identification and consumer coping. Eur. J. Mark. 2014, 48, 1239–1254. [Google Scholar] [CrossRef]
- Giacalone, D.; Jaeger, S. Better the devil you know? How product familiarity affects usage versatility of foods and beverages. J. Econ. Psychol. 2016, 55, 120–138. [Google Scholar] [CrossRef]
- López-Forniés, I.; Sierra-Pérez, J.; Boschmonart-Rives, J.; Gabarrell, X. Metric for measuring the effectiveness of an eco-ideation process. J. Clean. Prod. 2017, 162, 865–874. [Google Scholar] [CrossRef]
- Kim, Y.; Oh, K. Effects of Perceived Sustainability Level of Sportswear Product on Purchase Intention: Exploring the Roles of Perceived Skepticism and Perceived Brand Reputation. Sustainability 2020, 12, 8650. [Google Scholar] [CrossRef]
- Landis, J.R.; Koch, G.G. An Application of Hierarchical Kappa-type Statistics in the Assessment of Majority Agreement among Multiple Observers. Biometrics 1977, 33, 363–374. [Google Scholar] [CrossRef] [PubMed]
- Khamis, H. Measures of association: How to choose? J. Diagn. Med. Sonogr. 2008, 24, 155–162. [Google Scholar] [CrossRef] [Green Version]
- Deuble, M.P.; de Dear, R.J. Green occupants for green buildings: The missing link? Build. Environ. 2012, 56, 21–27. [Google Scholar] [CrossRef]
- Kim, M.J.; Oh, M.W.; Kim, J.T. A method for evaluating the performance of green buildings with a focus on user experience. Energy Build. 2013, 66, 203–210. [Google Scholar] [CrossRef]
- Earl, P.E. Lifestyle changes and the lifestyle selection process. J. Bioecon. 2016, 19, 97–114. [Google Scholar] [CrossRef]
Publisher’s Note: MDPI stays neutral with regard to jurisdictional claims in published maps and institutional affiliations. |
© 2022 by the authors. Licensee MDPI, Basel, Switzerland. This article is an open access article distributed under the terms and conditions of the Creative Commons Attribution (CC BY) license (https://creativecommons.org/licenses/by/4.0/).