Abstract
Transit-Oriented Development (TOD) assessment models are commonly used to assess existing and planned metro station catchment areas. Elements like diversity, density, design, destination, distance, and demand management are considered in the 6Ds TOD assessment model. Assessment of these elements in the designing stage depends on the TOD expert’s involvement to ensure the effectiveness of the model. The aim of this research is to develop novel pre-TOD assessment guidelines that consist of Spatial Analysis, Virtual Function of Transit Station (VFTS), and Estimated Spatial Analysis, which can improve the reliability of the assessment conclusion according to the 16 planning elements. The research applies three methodologies: (1) analytical approach to evaluate the TOD concept and its assessment model; (2) development of pre-TOD assessment guidelines using the Delphi technique; and (3) conduct a case study of the Doha Exhibition and Convention Center metro station in Qatar to validate the developed model. The findings are a new concept, called the Dependent Component Area (DCA) of the metro station, and VFTS classifications of the metro station include an urban connector, suburban connector, destination, and destination connector. The newly developed pre-TOD assessment guidelines can enhance TOD assessment methods, especially in emerging cities. Moreover, these assessment guidelines will provide TOD and planning experts with more precise data and information related to the DCA.
1. Introduction
Transit-Oriented Development (TOD) is the foremost approach of new urbanism, urban growth, urban fill, urban regeneration, and land use distribution used to assess the post-implementation and the pre-planning stage of the catchment areas surrounding the metro station [1,2]. This approach investigates the development of the catchment areas surrounding the metro station where the TOD should occur, including the core area, and the metro station catchment area based on the role between the transit and the surrounding development [3,4,5,6].
In previous studies, the TOD catchment areas surrounding the metro station are discussed according to the walking distance, ridership prediction, and in relation to land use distribution [3]. However, these areas are called the primary zone of influence or the pedestrian catchment area, where people can walk, cycle, drive less, and use the metro station according to cover a distance of 5 to 10 min [5,7,8]. The spatial area within a radius of 400 m from the metro station is called the core area and it is equivalent to a 5-min pedestrian walking distance, while the spatial area within a radius of 800 m from the metro is called the metro station catchment area station and it is equivalent to a 10-min pedestrian walking distance and 5-min cycling distance [9]. Recent studies identified another catchment area beyond the metro station catchment area called the secondary area or area of influence [10,11]. This area is a spatial area where people intended to use bicycles, public transport, or park and ride instead of walking to reach the metro station [12].
Pan et al. [13] created three catchment areas surrounding the metro station, the first area within 500 m, the second area within 1000 m, and the third area within 2000 m from the metro station [13,14]. García-Palomares et al. [15] demonstrated that a catchment area between a radius of 400 and 2400 m from the metro station had only a small influence on the ability to predict the use of the metro station. Li et al. identified seven buffer areas (50 m, 100 m, 200 m, 400 m, 800 m, 1200 m, and 1600 m) in their research and they established a regression model based on travel behavior [16].
Safee et al. [17] defined seven planning factors to develop the metro station catchment area: (1) Community Life, (2) Sense and Identity of the Place, (3) Livability, (4) Sidewalk Pedestrian, (5) Built Environment Connection, (6) Density Size, and (7) Environment. The urban planners concluded that different metro station catchment areas have similar development characteristics in reference to these factors, and these similarities lead to understanding the urban planning context and proposing different typologies of development [18,19]. The role of TOD is to develop the catchment areas surrounding the metro station as a vibrant mixed-use with a walkable opportunity that encourages people to use public transportation [19,20]. In addition, the core area is the best context for the employment stream that should attract workers to use the metro station, while the metro station catchment area is the best context for the residence stream that should attract residents to use the metro station [14,21].
In 2010, Ewing and Cervero developed the 6Ds TOD assessment model, referring to six elements: (1) Diversity, (2) Density, (3) Design, (4) Destination, (5) Distance, and (6) Demand Management. These elements focus on four planning factors to include: (1) Land Use, (2) Streetscapes, (3) Transportation Network, and (4) Travelling Behavior [22]. The 6Ds assessment elements identified indicators that are related to different planning elements identified by experts [23]. In reviewing the literature, the studies concluded in the next section that the 6Ds assessment elements are not considered all together as required during the TOD assessment process due to the missing related information to either TOD assessment elements or the influence catchment area [22,24,25].
Accordingly, the authors in this paper utilized a new concept for the catchment areas surrounding the metro station called the Dependent Component Area (DCA) of the metro station. The DCA, as shown in Figure 1, consists of three catchment areas surrounding the metro station, the core area within a radius of 400 m from the metro station, the metro station catchment area within a radius of 800 m from the metro station, and the influence catchment area within a radius 1600 m from the metro station. This new concept of the DCA will be used as a base for the analysis of the case study.
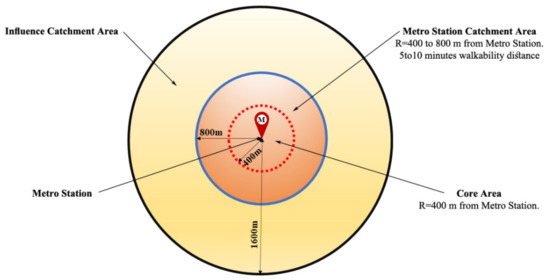
Figure 1.
The elements of the metro station Dependent Component Area (DCA).
To improve the reliability of the TOD assessment conclusion when using the 6Ds TOD assessment model by experts, this paper focuses on developing pre-TOD assessment guidelines that consist of spatial analysis, virtual function of transit station, and the estimated spatial analysis through the 16 planning elements related to the identified type of metro station.
The methodology used in this study is an explanatory sequential mixed method in research design that uses the conceptual and theoretical framework. It contains both quantitative and qualitative approaches such as a comprehensive literature review, professional interviews, research focus group, Delphi technique, and analytical hierarchy process. Additionally, it contains the instrument of data collection and the tool that will be used in the analysis of the case study related to a metro station in Qatar that will be discussed in the next sections of the paper.
2. Methodology and Materials
This study is based on three research approaches.
2.1. Analytical Approach
The analytical approach used to evaluate the literature review related to the evaluation of the TOD concept and the 6Ds TOD assessment model that will support the development of the planning factors and the 16 planning elements, based on the related Functional Assessment Criteria (FAC). The analytical study will elaborate and verify the research approach for developing the pre-TOD assessment guidelines, including the definition of VFTS type, the related spatial analysis, and the estimated spatial analysis.
2.2. Development Approach Using Delphi Technique
Semi-structured interviews with seven TOD professionals have been conducted to explore the planning factors, planning elements, VFTS type, and the proposed DCA that will be used in the pre-TOD assessment guidelines. After that interview, sessions such as face-to-face meetings and focus group meetings were conducted with 60 professionals in the Urban Planning Department in the Ministry of Municipality and Environment (since November 2021 it has become the Ministry of Municipality), and the Land Transport Planning Department in the Ministry of Transport and Communications in Qatar. The researcher follows the Delphi technique to validate the judgement related to the new concept of dependent component area and the four VFTS classifications of the metro station. In addition to identifying the planning factors, the planning elements need to be integrated with the TOD 6Ds assessment model.
2.3. Conducting Case Study Using GIS
The purpose of conducting a case study in this research is to validate the developed pre-TOD assessment guidelines. The researcher implemented the GIS in one of the existing metro stations in Doha metro network to explore the spatial analysis of the identified metro station. The analysis will investigate the required planning elements, such as land use plan, block size, population, etc., according to its criteria by using the spatial and attribute information data for the DCA. Accordingly, the GIS will provide the planning authority and urban planners with the required information for analyzing the DCA.
3. Background and Literature Review
The principles of urban planning systems are based on the analysis of urban form, urban interaction, and urban spatial structure [26]. Several studies have identified planning factors to include: (1) Transportation, (2) Road networks, (3) Buildings distribution, (4) Land use pattern, (5) Economic performance, and (6) Human behavior [26]. Urban spatial structure is the integration between the urban form and the urban interaction [27]. Planning authorities suggest a high emphasis on the urban spatial structure to represent the physical and complex context for a better understanding of the urban development [28].
TOD assessment relies on different related approaches to the DCA [29]. In USA, local governments have assessed the metro stations by the integration between the transit system and the land use development pattern [30,31]. In Asian countries, TOD assessment has been introduced as a solution to solve urban issues in terms of economy and population [32]. In the Middle East, TOD has been implemented as a planning method to solve traffic congestion [33]. Recently in Qatar, the Urban Planning Department has introduced TOD to develop the urban centers, reduce traffic congestion, and improve the quality of life for the residents [34].
The indicators of TOD assessment elements rely on the availability of the related information [35,36]. Haghshenas and Vaziri [35] introduced seven criteria, while Singh et al. [37] identified twenty-one TOD indicators. These indicators are related to the planning elements and are based on the DCA planning factors [37]. Thomas and Bertolini [38] linked the 6Ds elements to three Planning Factors: (1) Built environment, (2) Travel behavior, and (3) Transportation demand management. These planning factors offered feedback on both new and retrofitted metro station catchment areas [22,39]. The six 6Ds elements, as shown in Table 1, are defined statements by the authors that are intended to be achieved during TOD assessment as a Functional Assessment Criteria (FAC) and a set of indicators with goals and actions under each element [40,41]. These elements should be considered and analyzed during the TOD assessment process [22].

Table 1.
6Ds TOD assessment model versus functional assessment criteria and planning factors (source: Data modified from [38,39]).
The geographical location of the metro station versus the 6Ds assessment elements can be classified as shown in Table 2 [29,38]. The regional location includes many transit corridors, and the metro station catchment area serves to coordinate between land use and transportation. The corridor location includes many neighborhoods and the metro station catchment area fosters higher density, mixed-use, and walkable distance. The neighborhood location includes the metro station to integrate transportation into the urban context. The site location is the metro station, where the catchment area is oriented toward the public realm and the transit corridor, to enhance pedestrian connectivity, and create more convenient walking and cycling connections [38,42].

Table 2.
Level of impact of the 6Ds Elements within metro station catchment area according to the geographical location (source: Data modified from [38]).
Lutin and Benz [43] suggested, in their research, three types of stations based on the role they serve for passengers. These types are: (1) the line haul collector metro station, (2) the line haul distributer metro station, and (3) the transfer metro station.
The line haul collector metro station is typical for metro stations located in suburban areas where the passengers come from residential origins by walking, cycling, feeder or shuttle busses, and their own cars to park and ride.
The line haul distributer metro station is where the metro station is connected to major development projects such as central business district, a major activity center, or a suburban area.
The transfer metro station is where the metro station contends with the particular transfer volumes and patterns at different periods in the day.
The researchers in this paper conclude that by improving the reliability of the assessment conclusions done by TOD experts when using the 6Ds TOD assessment model, it can improve the effectiveness of this model. Accordingly, pre-TOD assessment guidelines that consist of planning elements linked to the elements of the 6Ds TOD assessment model based on the different types of the metro station can improve the reliability conclusion by providing the TOD experts with the adequate data to let them determine the required indicators and their corresponding weights in the TOD assessment model.
4. Developing the Pre-TOD Assessment Guidelines
This section focuses on the integration between the pre-TOD assessment guideline into the 6Ds TOD assessment model, as shown in Figure 2. The planning authority is to initiate the VFTS type based on the urban master plan or the metro network map. The spatial analysis should be explored through the related planning elements to emphasize the initiated VFTS type, followed by the investigation of the estimated spatial analysis of the 16 developed planning elements. The investigated estimated spatial analysis should be integrated into the 6Ds TOD assessment model elements.
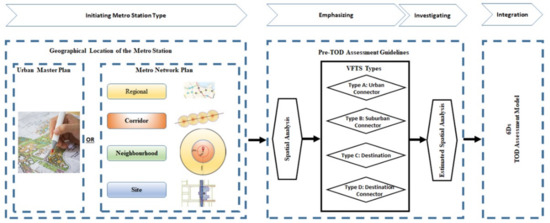
Figure 2.
The process of the pre-TOD assessment guidelines versus geographical levels and 6Ds TOD assessment model.
4.1. Planning Factors (PFs) versus Planning Elements (PEs)
Individual meetings with professionals in the planning authority were arranged to develop relevant planning factors and elements. This approach used face-to-face interviews with open discussion and questions. Table 3 presents the planning factors concluded in five planning factors with 16 related planning elements and criteria.

Table 3.
Planning factors versus planning elements.
The investigation of the 16 planning elements can be analyzed using GIS to identify the following:
- Spatial and attribute information, population statistic data, administrative boundary, land use, buildings condition, ownership, and transportation network.
- Support the location of the metro station as a point feature and create a buffer of 400 m to determine the core area, 800 m to determine the metro station catchment area, and 1600 m to determine the influence catchment area. The land use plan and cadastral data can be used to calculate the square meter size of each metro station DCA, land use distribution, and building conditions.
- Provides data related to pedestrian movements and connectivity between the metro station and the surrounding plots through the network analysis feature.
- The line feature analysis supports the specification of the shortest path from the metro station to the destination.
4.2. Spatial Analysis versus Virtual Function of Transit Station (VFTS)
The spatial analysis of specific planning elements supports urban planners to determine the initiated (VFTS) type. The VFTS of the metro station is to assess the urban functional role within the DCA. As mentioned earlier, the VFTS types of the metro station can be classified into four types, as shown in Figure 3.
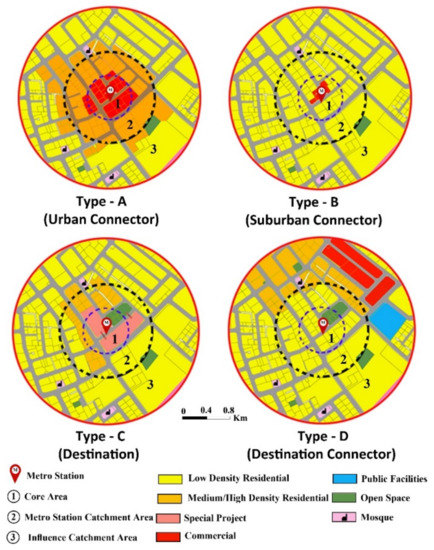
Figure 3.
Virtual Function of Transit Station (VFTS) classification.
The explored spatial analysis is based on the initiated definition of each VFTS type and related to specific planning elements, as shown in Figure 4.
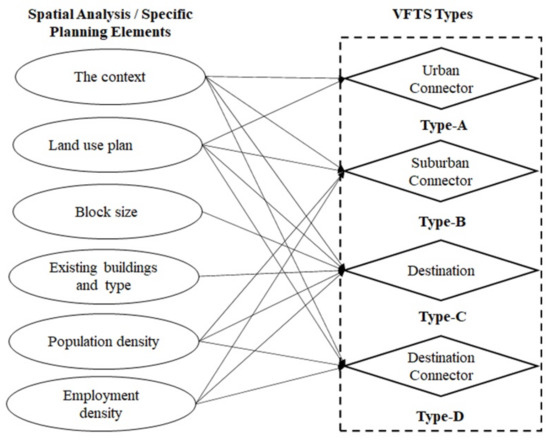
Figure 4.
The spatial analysis-specific planning elements versus the VFTS types.
- Type—A, the urban connector is where the metro station is within the metro station catchment area and should support vibrant mixed uses with high density. This type can be found in urban centers such as regional or district where the metro station catchment area highly supports walkability and accessibility and where amenities and facilities contribute to a wider public realm network. The influence catchment area within this type is lower in density than the metro station catchment area and should be considered for this type of metro station [21]. Urban planners can explore the spatial analysis for specific planning elements that correspond to the definition of type A to include (a) The context, and (b) Land use plan.
- Type—B, the suburban connector is where the metro station is predominantly within low-density residential areas with high vehicular use. In this type, the metro station catchment area can have a functional level of amenities, such as retail, to be allocated in the core area along the shortest paths used by the pedestrian. The metro station within this location has a direct connection to the pedestrians, cycle paths, and plaza that is connected to public transportation such as feeder buses, taxis, and private cars. The influence catchment area within this type is lower in density than the metro station catchment area and can be connected to the metro station through public transportations, such as feeder buses and dedicated paths for both pedestrians and cyclists. Urban planners can explore the spatial analysis for specific planning elements that correspond to the definition of type B to include (a) The context, (b) Land use plan, (c) Population density, and (d) Employment density.
- Type—C, the destination is where the metro station is connected to one or multiple mega projects such as a stadium, mall, tourist, or entertainment. The mega projects constitute a large proportion of the metro station catchment area and are located in the core area with direct access to the metro station. The metro station catchment area within this type could be low in residential density and medium to high in employment density, while the influence catchment area can be low, medium, or high residential density as per the defined concept plan and population distribution. Urban planners can explore the spatial analysis for specific planning elements that correspond to the definition of type C to include (a) The context, (b) Land use plan, (c) Block size, (d) Existing buildings and their type, (e) Population density, and (f) Employment density.
- Type—D, the destination connector is where the metro station has destination projects within a major TOD planning development within the metro station catchment area. Type D serves major adjacent destinations located within the influence catchment area, such as neighborhood, via walking routes or dedicated paths related to public transportations such as shuttle buses or trams. The influence catchment area plays an important role in the TOD assessment and can be developed as medium or high density while the metro station catchment area is developed as low density. It can be defined as urban centers or destination projects with no metro station. Urban planners can explore the spatial analysis for specific planning elements that correspond to the definition of type D to include (a) The context, (b) Land use plan, (c) Population density, and (d) Employment density.
4.3. Estimated Spatial Analysis versus 6Ds TOD Assessment Elements
The estimated spatial analysis should be investigated according to the previously identified VFTS type as an approach to be integrated into the 6Ds TOD assessment model. The 16 planning elements can be integrated into the 6Ds assessment elements, as shown in Figure 5.
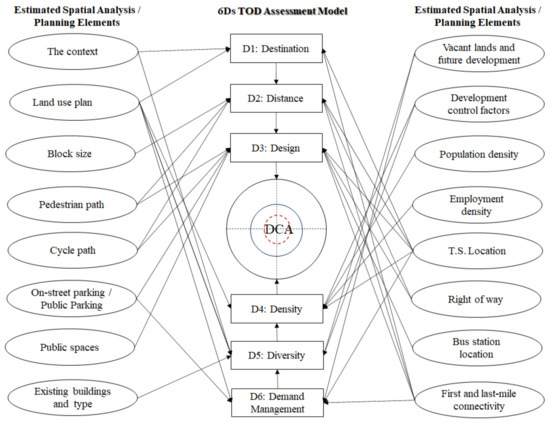
Figure 5.
The relation between the investigated estimated spatial analysis through its planning elements with the elements of the 6Ds TOD assessment model when assessing the DCA.
4.3.1. Destination
The destination is related to easy access to the attraction activities in the metro station catchment area with the shortest route distance [29]. It can be measured by the land use mixedness index [44,45]. The activities and places determine where and why people reside/travel [29,46]. The destination assessment element can be scored with reference to the investigated estimated spatial analysis for: (a) context, (b) transit station location, (c) land use plan, and (d) first and last-mile connectivity.
4.3.2. Distance
The commercial area is located within the metro station catchment area and the adjacent buildings, within the viewsheds of the metro stations [47]. The metro station should be accessed by the pedestrian path through smaller block sizes [48,49]. The distance assessment element can be scored with reference to the investigated estimated spatial analysis for: (a) transit station location, (b) block size, (c) right of way, (d) pedestrian path, (e) cycle path, and (f) first and last-mile connectivity.
4.3.3. Design
The design assessment element is related to the livability, walkability, and accessibility to the public spaces and streets within the metro station catchment area [50]. The street design will enhance the quality of life of people, provide safe connections to different modes of transportation, and foster social interaction [48]. The design assessment element can be scored with reference to the investigated estimated spatial analysis for: (a) transit station location, (b) right of way, (c) pedestrian path, (d) cycle path, (e) on-street parking/public parking, (f) public spaces, (g) bus station location, and (h) first and last-mile connectivity.
4.3.4. Density
The metro station should be affordable and functional for the people who live around it [48]. The three variables for determining the density are population, job, and business density. The density element can be assessed with reference to the investigated estimated spatial analysis of the following planning elements: (a) transit station location, (b) land use plan, (c) development control factors, (d) population density, and (e) employment density.
4.3.5. Diversity
The diversity assessment element is related to having mixed land uses, mixed affordable housing types, and different transportation modes within the metro station catchment area [51]. It is also related to social equity by providing multiple types of housing and transportation modes [52]. The diversity assessment element can be scored with reference to the investigated estimated spatial analysis for: (a) context, (b) transit station location, (c) land use plan, (d) existing buildings and types, (e) vacant lands and future development, and (f) development control factors.
4.3.6. Demand Management
The demand management assessment element is critically important for city planning and can be a decisive apparatus for urban development [53,54]. The demand management assessment element can be scored with reference to the investigated estimated spatial analysis for: (a) transit station location, (b) land use plan, (c) on-street parking/public parking, (d) vacant lands and future development, and (e) first and last-mile connectivity.
5. Validation of the Pre-TOD Assessment Guidelines Based on the 6Ds Model: The Case of DECC Metro Station
In this section, the developed pre-TOD assessment process has been applied in one of the existing metro stations located along with the Doha Metro project. The Doha operational metro network, which already exists, includes red, green, and gold lines as shown in Figure 6. The three operational lines will link all major districts to cities, ports, international airport, stadiums, and urban centers [55].
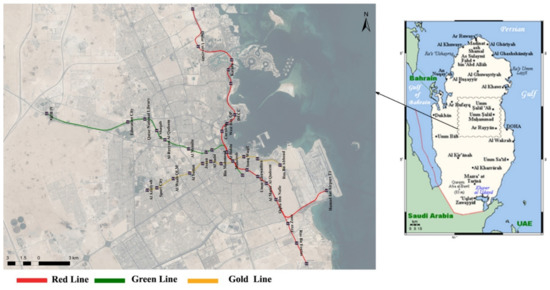
Figure 6.
Doha operational metro network.
As per government policies and strategies, the Qatar National Vision (QNV-2030) and Qatar National Development Framework (QNDF-2032), West Bay is defined as the new Central Business, Government, and Commercial District for Doha with high rise buildings. It will be the destination area for residents and international visitors in future [56,57]. The selected Doha Exhibition and Convention Centre (DECC) metro station are important to be considered as a TOD assessment case study for future implementation. DECC metro station is located in the heart of West Bay, providing access to shops, restaurants, Doha Exhibition and Convention Centre, City Centre Shopping Mall, and the surrounding offices.
5.1. Initiating the VFTS Type of DECC Metro Station
The Master Plan of Doha (2018) shown in Figure 7 indicates that the DCA of the DECC metro station is located in the West Bay district [58]. The DCA has three types of major land uses, separated from each other to include:
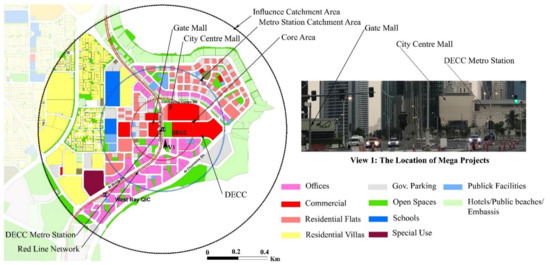
Figure 7.
Master Plan of DCA of DECC metro station.
- (a)
- The residential area consisting of villas and apartments located on the northwest and west of the influence catchment area,
- (b)
- The commercial area consisting of major retails uses allocated in the core area where DECC metro station is connected to three mega projects “the City Centre Mall, DECC, and the Gate Mall”, and the office uses located within the metro station catchment area along the Conference Centre Street, Omar Al Mukhtar Street, Al Bidda street, and Al Corniche Street, and
- (c)
- The shore area that includes the other uses such as embassies, hotels, public beaches, public facilities, etc.… located in the influence catchment area.
Therefore, the initiated VFTS type of DECC metro station is a destination (Type C).
5.2. Verification of DECC Metro Station as a Destination
In this section, the identified VFTS type of DECC will be verified by exploring spatial analysis through related planning elements for the destination metro station type including (1) The context, (2) Land use plan, (3) Block size, (4) Existing buildings and their type, (5) Population density, and (6) Employment density.
5.2.1. Spatial Analysis for the DECC Metro Station as a Destination
- Defining the context
As shown in Figure 8, the DECC metro station is located geographically along the red line of the metro network in DCA [55]. West Bay QIC metro station, which is located on the same red line and is the closest, is located within the influence catchment area of DECC metro station [55].
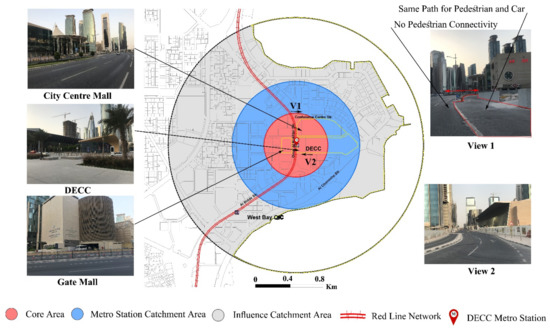
Figure 8.
Defining the context of the DECC metro station DCA.
GIS analysis shows that the DCA of the DECC metro station covers 804 ha, the metro station catchment area of 201 ha, and the influence catchment area of 603 ha, including the seawater area. This area reduces the influence catchment area to 327 ha and this should lead to a high TOD implementation compared to other influence catchment areas. The DCA is developed as mixed-use high-rise buildings with no cohesive urban design [58]. This stresses the importance of addressing a high level of walkability/Metrolink access to the core area. A radius of 400 m from DECC is the best context for the employment stream, and a radius of 800 m is the best context for residential uses. As shown in Figure 8, there are three mega projects surrounding the DECC metro station which have the ability to attract people, and where people are willing to travel [58]. The three mega projects cover more than 70% of the core area and 20% of the overall metro station catchment area. Accordingly, this should establish a high level of TOD access from the DECC metro station to these places and to the surrounding area. The DCA is still characterized by poorly planned, constructed and maintained pedestrian footways and crossings. This creates uncomfortable paths for pedestrians, as is mentioned by Qatar Pedestrian Crossing Master Plan (QPCMP), 2017 [59]. To mitigate these concerns within the timeframe of the World Cup 2022 event, the Ministry of Municipality (MM) initiated the Central Doha Development Strategy (CDDS) project that improves street activation and the public realm before the 2022 event.
- 2.
- Land use plan
The land use plan of the DCA was set out in the Municipal Spatial Development Plan, 2018 [58]. The area was divided into three predominant uses, which are as follows:
- Commercial area: where major offices and retail land uses are concentrated in the core area and located partially within the metro station catchment area.
- Residential area: where apartments and villas land uses are concentrated in the influence catchment area and located partially in the metro station catchment area.
- Shore area: where other uses such as embassies, hotels, public beaches, and related facilities are spread along the northern and eastern coastal strip in the influence catchment area. These uses in this area are proposed to provide local attractions rather than serve regional needs.
The detailed land use distribution within the DCA of the DECC metro station is shown in Figure 9. The highest distribution of commercial and government office uses is concentrated in the core area and within the metro station catchment area. This distribution of uses assesses the TOD concept through these destination commercial projects surrounding the DECC metro station.
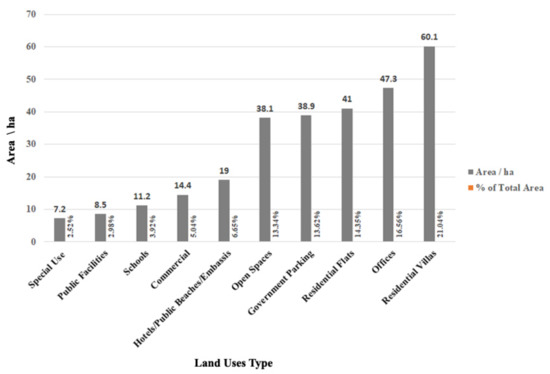
Figure 9.
Land uses distribution area and its percentage within the DCA of the DECC metro station.
- 3.
- Block size
The total number of plots within the DCA is 797 plots with a net plot area of 413 ha, in the influence catchment area there are 563 plots with a net plot area of 246 ha, and in the metro station catchment area there are 234 plots with a net plot area 167 ha. The block sizes within the DCA of the DECC metro station have been classified according to their areas, as shown in Figure 10. Most of the built blocks consist of plots 30 × 30 m for villas development, and plots 50 × 50 m for flats and offices development. The highest block sizes are concentrated in the core area, the City Centre mall 8.7 ha, the DECC 12.4 ha, and the Gate Mall 2.4 ha. These plot dimensions are not consistent with the TOD concept, because they do not support the diversity and the design 6Ds elements by creating places along with the transit links that can be accessible by a multi-range of mobility needs, and by encouraging a vibrant mix of uses that create a walkable and a diverse neighborhood.
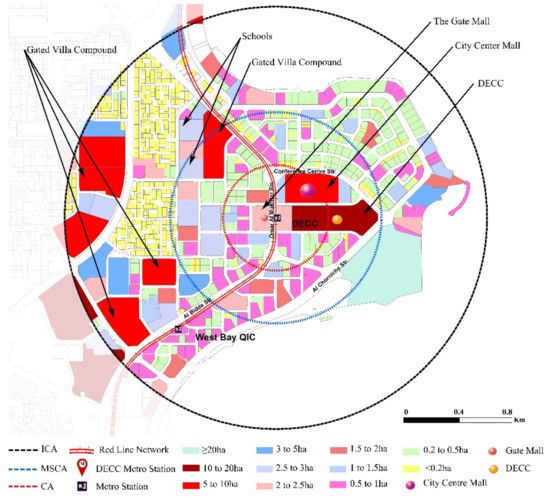
Figure 10.
Plot distribution areas within DCA of the DECC metro station.
- 4.
- Existing buildings and their type
Building types in the DCA of DECC station are classified into government buildings and private office buildings (concentrated in the metro station catchment area), three mega project buildings, two malls, and one exhibition (within the core area), while the residential villas and flats, public facilities, and schools are concentrated in the influence catchment area. As shown in Figure 11, the City Centre Mall building height is 4 stories, the North Gate Mall is 20 stories, the DECC building is 2 stories, the single residential building is 3 stories, the multi-residential and office buildings height is above 15 stories, and the school height is between 3 and 4 stories.
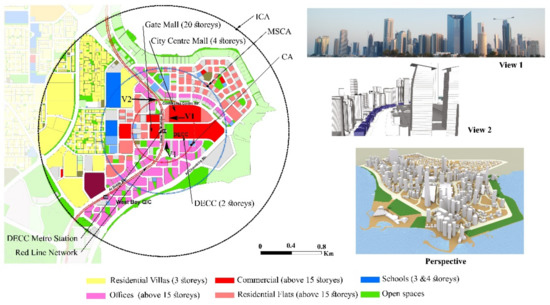
Figure 11.
Existing building heights within DCA of the DECC metro station.
- 5.
- Population density
The current residential population distributed within 361 ha in the DCA has been estimated at 10,000 people [60]. In 2032, the estimated resident population as projected in the QNDF study should reach 60,000 people. This population will be distributed in two residential locations within the DCA, in the west area the population will reach 30,500 people, while in the north area it will reach 29,500 people, as shown in Figure 12. Accordingly, the residential distribution in the influence catchment area will be concentrated as low density in the west part of the influence catchment area and high density in the north part of the influence catchment area, while in the metro station catchment area the residential distribution will be partially concentrated as high density in the north and west part of the metro station catchment area. The overall population density in the DCA (501.5 ha) will be 120 persons/ha [56].
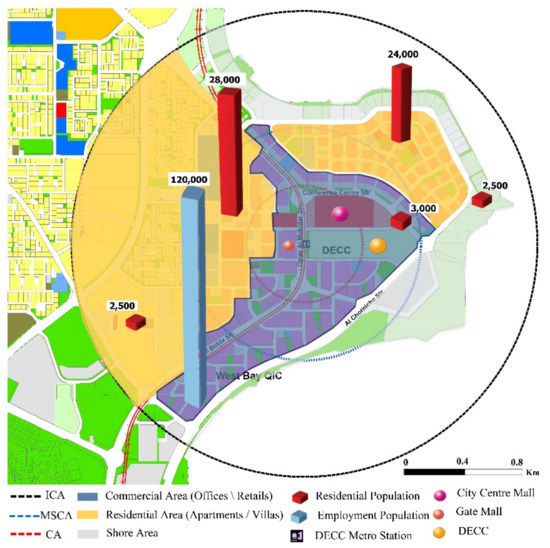
Figure 12.
Population distribution per zone within DCA of the DECC metro station.
- 6.
- Employment density
The current employment population distributed in an area covering 140 ha was 13,000 people [60]. As projected in the QNDF study, the total employment population will reach 120,000 in 2032. Accordingly, the employment density in the DCA (501.5 ha) will be 239 person/ha Figure 12 and will be concentrated in the metro station catchment area and partially in the influence catchment area [56].
5.2.2. Establishing the Metro Station Type—VFTS
The spatial analysis conducted has concluded that the type of the DECC metro station is a destination type according to the consistency of spatial analysis output with the initiated definition of the destination type. Examining the spatial analysis through specific planning elements shows:
- The context justifies how the special mega projects such as City Centre Mall, the DECC, and the Gate Mall play an important role within metro station catchment area as destination projects, although these projects constitute a large proportion of the metro station catchment area and are directly connected to the DECC metro station.
- The land use distribution, such as commercial and office uses, are concentrated in the metro station catchment area, and the residential uses such as apartments and villas are concentrated in the influence catchment area.
- The block size of the mega projects covers 70% of the core area and 20% of the metro station catchment area.
- The existing buildings and their types indicate that the government and private offices and the commercial are concentrated in the metro station catchment area, while the residential and public facilities and other uses are concentrated in the influence catchment area.
- The population density within the DCA is low to high density and it is concentrated in the influence catchment area more than the metro station catchment area.
- The employment density within the metro station catchment area is determined as high density, while it is low density in the influence catchment area.
5.3. Results and Findings for the DECC Metro Station Based on the Estimated Spatial Analysis Investigation
The estimated spatial analysis of the 16 planning elements for the DECC metro station should be investigated in reference to the integration with the 6Ds TOD assessment elements as follows.
5.3.1. Defining the Context
The new context of the DCA of the DECC metro station has to consider the West Bay concept plan, as shown in Figure 13. The concept plan is required as guidance for the future development and enhancement of the West Bay. It classifies the West Bay into different use areas such as beach, residential, business, central station, etc. The concept plan supports the DECC metro station as a destination type, and it also enhances the public realm in this area [52]. The Qatar National Development Framework (QNDF) 2032 recommends developing this area as a high-rise business district [56]. As per the defined relationship between the context element with the destination and diversity elements in the 6Ds TOD model, the recommended actions to be considered by experts can be concluded as follows:
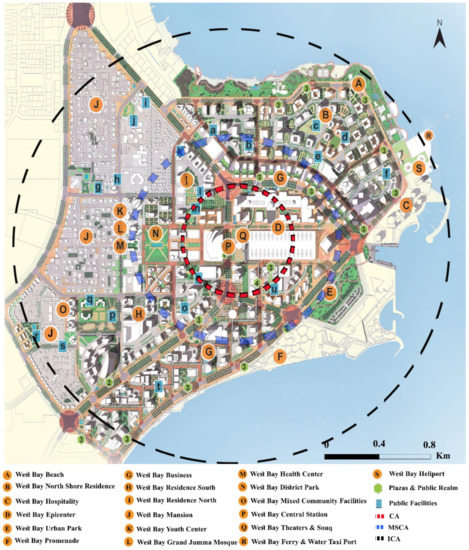
Figure 13.
West Bay Concept Plan.
- Provide public accessibility between the three destination projects and the DECC metro station.
- The density within this area must be consistent with the concept plan [56,58].
- The redistribution of the uses must be considered within this area by providing a mix of housing types and a mix of land uses.
- This area must be a livable core area by providing well-designed pedestrian and cycle paths to connect the DECC metro station with the surrounding development within the shortest route distance.
5.3.2. Land Use Plan
It is concluded by spatial analysis of the West Bay land use plan of the DECC metro station that DCA is classified into different land use areas and each area cannot be developed as a mixed-use, although the residential development in the core area is less than 5% and the commercial retails and offices development reach 95%. Since the land use has a relationship with the 6Ds, TOD model elements include destination, density, diversity, and demand management. The recommended actions to be considered by experts can be concluded as follows:
- The land use plan within the metro station catchment area can be reconsidered as a vibrant mixed-use with walkable opportunity instead of individual use.
- The mixed-use has to be reconsidered in the DCA to have 75% commercial and offices and 25% of residential apartments in the core area and to have 25% of the (commercial retails and offices) and 75% of residential apartments beyond the core area and within the metro station catchment area.
- In the influence catchment area, the distribution of the land use should respect the concept plan that allocates the residential uses (apartments and villas) and the other uses such as public facilities, schools, etc.… within this area [58].
5.3.3. Block Size
It is concluded by spatial analysis that the three mega projects constitute a huge block size in the core area, and most of these blocks contain long solid walls. Beyond the core area within the metro station catchment area, there are plots with an area above 2.5 ha, and one of these plots was developed as a gated villa compound with along solid fence. Since the block size element has a relationship with the distance as one of the 6Ds TOD model elements, the recommended actions to be considered by experts can be concluded as follows:
- The government blocks facing the City Centre Mall on the north side can be merged and redeveloped as retail uses that support the offices and the residential uses within this area. This will lead to livable places along with the transit links within the metro station catchment area and with the shortest path from the metro station, as shown in Figure 14.
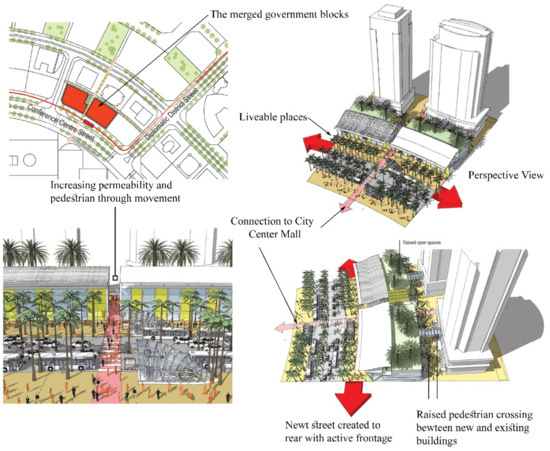 Figure 14. Retrofitting the Block Size.
 - It is recommended not to have a long solid wall in the metro station catchment area that affects the performance of walkability.
5.3.4. Pedestrian Path/Cycle Path
According to the pedestrian path and the cycle path relationship with the distance and design elements in the 6Ds TOD model, there is a lack of pedestrian and cycle paths that connect different locations within the metro station catchment area. The pedestrian and cycle paths, as per QPCMP 2017, should be a priority within the DCA and they must consider the movement and the passenger experience within this area with no obstacle to their movement. They have to be efficient, usable, and easy to access. Accordingly, the pedestrian paths should be fully supported, enabling connections to destinations that are convenient, comfortable, legible, attractive, and inclusive, as shown in Figure 15.
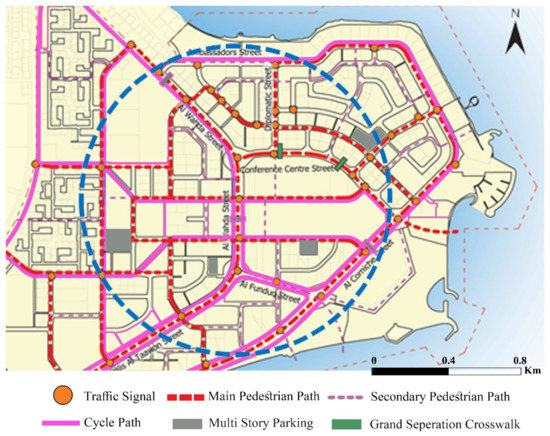
Figure 15.
Connectivity and Walkability Existing and Proposed.
5.3.5. On-Street Parking/Public Parking
It is better to reduce the on-street parking and the public parking within the metro station catchment area of DECC metro station. This can be reached if multi-story car parking is provided in a different location within this area with the shortest distance to the station and the surrounding destination development. Figure 15 shows the location of lands that can be developed as multi-story car parking.
5.3.6. Public Spaces
As shown in Figure 15, there is a lack of public open spaces in the DCA of DECC metro station, especially within the residential land use, and most of the government lands are leased to the owners of the adjacent lots to be used as surface and basement parking [58]. It is important to address the public realm to provide more public open spaces within the residential area.
5.3.7. Exiting Buildings and Their Type
The tallest buildings in the city of Doha exist within the DCA of the DECC metro station. It is recommended to provide multiple types of housing within the DCA. Further increasing building height within this area is not acceptable, as per the concept plan [58].
5.3.8. Vacant Lands and Future Development
Most of the vacant land in the DCA of DECC metro station is owned by the government. Therefore, there is a potential for new development to support the existing development to meet the concept of TOD in future. These lands should be redeveloped as multi-story car parking or open spaces with small retail that can be consistent with the TOD concept.
5.3.9. Development Control Factors
Building height, covered area, and floor area ratio (FAR) should be limited within the metro station catchment area according to the West Bay concept plan. Due to the continuous development of the area, this should be considered within the influence catchment area [58]. It is recommended to restudy the development control factors to be consistent with other planning elements in terms of the concept of TOD.
5.3.10. Population Density
Since the total residential population within the metro station catchment area did not reach the projected population in 2032 [58], it is recommended to reconsider the population distribution within the DECC metro station DCA according to the criteria determined in the density element in the 6Ds TOD model by concentrating the population density within the metro station catchment area to be medium to high density, while in the influence catchment area it could be low to medium, as is provided in the West Bay concept plan.
5.3.11. Employment Density
Since the total employment population within the metro station catchment area did not reach the projected employment population in 2032 [58], the easiest and shortest way to meet this projection according to the criteria determined in the density element within the 6Ds TOD model is by concentrating this population in the core area by providing different commercial and offices uses.
5.3.12. Transit Station Location
Connecting the DECC metro station with its DCA is a fundamental requirement to achieve a stress-free passenger experience when transitioning to and from the metro station [61]. The DECC metro station is connected with the underground level by the Gate Mall, and with the ground level through its public realm by the Doha Exhibition and Convention Centre and the City Centre Mall as shown in Figure 16. However, as per the defined relationship between transit station location elements with all the elements in the 6Ds model, it is considered to connect the public realm of the metro station with all the surrounding development by pedestrian and cycle paths.
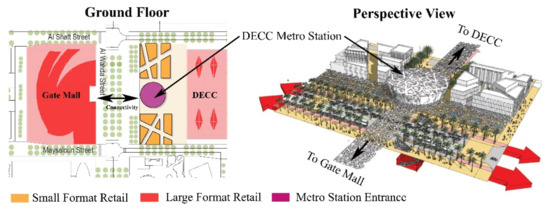
Figure 16.
Connectivity Between the DECC Metro Station and its Surrounding.
5.3.13. Right of Way
Most of the street network within the DECC metro station DCA is redeveloped to meet the new public realm, which includes cycle and pedestrian paths according to the road cross-sections as shown in Figure 17. Since the right of way element has a relationship with the distance and design elements in the 6Ds TOD model, the recommended actions to be considered by experts can be concluded as follows:
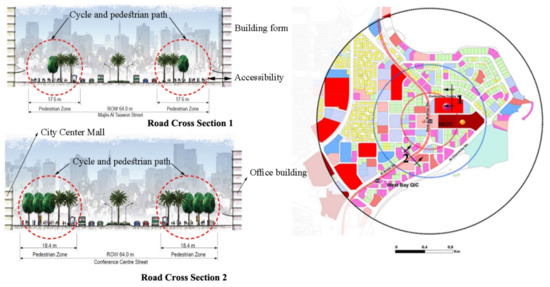
Figure 17.
Street Network Cross section.
- All the roads must support pedestrian/cycling-oriented amenities.
- Consider the building form and accessibility.
- Consider the public realm and street furniture.
- Provide transportation varieties with fine-grained street networks within the CA if possible. Additionally, in the north part facing the City Center Mall where the residential area is concentrated within the metro station catchment area, the same criteria must be applied.
5.3.14. Bus Station Location
The public transportation in the DECC metro station DCA consists of Karwa buses and taxis. Within this area, there is a dedicated bus station location and taxi location determined by the Ministry of Transport, as shown in Figure 18. As per the conclusion earlier to amend land use within the DCA, it is recommended to redistribute the bus stations according to the land use distribution and the walkability distance to and from the DECC metro station and its surrounding destination developments.
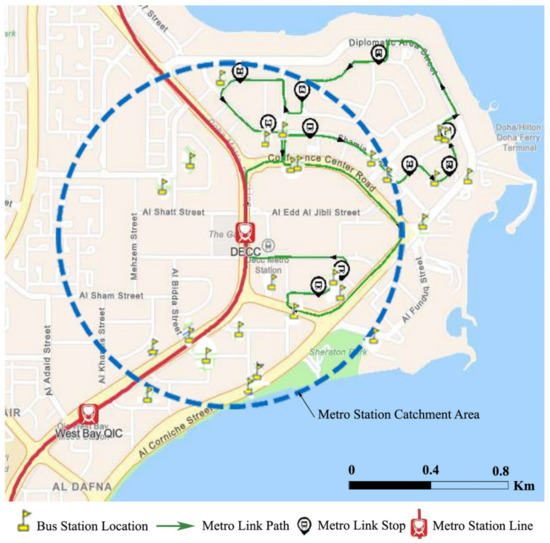
Figure 18.
Bus Network and Metrolink Network.
5.3.15. First and Last-Mile Connectivity
In the DCA, Qatar Rail provides buses and cars that follow a dedicated path called Metro link, as shown in Figure 18. This kind of transportation is free for passengers who want to use it to reach the DECC metro station. However, as per the defined relationship between the first and last-mile connectivity element with all the elements in the 6Ds model, it is recommended to provide some transportation alternative to link the different land uses with the DECC metro station to support the TOD concept. It is recommended to have more sustainable alternatives, such as tram or dedicated bus lanes, within the metro station catchment area.
6. Discussion of the Results
The findings of the preceding case study of the DECC Metro station shows that the determination of the type of metro station depends on specific planning elements and not on the Master Plan of Doha (2018). In addition, establishing the type of metro station will support the planning authority to investigate the estimated spatial analysis (ESA) for the 16 planning elements that will be connected to the 6Ds TOD assessment elements, as mentioned in Figure 19.
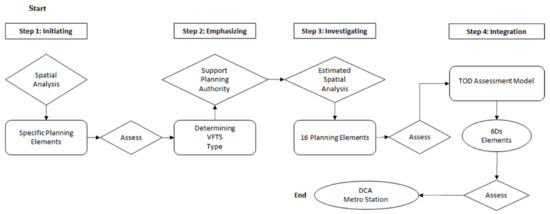
Figure 19.
The whole process of the pre-TOD assessment guidelines.
It is proved through the DECC case study that with the pre-TOD assessment guidelines, the new development/redevelopment of the sites within its DCA based on the ESA would show the potential that can be utilized to support the TOD with more users and activities. The result of the case also implies that the pre-TOD assessment guidelines have the flexibility to deal with any kind of TOD assessment model.
The pre-TOD assessment guideline plays a significant role in improving the DECC metro station’s function and development within its DCA. This role is defined through the 16 planning elements. The pre-TOD assessment also enhances the understanding of the roles of the DECC metro station DCA in directing the changes that should be done to the existing development to be consistent with the 6Ds TOD concept and function. It also supports the TOD expert with enough information related to the metro station and its DCA that can help to determine the required indicators and their corresponding weights that will be used in assessing the DCA and to measure the TOD performance within these areas.
7. Contribution of the Research
The pre-TOD assessment guidelines also aim to assist stakeholders, including planning authorities’ government, transit agencies, and private developers, to better understand what successful TOD means to all entities involved. It directly affects the TOD aspects, its criteria, and the related indicators in any TOD assessing model.
VFTS, which is part of the pre-TOD design guidelines, is the contribution of this research since it provides the experts with the needed information to limit the factor of error while increasing their reliability in determining the 6Ds indicators.
VFTS concept can lead urban planners and experts to develop different TOD typologies for the core area, the metro station catchment area, and the influence catchment area. Besides, if the metro station type is a destination or destination connector, in this case, the influence catchment area could be considered a supportive area for the TOD assessment.
8. Conclusions
This research started with the observation of the literature review regarding the TOD approaches for investigating the TOD assessment of the metro station catchment area. The researcher investigates the limitation of the metro station catchment area, which was originally defined as between 400 m to 800 m according to the walkability distance between 5 to 10 min. In addition, this area is directed by most TOD experts to be developed as a mixed-use development with a high density of employment and people. Accordingly, this means that if the metro station catchment area is not developed as mixed-use, the metro station and its catchment area cannot be defined as a TOD. However, the researcher briefly discusses the 6Ds assessment models with their related elements and concluded that the effectiveness of this model depends on expert involvement in assessing these elements.
The purpose of this research is to develop pre-TOD assessment guidelines that can improve the effectiveness of the 6Ds TOD assessment model by improving the reliability of the assessment conclusions according to the 16 planning elements. To address this issue, the researcher deduces the following findings:
- Adding a new area beyond the metro station catchment area called the influence catchment area with a radius of 1.6 km from the metro station. The overall catchment areas surrounding the metro station are named by the researcher as “dependent component area” that consist of three consecutive areas from the metro station. The determination of these catchment areas is based on the integration between the metro station accessibility, the land use, and the transportation according to the travel modes of users, starting from the vulnerable ones (pedestrians), cyclists, and vehicles. These areas are respectively from the metro station, the core area within 400 m, the metro station catchment area between 400 m to 800 m, and the influence catchment area between 800 m to 1600 m.
- Developing pre-TOD assessment guidelines that can assess the 6Ds TOD assessment model through its elements when assessing the DCA of the metro station. The assessment guidelines consist of spatial analysis, VFTS types, and the estimated spatial analysis.
- Identifying, as per the literature review, the planning factors and their related 16 planning elements that will be used partially in the spatial analysis, and the estimated spatial analysis.
- Classifying the metro stations into four types concerning the virtual function it plays within the DCA. These classifications are the urban connector, suburban connector, destination, and destination connector. The VFTS types for each metro station are determined by exploring the spatial analysis of the DCA of the metro station based on specific planning elements defined for each type.
- Establishing the relationship between the elements in the 6Ds TOD assessment model and the defined 16 planning elements according to the functional assessment criteria for each element.
- The output of the pre-TOD assessment guidelines provides experts with the investigated estimated spatial analysis through the 16 planning elements according to the VFTS type definition. The ESA assesses experts with adequate data to let them determine the required indicators and their corresponding weights in the TOD assessment model.
- Integrating pre-TOD assessment guidelines with the 6Ds TOD assessment model follows four steps: Initiating metro station type, Emphasizing, Investigating, and Integration.
The researcher uses the methods of face-to-face meetings and the focus groups meetings with selected groups of professionals and experts in Qatar from the planning department, transportation department, and Qatar Rail to validate the DCA concept, and to identify the required planning factors and the planning elements that will be integrated with the pre-TOD assessment guidelines.
As a proof and validation of the pre-TOD design guidelines, the researchers chose the Doha Exhibition and Convention Center metro station, located in Qatar, as a case study for analysis and validation of the assessment guidelines.
When applying pre-TOD assessment guidelines to the case study, we have validated that the process will improve the reliability of the assessment conclusions that can be used by TOD experts when assessing the DCA of the DECC metro station using any TOD assessment model.
9. Future Work
This pre-TOD assessment guideline will provide the basis to develop an automated GIS application to assess the post-implementation and pre-planning stages of the metro station catchment area more effectively. This will ease the determination of its effect on the TOD assessment model, its criteria, its indicators, and their corresponding weights used when assessing the DCA.
Author Contributions
The authors contributed to this research study as follows: conceptualization, M.J.; methodology, M.J., H.I., M.F.K. and M.S.F.; software, M.J.; validation, M.J., M.F.K., H.I., M.S.F. and M.I.; formal analysis, M.J. and M.F.K.; investigation, M.J.; resources, M.J.; data curation, M.J.; writing—original draft preparation, M.J.; writing—review and editing, M.J., M.F.K., H.I., M.S.F. and M.I.; visualization, M.J.; supervision, M.F.K. and H.I.; project administration, M.J. and M.F.K.; funding acquisition, M.S.F. All authors have read and agreed to the published version of the manuscript.
Funding
This publication was made possible by the NPRP grant (NPRP 12S-0304-190230) from the Qatar National Research Fund (a member of the Qatar Foundation).
Institutional Review Board Statement
Not applicable.
Informed Consent Statement
Not applicable.
Data Availability Statement
All data, models, and code generated or used during the study appear in the submitted article, and the related PhD dissertation done by the author Mohuiddin Jamaleddin.
Acknowledgments
The authors would like to acknowledge the support of Qatar University in providing a work environment which facilitates and motivates scientific research. This research study was developed as a part of the ongoing PhD dissertation at Qatar University/College of Engineering/Architecture and Urban Planning under the title of: “The Potential Impact of TOD on Urban Characteristics: The Case of Metropolitan Doha, Qatar”. The authors would like to thank the key professional people working in governmental agencies and municipalities in Qatar, specifically those in the Ministry of Municipality (MM), the Ministry of Transport (MOT), and the Qatar Rail. Their cooperation and collaboration with the authors were crucial in the development of this research study. This included meetings; the provision of visual materials, guidelines, and frameworks; and discussion of future plans. Finally, the authors would like to thank the reviewers and editors for their invaluable feedback. The authors are solely responsible for the statements made herein.
Conflicts of Interest
The authors declare no conflict of interest.
References
- Cervero, R.; Murphy, S.; Ferrell, C.; Goguts, N.; Tsai, Y.-H.; Arrington, G.B.; Boroski, J.; Smith-Heimer, J.; Golem, R.; Peninger, P.; et al. Transit-Oriented Development in the United States: Experiences, Challenges, and Prospects; Transportation Research Board: Washington, DC, USA, 2004; Volume 102. [Google Scholar]
- Mu, R.; de Jong, M. Establishing the conditions for effective transit-oriented development in China: The case of Dalian. J. Transp. Geogr. 2012, 24, 234–249. [Google Scholar] [CrossRef]
- Tong, X.; Wang, Y.; Chan, E.H.W.; Zhou, Q. Correlation between Transit-Oriented Development (TOD), Land Use Catchment Areas, and Local Environmental Transformation. Sustainability 2018, 10, 4622. [Google Scholar] [CrossRef]
- Zhang, M. A Chinese approach to “transit oriented development” (TOD). In Handbook on Transport and Urban Transformation in China; Chen, C.-L., Pan, H., Shen, Q., Wang, J.J., Eds.; Edward Elgar Publishing: Cheltenham, UK; Northampton, MA, USA, 2020; p. 480. [Google Scholar]
- Higgins, C.D.; Kanaroglou, P.S. A latent class method for classifying and evaluating the performance of station area transit-oriented development in the Toronto region. J. Transp. Geogr. 2016, 52, 61–72. [Google Scholar] [CrossRef]
- Guerra, E.; Cervero, R. Is a Half-Mile Circle the Right Standard for TODs? University of California Transportation Center: Berkeley, CA, USA, 2013. [Google Scholar]
- Li, S.; Lyu, D.; Huang, G.; Zhang, X.; Gao, F.; Chen, Y.; Liu, X. Spatially varying impacts of built environment factors on rail transit ridership at station level: A case study in Guangzhou, China. J. Transp. Geogr. 2020, 82, 102631. [Google Scholar] [CrossRef]
- Jones, C.E.; Ley, D. Transit-oriented development and gentrification along Metro Vancouver’s low-income SkyTrain corridor. Can. Geogr./Le Géogr. Can. 2016, 60, 9–22. [Google Scholar] [CrossRef]
- Jun, M.-J.; Choi, K.; Jeong, J.-E.; Kwon, K.-H.; Kim, H.-J. Land use characteristics of subway catchment areas and their influence on subway ridership in Seoul. J. Transp. Geogr. 2015, 48, 30–40. [Google Scholar] [CrossRef]
- Nigro, A.; Bertolini, L.; Moccia, F.D. Land use and public transport integration in small cities and towns: Assessment methodology and application. J. Transp. Geogr. 2019, 74, 110–124. [Google Scholar] [CrossRef]
- Kodukula, S. Integrating Land Use Planning and Urban Transport for Low Carbon Cities. In Proceedings of the Environmentally Sustainable Transport Forum, Ulaanbaatar, Mongolia, 2–5 October 2018. [Google Scholar]
- Chen, W.; Chen, X.; Chen, J.; Cheng, L. What factors influence ridership of station-based bike sharing and free-floating bike sharing at rail transit stations? Int. J. Sustain. Transp. 2022, 16, 357–373. [Google Scholar] [CrossRef]
- Pan, H.; Li, J.; Shen, Q.; Shi, C. What determines rail transit passenger volume? Implications for transit oriented development planning. Transp. Res. D Transp. Environ. 2017, 57, 52–63. [Google Scholar] [CrossRef]
- Li, S.; Yang, H.; Zhang, G.; Ling, Z.; Xiong, Y.; Li, Y. What is the best catchment area of a metro station? A study based on station level ridership modeling. In Proceedings of the 2019 5th International Conference on Transportation Information and Safety (ICTIS), Liverpool, UK, 14–17 July 2019; pp. 1239–1244. [Google Scholar]
- García-Palomares, J.C.; Ribeiro, J.S.; Gutiérrez, J.; Marques, T.S. Analysing proximity to public transport: The role of street network design. Bol. Asoc. Geógr. Esp. 2018, 76, 102–130. [Google Scholar] [CrossRef]
- Yang, H.; Li, X.; Li, C.; Huo, J.; Liu, Y. How do different treatments of catchment area affect the station level demand modeling of urban rail transit? J. Adv. Transp. 2021, 2021, 2763304. [Google Scholar] [CrossRef]
- Safee, F.A.; Yunos, M.Y.M.; Ismail, S.; Ariffin, N.F.M.; Isa, N.K.M. Establishing Elements of a Good City Planning: An Analysis of City Planning Theories. J. Teknol. 2015, 75, 101–105. [Google Scholar] [CrossRef][Green Version]
- Laaly, S.; Jeihani, M.; Lee, Y.-J. A multiscale, transit-oriented development definition based on context-sensitive paradigm. Transp. Res. Rec. 2017, 2671, 31–39. [Google Scholar] [CrossRef]
- Calthorpe, P. The Next American Metropolis: Ecology, Community, and the American Dream; Princeton Architectural Press: New York, NY, USA, 1993. [Google Scholar]
- Jamme, H.-T.; Rodriguez, J.; Bahl, D.; Banerjee, T. A Twenty-Five-Year Biography of the TOD Concept: From Design to Policy, Planning, and Implementation. J. Plan. Educ. Res. 2019, 39, 409–428. [Google Scholar] [CrossRef]
- Ann, S.; Yamamoto, T.; Jiang, M. Re-examination of the standards for transit oriented development influence zones in India. J. Transp. Land Use 2019, 12, 679–700. [Google Scholar] [CrossRef]
- Ogra, A.; Ndebele, R. The role of 6Ds: Density, diversity, design, destination, distance, and demand management in transit oriented development (TOD). In Proceedings of the Neo-International Conference on Habitable Environments, Chandigarh, India, 31 October–2 November 2014. [Google Scholar]
- Abutaleb, A.; McDougall, K.; Basson, M.; Hassan, R.; Mahmood, M.N. Towards a Conceptual Framework for Understanding the Attractiveness of Rail Transit-Oriented Shopping Mall Developments (TOSMDs). Urban Rail Transit 2019, 5, 225–239. [Google Scholar] [CrossRef]
- Kutty, N.A.K.A. Assessment and Classification of Transit Stations for Transit Oriented Development (TOD) Potential Using Node-Place Model: The Case of Doha Gold Metro Line. Master’s Thesis, Qatar University, Doha, Qatar, 2018. [Google Scholar]
- Lukman, A. Development and Implementation of a Transit Oriented Development (TOD) Index Around the Current Transit Nodes. Master’s Thesis, University of Twente, Enschede, The Netherlands, 2014. [Google Scholar]
- Zhang, Y.; Song, R.; van Nes, R.; He, S.; Yin, W. Identifying Urban structure based on transit-oriented development. Sustainability 2019, 11, 7241. [Google Scholar] [CrossRef]
- Bourne, L.S. Internal Structure of the City: Readings on Space and Environment; Oxford University Press: New York, NY, USA, 1971. [Google Scholar]
- Chen, T.; Hui, E.C.; Wu, J.; Lang, W.; Li, X. Identifying urban spatial structure and urban vibrancy in highly dense cities using georeferenced social media data. Habitat Int. 2019, 89, 102005. [Google Scholar] [CrossRef]
- Huang, R.; Grigolon, A.; Madureira, M.; Brussel, M. Measuring transit-oriented development (TOD) network complementarity based on TOD node typology. J. Transp. Land Use 2018, 11, 305–324. [Google Scholar] [CrossRef]
- Dittmar, H.; Poticha, S. Defining transit-oriented development: The new regional building block. In The New Transit Town: Best Practices in Transit-Oriented Development; Island Press: Washington, DC, USA, 2004; pp. 19–40. [Google Scholar]
- Dunphy, R.; Myerson, D.; Pawlukiewicz, M. Ten Principles for Successful Developing around Transit; The Urban Land Institute: Washington, DC, USA, 2004. [Google Scholar]
- Sung, H.; Oh, J.-T. Transit-oriented development in a high-density city: Identifying its association with transit ridership in Seoul, Korea. Cities 2011, 28, 70–82. [Google Scholar] [CrossRef]
- Knowles, R.D.; Ferbrache, F. Introduction to transit oriented development and sustainable cities: Economics, community and methods. In Transit Oriented Development and Sustainable Cities; Edward Elgar Publishing: Cheltenham, UK, 2019. [Google Scholar]
- Rahman, K. The Qatar National Master Plan. In Sustainable Development: An Appraisal from the Gulf Region; Berghahn Books: New York, NY, USA; Oxford, UK, 2014; Volume 19, p. 82. [Google Scholar]
- Haghshenas, H.; Vaziri, M. Urban sustainable transportation indicators for global comparison. Ecol. Indic. 2012, 15, 115–121. [Google Scholar] [CrossRef]
- Joumard, R.; Gudmundsson, H. Indicators of Environmental Sustainability in Transport; INRETS: Lyon, France, 2010. [Google Scholar]
- Singh, Y.J.; Lukman, A.; Flacke, J.; Zuidgeest, M.; Van Maarseveen, M. Measuring TOD around transit nodes-Towards TOD policy. Transp. Policy 2017, 56, 96–111. [Google Scholar] [CrossRef]
- Thomas, R.; Bertolini, L. Introduction to transit-oriented development. In Transit-Oriented Development; Springer: Cham, Switzerland, 2020; pp. 1–20. [Google Scholar]
- Shi, Z.A. Urban Design for Rapid Transit: Skytrain Stations for People. Master’s Thesis, University of British Columbia, Vancouver, BC, Canada, 2016. [Google Scholar]
- Alarcon, F.; Cho, Y.; Degerstrom, A.; Hartle, A.; Sherlock, R. The TOD Evaluation Method Evaluating TOD on Station Area and Corridor Scales. Master’s Thesis, University of Minnesota, Minneapolis, MN, USA, 2018. [Google Scholar]
- Gamiz, M.; Wyant, L. One-Way Carsharing as a First and Last Mile Solutions for Transit. Available online: https://sustain.ubc.ca/about/resources/one-way-carsharing-first-and-last-mile-solution-transit (accessed on 1 February 2022).
- Zemp, S.; Stauffacher, M.; Lang, D.J.; Scholz, R.W. Classifying railway stations for strategic transport and land use planning: Context matters! J. Transp. Geogr. 2011, 19, 670–679. [Google Scholar] [CrossRef]
- Lutin, J.; Benz, G.P. Key Issues in Light Rail Transit Station Planning and Design. In Proceedings of the Sixth National Conference on Light Rail Transit, Calgary, AB, Canada, 24–27 May 1992; Transportation Research Record: Washington, DC, USA, 1992. [Google Scholar]
- Jain, A.D.; Singh, E.; Ashtt, R. A systematic literature on application of transit oriented development. Int. J. Eng. Adv. Technol. 2020, 9, 2542–2552. [Google Scholar] [CrossRef]
- Teklemariam, E.A.; Shen, Z. Impacts of Accessibility on TOD: Measurement of Accessibility around Transit Stations of Addis Ababa, Ethiopia. J. Landsc. Res. 2020, 12, 39–48. [Google Scholar]
- Rauf, A.A.; Prasad, A. Temporal spaces of egalitarianism: The ethical negation of economic inequality in an ephemeral religious organization. J. Bus. Ethics 2020, 162, 699–718. [Google Scholar] [CrossRef]
- Stojanovski, T. Urban design and public transportation–public spaces, visual proximity and Transit-Oriented Development (TOD). J. Urban Des. 2020, 25, 134–154. [Google Scholar] [CrossRef]
- Maheshwari, R. Evaluating Local Area Plans and Their Effect of Transit Oriented Development: A Study from Ahmedabad, India. Master’s Thesis, University of Twente, Enschede, The Netherlands, 2019. [Google Scholar]
- Zhang, L.; Zhuang, Y. Analysis of multiple network accessibilities and commercial space use in metro station areas: An empirical case study of Shanghai, China. Int. J. High-Rise Build. 2019, 8, 49–56. [Google Scholar]
- Zaina, S.; Zaina, S.; Furlan, R. Urban planning in Qatar: Strategies and vision for the development of transit villages in Doha. Aust. Plan. 2016, 53, 286–301. [Google Scholar] [CrossRef]
- Al-Harami, A.; Furlan, R. Qatar National Museum-Transit oriented development: The masterplan for the urban regeneration of a ‘green TOD’. J. Urban Manag. 2020, 9, 115–136. [Google Scholar] [CrossRef]
- Li, C.-N.; Lai, T.-Y. Sustainable development and transit-oriented development cities in Taiwan. In Proceedings of the 12th Annual International Sustainable Development Research Conference, Hong Kong, 6–8 April 2006. [Google Scholar]
- Banister, D.; Berechman, Y. Transport investment and the promotion of economic growth. J. Transp. Geogr. 2001, 9, 209–218. [Google Scholar] [CrossRef]
- Knowles, R.D.; Ferbrache, F.; Nikitas, A. Transport’s historical, contemporary and future role in shaping urban development: Re-evaluating transit oriented development. Cities 2020, 99, 102607. [Google Scholar] [CrossRef]
- Qatar Rail. Doha Metro Stations. 2018. Available online: https://tunnelingonline.com/wp-content/uploads/2019/03/doha-metro-map.jpg (accessed on 26 March 2022).
- Ministry of Municipality and Environment. Qatar National Development Framework (QNDF) 2032. Available online: https://www.mme.gov.qa/QatarMasterplan/English/QNDF.aspx?panel=qndf (accessed on 26 March 2022).
- Tan, T.; Al-Khalaqi, A.; Al-Khulaifi, N. Qatar National Vision 2030. In Sustainable Development: An Appraisal from the Gulf Region; Berghahn Books: New York, NY, USA; Oxford, UK, 2014; Volume 19, p. 65. [Google Scholar]
- Ministry of Municipality and Environment. Municipality Spatial Development Plan-MSDP. Available online: https://www.mme.gov.qa/QatarMasterplan/default.aspx (accessed on 26 March 2022).
- Ministry of Transport and Communications. Qatar Pedestrian Crossing Master Plan-QPCMP. Available online: https://www.motc.gov.qa/en/news-events/event/launch-pedestrian-crossing-master-plan-qatar (accessed on 26 March 2022).
- Planning and Statistics Authority. Planning and Statistics Authority (PSA). Available online: https://www.psa.gov.qa/en/statistics1/StatisticsSite/Census/Pages/default.aspx. (accessed on 26 March 2022).
- Qatar Rail. Qatar Rail Annual Report 2015–2016; Qatar Rail Company: Doha, Qatar, 2018. [Google Scholar]
Publisher’s Note: MDPI stays neutral with regard to jurisdictional claims in published maps and institutional affiliations. |
© 2022 by the authors. Licensee MDPI, Basel, Switzerland. This article is an open access article distributed under the terms and conditions of the Creative Commons Attribution (CC BY) license (https://creativecommons.org/licenses/by/4.0/).