The A-Effect and Global Motion


Abstract
1. Introduction
2. Experiment 1
2.1. Materials and Methods
2.1.1. Subjects
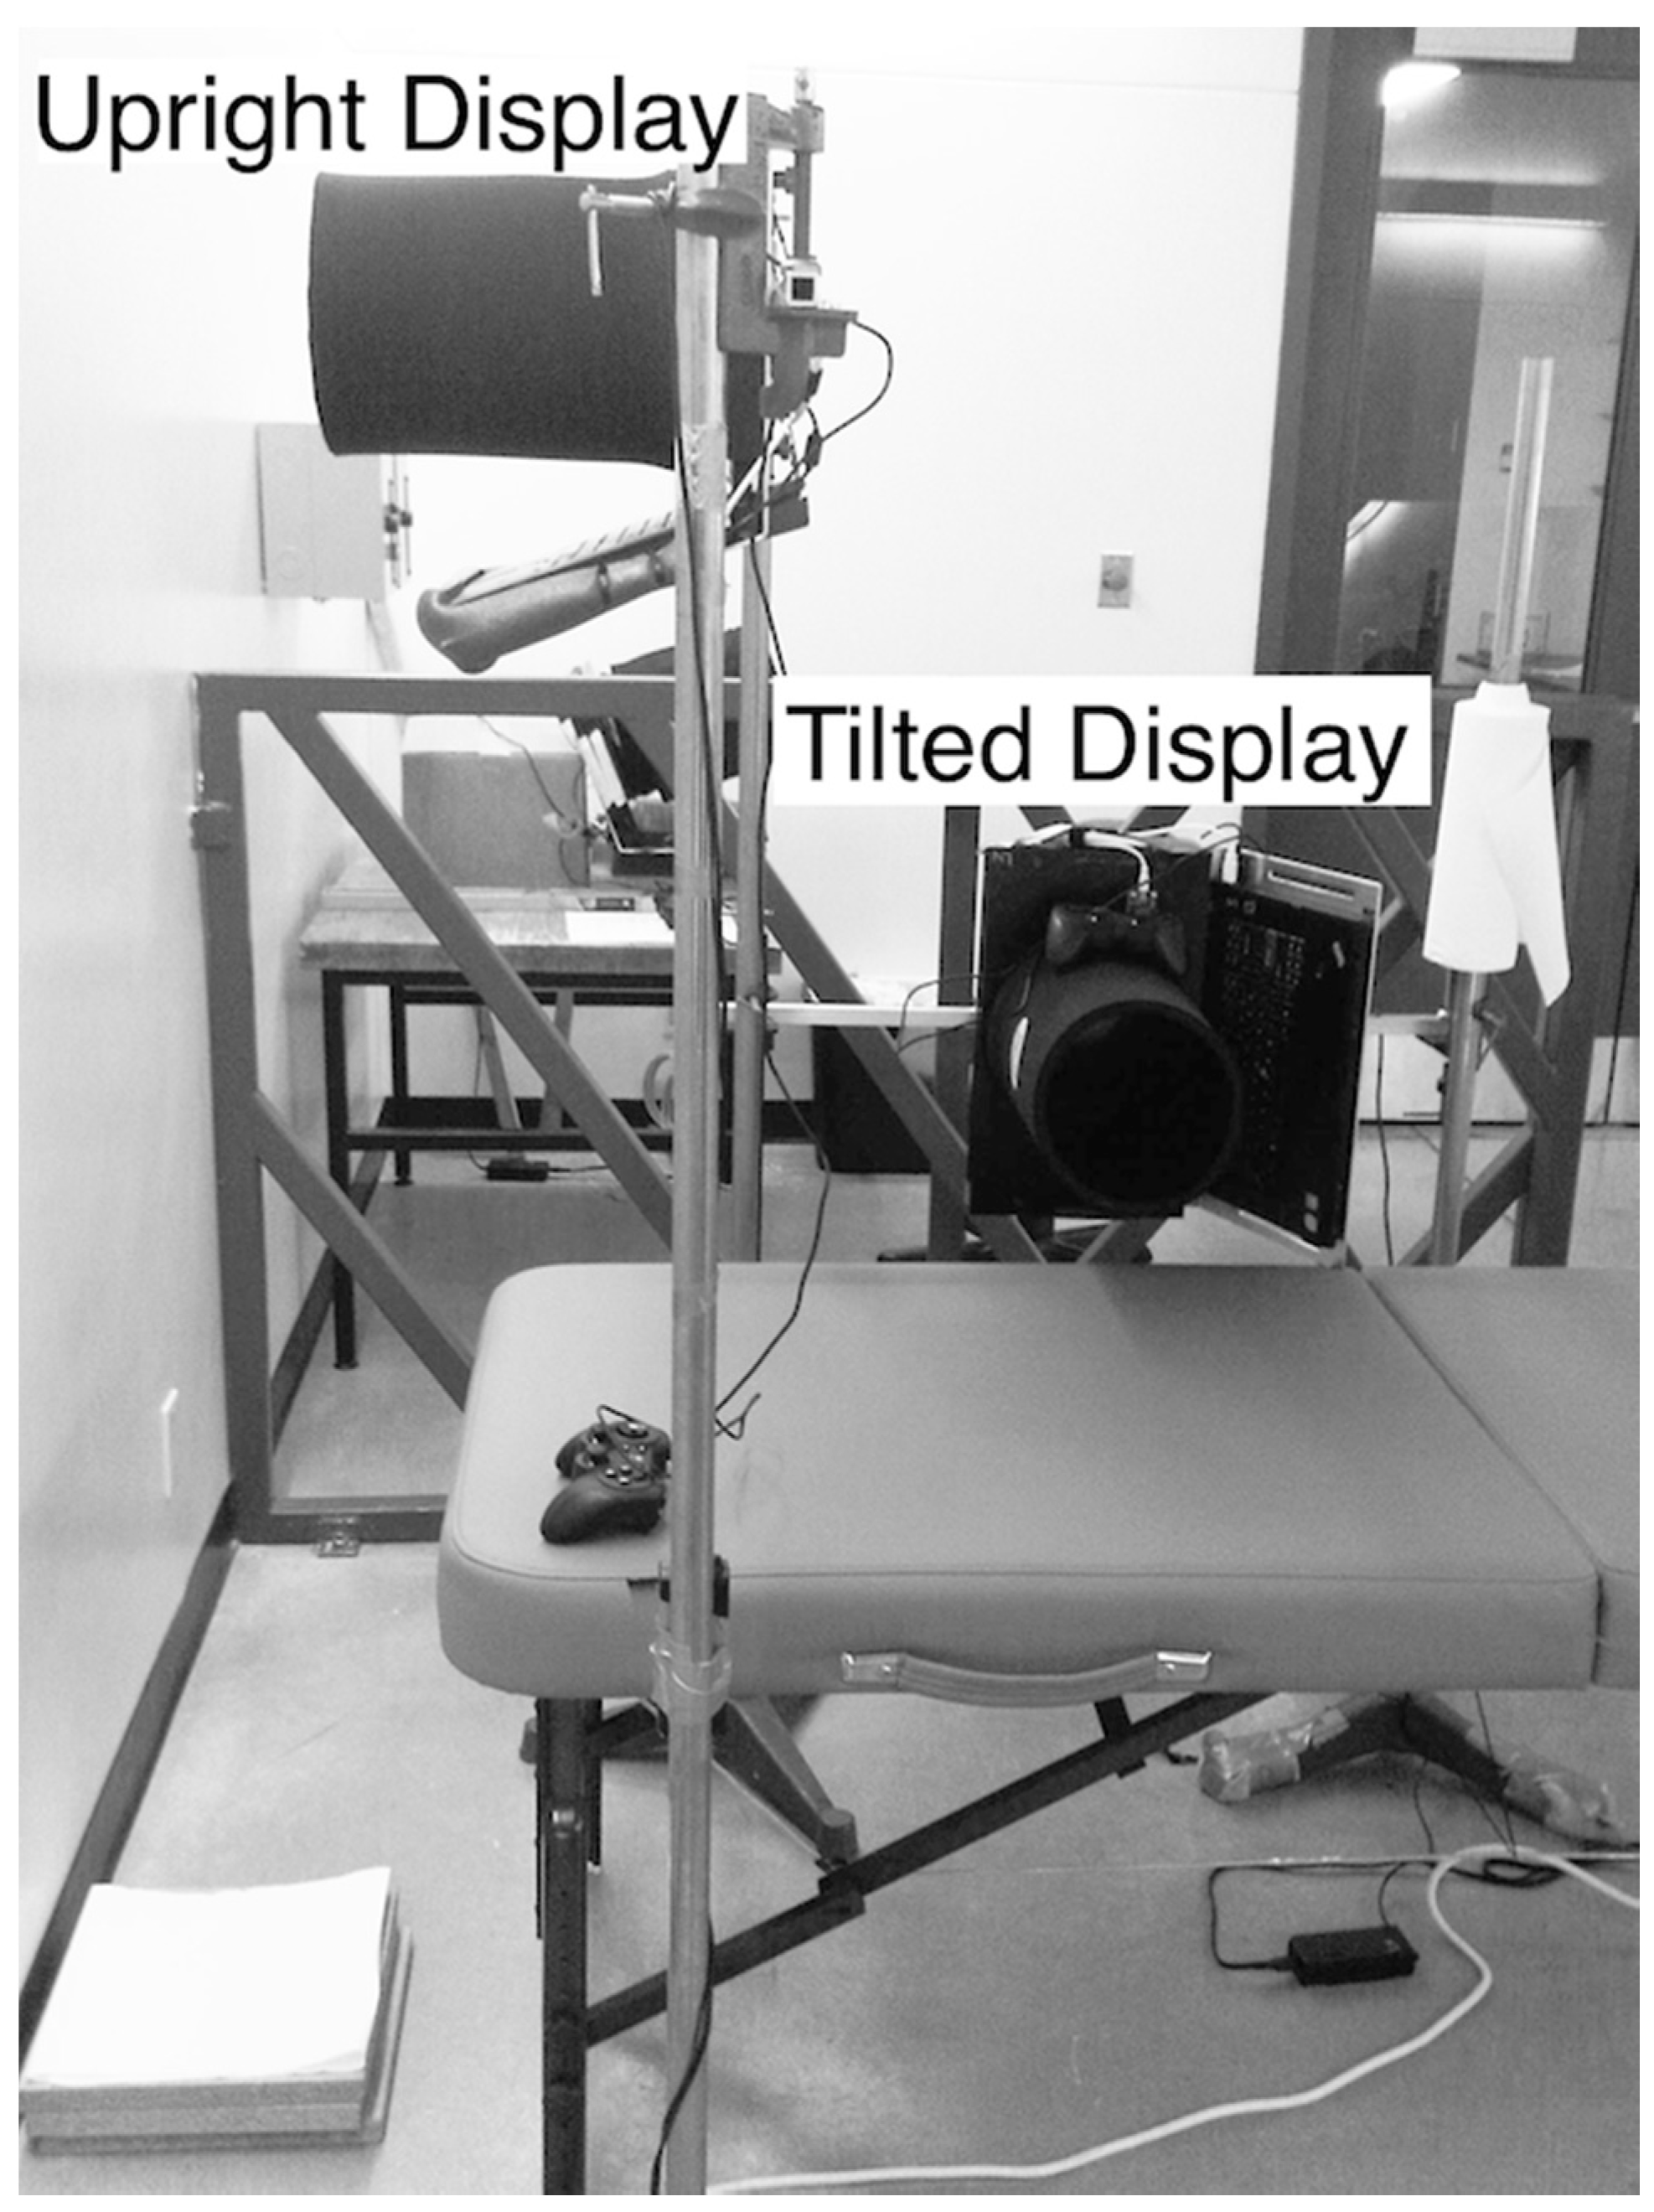
2.1.2. Apparatus
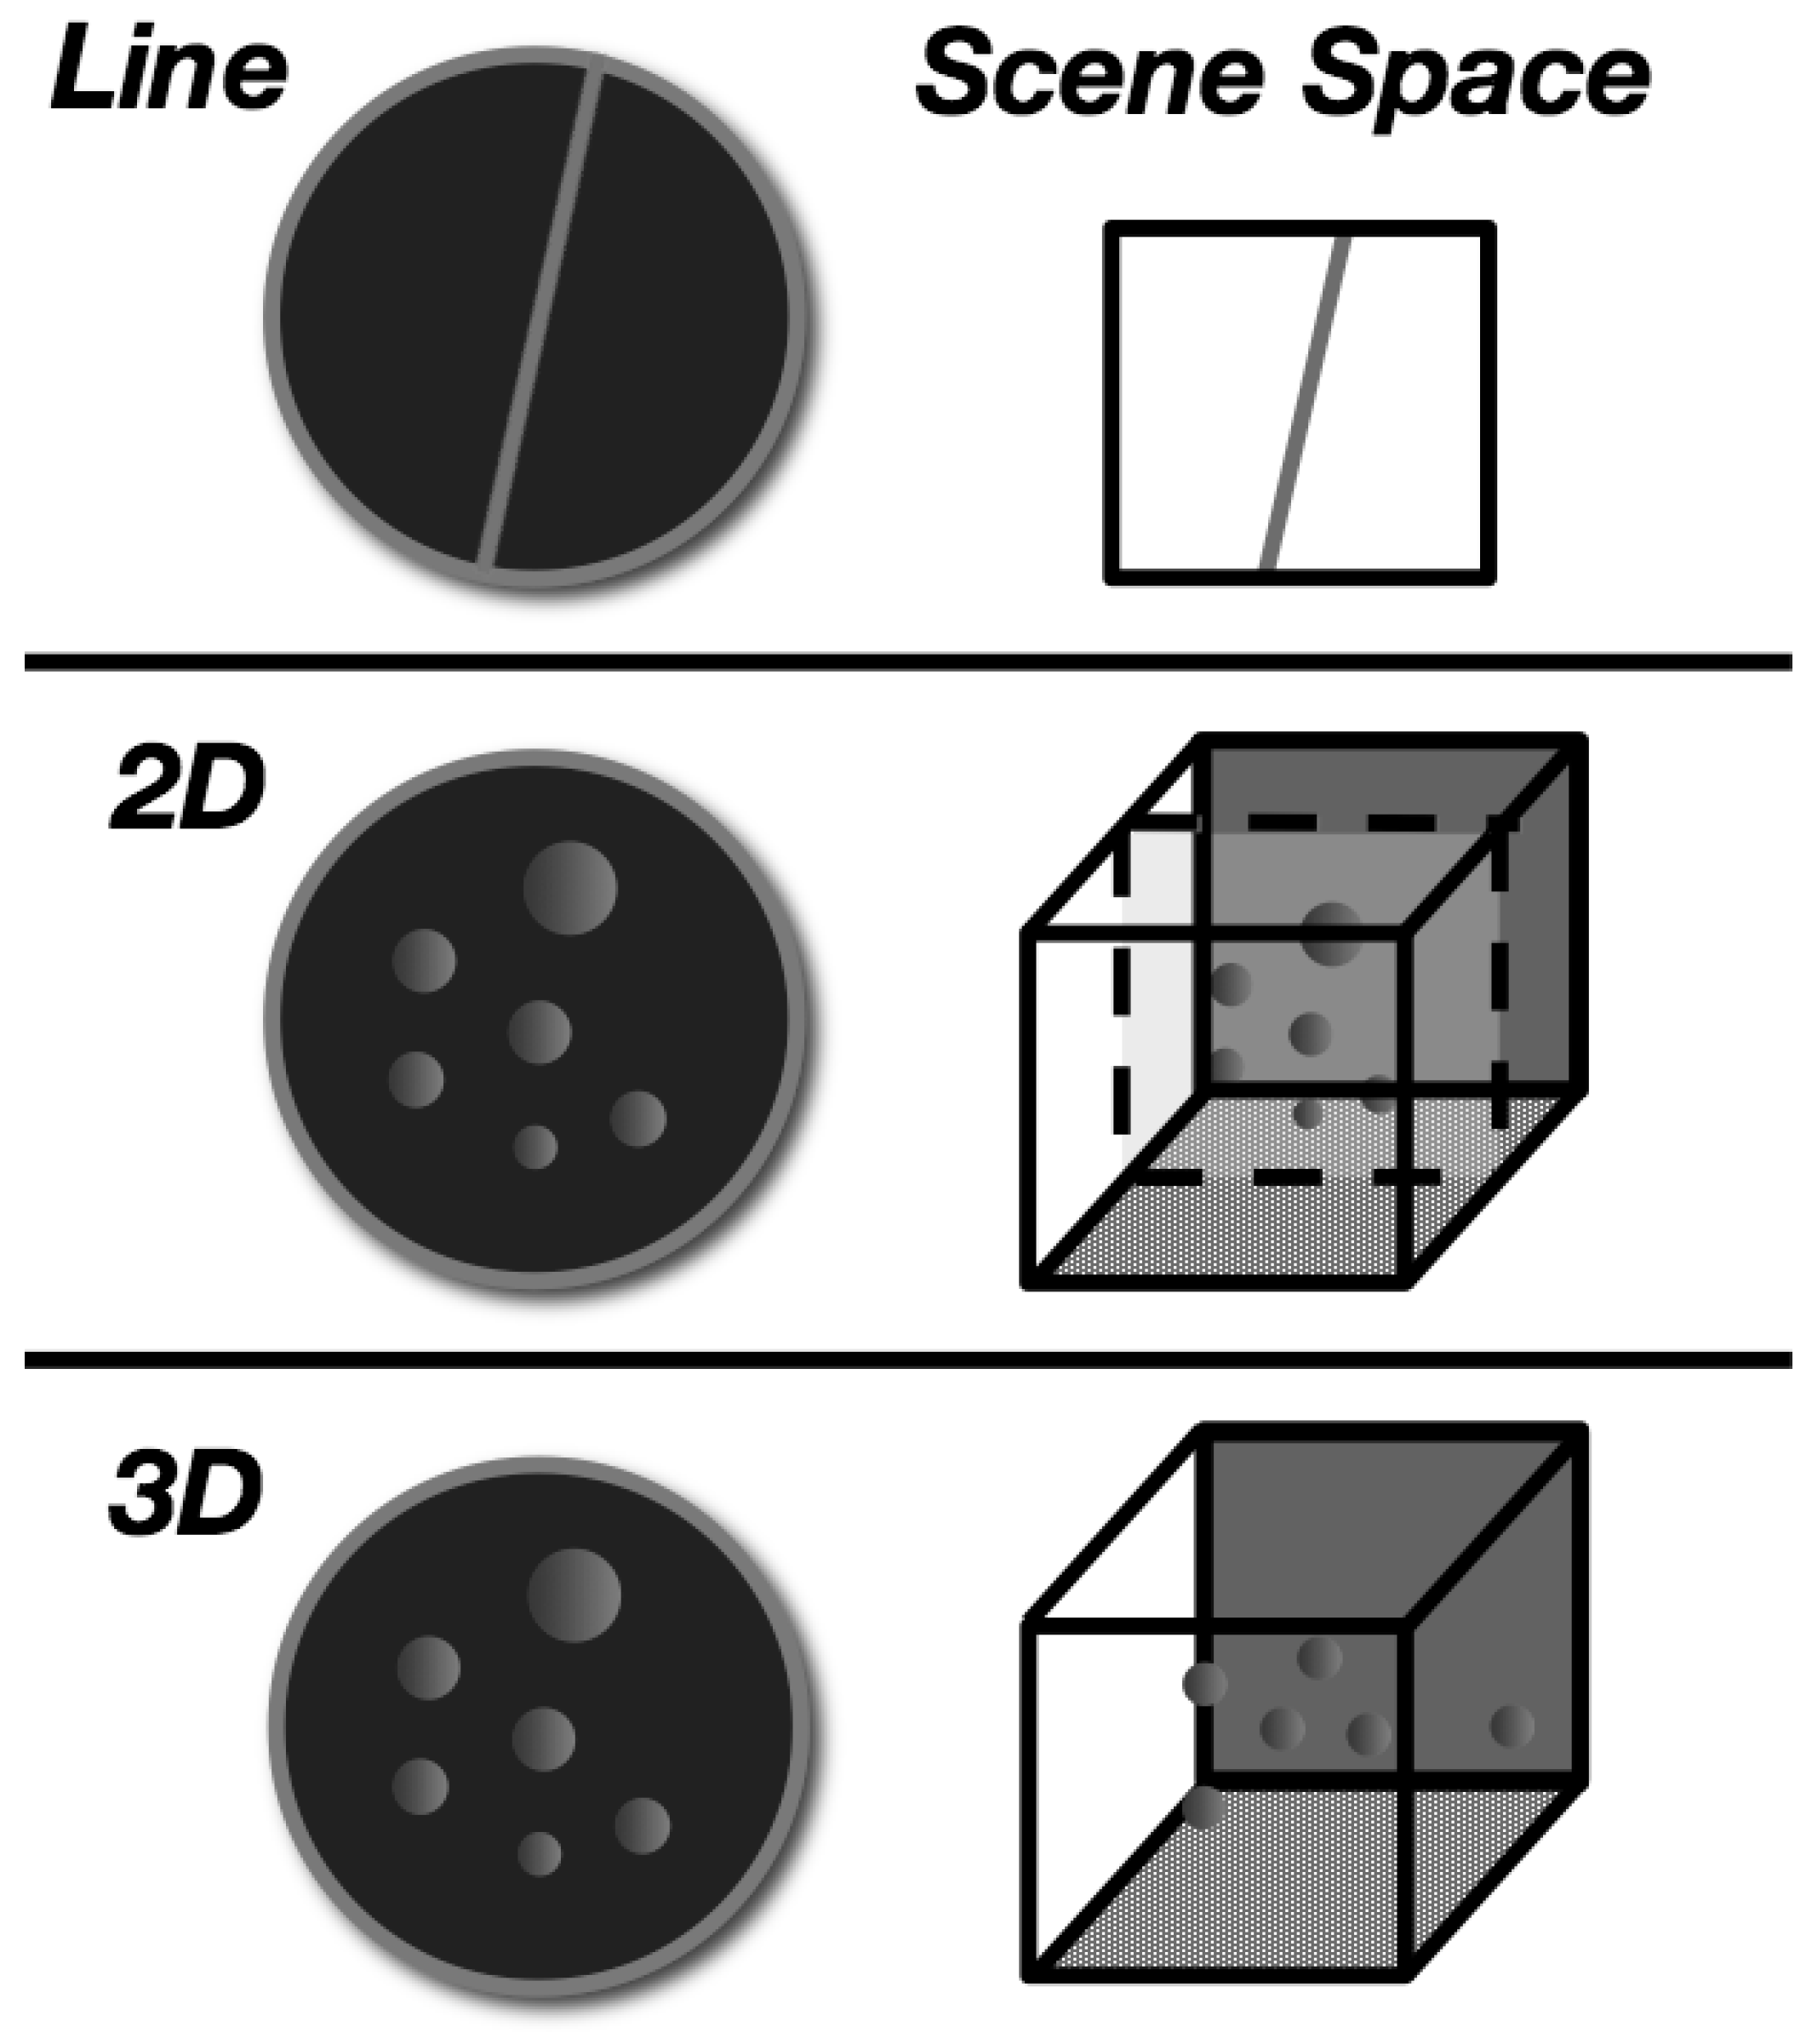
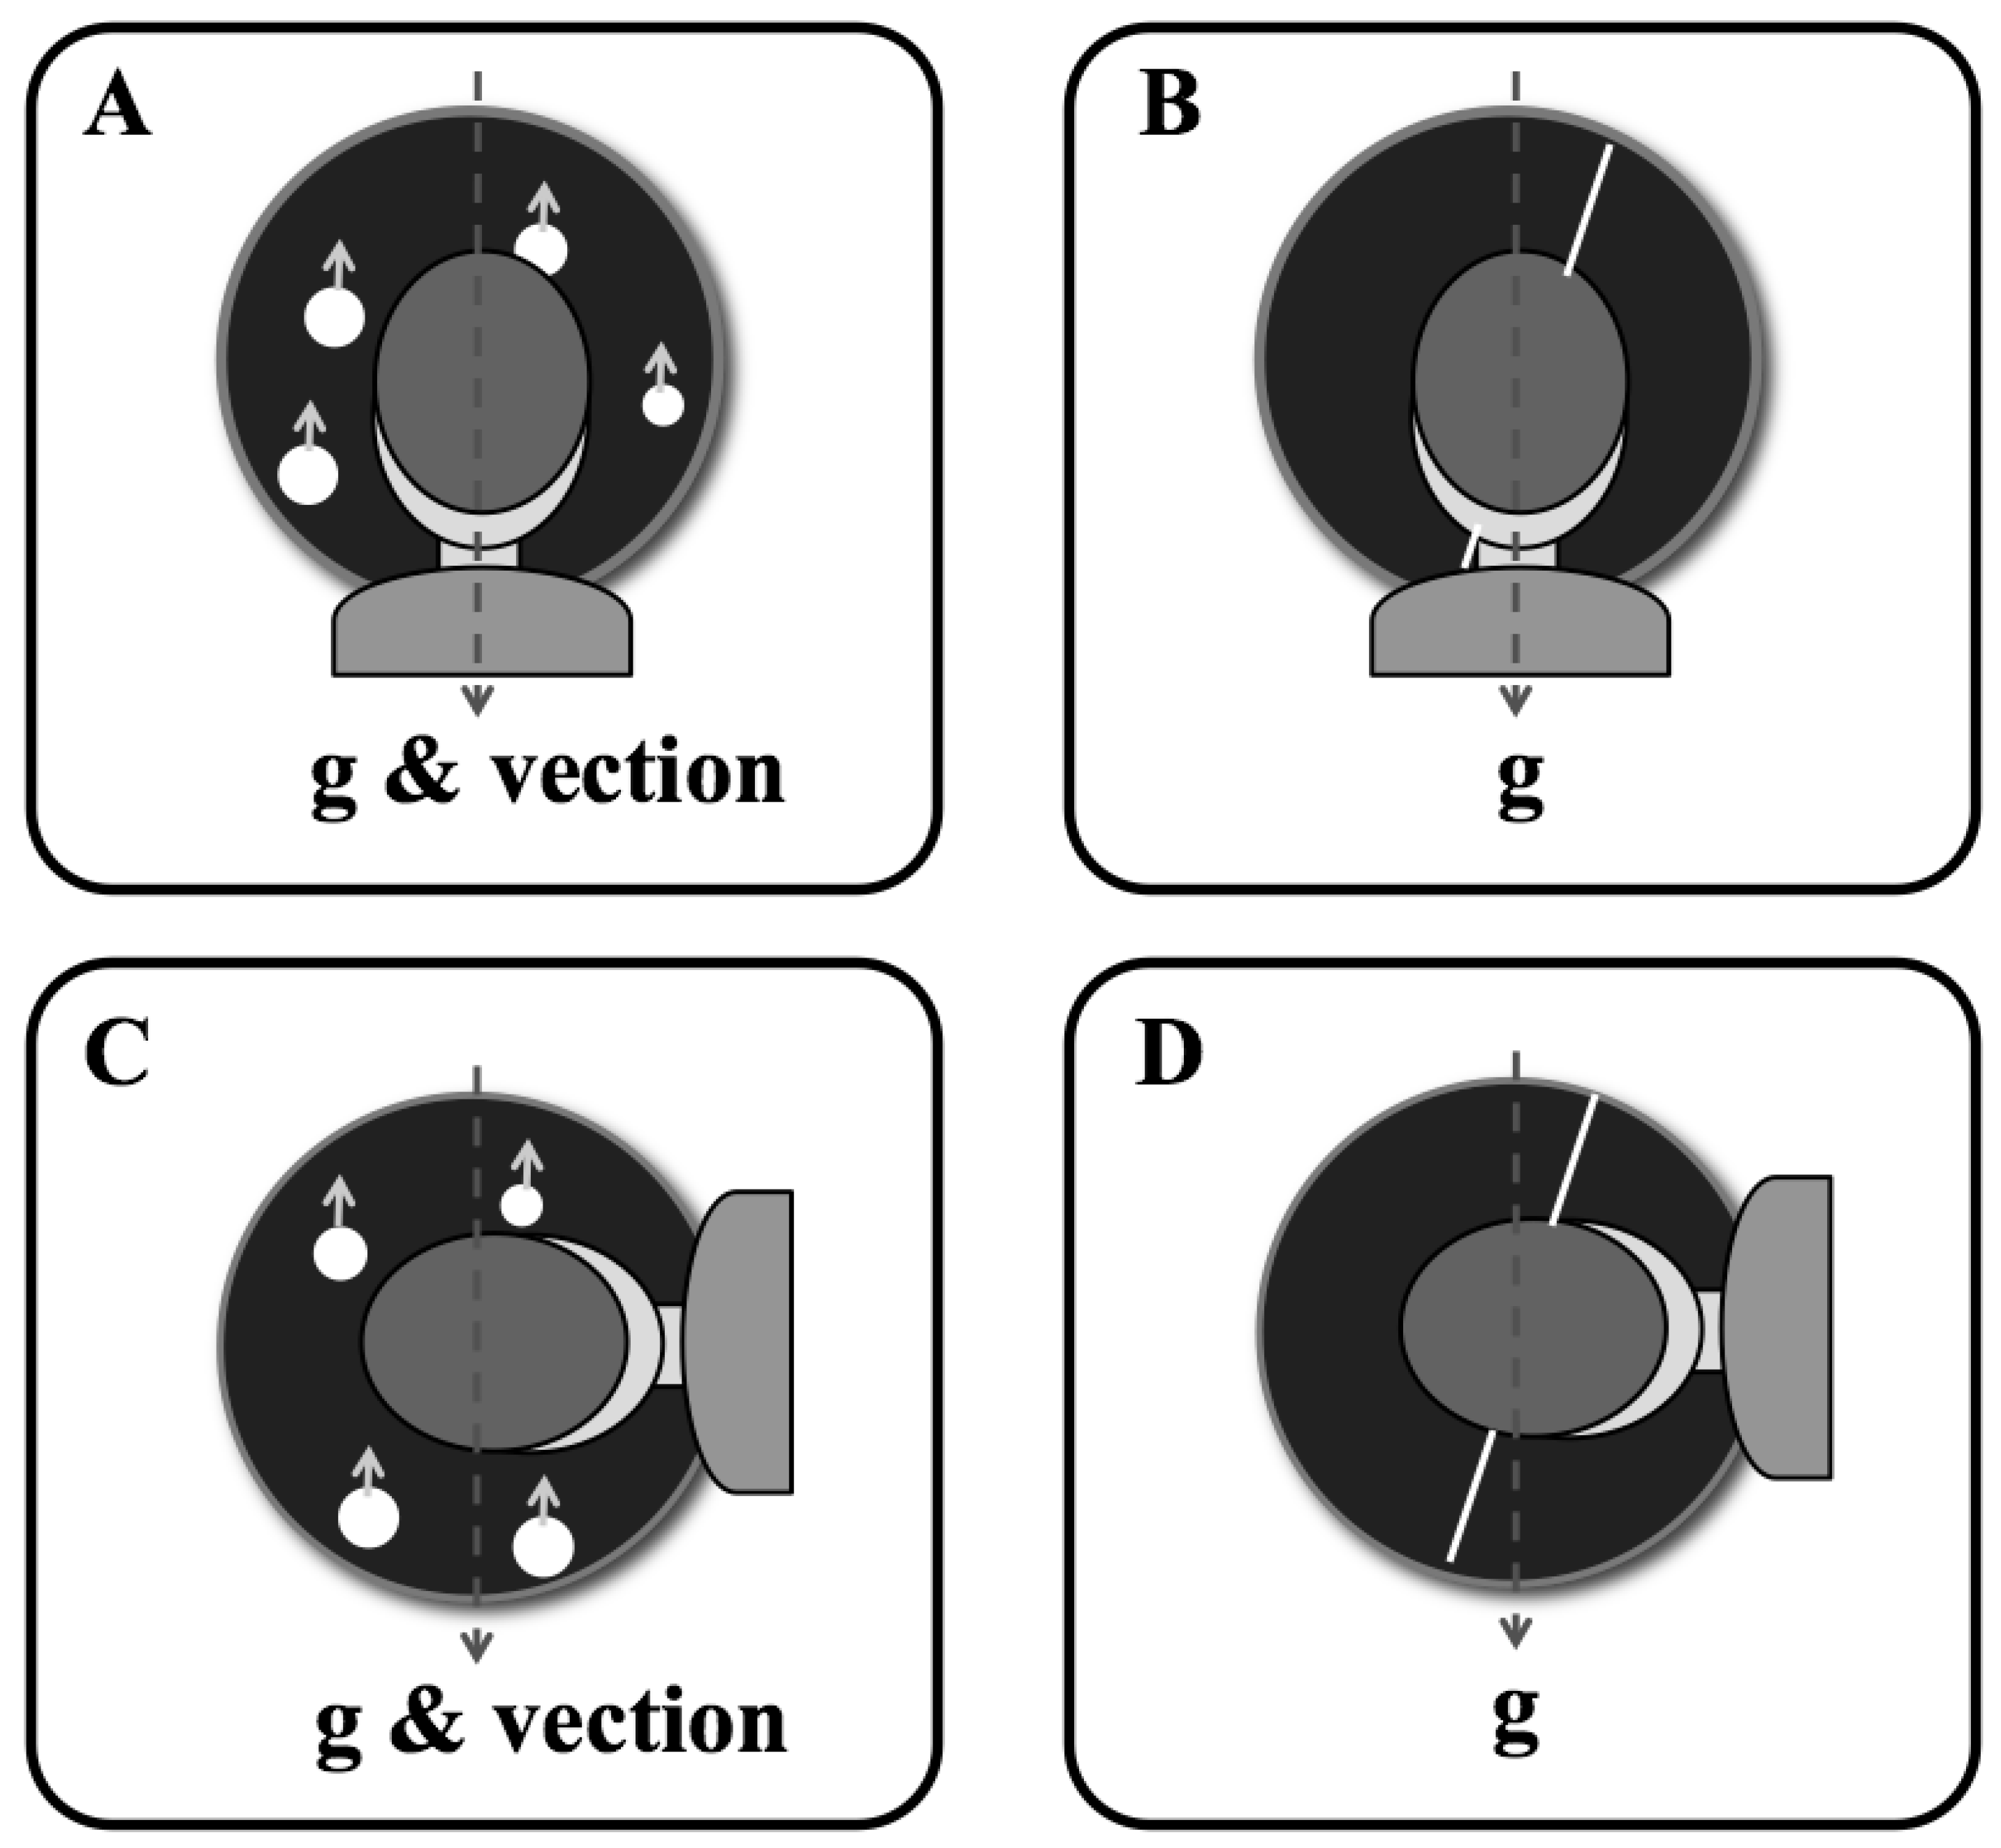
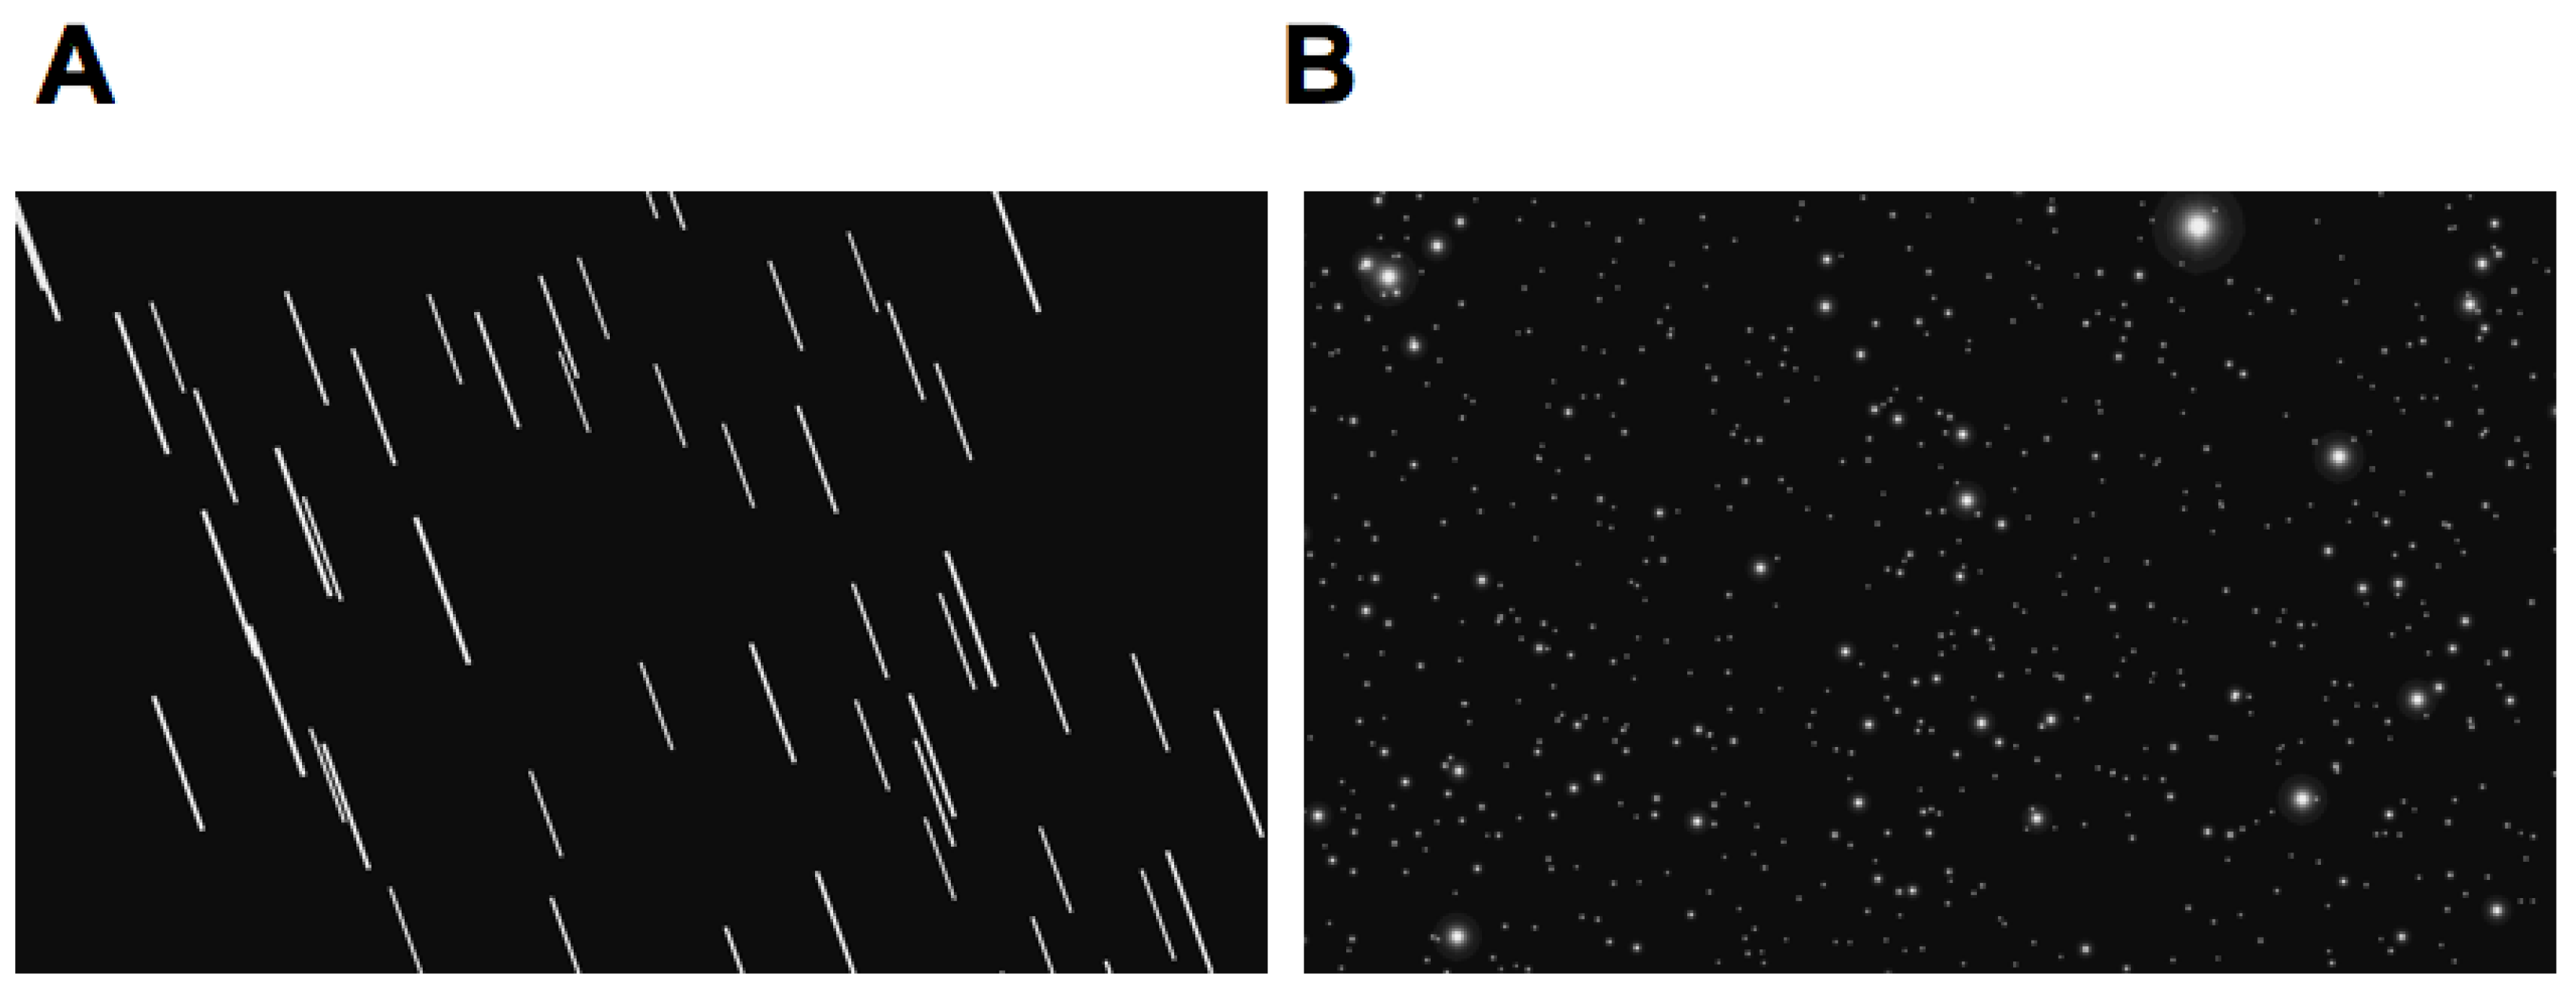
2.1.3. Visual Displays
2.1.4. Design
2.1.5. Procedure
2.1.6. Data Analysis
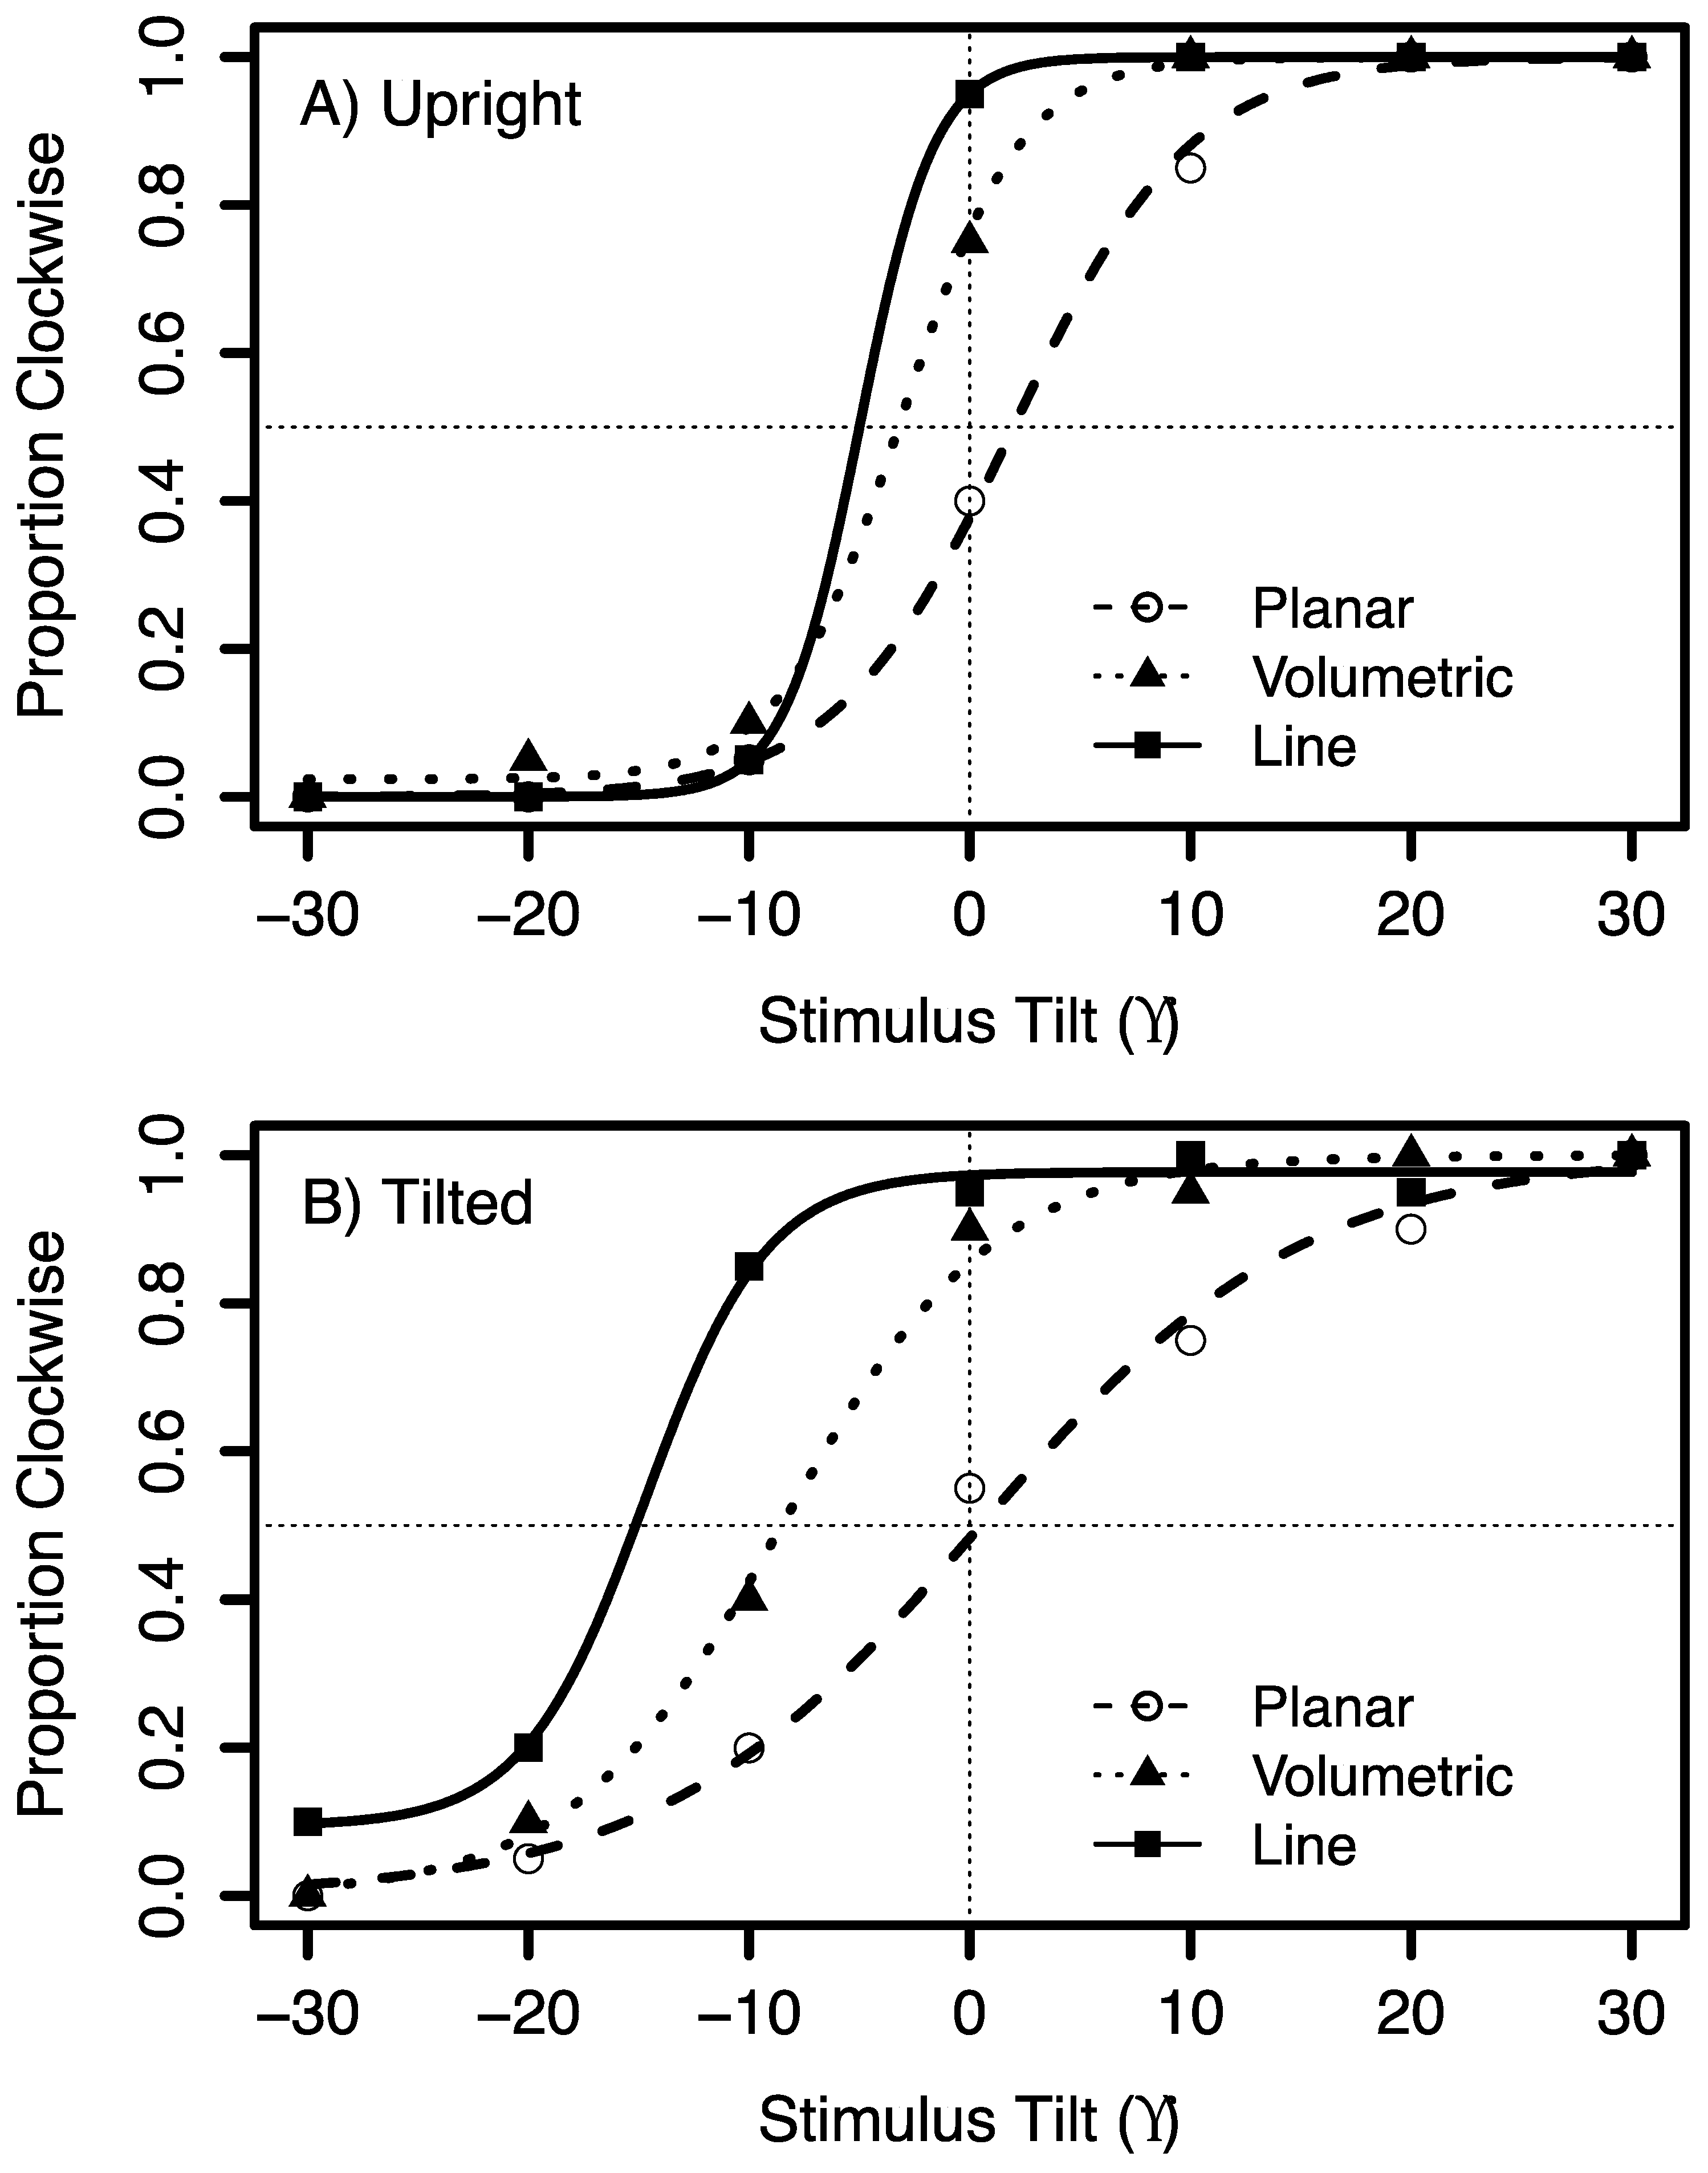
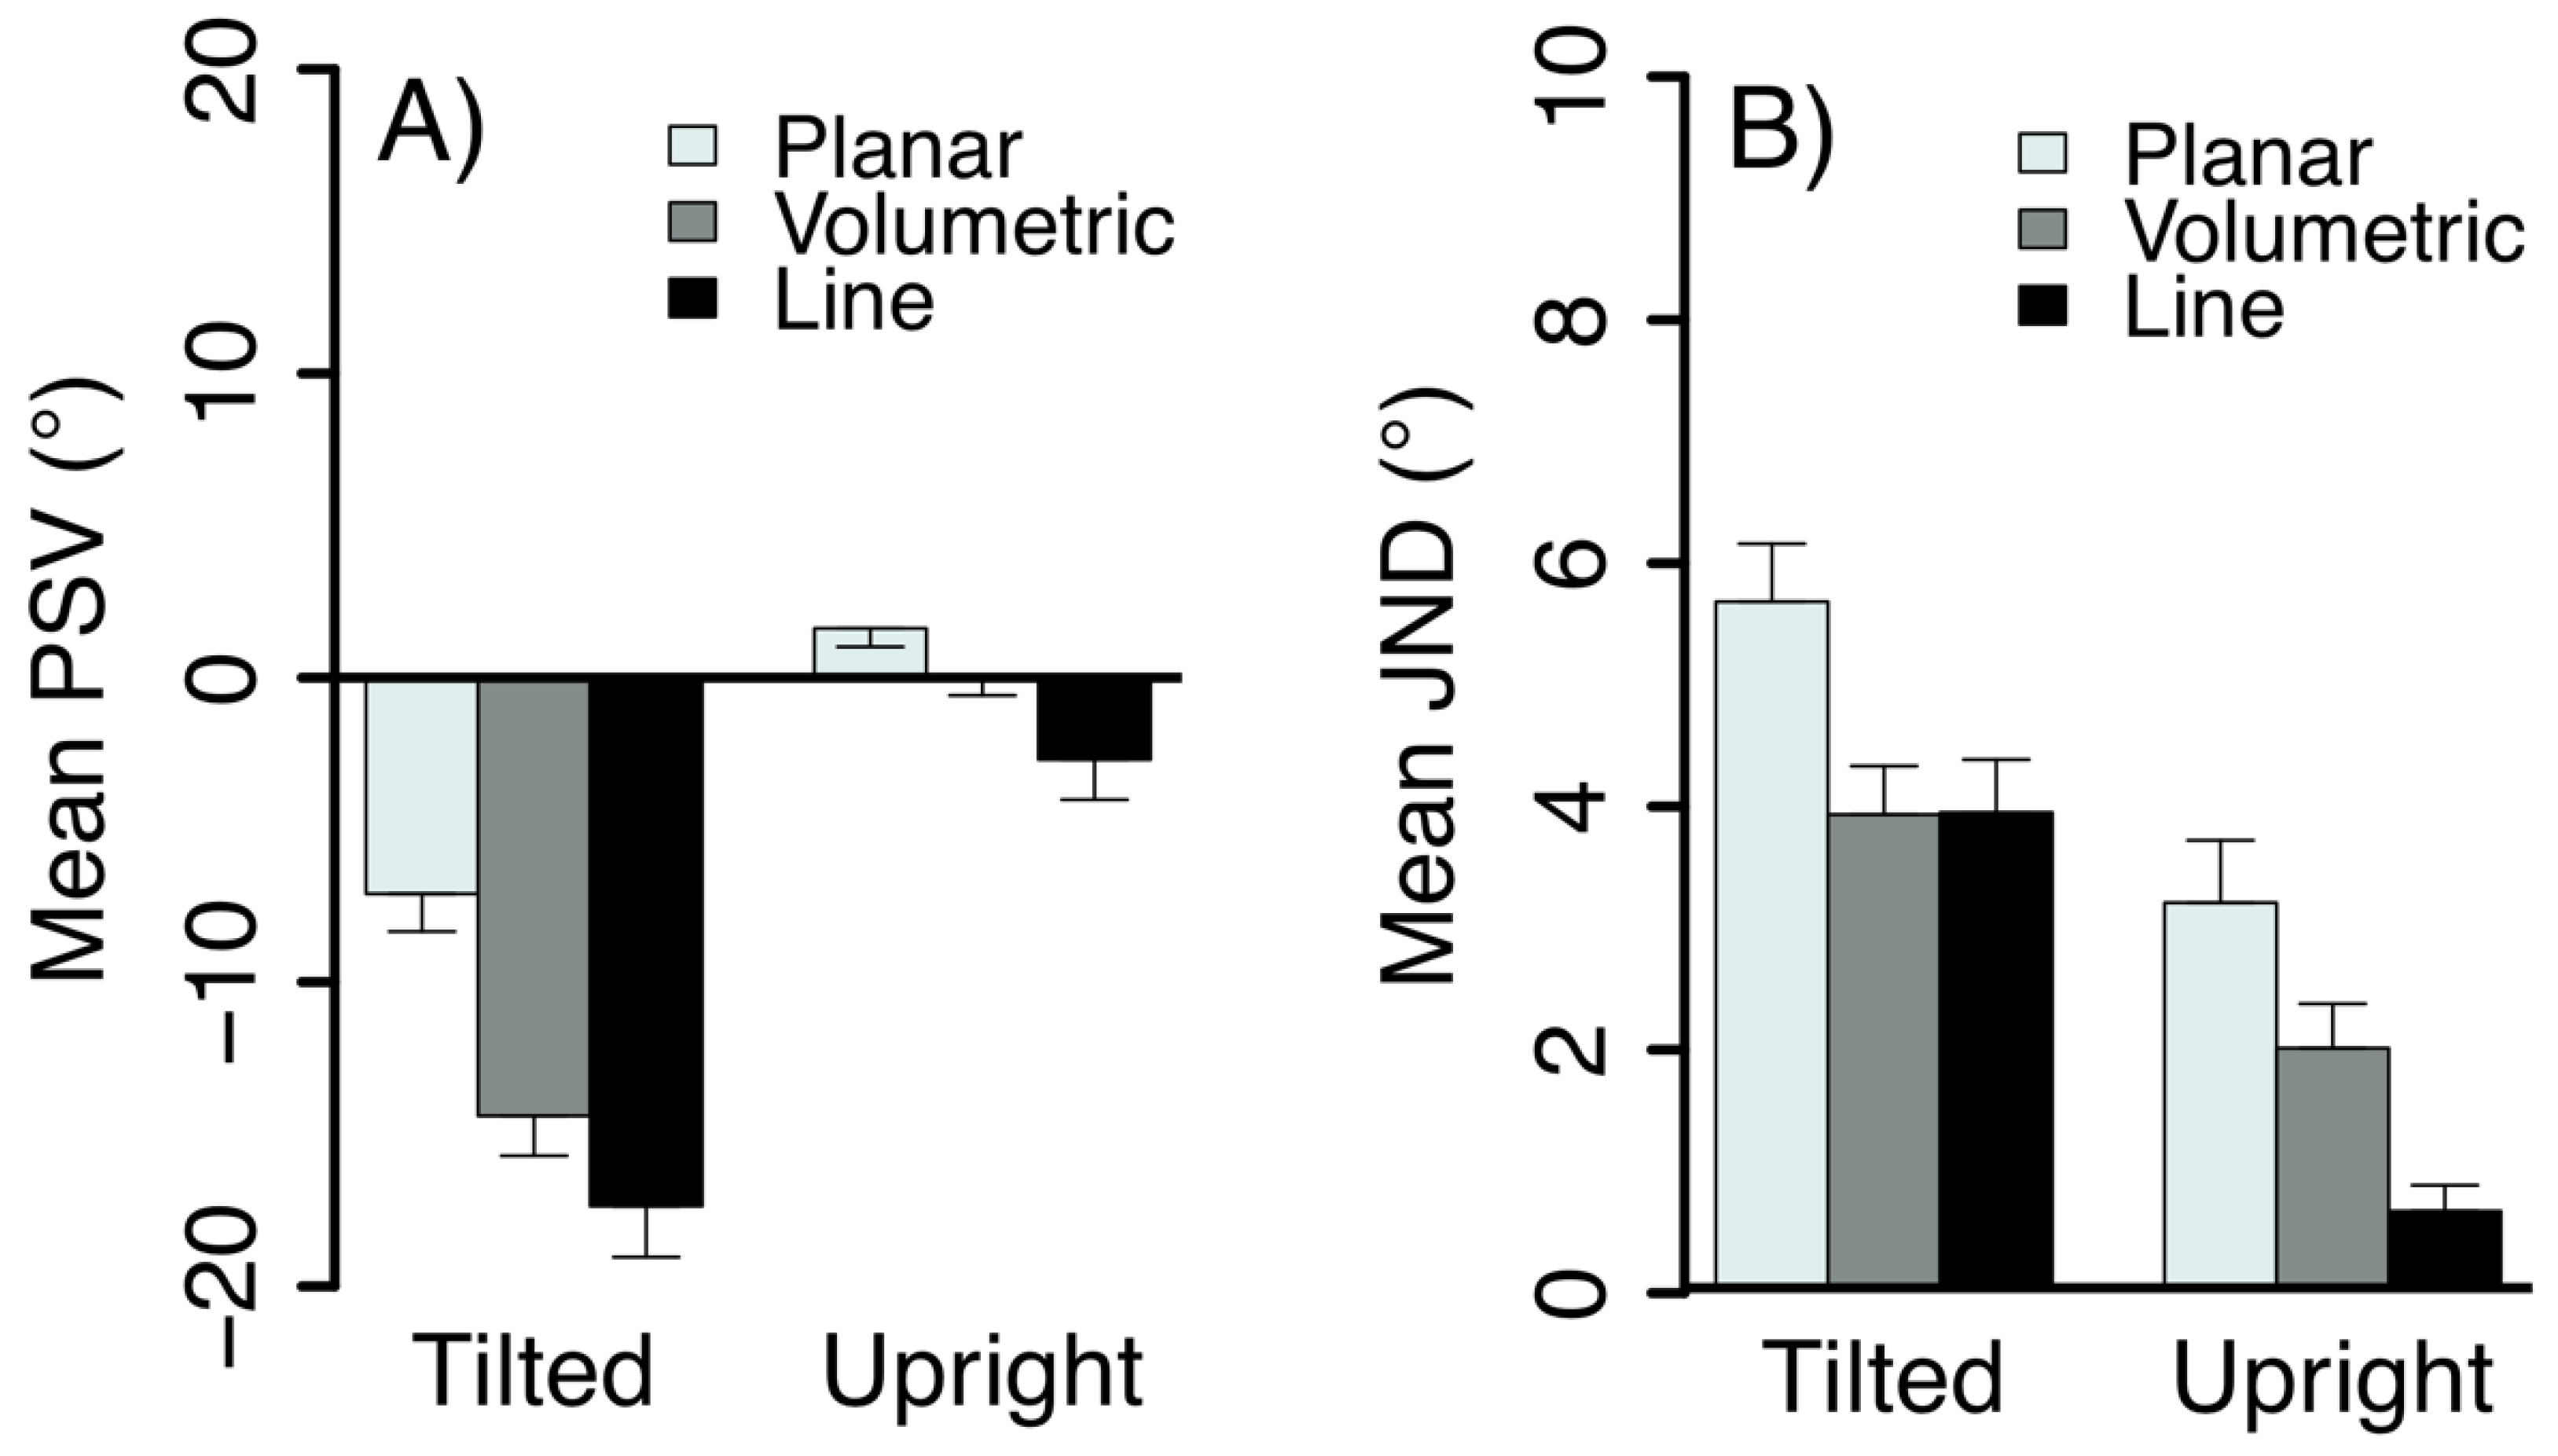
2.2. Results and Discussion
3. Experiment 2
3.1. Methods
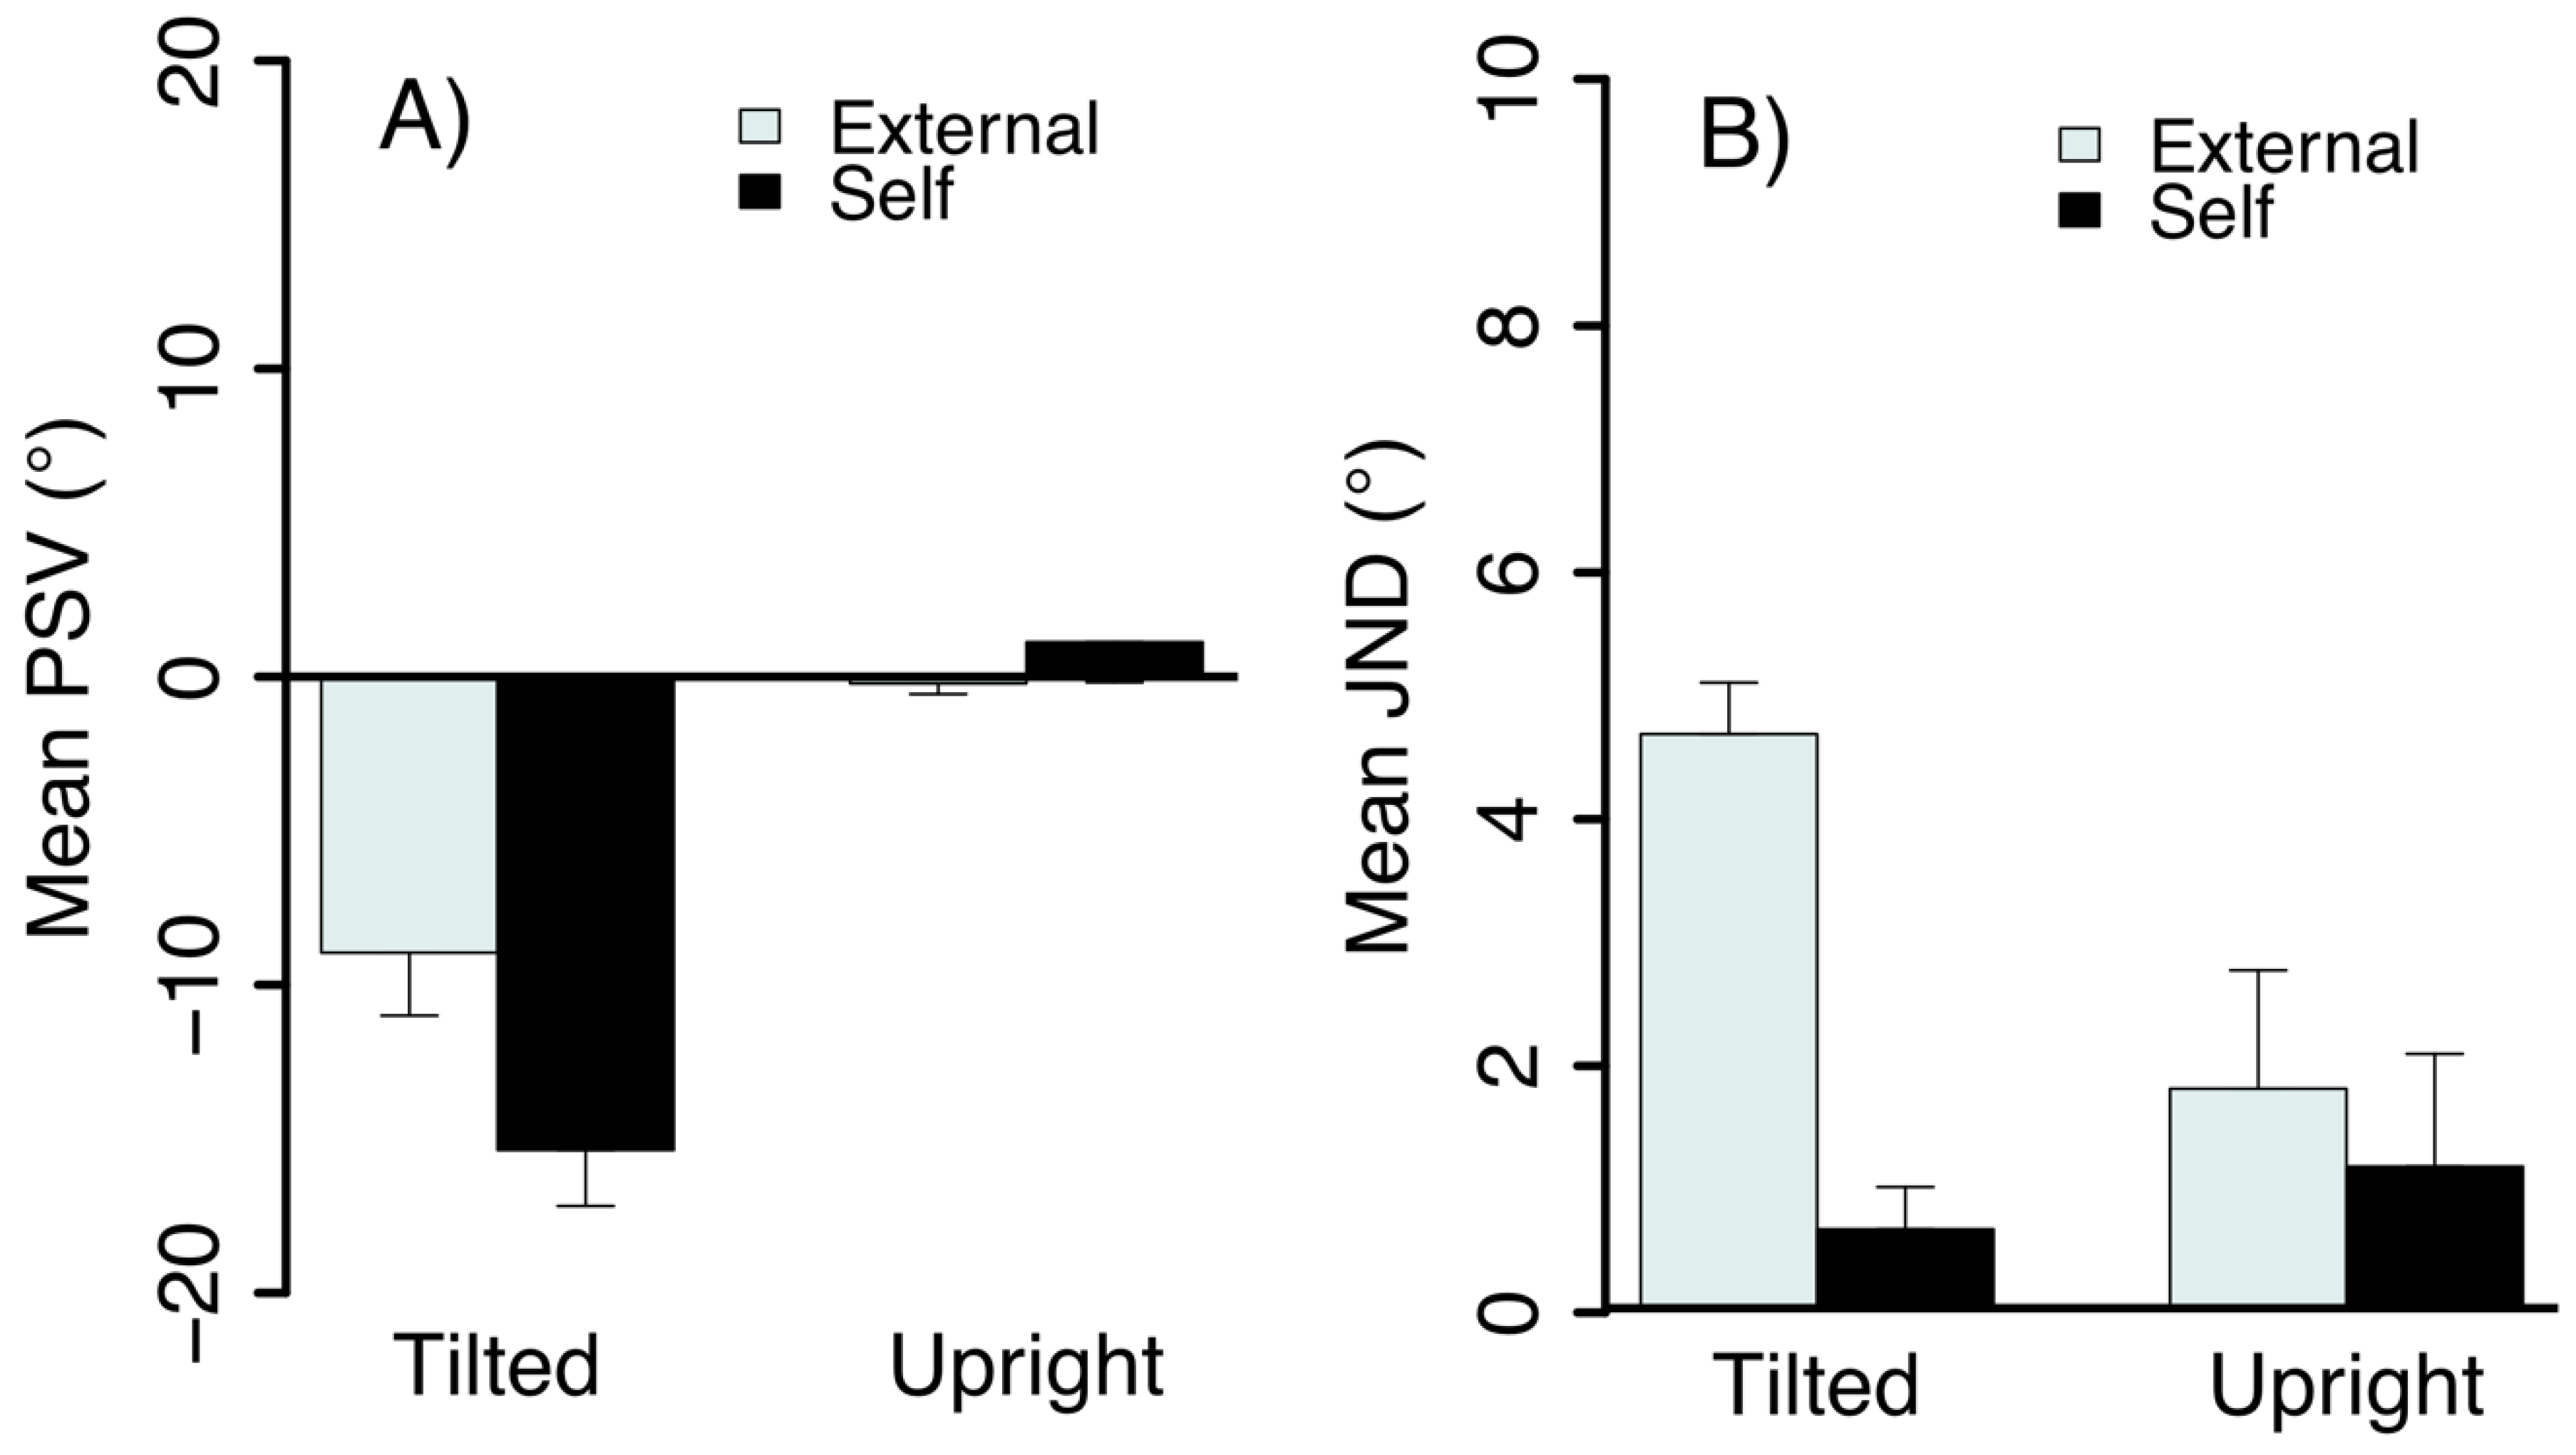
3.2. Results and Discussion
4. General Discussion
4.1. Coordinates, Frames of Reference and Priors
4.2. Sensory Integration
4.3. Neural Processing Considerations
4.4. Conclusions
Author Contributions
Funding
Conflicts of Interest
References
- Dichgans, J.; Brandt, T. Visual-vestibular interactions: Effects on selfmotion perception and postural control. In Handbook of Sensory Physiology: Vol. VIII; Held, R., Leibowitz, H.W., Teuber, H.L., Eds.; Springer: New York, NY, USA, 1978; pp. 755–804. [Google Scholar]
- Howard, I.P. Human Visual Orientation; J. Wiley: Chichester, UK, 1982; ISBN 978-0-471-27946-4. [Google Scholar]
- Allison, R.S.; Howard, I.P.; Zacher, J.E. Effect of field size, head motion and rotational velocity on roll vection and illusory self-tilt in a tumbling room. Perception 1999, 28, 299–306. [Google Scholar] [CrossRef]
- Asch, S.E.; Witkin, H.A. Studies in space orientation. II. Perception of the upright with displaced visual fields and with body tilted. J. Exp. Psychol. 1948, 38, 455–477. [Google Scholar] [CrossRef] [PubMed]
- Klient, H. Versuche über die Wahrnehmung: I. Über Bewegung. Z. Für Psychol. 1937, 141, 9–44. [Google Scholar]
- Hain, T.C.; Helminsky, J.O. Anatomy and Physiology of the Normal Vestibular System. In Vestibular Rehabilitation; Herdman, S., Ed.; FA Davis Company: Philadelphia, PA, USA, 2007; pp. 2–18. [Google Scholar]
- Hunt, J.N.; Knox, M.T.; Oginski, A. The effect of gravity on gastric emptying with various test meals. J. Physiol. 1965, 178, 92–97. [Google Scholar] [CrossRef]
- Shimizu, T.; Yamasaki, M.; Waki, H.; Katsuda, S.; Oishi, H.; Katahira, K.; Nagayama, T.; Miyake, M.; Miyamoto, Y. Development of the aortic baroreflex in microgravity. In The Neurolab Spacelab Mission: Neuroscience Research in Space: Results from the STS-90, Neurolab Spacelab Mission (NASA/SP-2003-535); NASA: Washington, DC, USA, 2002; pp. 151–159. [Google Scholar]
- Horak, F.B.; Nashner, L.M.; Diener, H.C. Postural strategies associated with somatosensory and vestibular loss. Exp. Brain Res. 1990, 82, 167–177. [Google Scholar] [CrossRef] [PubMed]
- Kaptein, R.G.; Van Gisbergen, J.A.M. Interpretation of a Discontinuity in the Sense of Verticality at Large Body Tilt. J. Neurophysiol. 2004, 91, 2205–2214. [Google Scholar] [CrossRef] [PubMed]
- Mast, F.; Jarchow, T. Perceived body position and the visual horizontal. Brain Res. Bull. 1996, 40, 393–397. [Google Scholar] [CrossRef]
- Mittelstaedt, H. A new solution to the problem of the subjective vertical. Naturwissenschaften 1983, 70, 272–281. [Google Scholar] [CrossRef]
- Aubert, H. Eine scheinbare bedeutende Drehung von Objecten bei Neigung des Kopfes nach rechts oder links. Arch. Pathol. Anat. Physiol. Klin. Med. 1861, 20, 381–393. [Google Scholar] [CrossRef]
- Witkin, H.A.; Asch, S.E. Studies in space orientation. III. Perception of the upright in the absence of a visual field. J. Exp. Psychol. 1948, 38, 603–614. [Google Scholar] [CrossRef]
- Müller, G.E. Über das Aubertsche Phänomen. Z. Sinnesphysiol. 1916, 49, 109–244. [Google Scholar]
- Van Beuzekom, A.D.; Van Gisbergen, J.A.M. Properties of the Internal Representation of Gravity Inferred from Spatial-Direction and Body-Tilt Estimates. J. Neurophysiol. 2000, 84, 11–27. [Google Scholar] [CrossRef] [PubMed]
- Mittelstaedt, H. The Role of the Otoliths in Perception of the Vertical and in Path Integration. Ann. N. Y. Acad. Sci. 1999, 871, 334–344. [Google Scholar] [CrossRef] [PubMed]
- Vrijer, M.D.; Medendorp, W.P.; Gisbergen, J.A.M.V. Shared Computational Mechanism for Tilt Compensation Accounts for Biased Verticality Percepts in Motion and Pattern Vision. J. Neurophysiol. 2008, 99, 915–930. [Google Scholar] [CrossRef] [PubMed]
- Palmisano, S.; Allison, R.S.; Schira, M.M.; Barry, R.J. Future challenges for vection research: Definitions, functional significance, measures and neural bases. Front. Psychol. 2015, 6, 1–15. [Google Scholar] [CrossRef] [PubMed]
- Guterman, P.S.; Allison, R.S.; Zacher, J.E. Effects of head orientation on the perceived tilt of a static line and 3D global motion. J. Vis. 2013, 13, 874. [Google Scholar] [CrossRef]
- Wichmann, F.A.; Hill, N.J. The psychometric function: I. Fitting, sampling and goodness of fit. Percept. Psychophys. 2001, 63, 1293–1313. [Google Scholar] [CrossRef] [PubMed]
- Dichgans, J.; Diener, H.C.; Brandt, T. Optokinetic-Graviceptive Interaction in Different Head Positions. Acta Otolaryngol. (Stockh.) 1974, 78, 391–398. [Google Scholar] [CrossRef]
- Seno, T.; Palmisano, S.; Ito, H. Independent modulation of motion and vection aftereffects revealed by using coherent oscillation and random jitter in optic flow. Vision Res. 2011, 51, 2499–2508. [Google Scholar] [CrossRef]
- Geisler, W.S. Motion streaks provide a spatial code for motion direction. Nature 1999, 400, 65–69. [Google Scholar] [CrossRef] [PubMed]
- Jenkin, H.L.; Dyde, R.T.; Zacher, J.E.; Zikovitz, D.C.; Jenkin, M.R.; Allison, R.S.; Howard, I.P.; Harris, L.R. The relative role of visual and non-visual cues in determining the perceived direction of “up”: Experiments in parabolic flight. Acta Astronaut. 2005, 56, 1025–1032. [Google Scholar] [CrossRef] [PubMed]
- Howard, I.P.; Childerson, L. The Contribution of Motion, the Visual Frame and Visual Polarity to Sensations of Body Tilt. Perception 1994, 23, 753–762. [Google Scholar] [CrossRef] [PubMed]
- DiLorenzo, J.R.; Rock, I. The rod-and-frame effect as a function of the righting of the frame. J. Exp. Psychol. Hum. Percept. Perform. 1982, 8, 536–546. [Google Scholar] [CrossRef] [PubMed]
- Kim, J.; Khuu, S. A new spin on vection in depth. J. Vis. 2014, 14, 5. [Google Scholar] [CrossRef]
- Palmisano, S.; Allison, R.; Ash, A.; Nakamura, S.; Apthorp, D. Evidence Against an Ecological Explanation of the Jitter Advantage for Vection. Percept. Sci. 2014, 5, 1297. [Google Scholar] [CrossRef]
- De Bruyn, B.; Orban, G.A. Human velocity and direction discrimination measured with random dot patterns. Vision Res. 1988, 28, 1323–1335. [Google Scholar] [CrossRef]
- Girshick, A.R.; Landy, M.S.; Simoncelli, E.P. Cardinal rules: Visual orientation perception reflects knowledge of environmental statistics. Nat. Neurosci. 2011, 14, 926–932. [Google Scholar] [CrossRef] [PubMed]
- MacNeilage, P.R.; Banks, M.S.; Berger, D.R.; Bülthoff, H.H. A Bayesian model of the disambiguation of gravitoinertial force by visual cues. Exp. Brain Res. 2007, 179, 263–290. [Google Scholar] [CrossRef] [PubMed]
- Mittelstaedt, H. The subjective vertical as a function of visual and extraretinal cues. Acta Psychol. (Amst.) 1986, 63, 63–85. [Google Scholar] [CrossRef]
- Witkin, H.A.; Asch, S.E. Studies in space orientation. IV. Further experiments on perception of the upright with displaced visual fields. J. Exp. Psychol. 1948, 38, 762–782. [Google Scholar] [CrossRef]
- Burns, J.K.; Nashed, J.Y.; Blohm, G. Head roll influences perceived hand position. J. Vis. 2011, 11, 3. [Google Scholar] [CrossRef]
- Harris, L.R.; Carnevale, M.J.; D’Amour, S.; Fraser, L.E.; Harrar, V.; Hoover, A.E.N.; Mander, C.; Pritchett, L.M. How our body influences our perception of the world. Front. Psychol. 2015, 6, 819. [Google Scholar] [CrossRef]
- De Winkel, K.N.; Katliar, M.; Diers, D.; Bülthoff, H.H. Causal Inference in the Perception of Verticality. Sci. Rep. 2018, 8, 5483. [Google Scholar] [CrossRef] [PubMed]
- Landy, M.S.; Maloney, L.T.; Johnston, E.B.; Young, M. Measurement and modeling of depth cue combination: In defense of weak fusion. Vis. Res. 1995, 35, 389–412. [Google Scholar] [CrossRef]
- Dieterich, M.; Brandt, T. The bilateral central vestibular system: Its pathways, functions and disorders. Ann. N. Y. Acad. Sci. 2015, 1343, 10–26. [Google Scholar] [CrossRef] [PubMed]
- Brandt, T.; Dieterich, M.; Danek, A. Vestibular cortex lesions affect the perception of verticality. Ann. Neurol. 1994, 35, 403–412. [Google Scholar] [CrossRef] [PubMed]
- Baier, B.; Suchan, J.; Karnath, H.-O.; Dieterich, M. Neural correlates of disturbed perception of verticality. Neurology 2012, 78, 728–735. [Google Scholar] [CrossRef]
- Bernhard, B.; Julian, C.; Peter, Z.E.; Christoph, B.; Wibke, M.; Frank, B. Dieterich Marianne Insular Strokes Cause No Vestibular Deficits. Stroke 2013, 44, 2604–2606. [Google Scholar]
- Bronstein, A.M. The interaction of otolith and proprioceptive information in the perception of verticality. The effects of labyrinthine and CNS disease. Ann. N. Y. Acad. Sci. 1999, 871, 324–333. [Google Scholar] [CrossRef] [PubMed]
- Frank, S.M.; Wirth, A.M.; Greenlee, M.W. Visual-vestibular processing in the human Sylvian fissure. J. Neurophysiol. 2016, 116, 263–271. [Google Scholar] [CrossRef]
- Gu, Y. Vestibular signals in primate cortex for self-motion perception. Curr. Opin. Neurobiol. 2018, 52, 10–17. [Google Scholar] [CrossRef] [PubMed]
- Smith, A.T.; Greenlee, M.W.; DeAngelis, G.C.; Angelaki, D.E. Distributed Visual–Vestibular Processing in the Cerebral Cortex of Man and Macaque. Multisensory Res. 2017, 30, 91–120. [Google Scholar] [CrossRef]
- Guldin, W.O.; Grüsser, O.J. Is there a vestibular cortex? Trends Neurosci. 1998, 21, 254–259. [Google Scholar] [CrossRef]
- Akbarian, S.; Berndl, K.; Grüsser, O.-J.; Guldin, W.; Pause, M.; Schreiter, U. Responses of Single Neurons in the Parietoinsular Vestibular Cortex of Primates a. Ann. N. Y. Acad. Sci. 1988, 545, 187–202. [Google Scholar] [CrossRef]
- Liu, S.; Dickman, J.D.; Angelaki, D.E. Response Dynamics and Tilt versus Translation Discrimination in Parietoinsular Vestibular Cortex. Cereb. Cortex 2011, 21, 563–573. [Google Scholar] [CrossRef]
- Kleinschmidt, A. Neural Correlates of Visual-Motion Perception as Object- or Self-motion. NeuroImage 2002, 16, 873–882. [Google Scholar] [CrossRef] [PubMed]


© 2019 by the authors. Licensee MDPI, Basel, Switzerland. This article is an open access article distributed under the terms and conditions of the Creative Commons Attribution (CC BY) license (http://creativecommons.org/licenses/by/4.0/).
Share and Cite
Guterman, P.S.; Allison, R.S. The A-Effect and Global Motion. Vision 2019, 3, 13. https://doi.org/10.3390/vision3020013
Guterman PS, Allison RS. The A-Effect and Global Motion. Vision. 2019; 3(2):13. https://doi.org/10.3390/vision3020013
Chicago/Turabian StyleGuterman, Pearl S., and Robert S. Allison. 2019. "The A-Effect and Global Motion" Vision 3, no. 2: 13. https://doi.org/10.3390/vision3020013
APA StyleGuterman, P. S., & Allison, R. S. (2019). The A-Effect and Global Motion. Vision, 3(2), 13. https://doi.org/10.3390/vision3020013