Association Between Stiffness of the Deep Fibres of the Tibialis Anterior Muscle and Seiza Posture Performance After Ankle Fracture Surgery
Abstract
1. Introduction
2. Materials and Methods
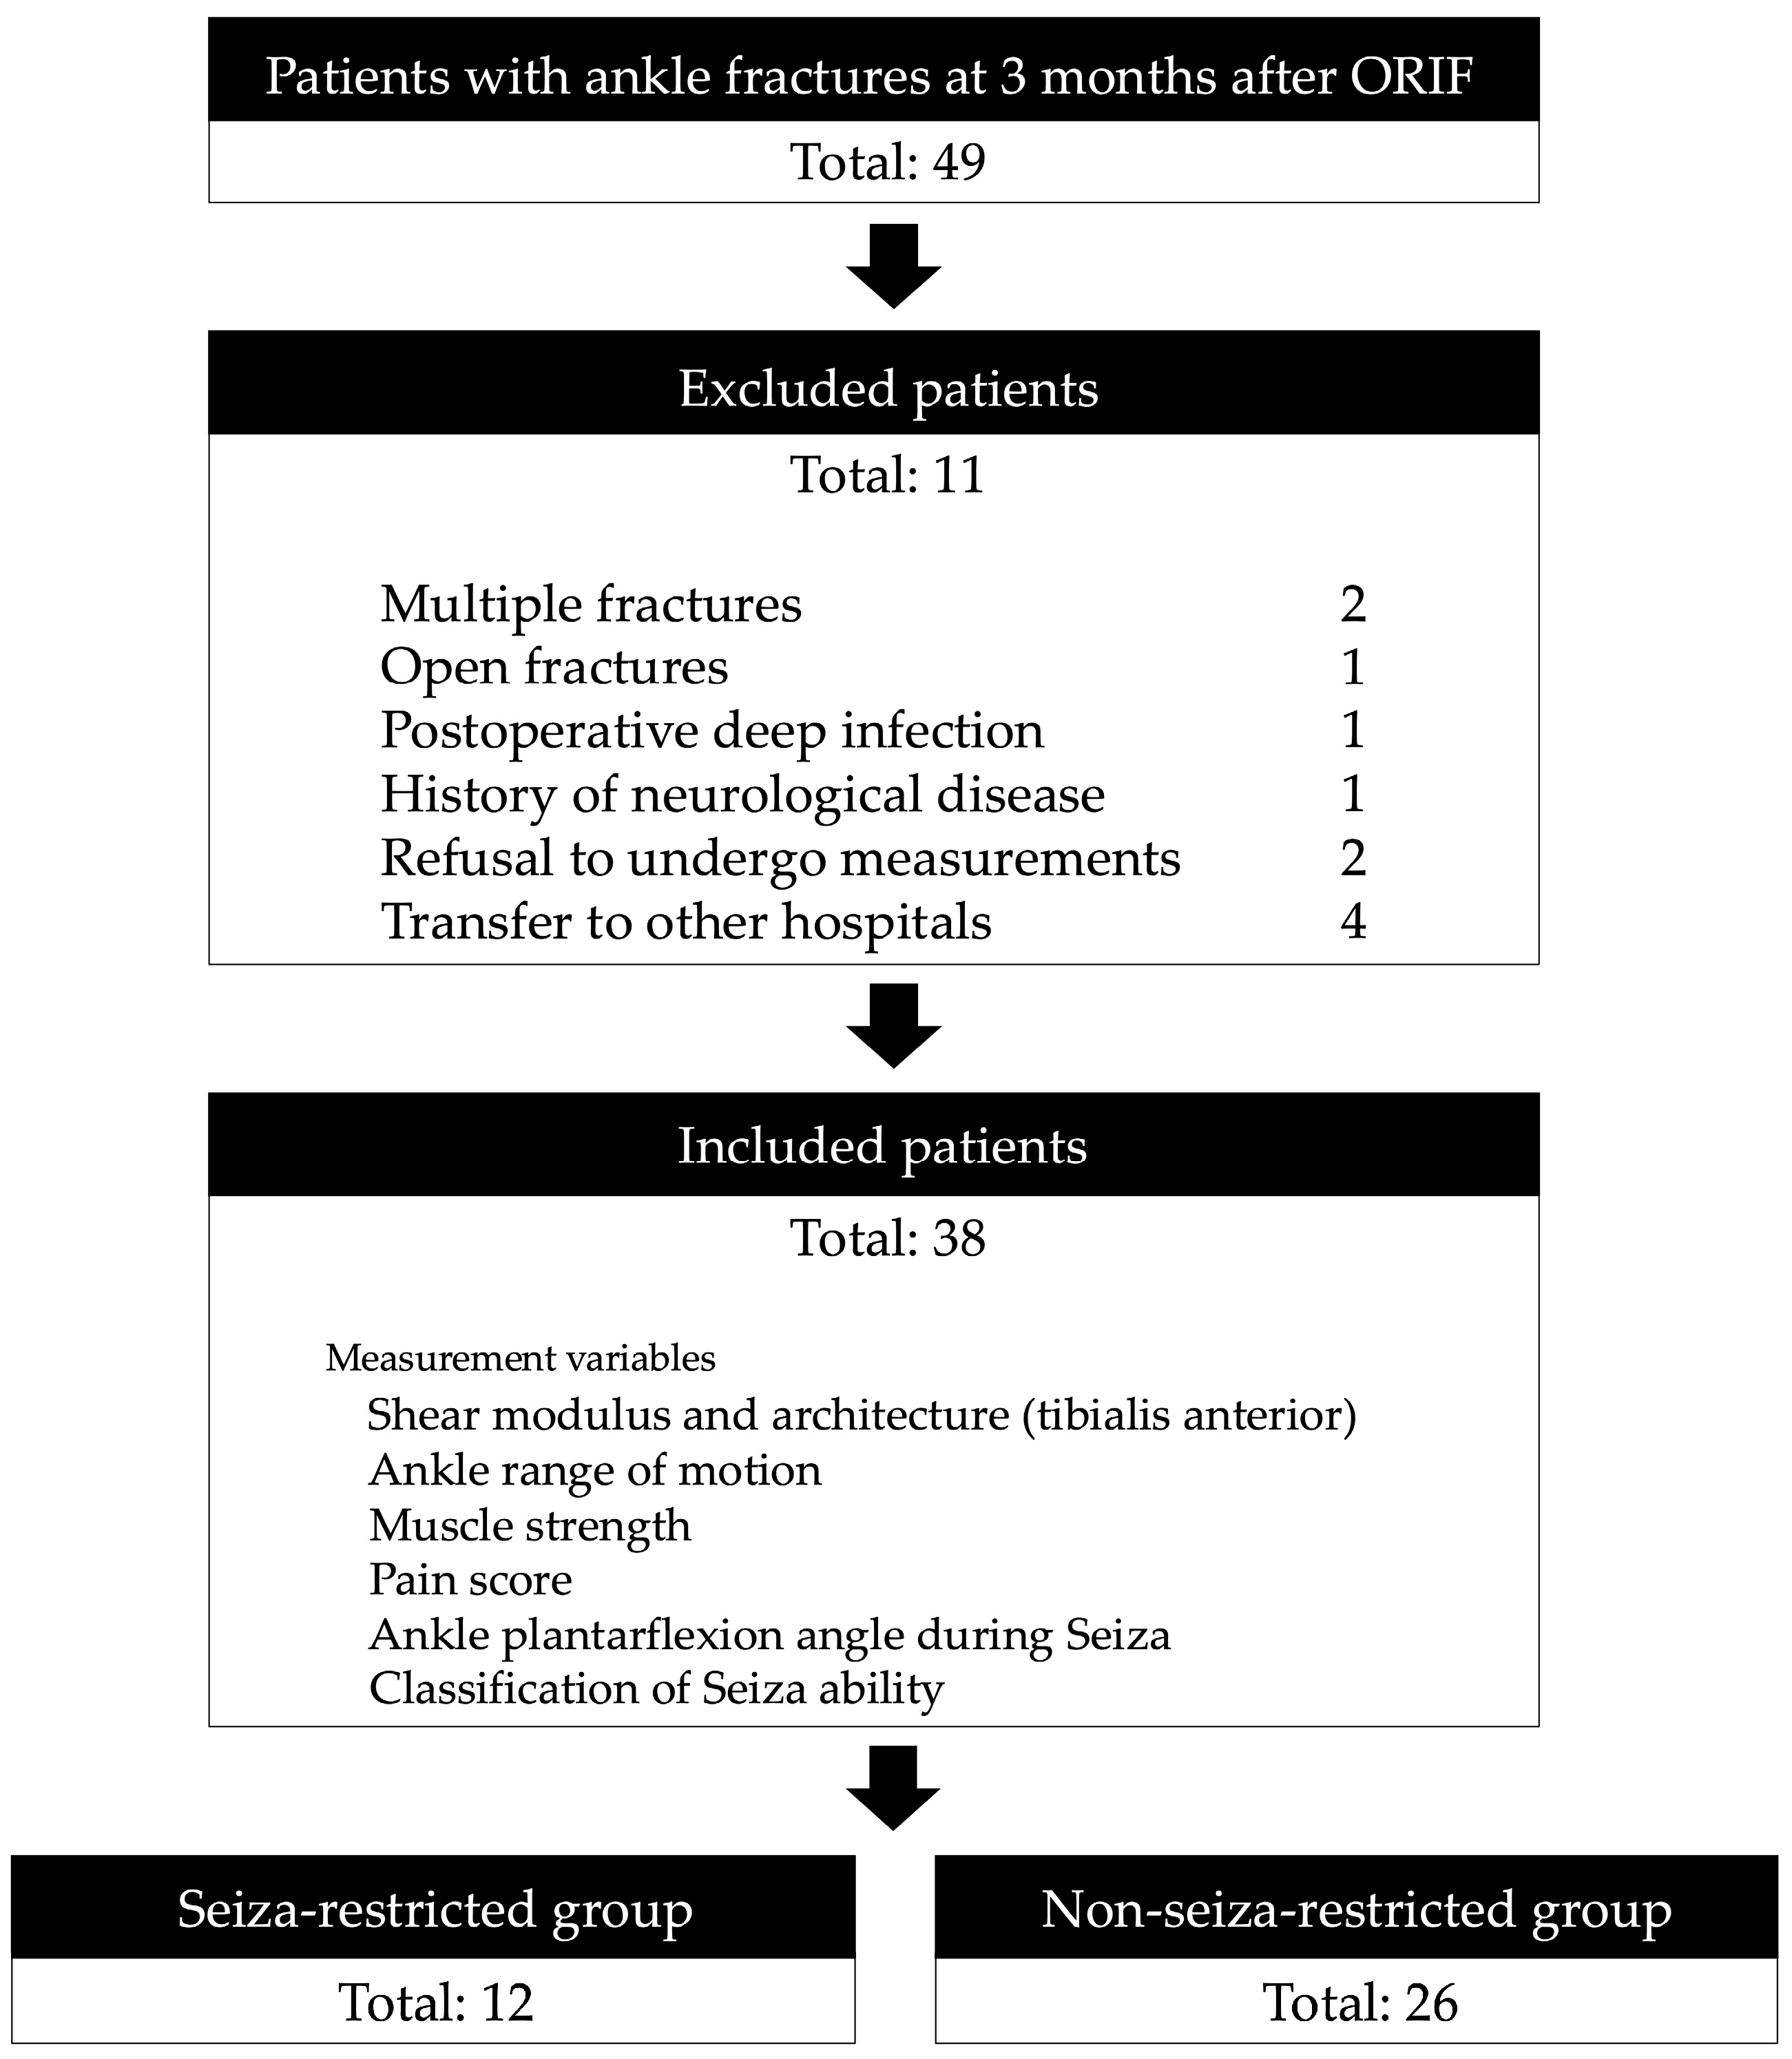
2.1. Participants
2.2. Measurement of the Ankle Plantarflexion Angle During Seiza and Classification of Seiza Performance
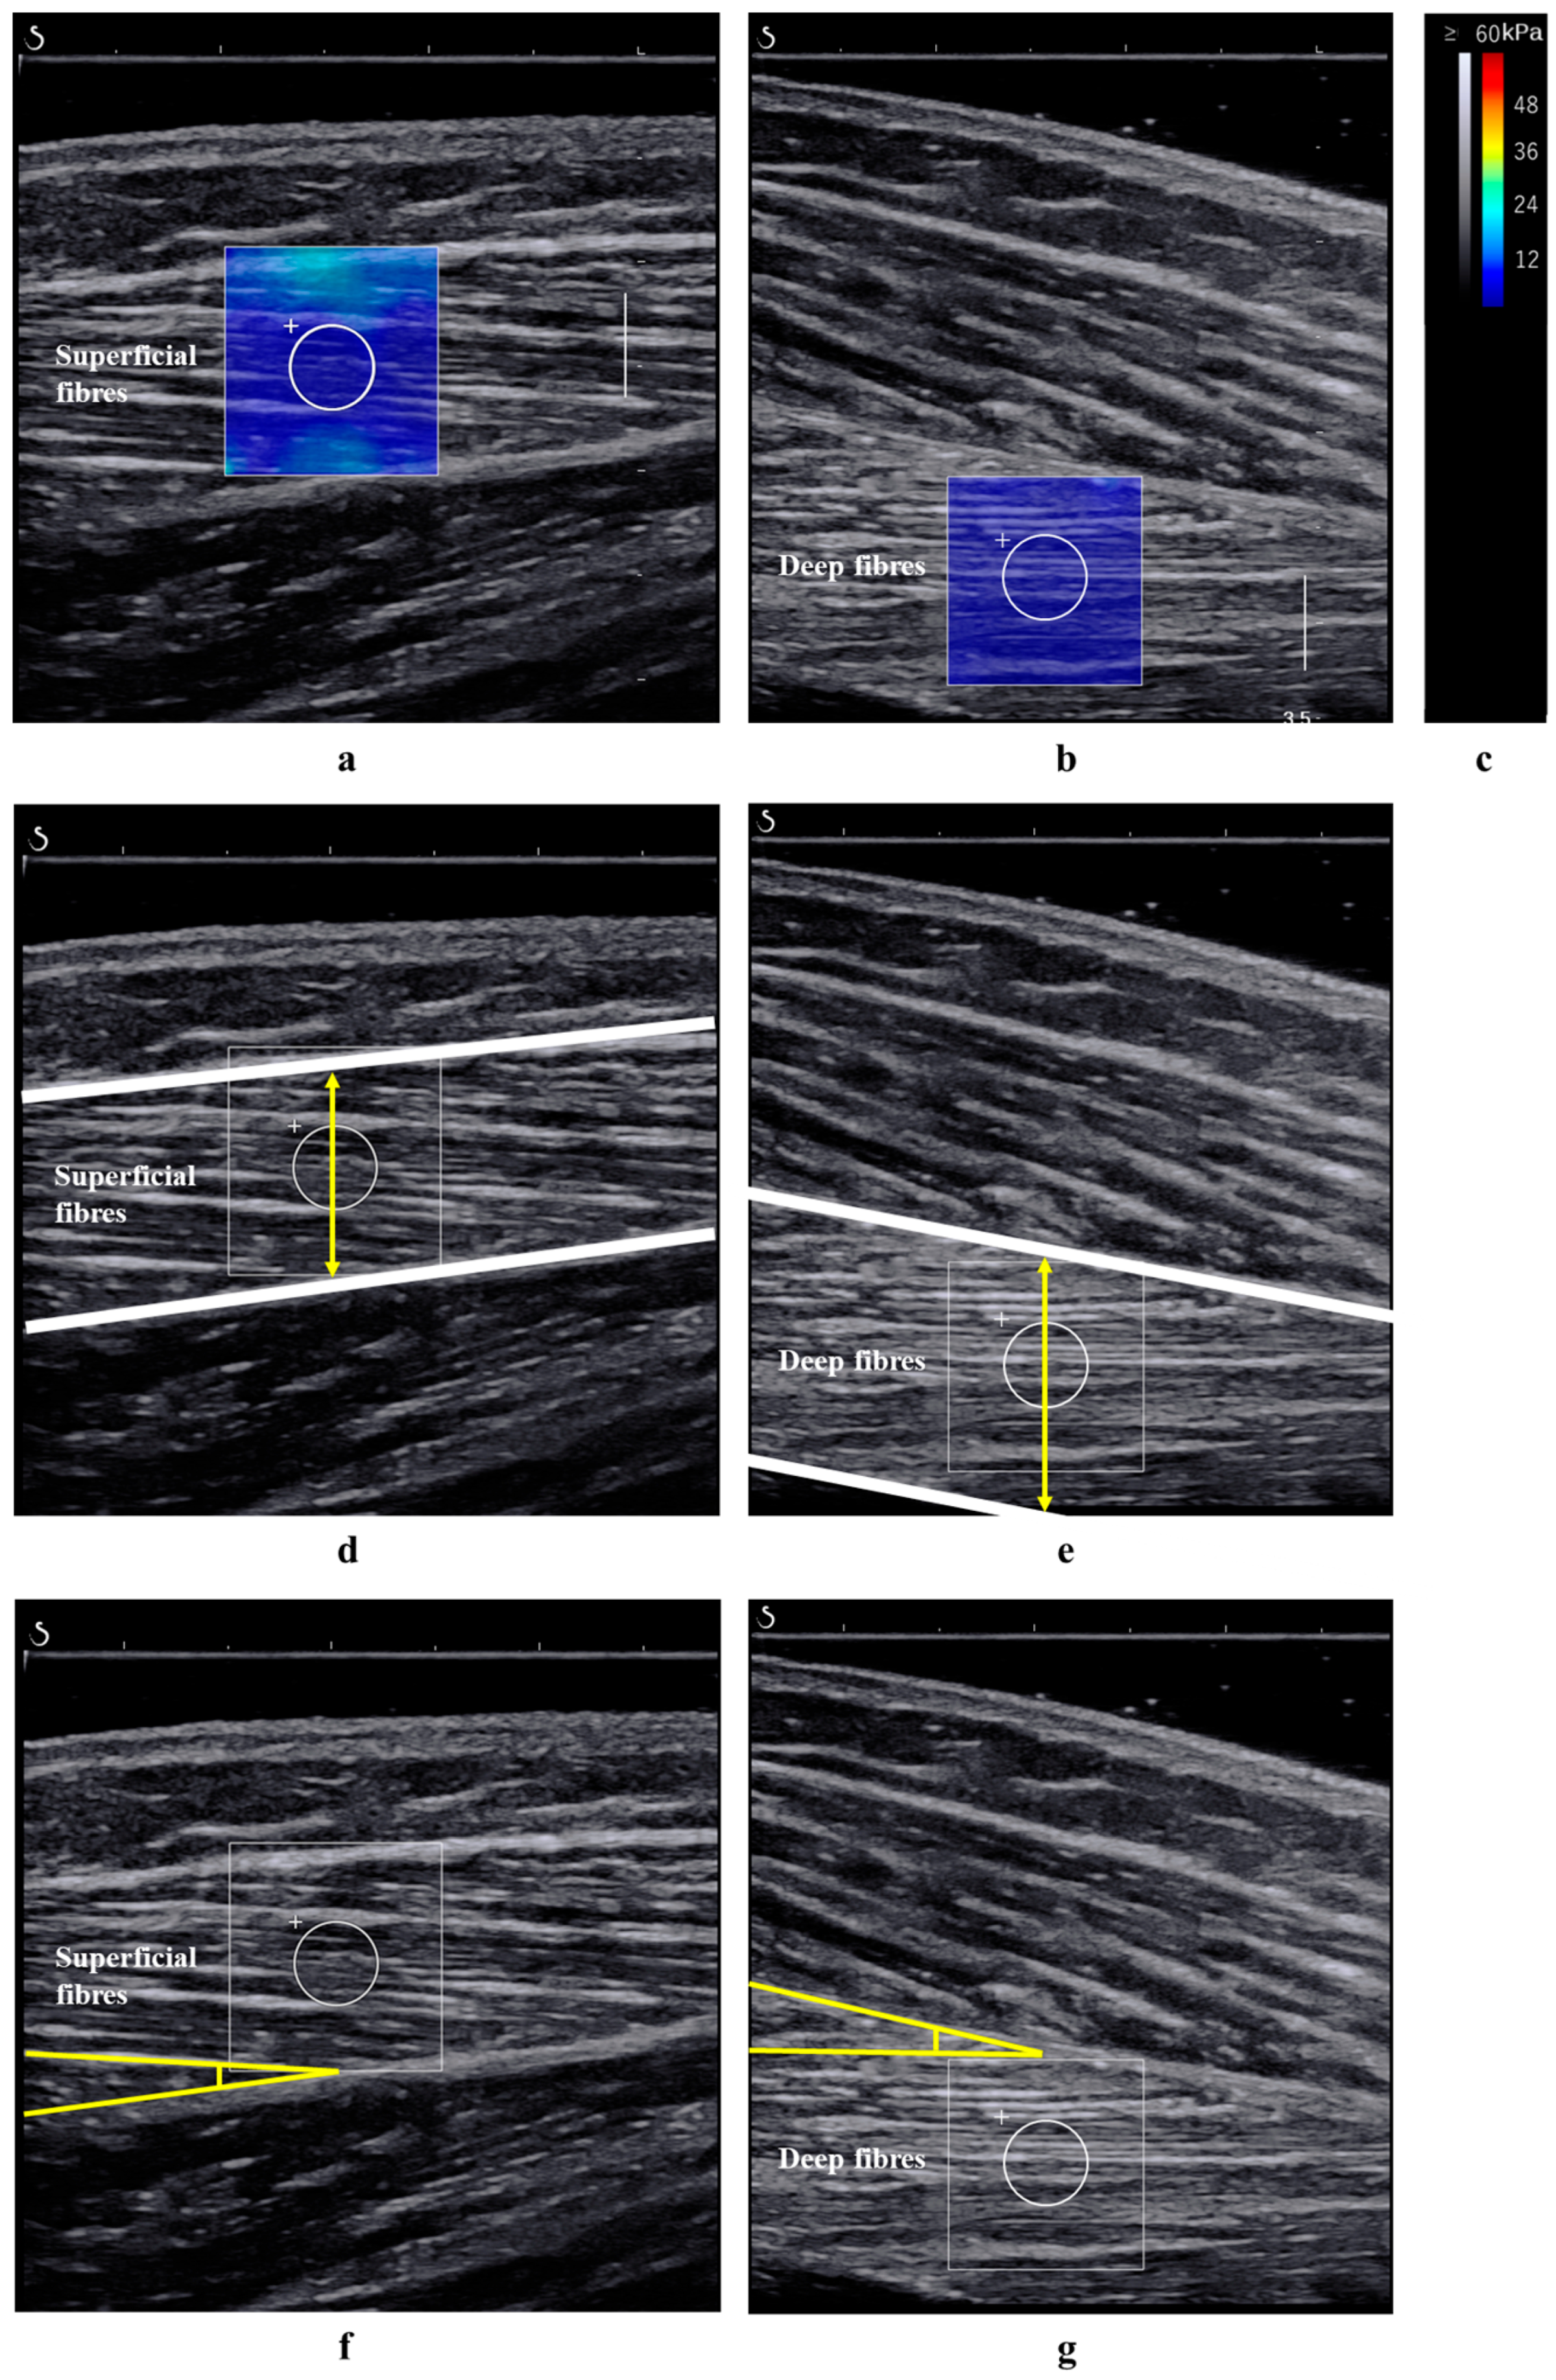
2.3. Measurement of the Shear Modulus and Architecture of the TA Muscle
2.4. Measurement of Ankle ROM
2.5. Measurement of Ankle Muscle Strength
2.6. Measurement of Ankle Pain During Seiza
2.7. Statistical Analyses
3. Results
3.1. Participants′ Characteristics
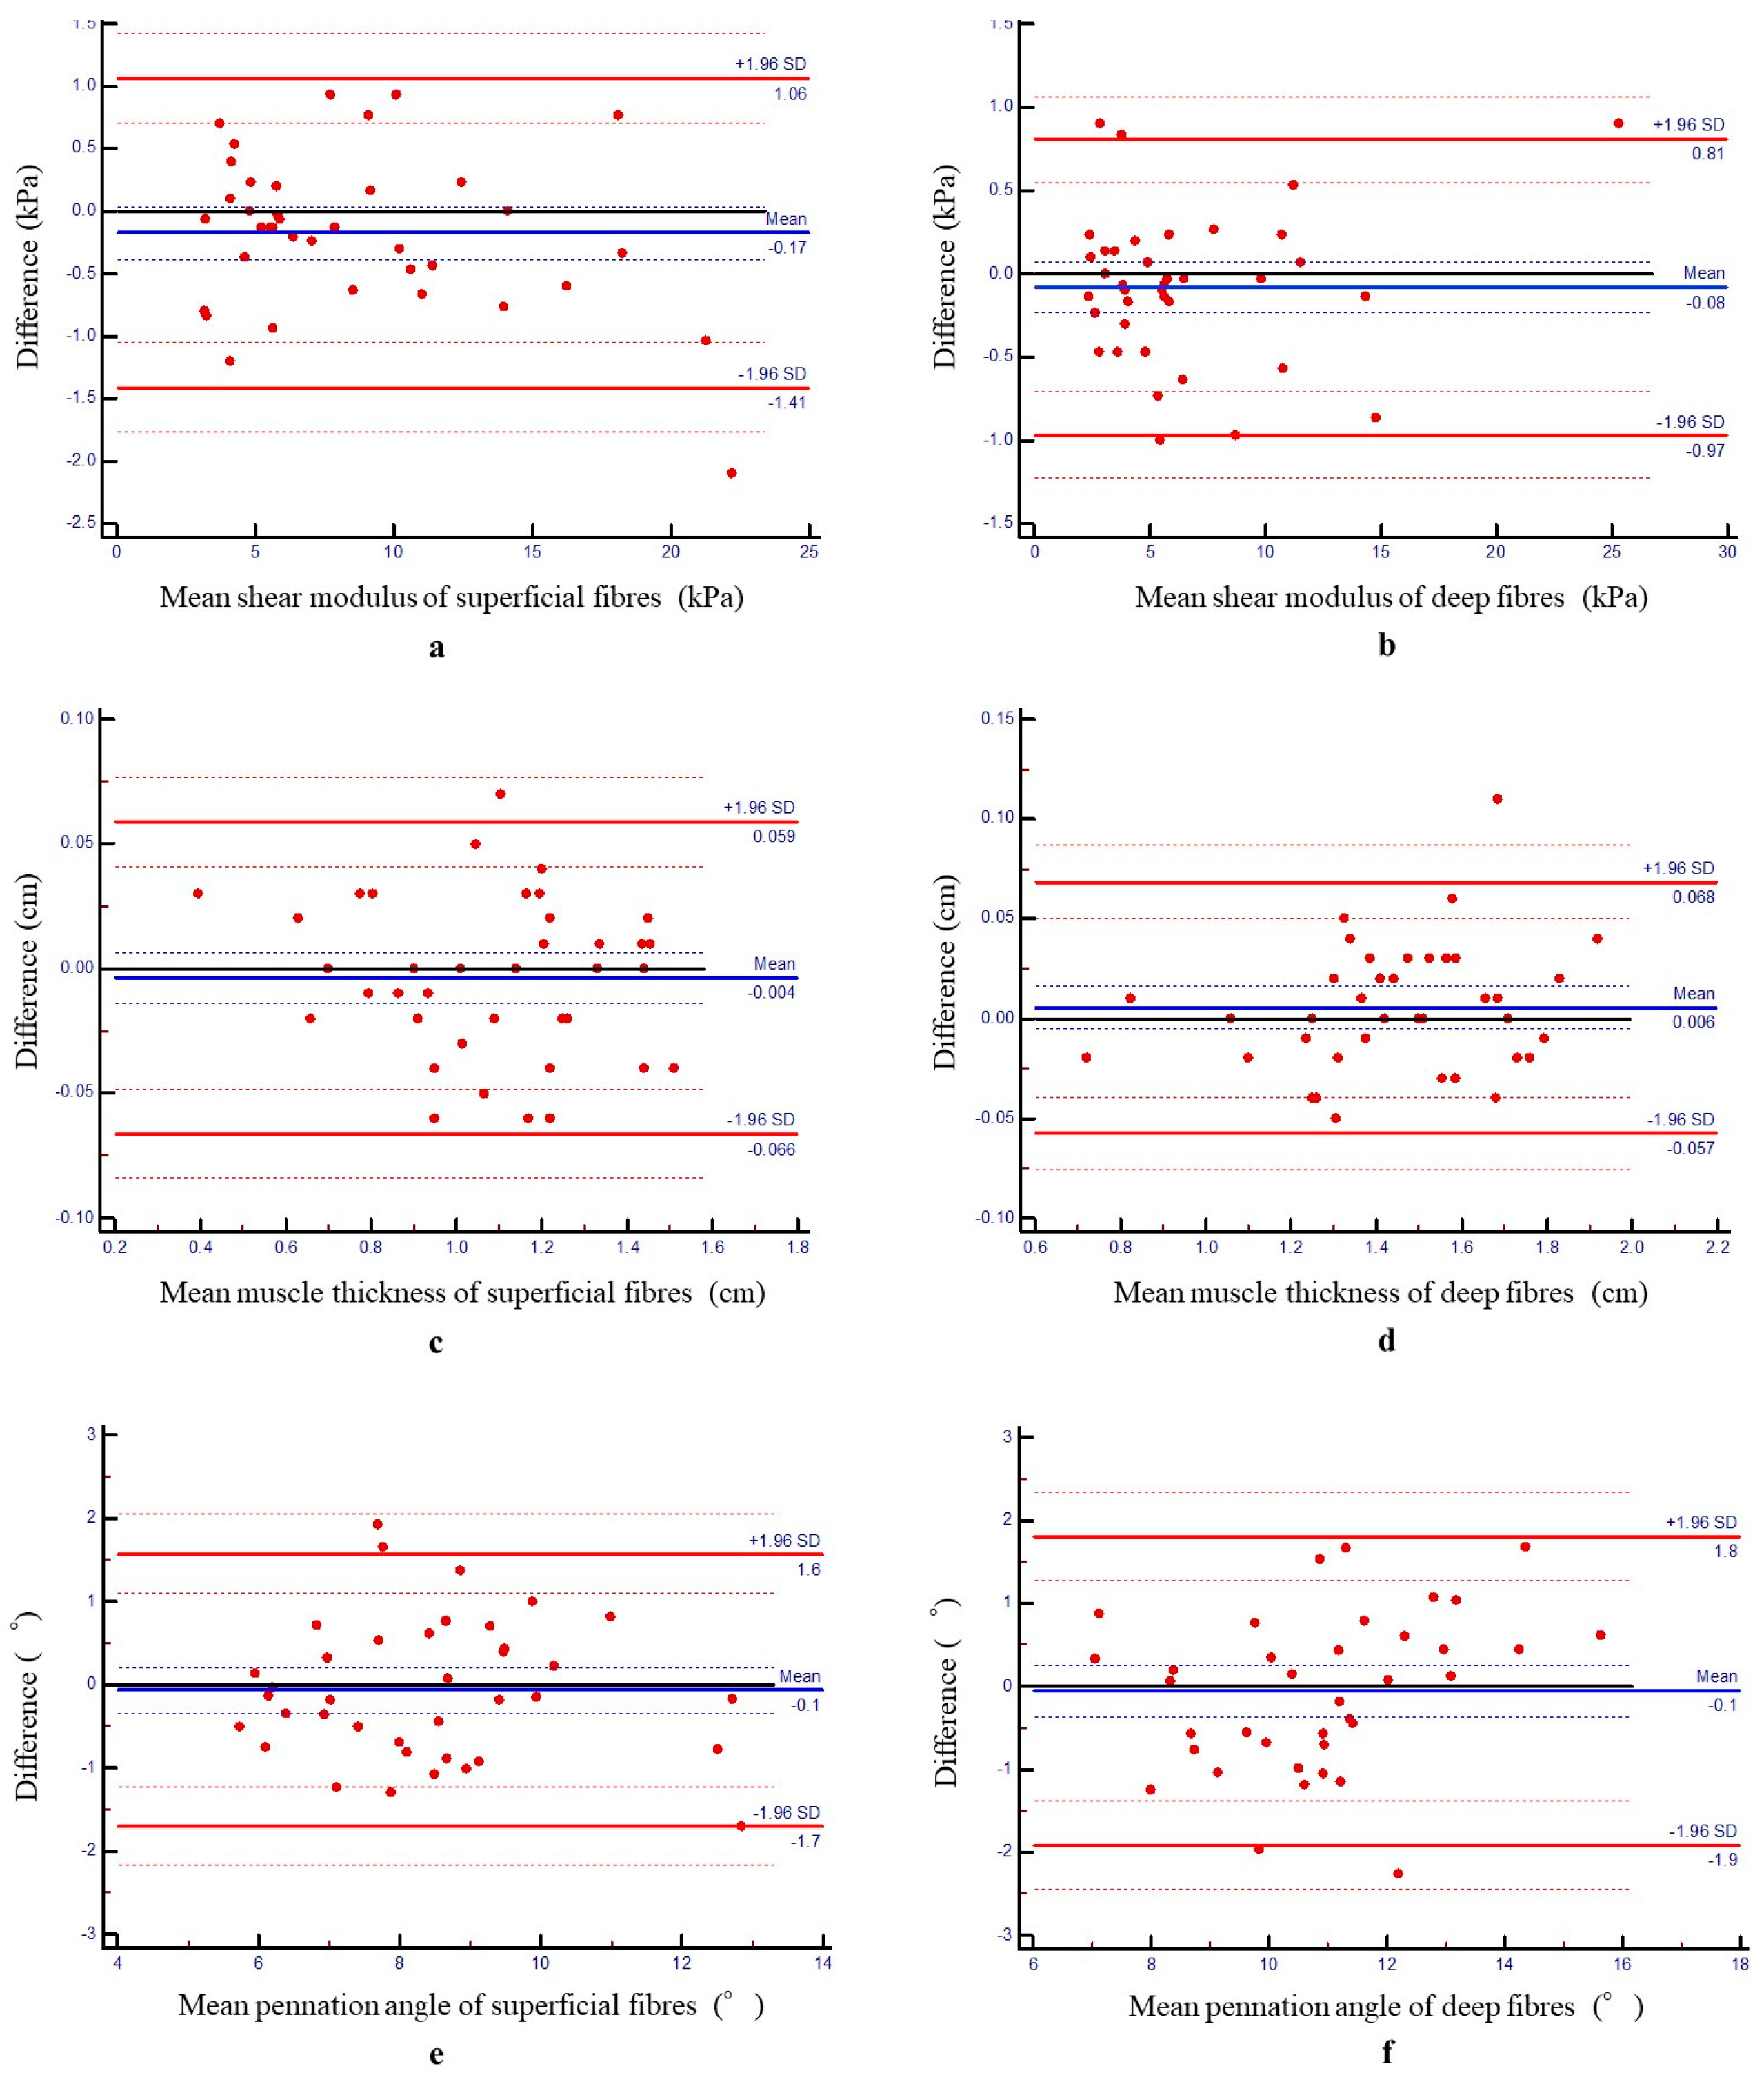
3.2. Intrarater Reliability
3.3. Comparison Between Two Groups Based on Seiza Ability (Seiza-Restricted Group vs. Non-Seiza-Restricted Group)
3.4. Correlation Coefficients
3.5. Simple and Multiple Linear Regression Analyses
3.6. ROC Analysis of Shear Modulus for Seiza Ability Prediction
3.7. Logistic Regression Analysis
4. Discussion
5. Conclusions
Author Contributions
Funding
Institutional Review Board Statement
Informed Consent Statement
Data Availability Statement
Conflicts of Interest
Abbreviations
| AUC | Area under the curve |
| CI | Confidence interval |
| CV | Coefficient of variation in the differences |
| ICC(1,1) | Intraclass correlation coefficient |
| MDC | Minimal detectable change |
| ORIF | Open reduction and internal fixation |
| ROC | Receiver operating characteristic |
| ROM | Range of motion |
| RR | Relative repeatability |
| SEM | Standard error of measurement |
| SWE | Shear wave elastography |
| TA | Tibialis anterior |
References
- Demura, S.; Uchiyama, M. Effect of Japanese sitting style (seiza) on the center of foot pressure after standing. J. Physiol. Anthr. Appl. Hum. Sci. 2005, 24, 167–173. [Google Scholar] [CrossRef] [PubMed]
- Fujita, K.; Makimoto, K.; Mawatari, M. Three-year follow-up study of health related QOL and lifestyle indicators for Japanese patients after total hip arthroplasty. J. Orthop. Sci. 2016, 21, 191–198. [Google Scholar] [CrossRef] [PubMed]
- Moon, M.S.; Lee, H.; Kim, S.T.; Kim, S.J.; Kim, M.S.; Kim, D.S. Spinopelvic orientation on radiographs in various body postures: Upright standing, chair sitting, Japanese style kneel sitting, and Korean style cross-legged sitting. Clin. Orthop. Surg. 2018, 10, 322–327. [Google Scholar] [CrossRef]
- Niki, Y.; Takeda, Y.; Harato, K.; Suda, Y. Factors affecting the achievement of Japanese-style deep knee flexion after total knee arthroplasty using posterior-stabilized prosthesis with high-flex knee design. J. Orthop. Sci. 2015, 20, 1012–1018. [Google Scholar] [CrossRef] [PubMed]
- Niki, Y.; Takeda, Y.; Udagawa, K.; Enomoto, H.; Toyama, Y.; Suda, Y. Is greater than 145 degrees of deep knee flexion underweight bearing conditions safe after total knee arthroplasty?: A fluoroscopic analysis of Japanese-style deep knee flexion. Bone Jt. J. 2013, 95-B, 782–787. [Google Scholar] [CrossRef]
- Elsoe, R.; Ostgaard, S.E.; Larsen, P. Population-based epidemiology of 9767 ankle fractures. Foot Ankle Surg. 2018, 24, 34–39. [Google Scholar] [CrossRef]
- Ohno, H.; Murata, M.; Ozu, S.; Matsuoka, N.; Kawamura, H.; Iida, H. Midterm outcomes of high-flexion total knee arthroplasty on Japanese lifestyle. Acta Orthop. Traumatol. Turc. 2016, 50, 527–532. [Google Scholar] [CrossRef]
- Kitagawa, T.; Nakase, J.; Takata, Y.; Shimozaki, K.; Asai, K.; Toyooka, K.; Tsuchiya, H. Relationship between the deep flexion of the knee joint and the dynamics of the infrapatellar fat pad after anterior cruciate ligament reconstruction via ultrasonography. J. Phys. Ther. Sci. 2019, 31, 569–572. [Google Scholar] [CrossRef]
- Torii, Y.; Yagi, K.; Izumi, K.; Jones, B. The beneficial effect of mobilisation with movement therapy for patients with limited plantar flexion after malleolar fracture surgery: A case study. J. Man. Phys. Ther. 2019, 19, 3–7. [Google Scholar]
- Court-Brown, C.M.; Caesar, B. Epidemiology of adult fractures: A review. Injury 2006, 37, 691–697. [Google Scholar] [CrossRef]
- Thur, C.K.; Edgren, G.; Jansson, K.Å.; Wretenberg, P. Epidemiology of adult ankle fractures in Sweden between 1987 and 2004: A population-based study of 91,410 Swedish inpatients. Acta Orthop. 2012, 83, 276–281. [Google Scholar] [CrossRef]
- Kannus, P.; Palvanen, M.; Niemi, S.; Parkkari, J.; Järvinen, M. Stabilizing incidence of low-trauma ankle fractures in elderly people Finnish statistics in 1970–2006 and prediction for the future. Bone 2008, 43, 340–342. [Google Scholar] [CrossRef]
- Ekinci, M.; Birisik, F.; Ersin, M.; Şahinkaya, T.; Öztürk, İ. A prospective evaluation of strength and endurance of ankle dorsiflexors-plantar flexors after conservative management of lateral malleolar fractures. Turk. J. Phys. Med. Rehabil. 2021, 67, 300–307. [Google Scholar] [CrossRef]
- Keith, L.; Moore, A.; Agur, A. Clinically Oriented Anatomy; Lippincott Williams & Wilkins: Philadelphia, PA, USA, 2006. [Google Scholar]
- Maganaris, C.N.; Baltzopoulos, V. Predictability of in vivo changes in pennation angle of human tibialis anterior muscle from rest to maximum isometric dorsiflexion. Eur. J. Appl. Physiol. Occup. Physiol. 1999, 79, 294–297. [Google Scholar] [CrossRef]
- Alexander, R.M. The dimensions of knee and ankle muscles and the forces they exert. J. Hum. Mov. Stud. 1975, 1, 115–123. [Google Scholar]
- Martin-Rodriguez, S.; Gonzalez-Henriquez, J.J.; Galvan-Alvarez, V.; Cruz-Ramírez, S.; Calbet, J.A.; Sanchis-Moysi, J. Architectural anatomy of the human tibialis anterior presents morphological asymmetries between superficial and deep unipennate regions. J. Anat. 2023, 243, 664–673. [Google Scholar] [CrossRef] [PubMed]
- Miyasaka, H.; Ebihara, B.; Fukaya, T.; Mutsuzaki, H. Absolute reliability of Young’s modulus of the soleus muscle and Achilles tendon measured using shear wave elastography in healthy young males. Asia Pac. J. Sports Med. Arthrosc. Rehabil. Technol. 2024, 37, 1–7. [Google Scholar] [CrossRef] [PubMed]
- Koo, T.K.; Guo, J.Y.; Cohen, J.H.; Parker, K.J. Relationship between shear elastic modulus and passive muscle force: An ex-vivo study. J. Biomech. 2013, 46, 2053–2059. [Google Scholar] [CrossRef]
- Raiteri, B.J.; Cresswell, A.G.; Lichtwark, G.A. Muscle-tendon length and force affect human tibialis anterior central aponeurosis stiffness in vivo. Proc. Natl. Acad. Sci. USA 2018, 115, E3097–E3105. [Google Scholar] [CrossRef]
- Fonseca, L.L.D.; Nunes, I.G.; Nogueira, R.R.; Martins, G.E.V.; Mesencio, A.C.; Kobata, S.I. Reproducibility of the Lauge-Hansen, Danis-Weber, and AO classifications for ankle fractures. Rev. Bras. Ortop. 2018, 53, 101–106. [Google Scholar] [CrossRef]
- Budny, A.M.; Young, B.A. Analysis of radiographic classifications for rotational ankle fractures. Clin. Podiatr. Med. Surg. 2008, 25, 139–152. [Google Scholar] [CrossRef] [PubMed]
- Lauge-Hansen, N. Ligamentous ankle fractures; diagnosis and treatment. Acta Chir. Scand. 1949, 97, 544–550. [Google Scholar]
- Gennisson, J.L.; Deffieux, T.; Macé, E.; Montaldo, G.; Fink, M.; Tanter, M. Viscoelastic and anisotropic mechanical properties of in vivo muscle tissue assessed by supersonic shear imaging. Ultrasound Med. Biol. 2010, 36, 789–801. [Google Scholar] [CrossRef]
- Muanjai, P.; Mickevicius, M.; Snieckus, A.; Jones, D.A.; Zachovajevas, P.; Satkunskiene, D.; Venckunas, T.; Kamandulis, S. Response of knee extensor muscle-tendon unit stiffness to unaccustomed and repeated high-volume eccentric exercise. Int. J. Environ. Res. Public Health 2021, 18, 4510. [Google Scholar] [CrossRef]
- Koo, T.K.; Guo, J.Y.; Cohen, J.H.; Parker, K.J. Quantifying the passive stretching response of human tibialis anterior muscle using shear wave elastography. Clin. Biomech. 2014, 29, 33–39. [Google Scholar] [CrossRef]
- Kot, B.C.W.; Zhang, Z.J.; Lee, A.W.C.; Leung, V.Y.F.; Fu, S.N. Elastic modulus of muscle and tendon with shear wave ultrasound elastography: Variations with different technical settings. PLoS ONE 2012, 7, e44348. [Google Scholar] [CrossRef]
- Miyasaka, H.; Ebihara, B.; Fukaya, T.; Mutsuzaki, H. Evaluation of the relationship between echo intensity and Young’s modulus of the soleus muscle using ultrasound images after ankle fracture surgery. Cureus 2024, 16, e69218. [Google Scholar] [CrossRef] [PubMed]
- Joyce, C.R.; Zutshi, D.W.; Hrubes, V.; Mason, R.M. Comparison of fixed interval and visual analogue scales for rating chronic pain. Eur. J. Clin. Pharmacol. 1975, 8, 415–420. [Google Scholar] [CrossRef] [PubMed]
- Faul, F.; Erdfelder, E.; Buchner, A.; Lang, A.-G. Statistical power analyses using G*Power 3.1: Tests for correlation and regression analyses. Behav. Res. Methods 2009, 41, 1149–1160. [Google Scholar] [CrossRef]
- Weir, J.P. Quantifying test–retest reliability using the intraclass correlation coefficient and the SEM. J. Strength. Cond. Res. 2005, 19, 231–240. [Google Scholar] [CrossRef]
- Faber, M.J.; Bosscher, R.J.; Van Wieringen, P.C.W. Clinimetric properties of the performance-oriented mobility assessment. Phys. Ther. 2006, 86, 944–954. [Google Scholar] [CrossRef]
- Shankar, H.; Taranath, D.; Santhirathelagan, C.T.; Pesudovs, K. Anterior segment biometry with the Pentacam: Comprehensive assessment of repeatability of automated measurements. J. Cataract. Refract. Surg. 2008, 34, 103–113. [Google Scholar] [CrossRef]
- Domholdt, E. Physical Therapy Research: Principles and Applications; W. B. Saunders: Philadelphia, PA, USA, 1993. [Google Scholar]
- James, G.; Witten, D.; Hastie, T.; Tibshirani, R. An Introduction to Statistical Learning: With Applications in R; Springer: New York, NY, USA, 2013. [Google Scholar]
- Akobeng, A.K. Understanding diagnostic tests 3: Receiver operating characteristic curves. Acta Paediatr. 2007, 96, 644–647. [Google Scholar] [CrossRef]
- Yatsuya, H.; Li, Y.; Hirakawa, Y.; Ota, A.; Matsunaga, M.; Haregot, H.E.; Chiang, C.; Zhang, Y.; Tamakoshi, K.; Toyoshima, H.; et al. A point system for predicting 10-year risk of developing type 2 diabetes mellitus in Japanese men: Aichi workers’ cohort study. J. Epidemiol. 2018, 28, 347–352. [Google Scholar] [CrossRef]
- Cohen, J. Statistical Power Analysis for the Behavioral Sciences, 2nd ed.; Lawrence Erlbaum: Hillsdale, NJ, USA, 1988. [Google Scholar]
- Chleboun, G.S.; Howell, J.N.; Conatser, R.R.; Giesey, J.J. The relationship between elbow flexor volume and angular stiffness at the elbow. Clin. Biomech. 1997, 12, 383–392. [Google Scholar] [CrossRef]
- Kimata, K.; Otsuka, S.; Yokota, H.; Shan, X.; Hatayama, N.; Naito, M. Relationship between attachment site of tibialis anterior muscle and shape of tibia: Anatomical study of cadavers. J. Foot Ankle Res. 2022, 15, 54. [Google Scholar] [CrossRef]
- McNeill, W. Adapting to floor sitting and kneeling. J. Bodyw. Mov. Ther. 2017, 21, 731–735. [Google Scholar] [CrossRef] [PubMed]
- Souron, R.; Bordat, F.; Farabet, A.; Belli, A.; Feasson, L.; Nordez, A.; Lapole, T. Sex differences in active tibialis anterior stiffness evaluated using supersonic shear imaging. J. Biomech. 2016, 49, 3534–3537. [Google Scholar] [CrossRef] [PubMed]
- Boulard, C.; Mathevon, L.; Arnaudeau, L.F.; Gautheron, V.; Calmels, P. Reliability of shear wave elastography and ultrasound measurement in children with unilateral spastic cerebral palsy. Ultrasound Med. Biol. 2021, 47, 1204–1211. [Google Scholar] [CrossRef]
- Cornelson, S.M.; Ruff, A.N.; Perillat, M.; Kettner, N.W. Sonoelastography of the trunk and lower extremity muscles in a case of Duchenne muscular dystrophy. J. Ultrasound 2021, 24, 343–347. [Google Scholar] [CrossRef] [PubMed]


| Measurement Variables | Test 1 | Test 2 | ICC | 95% CI | SEM | CV (%) | MDC95 | RR |
|---|---|---|---|---|---|---|---|---|
| Superficial fibres | ||||||||
| Shear modulus (kPa) | 8.59 | 8.76 | 0.99 | 0.98–0.99 | 0.45 | 5.14 | 0.89 | 0.10 |
| Muscle thickness (cm) | 1.08 | 1.09 | 0.99 | 0.98–0.99 | 0.02 | 2.07 | 0.06 | 0.06 |
| Pennation angle (°) | 8.42 | 8.48 | 0.90 | 0.82–0.95 | 0.59 | 7.00 | 1.64 | 0.19 |
| Deep fibres | ||||||||
| Shear modulus (kPa) | 6.42 | 6.50 | 0.99 | 0.98–0.99 | 0.32 | 4.95 | 1.23 | 0.19 |
| Muscle thickness (cm) | 1.45 | 1.44 | 0.99 | 0.98–0.99 | 0.02 | 1.57 | 0.06 | 0.05 |
| Pennation angle (°) | 10.85 | 10.90 | 0.89 | 0.80–0.94 | 0.67 | 6.20 | 1.86 | 0.17 |
| Plantarflexion angle during seiza (°) | 57.9 | 57.7 | 0.99 | 0.98–0.99 | 0.59 | 1.02 | 1.64 | 0.03 |
| Ankle ROM (°) | ||||||||
| Dorsiflexion with knee extended | 12.7 | 12.6 | 0.95 | 0.91–0.98 | 0.54 | 4.27 | 1.50 | 0.12 |
| Dorsiflexion with knee flexed | 16.5 | 16.4 | 0.98 | 0.95–0.99 | 0.54 | 3.29 | 1.50 | 0.09 |
| Plantarflexion | 54.6 | 54.4 | 0.97 | 0.94–0.98 | 0.91 | 1.67 | 2.53 | 0.05 |
| Variables | Seiza Ability | p Value | Effect Size | |
|---|---|---|---|---|
| Seiza-Restricted Group (n = 12) | Non-Seiza-Restricted Group (n = 26) | |||
| Age (years) | 46.8 ± 17.9 | 45.1 ± 22.7 | 0.819 | 0.04 |
| Sex (male/female) | 4/8 | 14/12 | 0.239 | 0.19 |
| Height (m) | 1.58 ± 0.10 | 1.62 ± 0.07 | 0.121 | 0.26 |
| Weight (kg) | 62.3 (56.0–71.3) | 58.0 (50.5–71.5) | 0.471 | 0.12 |
| Body mass index (kg/m2) | 26.0 ± 4.8 | 23.6 ± 4.9 | 0.176 | 0.22 |
| Muscle thickness (cm) | ||||
| Superficial fibres | 1.06 ± 0.18 | 1.09 ± 0.30 | 0.684 | 0.07 |
| Deep fibres | 1.39 ± 0.28 | 1.47 ± 0.25 | 0.373 | 0.15 |
| Pennation angle (°) | ||||
| Superficial fibres | 8.8 ± 2.3 | 8.2 ± 1.6 | 0.360 | 0.15 |
| Deep fibres | 10.5 ± 2.2 | 11.0 ± 2.1 | 0.510 | 0.11 |
| Shear modulus (kPa) | ||||
| Superficial fibres | 11.3 ± 6.9 | 7.3 ± 3.5 | 0.008 | 0.46 |
| Deep fibres | 11.1 ± 5.7 | 4.3 ± 1.2 | 0.001 | 0.77 |
| Dorsiflexion ROM with knee extended (°) | 14.0 (11.8–14.3) | 12.0 (10.0–14.0) | 0.211 | 0.20 |
| Dorsiflexion ROM with knee flexed (°) | 15.5 (14.0–18.0) | 17.5 (15.0–19.3) | 0.527 | 0.10 |
| Plantarflexion ROM (°) | 50.8 ± 6.3 | 56.3 ± 3.0 | 0.012 | 0.62 |
| Plantarflexion angle during seiza (°) | 54.3 ± 6.8 | 59.5 ± 3.5 | 0.012 | 0.40 |
| Plantarflexion muscle strength (Nm/kg) | 0.30 ± 0.18 | 0.39 ± 0.20 | 0.185 | 0.22 |
| Dorsiflexion muscle strength (Nm/kg) | 0.31 (0.25–0.34) | 0.36 (0.27–0.43) | 0.123 | 0.25 |
| Ankle pain during seiza (mm) | 30.0 (20.0–50.0) | 0.0 (0.0–0.0) | 0.013 | 0.40 |
| Variables | Ankle Plantarflexion Angle During Seiza | |
|---|---|---|
| Correlation Coefficient | p Value | |
| Muscle thickness | ||
| Superficial fibres | 0.216 a | 0.193 |
| Deep fibres | 0.161 a | 0.335 |
| Pennation angle | ||
| Superficial fibres | −0.272 a | 0.100 |
| Deep fibres | 0.204 a | 0.219 |
| Shear modulus | ||
| Superficial fibres | −0.692 a | <0.001 |
| Deep fibres | −0.731 a | <0.001 |
| Ankle range of motion | ||
| Dorsiflexion with extended knee | 0.172 b | 0.303 |
| Dorsiflexion with flexed knee | 0.298 b | 0.069 |
| Plantar flexion | 0.930 a | <0.001 |
| Ankle strength | ||
| Plantarflexion | 0.225 a | 0.175 |
| Dorsiflexion | 0.243 b | 0.141 |
| Ankle pain during seiza | −0.585 b | <0.001 |
| Dependent Variables | Simple Linear Regression | Multiple Linear Regression | ||||
|---|---|---|---|---|---|---|
| β | p Value | β | p Value | R2 | VIF | |
| Shear modulus deep fibres | −0.731 | <0.001 | −0.454 | <0.001 | 0.624 | 1.651 |
| Shear modulus superficial fibres | −0.692 | <0.001 | −0.339 | 0.017 | 1.801 | |
| Ankle pain during seiza | −0.585 | <0.001 | −0.151 | 0.249 | 1.631 | |
Disclaimer/Publisher’s Note: The statements, opinions and data contained in all publications are solely those of the individual author(s) and contributor(s) and not of MDPI and/or the editor(s). MDPI and/or the editor(s) disclaim responsibility for any injury to people or property resulting from any ideas, methods, instructions or products referred to in the content. |
© 2025 by the authors. Licensee MDPI, Basel, Switzerland. This article is an open access article distributed under the terms and conditions of the Creative Commons Attribution (CC BY) license (https://creativecommons.org/licenses/by/4.0/).
Share and Cite
Miyasaka, H.; Ebihara, B.; Fukaya, T.; Iwai, K.; Kubota, S.; Mutsuzaki, H. Association Between Stiffness of the Deep Fibres of the Tibialis Anterior Muscle and Seiza Posture Performance After Ankle Fracture Surgery. J. Funct. Morphol. Kinesiol. 2025, 10, 300. https://doi.org/10.3390/jfmk10030300
Miyasaka H, Ebihara B, Fukaya T, Iwai K, Kubota S, Mutsuzaki H. Association Between Stiffness of the Deep Fibres of the Tibialis Anterior Muscle and Seiza Posture Performance After Ankle Fracture Surgery. Journal of Functional Morphology and Kinesiology. 2025; 10(3):300. https://doi.org/10.3390/jfmk10030300
Chicago/Turabian StyleMiyasaka, Hayato, Bungo Ebihara, Takashi Fukaya, Koichi Iwai, Shigeki Kubota, and Hirotaka Mutsuzaki. 2025. "Association Between Stiffness of the Deep Fibres of the Tibialis Anterior Muscle and Seiza Posture Performance After Ankle Fracture Surgery" Journal of Functional Morphology and Kinesiology 10, no. 3: 300. https://doi.org/10.3390/jfmk10030300
APA StyleMiyasaka, H., Ebihara, B., Fukaya, T., Iwai, K., Kubota, S., & Mutsuzaki, H. (2025). Association Between Stiffness of the Deep Fibres of the Tibialis Anterior Muscle and Seiza Posture Performance After Ankle Fracture Surgery. Journal of Functional Morphology and Kinesiology, 10(3), 300. https://doi.org/10.3390/jfmk10030300


