Article

Reliability and Inter-Device Agreement Between a Portable Handheld Ultrasound Scanner and a Conventional Ultrasound System for Assessing the Thickness of the Rectus Femoris and Vastus Intermedius

School of Kinesiology, Louisiana State University, Baton Rouge, LA 70803, USA
*
Author to whom correspondence should be addressed.
J. Funct. Morphol. Kinesiol. 2025, 10(3), 299; https://doi.org/10.3390/jfmk10030299
Submission received: 21 May 2025 / Revised: 12 July 2025 / Accepted: 31 July 2025 / Published: 1 August 2025
(This article belongs to the Section Kinesiology and Biomechanics)

Abstract

Background: Ultrasound (U/S) can be used to evaluate skeletal muscle characteristics in clinical and sports settings. Handheld U/S devices have recently emerged as a cheaper and portable alternative to conventional U/S systems. However, further research is warranted on their reliability. We assessed the reliability and inter-device agreement between a handheld U/S device (Clarius L15 HD3) and a more conventional U/S system (GE LOGIQ e) for measuring the thickness of the rectus femoris (RF) and vastus intermedius (VI). Methods: Cross-sectional images of the RF and VI muscles were obtained in 20 participants by two assessors, and on two separate occasions by one of those assessors, using the Clarius L15 HD3 and GE LOGIQ e devices. RF and VI thickness measurements were obtained to determine the intra-rater reliability, inter-rater reliability, and inter-device agreement. Results: All intraclass correlation coefficients (ICCs) were above 0.9 for intra-rater reliability (range: 0.94 to 0.97), inter-rater reliability (ICC: 0.97), and inter-device agreement (ICC: 0.98) when comparing the two devices in assessing RF and VI thickness. For the RF, the Bland–Altman plot revealed a mean difference of 0.06 ± 0.07 cm, with limits of agreement ranging from 0.21 to −0.09, whereas for the VI, the Bland–Altman plot showed a mean difference of 0.07 ± 0.10 cm, with limits of agreement ranging from 0.27 to −0.13. Conclusions: The handheld Clarius L15 HD3 was reliable and demonstrated high agreement with the more conventional GE LOGIQ e for assessing the thickness of the RF and VI in young, healthy adults.

1. Introduction

Strategies for reliably and routinely assessing skeletal muscle characteristics are of relevance to clinical and sports settings. From a clinical perspective, the assessment of skeletal muscle mass combined with measures of physical function is used to identify individuals with sarcopenia [1]. Sarcopenia is an age-related syndrome associated with a higher risk of falls and fractures [2], hospitalizations [3], cognitive impairment [4], osteopenia [5], metabolic syndrome [6], and other adverse outcomes, including all-cause mortality [7]. From an athletic/sports perspective, the ability to accurately assess chronic skeletal muscle adaptations in response to training, as well as morphologic alterations associated with previous or ongoing skeletal muscle injuries, is important and can inform training and rehabilitation strategies to optimize performance.
Computed tomography (CT), magnetic resonance imaging (MRI), and dual X-ray absorptiometry (DXA) are well-established techniques for assessing musculoskeletal characteristics, particularly in clinical settings. However, they all exhibit major limitations, such as high costs and lack of portability [8,9]. Additionally, routine use of CT is limited by its ionizing radiation [8,9]. Therefore, the frequent use of CT, MRI, and/or DXA to assess and monitor changes in skeletal muscle characteristics exhibits several challenges.
Several studies suggest that ultrasonography may be used as an alternative and more practical strategy for researchers and clinicians than the conventional and cumbersome imaging techniques (e.g., CT, MRI and DXA) for assessing muscle mass of selected muscle groups as opposed to whole-body muscle mass [9,10,11]. Ultrasound (U/S) has widely been used to assess muscle quantity (mass) via muscle thickness of the lower extremities, particularly the rectus femoris (RF) and vastus intermedius (VI) across different populations [12,13,14]. Specifically, the RF and VI have been used to monitor adaptations in response to resistance training [14] predict postoperative outcomes [12] and confirm the presence of sarcopenia in adults [13]. Additionally, greater muscle thickness of the RF and VI has been associated with lower pain scores and better function among adults with knee osteoarthritis [15]. Conventional U/S systems may be costly and not portable. The Clarius L15 HD3 (Clarius Mobile Health, Vancouver, BC, Canada) is a relatively inexpensive, pocket-sized, high-frequency, wireless, handheld ultrasound scanner that has the potential to efficiently and reliably assess skeletal muscle parameters in clinical and sports settings. However, to our knowledge the reliability of the Clarius L15 HD3 and its agreement with a conventional U/S system for measuring the thickness of the RF and VI have not been previously examined.
Measures of muscle mass are often used along with measures of muscle strength to provide a more thorough assessment of physical fitness and performance in athletes and to confirm the presence of sarcopenia in older adults [16]. However, correlations between measures of muscle mass and muscle strength present conflicting findings across different populations. For example, meta-analytic data demonstrated weak correlations between lower limb muscle strength and lower limb muscle size measured by U/S, CT, or MRI (r = 0.26) in adults [17]. Similarly, weak correlations between muscle strength and measures of muscle mass using DXA or the D3-creatine dilution method have been observed in older adults (r = 0.19–0.32) [18]. However, strong correlations between the 1-RM and lean body mass (r > 0.75) have been found in adult powerlifters [19]. The disparate findings on the relationship between muscle strength and muscle mass among studies may relate to differences in population characteristics and the methods employed to assess muscle mass. Thus, further research is warranted to understand the relationship between muscle mass and strength.
The primary aim of this study was to assess the reliability and inter-device agreement of the Clarius L15 HD3 with a more conventional U/S system (GE LOGIQ e, GE Healthcare, Chicago, IL, USA) by comparing thickness measurements of the RF and VI. Our secondary aim was to examine correlations between lower body strength based on the one-repetition maximum (1-RM) for leg extension and ultrasound-based thickness of the RF and VI.

2. Materials and Methods

2.1. Participants

Participants were eligible if they were between 18 and 40 years old, capable and willing to provide informed consent, and had no medical conditions based on the Physical Activity Readiness Questionnaire for Everyone (PARQ+) [20]. All interested individuals provided written informed consent before any data collection. Eligible participants were also asked to provide information on their physical activity levels using the International Physical Activity Questionnaire—Short Form (IPAQ-SF) [21]. Using non-probability sampling, our aim was to recruit thirty (n = 30) participants, of whom the first ten (n = 10) would allow standardization of operator training between the two assessors despite differences in their level of prior experience with ultrasonography. Specifically, the first assessor was a graduate student with three years of clinical research experience but no prior formal U/S training, whereas the second assessor was a scientist and Certified Clinical Densitometrist with over 20 years of experience in performing and analyzing body composition data, and over 5 years of experience using U/S. Thus, data from twenty (n = 20) participants were used for the present analysis, a sample size that is in line with previous literature [9,10,22,23]. All study procedures were approved by the Institutional Review Board (IRBAM-23-1397).

2.2. Training for Standardization of Ultrasound Measurements

Practice sessions were conducted to standardize U/S measurements prior to formal data collection and to familiarize the inexperienced operator with image acquisition using the U/S scanners, in line with previous work [22]. Specifically, the experienced assessor (BI) provided an orientation session that introduced the inexperienced assessor (CE) to the interface of the Clarius L15 HD3 (Clarius Mobile Health, Vancouver, BC, Canada) and GE LOGIQ e (GE Healthcare, Chicago, IL, USA), identification of the anatomical landmark for placement of the probe, probe positioning, and common issues related to image acquisition and identification of the skeletal muscles of interest. Subsequently, both assessors performed measurements on 10 subjects. During image acquisition of those 10 subjects, the experienced assessor (BI) had the opportunity to supervise the inexperienced assessor (CE) and discuss any technical discrepancies that would undermine standardization of image acquisition (e.g., position of the limb, pressure of the probe, amount of gel used, and anatomical landmarks for measurements). Following completion of the 10 subjects, assessors performed U/S measurements on 20 subjects independently. Overall, the inexperienced assessor had approximately 10 h of training prior to formal data collection.

2.3. Study Procedures

The study involved two visits to the Exercise Physiology Laboratory within the School of Kinesiology at Louisiana State University, separated by 5–7 days. All visits were conducted between 8:00 am and 2:00 pm and each participant visited the lab at the same time for both visits. Participants were instructed to avoid engaging in exercise for ≤12 h before each visit while keeping the amount of time since last engaging in exercise as consistent as possible for both visits.
During the first visit, participants’ anthropometric characteristics were measured using standard techniques. Before initiation of all U/S assessments, participants were required to rest while lying in the supine position for at least 15 min to avoid fluid shifts. During this rest period, landmarks were established for U/S location. Specifically, using Gulick tape, the distance between the greater trochanter and the lateral condyle of the right femur was measured and markers were placed at the midpoint so that ultrasonography could be performed at the anatomical region of interest [10]. Two assessors independently performed femur length measurement and midpoint identification (i.e., after one assessor completed his U/S assessment, the femur midpoint landmarks were removed so that the second assessor could establish his own landmarks). After 15 min of rest, participants’ RF and VI thickness of the right leg was independently assessed by the two assessors using both the Clarius L15 HD3 and GE LOGIQ e 12 L linear probes. Each assessor independently quantified participants’ RF and VI thickness using the built-in software of each U/S unit deriving measurements in real time. The assessors were not allowed to be present in the room together during study visits, including when measurements were taken. Specifically, the research coordinator would notify the second assessor to enter the room after completion of measurements by the other assessor. The data obtained from each assessor were extracted from the study coordinator and stored until analysis. Following the U/S measurements of the first visit, participants underwent 1-RM testing of leg extension of the right leg using standard procedures in line with previous work [24]. Specifically, participants performed a warm-up set of 8–10 repetitions at 40–50% of their perceived 1-RM followed. After 2 min of rest, participants were asked to perform another set of 5–6 repetitions at 60–70% of their perceived 1-RM. Following another 2 min rest, a third set of 3 repetitions at ~80% of the participants’ perceived maximum was introduced. Subsequently, 3 to 4 sets of a single repetition were used to determine the participant’s true 1-RM.
Approximately 5–7 days after the first visit, participants returned to the Exercise Physiology Laboratory for their second and final visit. During the second visit, the U/S measurements of the right RF and VI using both the Clarius L15 HD3 and GE LOGIQ e were repeated only by one assessor.

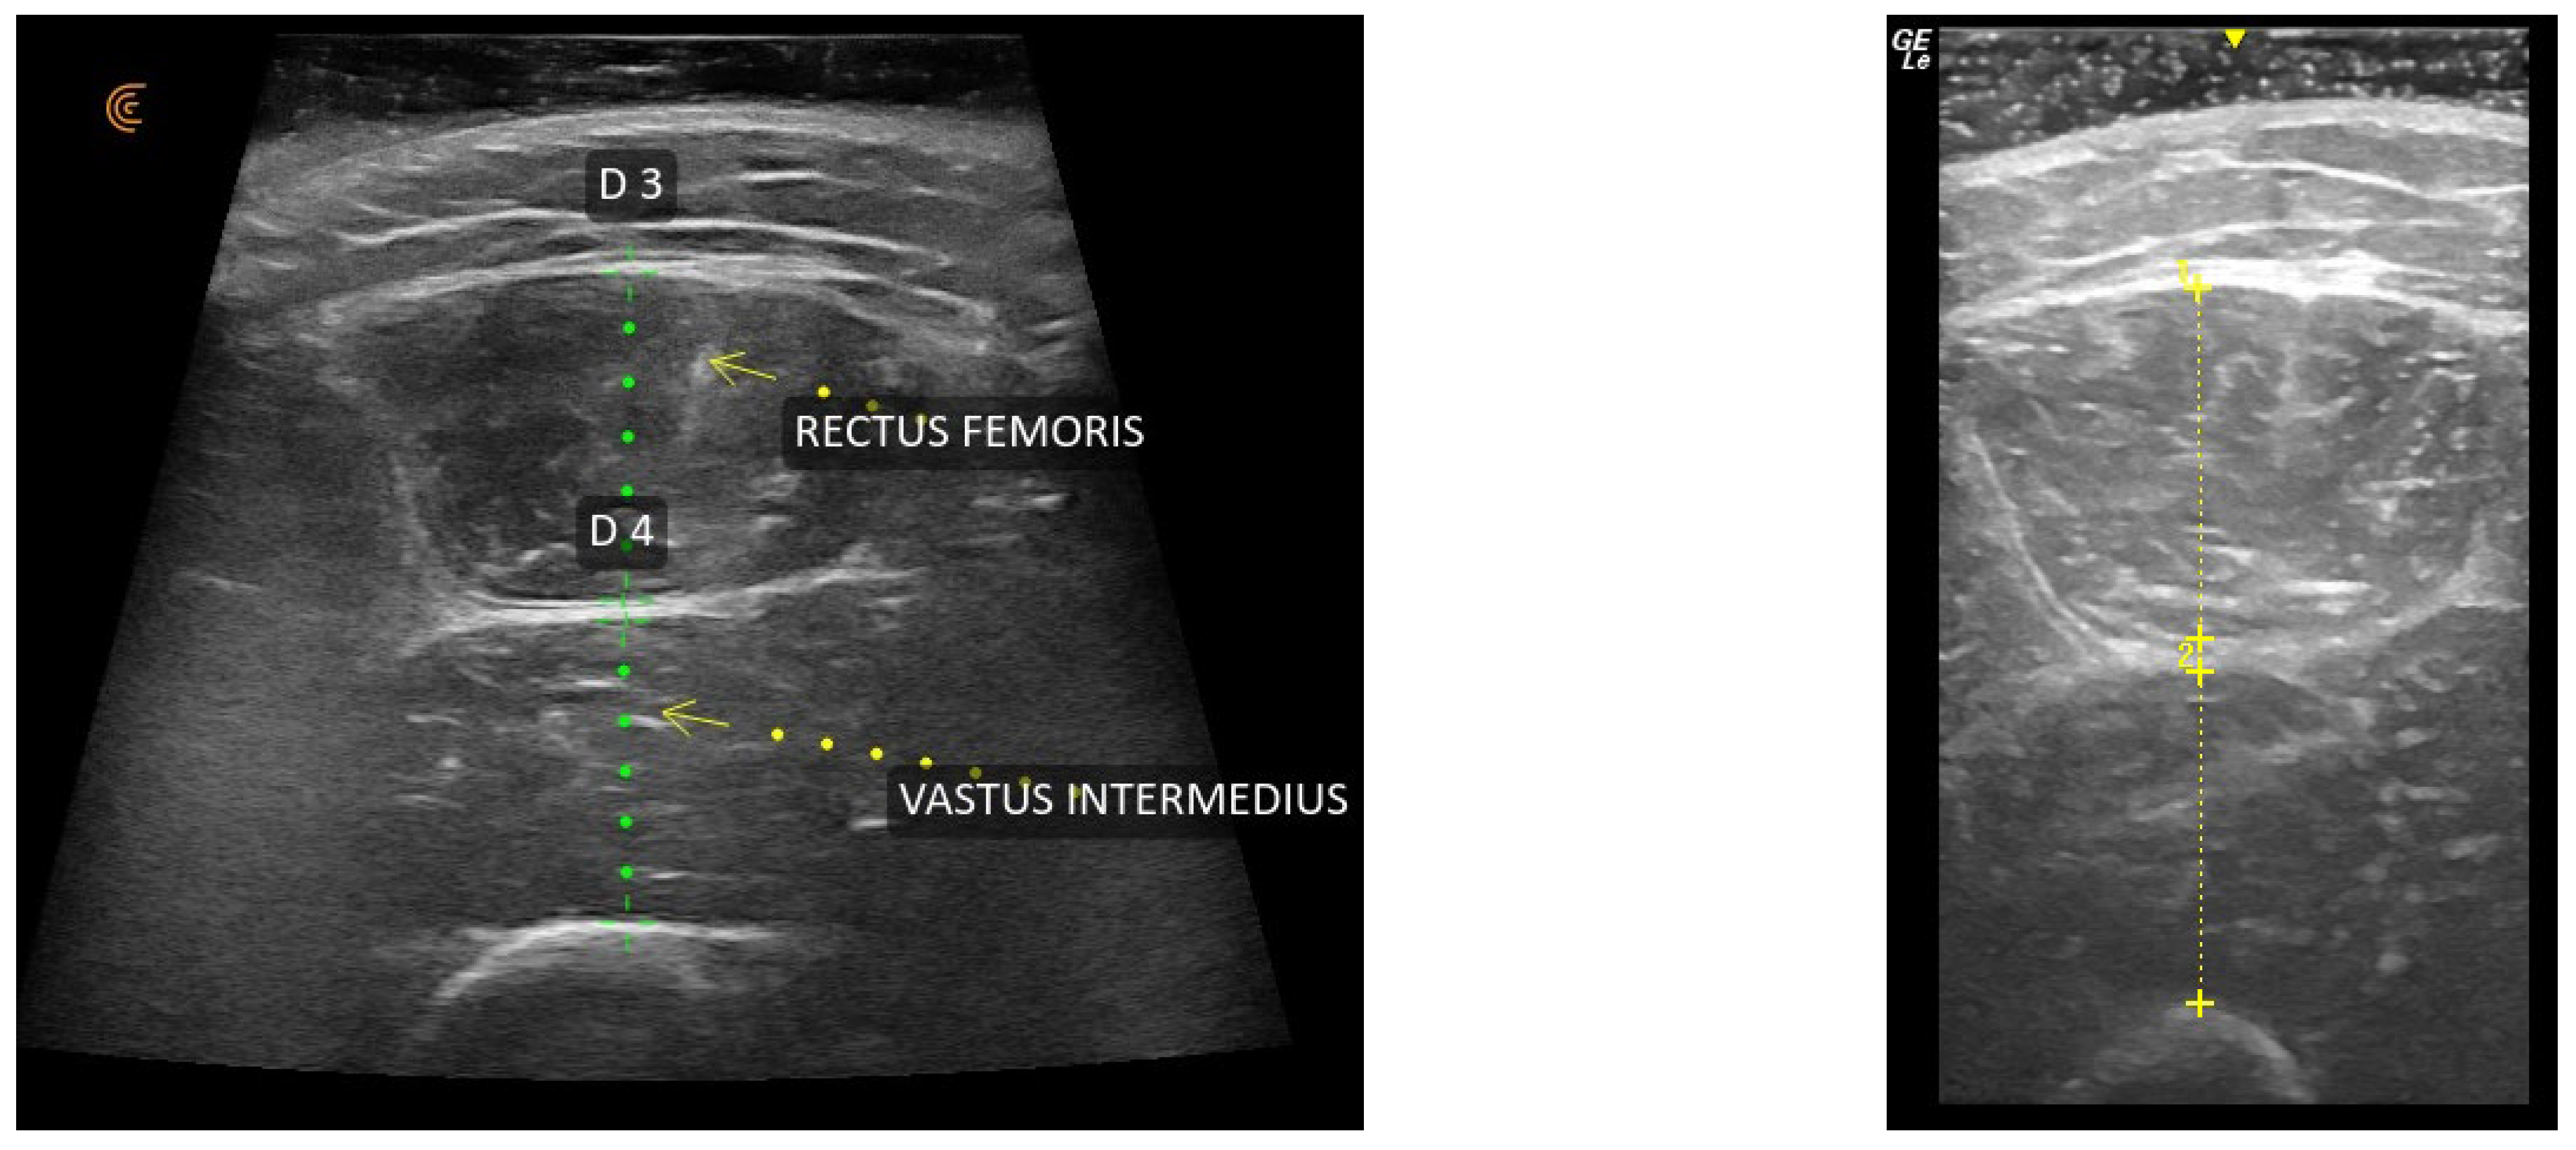
2.4. Ultrasound Assessment and Muscle Thickness Measurement

The same technique was utilized for the Clarius L15 HD3 and GE LOGIQ e U/S units to capture three cross-sectional images displaying the RF, VI, and femur. A generous amount of ultrasound gel was applied at the anatomical location of interest. With the probe or device oriented in the correct direction (i.e., perpendicular to the long axis of the thigh with correct mediolateral orientation), minimal pressure was applied to capture an image where the RF, VI, and femur were as closely in line as possible without being compressed. Specifically, the skin should have a slightly convex shape rather than appear as a straight line, which is indicative of minimal compression. Once a desirable image was identified, the image was frozen and stored if it appeared satisfactory upon further scrutiny. After at least three satisfactory images were captured with one ultrasound unit, the assessor repeated the same process with the other unit. In some cases, it was necessary to manually manipulate the orientation of the participant’s leg (i.e., internally or externally rotate the femur) to capture the desired image. In these instances, efforts were made to keep the leg orientation for a given participant consistent for both visits.
Both ultrasound units were utilized in the Brightness Mode (B-mode) setting with Gain 45 dB, and depth 5 cm. However, the depth was adjusted when necessary, based on the thickness of a participant’s subcutaneous adipose tissue and muscle to allow visibility of the femur. Given the interindividual differences among study participants, the depth ranged from 5 to 7 cm. Notably, the maximal depth of the Clarius L15 HD3 unit is 7 cm.
Using the built-in software of the two U/S scanners, the thickest aspects of the RF and VI were measured independently (Figure 1). Specifically, the thickness of the RF and VI were measured between the superficial and deep aponeuroses [10]. The three measurements were completed on three separate images from each of the two ultrasound units. The average of the three measurements per muscle group obtained independently by the two assessors using each of the U/S scanners were used for the analysis.

2.5. Statistical Analysis

The characteristics of study participants at baseline were summarized using the mean and standard deviation for continuous data, whereas frequencies and proportions were used for categorical data. Normality of the data was assessed using the Kolmogorov–Smirnov test. Intra-rater (first and second visit measurements obtained by the first assessor) and inter-rater reliability (first visit measurements between assessors) for evaluating the repeatability of RF and VI muscle thickness measurements using the Clarius L15 HD3 and GE LOGIQ e was assessed using the intraclass correlation coefficient (ICC3,1) based on a two-way mixed-effects model with absolute agreement. The percentage differences were calculated by calculating the percentage differences between two raters (100 × (measurement 1 − measurement 2) / measurement 1). Typical error (TE, cm) was calculated as the standard deviation (SD) of the difference divided by the square root of 2 [9]. The standard error of measurement (SEM) was calculated by multiplying the SD of the differences between measurements by the square root of one minus the ICC and then multiplying by 100. Additionally, we calculated the minimal detectable change (MDC) by multiplying the SEM by the square root of two and then by 1.96. Potential differences in the measurements between the two examiners were assessed using independent samples t-test. The Bland–Altman method was employed to assess the agreement between the two ultrasound devices (Clarius L15 HD3 and GE LOGIQ e) for each muscle using the average values obtained by the first assessor at both study visits. Pearson’s correlation coefficient (r) was utilized to measure the strength and direction of the relationship between muscle thickness and 1-RM measures. Additionally, least significant change (LSC) scores were calculated to determine the minimum change that would be considered ‘real’ (beyond measurement error) at the 95% confidence level consistent with the International Society for Clinical Densitometry’s Precision Assessment for each U/S device [25]. Specifically, we used the ISCD Advanced Precision Calculating Tool (https://iscd.org/learn/resources/calculators/, accessed on 10 June 2024) to calculate the LSC scores for each U/S device using the data collected from by the same sonographer on the two separate study visits (V1 and V2). LSC scores are presented as LSC for the root-mean-square standard deviation (RMSSD) and root-mean-square percent coefficient of variation (RMS%CV) at 95% confidence, LSCRMSD (2.77*RMSSD) and LSC%CV (2.77*RMS%CV) respectively, as recommended by the International Society of Clinical Densitometry [25,26]. The present LSC scores were calculated from twenty participants with duplicate measurements, while the ISCD recommends 30 participants with duplicate measurements for calculating LSC scores for clinical bone densitometry [25]. Moreover, the present LSC scores were calculated based on duplicate measurements on different study visits, including additional between-day variability. All data were analyzed by a member of the study team (HKK) who was not present during image acquisition and processing. All analyses were performed using IBM SPSS version 28.0 (IBM Corp., Armonk, NY, USA).

3. Results

Of the 34 participants who signed informed consent, one was ineligible due to a chronic condition based on the PARQ+, while three participants lost to follow-up prior to their first visit. Twenty (n = 20) participants (mean age: 21.9 years) were included in the analysis, of whom sixteen were females (80%). On average, participants engaged in 48 min of moderate intensity and 187 minutes of vigorous intensity physical activity per week. The characteristics of study participants at baseline are listed in Table 1.

3.1. Intra-Rater Reliability

Table 2 lists the results of the intra-rater reliability for assessing thickness of the RF and VI via the Clarius L15 HD3 and GE LOGIQ e. The intra-rater reliability was assessed only for the assessor who was present in both study visits for all study participants. All ICCs for intra-rater reliability in assessing RF and VI muscle thickness were above 0.9, ranging from 0.94 to 0.97, indicating excellent test–retest reliability for both U/S scanners [27]. Percentage differences in RF and VI muscle thickness ranged from −4.16% to 1.08%, generally showing slightly lower values in the first visit compared to the second. TE (cm) ranged from 0.09 to 0.12, with the highest TE observed for RF thickness using the GE LOGIQ e.

3.2. Inter-Rater Reliability

Table 3 lists the results of the inter-rater reliability for assessing thickness of the RF and VI at the first visit using the Clarius L15 HD3 and GE LOGIQ e. All ICCs for inter-rater reliability were above 0.95, which is suggestive of excellent inter-rater reliability [27]. Percentage differences in RF and VI muscle thickness using the Clarius L15 HD3 were 1.43% and −1.33%, respectively. Similarly, percentage differences in RF and VI muscle thickness using the GE LOGIQ e were 2.86 and −0.30%, respectively. TE (cm) ranged from 0.09 to 0.11, with the largest TE observed for VI thickness using the Clarius L15 HD3.

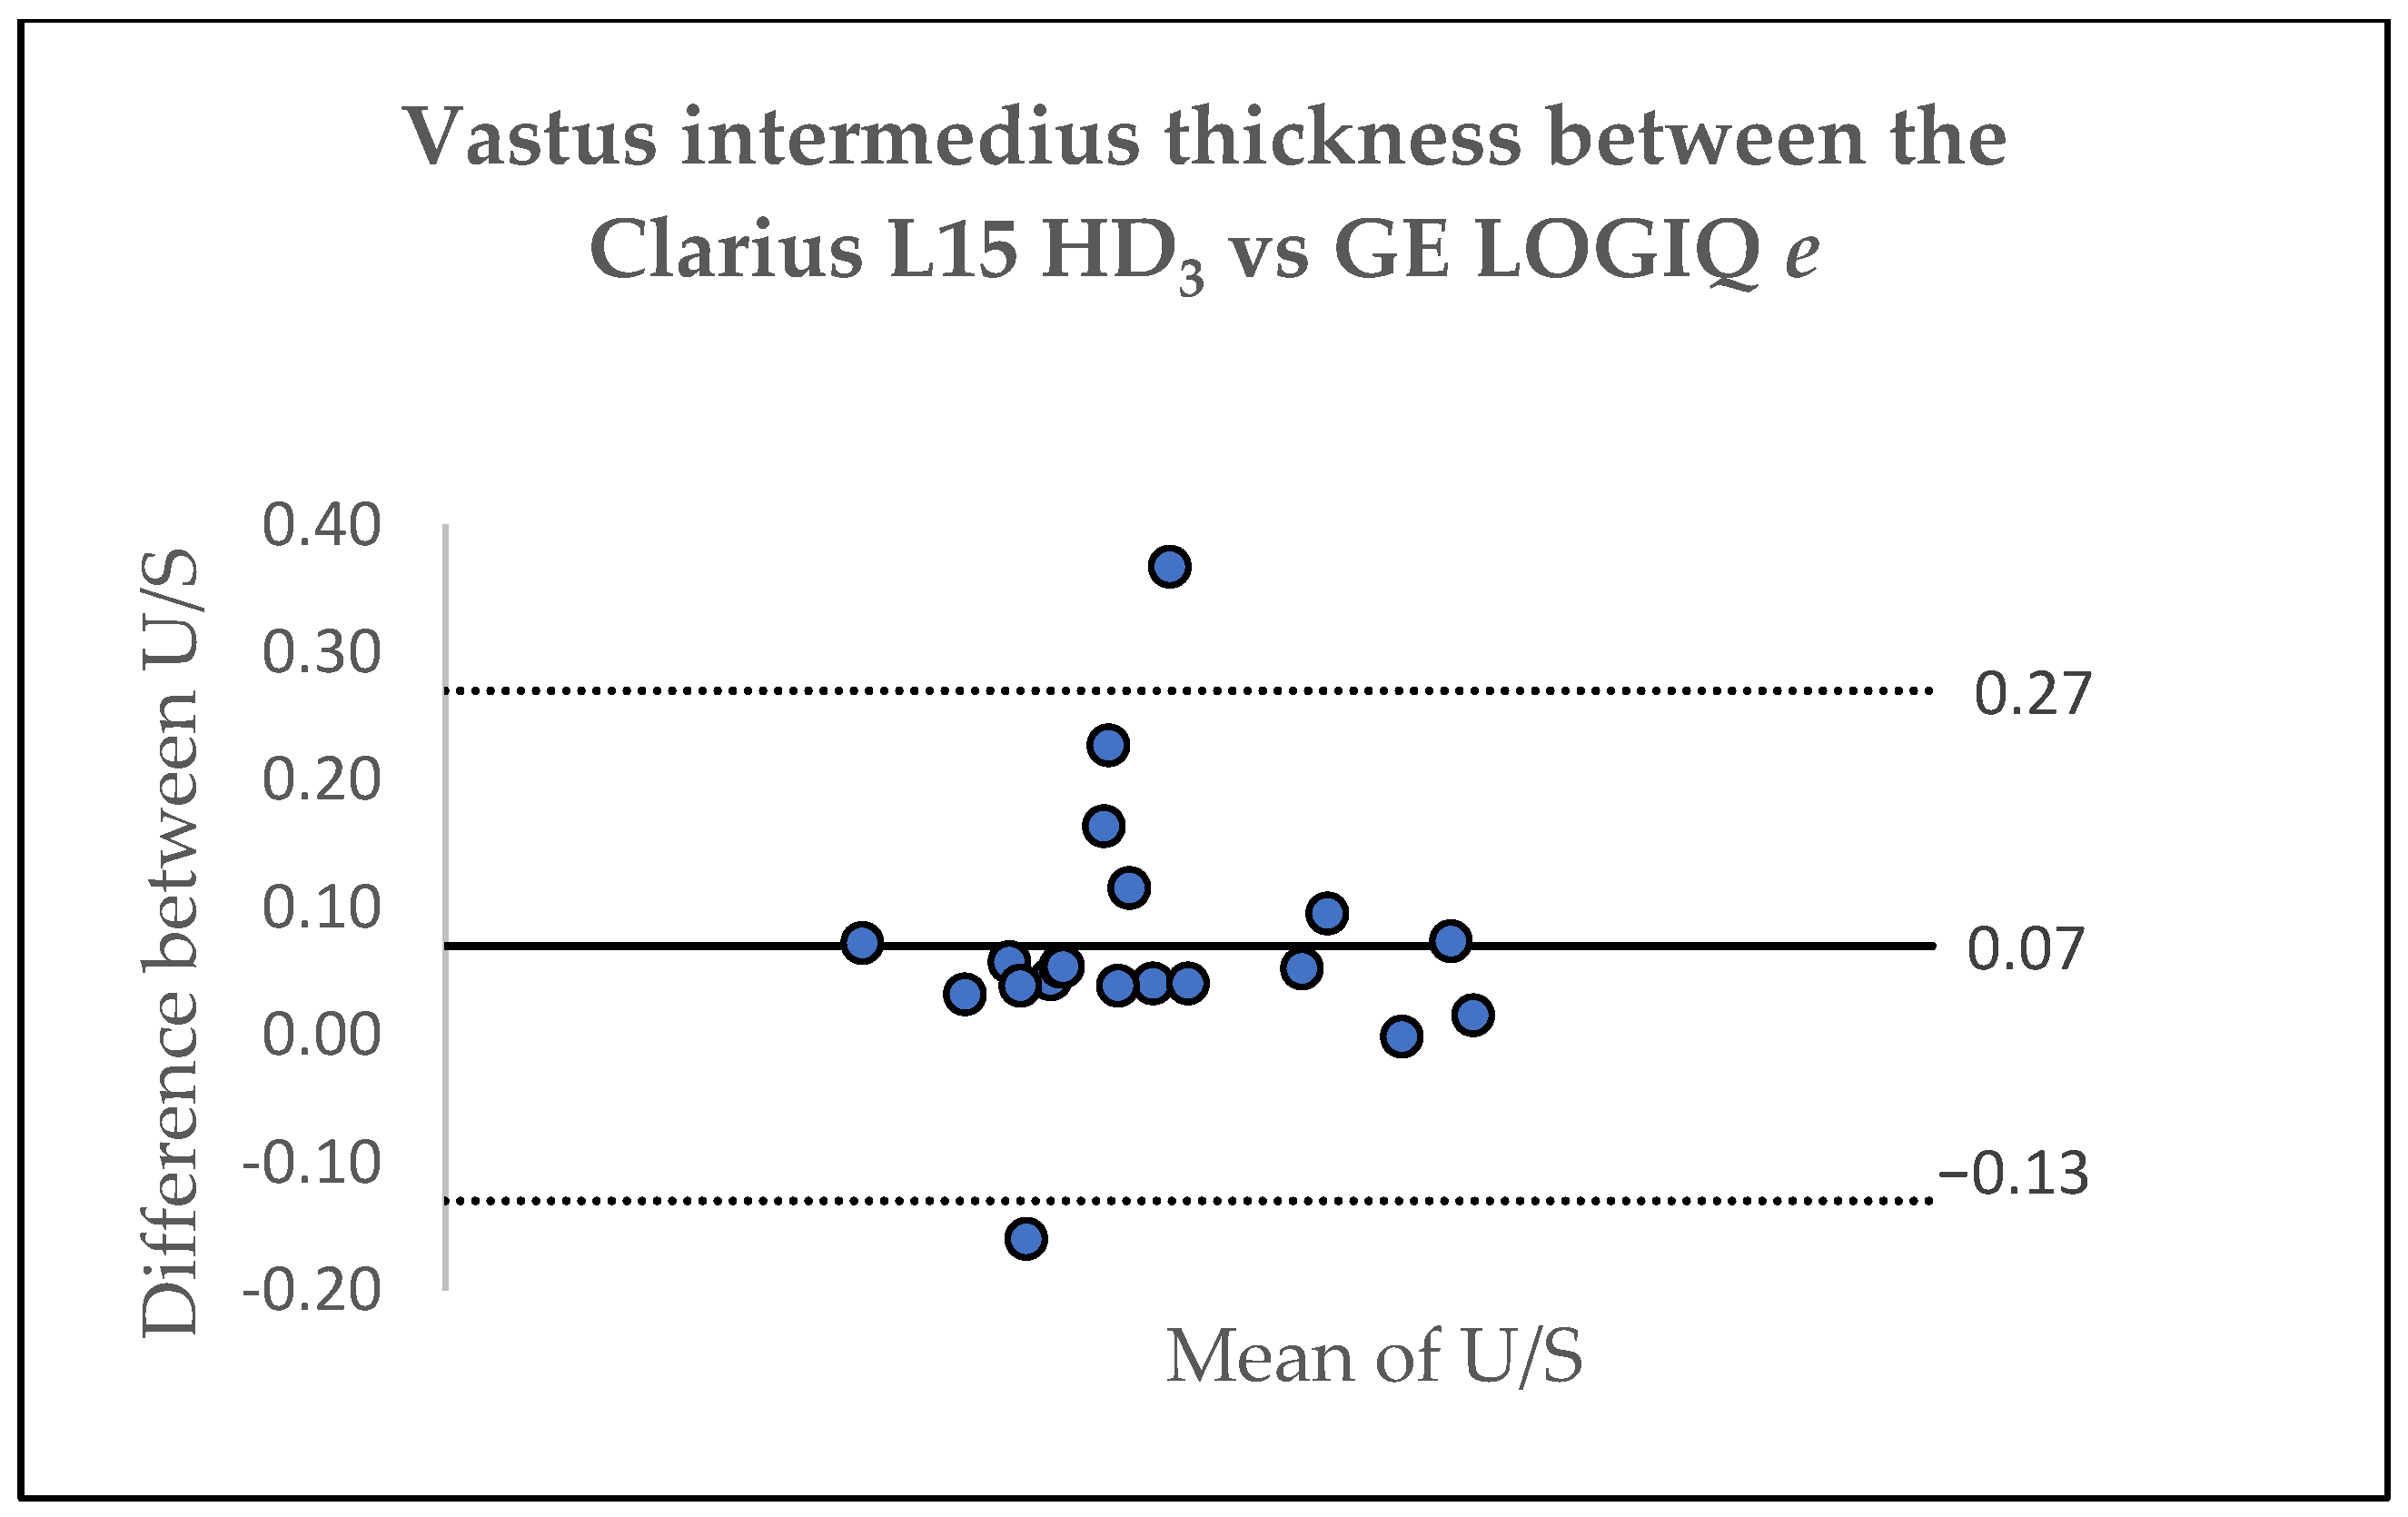
3.3. Inter-Device Agreement

Table 4 lists the results of the inter-device agreement between the Clarius L15 HD3 and the GE LOGIQ e for assessing thickness of the RF and VI based on one assessor. The ICC for RF and VI was 0.98 (95%CI: 0.94–0.99) and 0.98 (95%CI: 0.95–0.99), respectively, indicating excellent agreement between the two scanners [28]. A Bland–Altman analysis was also used to assess the agreement between the Clarius L15 HD3 and the GE LOGIQ e, showing acceptable levels of agreement. For the RF, the Bland–Altman plot revealed a mean difference of 0.06 ± 0.07 cm, with limits of agreement ranging from 0.21 to −0.09, whereas for the VI, the Bland–Altman plot showed a mean difference of 0.07 ± 0.10 cm, with limits of agreement ranging from 0.27 to −0.13 (Figure 2 and Figure 3). However, as shown in Figure 3, two data points were outside the limits of agreement.

3.4. Precision

Table 2 also lists the precision analysis results for assessing the RF and VI thickness via the Clarius L15 HD3 and GE LOGIQ e. The GE LOGIQ e had higher RMSSD and RMS%CV than the Clarius L15 HD3 for the between-visit replicates of the RF and VI thicknesses. Subsequently, the GE LOGIQ e had higher LSCRMSD and LSC%CV than the Clarius L15 HD3 for the between-visit replicates of the RF and VI thicknesses.

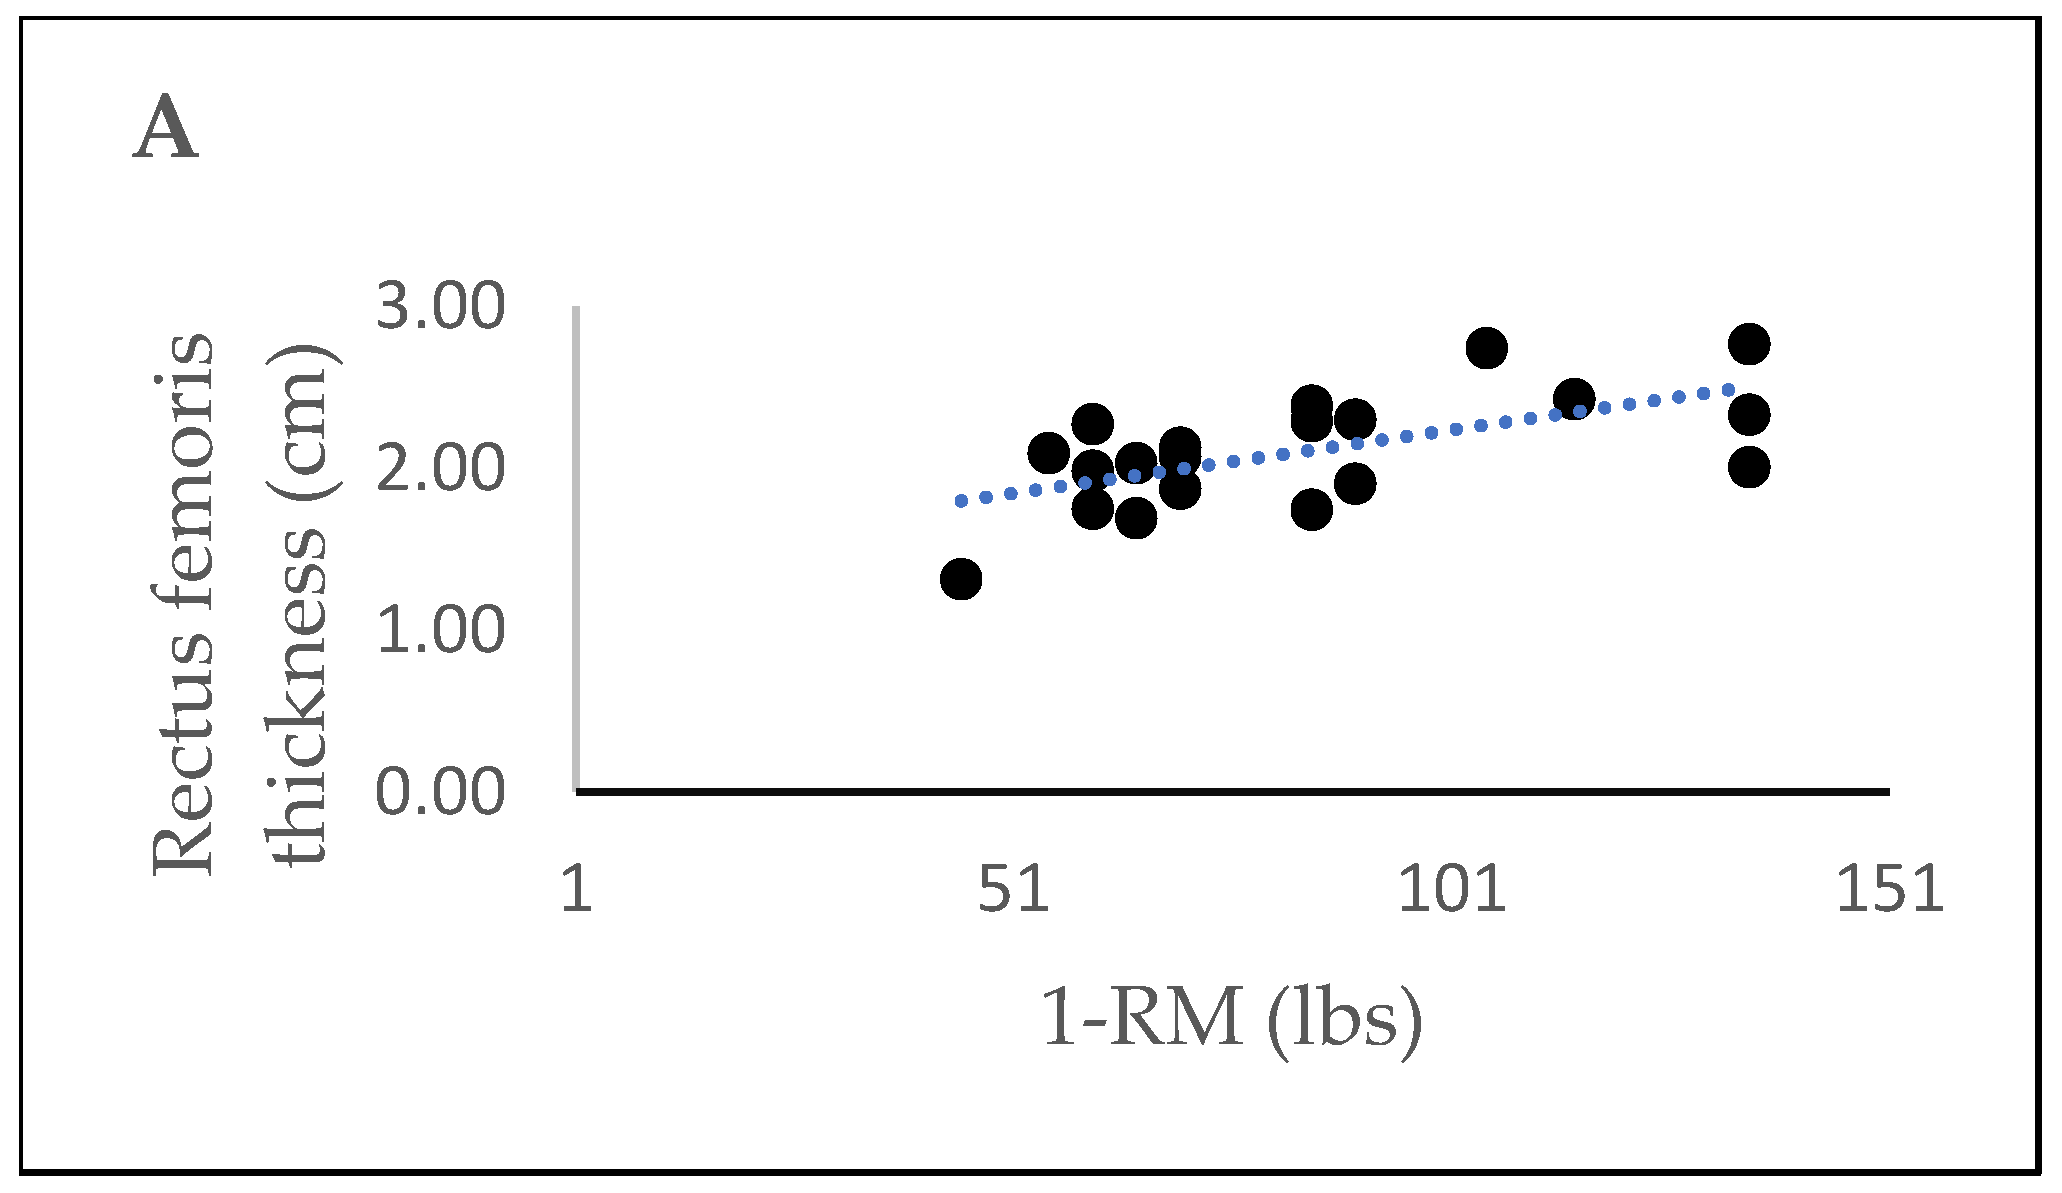
3.5. Correlations Between Muscle Thickness and 1-RM for Leg Extension

Moderate significant correlations were found between the 1-RM of leg extension and RF thickness (r = 0.620, p = 0.004), while weaker correlations were demonstrated between the 1-RM and VI thickness (r = 0.442, p = 0.051) (Figure 4A,B). Additionally, a partial correlation was conducted to examine the relationship between muscle thickness and 1-RM, while controlling for sex. A statistically significant partial correlation was found between RF thickness and 1-RM (r = 0.558, p = 0.013). However, after accounting for the effect of sex, VI thickness showed a weak correlation with 1-RM (r = 0.290, p = 0.229).

4. Discussion

This study assessed the reliability and inter-device agreement between a portable, pocket-sized handheld U/S scanner (Clarius L15 HD3) and a conventional U/S (GE LOGIQ e) for assessing the thickness of the RF and VI. Our findings suggest that Clarius L15 HD3 can accurately and reliably measure thickness of the lower extremities.
We found excellent test–retest reliability of both U/S systems for estimating thickness of the RF and VI. Specifically, the ICC using the Clarius L15 HD3 ranged from 0.96 to 0.97. Previous work using a different handheld, portable U/S device corroborates our findings, suggesting that handheld U/S can reliably measure muscle thickness of the RF in healthy adults [29,30]. Similarly, portable U/S may be used to assess muscle thickness in older adults, given the age-associated declines in muscle mass and function. For example, in study of 150 community-dwelling older adults, a portable U/S system using A-mode demonstrated good intra-rater reliability for thickness of the triceps, biceps, anterior thigh and calf muscles with ICCs ranging from 0.80 to 0.90 [31]. Similarly, the intra-rater reliability using the GE LOGIQ e was also excellent, ranging from 0.94 to 0.97.
The inter-rater reliability for measuring the thickness of the RF and VI was excellent using the Clarius L15 HD3 or the GE LOGIQ e (ICC: 0.97), despite the different level of experience between the two examiners with U/S image acquisition and analyses. To attenuate some of these differences, the first examiner who was less experienced with U/S imaging compared to the second examiner, was able to practice and improve his technique using the first ten subjects. Moreover, the second examiner also had the opportunity to familiarize himself with acquiring images using the new hand-held U/S device. Previous work has demonstrated that the level of experience with U/S image acquisition and analyses can influence U/S measures. Specifically, Carr and colleagues found good-to-excellent inter-rater reliability for image acquisition of muscle size using panoramic imaging, but poor reliability for analysis of muscle thickness [22]. According to the authors, the poor inter-rater reliability might relate to inconsistencies with the identification of muscle boundaries by the novice examiner who had less than two hours of instruction before image analyses [22]. In line with these findings, poor inter-rater reliability was found in another study where two novice examiners measured the thickness of the RF and VI in healthy adult males [29]. However, Oliveira and colleagues found moderate-to-good inter-rater reliability (ICCs: 0.70–0.76) of a handheld, portable U/S for assessing thickness of muscle groups of the upper and lower extremities in older adults [31]. Our findings highlight the importance of practice for novice examiners prior to U/S image acquisition and analysis that appears to optimize inter-rater reliability.
Furthermore, the inter-device agreement between the Clarius L15 HD3 and the GE LOGIQ e was also excellent for measuring thickness of the RF and VI (ICC: 0.98 for both the RF and VI). Nonetheless, measurements of the VI for two participants were outside the limits of agreement which may relate to positioning of the limb or the probe which could have affected the measurements. This underscores the importance of standardization protocols to minimize such occurrences in future studies. Our findings correspond with those by Turton and colleagues who also demonstrated inter-device agreement between a different handheld U/S device and a more conventional U/S system for measuring thickness of the RF and VI in healthy males [32]. Nonetheless, the level of agreement between the examined U/S scanners was lower in that study compared to our findings [32]. Similarly, a handheld U/S scanner exhibited high inter-device agreement with a conventional U/S system for measuring thickness of the RF (ICC: 0.82) and the VI (ICC: 0.89) in active healthy participants [30].
The ISCD has been a long-time proponent of using precision analysis to assess the test–retest reliability of dual X-Ray absorptiometry bone mineral density measurements in clinical practice at the level of the technologist [25,33]. More recently, investigators have begun reporting precision analysis for DXA-derived body composition measurements including lean body mass. A review identified six studies that reported LSCRMSD and LSC%CV for lean body mass in non-athletes and athletes using DXA [34]. The LSC%CV ranged from 0.8% to 4.5% with 95% confidence [34]. Our results suggest that LSC%CV is between 12.5 and 18.3% with 95% confidence for measuring RF and VI muscle thicknesses with the Clarius L15 HD3 and the GE LOGIQ e U/S systems. The higher LSC%CV observed in the present study using U/S to measure muscle thickness of the RF and VI relative to the LSC%CV obtained by DXA for measuring lean body mass are likely to be due to a few factors. First, small differences in DXA measurements of lean body mass led to a small RMS%CV and thus a small LSC%CV due to the relatively high lean body mass (i.e., large denominator), while small differences in skeletal muscle thickness led to a high RMS%CV and thus a high LSC%CV due to the relatively small muscle thickness (i.e., small denominator). Second, most of the aforementioned DXA studies performed same-day precision analysis, while the present study used non-consecutive-day (5–7 days apart) precision analysis, likely increasing variability. Consistent with this notion, one study that examined the precision of DXA-measured leg lean mass showed a ~37% increase in LSC%CV when replicates were measured on consecutive days compared to when measured on the same day [35]. Few U/S studies have reported precision analysis for measuring muscle thickness, particularly with respect to reporting either LSCRMSD or LSC%CV. However, a recent study reported raw %CV for measurements of the anterior thigh muscle (i.e., RF) in older adults with type 2 diabetes, older adult matched controls, and healthy young adults [36]. The raw %CV ranged from 0.4 to 1.3 for repeated measurements with their expert sonographer, compared to our 4.5 to 6.6% for RMS%CV for our trained but novice sonographer. As noted above, our higher RMS%CV is likely due to measurements taken on non-consecutive days. Moreover, it is unclear whether the repeated measurements conducted in the prior study repositioned their participants before taking repeated measurements as recommended by the ISCD [36]. In the absence of repositioning, raw %CV and/or RMS%CV are likely to be considerably lower than with repositioning. Finally, additional training and the inclusion of more study participants (e.g., 30 participants with duplicate measurements) would likely lower the LSCRMSD and LSC%CV.
Correlations between 1-RM leg extension and measures of muscle thickness were moderate in line with previous work [37,38], indicating the importance of assessing muscle strength in addition to muscle thickness. The moderate correlation between RF thickness and leg extension 1-RM may be attributed to neural factors such as differences in motor unit recruitment, rate of activation, synchronization, in addition to coordination of antagonistic muscle groups. Another possible mechanism relates to potential differences in fat infiltration of the skeletal muscle (i.e., myosteatosis), which has been shown to negatively affect muscle strength [39]. This may be particularly useful for the evaluation of sarcopenia according to the European Working Group of Sarcopenia in Older People 2, which defines sarcopenia as the combination of low muscle strength in addition to low muscle quantity or quality [16].
Our findings strengthen the rationale for using handheld, portable U/S devices for assessing muscle thickness in younger and older adults. Emerging evidence supports the use of handheld, portable U/S scanners for detecting sarcopenia [40] or assisting with the diagnosis of musculoskeletal injuries such as rotator cuff tears [41] and carpal tunnel syndrome [42], carotid artery plaque [43] and ulcerative colitis [44].
Our study includes several limitations. First, our results should be interpreted with caution due to the small sample size which may affect our study outcomes [45]. In particular, the study sample (n = 20) does not meet the sample size recommendations for calculating the LSC per the ISCD (n = 30) [25]. Thus, the precision and generalizability of our results regarding the LSC should be interpreted cautiously given that statistical power was insufficient. However, our sample size is in line with several studies that examined the reliability and inter-device agreement of U/S scanners for assessing skeletal muscle characteristics [9,10,22,23]. Second, the demographic characteristics of the participants (i.e., young healthy adults) limit the generalizability of our findings to other populations, particularly insufficiently active individuals or older adults, where conditions that impact skeletal muscle thickness such as sarcopenia and frailty are more relevant. Study assessors performed measurements independently, in real time following study visits to resemble a real-world scenario. A more rigorous strategy would involve randomization of images prior to obtaining measurements independently by each assessor. Additionally, the inclusion of additional U/S measures, such as cross-sectional area and echo intensity, would have provided further insight into the utility of the Clarius L15 HD3 in evaluating comprehensively the characteristics of the RF and VI.

5. Conclusions

A handheld portable U/S scanner can accurately and reliably assess the thickness of the RF and VI. Additional U/S precision studies are needed to further clarify whether U/S measurements can be used to detect clinically significant changes in skeletal muscle thickness and will likely help investigators deploy this cost-efficient method in multi-center clinical trials and/or epidemiological studies. Further studies are warranted to examine the role of handheld U/S devices in determining cross-sectional area and echo intensity that will provide further information on muscle quantity and quality, respectively.

Author Contributions

Conceptualization, B.A.I. and E.P.; methodology, B.A.I. and E.P.; formal analysis, H.K.K.; investigation, B.A.I. and E.P.; data curation, C.E. and B.A.I.; writing—original draft preparation, C.E. and E.P.; writing—review and editing, all authors.; supervision, E.P.; project administration, E.P.; funding acquisition, E.P. and B.A.I. All authors have read and agreed to the published version of the manuscript.

Funding

This study was funded by the Seed Grant School of Kinesiology at Louisiana State University.

Institutional Review Board Statement

All study procedures were approved by the Institutional Review Board at Louisiana State University (IRBAM-23-1397), 18 December 2023.

Informed Consent Statement

Informed consent was obtained from all subjects involved in the study. Written informed consent has been obtained from the participants to publish this paper.

Data Availability Statement

The data of this study are available from the corresponding author upon reasonable request.

Conflicts of Interest

The authors declare no conflicts of interest.

Abbreviations

The following abbreviations are used in this manuscript:
CTComputed tomography
MRIMagnetic resonance imaging
DXADual X-Ray absorptiometry
U/SUltrasound
RFRectus femoris
VIVastus intermedius
PARQ+Physical activity readiness questionnaire for everyone
IPAQ-SFInternational Physical Activity Questionnaire-Short Form
1-RM1-repetition-maximum
ICCIntraclass correlation coefficient
TETypical error
SDStandard deviation
SEMStandard error of measurement
MDCMinimal detectable change
LSCLeast significant change
ISCDInternational Society for Clinical Densitometry
RMSSDRoot-mean-square standard deviation
RMS%CVRoot-mean-square coefficient of variation

References

  1. Cruz-Jentoft, A.J.; Sayer, A.A. Sarcopenia. Lancet 2019, 393, 2636–2646. [Google Scholar] [CrossRef]
  2. Zhang, Y.; Hao, Q.; Ge, M.; Dong, B. Association of sarcopenia and fractures in community-dwelling older adults: A systematic review and meta-analysis of cohort studies. Osteoporos. Int. 2018, 29, 1253–1262. [Google Scholar] [CrossRef] [PubMed]
  3. Zhang, X.; Zhang, W.; Wang, C.; Tao, W.; Dou, Q.; Yang, Y. Sarcopenia as a predictor of hospitalization among older people: A systematic review and meta-analysis. BMC Geriatr. 2018, 18, 188. [Google Scholar] [CrossRef]
  4. Cabett Cipolli, G.; Sanches Yassuda, M.; Aprahamian, I. Sarcopenia Is Associated with Cognitive Impairment in Older Adults: A Systematic Review and Meta-Analysis. J. Nutr. Health Aging 2019, 23, 525–531. [Google Scholar] [CrossRef] [PubMed]
  5. Teng, Z.; Zhu, Y.; Yu, X.; Liu, J.; Long, Q.; Zeng, Y.; Lu, S. An analysis and systematic review of sarcopenia increasing osteopenia risk. PLoS ONE 2021, 16, e0250437. [Google Scholar] [CrossRef]
  6. Zhang, H.; Lin, S.; Gao, T.; Zhong, F.; Cai, J.; Sun, Y.; Ma, A. Association between Sarcopenia and Metabolic Syndrome in Middle-Aged and Older Non-Obese Adults: A Systematic Review and Meta-Analysis. Nutrients 2018, 10, 364. [Google Scholar] [CrossRef]
  7. Xu, J.; Wan, C.S.; Ktoris, K.; Reijnierse, E.M.; Maier, A.B. Sarcopenia Is Associated with Mortality in Adults: A Systematic Review and Meta-Analysis. Gerontology 2022, 68, 361–376. [Google Scholar] [CrossRef]
  8. Nijholt, W.; Scafoglieri, A.; Jager-Wittenaar, H.; Hobbelen, J.S.M.; van der Schans, C.P. The reliability and validity of ultrasound to quantify muscles in older adults: A systematic review. J. Cachexia Sarcopenia Muscle 2017, 8, 702–712. [Google Scholar] [CrossRef]
  9. Thomaes, T.; Thomis, M.; Onkelinx, S.; Coudyzer, W.; Cornelissen, V.; Vanhees, L. Reliability and validity of the ultrasound technique to measure the rectus femoris muscle diameter in older CAD-patients. BMC Med. Imaging 2012, 12, 7. [Google Scholar] [CrossRef]
  10. Nijholt, W.; Jager-Wittenaar, H.; Raj, I.S.; van der Schans, C.P.; Hobbelen, H. Reliability and validity of ultrasound to estimate muscles: A comparison between different transducers and parameters. Clin. Nutr. ESPEN 2020, 35, 146–152. [Google Scholar] [CrossRef]
  11. Neira Alvarez, M.; Vazquez Ronda, M.A.; Soler Rangel, L.; Thuissard-Vasallo, I.J.; Andreu-Vazquez, C.; Martinez Martin, P.; Rabago Lorite, I.; Serralta San Martin, G. Muscle Assessment by Ultrasonography: Agreement with Dual-Energy X-Ray Absorptiometry (DXA) and Relationship with Physical Performance. J. Nutr. Health Aging 2021, 25, 956–963. [Google Scholar] [CrossRef]
  12. Vongchaiudomchoke, W.; Cho, A.R.; Mahmoud, I.; Carli, F. Ultrasound for skeletal muscle assessment in surgical oncology: A scoping review. Eur. J. Surg. Oncol. 2025, 51, 109676. [Google Scholar] [CrossRef] [PubMed]
  13. Nies, I.; Ackermans, L.; Poeze, M.; Blokhuis, T.J.; Ten Bosch, J.A. The Diagnostic Value of Ultrasound of the Rectus Femoris for the diagnosis of Sarcopenia in adults: A systematic review. Injury 2022, 53, S23–S29. [Google Scholar] [CrossRef] [PubMed]
  14. Soares, A.L.C.; Carvalho, R.F.; Mogami, R.; Meirelles, C.M.; Gomes, P.S.C. Effect of resistance training on quadriceps femoris muscle thickness obtained by ultrasound: A systematic review with meta-analysis. J. Bodyw. Mov. Ther. 2024, 39, 270–278. [Google Scholar] [CrossRef] [PubMed]
  15. Gellhorn, A.C.; Stumph, J.M.; Zikry, H.E.; Creelman, C.A.; Welbel, R. Ultrasound measures of muscle thickness may be superior to strength testing in adults with knee osteoarthritis: A cross-sectional study. BMC Musculoskelet. Disord. 2018, 19, 350. [Google Scholar] [CrossRef]
  16. Cruz-Jentoft, A.J.; Bahat, G.; Bauer, J.; Boirie, Y.; Bruyere, O.; Cederholm, T.; Cooper, C.; Landi, F.; Rolland, Y.; Sayer, A.A.; et al. Sarcopenia: Revised European consensus on definition and diagnosis. Age Ageing 2019, 48, 601. [Google Scholar] [CrossRef]
  17. Rostron, Z.P.; Green, R.A.; Kingsley, M.; Zacharias, A. Associations Between Measures of Physical Activity and Muscle Size and Strength: A Systematic Review. Arch. Rehabil. Res. Clin. Transl. 2021, 3, 100124. [Google Scholar] [CrossRef]
  18. Duchowny, K.A.; Peters, K.E.; Cummings, S.R.; Orwoll, E.S.; Hoffman, A.R.; Ensrud, K.E.; Cauley, J.A.; Evans, W.J.; Cawthon, P.M.; Osteoporotic Fractures in Men (MrOS) Study Research Group. Association of change in muscle mass assessed by D3-creatine dilution with changes in grip strength and walking speed. J. Cachexia Sarcopenia Muscle 2020, 11, 55–61. [Google Scholar] [CrossRef]
  19. Tromaras, K.; Zaras, N.; Stasinaki, A.N.; Mpampoulis, T.; Terzis, G. Lean Body Mass, Muscle Architecture and Powerlifting Performance during Preseason and in Competition. J. Funct. Morphol. Kinesiol. 2024, 9, 89. [Google Scholar] [CrossRef]
  20. Bredin, S.S.; Gledhill, N.; Jamnik, V.K.; Warburton, D.E. PAR-Q+ and ePARmed-X+: New risk stratification and physical activity clearance strategy for physicians and patients alike. Can. Fam. Physician 2013, 59, 273–277. [Google Scholar]
  21. Craig, C.L.; Marshall, A.L.; Sjostrom, M.; Bauman, A.E.; Booth, M.L.; Ainsworth, B.E.; Pratt, M.; Ekelund, U.; Yngve, A.; Sallis, J.F.; et al. International physical activity questionnaire: 12-country reliability and validity. Med. Sci. Sports Exerc. 2003, 35, 1381–1395. [Google Scholar] [CrossRef]
  22. Carr, J.C.; Gerstner, G.R.; Voskuil, C.C.; Harden, J.E.; Dunnick, D.; Badillo, K.M.; Pagan, J.I.; Harmon, K.K.; Girts, R.M.; Beausejour, J.P.; et al. The Influence of Sonographer Experience on Skeletal Muscle Image Acquisition and Analysis. J. Funct. Morphol. Kinesiol. 2021, 6, 91. [Google Scholar] [CrossRef]
  23. Hammond, K.; Mampilly, J.; Laghi, F.A.; Goyal, A.; Collins, E.G.; McBurney, C.; Jubran, A.; Tobin, M.J. Validity and reliability of rectus femoris ultrasound measurements: Comparison of curved-array and linear-array transducers. J. Rehabil. Res. Dev. 2014, 51, 1155–1164. [Google Scholar] [CrossRef]
  24. Bird, S.P.; Tarpenning, K.M.; Marino, F.E. Independent and combined effects of liquid carbohydrate/essential amino acid ingestion on hormonal and muscular adaptations following resistance training in untrained men. Eur. J. Appl. Physiol. 2006, 97, 225–238. [Google Scholar] [CrossRef] [PubMed]
  25. Baim, S.; Binkley, N.; Bilezikian, J.P.; Kendler, D.L.; Hans, D.B.; Lewiecki, E.M.; Silverman, S. Official Positions of the International Society for Clinical Densitometry and executive summary of the 2007 ISCD Position Development Conference. J. Clin. Densitom. 2008, 11, 75–91. [Google Scholar] [CrossRef] [PubMed]
  26. Buehring, B.; Krueger, D.; Libber, J.; Heiderscheit, B.; Sanfilippo, J.; Johnson, B.; Haller, I.; Binkley, N. Dual-energy X-Ray absorptiometry measured regional body composition least significant change: Effect of region of interest and gender in athletes. J. Clin. Densitom. 2014, 17, 121–128. [Google Scholar] [CrossRef] [PubMed]
  27. Koo, T.K.; Li, M.Y. A Guideline of Selecting and Reporting Intraclass Correlation Coefficients for Reliability Research. J. Chiropr. Med. 2016, 15, 155–163. [Google Scholar] [CrossRef]
  28. Mota, P.; Pascoal, A.G.; Sancho, F.; Bo, K. Test-retest and intrarater reliability of 2-dimensional ultrasound measurements of distance between rectus abdominis in women. J. Orthop. Sports Phys. Ther. 2012, 42, 940–946. [Google Scholar] [CrossRef]
  29. Alfuraih, A.M.; Alqarni, M.A.; Alhuthaili, H.S.; Mubaraki, M.Y.; Alotaibi, N.N.; Almusalim, F.M. Reproducibility and feasibility of a handheld ultrasound device compared to a standard ultrasound machine in muscle thickness measurements. Australas. J. Ultrasound Med. 2023, 26, 13–20. [Google Scholar] [CrossRef]
  30. Ritsche, P.; Schmid, R.; Franchi, M.V.; Faude, O. Agreement and reliability of lower limb muscle architecture measurements using a portable ultrasound device. Front. Physiol. 2022, 13, 981862. [Google Scholar] [CrossRef]
  31. Benatti de Oliveira, G.; Vilar Fernandes, L.; Summer Chen, X.; Drumond Andrade, F.C.; Scarlazzari Costa, L.; Junqueira Vasques, A.C.; Pires Corona, L. Intra- and inter-rater reliability of muscle and fat thickness measurements obtained using portable ultrasonography in older adults. Clin. Nutr. ESPEN 2024, 60, 65–72. [Google Scholar] [CrossRef]
  32. Turton, P.; Hay, R.; Welters, I. Assessment of peripheral muscle thickness and architecture in healthy volunteers using hand-held ultrasound devices; a comparison study with standard ultrasound. BMC Med. Imaging 2019, 19, 69. [Google Scholar] [CrossRef]
  33. Lewiecki, E.M.; Binkley, N.; Morgan, S.L.; Shuhart, C.R.; Camargos, B.M.; Carey, J.J.; Gordon, C.M.; Jankowski, L.G.; Lee, J.K.; Leslie, W.D.; et al. Best Practices for Dual-Energy X-Ray Absorptiometry Measurement and Reporting: International Society for Clinical Densitometry Guidance. J. Clin. Densitom. 2016, 19, 127–140. [Google Scholar] [CrossRef] [PubMed]
  34. Hind, K.; Slater, G.; Oldroyd, B.; Lees, M.; Thurlow, S.; Barlow, M.; Shepherd, J. Interpretation of Dual-Energy X-Ray Absorptiometry-Derived Body Composition Change in Athletes: A Review and Recommendations for Best Practice. J. Clin. Densitom. 2018, 21, 429–443. [Google Scholar] [CrossRef] [PubMed]
  35. Zemski, A.J.; Hind, K.; Keating, S.E.; Broad, E.M.; Marsh, D.J.; Slater, G.J. Same-Day Vs Consecutive-Day Precision Error of Dual-Energy X-Ray Absorptiometry for Interpreting Body Composition Change in Resistance-Trained Athletes. J. Clin. Densitom. 2019, 22, 104–114. [Google Scholar] [CrossRef] [PubMed]
  36. Bell, K.E.; Paris, M.T.; Samuel, M.; Mourtzakis, M. Reliability of ultrasound measurements of muscle thickness and echointensity in older adults with type 2 diabetes. WFUMB Ultrasound Open 2024, 2, 100032. [Google Scholar] [CrossRef]
  37. Muraki, S.; Fukumoto, K.; Fukuda, O. Prediction of the muscle strength by the muscle thickness and hardness using ultrasound muscle hardness meter. Springerplus 2013, 2, 457. [Google Scholar] [CrossRef]
  38. Ogawa, M.; Matsumoto, T.; Harada, R.; Yoshikawa, R.; Ueda, Y.; Takamiya, D.; Sakai, Y. Reliability and Validity of Quadriceps Muscle Thickness Measurements in Ultrasonography: A Comparison with Muscle Mass and Strength. Prog. Rehabil. Med. 2023, 8, 20230008. [Google Scholar] [CrossRef]
  39. Fukumoto, Y.; Ikezoe, T.; Yamada, Y.; Tsukagoshi, R.; Nakamura, M.; Mori, N.; Kimura, M.; Ichihashi, N. Skeletal muscle quality assessed from echo intensity is associated with muscle strength of middle-aged and elderly persons. Eur. J. Appl. Physiol. 2012, 112, 1519–1525. [Google Scholar] [CrossRef]
  40. Phillip, J.G.; Minet, L.R.; Smedemark, S.A.; Ryg, J.; Andersen-Ranberg, K.; Brockhattingen, K.K. Comparative analysis of hand-held and stationary ultrasound for detection of sarcopenia in acutely hospitalised older adults—A validity and reliability study. Eur. Geriatr. Med. 2024, 15, 1017–1022. [Google Scholar] [CrossRef]
  41. van der Kraats, A.M.; Peeters, N.H.C.; Janssen, E.R.C.; Lambers Heerspink, F.O. Handheld Ultrasound Does not Replace Magnetic Resonance Imaging for Diagnosis of Rotator Cuff Tears. Arthrosc. Sports Med. Rehabil. 2023, 5, e381–e387. [Google Scholar] [CrossRef]
  42. Yagobian, S.D.; Wallace, S.R.; Fowler, J.R. A comparison of handheld versus cart-based ultrasound in the evaluation and diagnosis of carpal tunnel syndrome. J. Hand Microsurg. 2024, 16, 100159. [Google Scholar] [CrossRef]
  43. Mantella, L.E.; Colledanchise, K.; Bullen, M.; Hetu, M.F.; Day, A.G.; McLellan, C.S.; Johri, A.M. Handheld versus conventional vascular ultrasound for assessing carotid artery plaque. Int. J. Cardiol. 2019, 278, 295–299. [Google Scholar] [CrossRef]
  44. Rispo, A.; Calabrese, G.; Testa, A.; Imperatore, N.; Patturelli, M.; Allocca, M.; Guarino, A.D.; Cantisani, N.M.; Toro, B.; Castiglione, F. Hocus Pocus: The Role of Hand-held Ultrasonography in Predicting Disease Extension and Endoscopic Activity in Ulcerative Colitis. J. Crohn’s Colitis 2023, 17, 1089–1096. [Google Scholar] [CrossRef]
  45. Borg, D.N.; Bach, A.J.E.; O’Brien, J.L.; Sainani, K.L. Calculating sample size for reliability studies. PMR 2022, 14, 1018–1025. [Google Scholar] [CrossRef]
Figure 1. Thickness of the rectus femoris and vastus intermedius using the Clarius L15 HD3 (left image) and GE LOGIQ e (right image).
Jfmk 10 00299 g001
Figure 2. Bland–Altman Plot depicting the agreement for the evaluation of rectus femoris thickness for the Clarius L15 HD3 and GE LOGIQ e.
Jfmk 10 00299 g002
Figure 3. Bland–Altman Plot depicting the agreement for the evaluation of vastus intermedius thickness for the Clarius L15 HD3 and GE LOGIQ e.
Jfmk 10 00299 g003
Figure 4. (A,B) Relationship between the 1-RM and thickness of the rectus femoris (A) and the vastus intermedius (B).
Jfmk 10 00299 g004aJfmk 10 00299 g004b
Table 1. Characteristics of study participants at baseline.
CharacteristicN = 20
Age, years (mean, SD)21.9 (2.7)
Sex (females), n (%)16 (80%)
Race, n (%)
     White12 (60%)
     Black4 (20%)
     Hispanic2 (10%)
     Asian1 (10%)
Body mass index (kg/m2), mean (SD)23.7 (4.2)
Days of vigorous PA per week (mean, SD)2.8 (1.9)
Minutes of vigorous PA per week (mean, SD)187 (167.3)
Days of moderate PA per week (mean, SD)2.6 (1.8)
Minutes of moderate PA per week (mean, SD)48 (31.0)
Days of walking per week (mean, SD)5.9 (1.4)
Minutes of walking per week (mean, SD)71.8 (77.9)
Minutes of sitting per week (mean, SD)361.8 (142.9)
PA = Physical activity; SD = Standard deviation.
Table 2. Intra-rater reliability for measuring thickness of the rectus femoris and vastus intermedius using the Clarius L15 HD3 and GE LOGIQ e.
Thickness (cm)Visit 1
(Mean, SD)
Visit 2
(Mean, SD)
Δ (%)ICC (95%CI)TE (cm)RMSSD
(cm)
LSCRMSD
(cm)
RMS%CVLSC%CVSEM (%)MDC (cm)
RF
Clarius L15 HD3
2.11 (0.35)2.13 (0.32)−1.54 (6.59)0.96
(0.90–0.98)
0.090.0930.2584.5112.492.660.07
RF
GE LOGIQ e
2.14 (0.38)2.21 (0.33)−3.91 (9.41)0.94
(0.84–0.98)
0.120.1220.3396.2317.264.020.11
VI
Clarius L15 HD3
1.86 (0.49)1.86 (0.41)1.08 (9.44)0.97
(0.92–0.99)
0.120.1120.3116.1617.052.830.08
VI
GE LOGIQ e
1.90 (0.45)1.96 (0.45)−4.16 (9.56)0.97
(0.91–0.99)
0.110.1160.3216.6118.312.650.07
ICC = intraclass correlation coefficient; MDC = minimal detectable change; RF = rectus femoris; SEM = standard error of measurement; TE = typical error; VI = vastus intermedius; RMSSD = root mean square standard deviation; LSCRMSD = least significant change for RMSSD at 95% confidence; RMS%CV = root mean square percentage coefficient of variation; LSC%CV = least significant change for RMS%CV at 95% confidence.
Table 3. Inter-rater reliability for measuring thickness of the rectus femoris and vastus intermedius using the Clarius L15 HD3 and GE LOGIQ e.
Thickness (cm)Assessor 1
(Mean, SD)
Assessor 2
(Mean, SD)
Δ (%)pICC (95%CI)TE (cm)SEM (%)MDC (cm)
Clarius L15 HD3
      RF2.11 (0.35)2.08 (0.39)1.43 (6.00)0.380.97
(0.93–0.99)
0.092.200.06
      VI1.86 (0.49)1.88 (0.46)−1.33 (8.62)0.680.97
(0.93–0.99)
0.112.720.08
GE LOGIQ e
      RF2.14 (0.38)2.08 (0.39)2.86 (7.02)0.0430.97
(0.91–0.99)
0.092.170.06
      VI1.90 (0.45)1.90 (0.46)−0.30 (10.27)0.990.97
(0.93–0.99)
0.112.660.07
ICC = intraclass correlation coefficient; MDC = minimal detectable change; RF = rectus femoris; SEM = standard error of measurement; TE = typical error; VI = vastus intermedius.
Table 4. Inter-device agreement between the Clarius L15 HD3 and GE LOGIQ e for measuring thickness of the rectus femoris and vastus intermedius.
Thickness (cm)Clarius L15 HD3
(Mean, SD)
GE LOGIQ e
(Mean, SD)
Δ (%)ICC (95%CI)TE (cm)SEM (%)MDC (cm)
RF2.11 (0.35)2.14 (0.38)−1.47 (6.20)0.98
(0.94–0.99)
0.081.580.04
VI1.86 (0.49)1.90 (0.45)−2.03 (7.20)0.98
(0.95–0.99)
0.091.750.05
ICC = intraclass correlation coefficient; MDC = minimal detectable change; RF = rectus femoris; SEM = standard error of measurement; TE = typical error; VI = vastus intermedius.
Disclaimer/Publisher’s Note: The statements, opinions and data contained in all publications are solely those of the individual author(s) and contributor(s) and not of MDPI and/or the editor(s). MDPI and/or the editor(s) disclaim responsibility for any injury to people or property resulting from any ideas, methods, instructions or products referred to in the content.

