Review

A Study on the Impact of Different PV Model Parameters and Various DC Faults on the Characteristics and Performance of the Photovoltaic Arrays

by
Khaled Ibrahim Baradieh
1,
Muhammad Ammirrul Atiqi Mohd Zainuri
1,*,
Nor Azwan Mohamed Kamari
1,
Huda Abdullah
1,
Yushaizad Yusof
1,
Mohd Asyraf Zulkifley
1 and
Mohsin Ali Koondhar
1,2
1
Department of Electrical, Electronic and Systems Engineering, Faculty of Engineering and Built Environment, Universiti Kebangsaan Malaysia (UKM), Bangi 43600 UKM, Selangor, Malaysia
2
Department of Electrical Engineering, Quaid-e-Awam University of Engineering, Science and Technology, Nawabshah 67480, Sindh, Pakistan
*
Author to whom correspondence should be addressed.
Inventions 2024, 9(5), 93; https://doi.org/10.3390/inventions9050093
Submission received: 16 July 2024 / Revised: 14 August 2024 / Accepted: 22 August 2024 / Published: 27 August 2024

Abstract

:
PV systems play a vital role in the global renewable energy sector, and they require accurate modeling and reliable performance to maximize the output power. This research presents a thorough analysis and discussions on the effects of different PV models’ parameters and certain specific faults on the performance and behavior of the photovoltaic systems under different temperature and irradiation conditions. It provides a detailed analysis of how several parameters affect the performance of the PV arrays, for instance, the series resistance, shunt resistance, photocurrent, reverse saturation current, and the diode ideality factor. These parameters were extracted mathematically and verified with the help of wide-ranging simulations and practical experiments. Additionally, the investigation of the effect of DC faults, including line-to-line, line-to-ground, partial shading, and complete shading faults on PV arrays, provides important fundamentals for fault detection and classification, thus improving the efficiency and protection of PV systems. It can, therefore, be stated that the outcomes of this research will assist in the enhancement of PV systems in terms of design, operation, and maintainability of photovoltaic plants, as well as contribute positively to the advancement of sustainable solar energy technology.

1. Introduction

Photovoltaic (PV) solar cell technology harnesses sunlight to generate electricity, tracing its roots to the 19th century when scientists first observed that specific materials could transform sunlight into electrical energy. The development of the first solar cells, employing selenium and silicon, took place in the early 20th century, largely driven by the space industry’s contributions to the growth of photovoltaic technology [1]. The fundamental process of a photovoltaic (PV) cell, referred to as the photovoltaic effect, is converting sunlight into electrical energy by absorbing sunlight, facilitating the transit of carrier electrons across an external circuit, and providing a sufficient voltage for practical applications [2]. Typically, PV cells consist of p-type and n-type semiconductor layers generating a p-n junction, an electrical contact composed of a metal grid or strip, and an anti-reflective coating to minimize energy loss [3,4]. When photons of sunlight possess enough energy, they can stimulate electrons from the bandgap of the material, causing them to move into the conduction band and generate charge carriers or electrons. The electric field at the p-n junction separates the electrons and holes, preventing their recombination and creating an electric field that opposes the original p-n junction field. This process is fundamental to the development of the voltage required for power production [4,5].
In 1954, Daryl Chapin from Bell Labs unveiled the first solar cell capable of turning sunlight into electricity using silicon at a 4% efficiency [6,7,8]. New materials and manufacturing procedures were implemented to help solar cells become more efficient in the next years. With the dramatic dropping in solar energy prices in the late 20th century, it became more reasonably priced and allowed a larger range of businesses and people [9]. Since PV solar cells offer globally reasonably priced, long-term, and sustainable power sources, they are more important in the renewable energy scene nowadays. The global demand for environmentally friendly energy sources has spurred major studies on photovoltaic technology as a method of generating pure electricity. Reducing the dependability and efficiency of PV systems requires an awareness of many elements affecting their performance.
Several studies published in the literature have looked at how several elements affect the PV system’s performance and behavior. Suthar et al. [10] explored the effect of many PV parameters, including irradiance, temperature, series resistance, and diode ideality factor, on the efficiency and performance of PV modules by analyzing many mathematical models. Tofel et al. [11] used computational methods to analyze the effect of temperature, irradiation, series and parallel resistance, and reverse saturation current on the PV module and the characteristics of I-V curves. Moreover, M. Sarkar [12] employed SPICE analysis to study the effects of series resistance, parallel resistance, photocurrent, and operating temperature on the performance of PV cells. These parameters were also quantitatively discussed in [13] and mathematically described in [14] with regard to their impact on the I-V characteristic of the PV modules. The impact of many variables on the MPP of the photovoltaic cells was examined in [15] using MATLAB; some of them were the series and parallel resistances, temperature, irradiance, and diode ideality factor. Furthermore, Saloux et al. [16], Hammodi et al. [17], and Ekwe [18] also looked at the effect of temperature and sun irradiation on the open circuit voltage, short circuit current, maximum power point, and fill factor of solar cells.
Bouzguenda et al. [19] constructed a MATLAB model to study MPP fluctuations under different temperatures and solar irradiation levels. Other studies have focused on the impact of single parameters on PV system performance, such as shunt resistance [20,21], reverse bias stress current [22], reverse saturation current [23], and illumination intensity [24]. However, the methodologies utilized in previous studies to examine the impact of different parameters on the efficiency of the PV modules, although valuable, have frequently demonstrated constraints in thoroughly evaluating all pertinent factors and comprehending the complex interactions among these variables. These restrictions emphasize the necessity of adopting a more comprehensive and holistic study. This approach should not solely focus on analyzing the isolated impacts of various characteristics but should also explore the complicated interconnections among these elements.
This work’s key contributions are summarized as follows:
  • Reviewing recent studies on how various parameters affect PV cells and modules’ behavior and efficiency.
  • Identifying knowledge gaps by investigating the complex interdependencies among different parameters and their cumulative impact on PV arrays’ performance.
  • Conducting a complete investigation of PV arrays’ dynamic characteristics by examining the effects of series resistance, shunt resistance, photocurrent, reverse saturation current, and the diode ideality factor through mathematical extractions, advanced simulations, and experimental methods.
  • Investigating typical electrical faults in PV arrays, such as line-to-line, line-to-ground, partial shading, and complete shading, acquiring insights into fault detection and classification methodologies, ultimately boosting system reliability and efficiency.
The paper’s structure seeks to give a comprehensive and systematic review of the impacts of numerous parameters and faults on the PV systems’ behavior and performance. Section 2 discusses the methods for obtaining PV module parameters, providing the framework for subsequent investigation.
In Section 3, the main emphasis is placed on the combined impact of the most important PV factors on the system output and on the way to visualize the dynamics of the system operation under various conditions. Section 4 investigates the role of different faults in PV array performance, analyzing their individual and cumulative implications. The findings, final analysis, and future recommendations are presented in Section 5.

2. PV Modelling and Parameters Extraction

The PV manufacturers offer comprehensive specifications, including information about temperature coefficients for open-circuit voltage (VOC) and short-circuit current (ISC), as well as the values for ISC, VOC, voltage at the maximum power point (VMPP), current at the maximum power point (IMPP), the number of cells connected in series, and the panel’s peak output power at STC (MPP). Due to the extended operational range of PV panels and the variety of climates when PV systems are installed, it is necessary to create performance models that would adequately predict the behavior of PV systems under different operational and climatic conditions. Due to the complexity of the described system, these models are useful in the prediction of the I-V characteristics of the photovoltaic system since they exhibit non-linear characteristics as a function of solar intensity, angle of incidence, spectrum, and temperature [25,26]. As a result, it is essential to have a highly accurate modeling approach to design and optimize the photovoltaic systems, to assess the effectiveness of new materials and technologies, and to analyze the effects caused by various faults in different operational conditions [27,28].

2.1. Modelling of the PV System

2.1.1. Equivalent Model of Series Connected PV Cells

The core solar cell model consists of a current source generated by sunlight, operating in conjunction with a diode. The net current accessible to the load is the difference between the total generated current and the current consumed by the diode [29,30]. The complex voltage–current relationship in solar cells, defined by its non-linearity, requires more comprehensive models for reliable electrical characterization, where it is not accurate to describe the solar cell simply as having a constant voltage or current [31]. The most generally adopted models for this purpose are the single-diode and double-diode models, as illustrated in Figure 1 [32].
The single-diode model, always referred to as a single-diode RP model, contains the linear and non-linear behavior of the photovoltaic cell by using only one diode. It models the solar cell by a single diode in parallel with a current source that represents the photovoltaic current, a parallel resistance that represents the leakage current, and a series resistance that represents the resistance within the cell to the passage of current [11,15,31,32,33].
On the other hand, building from the single-diode model, the double-diode model introduces an enhanced representation of the PV cell by incorporating forward and backward-biased diodes, enabling a representation of the carriers’ recombination process and providing a complex view of cell efficiency, most notably in terms of series and parallel of resistance. The use of the second diode in parallel with the model aids in emulating junction recombination, and the change in the ideality factor to two is quite helpful [8,30].
Nonetheless, the single-diode model emerges as the preferred framework owing to its optimal balance between simplicity and analytical precision. It surpasses the double-diode model in various aspects, including enhanced accuracy in steady-state and fault diagnosis at the system level, the availability of extensive dataset for a wide range of PV modules prevalent in the marketplace, and the expedited responsiveness within simulation settings [10,34,35]. Consequently, this study opts for the implementation of the single-diode model, grounded in the principles of the Shockley diode equation, for the numerical depiction of the PV cell’s current [36,37,38]. Therefore, the characterization of the PV cell hinges on five principal parameters: the photocurrent (Iph), the saturation current (Io), the ideality factor (α), the series resistance (Rs), and the parallel (shunt) resistance (Rsh).
I P V = I p h I d I s h
where the Iph is the photocurrent (A), Id is the diode current (A), and Ish is the shunt resistance current (A). They can be represented as follows:
I p h = I s c , S T C + K I T c e l l T r e f G G r e f
I d = I o e V d + I P V R s a V t 1
I s h = V P V + R s I P V R s h
where Io is the diode reverse saturation current, and Vd is the diode voltage. Both parameters are represented in (5) and (6).
I o = I s c , S T C + K I T c e l l T r e f e x p V o c , S T C + K v T c e l l T r e f a v t 1
V d = V P V + R s I P V
Table 1 summarizes the parameters of the PV module equations.

2.1.2. Equivalent Model of the PV Module

The datasheet of a photovoltaic module is an essential source of data that provides detailed information on the module’s composition. The module is comprised of Ns cells that are connected in series. The quantity of cells typically ranges from 36 to 72, resulting in a range of open-circuit voltage between approximately 20 and 45 volts [39]. This specific arrangement is purposefully chosen to produce higher voltage outputs, which can be used for various applications such as grid-connected solar systems and portable solar units.
To accurately depict the behavior of these series-connected Ns cells, it is necessary to modify different parameters in the single-diode PV cell model while keeping the same photocurrent (Iph), which is identical to that of a single PV cell. However, the operating parameters of the diode experience two main modifications: the voltage across the diode is multiplied by a factor of Ns, resulting in an open-circuit voltage for the complete PV module that is Ns times 0.6 volts instead of the estimated 0.6 volts of a single cell. Similarly, the thermal voltage, denoted as Vt = akT/q, is scaled by the number of series-connected cells in the PV module (Ns), resulting in the module’s thermal voltage being Ns times greater than that of a single PV cell [40,41]. Furthermore, the resistances in series and parallel within the entire module are increased by a factor of Ns compared to the values for a single cell. Consequently, the present result of a photovoltaic module can be evaluated by the elements that contain these modified variables as in the following equation:
I P V = I p h I o e q V d + I P V R s N s a K T 1 V P V + R s I P V R s h
In certain research scenarios, such as in this study, it may be necessary to investigate specific parameters of certain cells, for instance, to analyze the effects of partial shading on the PV module’s efficiency. In the case of such investigations, some of these parameters need to be divided by (Ns) to achieve values corresponding to a single PV cell. This is important as it sets a clear differentiation and approach towards the analysis and understanding of how partial shading impacts the entire system.
On the other hand, the current–voltage (I-V) characteristics given on the module’s datasheets are often achieved under Standard Test Conditions (STC), meaning irradiation level of 1000 W/m2, temperature of 25 °C, and an air mass (AM) of 1.5. Although these datasheets are useful for providing the basic information on the tested cell, such as the currents and voltages operating under three critical conditions: open circuit, short-circuit, and at the maximum power point, they do not provide necessary parameters required for constructing the adequate and comprehensive PV model. For instance, the photocurrent (Iph), series resistance (Rs), parallel (shunt) resistance (Rsh), saturation current (Io), and the ideality factor (α) are not explicitly stated. Thus, it emphasizes the importance of developing the concept of having different methods to acquire these characteristics [40,41].

2.2. PV Module Parameters Extraction

In PV systems, diode models require proper determination of the model parameters to enhance the system’s performance, a procedure generally considered complicated. This challenge has been described as an optimization problem in the literature [42]. Various numerical methods have been applied to determine the ideal model parameters that boost the efficiency of PV systems. For instance, researchers have utilized a non-linear least-squares technique using the Newton model to extract unknown parameters impacting the short-circuit behavior of PV cells [43]. Another study used numerous analytical methodologies to unravel the complexity of current–voltage (I-V) relationships in PV systems [44]. Additionally, three strategies were investigated for extracting parameters of the Shockley-diode model, where the curve-fitting methods have demonstrated the most advantageous outcomes [45]. A mathematical approach leveraging the Lambert W. function for determining the root-mean-square error in five-parameter single-diode models was proposed, yielding an accurate solution for the single-diode model parameters [46]. Another research applied tabular approaches to produce correct estimates for PV system performance but with a significant processing requirement [47]. A comparative investigation of the Levenberg–Marquardt and Newton–Raphson approaches emphasized the computing challenges and the risk of converging to local optima due to reliance on initial predictions was conducted in [48]. However, the optimization approaches referred to as deterministic techniques considering multiple boundary conditions, including convexity and differentiability to assure appropriate implementation. Regrettably, these methodologies frequently resulted in the emergence of local optima because of their dependence on initial solutions.
Evolutionary computation techniques have lately gained popularity for parameter extraction in PV models, hailed for their capacity to explore multidimensional search spaces without pre-existing information [49]. Techniques such as particle swarm optimization (PSO) have been employed for parameter assessment in both Shockley-diode and double-diode models [50]. The Simulated Annealing (SA) method has also been utilized for parameter determination, demonstrating benefits for both model types [51]. Meta-heuristic optimization approaches have been acknowledged for enabling the construction of efficient PV modulators characterized by precision, dependability, fast convergence, computational efficiency, and minimal control parameters [52,53,54,55,56,57].
On the other hand, Stornelli et al. introduced a novel iterative algorithm aimed at optimizing the parameters of the single-diode model for multi-crystalline PV panels, focusing on series resistance, parallel resistance, and diode ideality factor through a two-step process starting with manufacturer datasheet values or I-V curves [31].
However, in this paper, a combination of the datasheet values, such as Vmp (voltage at the maximum power point), Imp (current at the maximum power point), Voc (open-circuit voltage), Isc (short-circuit current), and the number of series-connected cells (Ns) are used to construct an accurate PV model. In addition, the estimation of gradients from the I-V curves, particularly under short circuit and near open-circuit conditions, is crucial for determining the required model’s parameters. This procedure is the primary focus of this section, which presents a method of extracting the five parameters of the single-diode model based on the data provided in the commercial datasheets. The proposed model uses the iterative algorithm [31], taking into consideration the variation in the solar irradiance and temperature to obtain the I-V characteristics of the PV module, in which we intend to develop a reliable and accurate PV model. Such a model can gain valuable insights into the performance of PV systems and make accurate choices regarding system design and optimization. The parameters to be extracted in this model are the photocurrent (Iph), shunt resistance (Rsh), series resistance (Rs), reverse saturation current (Io), and the diode ideality factor (α).

2.2.1. Extraction of the Photocurrent Parameter (Iph)

In short circuit conditions and at STC, the module voltage Vpv = 0, and the module current is the same as the short circuit current (Ipv = Isc). Therefore, the diode voltage as in (6) is as follows:
V d = R s I s c
The value of the diode voltage in (8) is very small at the normal values of the series resistance Rs, and it is comparable to the thermal voltage. Therefore, the diode current (3) at short circuit conditions and for small values of Rs can be assumed negligible. Similarly, since Vd is the voltage across the shunt resistance, then the shunt current is also negligible [58,59]. Therefore, under the short circuit current, the photocurrent is considered the same as the short circuit current at STC:
I p h = I s c
To obtain the photocurrent value under any irradiance and temperature conditions, it is important to consider the fact that the photocurrent is linearly proportional to the solar irradiance level [60], so the photocurrent is as follows:
I p h = ( I s c , S T C + K I Δ T ) G G S T C
where Δ T is the temperature difference from STC.

2.2.2. Extraction of the Shunt Resistance (Rsh)

The main effect of the shunt resistance is at the short circuit condition [61], and it affects the slope of the I-V curve at the short circuit condition, where the slope is very small with higher shunt resistance, as is shown in the coming sections. Therefore, the value of the shunt resistance is estimated by measuring the slope of the I-V curve at the short circuit condition by taking the derivative of the current with respect to the voltage:
d I P V d V P V 1 + R s R s h + I o R s V t e V P V + I P V R s V t = I o V t e V P V + I P V R s V t 1 R s h  
Under short circuit conditions, Vpv is zero, and at small values of the series resistance Rs, the term IscRs is very small compared to the thermal voltage Vt, and since the reverse saturation current is very small (nA), which means that the exponential terms can be neglected. In addition, since the series resistance is much smaller than the shunt resistance, then the term R s R s h can also be neglected. Therefore, the shunt resistance at short circuit condition is the inverse of the slope of the I-V curve, as shown in (12):
R s h ,   s h o r t   c i r c u i t = d V P V d I P V

2.2.3. Extraction of the Series Resistance (Rs)

The series resistance significantly affects the slope of the I-V curve near the open circuit voltage, which is used to estimate the series resistance [62]. The slope of the curve is very high for small resistance; it becomes smaller for higher resistance values, as is shown later. To estimate the series resistance, the same equation as in (11) is utilized after applying the open circuit conditions, where the entire photocurrent is the same as the diode current while neglecting the shunt resistance current, as Rsh is very high compared to the open circuit voltage, and the diode voltage is the same as the open circuit voltage. Applying these assumptions to Equations (7) and (9) results in the following:
I o e V o c V t = I s c
Hence, Equation (11) becomes the following:
1 + R s 1 R s h + I s c V t = d V P V d I P V I s c V t + 1 R s h  
By rearranging Equation (14), the series resistance can be extracted using the following equation:
R s = d V P V d I P V 1 1 R s h + I s c V t  
Since Rsh usually large value (several hundreds of ohms), then the value 1 R s h is very small compared to the value of I s c V t , which can be neglected. Equation (15) can be rewritten as follows:
R s ,   o p e n   c i r c u i t   c o n d i t i o n = d V P V d I P V V t I s c  

2.2.4. Extraction of the Reverse Saturation Current (Io)

The reverse saturation current is estimated under the open circuit condition, where the module current is zero, the module voltage is the open circuit voltage Voc, the photocurrent is the same as the short circuit current, and the diode voltage is the same as the open circuit voltage, with ignoring the shunt resistance current [23,63,64]. By applying these conditions to the current Equation (7), the reverse saturation current can be estimated as follows:
I o e V o c V t 1 V o c R s h = I s c V o c R s h
Hence, the reverse saturation current can be estimated using the formula:
I o = I s c V o c R s h e V o c V t

2.2.5. Extraction of the Diode Ideality Factor (α)

The diode ideality factor (α) is a measure of the material quality, where a lower value reflects a better material and higher output power. The diode ideality factor ranges between 1 and 2 [64,65]. The impact of the ideality factor is usually near the maximum power point (MPP), where the datasheets can be used to estimate the value of α. Therefore, the ideality factor is estimated from the current Equation (7) at the MPP conditions, where the voltage is the module voltage at maximum power (Vmp), and the current is the module current at maximum Power (Imp). Equation (7) is written as follows:
I m p = I s c I o e V d V t 1 V d R s h
where V d = V m p + I m p R s , and V t = N s α K T q .
As can be noticed in (19), the ideality factor appears in the thermal voltage equation. At this stage, and to find the optimum values of Rs, Io, and α, a numerical solution is required to solve the non-linear Equations (16), (18), and (19), respectively.

2.3. Parameters Extraction Implementation and Validation

The proposed estimation method was implemented in Mathcad® with the use of the single-diode model. The multi-crystalline PV module (KC130GT) module was selected to test the extraction method. However, since the type of PV module does not affect the algorithm in this research, the choice of the KC130GT PV module was sufficient to generalize the results without having to make multiple comparisons. Moreover, for testing and modeling, the multi-crystalline modules are frequently selected above other modules for several reasons, including the following: (1) The availability and widespread use of the module. (2) The exemplary performance: the KC130GT multi-crystalline photovoltaic modules are very reliable and stable in performing their functions in different weather conditions such as temperature and irradiation variation; they are therefore suitable for diagnostic and general PV analysis and transient performance. (3) Data availability: due to the availability of much research and data regarding the KC130GT module, the presence of such background knowledge makes it possible to ensure, to some extent, that the parameters that are used in simulations and experiments are credible and well-understood. (4) Cost-effectiveness: in relation to other forms of technology, for instance, monocrystalline or thin-film modules, the multi-crystalline modules are generally cheaper. (5) Exemplar of common faults: the KC130GT, for instance, falls under multi-crystalline modules and is known to be vulnerable to some faults. This makes them perfect for studies that focus on fault detection and analysis.
Table 2 depicts the characteristics provided by the manufacturer of the utilized PV module at STC [66]. In this research, the value of the diode ideality factor α is swept between 1 and 1.5; at each point, the values of Rs and Io are calculated, and the best set of values they provide the I-V curve that matches the curve of the module in the datasheet is considered as the optimum values of the required parameters. The required parameters from the datasheet are the open circuit voltage (Voc), the short circuit current (Isc), the voltage at the maximum power (Vmp), the current at the maximum power (Imp), the number of cells (Ns), the slope of the I-V curve near the short circuit, and the slope of the curve near the open circuit.
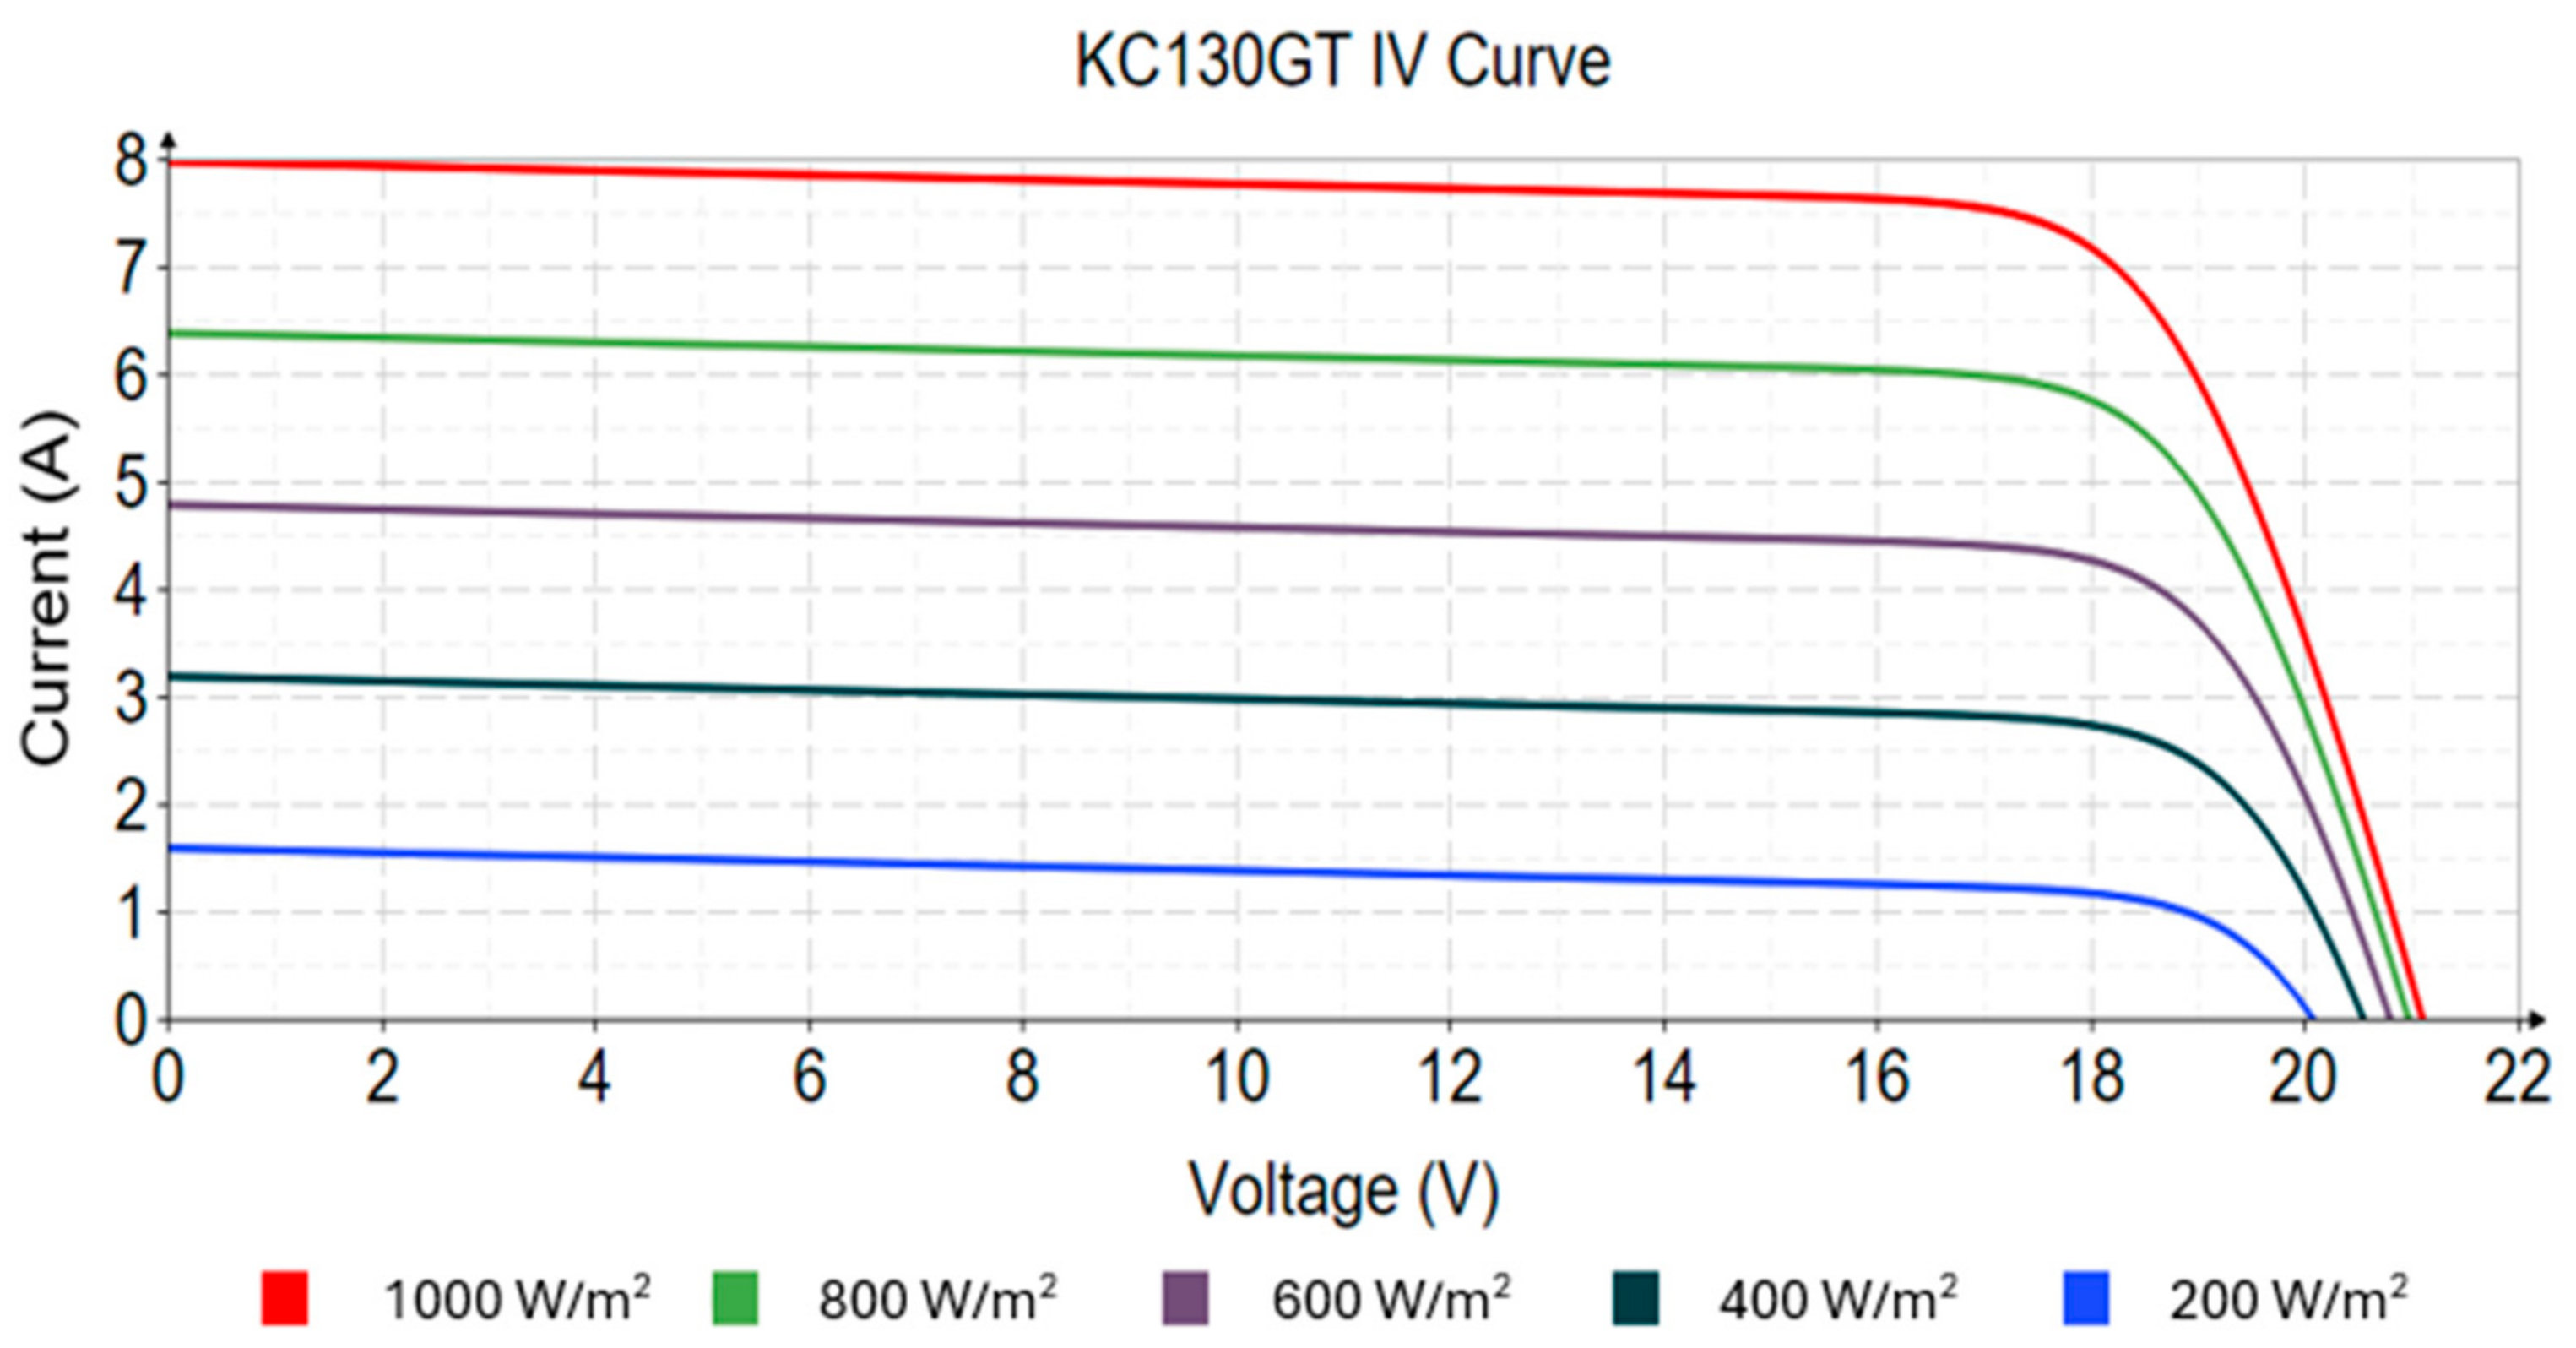
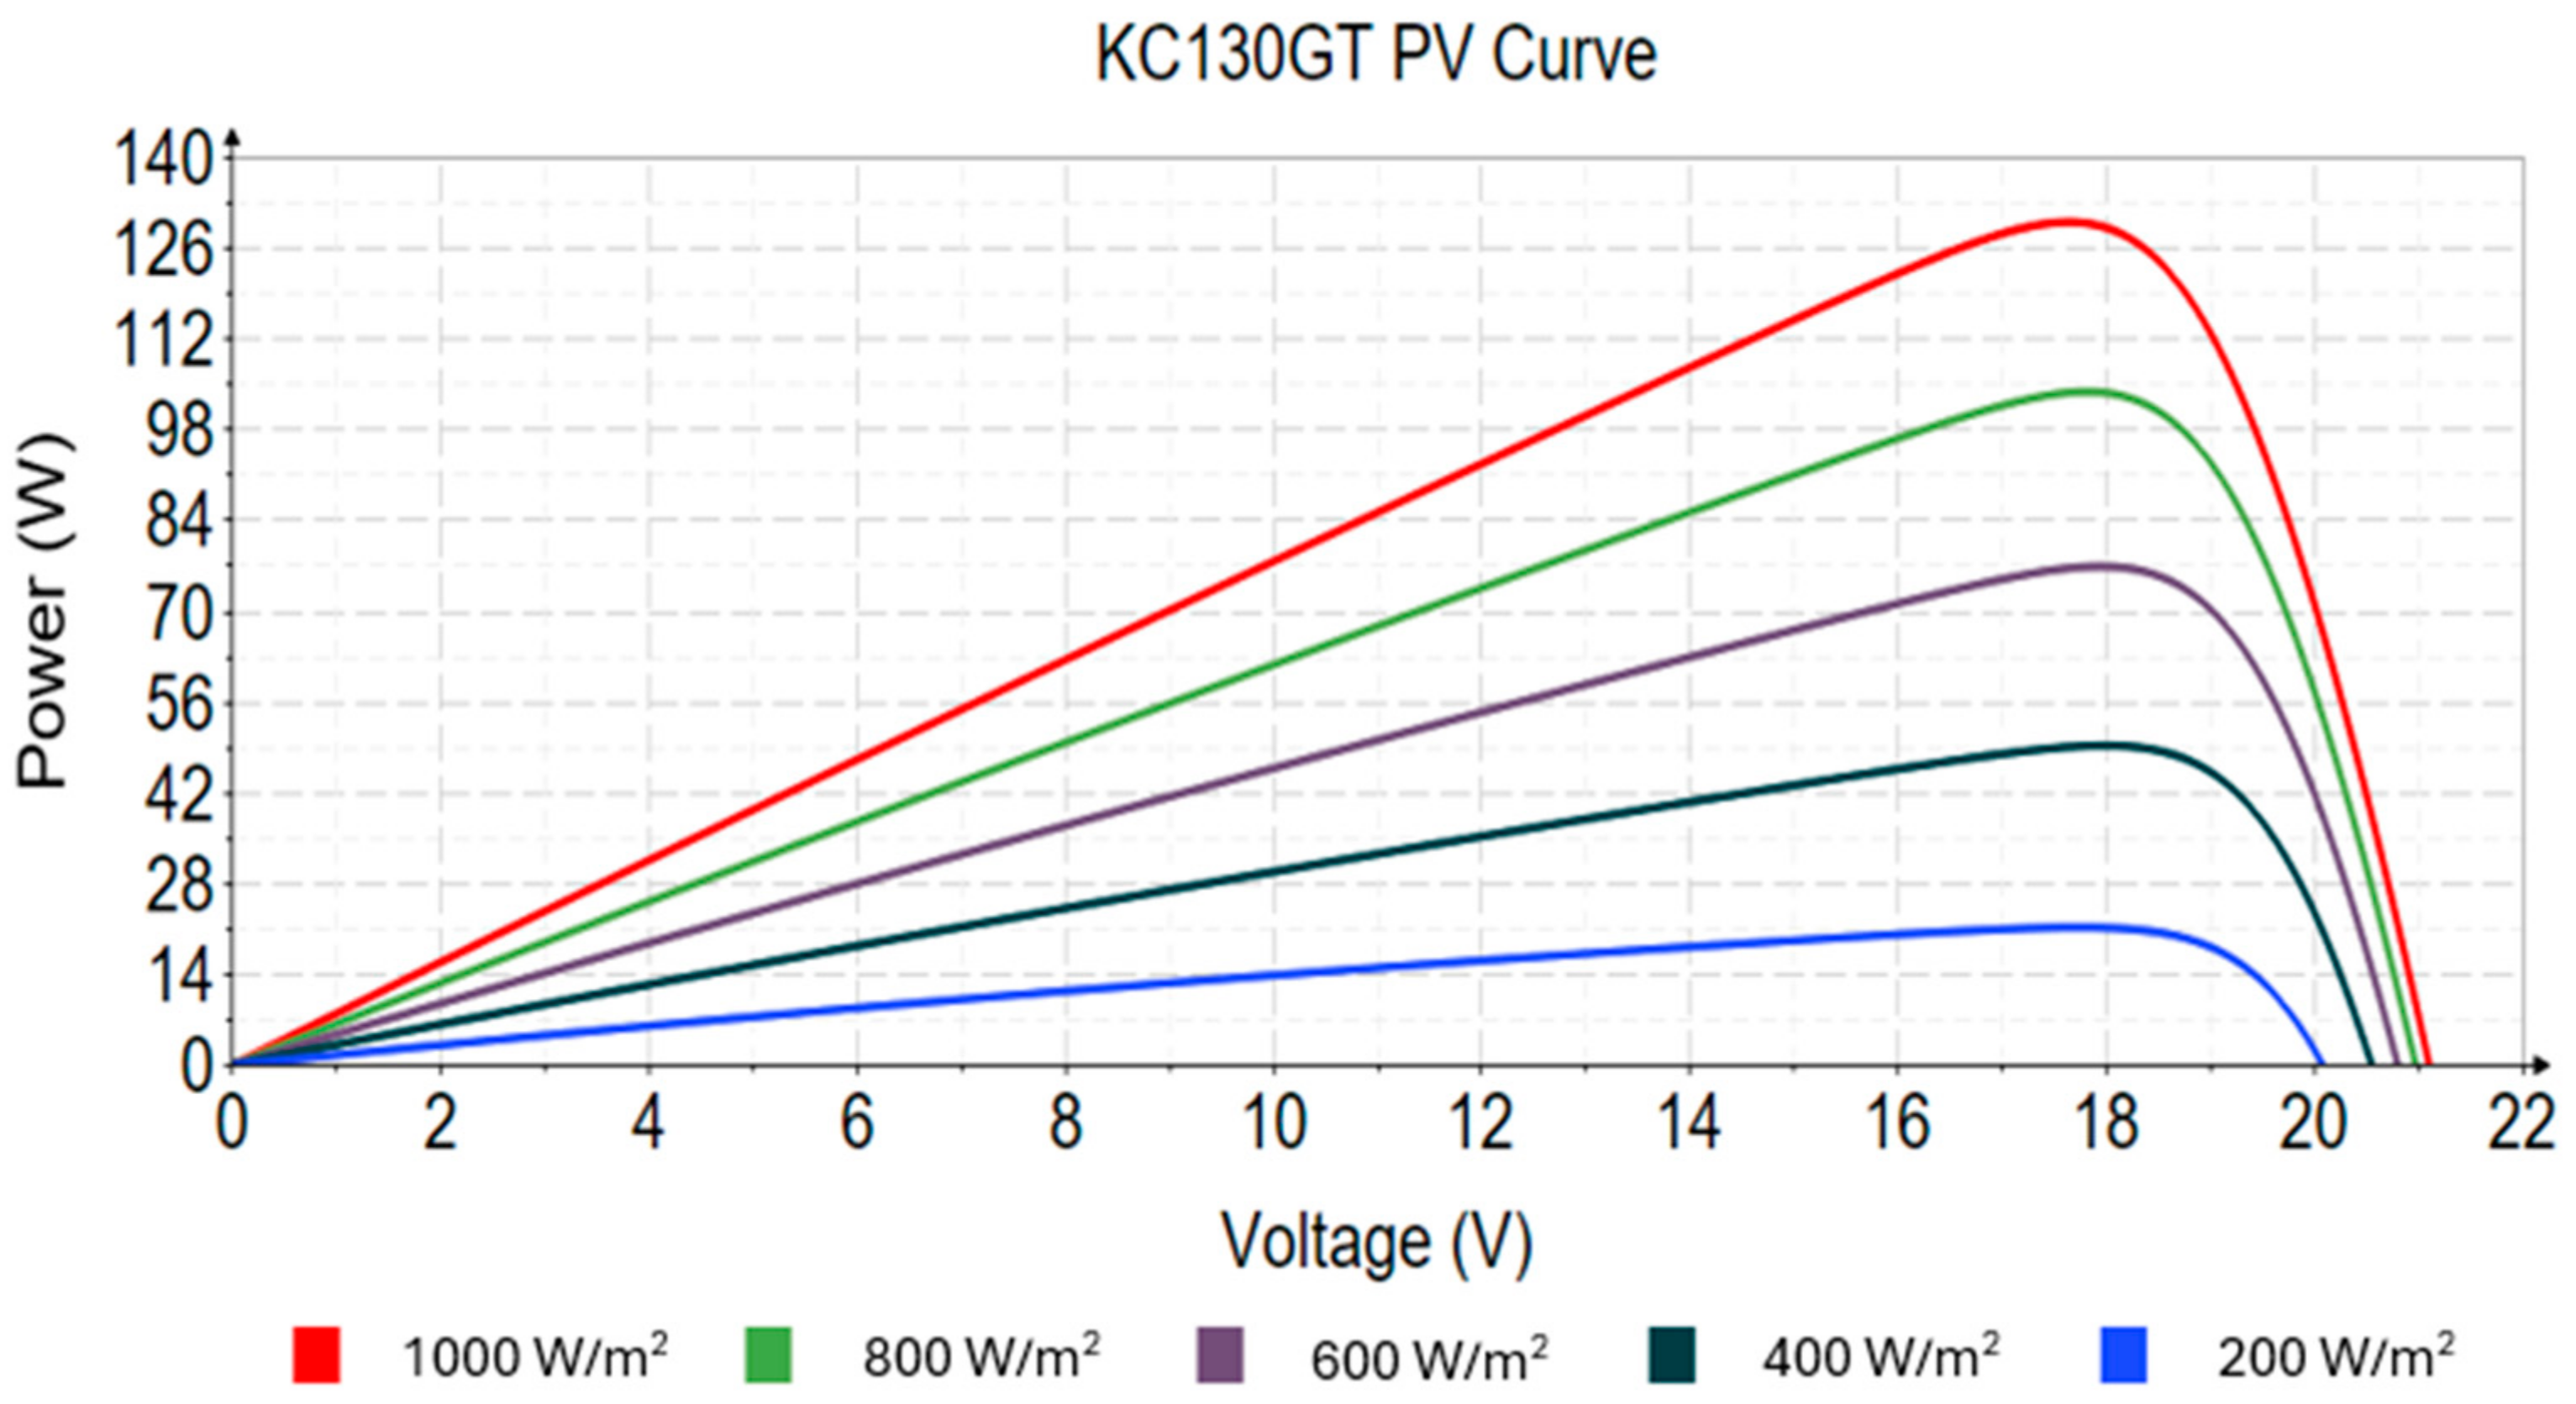
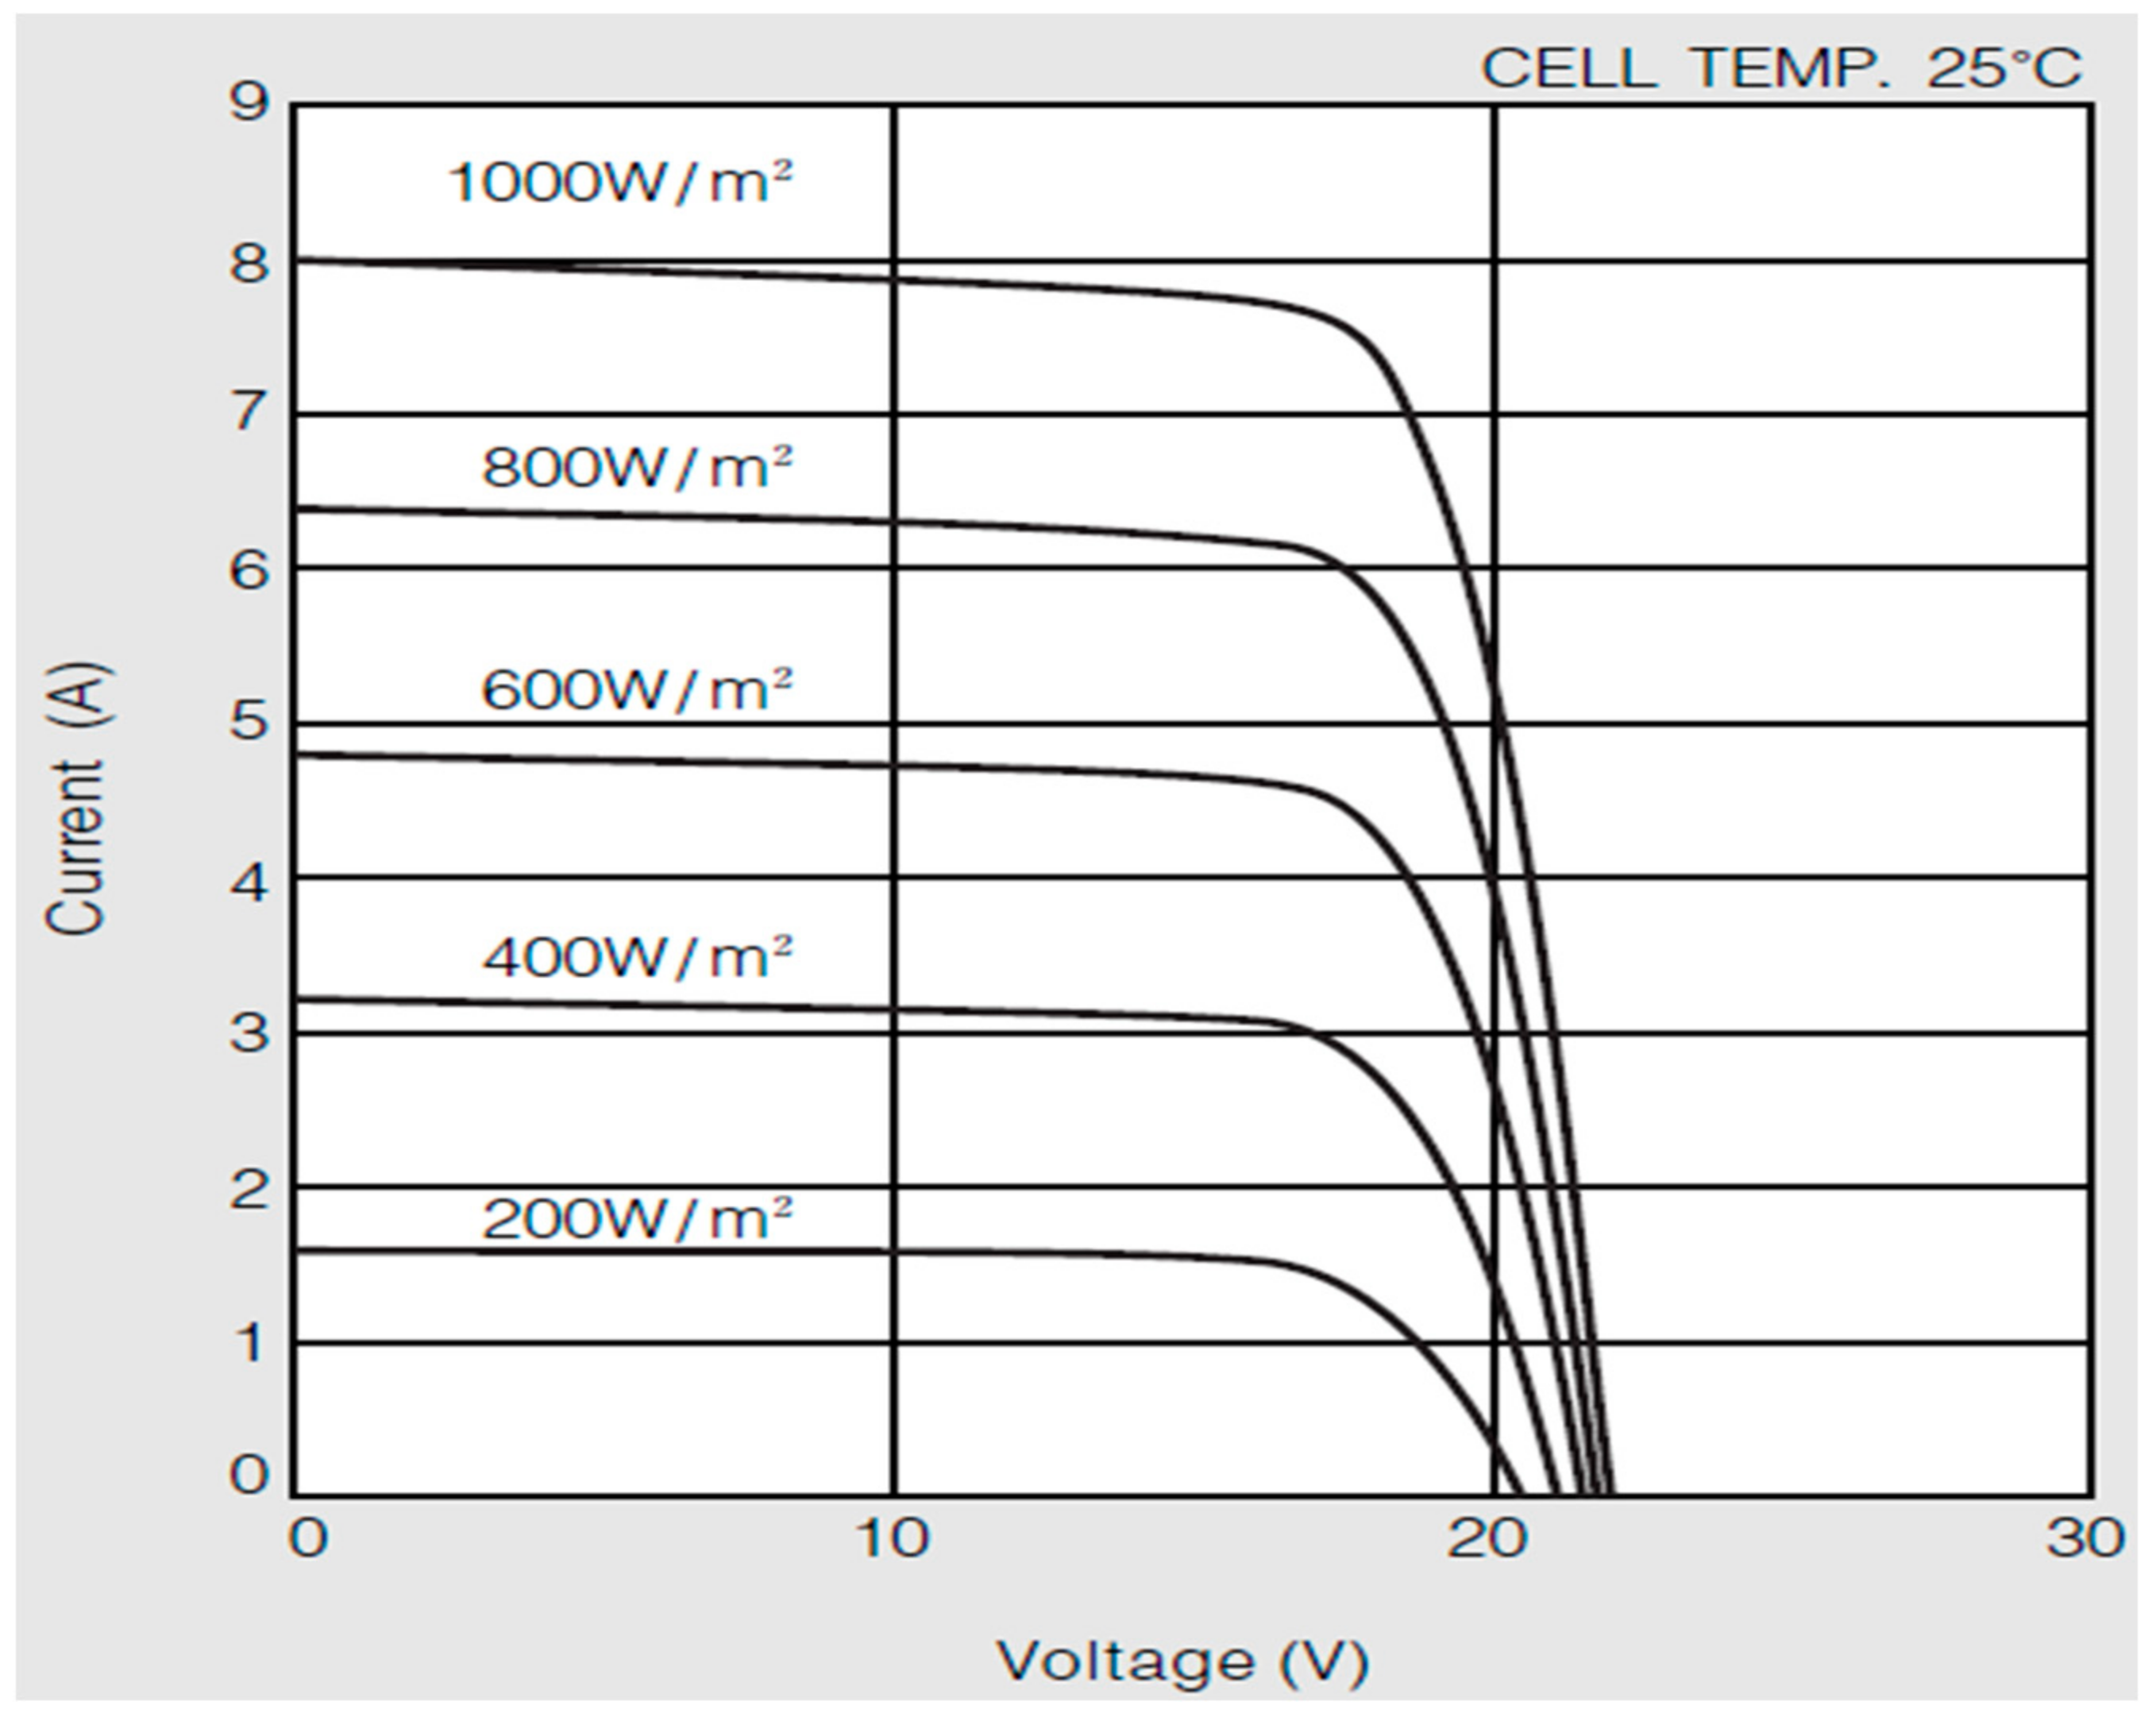
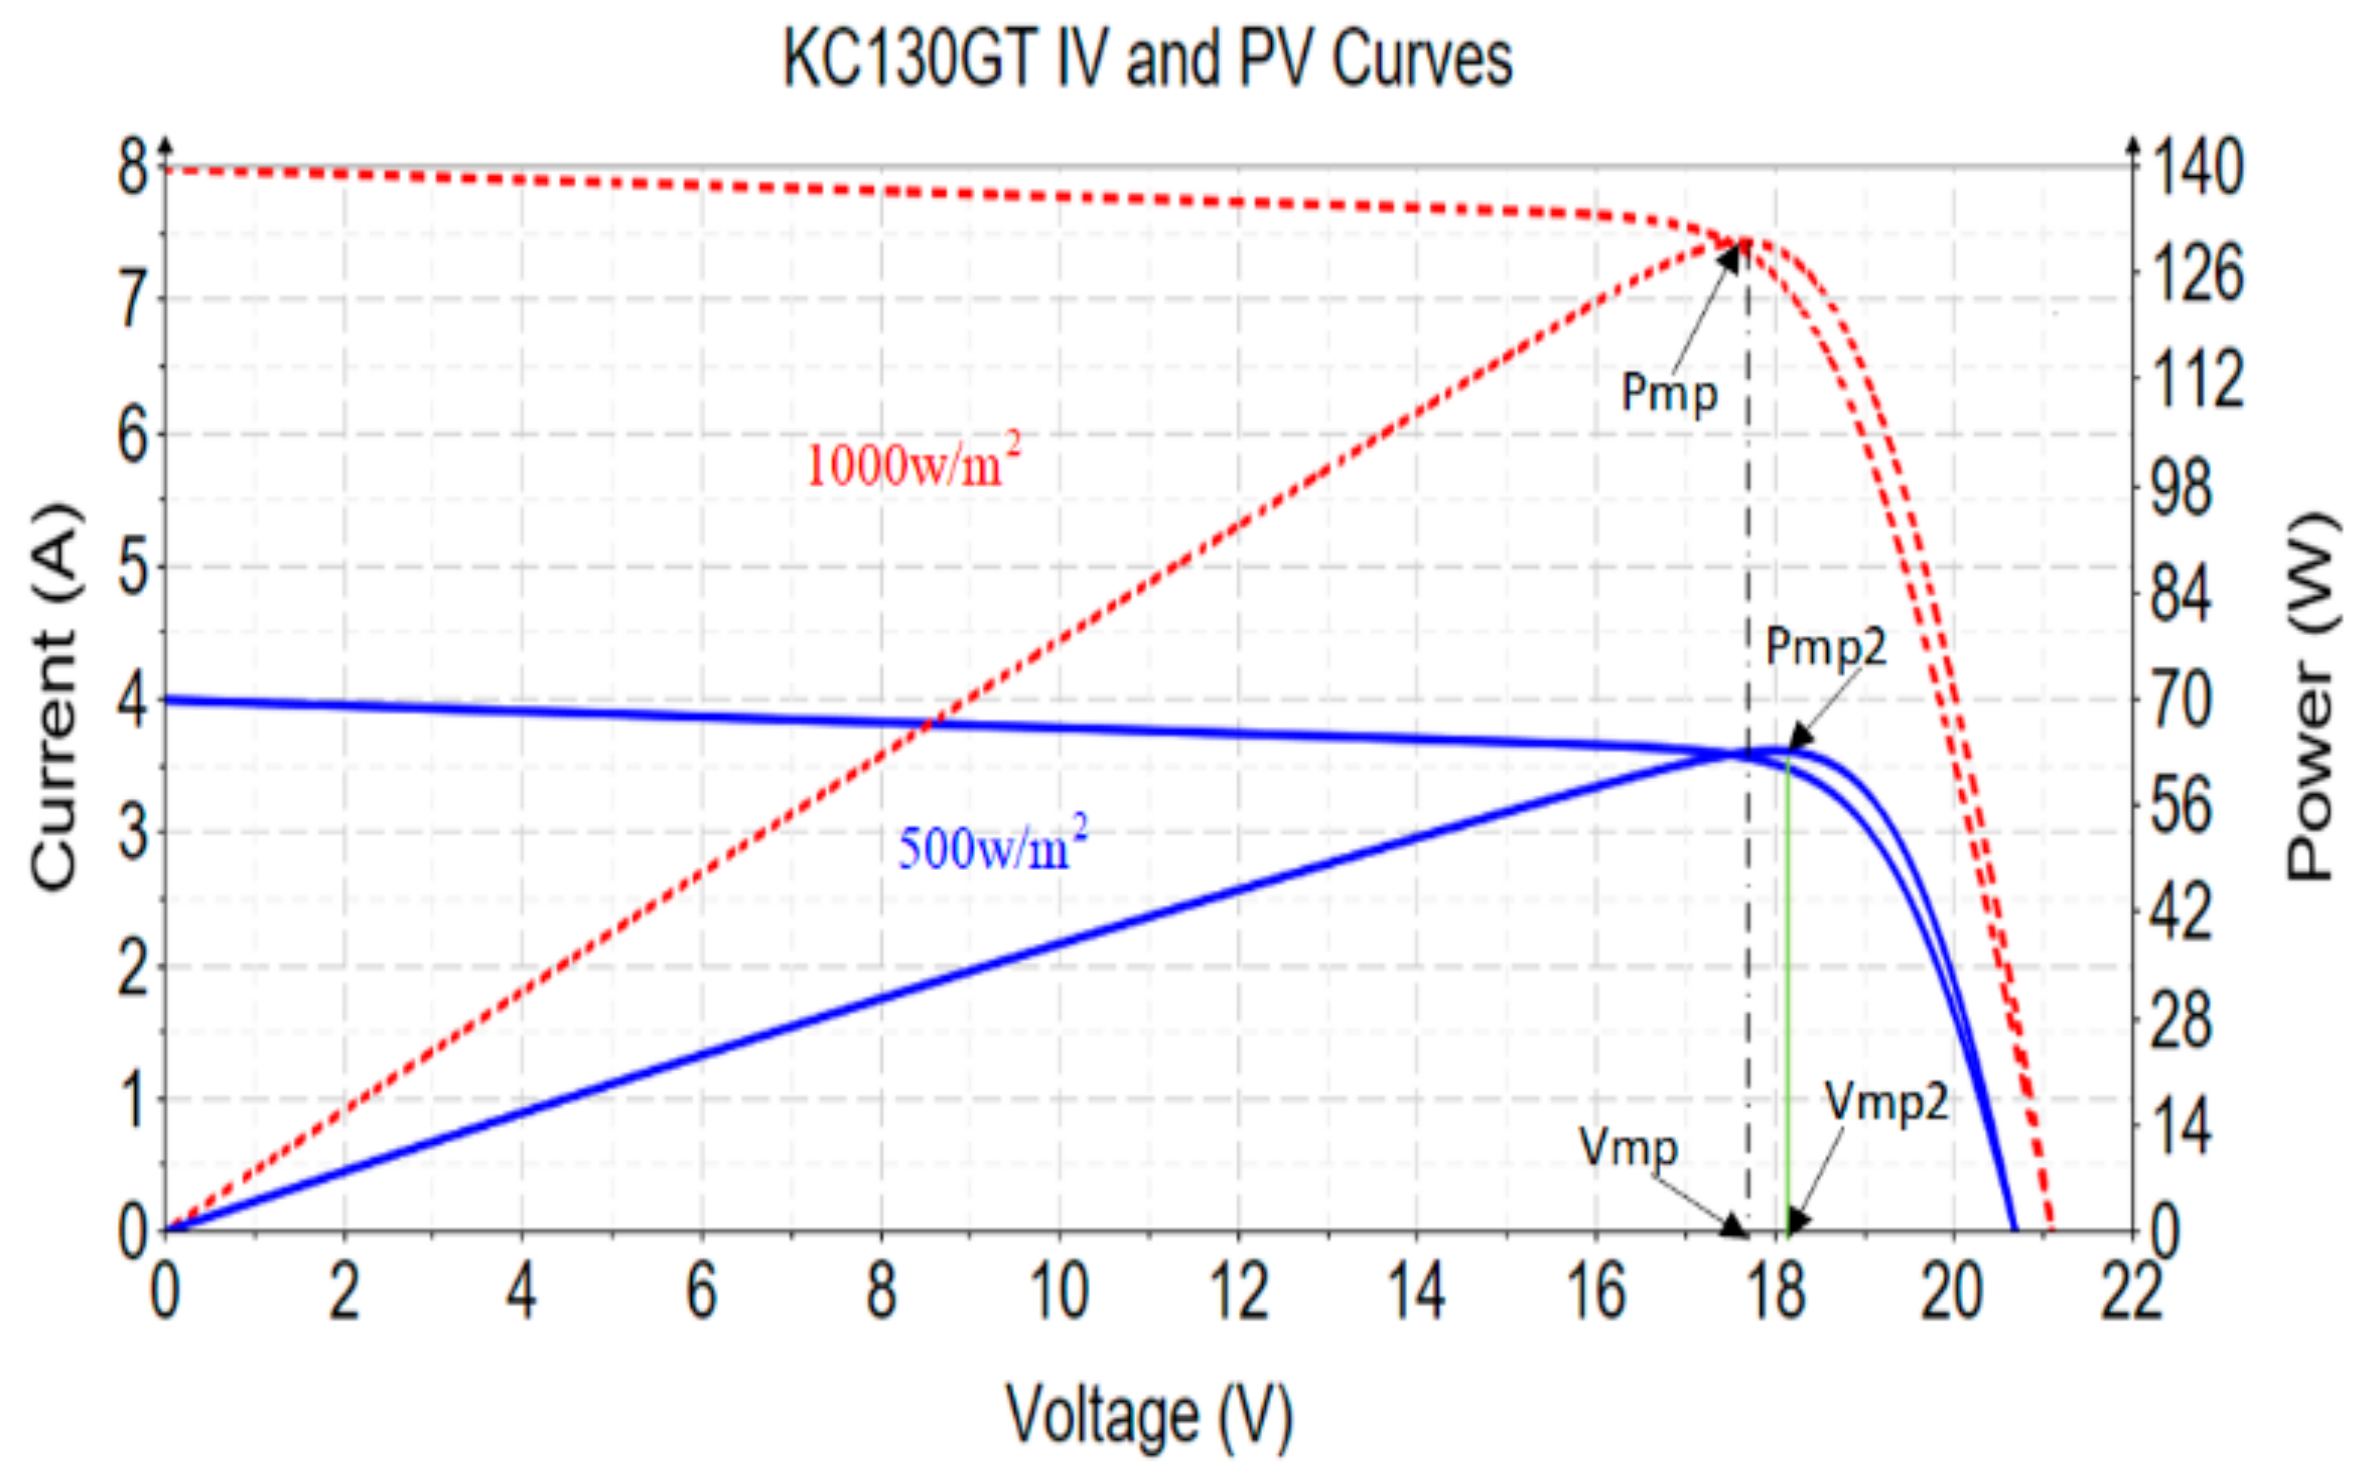
On the other hand, the parameters to be extracted are the photocurrent (Iph), the reverse saturation current (Io), the shunt resistance (Rsh), the series resistance (Rs), and the diode ideality factor (α). The extracted parameters, with the help of the sweeping method for the range of α, and the initial guess of the series resistance with 0.3 Ω are shown in Table 3. The I-V and P-V curves of the utilized PV module (KC130GT) with the use of the extracted parameters are shown in Figure 2 and Figure 3, respectively. The reference I-V curve of the module was captured from the module datasheet, as shown in Figure 4. As can be noticed, the extracted parameters were able to provide a very accurate curve compared to the reference curve from the module datasheet. Therefore, the extracted parameters are used at a later stage to build the PV array, which helps in studying the effect of varying such parameters on the efficiency of the PV array.

2.4. Experimental Setup Validation

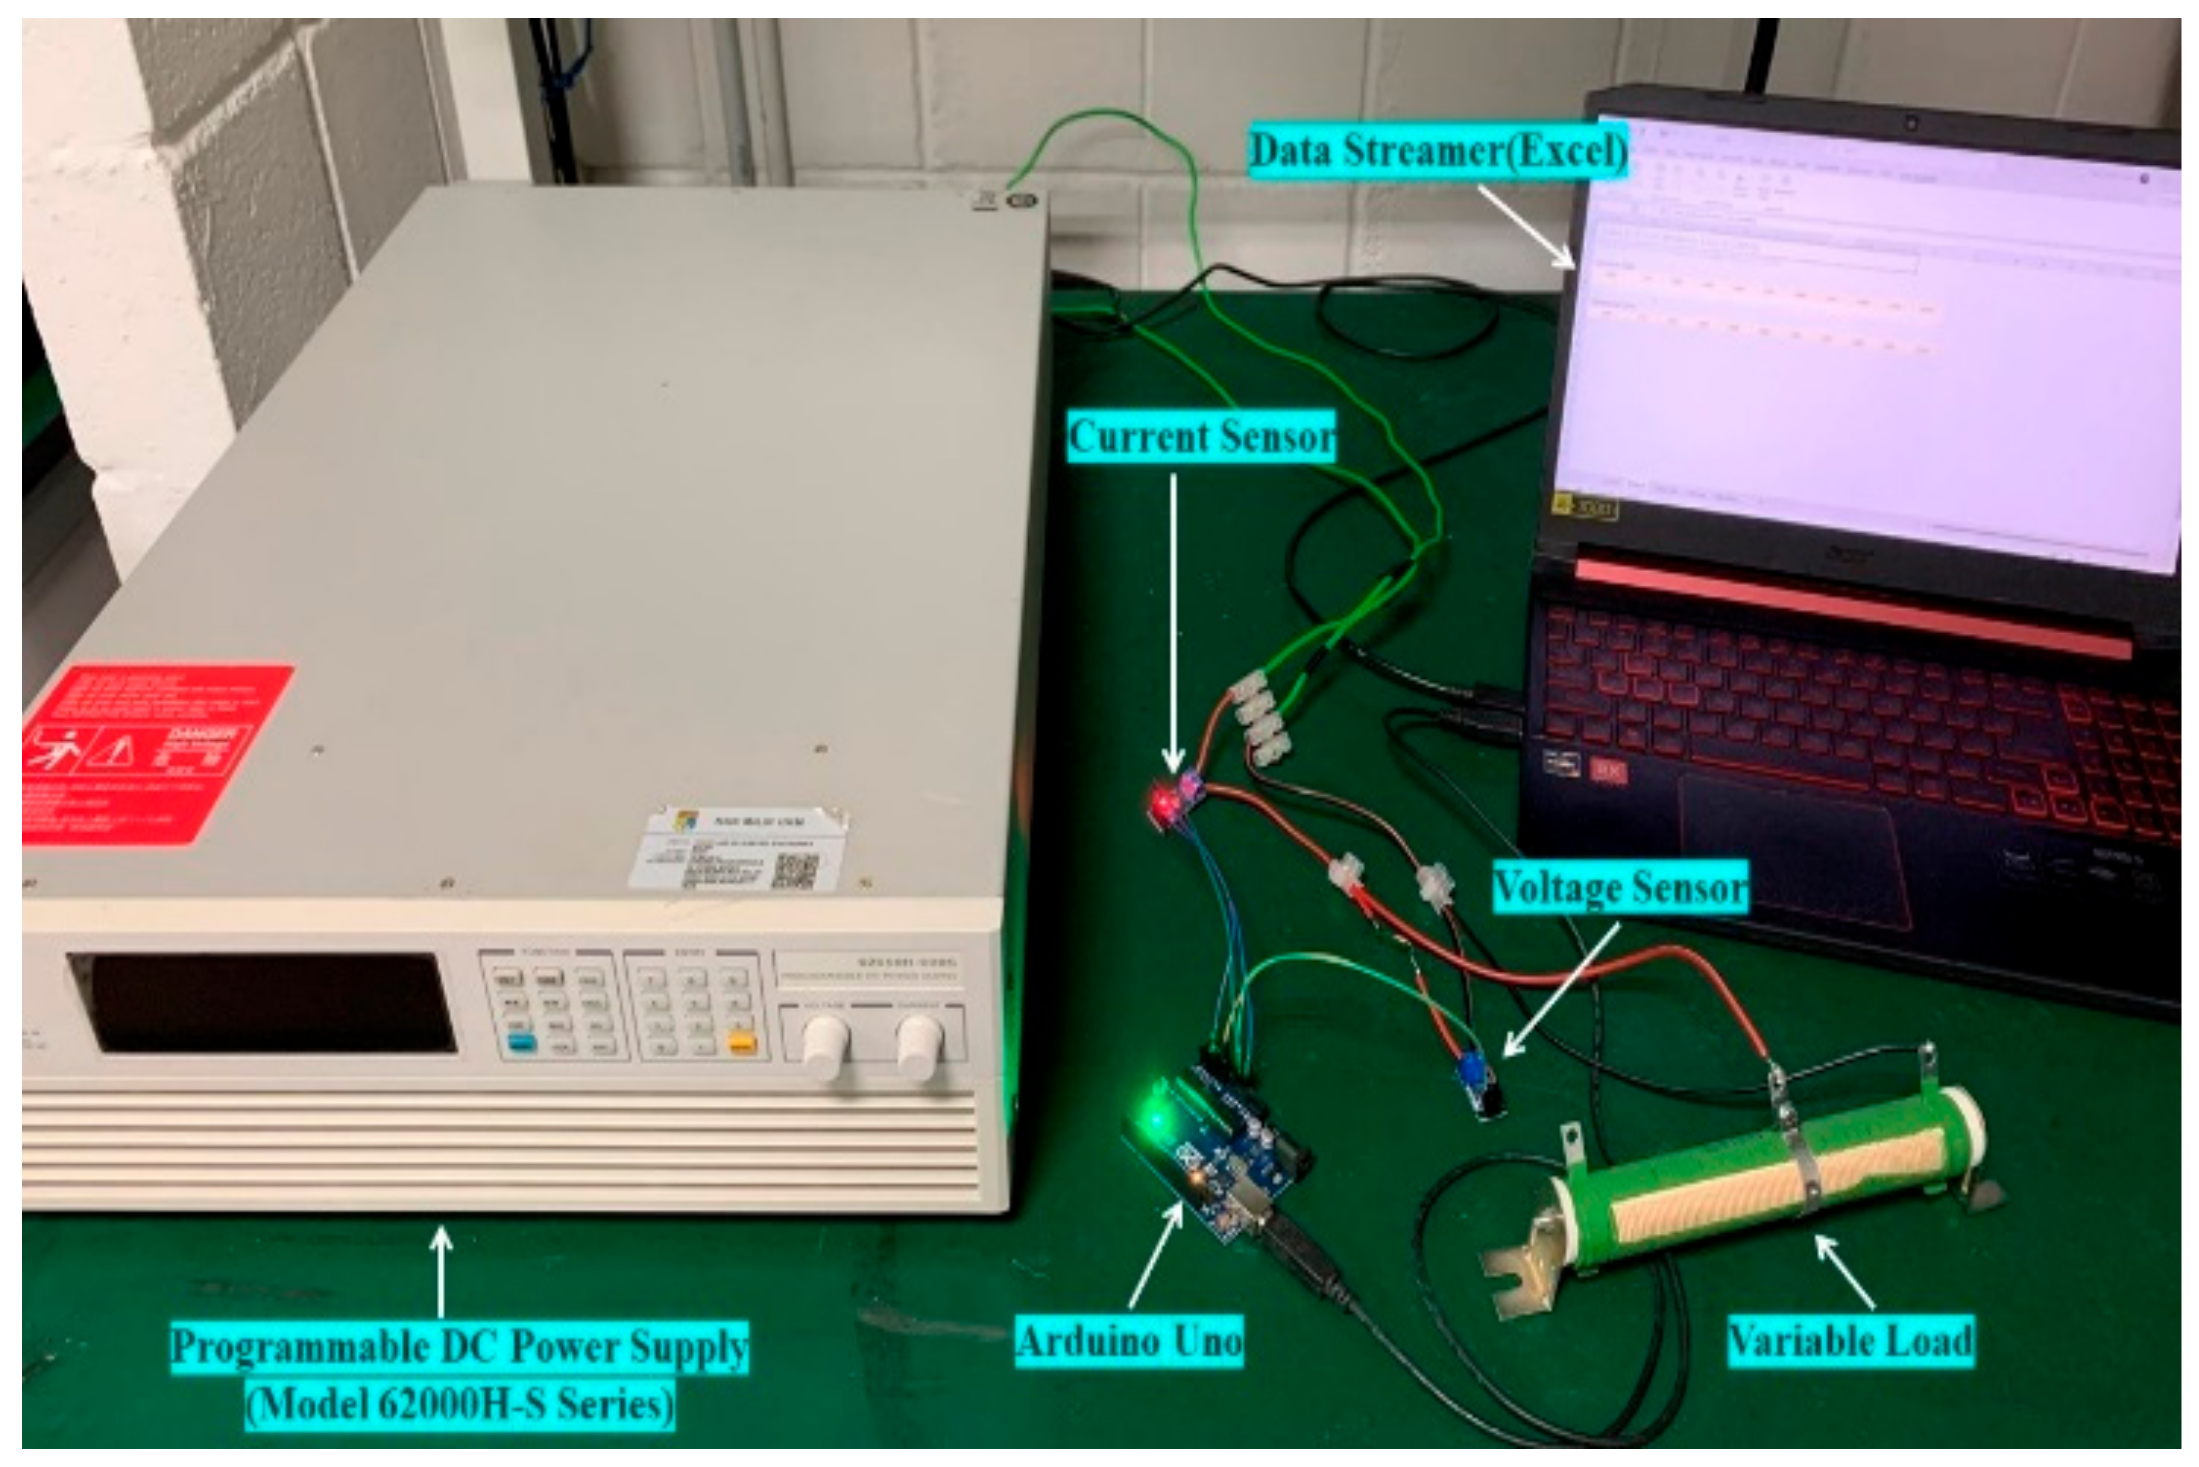
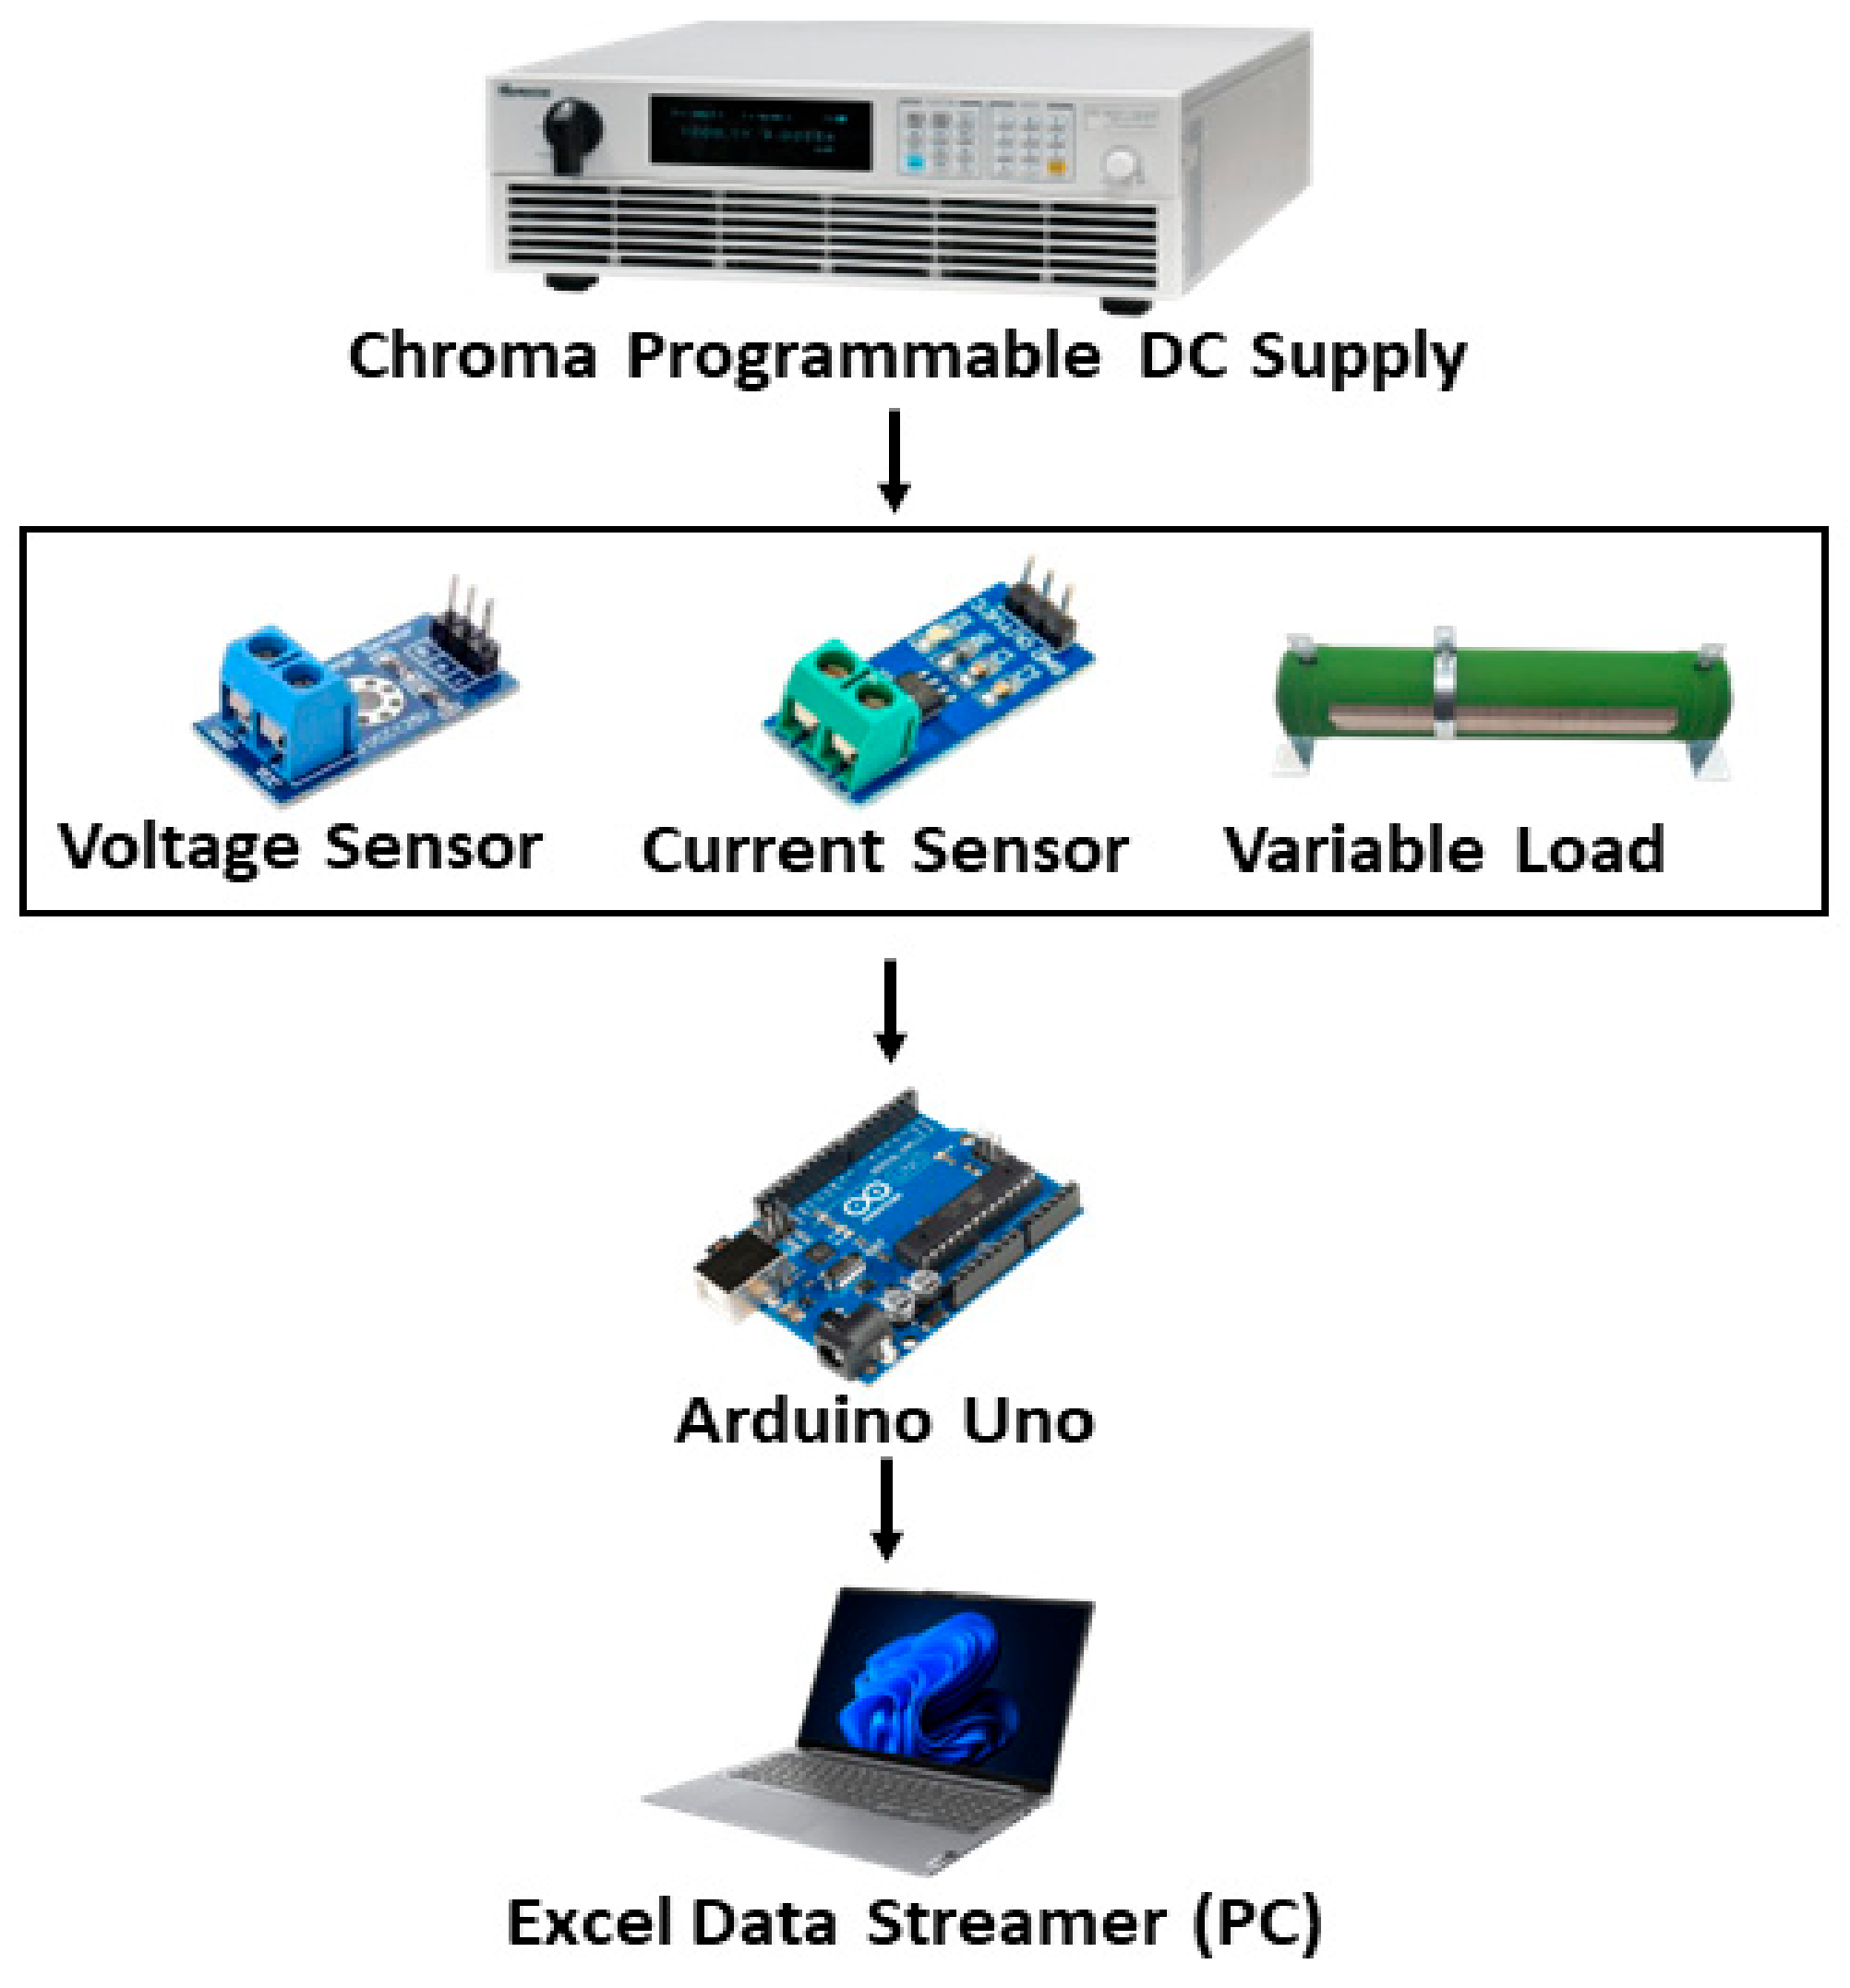
This subsection covers the experimental setup aimed to validate the efficiency and reliability of the suggested parameter extraction approach for practical usage. It attempts to provide actual proof demonstrating the method’s effectiveness and its stability under varied scenarios. Figure 5 illustrates the setup for the photovoltaic (PV) system, including a Chroma programmable DC power supply (62000H-S Series), which functions as an artificial solar panel. This system can create a direct current that replicates that of actual solar panels, with open-circuit voltages up to 1000 V and short-circuit currents up to 25 A, depending on the solar panel model utilized. This adaptability is made possible by the power supply EN50530 and Sandia SAS standards, enabling the easy programming of PV module characteristics stated in Table 3 to instantly obtain real-time voltage, current, and power data for various solar cell materials.
In addition, voltage and current sensors are utilized to measure the output voltage and current of the array in this system. Specifically, the current sensor Allegro-ACS712( manufactured by Allegro MicroSystems, Manchester, NH, USA), which can effectively measure the current up to 5 A, is in series with the Chroma power supply, a variable load, and an Arduino Uno R3 microcontroller ATMEGA328P (manufactured by Arduino LLC, James Ave, Boston, MA, USA)for data acquirement. The ACS712 sensor is composed of a high-precision linear hall sensor circuit with a low offset adjacent to the surface of its mold. The sensor measures the magnetic field from the current flowing through a copper conduction channel proximate to the sensor, converting this to a voltage signal. This conversion method comes with an advantage where the magnetic source is close to the hall transducer for improved accuracy [67]. Furthermore, a voltage sensor module (F031-06), which is capable of handling up to 25 V [68], is connected in parallel to the variable load and the Chroma power supply for voltage monitoring. This module operates on a basic voltage divider principle, utilizing two resistors of 30 kΩ and 7.5 kΩ, and normally draws a current of roughly 0.67 mA. Consequently, it scales down the output voltage by a factor of 5 V for every given input voltage. To increase the measurable voltage, a 100 kΩ resistor is connected in series with the input of the voltage sensor, as shown in Figure 6. Therefore, the new voltage rating of the voltage sensor is up to 92 V, according to the following calculations:
I s e n s o r = V s e n s o r R V D R = 25 30   k + 7.5   k = 0.67   m A
R s e r i e s = V s e n s o r n e w 25 I s e n s o r
V s e n s o r n e w = 100   k × 0.67   m A + 25   V = 92   V
Additionally, a 100 Ω, 100 W variable resistor, linked in series within the circuit, serves as the variable load. The Arduino Uno R3 (ATMEGA328P) microprocessor interprets the analog signals from the current and voltage sensors. These signals are interfaced via the microcontroller’s analog pins and sent to a PC using the serial port. The real-time data are monitored by an Excel data streamer interface, which allows live data to be streamed directly from the Arduino into Microsoft Excel 365. The prototype of the hardware configuration is presented in Figure 7.
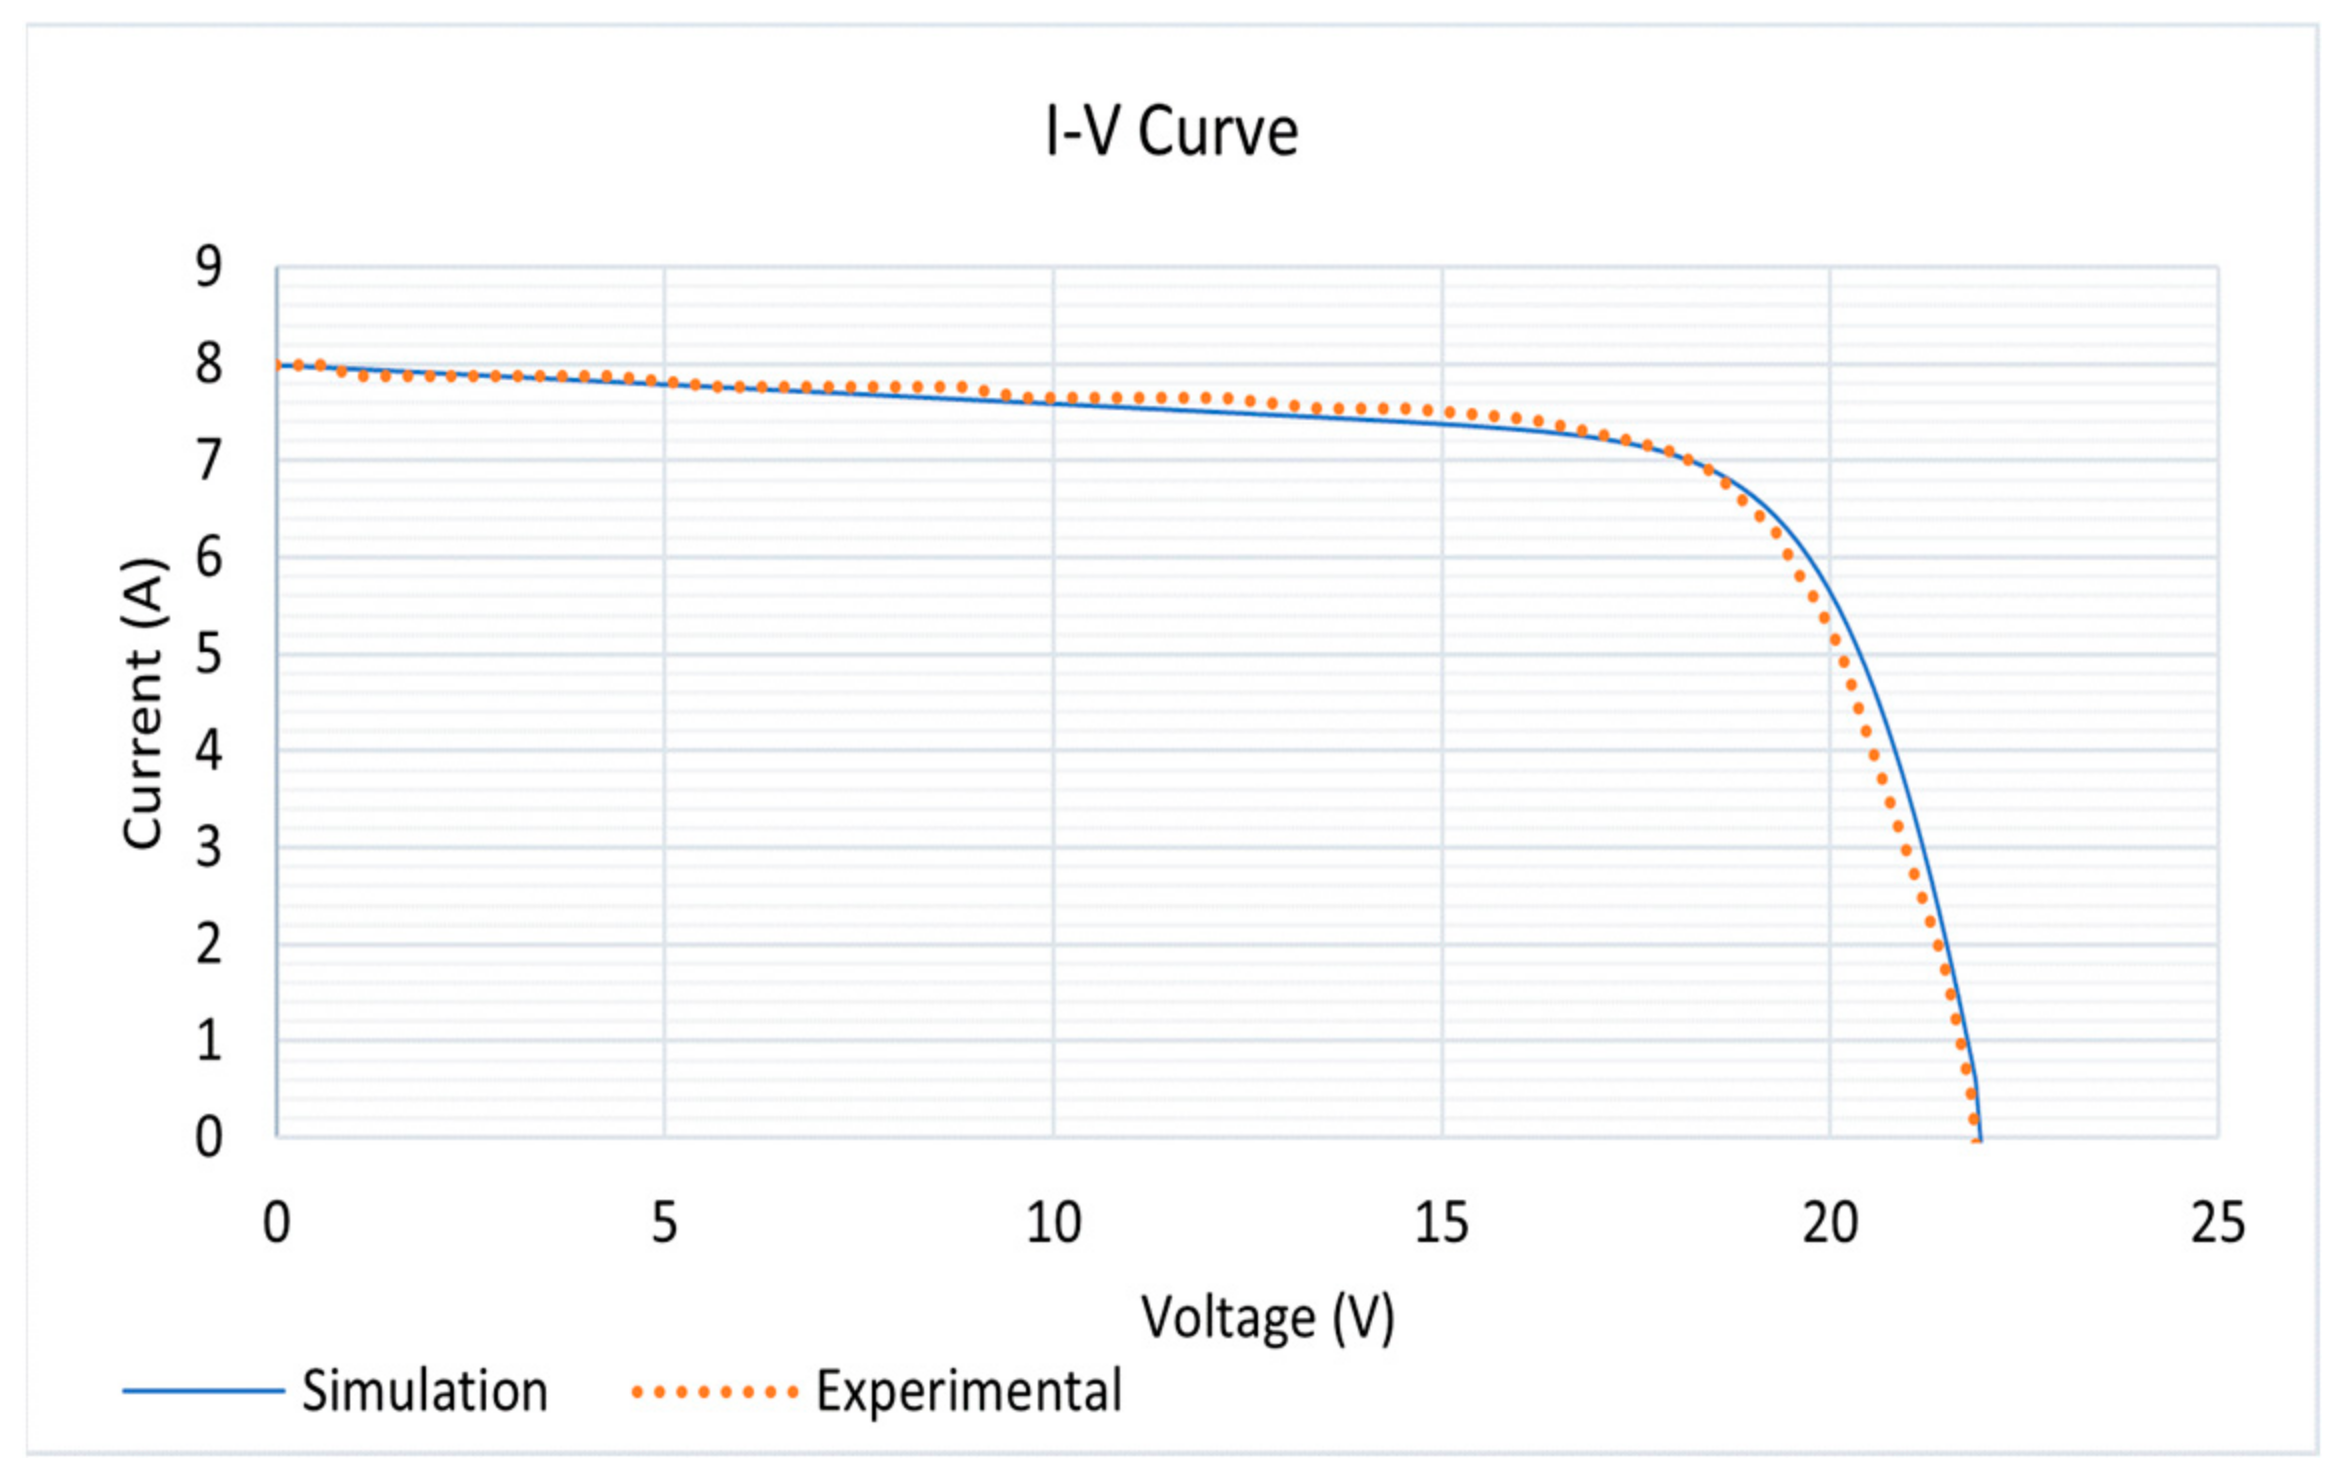
The experimental results demonstrated a very high degree of consistency with the simulated data and the datasheet of the KC130GT photovoltaic module under standard test settings (1000 W/m2 irradiance and a temperature of 25 °C). Figure 8 and Figure 9 demonstrate the consistency between the I-V and P-V curves obtained from the experimental data and those produced by simulation, highlighting the effectiveness of the employed methodology. Furthermore, the P-V curves of the same module are illustrated in Figure 9. The results confirm the precision of the proposed parameters extraction technique.

3. The Effect of Different Parameters and Faults on the Performance of the PV Array

The performance and efficiency of the PV system are affected by different factors, including the general design of the model, the parameters of the system, the characteristics of internal models, and the interrelations between them. Generally, the output power and the efficiency of the PV system may be influenced by these factors. Thus, it is necessary to elaborate on them to enable the system to work efficiently and to guarantee dependable functioning.
This section comprehensibly explains the relation between various parameters that describe the PV model and their impact on the output power as well as the efficiency of the PV system. The analyzed variables include irradiance, temperature, series resistance, shunt resistance, diode ideality factor, photocurrent, and reverse saturation current. It is, therefore, useful to understand the contribution of each of these parameters toward the output power, fill factor, the effect on the I-V curve, and the performance of the PV system.

3.1. The Fill Factor (FF)

Among all the parameters characterizing the efficiency of a photovoltaic cell or module, fill factor (FF) is one of the most widely known indicators. Its importance comes from the ability to calculate the efficiency of the conversion of sunlight to electricity in the PV device. The FF is determined by dividing the PV’s maximum power (Pmax) by the product of its open circuit voltage (VOC) and short circuit current (ISC). The fill factor (FF) can be expressed mathematically as follows [15,69]:
F i l l   F a c t o r   ( F F ) = V m p p I m p p V o c I s c
In other words, apart from the external efficiency, the fill factor is the “filling” of the rectangle created by the I-V curve of the PV device, as shown in Figure 10. Thus, a higher fill factor means a more efficient PV device since a larger portion of the I-V curve area has been utilized to deliver power. A smaller fill factor, on the other hand, indicates that there are greater losses and that the device is not utilizing its full power-generating capacity. Internal resistances, diode non-idealities, material qualities, manufacturing quality, and surrounding conditions such as temperature and irradiance can all have an impact on a PV device’s fill factor. As a result, controlling the fill factor is critical for improving PV system efficiency and performance [69].

3.2. The Effect of the Irradiance Level (G)

Solar irradiance level, which is the power per unit area, is one of the most significant environmental conditions that affect the output power of the PV array, which is directly proportional to the amount of sunlight it receives. More photons strike the semiconductor material in solar cells as the irradiance level rises, resulting in more production of electron–hole pairs. As a result, the output power of the PV array is increased. Similarly, a reduction in irradiance results in a decrease in power production since there are fewer photons available.
As shown in Figure 11 and Table 4, the variation in illumination has a considerable effect on the short circuit current Isc. Any variation in irradiation induces a directly proportional variation in short circuit current. There is also a linear growth in Isc, with the range of irradiation being between 200 and 1000 W/m2. Indeed, the extent of change in the current Isc with irradiation is confined by the values 1.604 A for 200 W/m2 irradiance and 8.02 A for 1000 W/m2 irradiance, demonstrating that the short circuit current is almost equivalent to the photocurrent. The relationship between Isc and irradiance can be expressed as follows [24]:
I s c = K E G
where KE is a function of irradiance and the variation in short circuit current. In this study, KE = 0.008 (A.m2/W).
Regarding the open circuit voltage, it grows with increasing irradiation, although it is less susceptible to light intensity than the short circuit current, as seen in the logarithmic scale in Figure 12, as well as in Figure 2 and Figure 3. The open circuit voltage Voc varies from 20.205 V for a 200 W/m2 to 21.9 V for a 1000 W/m2 irradiation. It can also be noticed that the voltage at the maximum power point slightly increases with the reduction in irradiance level, as shown in Figure 11.
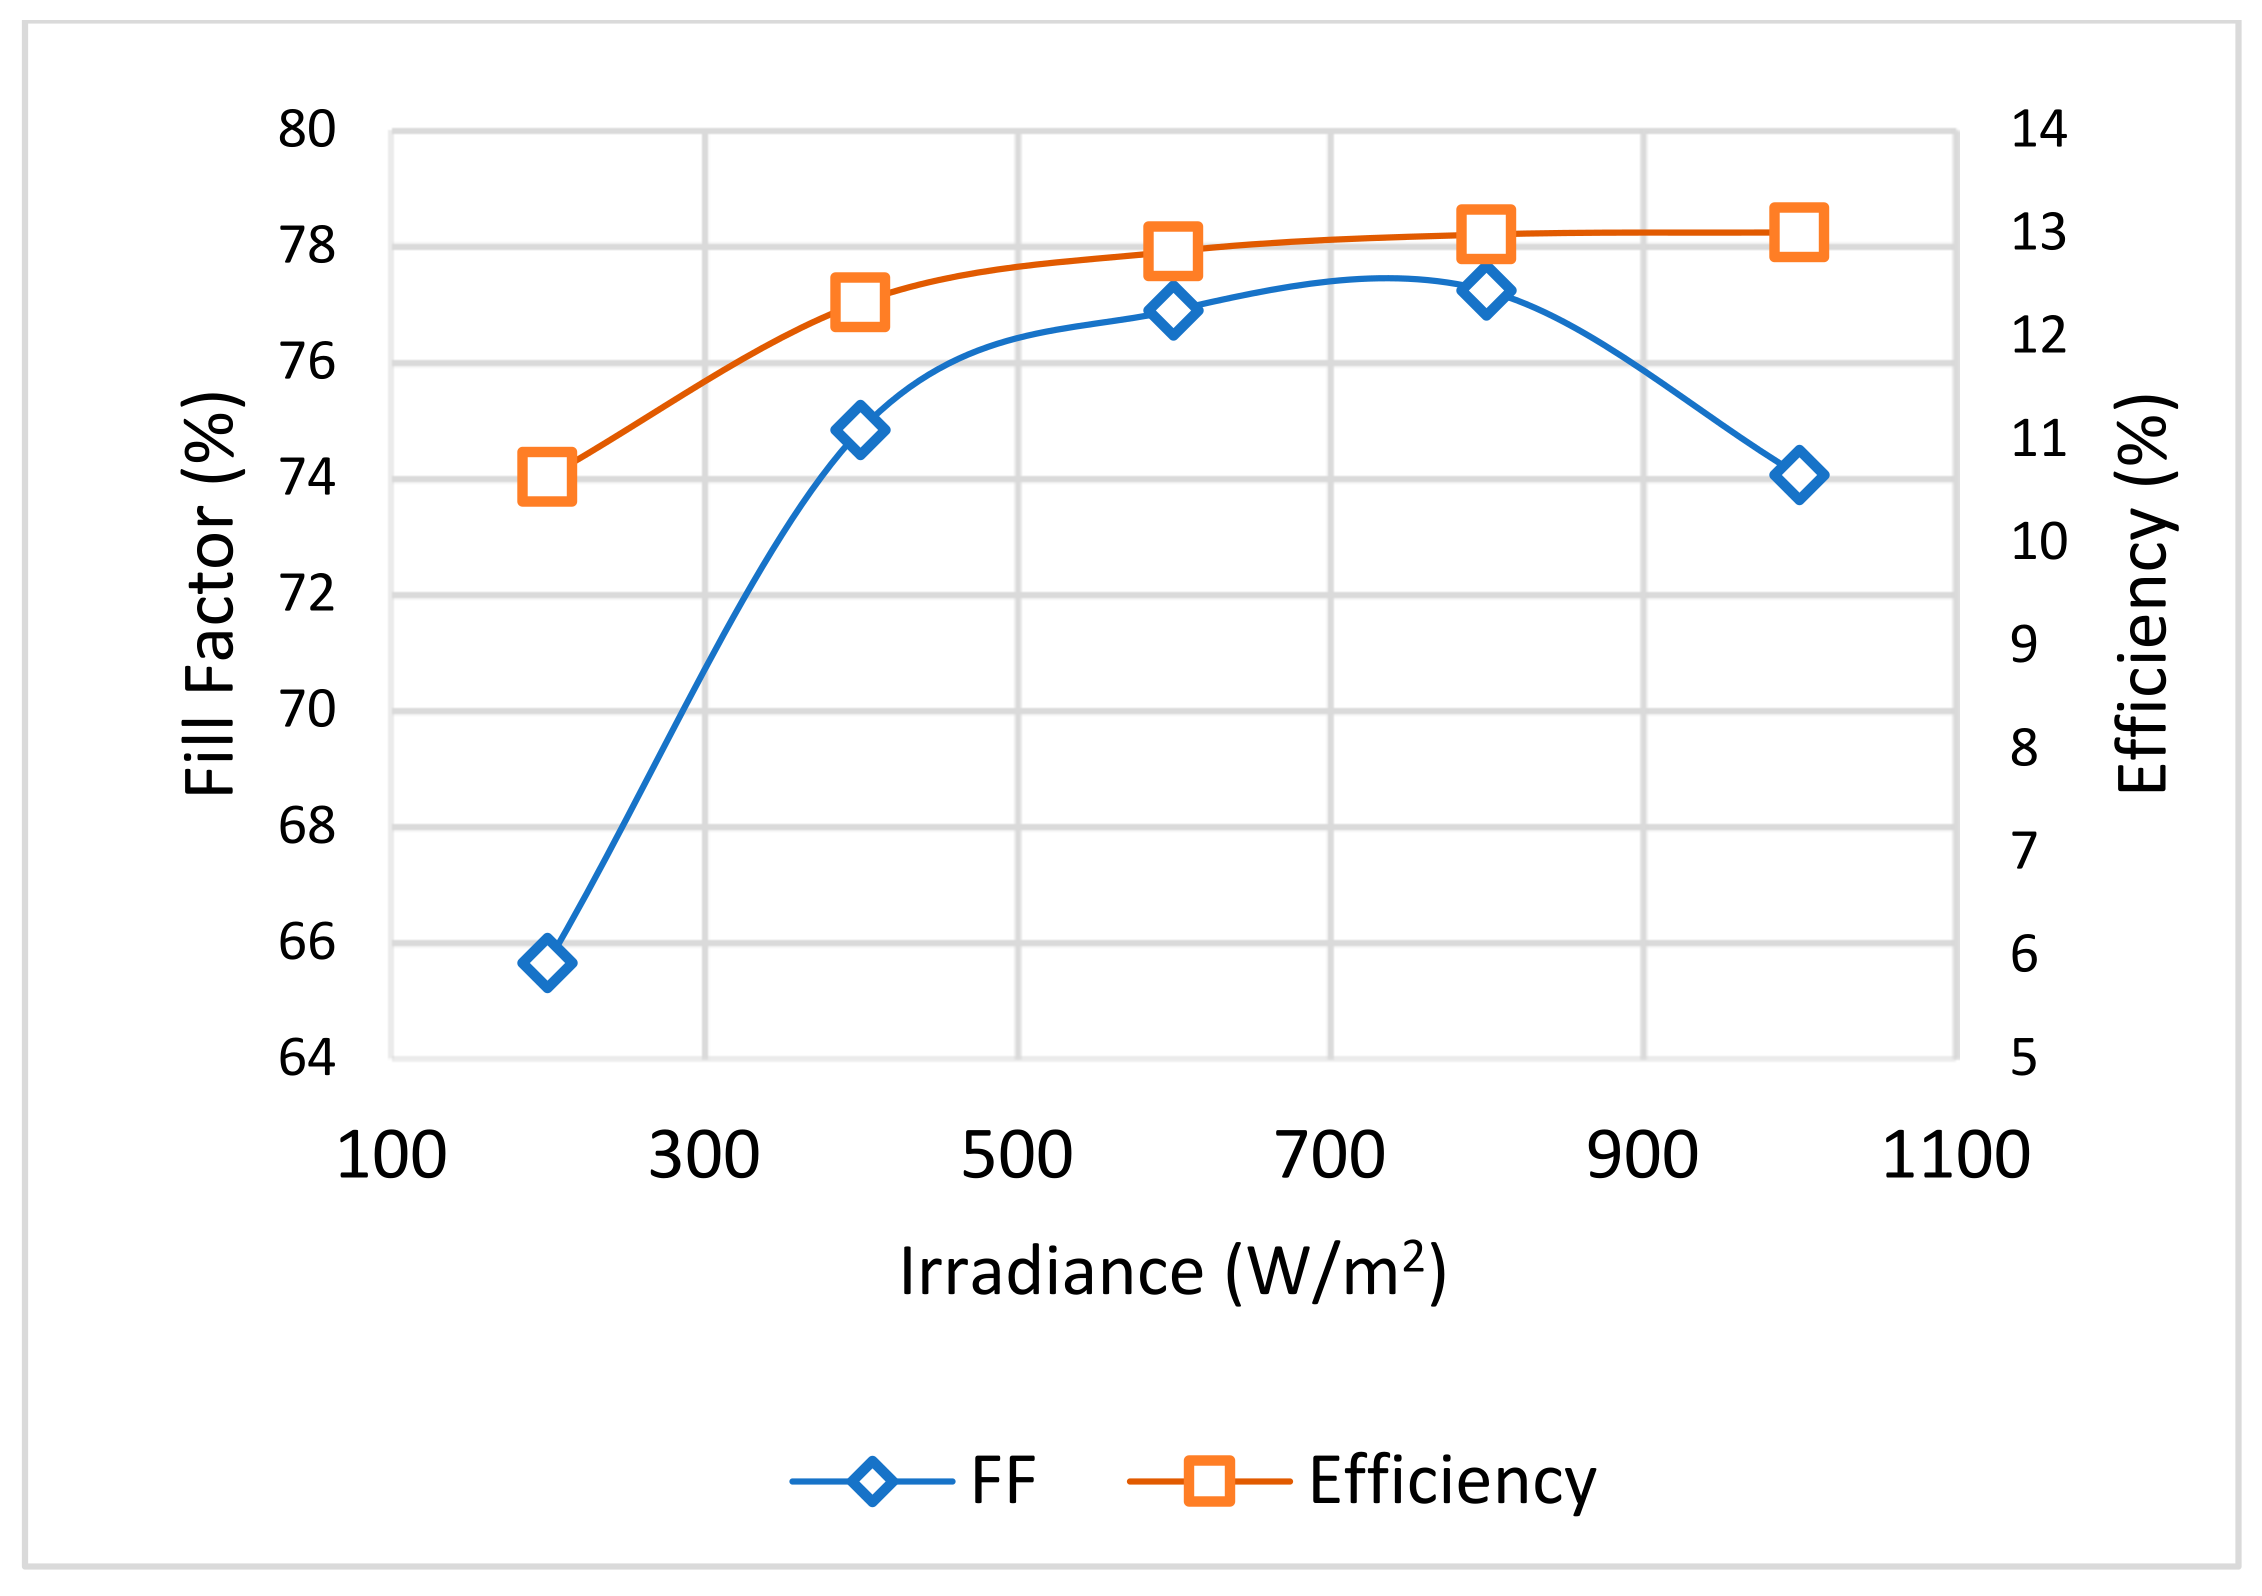
The fill factor, on the other hand, is affected by the irradiance level, as shown in Figure 13, and its value increases with low irradiance levels (G < 600 W/m2). However, once the irradiance rises over this threshold (G > 600 W/m2), the fill factor begins to decrease. This behavior is caused by the influence of series resistance, which inhibits the module’s capacity to sustain high efficiency at higher irradiance levels [16]. In addition, Figure 13 shows the impact of the irradiance level on the PV module efficiency, where the efficiency of a PV module varies depending on the irradiation level from 10.63% to 13%, as the irradiance varies from 200 to 1000 W/m2. This range of efficiency emphasizes the need to carefully select PV modules and develop solar energy systems to optimize performance under specific irradiance conditions.
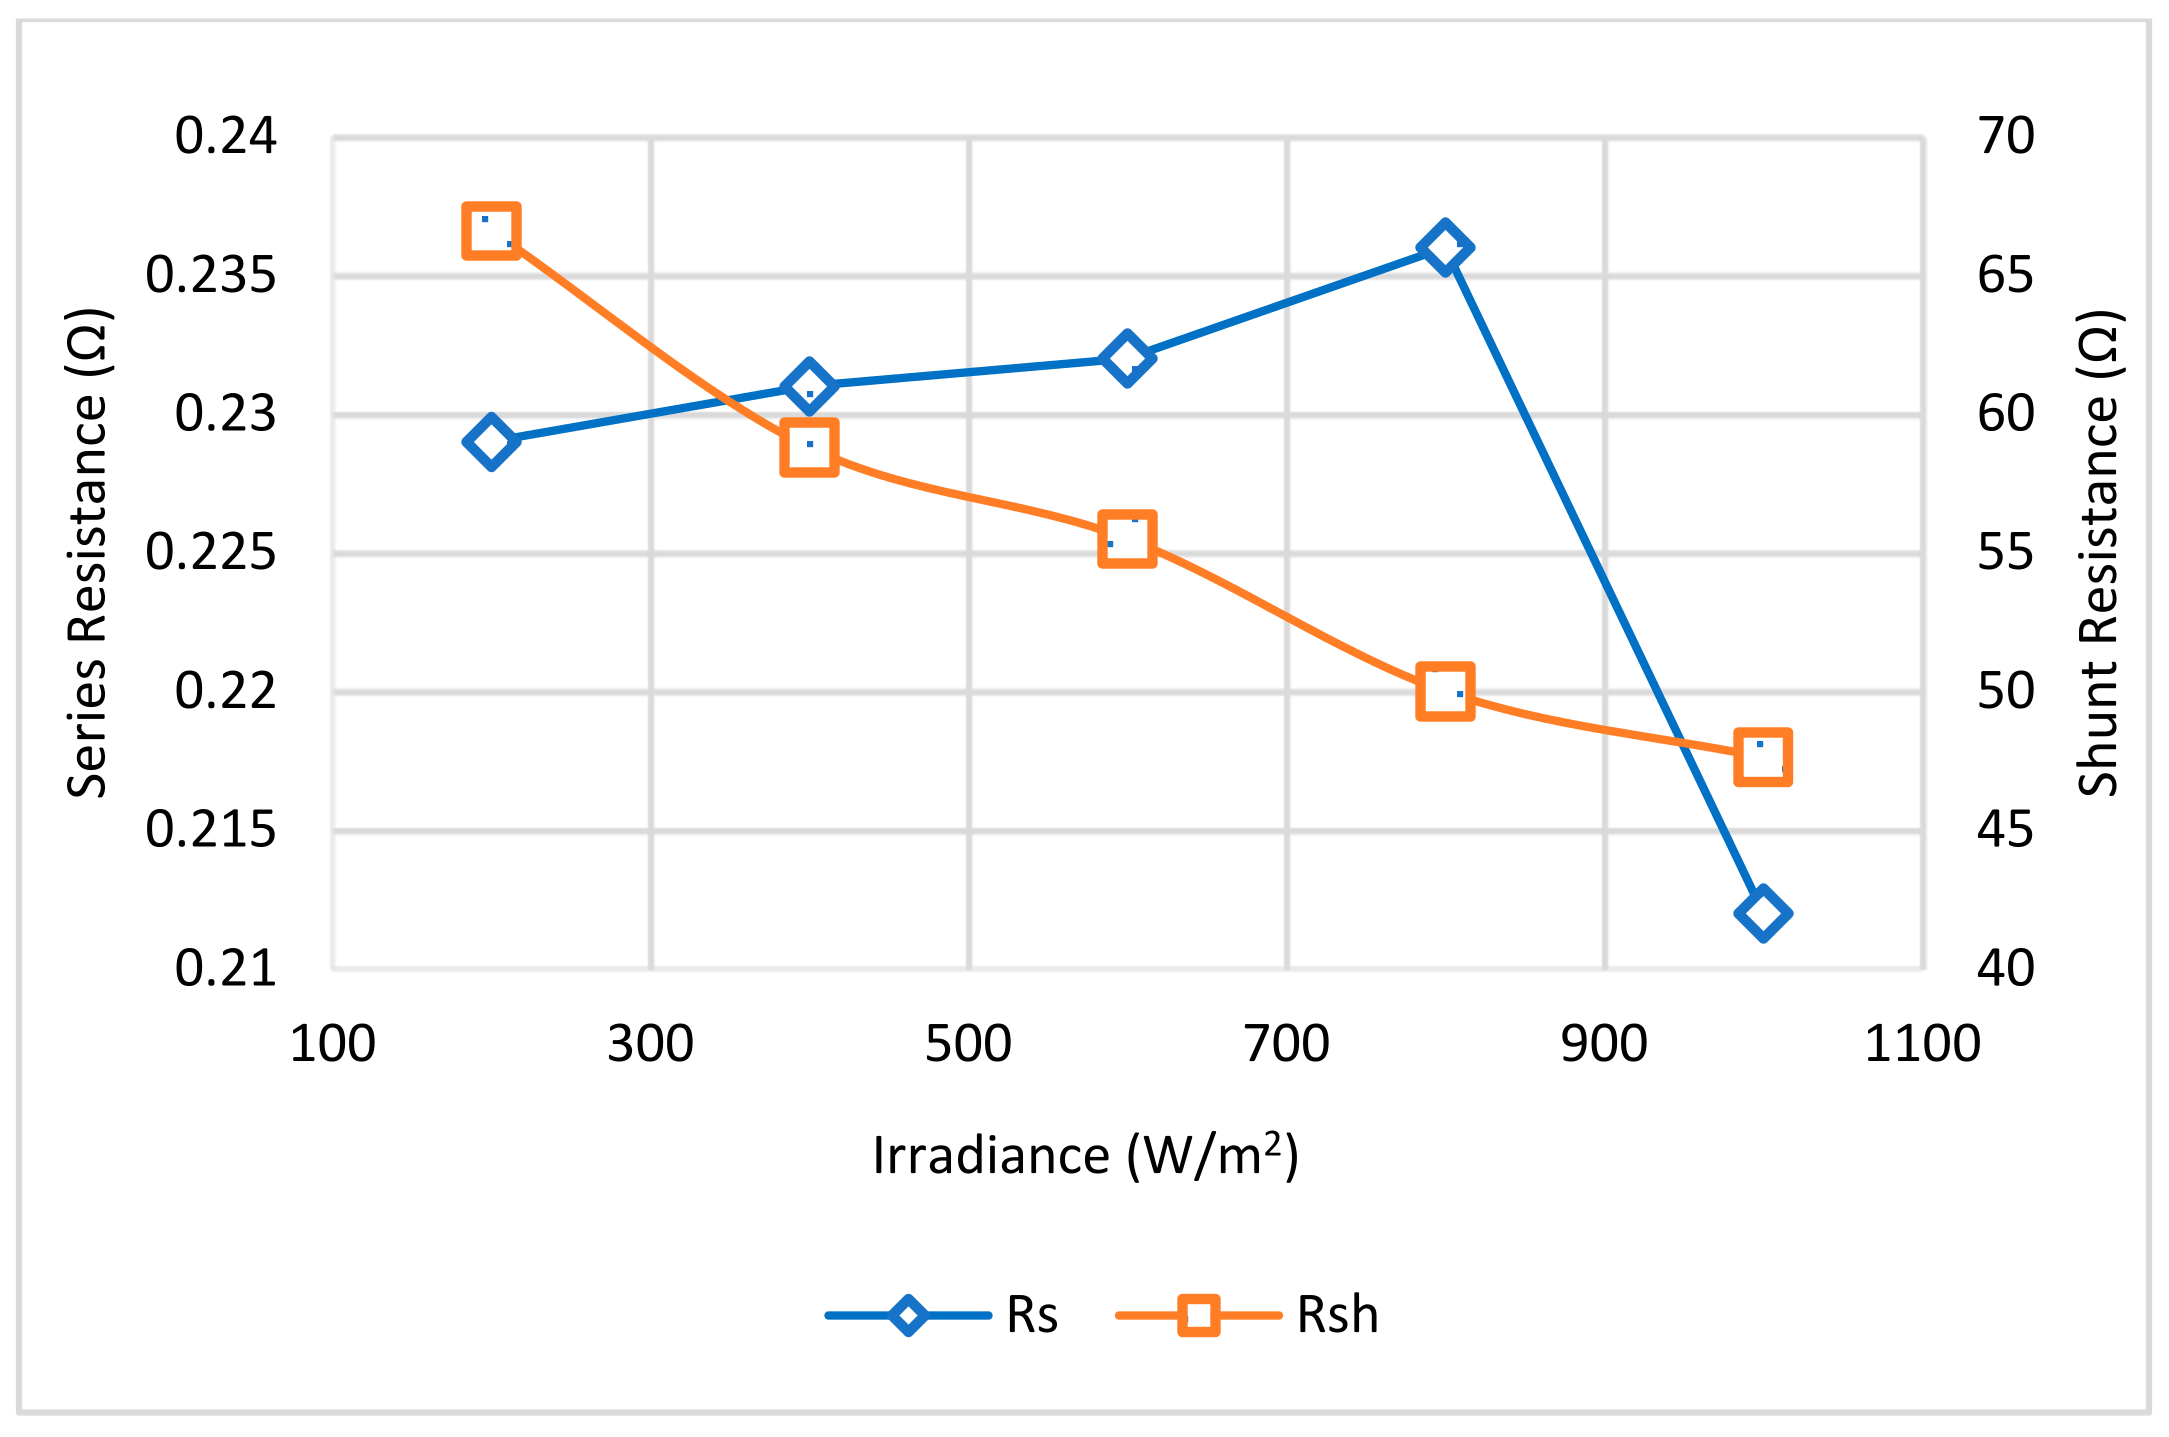
The diode parameters of the PV modules are also affected by the change in the irradiation level. Because of the increase in the recombination current, the ideality factor of the diode increases linearly with the increase in the irradiation level, while the reverse saturation current is increased exponentially with increasing the irradiance, as shown in Figure 14. The latter is connected to an increase in the number of defect states in the band gap. The energy released during electron–hole pair recombination causes these flaws to occur. As a result, while electrons and holes recombine, the atomic bonds are destroyed by the low energy produced. These broken linkages represent fault states, resulting in additional recombination sites. Increased recombination locations lead to increased recombination of electron–hole pairs. On the other hand, while the shunt resistance is linearly decreasing with the increase in the irradiation level, the series resistance was barely impacted, indicating that it is light-independent, as shown in Figure 15. The results are consistent with the literature [16,24].

3.3. The Effect of Temperature (K)

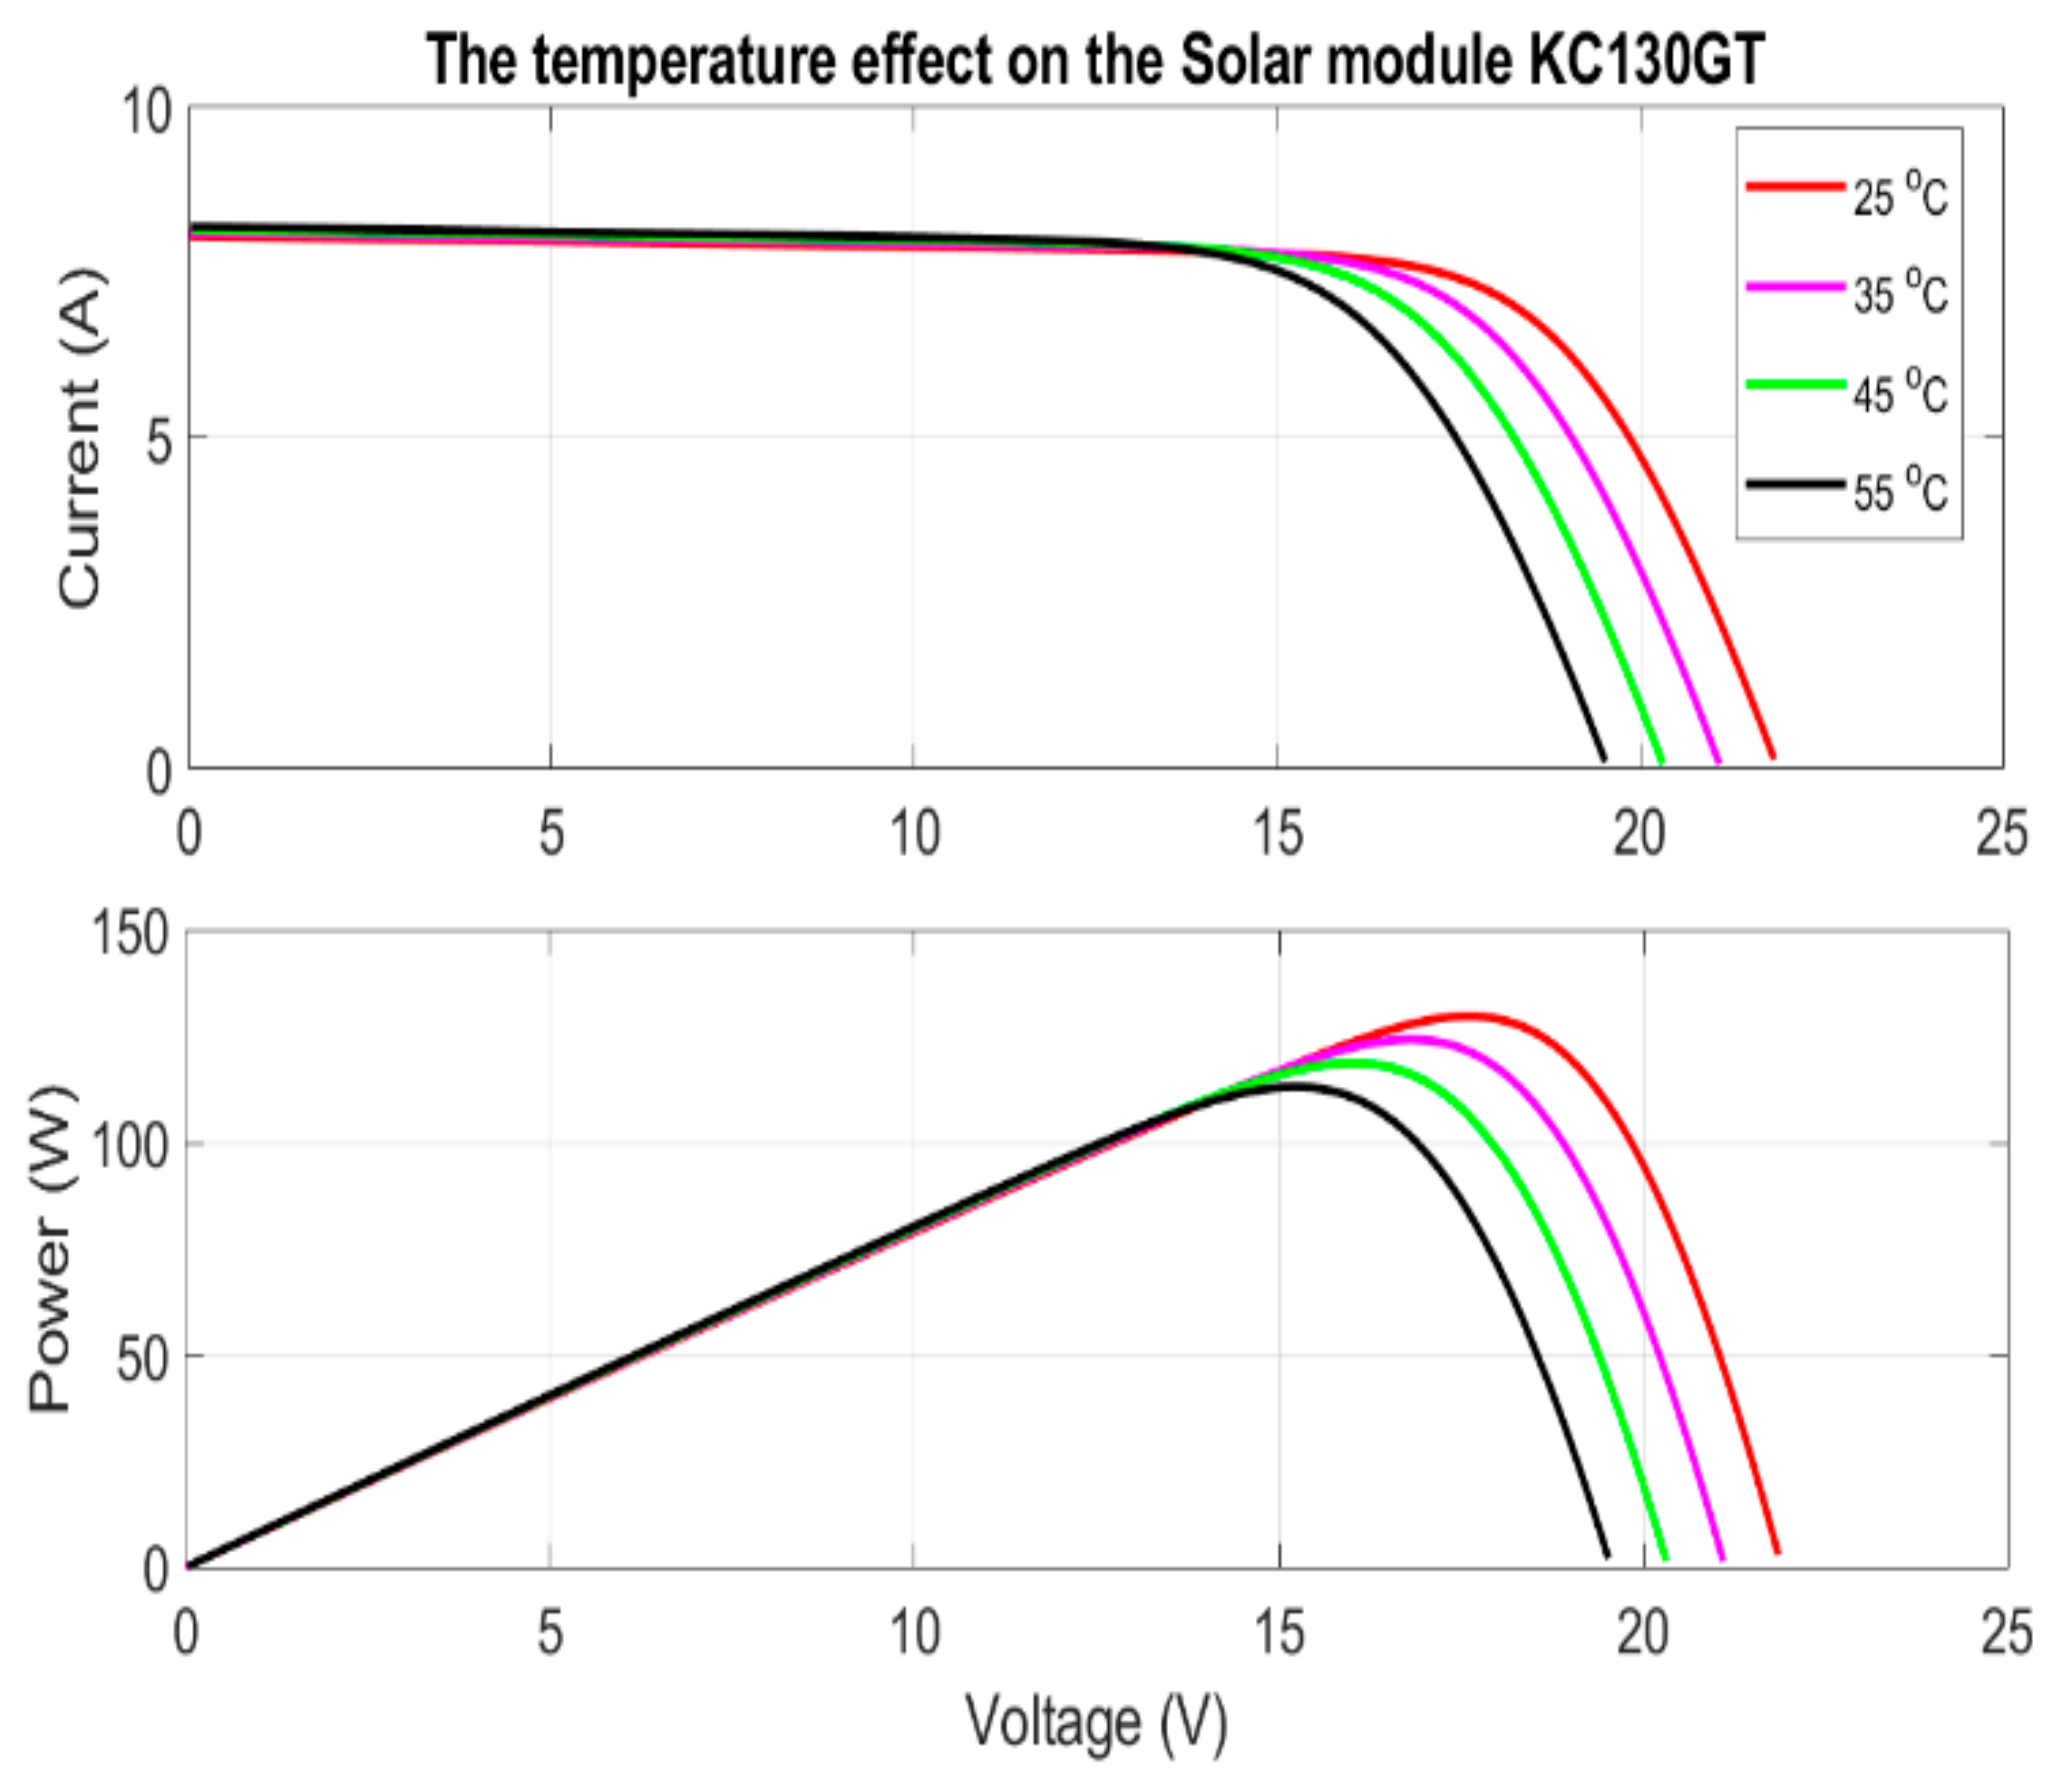
The temperature mainly affects the diode characteristics; specifically, the diode reverse saturation current increases with the increase in the diode temperature [23,70]. In addition, the temperature also affects the I-V curve of the PV module, where the open circuit voltage is reduced by 0.082 V/°C as per the module (KC130GT) datasheet, listed in Table 2, while the maximum power is also reduced by 0.45%/°C with the increase in temperature. Therefore, the higher the temperature, the less energy is captured from the sun. The I-V characteristics of the KC130GT module at various temperatures are shown in Figure 16. The curves demonstrate that the influence of temperature on the short circuit current is negligible, whereas its effect on the open circuit voltage is substantial.
The I-V curve of the PV module under different temperatures shows that there is a nearly linear relationship between the temperature and the open circuit voltage; this relationship was described by [63] as follows:
V o c , n e w = V o c , S T C + K v (   T n e w T S T C )
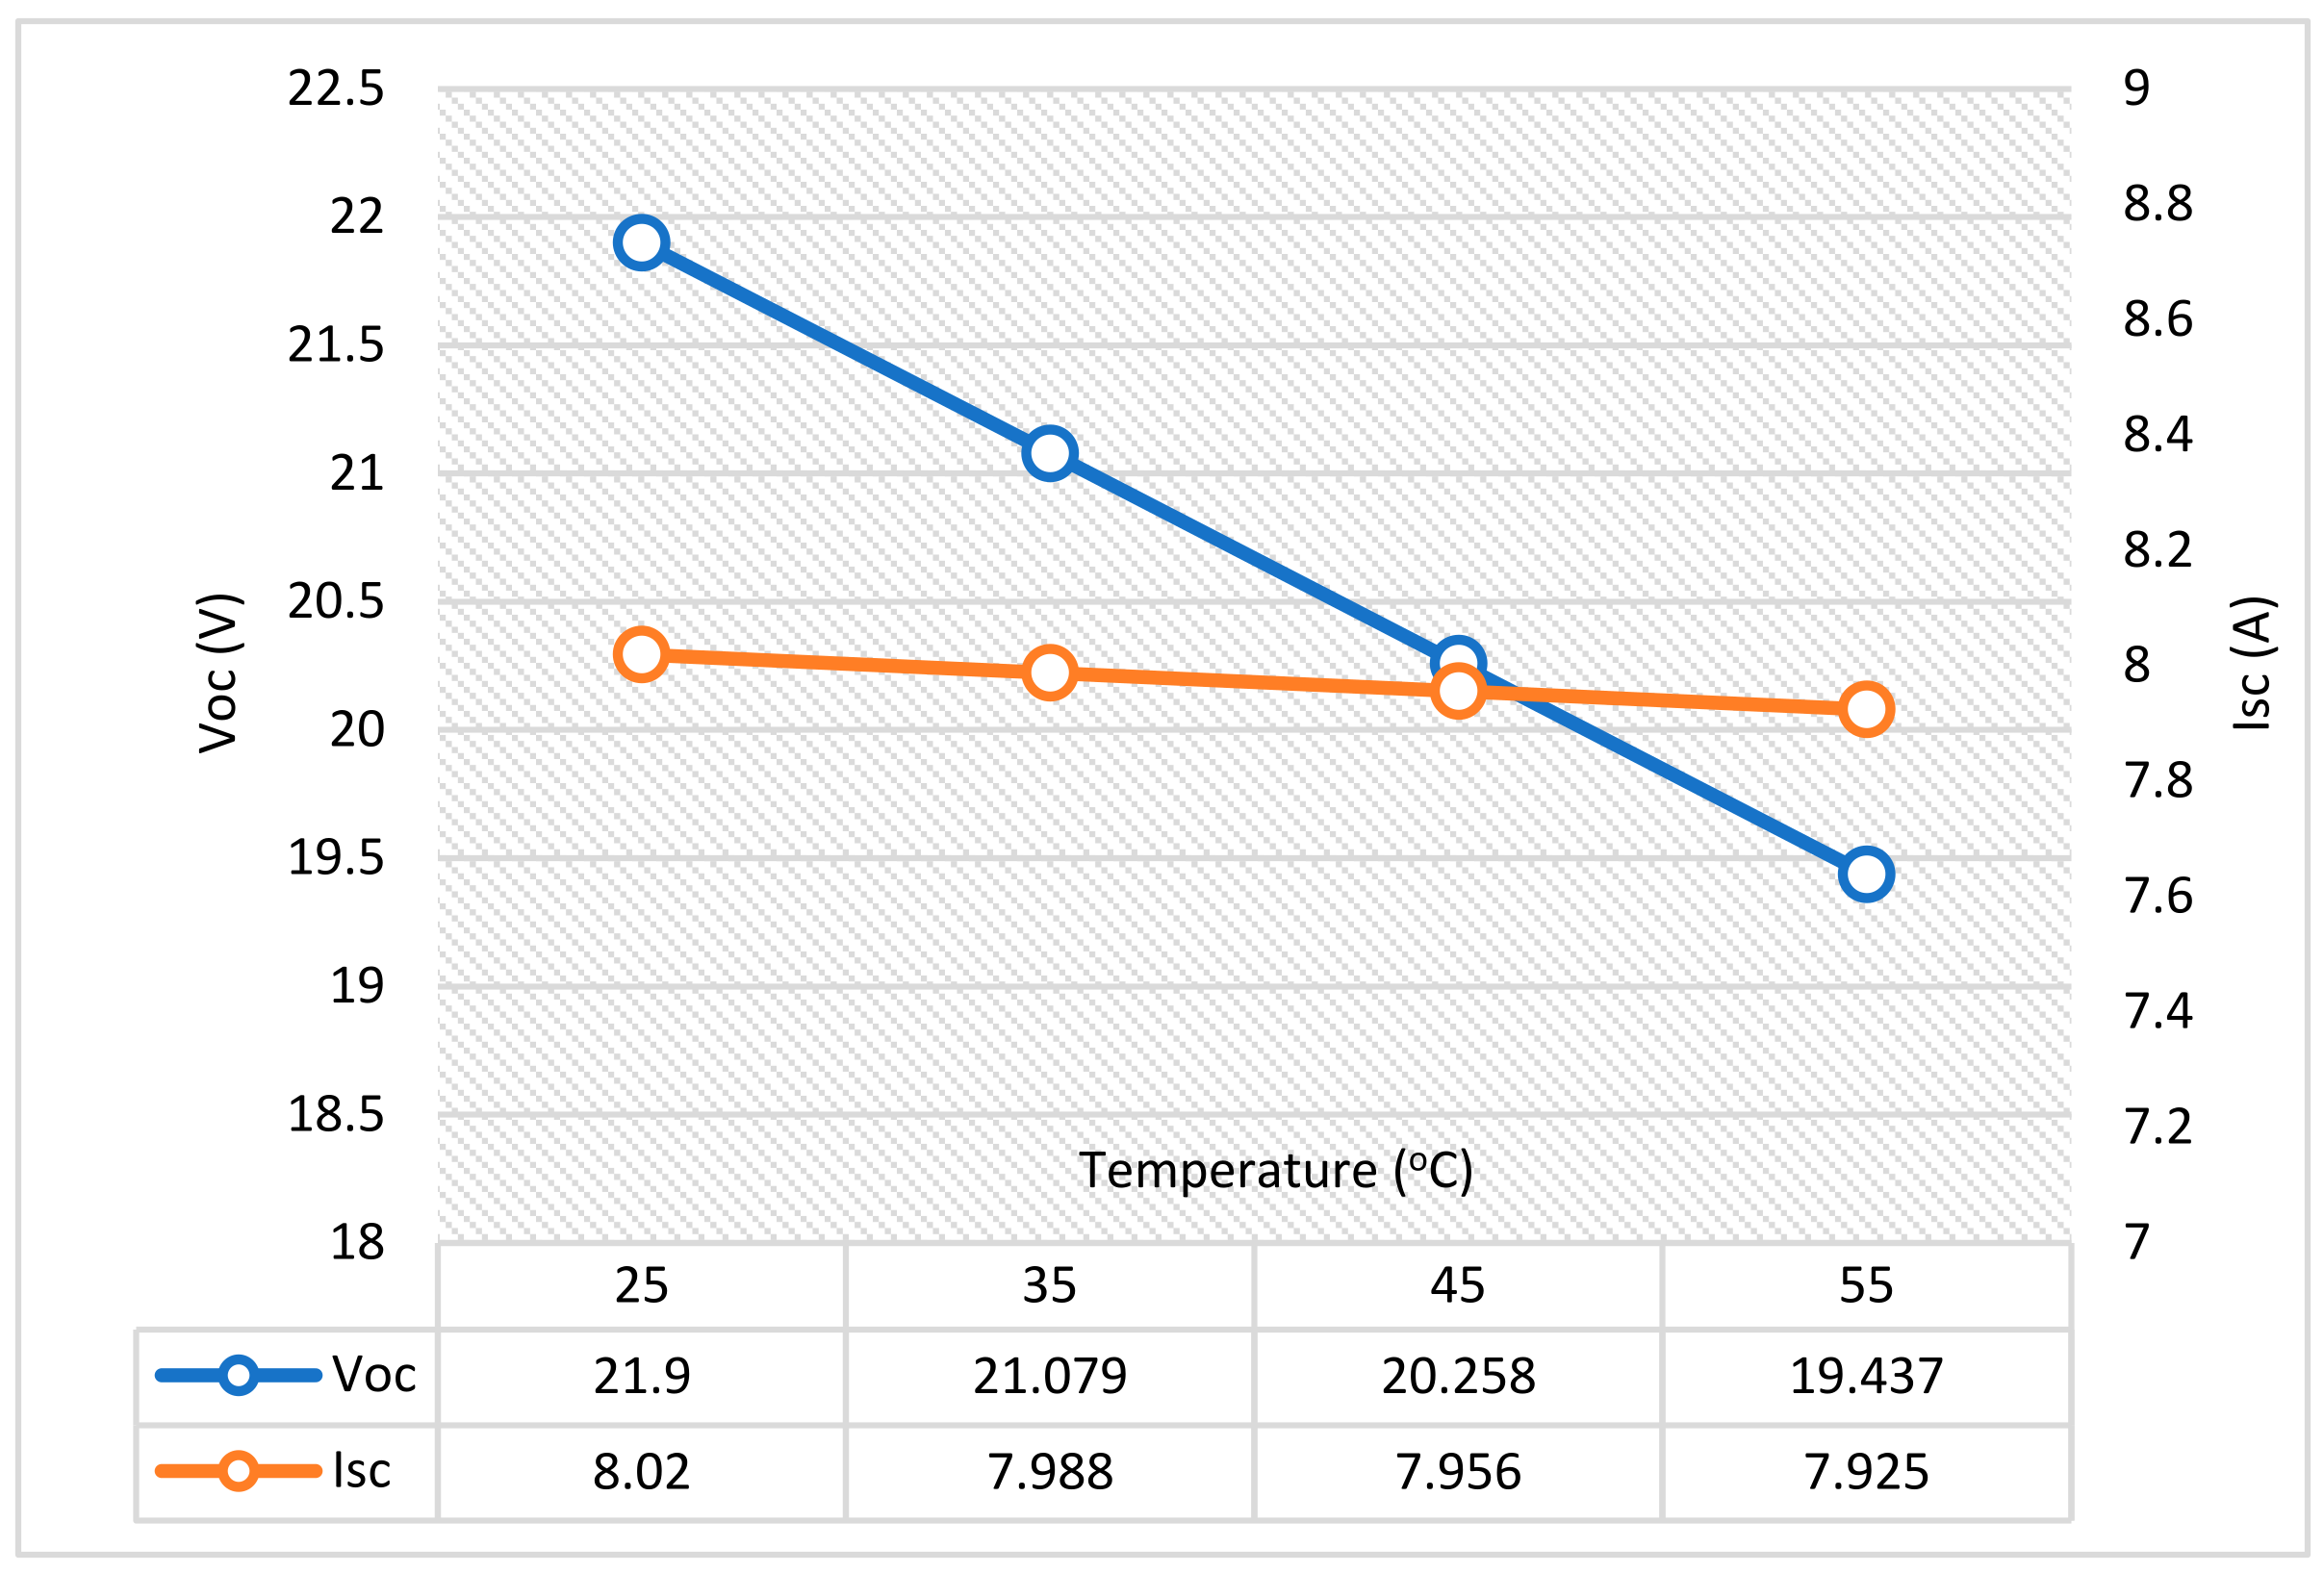
where Kv is the temperature coefficient at the reference open circuit voltage, or the sensitivity of the open circuit voltage to the variation in the cell’s temperature, which can be represented by the slope of the voltage curve in Figure 17 and usually provided by the manufacturer. Voc,new and Tnew are the open circuit voltage and the cell temperature, respectively. Voc,STC and TSTC are the open circuit voltage and the cell temperature at standard test conditions, respectively.
In addition, the effect of the variation in the temperature on the short circuit current can also be studied in the same way as in (24), where Ki represents the temperature coefficient at the reference short circuit current, which can be represented by the slope of the current curve shown in Figure 17 and clearly shows the minor effect of the temperature on the short circuit current of the PV module.
I s c , n e w = I s c , S T C + K i (   T n e w T S T C )
On the other hand, the effect of temperature variation on the fill factor (FF) can be studied based on the following equation [63]:
F F = P m a x , S T C ( 1 + K p   T n e w T S T C ) I s c , S T C + K i (   T n e w T S T C ) V o c , S T C + K v (   T n e w T S T C )
where Kp represents the temperature coefficient at the reference maximum power (Pmax) and is given as a percentage. It can be noticed from Figure 18 that the FF of the PV modules drops as the temperature increases in an almost linear relationship because of the change in the open circuit voltage.
Moreover, the efficiency of the solar module is also affected by the change in temperature, even with the stability in the illumination intensity, as the illumination intensity and the module area are independent of the PV module temperature. The efficiency of the PV module changes because of the change in the FF and the open circuit voltage as the main parameters affected by the temperature variation, while the short circuit current is almost stable, as shown previously. Assuming that the short circuit current is the same as the photocurrent of the diode, then the efficiency of the PV module under the variation in the temperature can be calculated using the following formula:
η = I s c V o c F F G A
where A is the cell or module area, and G is the cell or module irradiance per unit area. As can be noticed in Figure 18, the PV cell’s efficiency tends to drop as its temperature increases. This decrease in efficiency is primarily linked to how diodes adapt to temperature changes.
As the temperature increases, the electrons in the semiconductor material acquire more energy and become more active, resulting in a greater rate of recombination [15]; therefore, the variation in temperature also affects the diode reverse saturation current and the PV cell’s photocurrent, as it is shown later.

3.4. The Effect of Series Resistance (Rs)

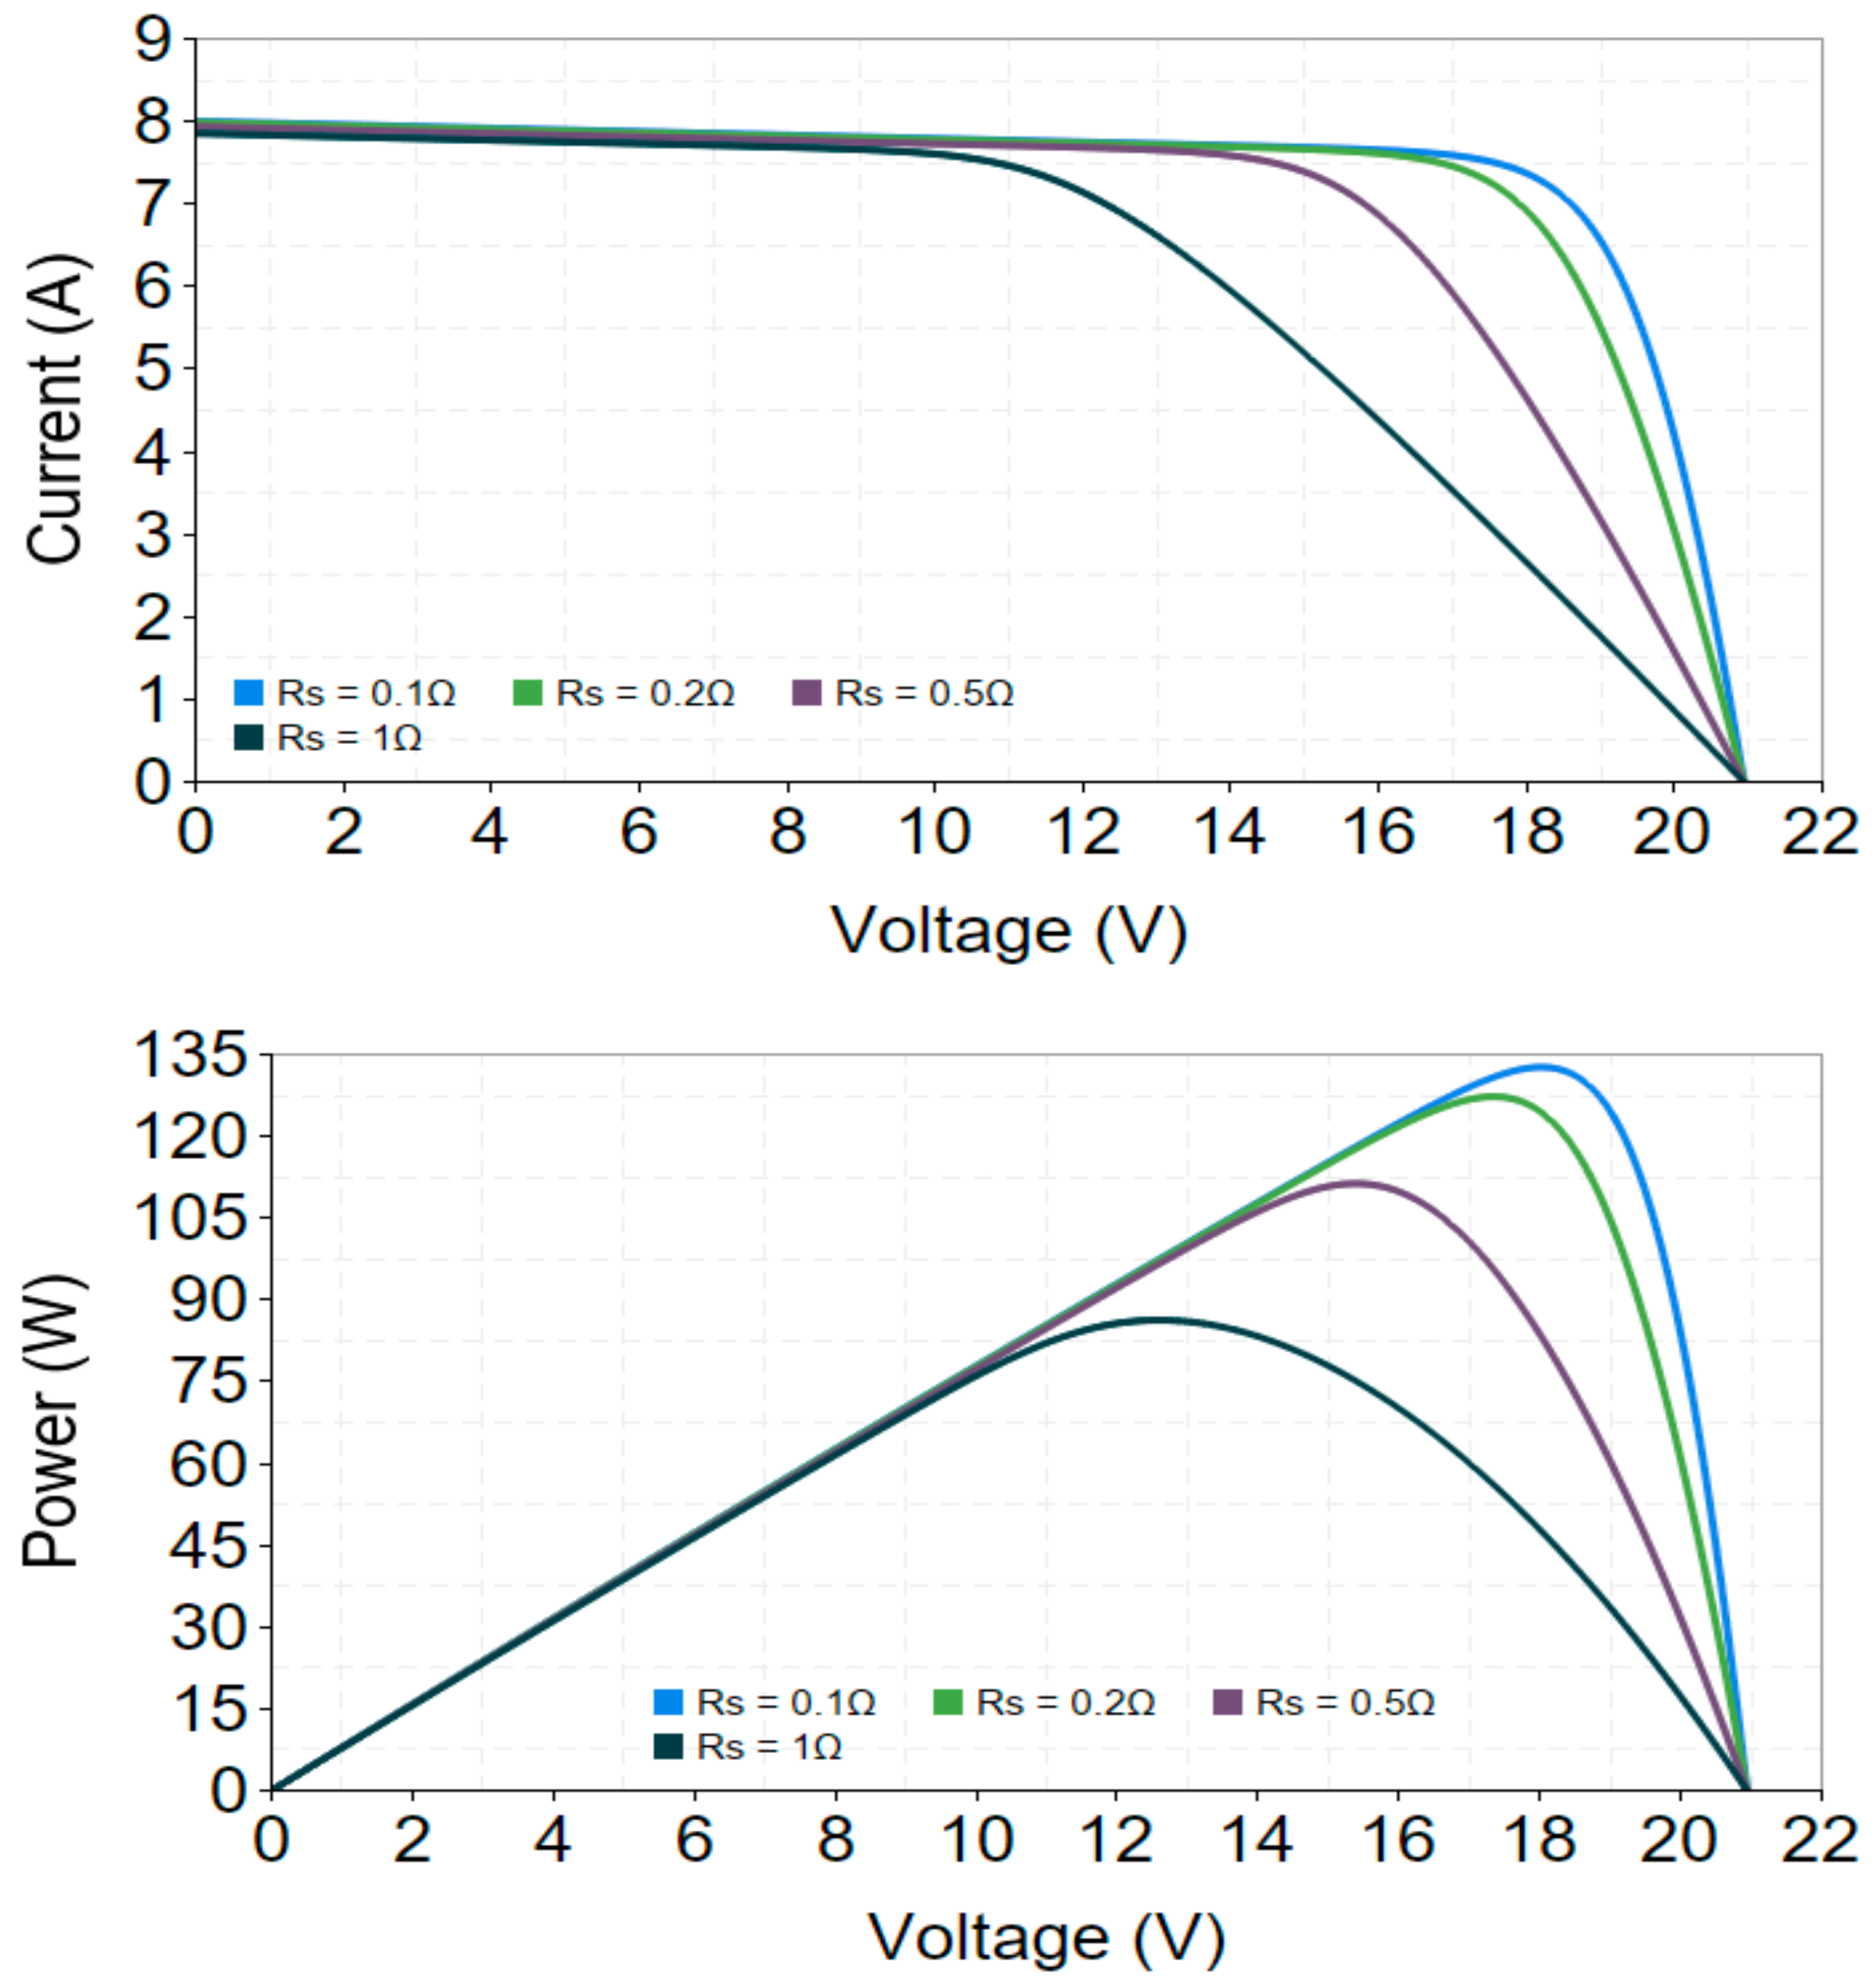
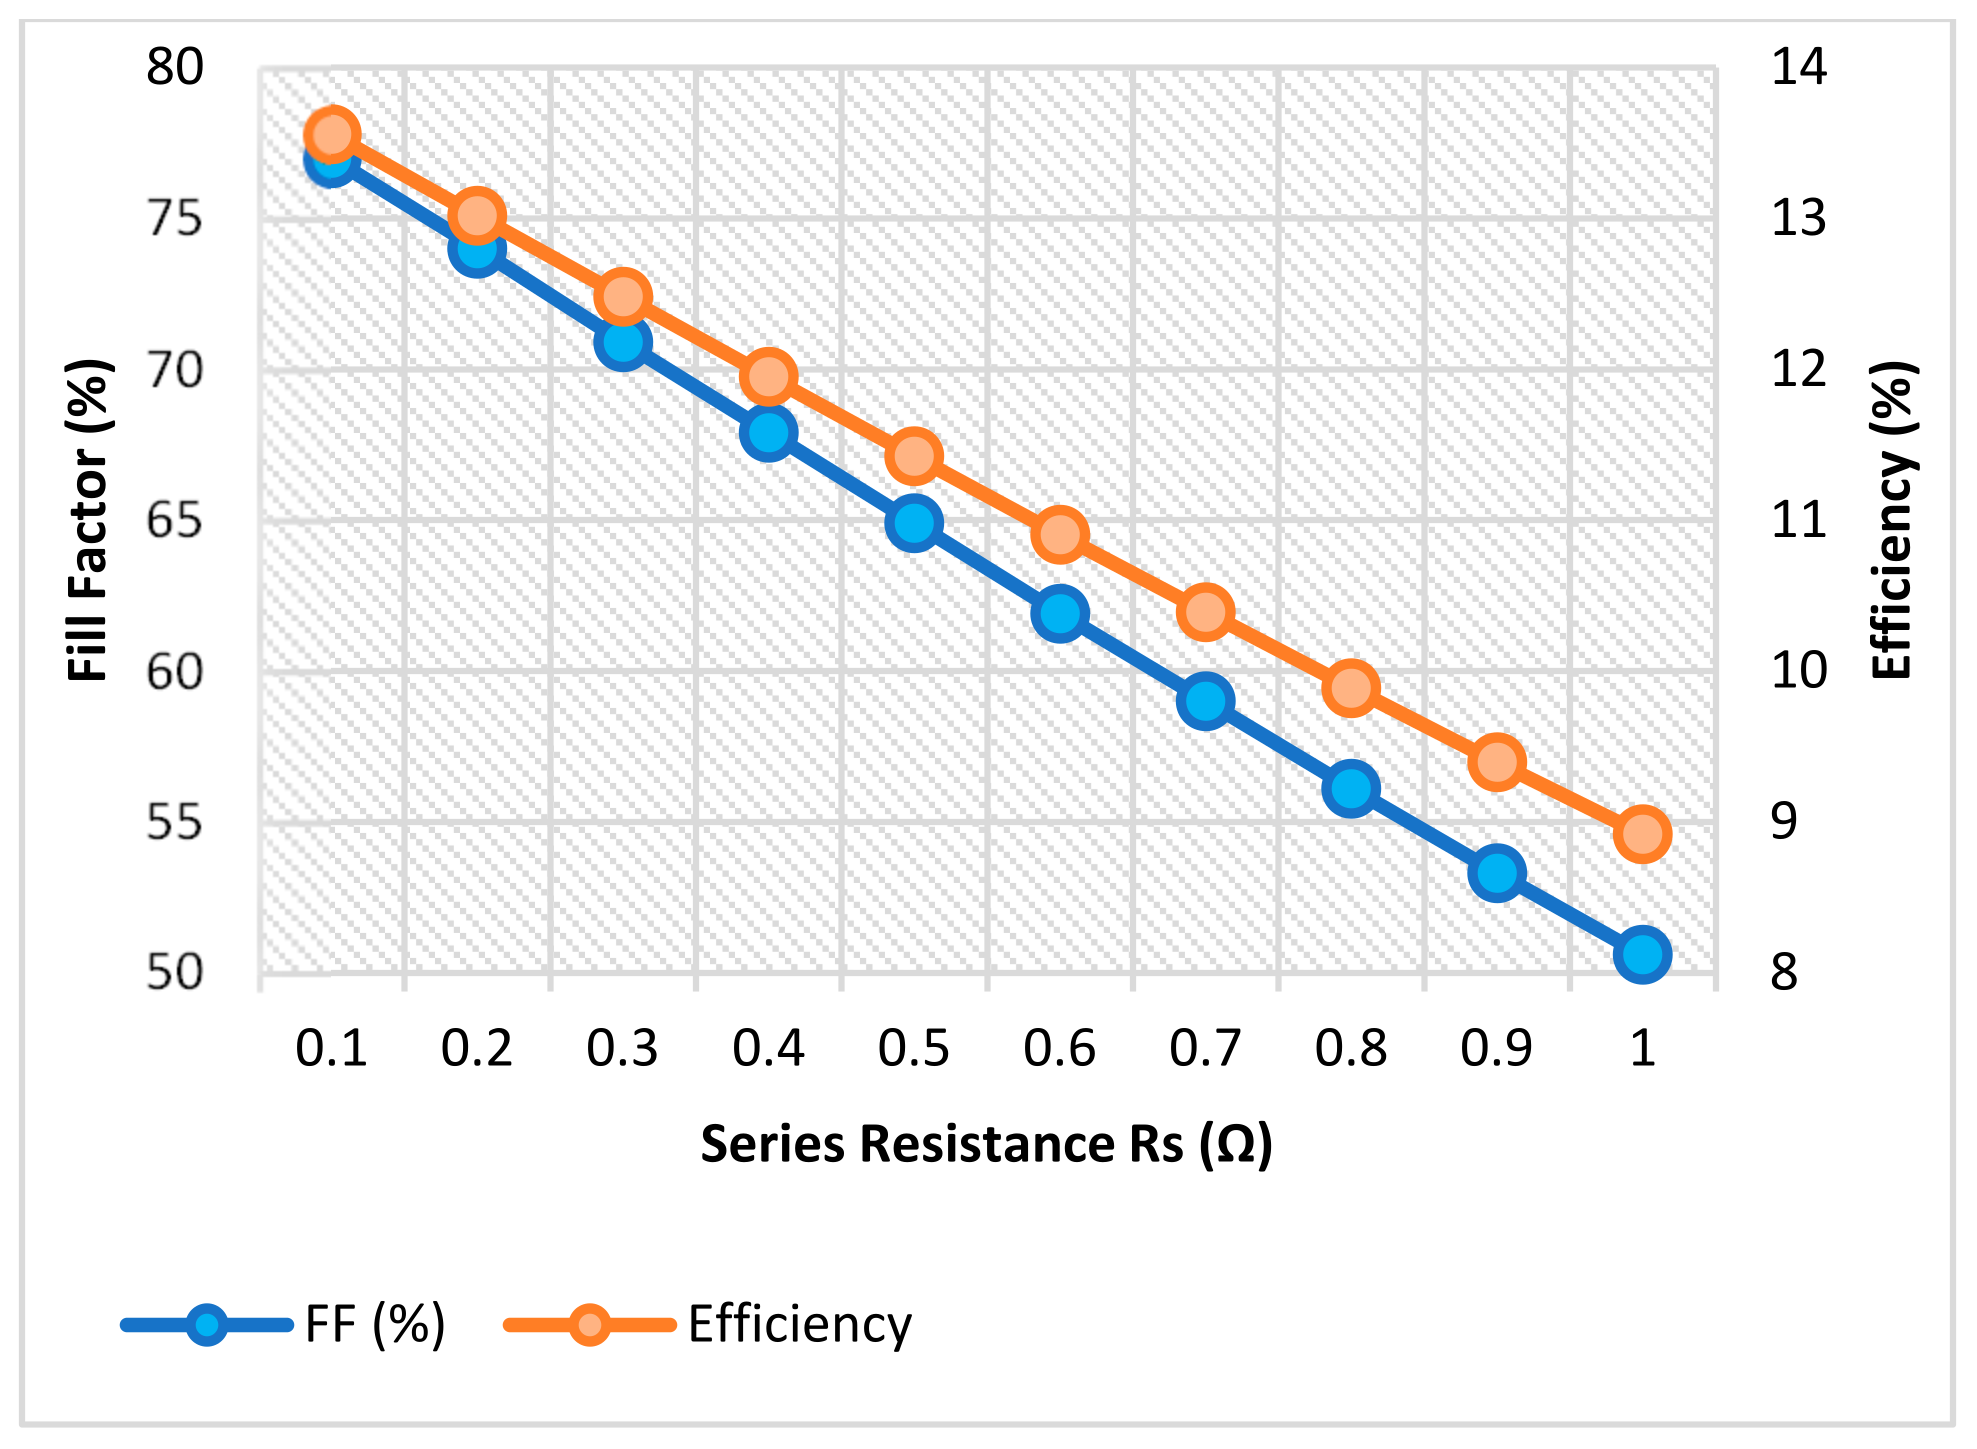
In a photovoltaic module, series resistance (Rs) refers to the inherent electrical resistance that exists within the semiconductor material and interconnections [71]. It is a parasitic resistance that decreases the PV module’s efficiency by impeding the passage of current through the cells. The PV model shown in Figure 1 and the PV current equation reveal that the series resistance influences the voltage drop across the PV module. When Rs increases, the voltage loss increases, causing the module voltage (Vmp) to decrease. In contrast, decreasing Rs decreases voltage drop on the series resistor and increases Vmp. Additionally, the series resistance influences the module current (Imp). As Rs increases, the module’s current consumption decreases. Alternatively, a decrease in Rs results in an increase in module current. Therefore, the output power of the PV module, which is the product of voltage and current (Pmp = Vmp × Imp), is directly affected by any change in series resistance, where the increase in Rs is decreasing module output power and vice versa. The effect of the series resistance on the PV voltage, current, and power is shown in Figure 19, where four different series resistance values were tested on the PV module (KC130GT).
On the other hand, the variation in series resistance has almost no effect on the open circuit voltage and short circuit current, but the fill factor of the module is still influenced by the shift in the MPP. Higher values of Rs tend to decrease the fill factor because of the greater voltage drop, which diminishes the power output, which, in turn, decreases the PV module efficiency, as shown in Figure 20.

3.5. The Effect of the Shunt Resistance (Rsh)

The shunt resistance in the PV cell represents the parallel path with the PV cell. It is a significant element impacting a solar cell’s or PV module’s efficiency, playing a fundamental role in sustaining consistent voltage levels across the cells and controlling reverse currents during non-power generating states (like under low-light or partially shaded scenarios) [20,21]. A higher shunt resistance is preferred in PV modules as it aids in preventing undesired parallel current routes that can lead to significant power losses. It guarantees that most of the generated current is transferred to the specified load rather than through unwanted pathways, such as the reverse-biased diodes [71].
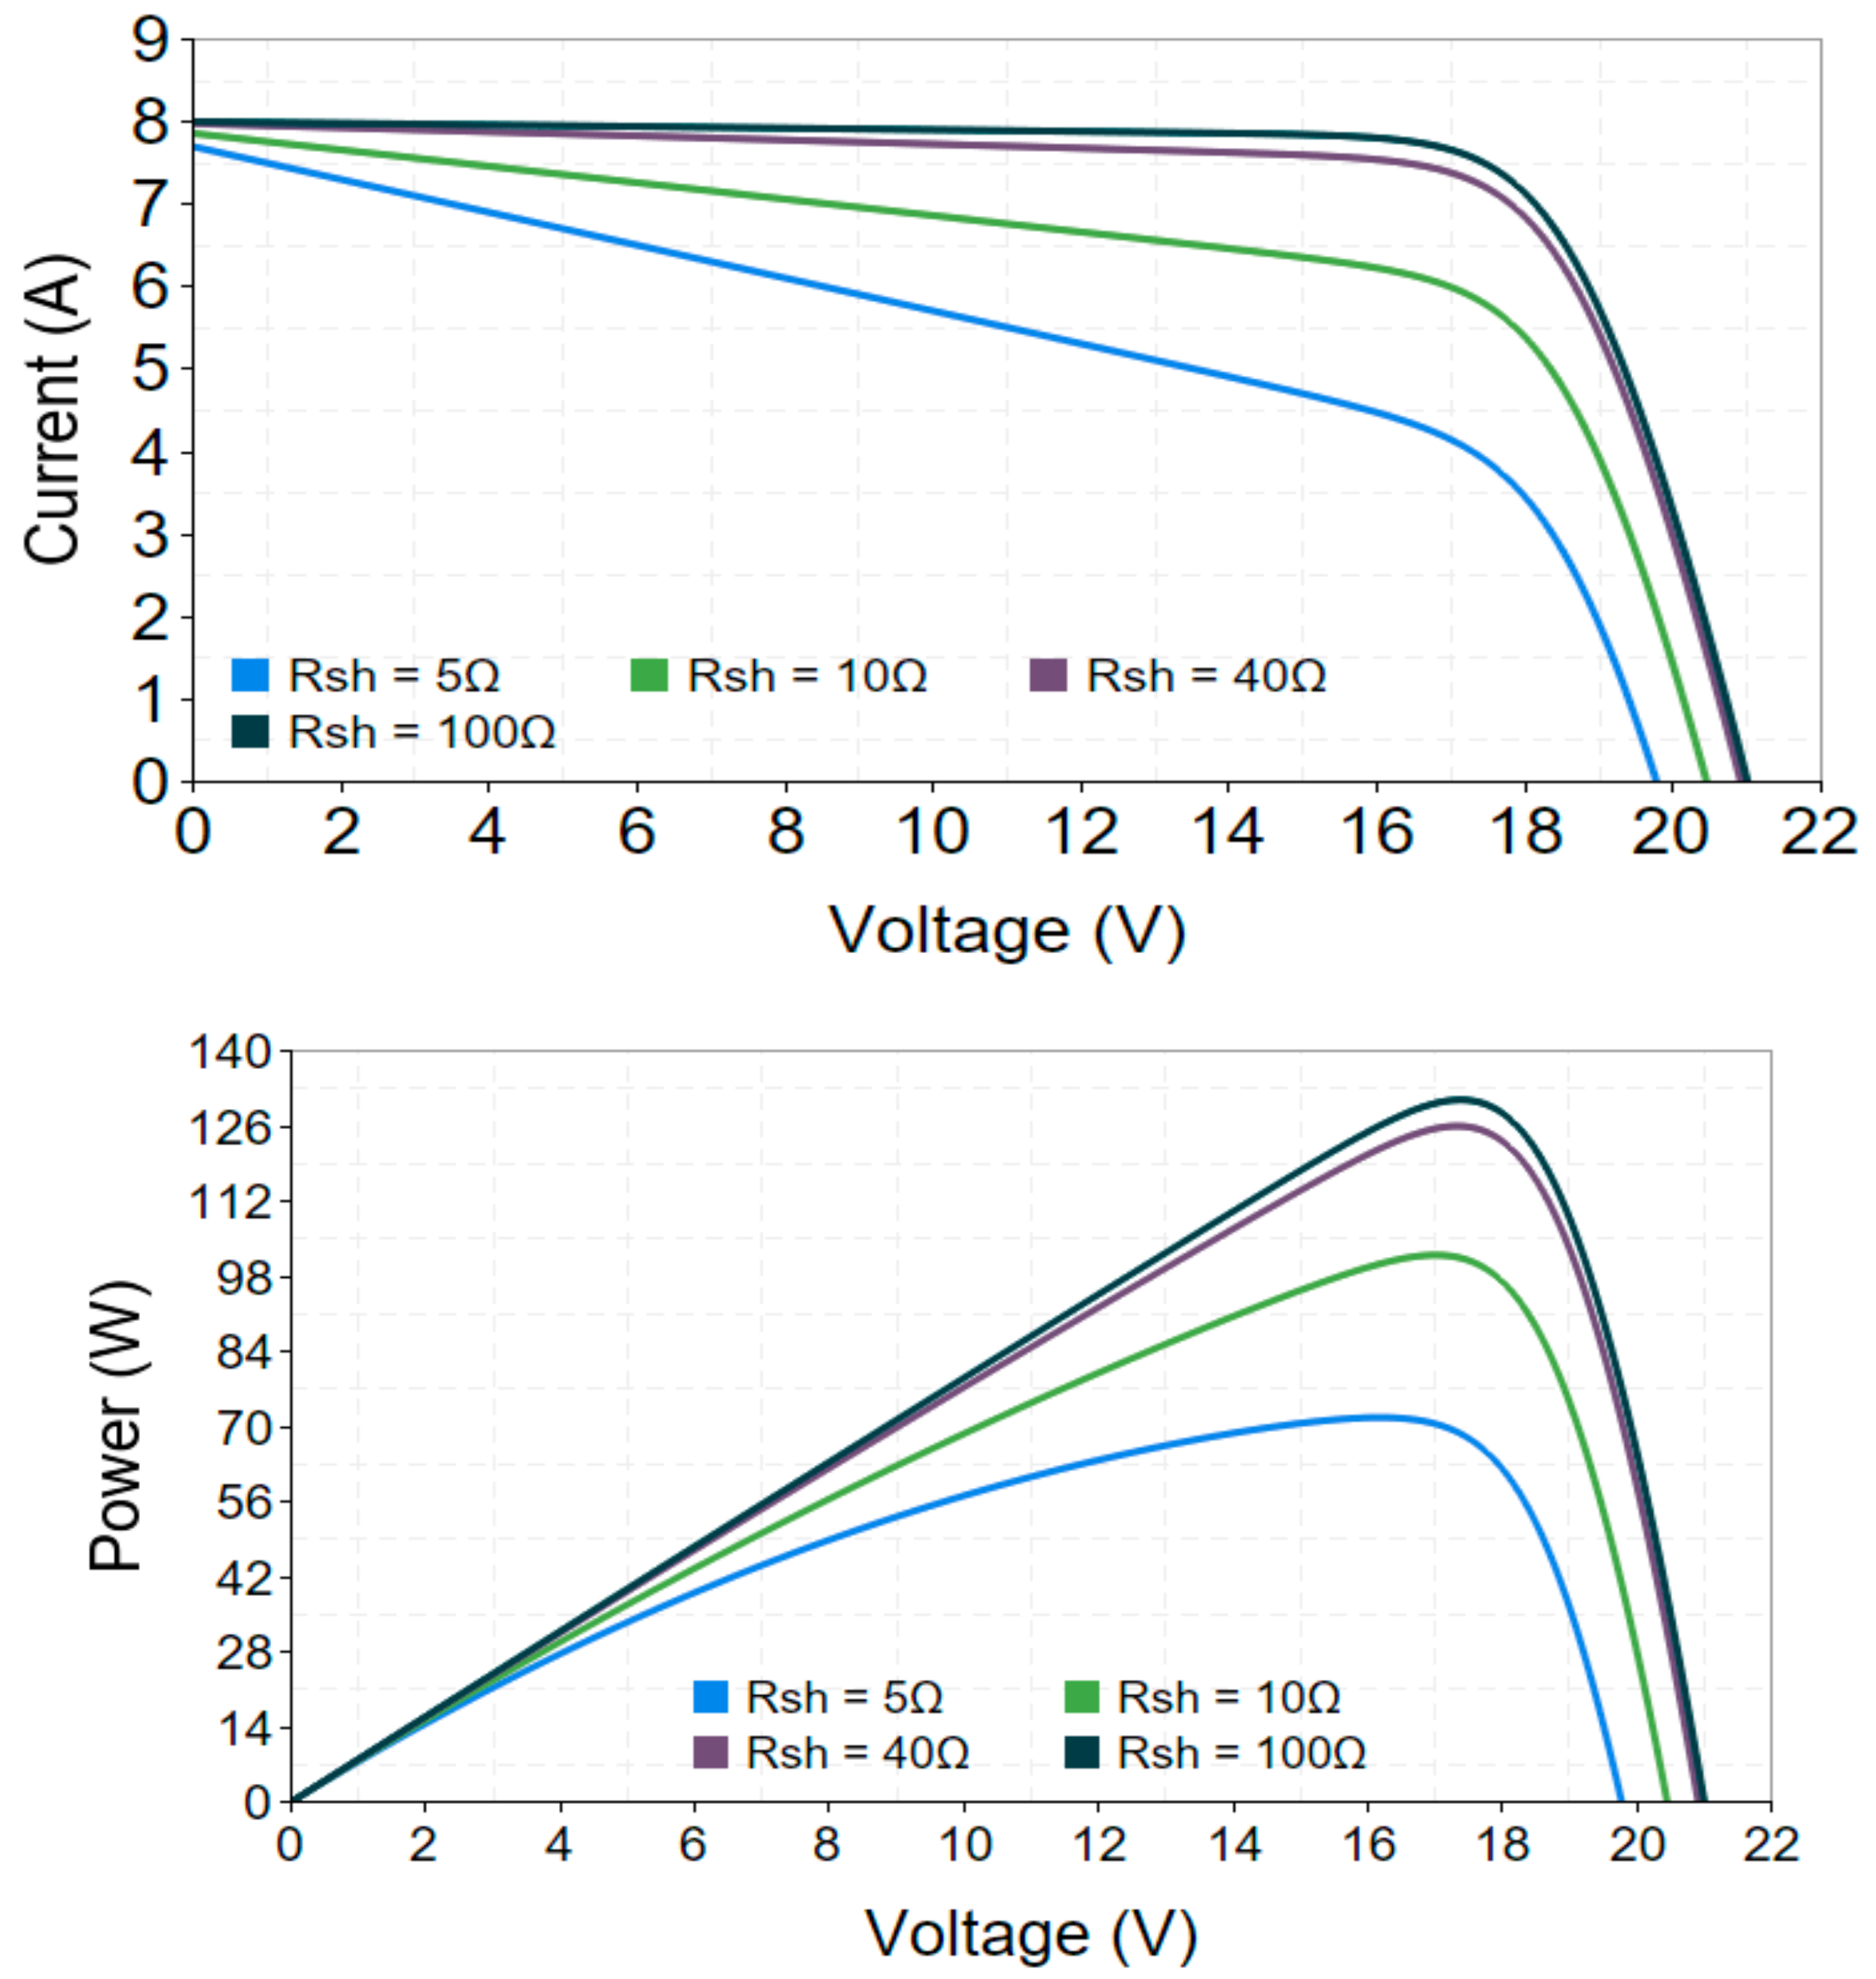
Figure 21 indicates the fact that with the increase in shunt resistance, there is a reduction in the module’s leakage current (unintentional parallel currents), leading to a decrease in voltage drop across the shunt resistor. Consequently, the open-circuit voltage (Voc) undergoes a rise. On the contrary, the impact of heightened shunt resistance on the short circuit current is modest or almost negligible, particularly at elevated resistance values. This is because it inhibits the flow of parallel currents that can circumvent the solar cells in circumstances of a module short circuit, thereby slightly increasing the short-circuit current (Isc). Therefore, an upgrade in shunt resistance results in a rise in open-circuit voltage and a modest increase in short-circuit current, along with increases in the PV module’s maximum power output, fill factor, and overall efficiency.
Additionally, the researchers in [20] demonstrated that the power generated at standard irradiance reduces with reduced shunt resistance, whereas the power generated from tilted irradiation is greater than that of a module without shunt resistance. This shows that small shunt resistance can minimize power loss owing to mismatched currents. Moreover, curved PV modules are prone to self-shading under high tilt conditions and continue generating energy with low shunt resistances even when certain cells are not exposed to light. In addition, shunt resistance minimizes abrupt current mismatches in solar cells that can lead to harmfully high reverse biases, underlining its importance in strengthening the durability of curved PV modules. Conversely, modules with infinitely high shunt resistance can encounter excessive reverse bias currents, resulting in deterioration. Hence, thin-film PV modules with low shunt resistances are particularly well-suited for usage on curved surfaces, where difficulties like self-shading and uneven irradiance can cause current mismatches.

3.6. The Effect of the Reverse Saturation Current (Io)

The reverse saturation current is an important parameter in determining the electrical properties of a solar cell or PV module. When a solar cell or PV module is exposed to light, an electric current is generated. Even in the absence of light, a small current flows through the cell due to the inherent qualities of the semiconductor materials used to build it. This little current is known as the reverse saturation current (Io), and it is induced by the material’s thermally generated electron–hole pairs [4,23,63].
The reverse saturation current (Io) has a notable impact on the IV and PV characteristics of a PV cell. With the rise in Io, the presence of thermally generated charge carriers is amplified. This phenomenon results in an increased dark current in the absence of illumination. Consequently, the short circuit current and the leakage current in the reverse bias area exhibit a marginal rise, as evident from Figure 22. Conversely, it can be observed that the open-circuit voltage exhibits a tendency to decrease. This may be attributed to the presence of a heightened dark current that counteracts the voltage accumulation across the cell, hence impeding the maintenance of a high Voc. Therefore, this alteration in Voc results in a shift of the maximum power point (MPP) and a subsequent reduction in the attainable power output. Consequently, the fill factor (FF) is diminished because of the elevated dark currents, thereby leading to amplified losses in the electrical properties of the cell.
On the other hand, the reverse saturation current is temperature-sensitive. It increases with the rising temperature since the temperature has a significant influence on diode properties. According to (5), the diode reverse saturation current is affected by the variation in temperature through its effect on the thermal voltage and the open circuit voltage. The effect of temperature on the Io current can be yielded from (5) by the following equation [63]:
I o , n e w = I s c n e w V o c , n e w R s h e q N s a K ( V o c , n e w T n e w + K v )
Figure 23 shows the normalized reverse saturation current of the diode (Io,new/Io,STC) as a function of temperature. It can be noticed that the diode’s current increases exponentially with the increase in temperature because of the increase in the kinetic energy of the PV diodes.

3.7. The Effect of the Diode Ideality Factor (α)

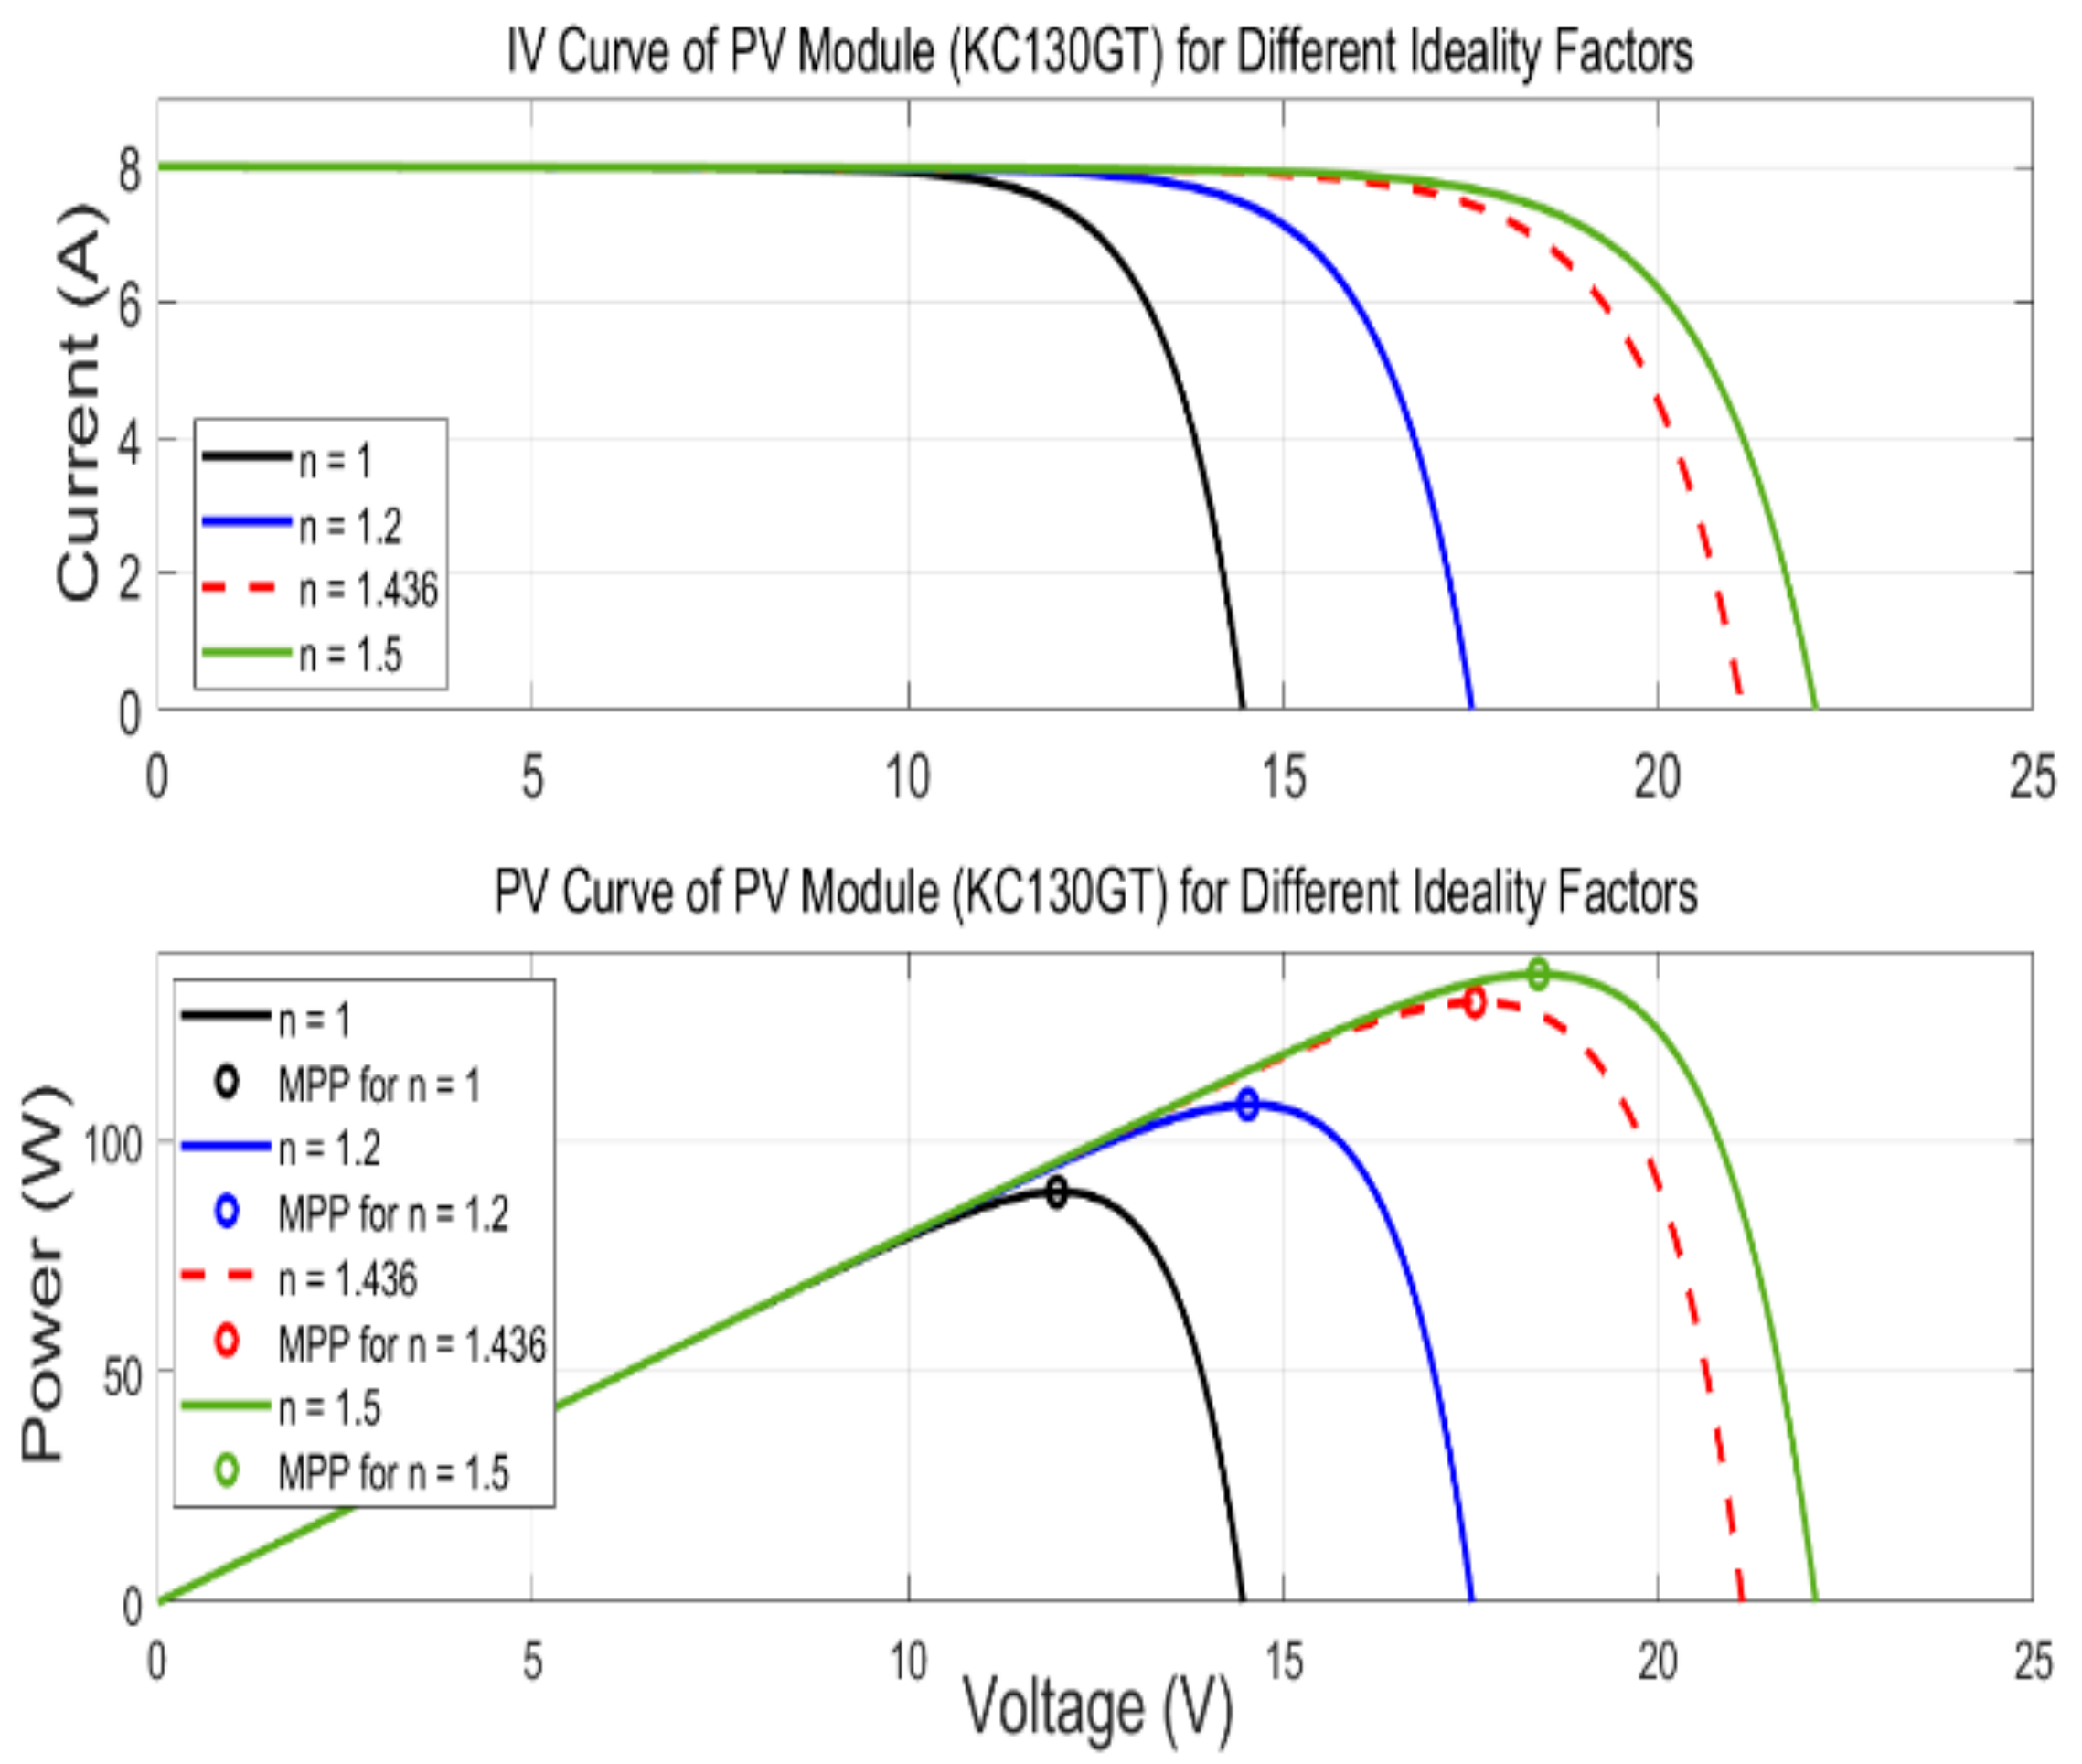
The ideality factor (α) is a measure to characterize the non-ideal characteristics of the diode in photovoltaic modules. The term “diode ideality factor” or “diode quality factor” is commonly used to refer to this concept [72]. The ideality factor is included in the current equation of the diode, as in (7), to incorporate variations from the ideal diode behavior. The ideality factor is subject to influence from a range of parameters, encompassing material properties, temperature, manufacturing variations, and irradiance level. As evidenced by the I-V and P-V curves of the KC130GT PV module shown in Figure 24, there is a noticeable trend of the increase in open-circuit voltage (Voc) as the ideality factor increases. On the other hand, in cases when the ideality factor approaches the ideal value of 1 (α ≈ 1), the open-circuit voltage exhibits greater proximity to its theoretical maximum within a certain combination of material and temperature parameters [73]. The phenomenon arises due to the influence of the ideality factor on the voltage at which the diode current undergoes a shift from exponential to linear characteristics. Greater values of α are associated with a more gradual transition, hence yielding a greater open-circuit voltage. This would indicate a correlation between the ideality factor and the shunt resistance of the module. In contrast, the impact of the ideality factor on the short circuit current (Isc) is almost less pronounced when compared to its effect on the open circuit voltage. However, as mentioned earlier, the main factors that determine the short circuit current are the intensity of sunlight (irradiance), the area of the photovoltaic cell, and the qualities of the semiconductor material. Hence, alterations in the ideality factor can result in minor fluctuations in the gradient of the I-V curve.
Additionally, the ideality factor plays a significant role in determining the characteristics of the P-V curve. Higher values of α are associated with a wider and flatter P-V curve. Conversely, lower values of α yield a narrower and more evident MPP on the PV curve.
It is crucial to note that in the case where α = 1, the only currents present in the p-n junction are diffusion currents, which can be attributed to the band-to-band recombination process. Nevertheless, when the value of α is equal to 2, the currents in the device are primarily influenced by the charge production and recombination processes [72,74,75]. In the regime of significant reverse bias, the likelihood of recombination is theoretically negligible due to the presence of a strong internal electric field that effectively eliminates barriers to recombination. This ensures a reliable movement of free-charge carriers to the electrodes. Hence, it was observed that the short circuit current exhibited minimal variation in response to the increase in the ideality factor.
On the other hand, the correlation between irradiance level and the ideality factor in PV modules is depicted in Figure 25. A noticeable trend can be observed, indicating a positive relation between the irradiance level and the ideality factor. Specifically, as the irradiance level rises, there is a tendency for the ideality factor to exhibit a slight linear increase. To clarify, it can be observed that while the photovoltaic module functions under increased amounts of sunlight, there is a slight proportional increase in the ideality factor, indicating a linear relationship between the ideality factor and the intensity of irradiance. The results are consistent with the findings in [24].

4. The Performance of the PV Arrays under the Effect of Different Electrical Faults

Faults in PV arrays are a major source that might increase the susceptibility of the power grid and cause power losses in the PV systems. Faults can occur for a variety of reasons, including manufacturing or installation-level faults, faults caused by external factors, and internal component failures. To gain a better understanding, PV faults may occur in the DC or AC stages that comprise the power flow chain. At the DC stage, the faults can be caused by a variety of factors, including partial shading, hotspots, bypass diode failure, module cracks, maximum power point failure, and DC-DC converter switching failure [76,77,78]. AC stage faults, on the other hand, are faults that occur on the distribution side of a PV system and typically include inverter faults such as open circuit switches, short circuit switches, filter failure, and gating failure in the inverter [79]. These defects may induce incoherence in the operation of the PV system, aging of PV arrays, and a reduction in overall efficacy [79,80]. Among these faults, line-to-line (LL), line–ground (LG), and arc faults were identified as the principal DC side defects that could create catastrophes such as electrical fires [81].
However, fault analysis is of paramount importance in ensuring the protection of photovoltaic systems, particularly in cases when conventional protection methods may not possess the necessary accuracy to rectify faults promptly and efficiently. In this context, a comprehensive evaluation of current–voltage (I-V) curves has great importance, as it offers significant insights into the impact of faults on photovoltaic arrays. The identified flaws possess the capacity to significantly diminish power generation and pose a threat to the structural soundness of the array’s components, hence emphasizing the crucial need for fault analysis in upholding the dependability and effectiveness of the system. Therefore, this section discusses the anticipated causes of different electric faults in the DC side of the PV array and their impact on the electrical behavior and the output of the system, where only the PV array side was considered the source of the electrical faults in this analysis. Figure 26 depicts different types of PV array faults that might happen on the DC side of the system.

4.1. Line-to-Line Fault (LL)

A line-to-line (LL) fault occurs when two points in the same or separate strings of a PV array are accidentally connected, creating a low-impedance current channel or causing reverse current flow in the affected strings. At the time of the fault incidence, the voltage difference between the connected spots determines its severity. The greater the voltage disparity, the greater the fault current, as it is directly proportional to this disparity.
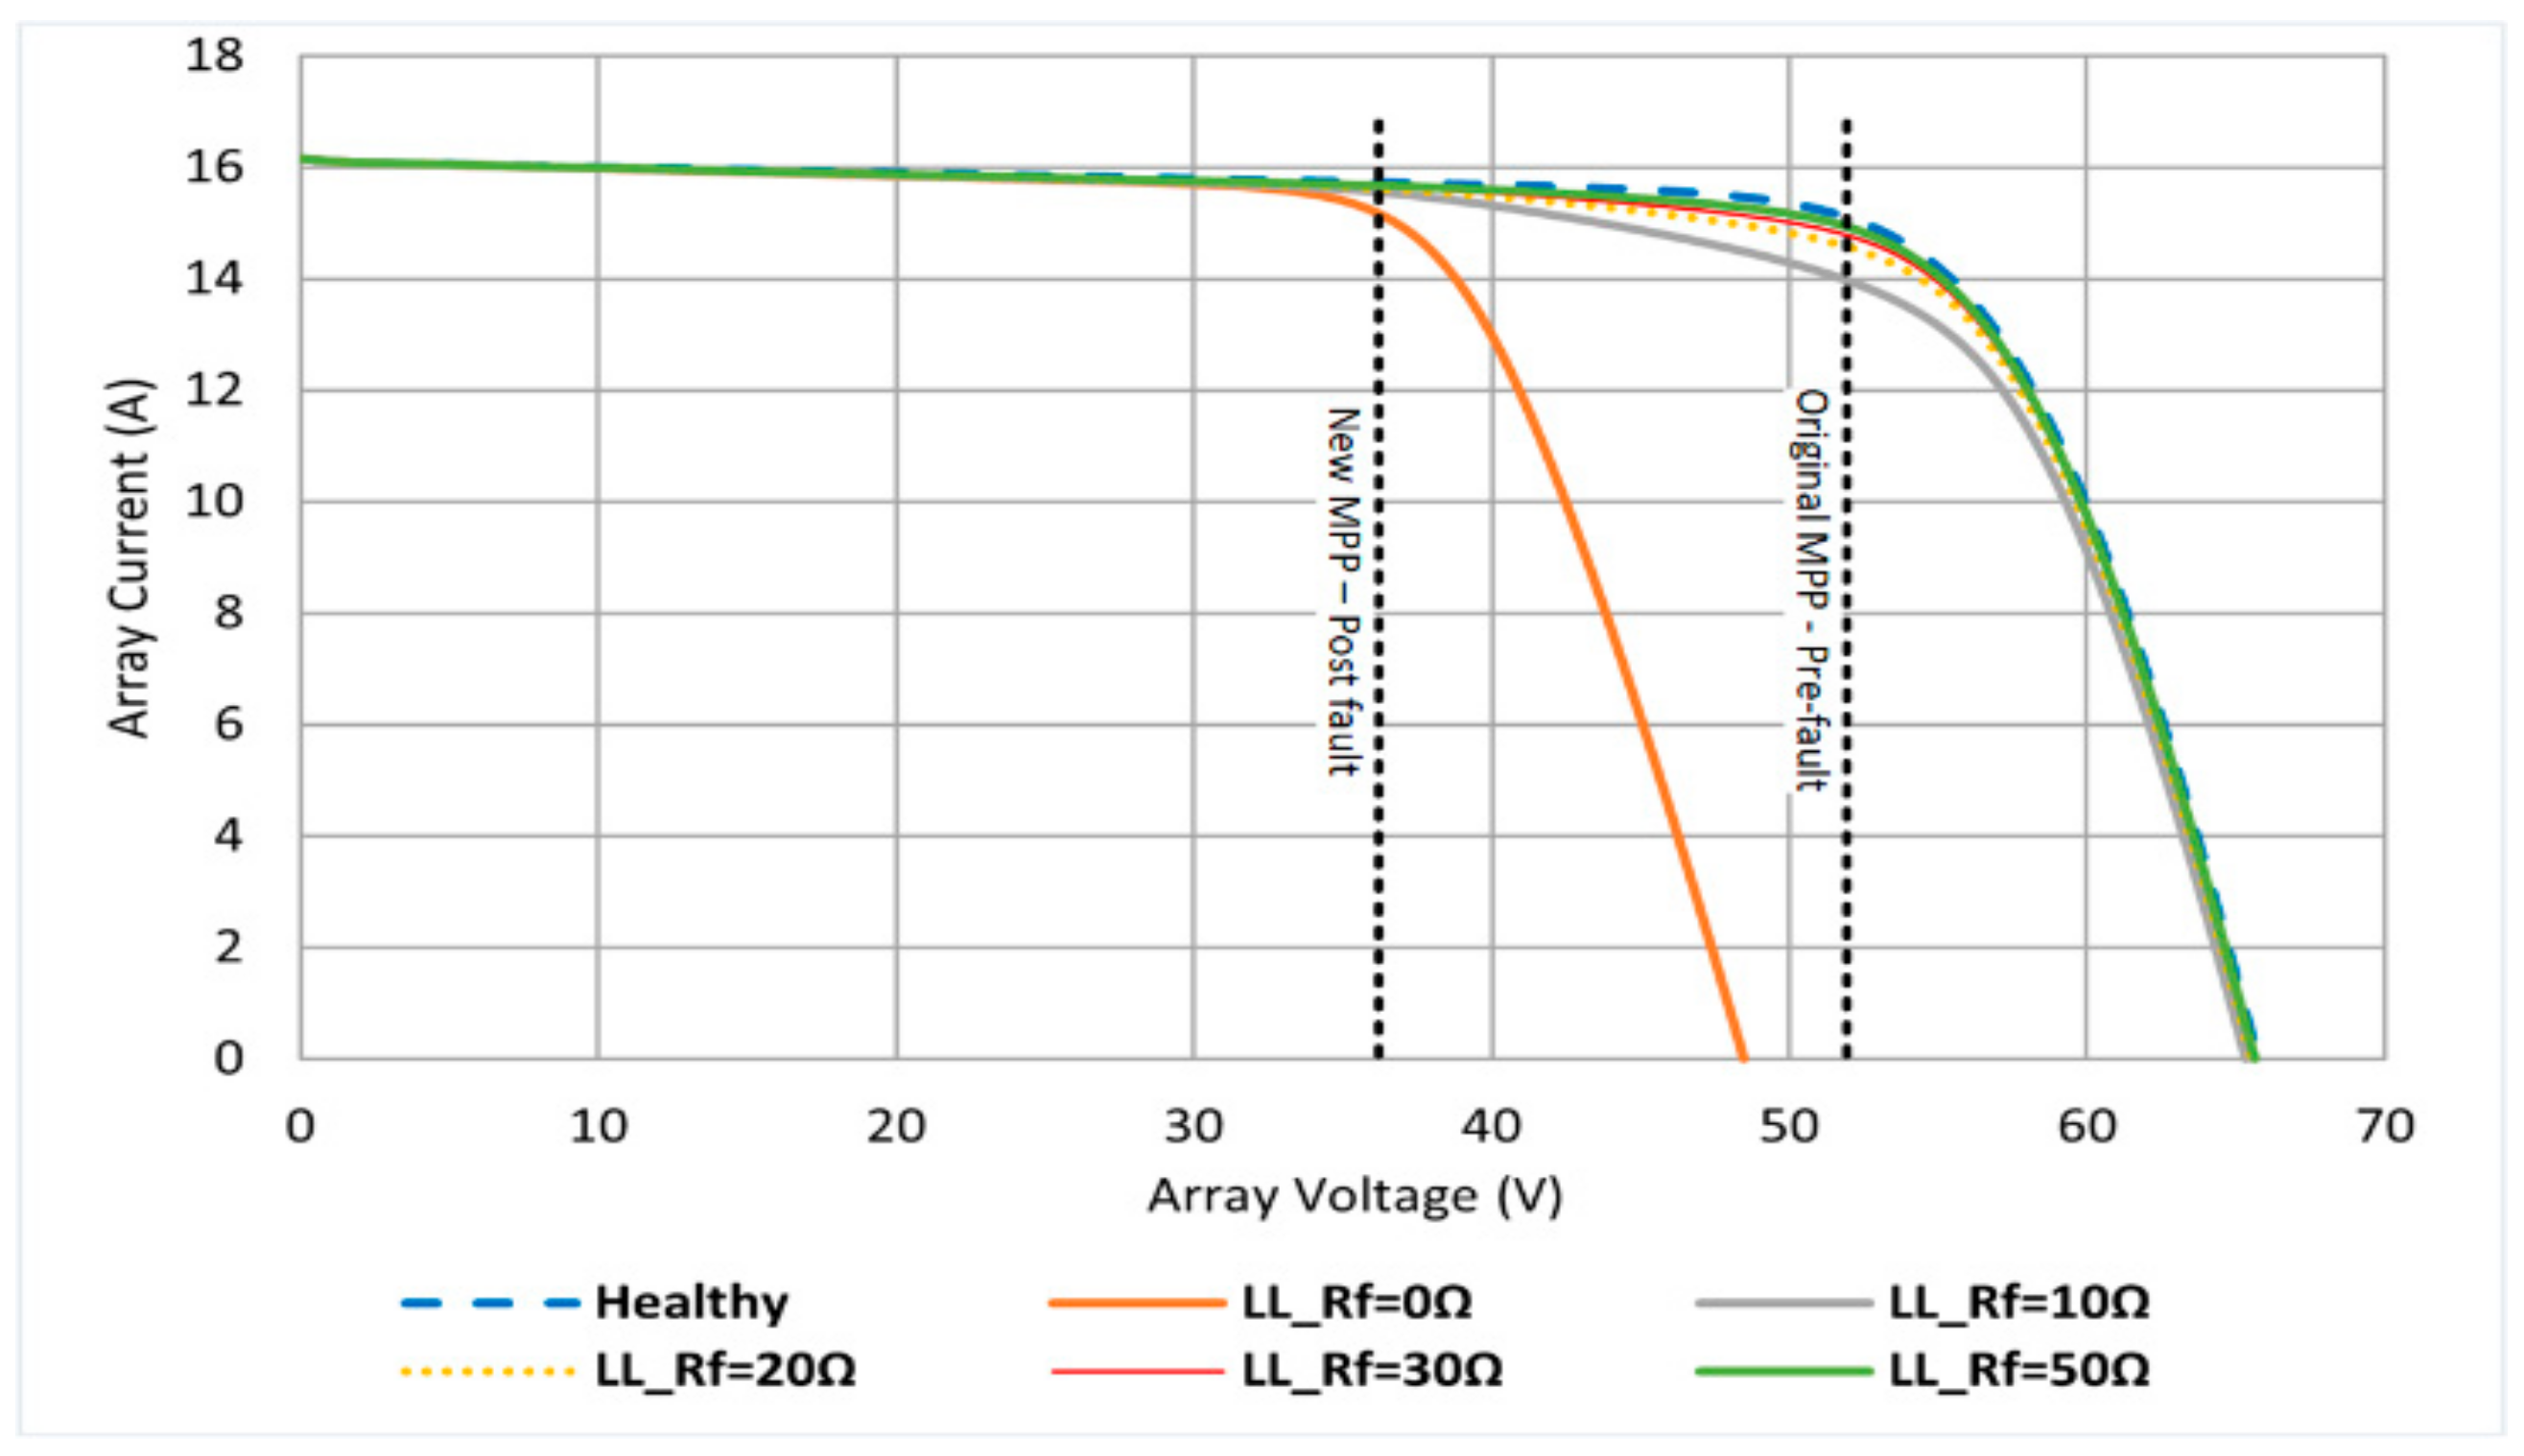
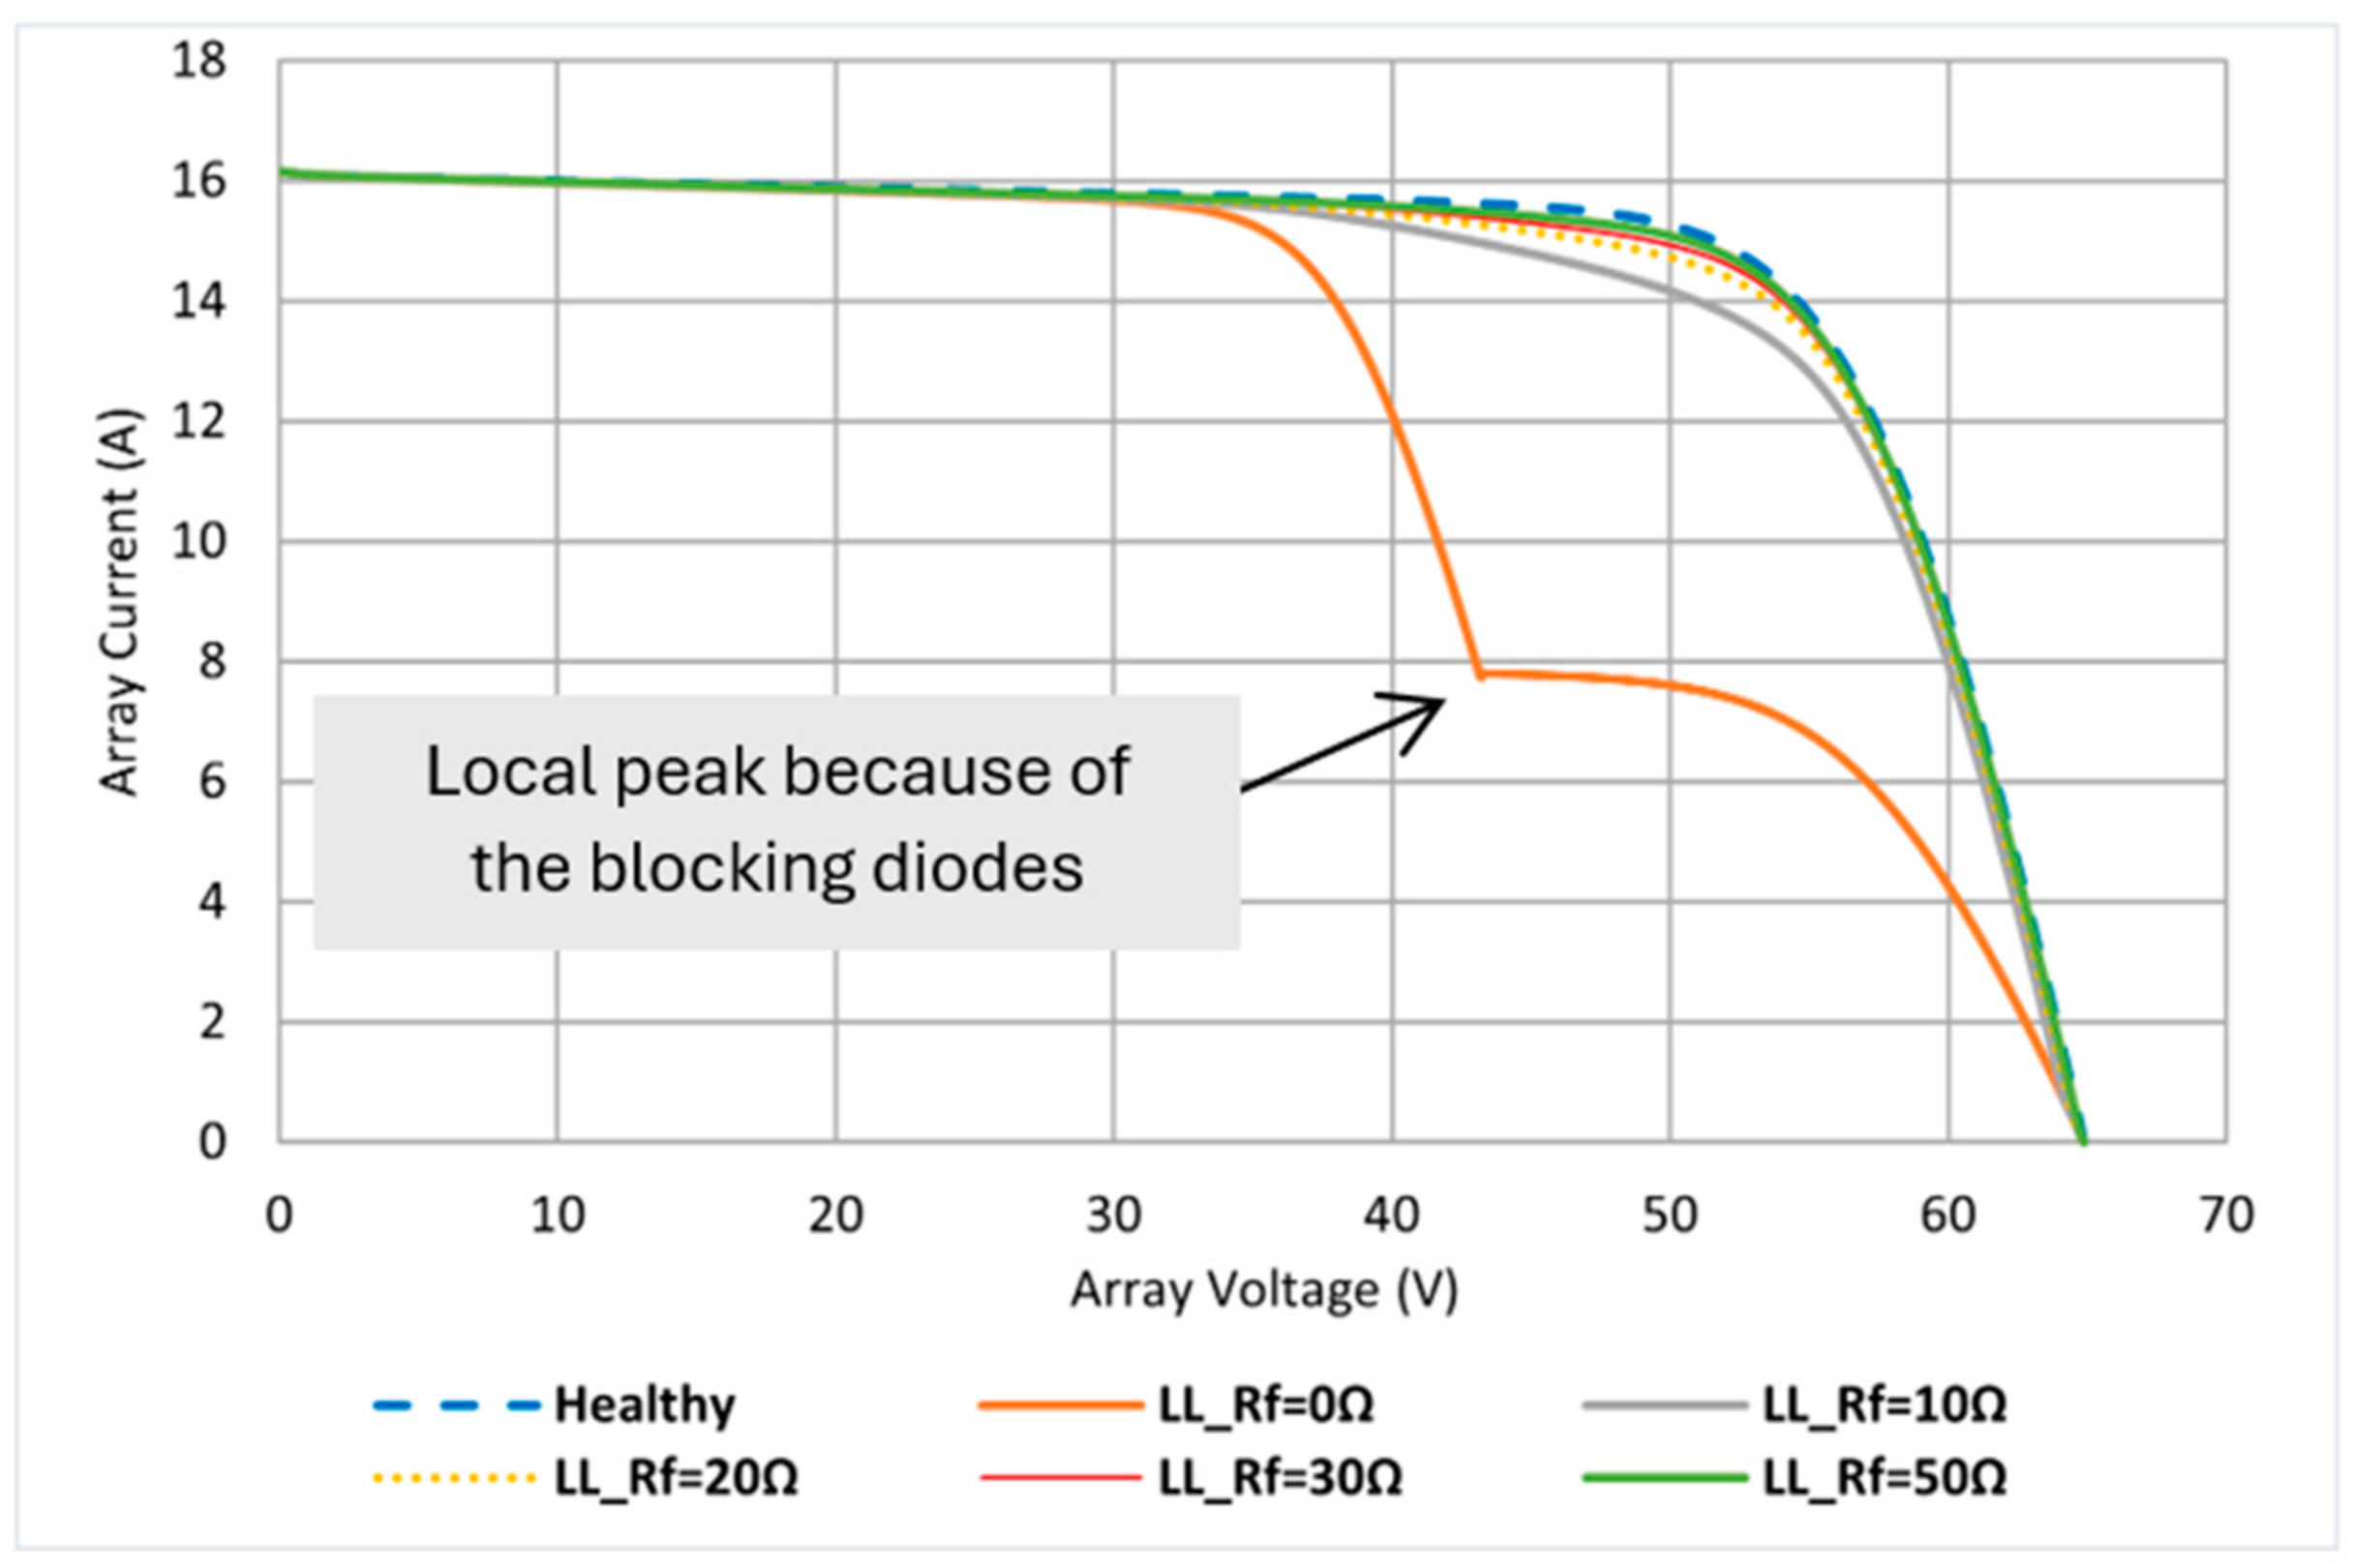
The presence of the LL fault can have a variety of negative effects on the PV array’s performance. The maximum power point tracking (MPPT) algorithm, which optimizes the PV array’s output power, may continue to operate despite the fault but with reduced output power. Figure 27 depicts the behavior of a PV array with one defective module with a range of LL fault resistance. As depicted, the MPPT follows the new maximum power point (MPP). Furthermore, the resistance of the LL fault plays a crucial role in determining the impact of the fault on the PV array. As shown in Figure 27 and Figure 28, the behavior of the PV array approaches that of a healthy system as the fault resistance increases. This indicates that a higher resistance in the fault path decreases the fault current and mitigates its negative impact on the PV system.
Overcurrent protection devices (OCPDs), on the other hand, are frequently employed to protect PV arrays from the potential damage caused by LL faults [82]. OCPDs, such as fuses, are intended to clear faults once the fault current exceeds a predetermined threshold, which is typically set to 156% of the string current [81]. By interrupting the flow of current during a fault, OCPDs prevent further damage to the array and reduce the risk of an open circuit or electrical fire.
In addition to OCPDs, blocking diodes are used to prevent reverse currents through PV array strings. Blocking diodes work as a unidirectional valve, permitting current to flow only in the desired direction and thereby increasing the PV power output [83]. Nonetheless, it is essential to ensure that the blocking diodes are functioning properly, as a failure in these diodes, coupled with the undetected LL fault, can result in hazardous conditions and high fault currents. Moreover, the blocking diodes with the presence of the low resistance fault cause different voltage peaks on the I-V characteristics curve, making it very similar to the I-V curve of the open circuit and partial shading faults [80], as depicted in Figure 28.

4.2. Line-To-Ground Fault

During normal operation, PV arrays are comprised of non-current carrying components (NCC) like mounting platforms, module frames, and enclosures. Nevertheless, a short circuit can occur when there is contact between the junction box and the ground or when water corrosion takes place, resulting in an electrical connection between the non-current-carrying conductors (NCC) and the current-carrying conductors (CCC). As depicted in Figure 26a,b, this situation is referred to as a line-to-ground fault.
As shown in Figure 29, the magnitude of the fault current in the LG fault depends mainly on the fault location and fault impedance. Low fault impedance typically results in a high fault current, which activates the Ground Fault Protection Device (GFPD) and protects the system [84]. LG faults can pose a fire hazard if there is no mechanism in place to remove the fault. In PV arrays, two primary categories of LG faults are observed: lower-ground faults and upper-ground faults.
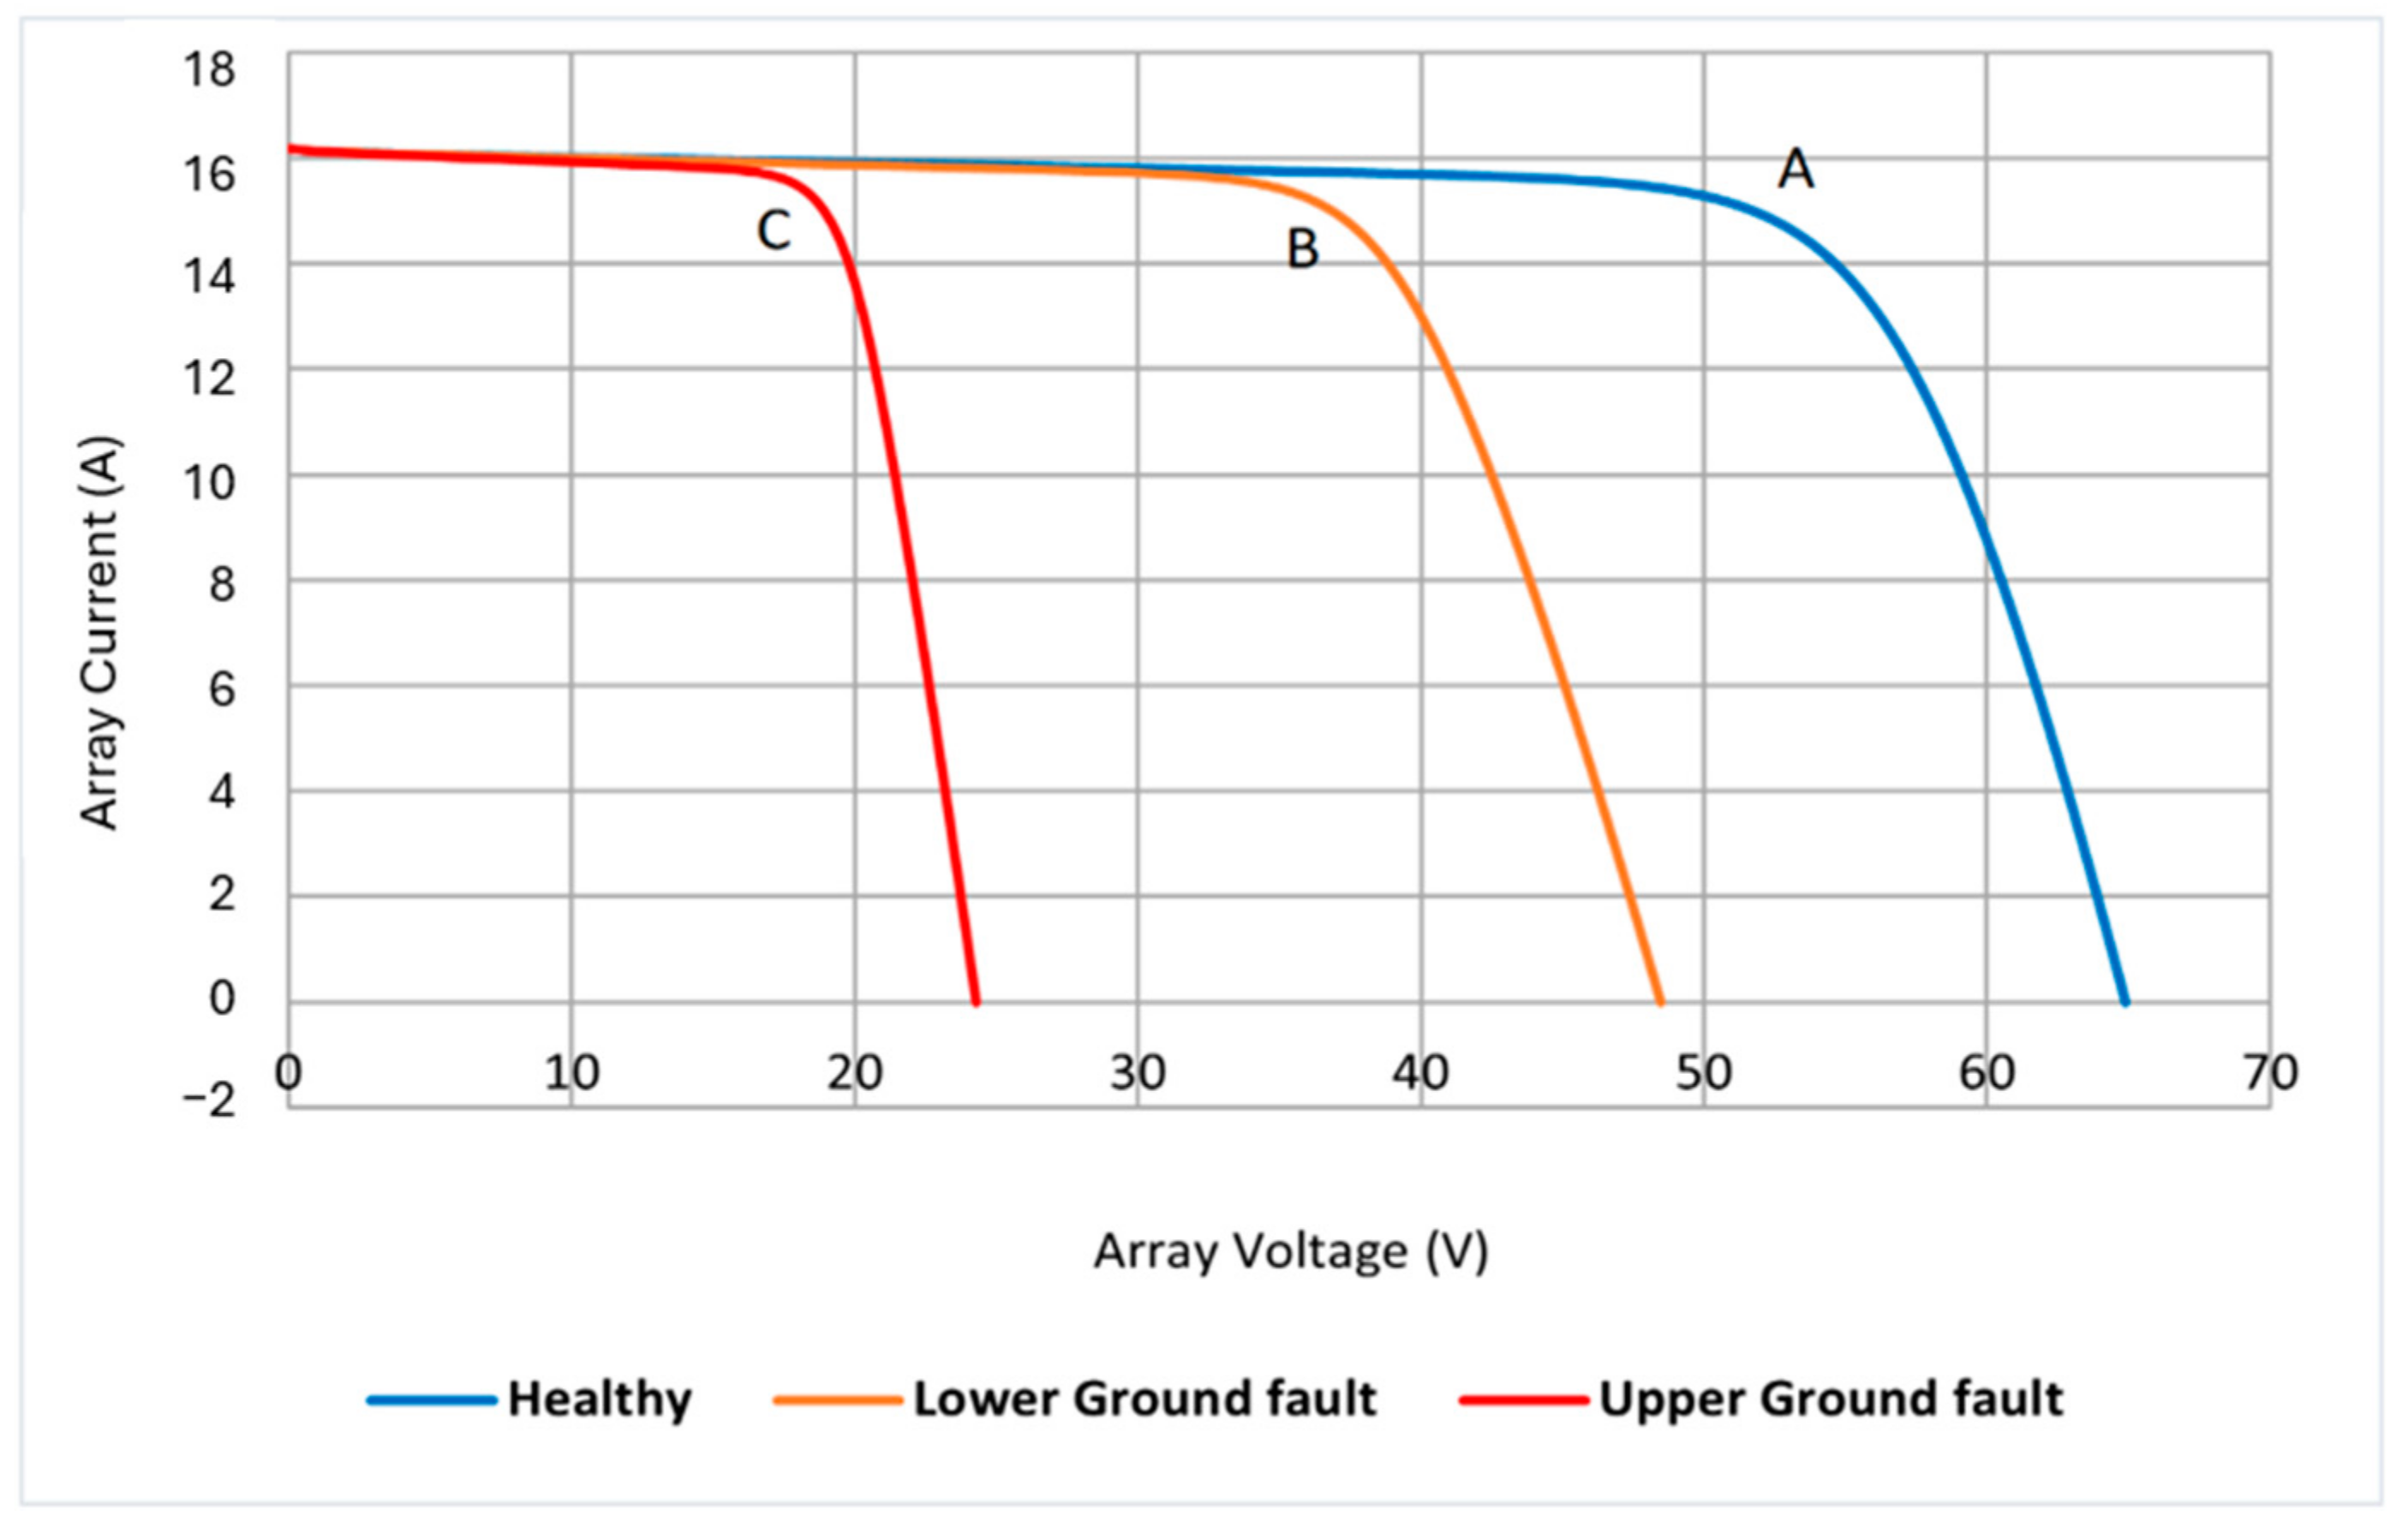
A lower ground fault occurs in the last two modules of the PV string. There is a difference in voltage and current transfer between the faulty and normal strings due to the fault. The maximum power point tracking (MPPT) algorithm detects the decrease in the output power and shifts the maximum power point (MPP) from point “A” to point “B,” thereby optimizing the output power, as shown in Figure 30. Nonetheless, the faulty string is mismatched with other strings and is not able to operate at its actual MPP, resulting in a performance decrease [79].
Upper ground fault, on the other hand, occurs in the higher PV modules and is characterized by a high fault current and a low or zero impedance. Due to the fault current and the back-fed current, the faulty module experiences a higher current than the other modules. The GFPD may disconnect the faulty string, thereby terminating the faulty path. Nonetheless, if the GFPD fails to detect the fault, the inverter’s MPPT will shift the MPP from point “A” to point “C” to reduce power loss and fault current, causing damage to the cables and modules, as shown in Figure 30.
In addition, blocking diodes in the PV arrays can prevent current from flowing in the opposite direction, thereby reducing the risk of damage. Figure 30 illustrates the impact of and blocking diode resistance levels on the PV array’s behavior during LG faults.

4.3. Partial Shading and Complete Shading Faults

Partial shading is one of the most critical faults that PV arrays confront. It happens when areas of the PV array are subjected to diminished sunlight due to different factors, such as clouds, dust, trees, snow, or other barriers [85,86]. Partial shading can result in a loss of output power and can lead to a hotspot when certain cells in the shaded area absorb little or no sunlight while others contribute to the current flow. Power may be dissipated as heat by the reverse-biased shaded cells, resulting in localized temperature spikes. Excessive heat (over 150 °C) can cause permanent damage to the PV generator, limiting its efficiency and longevity and may risk the overall system safety and dependability [83,87].
As demonstrated in Figure 31, the MPP of the PV array drops as the percentage of partial shading increases. Furthermore, depending on the number and size of shaded modules, different local and global MPP peaks may arise.
Various detection approaches have been developed to mitigate the negative effects of partial shading, with bypass diodes being one of the most typical alternatives [88,89]. Bypass diodes are often linked in parallel with PV modules at the opposite polarity. When there is partial shading, the bypass diodes allow current to flow around the shaded modules, keeping them from becoming reverse-biased. This guarantees that no hotspots are created by the shaded modules and that the overall system output is maximized [90]. While bypass diodes are efficient at minimizing hotspots, they may create new issues for the MPP tracker. When the maximum power point tracking algorithm in the inverter is activated, it searches for the ideal operating point on the I-V curve to optimize the system’s output power. Multiple MPPs, both local and global, may arise in the case of partial shading. The MPPT of the inverter normally forces the system to function at the new global MPP, which may imply lowering the output voltage. This has the potential to reduce inverter lifetime and overall system efficiency.
On the other hand, complete shading (CS) of the PV array is the extreme end of partial shading. In this case, no local peaks arise, and the system’s overall output power is lowered. This emphasizes the significance of correct array design and positioning to reduce the influence of shading.

5. Conclusions

This paper provides substantial findings concerning the nature of photovoltaic arrays from a systematic analysis of the impact of various parameters and particular fault conditions. The study started with the establishment of a detailed mathematical model of the PV cell and module employing Shockley’s equation single-diode PV model. The iteration analysis of the model was utilized to identify the five main parameters of the developed model, i.e., series resistance, shunt resistance, diode ideality factor, photocurrent, and reverse saturation current. Furthermore, advancements in simulation methods and experimental designs were adopted to assess the developed model’s performance.
The effect of the change in the model’s parameters under a wide range of temperatures and irradiation on the efficiency and behavior of the tested modules were evaluated. The changes concerning the current–voltage (I-V) characteristics, output power, and fill factor of the photovoltaic module were evaluated.
Furthermore, the scope of this study also examined the impacts of typical photovoltaic array faults, including line-to-line, line-to-ground, and partial shading faults. By means of evaluating the impacts of these faults on the array’s operating characteristics and power generation in different cases, this research has thereby contributed to the development of fault detection and classification strategies. This knowledge is of great concern to enhance the dependability and efficiency of photovoltaic systems, hence their wider application and sustainability.

Author Contributions

Conceptualization, K.I.B.; Methodology, M.A.A.M.Z.; Validation, N.A.M.K. and H.A.; formal analysis, K.I.B. and M.A.A.M.Z.; Data curation, Y.Y., M.A.Z. and M.A.K.; Writing—original draft, K.I.B.; Writing—review & editing, M.A.A.M.Z.; Supervision, M.A.A.M.Z. All authors have read and agreed to the published version of the manuscript.

Funding

This research work is supported by Universiti Kebangsaan Malaysia Geran Universiti Penyelidikan GUP-2022-024 and DPK-2023-015.

Conflicts of Interest

The authors declare no conflict of interest.

References

  1. Lorenzo, G.A.E. Solar Electricity: Engineering of Photovoltaic Systems; Institute of Solar Energy: Mendoza, Argentina; Polytechnic University of Madrid: Madrid, Spain, 1994. [Google Scholar]
  2. Tian, H.; Mancilla-david, F.; Ellis, K.; Jenkins, P.; Muljadi, E. A Detailed Performance Model for Photovoltaic Systems Preprint; NREL/JA-5500-54601; National Renewable Energy laboratory (NREL): Golden, CO, USA, 2012. Available online: http://www.osti.gov/bridge (accessed on 24 September 2023).
  3. Bhatia, S.C. Solar devices. Adv. Renew. Energy Syst. 2014, 68–93. [Google Scholar] [CrossRef]
  4. Al-Ezzi, A.S.; Ansari, M.N.M. Photovoltaic Solar Cells: A Review. Appl. Syst. Innov. 2022, 5, 67. [Google Scholar] [CrossRef]
  5. Oelhafen, P.; Schüler, A. Nanostructured materials for solar energy conversion. Sol. Energy 2005, 79, 110–121. [Google Scholar] [CrossRef]
  6. Blandford, R.; Watkins, M. This Month in Physics History: April 25, 1954: Bell Labs Demonstrates the First Practical Silicon Solar Cell. APS News 2009, 18, 2. [Google Scholar]
  7. Libra, M.; Kozelka, M.; Šafránková, J.; Belza, R.; Poulek, V.; Beránek, V.; Sedláček, J.; Zholobov, M.; Šubrt, T.; Severová, L. Agrivoltaics: Dual usage of agricultural land for sustainable development. Int. Agrophysics 2024, 38, 121–126. [Google Scholar] [CrossRef]
  8. Velasco, M.H. Enabling Year-round Cultivation in the Nordics-Agrivoltaics and Adaptive LED Lighting Control of Daily Light Integral. Agriculture 2021, 11, 1255. [Google Scholar] [CrossRef]
  9. Green, M.; Dunlop, E.; Hohl-Ebinger, J.; Yoshita, M.; Kopidakis, N.; Hao, X. Solar cell efficiency tables (version 56). Prog. Photovolt. Res. Appl. 2020, 28, 629–638. [Google Scholar] [CrossRef]
  10. Suthar, M.; Singh, G.K.; Saini, R.P. Comparison of mathematical models of photo-voltaic (PV) module and effect of various parameters on its performance. In Proceedings of the 2013 International Conference on Energy Efficient Technologies for Sustainability (ICEETS), Nagercoil, India, 10–12 April 2013; pp. 1354–1359. [Google Scholar]
  11. Ahmed, T.; Goncalves, T.; Tlemcani, M. Single diode model parameters analysis of photovoltaic cell. In Proceedings of the 2016 IEEE International Conference on Renewable Energy Research and Applications (ICRERA), Bermigham, UK, 20–23 November 2016; Volume 017659, pp. 396–400. [Google Scholar] [CrossRef]
  12. Sarkar, N.I. Effect of various model parameters on solar photovoltaic cell simulation: A SPICE analysis. Renew. Wind. Water Sol. 2016, 3, 1. [Google Scholar] [CrossRef]
  13. Skoplaki, J.; Palyvos, E. On the temperature dependence of photovoltaic module electrical performance: A review of efficiency/power correlations. Sol. Energy 2009, 83, 614–624. [Google Scholar] [CrossRef]
  14. Seapan, M.; Limsakul, C.; Chayavanich, T.; Kirtikara, K.; Chayavanich, N.; Chenvidhya, D. Effects of dynamic parameters on measurements of IV curve. In Proceedings of the 2008 33rd IEEE Photovoltaic Specialists Conference, San Diego, CA, USA, 11–16 May 2008; pp. 1–3. [Google Scholar] [CrossRef]
  15. El-Khozondar, H.J.; El-Khozondar, R.J.; Matter, K. Parameters Influence on MPP Value of the Photo Voltaic Cell. Energy Procedia 2015, 74, 1142–1149. [Google Scholar] [CrossRef]
  16. Saloux, E.; Teyssedou, A.; Sorin, M. Explicit model of photovoltaic panels to determine voltages and currents at the maximum power point. Sol. Energy 2011, 85, 713–722. [Google Scholar] [CrossRef]
  17. Hamoodi, A.N.; Hamoodi, S.A.; Mohammed, R.A. Photovoltaic Modeling and Effecting of Temperature and Irradiation on I-V and P-V Characteristics. Int. J. Appl. Eng. Res. 2018, 13, 3123–3127. Available online: http://www.ripublication.com (accessed on 4 January 2024).
  18. Ukoima, K.; Agwu, E. Resistance, temperature and irradiance parameter analysis of a single diode photovoltaic cell model. Umudike J. Eng. Technol. 2019, 5, 97–107. [Google Scholar]
  19. Bouzguenda, M.; Salmi, T.; Gastli, A.; Masmoudi, A. Evaluating solar photovoltaic system performance using MATLAB. In Proceedings of the 2012 First International Conference on Renewable Energies and Vehicular Technology (REVET), Nabeul, Tunisia, 26–28 March 2012; pp. 55–59. [Google Scholar]
  20. Tayagaki, T.; Sasaki, A.; Ishizuka, S.; Yoshita, M. Impact of Shunt Resistance on the Performance of Curved Thin-Film Photovoltaic Modules With Series-Connected Solar Cells. IEEE J. Photovolt. 2022, 12, 1527–1532. [Google Scholar] [CrossRef]
  21. McMahon, T.; Basso, T.; Rummel, S. Cell shunt resistance and photovoltaic module performance. In Proceedings of the Conference Record of the Twenty Fifth IEEE Photovoltaic Specialists Conference, Washington, DC, USA, 13–17 May 1996; pp. 1291–1294. [Google Scholar]
  22. Al Abdullah, K.; Al Alloush, F.; Jaafar, A.; Salame, C. Study of the Effects Related to the Electric Reverse Stress Currents on the Mono-Si Solar Cell Electrical Parameters. Energy Procedia 2013, 36, 104–113. [Google Scholar] [CrossRef]
  23. Ramos-hernanz, J.; Lopez-guede, J.M.; Zulueta, E. Reverse Saturation Current Analysis in Photovoltaic Cell Models. WSEAS Trans. Power Syst. 2017, 12, 231–237. [Google Scholar]
  24. Chegaar, M.; Hamzaoui, A.; Namoda, A.; Petit, P.; Aillerie, M.; Herguth, A. Effect of Illumination Intensity on Solar Cells Parameters. Energy Procedia 2013, 36, 722–729. [Google Scholar] [CrossRef]
  25. Silva, E.A.; Bradaschia, F.; Cavalcanti, M.C.; Nascimento, A.J. Parameter Estimation Method to Improve the Accuracy of Photovoltaic Electrical Model. IEEE J. Photovolt. 2015, 6, 278–285. [Google Scholar] [CrossRef]
  26. Silva, E.A.; Bradaschia, F.; Cavalcanti, M.C.; Nascimento, A.J. Renewable Energy-Utilisation and System Integration. IEEE J. Photovolt. 2016, 6, 278–285. [Google Scholar] [CrossRef]
  27. Nayak, B.; Mohapatra, A.; Misra, B. Non Linear IV Curve of PV Module: Impacts on MPPT and Parameters Estimation. Int. J. Eng. Res. Technol. 2012, 1, 1–8. [Google Scholar]
  28. Baradieh, K.; Zainuri, M.A.A.B.M.; Kamari, N.A.M.; Yusof, Y.; Abdullah, H.; Zaman, M.H.B.M. Fault Detection and Classification in the Photovoltaic Arrays using Machine Learning. In Proceedings of the 2023 IEEE Industrial Electronics and Applications Conference (IEACon), Penang, Malaysia, 6–7 November 2023; pp. 177–182. [Google Scholar] [CrossRef]
  29. Chin, V.J.; Salam, Z.; Ishaque, K. Cell modelling and model parameters estimation techniques for photovoltaic simulator application: A review. Appl. Energy 2015, 154, 500–519. [Google Scholar] [CrossRef]
  30. Diantoro, M.; Suprayogi, T.; Hidayat, A.; Taufiq, A.; Fuad, A.; Suryana, R. Shockley’s Equation Fit Analyses for Solar Cell Parameters from I-V Curves. Int. J. Photoenergy 2018, 2018, 9214820. [Google Scholar] [CrossRef]
  31. Stornelli, V.; Muttillo, M.; de Rubeis, T.; Nardi, I. A New Simplified Five-Parameter Estimation Method for Single-Diode Model of Photovoltaic Panels. Energies 2019, 12, 4271. [Google Scholar] [CrossRef]
  32. Md Tofael, A.; Teresa, G. Fault Analysis in Solar Photovoltaic Arrays. In Proceedings of the 5th International Conference on Renewable Energy Research and Applications, Bermigham, UK, 6–9 November 2016; pp. 20–23. [Google Scholar]
  33. Patil, S.R.; Burade, P.G.; Kadam, D.P. Five parameters extraction of single diode PV model by metaheuristic optimization method by identified built-up data. In Proceedings of the 5th International Conference on Renewable Energy Research and Applications, Bermigham, UK, 6–9 November 2016; Volume 12, pp. 20–23. [Google Scholar] [CrossRef]
  34. Quaschning, V.; Hanitsch, R. Numerical simulation of current-voltage characteristics of photovoltaic systems with shaded solar cells. Sol. Energy 1996, 56, 513–520. [Google Scholar] [CrossRef]
  35. Kumar, A.N.; Sameer, M.; Rasheed, M.M.; Balakrishna, A.; Venkat, S.N.; Manasa, V. A detailed modeling and simulation of photovoltaic module. In Proceedings of the 2020 International Conference on Smart Technologies in Computing, Electrical and Electronics (ICSTCEE), Bengaluru, India, 9–10 October 2020; pp. 39–43. [Google Scholar]
  36. Qi, C.; Ming, Z. Photovoltaic Module Simulink Model for a Stand-alone PV System. Phys. Procedia 2012, 24, 94–100. [Google Scholar] [CrossRef]
  37. Zainal, N.A.; Ajisman; Yusoff, A.R. Modelling of Photovoltaic Module Using Matlab Simulink. In IOP Conference Series: Materials Science and Engineering; IOP Publishing: Bristol, UK, 2016; Volume 114, p. 012137. [Google Scholar] [CrossRef]
  38. Sharma, C.; Jain, A. Solar Panel Mathematical Modeling Using Simulink. J. Eng. Res. Appl. 2014, 4, 67–72. [Google Scholar]
  39. Mayfield, R. Photovoltaic Installation and Design for Dummies; Wiley Publishing, Inc.: Hoboken, NJ, USA, 2010. [Google Scholar]
  40. Bun, L. Detection and Localization of Faults in a System Photovoltaic Fault Detection and Localization for a PV System, Electric Energy; University of Grenoble: Grenoble, French, 2012. [Google Scholar]
  41. Zbib, B.; Al Sheikh, H. Fault Detection and Diagnosis of Photovoltaic Systems through I-V Curve Analysis. In Proceedings of the 2020 International Conference on Electrical, Communication, and Computer Engineering (ICECCE), Istanbul, Turkey, 12–13 June 2020; pp. 1–6. [Google Scholar]
  42. Diab, A.A.Z.; Sultan, H.M.; Do, T.D.; Kamel, O.M.; Mossa, M.A. Coyote Optimization Algorithm for Parameters Estimation of Various Models of Solar Cells and PV Modules. IEEE Access 2020, 8, 111102–111140. [Google Scholar] [CrossRef]
  43. Easwarakhanthan, T.; Bottin, J.; Bouhouch, I.; Boutrit, C. Nonlinear Minimization Algorithm for Determining the Solar Cell Parameters with Microcomputers. Int. J. Sol. Energy 1986, 4, 1–12. [Google Scholar] [CrossRef]
  44. Ortiz-Conde, J.M.A.; Sánchez, F.J.G. New method to extract the model parameters of solar cells from the explicit analytic solutions of their illuminated I-V characteristics. Sol. Energy Mater. Sol. Cells 2006, 90, 352–361. [Google Scholar] [CrossRef]
  45. Chan, J.C.H.P.D.S.H.; Phillips, J.R. A comparative study of extraction methods for solar cell model parameters. Solid-State Electron. 1986, 29, 329–337. [Google Scholar] [CrossRef]
  46. Ćalasan, M.; Aleem, S.H.; Zobaa, A.F. On the root mean square error (RMSE) calculation for parameter estimation of photovoltaic models: A novel exact analytical solution based on lambert w function. Energy Convers. Manag. 2020, 210, 112716. [Google Scholar] [CrossRef]
  47. Orioli, A.; Di Gangi, A. A procedure to calculate the five-parameter model of crystalline silicon photovoltaic modules on the basis of the tabular performance data. Appl. Energy 2013, 102, 1160–1177. [Google Scholar] [CrossRef]
  48. Appelbaum, J.; Peled, A. Parameters extraction of solar cells-A comparative examination of three methods. Sol. Energy Mater. Sol. Cells 2014, 122, 64–173. [Google Scholar] [CrossRef]
  49. Oliva, D.; Elaziz, M.A.; Elsheikh, A.H.; Ewees, A.A. A review on meta-heuristics methods for estimating parameters of solar cells. J. Power Sources 2019, 435, 126683. [Google Scholar] [CrossRef]
  50. Ye, M.; Wang, X.; Xu, Y. Parameter extraction of solar cells using particle swarm optimization. J. Appl. Phys. 2009, 105, 094502. [Google Scholar] [CrossRef]
  51. El-Naggar, K.; AlRashidi, M.; AlHajri, M.; Al-Othman, A. Simulated Annealing algorithm for photovoltaic parameters identification. Sol. Energy 2012, 86, 266–274. [Google Scholar] [CrossRef]
  52. Ayodele, T.R.; Ogunjuyigbe, A.S.; Ekoh, E.E. Evaluation of numerical algorithms used in extracting the parameters of a singlediode photovoltaic model. Sustain. Energy Technol. Assess. 2016, 13, 51–59. [Google Scholar]
  53. Ram, J.P.; Babu, T.S.; Dragicevic, T.; Rajasekar, N. A new hybrid bee pollinator follower pollination algorithm for solar PV parameter estimation. Energy Convers. Manag. 2017, 135, 463–476. [Google Scholar] [CrossRef]
  54. Kumari, P.A.; Geethanjali, P. Adaptive genetic algorithm based multiobjective optimization for photovoltaic cell design parameter extraction. Energy Procedia 2017, 117, 432–441. [Google Scholar] [CrossRef]
  55. Merchaoui, M.; Sakly, A.; Mimouni, M.F. Particle swarm optimisation with adaptive mutation strategy for photovoltaic solar cell/module parameter extraction. Energy Convers. Manag. 2018, 175, 151–163. [Google Scholar] [CrossRef]
  56. García-Ródenas, R.; Linares, L.J.; López-Gómez, J.A. A memetic chaotic gravitational search algorithm for unconstrained global optimization problems. Appl. Soft Comput. 2019, 79, 14–29. [Google Scholar] [CrossRef]
  57. Ji, J.; Gao, S.; Wang, S.; Tang, Y.; Yu, H.; Todo, Y. Self-adaptive gravitational search algorithm with a modified chaotic local search. IEEE Access 2017, 5, 7881–17895. [Google Scholar] [CrossRef]
  58. Skvarenina, T.L. Handbook for Solar Photovoltaic Systems; Purdue University: West Lafayette, IN, USA, 2018. [Google Scholar]
  59. Skvarenina, T.L. The Power Electronics Handbook; Purdue University: West Lafayette, IN, USA, 2018. [Google Scholar]
  60. Erhard, N.; Holleitner, A. 13-Semiconductor nanowires studied by photocurrent spectroscopy. In Semiconductor Nanowires; Arbiol, J., Xiong, Q., Eds.; Woodhead Publishing: Sawston, UK, 2015; pp. 365–391. [Google Scholar] [CrossRef]
  61. Ruschel, C.S.; Gasparin, F.P.; Costa, E.R.; Krenzinger, A. Assessment of PV modules shunt resistance dependence on solar irradiance. Sol. Energy 2016, 133, 35–43. [Google Scholar] [CrossRef]
  62. Piliougine, M.; Spagnuolo, G.; Sidrach-De-Cardona, M. Series resistance temperature sensitivity in degraded mono–crystalline silicon modules. Renew. Energy 2020, 162, 677–684. [Google Scholar] [CrossRef]
  63. Kabbani, A.; Honnurvali, M.S. PV Cell Parameters Modeling and Temperature Effect Analysis. Int. J. Renew. Energy Dev. 2021, 10, 563–571. [Google Scholar] [CrossRef]
  64. Meyer, E.L. Extraction of Saturation Current and Ideality Factor from Measuring Voc and Isc of Photovoltaic Modules. Int. J. Photoenergy 2017, 2017, 8479487. [Google Scholar] [CrossRef]
  65. Sabadus, A.; Paulescu, M. Extraction of the diode saturation current and ideality factor from the PV module datasheet. AIP Conf. Proc. 2023, 2843, 40004. [Google Scholar] [CrossRef]
  66. Corporation, K. “Model kc130gt” Kyocera s Advanced Cell Processing Technology; Kyocera Corporation: Kyoto, Japan. Available online: http://www.kyocera.com (accessed on 2 February 2024).
  67. Allegro Microsystems, Fully Integrated, Hall-Effect-Based Linear Current Sensor IC with 2.1 kVRMS Voltage Isolation and a Low-Resistance Current Conductor. Rev. 22. February 2024. pp. 1–16. Available online: https://www.allegromicro.com/-/media/files/datasheets/acs712-datasheet.pdf (accessed on 2 February 2024).
  68. El Hammoumi, A.; Motahhir, S.; Chalh, A.; El Ghzizal, A.; Derouich, A. Low-cost virtual instrumentation of PV panel characteristics using Excel and Arduino in comparison with traditional instrumentation. Renew. Wind. Water Sol. 2018, 5, 3. [Google Scholar] [CrossRef]
  69. Green, M.A. Accuracy of analytical expressions for solar cell fill factors. Sol. Cells 1982, 7, 337–340. [Google Scholar] [CrossRef]
  70. Libra, M.; Petrik, T.; Poulek, V.; Tyukhov, I.I.; Kourim, P. Changes in the Efficiency of Photovoltaic Energy Conversion in Temperature Range With Extreme Limits. IEEE J. Photovolt. 2021, 11, 1479–1484. [Google Scholar] [CrossRef]
  71. Ahmed, T.; Goncalves, T.; Albino, A.; Rashel, M.R.; Veiga, A.; Tlemcani, M. Different parameters variation analysis of a PV cell. In Proceedings of the 2016 International Conference for Students on Applied Engineering (ICSAE), Newcastle Upon Tyne, UK, 20–21 October 2016; pp. 176–180. [Google Scholar]
  72. Muhammad, F.F.; Yahya, M.Y.; Hameed, S.S.; Aziz, F.; Sulaiman, K.; Rasheed, M.A.; Ahmad, Z. Employment of single-diode model to elucidate the variations in photovoltaic parameters under different electrical and thermal conditions. PLoS ONE 2017, 12, e0182925. [Google Scholar] [CrossRef]
  73. Islam, A.; Chowdhury, I.B. A simulink based generalized model of PV cell/array. In Proceedings of the 2014 3rd International Conference on the Developments in Renewable Energy Technology (ICDRET), Dhaka, Bangladesh, 29–31 May 2014; pp. 1–5. [Google Scholar]
  74. Qi, B.; Wang, J. Fill factor in organic solar cells. Phys. Chem. Chem. Phys. 2013, 15, 8972–8982. [Google Scholar] [CrossRef]
  75. Street, R.A.; Schoendorf, M.; Roy, A.; Lee, J.H. Interface state recombination in organic solar cells. Phys. Rev. B 2010, 81, 205307. [Google Scholar] [CrossRef]
  76. Jain, P.; Xu, J.-X.; Panda, S.K.; Poon, J.; Spanos, C.; Sanders, S.R. Fault diagnosis via PV panel-integrated power electronics. In Proceedings of the 2016 IEEE 17th Workshop on Control and Modeling for Power Electronics (COMPEL), Trondheim, Norway, 27–30 June 2016; pp. 1–6. [Google Scholar] [CrossRef]
  77. Baradieh, K.I.; Al-Hamouz, Z. Modelling and Simulation of Line Start Permanent Magnet Synchronous Motors with Broken Bars. J. Electr. Electron. Syst. 2018, 7, 2. [Google Scholar] [CrossRef]
  78. Baradieh, K.; Al-Hamouz, Z.; Abido, M. ANN Based Broken Rotor Bar Fault Detection in LSPMS Motors. J. Electr. Electron. Syst. 2018, 7, 2332–2796. [Google Scholar] [CrossRef]
  79. Nie, S.; Chen, Y.; Pei, X.; Wang, H.; Kang, Y. Fault diagnosis of a single-phase inverter using the magnetic field waveform near the output inductor. In Proceedings of the 2011 IEEE Applied Power Electronics Conference and Exposition (APEC 2011), Fort Worth, TX, USA, 6–11 March 2011; pp. 1648–1655. [Google Scholar] [CrossRef]
  80. Rakesh, N.; Banerjee, S.; Subramaniam, S.; Babu, N. A simplified method for fault detection and identification of mismatch modules and strings in a grid-tied solar photovoltaic system. Int. J. Emerg. Electr. Power Syst. 2020, 21, 20200001. [Google Scholar] [CrossRef]
  81. Alam, M.K.; Khan, F.; Johnson, J.; Flicker, J. A Comprehensive Review of Catastrophic Faults in PV Arrays: Types, Detection, and Mitigation Techniques. IEEE J. Photovolt. 2015, 5, 982–997. [Google Scholar] [CrossRef]
  82. Detection, F.; In, P.; Photovoltaic, S.; Presented, A.D. Protection in Solar Photovoltaic Arrays Acknowledgments. 2015. Available online: https://repository.library.northeastern.edu/downloads/neu:m039kr12f?datastream_id=content (accessed on 18 September 2023).
  83. Badr, M.M.; Hamad, M.S.; Abdel-Khalik, A.S.; Hamdy, R.A.; Ahmed, S.; Hamdan, E. Fault Identification of Photovoltaic Array Based on Machine Learning Classifiers. IEEE Access 2021, 9, 159113–159132. [Google Scholar] [CrossRef]
  84. Wang, G.; Youn, C.C.; Stankovic, A.M. DC-side high impedance ground fault detection for transformerless single-phase PV systems. In Proceedings of the 2015 North American Power Symposium (NAPS), Charlotte, NC, USA, 4–6 October 2015; pp. 1–6. [Google Scholar]
  85. Chine, W.; Mellit, A.; Pavan, A.M.; Lughi, V. Fault diagnosis in photovoltaic arrays. In Proceedings of the 2015 International Conference on Clean Electrical Power (ICCEP), Taormina, Italy, 16–18 June 2015; pp. 67–72. [Google Scholar]
  86. Restrepo-Cuestas, B.J.; Durango-Flórez, M.; Trejos-Grisales, L.A.; Ramos-Paja, C.A. Analysis of Electrical Models for Photovoltaic Cells under Uniform and Partial Shading Conditions. Computation 2022, 10, 111. [Google Scholar] [CrossRef]
  87. Khalil, I.U.; Ul-Haq, A.; Mahmoud, Y.; Jalal, M.; Aamir, M.; Ahsan, M.U.; Mehmood, K. Comparative Analysis of Photovoltaic Faults and Performance Evaluation of its Detection Techniques. IEEE Access 2020, 8, 26676–26700. [Google Scholar] [CrossRef]
  88. Grisales, L.A.T.; Ramos-Paja, A.J.S.-M.C.A. Fault Detection and Performance Analysis of Photovoltaic Installations. Tecnura 2016, 20, 171–184. Available online: http://eprints.hud.ac.uk/id/eprint/34576/ (accessed on 11 April 2024).
  89. Grisales, L.A.T.; Ramos-Paja, A.J.S.-M.C.A. Techniques for modeling photovoltaic systems under partial shading. Tecnura 2016, 20, 171–184. [Google Scholar]
  90. Kim, K.A.; Seo, G.-S.; Cho, B.-H.; Krein, P.T. Photovoltaic Hot-Spot Detection for Solar Panel Substrings Using AC Parameter Characterization. IEEE Trans. Power Electron. 2015, 31, 1121–1130. [Google Scholar] [CrossRef]
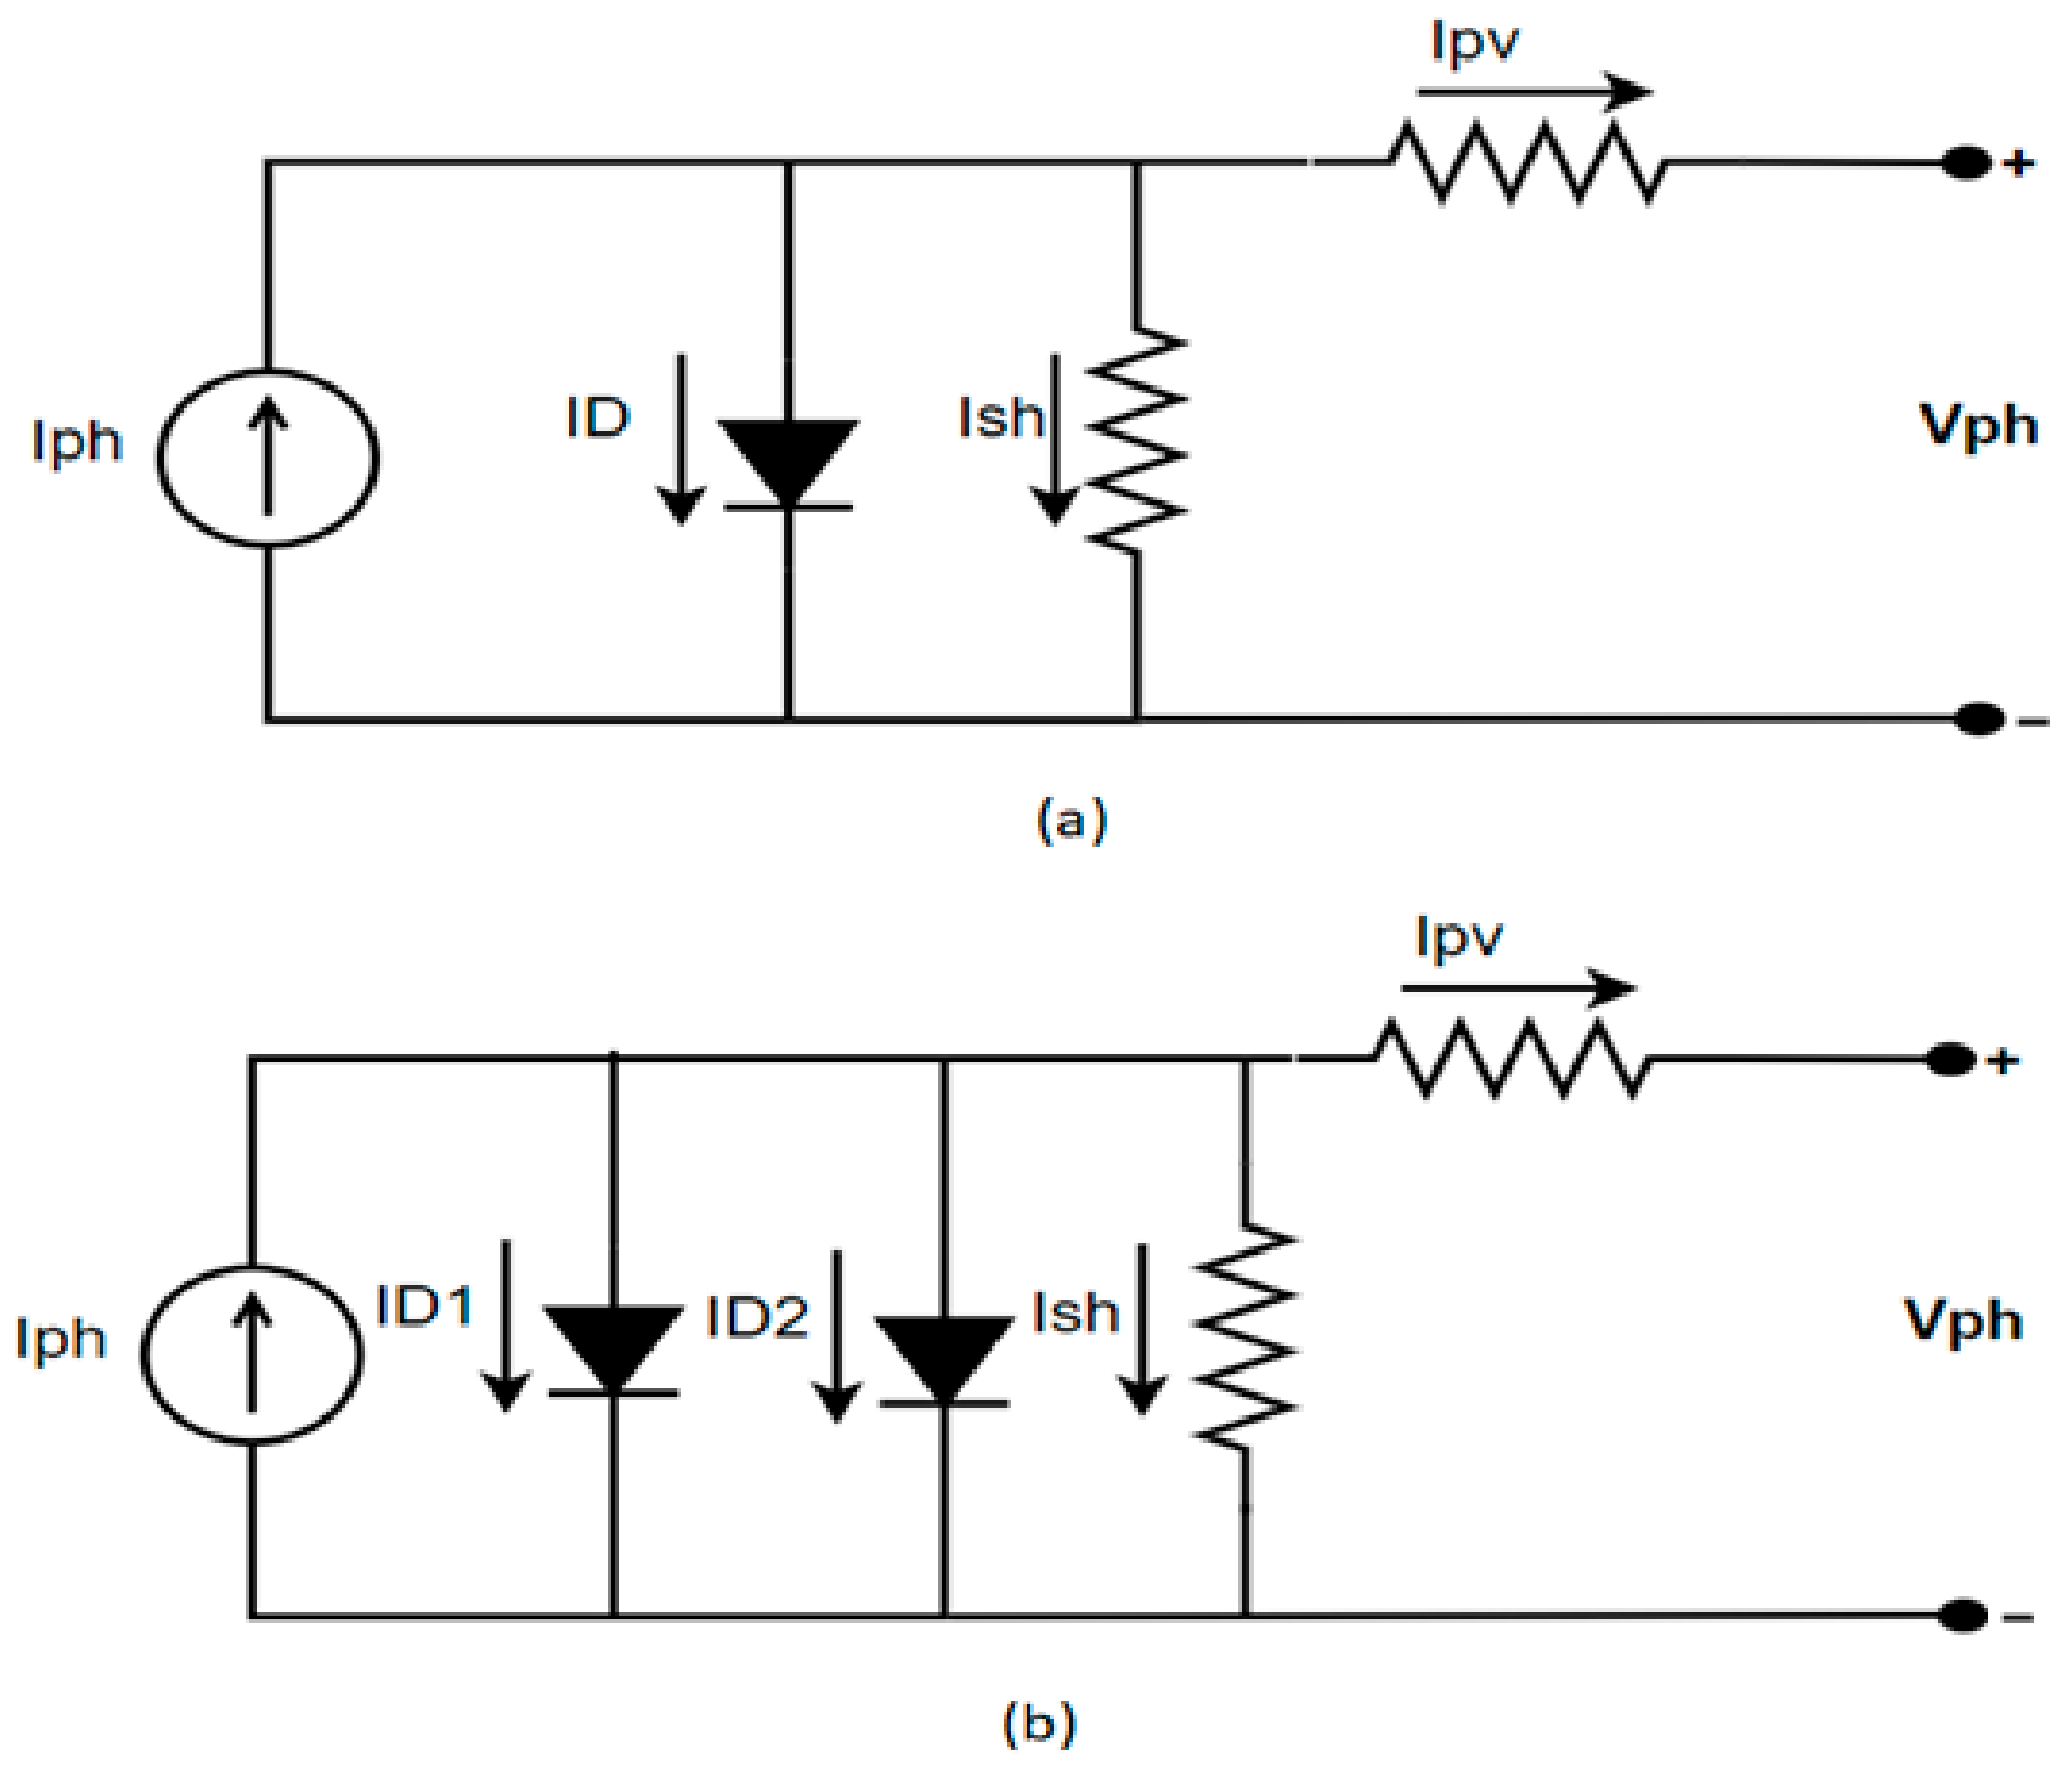
Figure 1. Electrical representation of the PV cell: (a) single-diode model, (b) double-diode model.
Inventions 09 00093 g001
Figure 2. The I-V curve of the module (KC130GT) using the extracted parameters under different irradiance levels.
Inventions 09 00093 g002
Figure 3. The P-V curve of the module (KC130GT) using the extracted parameters under different irradiance levels.
Inventions 09 00093 g003
Figure 4. The reference I-V curve from the (KC130GT) datasheet.
Inventions 09 00093 g004
Figure 5. Experimental setup.
Inventions 09 00093 g005
Figure 6. A 100 kΩ resistor connected in series with the voltage sensor module.
Inventions 09 00093 g006
Figure 7. The block diagram of the hardware prototype.
Inventions 09 00093 g007
Figure 8. A comparison between the simulation and experimental I-V curves of KC130GT at STC.
Inventions 09 00093 g008
Figure 9. A comparison between the simulation and experimental P-V curves of KC130GT at STC.
Inventions 09 00093 g009
Figure 10. Fill factor of a PV device representation (KC130GT).
Inventions 09 00093 g010
Figure 11. The effect of the irradiance level on the IV and PV curves.
Inventions 09 00093 g011
Figure 12. The effect of the irradiance level on the open circuit voltage (logarithmic scale).
Inventions 09 00093 g012
Figure 13. The effect of the irradiance level on the efficiency and FF of the PV module.
Inventions 09 00093 g013
Figure 14. The effect of the irradiance level on the ideality factor.
Inventions 09 00093 g014
Figure 15. The effect of the irradiance level on the series and shunt resistances.
Inventions 09 00093 g015
Figure 16. The effect of the temperature variation in the IV and PV curves of the PV module KC130GT.
Inventions 09 00093 g016
Figure 17. The effect of the temperature variation on the open circuit voltage and short circuit current of the PV module KC130GT.
Inventions 09 00093 g017
Figure 18. The effect of the temperature variation in the fill factor and efficiency of the PV module KC130GT.
Inventions 09 00093 g018
Figure 19. The effect of the variation in series resistance on the current and power curves of the PV module (KC130GT).
Inventions 09 00093 g019
Figure 20. The effect of the variation in series resistance on the PV module FF and efficiency.
Inventions 09 00093 g020
Figure 21. The effect of the variation in shunt resistance on the I-V and P-V curves of the photovoltaic module.
Inventions 09 00093 g021
Figure 22. The effect of the variation in reverse saturation current on the I-V and P-V curves of the photovoltaic module.
Inventions 09 00093 g022
Figure 23. The effect of the temperature variation on the diode’s reverse saturation current.
Inventions 09 00093 g023
Figure 24. The impact of the change in the ideality factor on the I-V and P-V characteristics of the PV module (KC130GT).
Inventions 09 00093 g024
Figure 25. The relationship between the irradiance level and the ideality factor.
Inventions 09 00093 g025
Figure 26. Fault types in the PV system.
Inventions 09 00093 g026
Figure 27. The effect of the LL fault resistance on the I-V curve of the PV array with no blocking diodes at STC.
Inventions 09 00093 g027
Figure 28. The effect of the LL fault resistance on the I-V curve of the PV array with blocking diodes at STC.
Inventions 09 00093 g028
Figure 29. I-V curve of the PV array under lower and upper ground fault.
Inventions 09 00093 g029
Figure 30. The upper ground fault at different resistance levels in the presence of blocking diodes.
Inventions 09 00093 g030
Figure 31. The PV curve of the PV array under different shading scenarios.
Inventions 09 00093 g031
Table 1. PV module equations parameters.
ParameterDescriptionUnit
IphPhotocurrentA
IdDiode currentA
IshShunt currentA
IoReverse saturation currentA
VdDiode voltageV
GSolar irradiation under a given conditionW/m2
GrefIllumination reference (1000 W/m2)W/m2
TcellTemperature of the cell(°K)
TrefReference temperature(°K)
KIShort circuit current temperature coefficient(A/°K)
KvOpen circuit temperature coefficient(V/°K)
aThe ideality factor of the diode-
RsSeries resistanceΩ
RshShunt resistanceΩ
VtThermal voltage = K T c e l l q V
KBoltzmann’s constant = 1.38 × 10 23 J/K
qElectron Charge = 1.6 × 10 19 C
Table 2. The electrical characteristics of the PV module (KC130GT).
Parameter under STCValue
Maximum power (Pmax)130 W
Voltage at maximum power point (Vmp)17.6 V
Current at maximum power point (Imp)7.39 A
Open-circuit voltage (Voc)21.9 V
Short-circuit current (Isc)8.02 A
Temperature coefficient of Voc−8.21 × 10⁻² V/°C
Temperature coefficient of Isc3.18 × 10−3 A/°C
Ns36
Table 3. The extracted parameters for the PV module (KC130GT).
ParameterEstimated Value
d I d V ( a t   s h o r t   c i r c u i t   c o n d i t i o n ) −0.021 A/V
d I d V ( a t   o p e n   c i r c u i t   c o n d i t i o n ) −0.2291 A/V
Iph8.02 A
Io1.648 × 10−16 A
Rsh47.619 Ω
Rs0.212 Ω
α1.436
Table 4. The parameters of the PV module (KC130GT) under the effect of the irradiation intensity.
Irradiance (W/m2)Isc (A)Voc (V)Pmp (W)FF
10008.0221.9130.0710.741
8006.41620.966103.8910.7726
6004.81220.79476.9380.767
4003.20820.54449.3140.748
2001.60420.20521.2740.656
Disclaimer/Publisher’s Note: The statements, opinions and data contained in all publications are solely those of the individual author(s) and contributor(s) and not of MDPI and/or the editor(s). MDPI and/or the editor(s) disclaim responsibility for any injury to people or property resulting from any ideas, methods, instructions or products referred to in the content.