Article

Improvement of Fault Current Calculation and Static Security Risk for Droop Control of the Inverter-Interfaced DG of Grid-Connected and Isolated Microgrids

1
Ural Power Engineering Institute, Ural Federal University Yekaterinburg, Ekaterinburg 620075, Russia
2
Electrical Engineering Department, Assiut University, Assiut 71515, Egypt
3
Electrical Engineering Department, Faculty of Engineering, Minia University, Minia 61111, Egypt
4
Electrical Department, Dong Nai Technical College, Bien Hoa 810000, Vietnam
5
Electrical and Electronics Department, Lac Hong University, Bien Hoa 810000, Vietnam
*
Authors to whom correspondence should be addressed.
Inventions 2022, 7(3), 52; https://doi.org/10.3390/inventions7030052
Submission received: 29 May 2022 / Revised: 17 June 2022 / Accepted: 27 June 2022 / Published: 29 June 2022
(This article belongs to the Special Issue Microgrids: Protection, Cyber Physical Issues, and Control)

Abstract

:
The contribution current of an inverter-interfaced distributed generator unit during a fault is one of the significant challenges for two modes: grid-connected and isolated AC microgrid. For this challenge, this article is aimed to study two methods of fault current calculation for two modes: grid-connected and isolated microgrids. These methods include a virtual equivalent impedance and a proposed method. The proposed method is a new technique for calculating the fault current contribution depending on the droop control of inverter-interfaced DG. The proposed method can control the contribution short-circuit current of DG within its limit (2 p.u.) where it is dependent on the voltage value of the DG bus to calculate the short circuit current of DG by using the control criterion. Static security risk and load shedding are calculated after fault clearance using an operation scenario in which the distribution system will be divided into small subsystems and is then grid-connected and isolated due to the removal of the faulted bus by protection devices. The proposed technique is applied to a standard IEEE 33-bus distribution network with five DGs. The results show that the contribution current of inverter-interfaced DG during the fault has more effects than the fault current of the nearest faulted bus to the DG bus. The proposed technique improves the calculated fault current value by about 30% for the grid-connected microgrid and by about 50% for the isolated microgrid from its value of the virtual impedance method. The static security risk is improved after load shedding. The static security risk improved by about 0.025%.

1. Introduction

1.1. Motivation

Over the past decades, the electric power industry has undertaken significant differences in response to growing concerns about global weather change and the volatility of fossil fuel prices. To produce more efficient, reliable and ecologically friendly energy, the expansion of the use of DGs is of great importance. This movement has developed into the theory of a “microgrid”, which can be explained as a set of distributed energy resources and energy storage systems controlled by an efficient energy management system. A microgrid (MG) can operate in both grid-connected and standalone modes. Island MGs are considered a great solution for some applications where the main network connection is absurd or weak. AC MGs are very popular due to their ease of modelling, simple design and efficient operation.
A faulted DG bus makes the equivalent circuit of the entire system look different from a conventional power system. The DG source can be considered a voltage source or a current source in the sequence network depending on the faulty control system and the relative model of inverter-interfaced DG. The analyses of fault characteristics of DGs with different control schemes and comparisons are discussed in detail in the literature. Both current control and voltage control schemes are discussed in [1,2,3,4,5].

1.2. Related Work

Various methods have been acquainted with controlling islanded MGs. In general, droop control is a ward control that shares the active and reactive powers of DGs. Virtual equivalent impedance is used to improve the exhibition of droop control. The adaptive virtual equivalent impedance is employed to enhance traditional virtual equivalent impedance procedures. The estimation of virtual equivalent impedance is not consistent in the adaptive virtual equivalent impedance system and fluctuates at any moment in a manner that expels impedance imbalance between various DGs. The control innovation of MG is key to the operation of the system. Developed control innovations can improve the adaptability of microgrid activity and improve control quality. The issue of fault current computation in a power system with inverter-based DG is underlined by the fault ride-through prerequisite declared in grid codes.
In [1,2], two model-based fault-tolerant control strategies for a diesel engine generator functioning as the main generating unit in an islanded MG comprising a hybrid wind–diesel–PV system with a battery storage system based on the master–slave strategy were proposed. In [3], a new algorithm for calculating the short-circuit current of a droop-controlled DG was presented. Simulation results based on PSCAD/EMTDC and calculation results based on Matlab/Simulink confirm the correctness of the proposed fault models. A simplified and automated approach for calculating short-circuit currents for grid-connected AC MG has been explored for the fast and accurate calculation of the short-circuit current contribution from IBDGs and RBDGs, which was discussed in [4]. The current limiting strategy, which can be implemented in various frames of reference, has been studied in [5]. As a special case, wind and PV generators’ short circuit current contribution was investigated, and recommendations are provided for the island mode of microgrid operation.
An improved control system provides suitable power-sharing and reduces the flowing current while the voltage drop over the output impedance of DGs is remunerated by utilizing adaptive virtual equivalent impedance [6]. An idea titled ‘virtual equivalent impedance’ is acquainted with executing the droop control for microgrids. By this strategy, the proportional impedance of the inverter, just as the complete corresponding impedance of the system, is with the inductive characteristic, which meets the prerequisites for the execution of P-f and Q-V control procedures [7]. Enhancing the efficiency of DG units by increasing power-sharing using an improved droop control technique, which depends on virtual equivalent impedance, is examined in [8]. Virtual equivalent impedance, angle and frequency droop control are significant in keeping up the system’s stability and power-sharing between DGs in MG. In MG, voltage/frequency stability and precise power-sharing are substantial undertakings. The virtual equivalent impedance strategy is acquainted early with shape-wanted output impedances in uninterruptible power frameworks. The traditional P-ω frequency droop control is right off the bat suggested to accomplish power-sharing control in parallel inverters without correspondence with joining frequency droop, and the virtual equivalent inductance technique, an adjusted proportional–derivative type of P-ω frequency droop control is acquired for improving transient stability [9].
A virtual arrangement impedance imitates the control methodology for current-controlled standalone PV or wind ranches to upgrade the power moveability of the transmission line [10]. This methodology can be viewed as incorporating the elements of the Realities gadgets, for example, arrangement capacitors, into the lattice side converters of PV or wind ranches by using the receptive power ability of the converters. Power stream count and short-out estimation are the premises of hypothetical research for circulation coordinated with inverter-based appropriated age. A coordinated power stream and short-out estimation technique for appropriation connected with inverter-based circulated age is proposed in [11].
An inverter-based DG equivalent model for a distributed system’s static and error operating states was investigated, and the difference between power flow and short circuit calculation was also investigated. In [12], the implementation of an extended power flow for DGs controlled by droop control of active and reactive power functions and virtual impedances in a low voltage (LV) microgrid was studied. The study provides an idea of the virtual equivalent impedance parameters and the higher accuracy of the reactive power flow calculation. To improve the system’s stability and prevent power coupling, the virtual equivalent impedances can be set between the converter’s outputs and the main network [13]. A robust virtual equivalent impedance implementation method is demonstrated to mitigate voltage distortion problems caused by load harmonics instead of physical impedance effects. In addition, the idea of adaptive virtual equivalent impedance aims to improve power control performance under transient faults of the network [13]. A virtual equivalent impedance-based short-circuit current limiter is shown for isolated MG consisting of many inverter-interfaced DGs [14]. Virtual equivalent impedance-based short-circuit current features an adaptive, low-cost implementation and suppresses short-circuit current fluctuations during faulted AC MG recovery. Concerning the usefulness of DGs, the protection methods for MGs are more complex than for passive distribution networks.
DGs can lead to the stoppage of operation or deliberate operation of protective devices under emergency conditions. The inertia of inverter-based DGs is opposed to rotary DGs, such as small hydro generators, diesel generators, etc., and the fault current limits are reduced due to the inverter’s rated power. Various methodologies have been presented to improve the protection schemes of MGs. Virtual equivalent impedance-based short circuit current limiter is designed to suppress short circuit current in AC MGs. An approach to calculating the fault current is shown depending on the estimate of the virtual equivalent impedances of inverter-interfaced DGs in the MG [15].
The accurate assessment of the short circuit current in grid-connected and isolated MGs with different types of loads (dynamic or static) using three detection strategies (the traditional method based on the representation of the power system by the source voltage and Thevenin impedance, the IEC standard and rectification coefficients strategy for calculating and the virtual equivalent impedance method) has been studied in [16]. The algorithm for calculating the fault current for such a network is described in [17]. The algorithm corrects the traditional short circuit calculation technique using power flow-based calculation. As a method of equivalent voltage source at the fault site, an approach is used to calculate short-circuit currents in electrical distribution networks [18,19]. The IEC 60909 specification applies, according to which an equivalent voltage source replaces the fault.
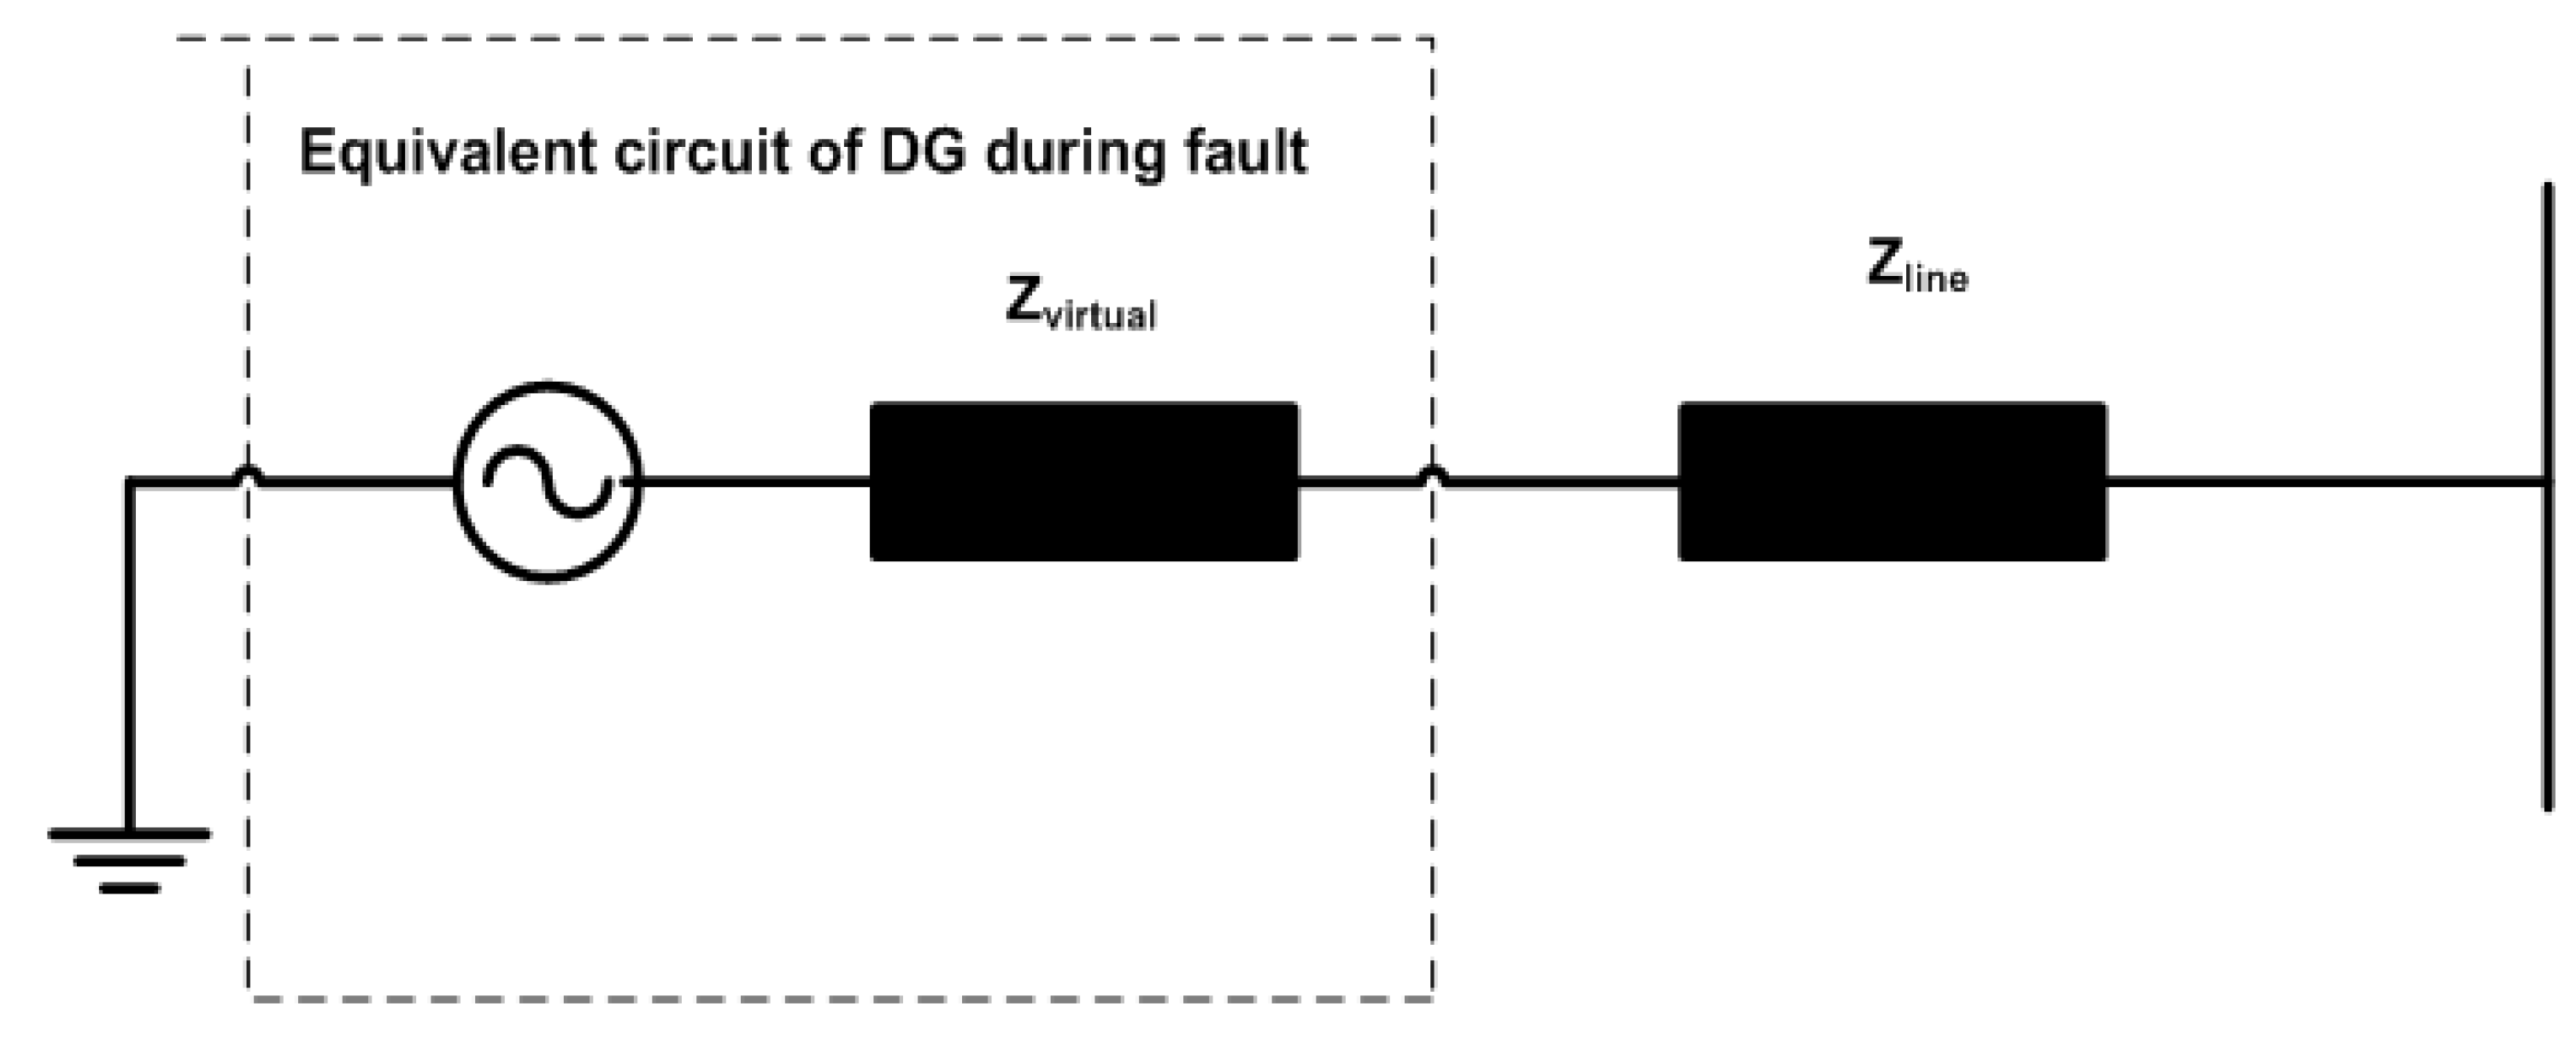
From the studies presented above, the equivalent model of an inverter-based generator handles well when calculating the power flow. The current specific situation with inverter DGs was not considered. At the same time, the inverter-interfaced DG could be modeled as the current source, which has already been mentioned in some studies. However, the models of current sources proposed in these works are ideal for a simplified analysis of the organization of current release. Thus, many research studies have been investigated the model of DG during the fault but the short-circuit current contribution of DG cannot controlled within the inverter current limit of 2 p.u.
The method for assessing the probability of risk in the power supply is due to faults of the system’s protection relay, which considers the probability of a malfunction in relay protection systems. The availability and suitability of the risk assessment method for the protection relay of systems were tested on two models studied in [20]. Power systems can be affected by unforeseen and unavoidable faults and failures, making safety assessment a serious issue that requires significant research work [21]. A probabilistic risk assessment of the types and cases of deterioration in power quality that may arise due to the high integration of photovoltaic generation in the low voltage distribution network is performed in [22]. Ref. [23] investigated a static security study to select a post-shutdown plan and load-shedding strategy to achieve the energy balance of subsystems.

1.3. Contributions

To decrease short circuit current calculations problems of grid-connected and isolated MGs, this article aims to calculate the short circuit current for grid-connected and isolated MGs by virtual equivalent impedance and a suggested method. The proposed method for calculating the contribution of the short-circuit current of a controlled DG is used to analyze the equivalent model of an inverter-interfaced DG. There are three cases of calculating this contribution of the DG to the short circuit current depending on the voltage of the DG bus. Inverter control limits its current to the 2 p.u. inverter rating. Accordingly, this study contributes the following to the literature:
  • Power flow is investigated on the IEEE 33-bus with five DGs distribution system using a modified Newton–Raphson program for the grid-connected system while the Trust–Newton–Raphson program for the IEEE 33-bus with five DGs isolated systems is used;
  • Developing the proposed method for calculating the contribution of the short-circuit current of a controlled DG according to the equivalent model of an inverter-interfaced DG;
  • The simulation was carried out by observing the test system’s bus voltages and short-circuit currents through various DGs locations;
  • A fair comparison of short circuit current contribution of DG using virtual equivalent impedance and the proposed method;
  • Calculating the static security risks and load-shedding during various fault locations using a scenario in which the distribution system will be divided into grid-connected and isolated small subsystems. This scenario shows that the system protection relays will disable the faulted bus.

2. Research Method

2.1. Power Flow Calculation

2.1.1. Power Flow of Grid-Connected Microgrid

The inverter-interfaced DG control is the main component of its characteristics output for different controls; the model of DG of power flow program is different from conventional synchronous generators. The first model of DG is PQ model. This is used for constant power control. While the second model of DG is PV model for constant voltage control. In the second model, the reactive power of DG is limited by inverter rating. For the abovementioned method, there are two models of DG: PV model and PQ model. These models are employed with traditional power flow techniques such as back/forward sweep or Newton–Raphson methods. In this paper, the modified Newton–Raphson method is used to analyze the power flow for the grid-connected system while the Trust Newton–Raphson program is used for isolated systems.
The modified Newton–Raphson method is used to solve energy flow microgrids by combining DG descent control with the traditional Newton–Raphson method. In order to find the voltage angle and magnitude of a droop bus at the (i + 1) iteration, the active and reactive powers of the droop buses need to be calculated and added to the mismatch matrix by the droop control active and reactive power equations. If the active and reactive powers of the droop bus exceed their limits, the active or reactive power is set to its rated value of inverter-interfaced DG. The active power of inverter-interfaced DG depends on the system’s frequency. For that, all the inverter-interfaced DGs in the microgrid will feed active power at the same angular frequency. The Newton–Trust domain method is a simple and effective tool for solving systems of nonlinear equations and optimization problems on a large scale. It was originally designed to solve unbounded optimization problems. These methods behave similarly to Newton–Raphson algorithms, which are characterized by quadratic convergence. They also have the advantage of providing a solution whenever it is found.

2.1.2. Power Flow of Isolated Microgrid

The absence of a slack bus in isolated MG makes its power flow different from that of grid-connected MG. The DGs operate primarily in droop mode against the backdrop of isolated MG mode. The droop control technique of DG is, to a large extent, an excellent alternative to on-load power to be shared between different generating sets since, in a scaling strategy, the distribution of power is linked to the power rating of the DG sets. The configuration of the droop control parameters of DGs should be chosen so that the loads have participated in the extent of their ratings. The formulas of attributes control DGs’ shared active and reactive power P–f droop Q–V separately. DGs work largely in the (P–Q) or (P–V) mode for grid-connected MG. Newton–Raphson computation is the best method for tackling nonlinear problems in the power flow problems. Modified Newton–Raphson technique [24] or the Newton–Trust region approach [25] has been applied to solve the power flow of isolated MG. This paper solves the power flow of islanded MG by the Newton–Trust region procedure. The three-phase active and reactive power of droop control inverter-interfaced DG operating can be stated in the power flow formula as follows:
P DG = 1 m p ( ω * ω ) Q DG = 1 n p ( V DG * V DG )
where P DG and Q DG are active and reactive power level of DG, ω * and ω are the nominal and operating frequency level of the system, V DG * and V DG are the nominal and operating voltage of DG, and m p and n p are the active power static droop gain and the reactive power static droop gain.
A current limiter usually provides the DGs to restrict the output current of DG to its active and reactive rate P max and   Q max .

2.2. Fault Current Calculation

Short-circuit current estimates must often be supplied on the substation’s secondary rails regardless of the DG connection configuration (connection to an active feeder or directly to the rails via a dedicated line). Irrespective of the short circuit current level, it is the sum of the maximum phase fault currents from the upstream network through the step-down transformer. Various generating units (and maybe motors) are interconnected to the distribution system. The short circuit current value for grid-connected and isolated MGs is calculated using the virtual equivalent impedance and the proposed methodology. The proposed method improves the method for calculating the short circuit current by employing the influence of the droop control inverter-interfaced DG. Ref [11] explains this paradigm in detail.

2.2.1. Virtual Impedance Method

At the faulted bus, the short circuit current contribution of DG is very high, but the control of the inverter restricts this current value to 2 p.u. Each inverter is provided with a variable virtual impedance that limits the short circuit current contribution up to 2 p.u. When the fault location changes, the virtual equivalent impedance value changes to keep the short-circuit current contribution within 2 p.u. The following algorithm was used to tackle this problem [16].
Each inverter is replaced by a virtual equivalent impedance.
The virtual inverter impedance R/X ratio is considered the same as the R/X ratio of the transmission line to which the inverter is attached.
Calculate each inverter’s short circuit current contribution when a three-phase fault arises.
Change the virtual equivalent impedance of the inverter.
Recalculate the short circuit current contribution of each inverter. If it is more than 2 p.u of the rating current of inverter rating, the virtual equivalent impedance changes to a limit current at 2 p.u. The equivalent circuit of DG during a fault is depicted in Figure 1.

2.2.2. The Proposed Method

  • Calculate the Power flow of IEEE 33 bus with 5 DGs (Figure 2) by the Newton–Trust region program.
  • By using the estimated data from step 1, compute short circuit currents of feeders and bus voltages during a fault using the algorithm in Figure 3.
  • From the flow chart, we have the following:
    (a)
    Assume that the pre-fault bus voltage is identical to the calculated voltage in step 1 (V = Vm) and short-circuit currents adjusted by zero values; then, construct system impedance matrix Zbus. Then, knowing the bus number nf and impedance Zf of the faulted bus, calculate the faulted buses by adjusting all voltage sources to be equal to the zero value; the pre-fault value of faulted bus is – V f and the short-circuit current of the faulted bus– I f by the following nodal voltage equation is calculated as follows:
    [ Y 11 Y n 1 Y 1 n Y nn ] [ V 1 V f V n ] = [ 0 I f 0 ]
    where V 1 , ………, V n are the variation of buses voltages due to the short circuit current I f . The nodal voltage equation is expressed by using system bus impedance:
    [ V 1 V f V n ] = [ Z 11 Z n 1 Z 1 n Z nn ] [ 0 I f 0 ]
    where Z bus = Y bus 1 .
Calculate the change of bus impedance by adding the influence of grounding impedance ( z f ):
Y iif = Y iinf + 1 z f
where Y iif and Y iinf are the self-admittance of faulted bus i of post-fault and pre-fault admittances.
Estimate buses voltages during the fault by using the follow:
At faulted bus:
V f = I f Z ff
Other buses:
V fk = V fk 0 ( 1 Z kn Z nn )
Determine the short circuit current of the feeder, which is connected between n and k buses.
I fnk = V fn V fk Z nk
The contribution of short circuit current of inverter-interfaced DG is calculated using three cases depending on the bus voltage of DG by analyzing the comparable model of droop control inverter-interfaced DG.
(1)
Case 1 is a normal condition of DG for V DG 0.9   p . u , and DG keeps active withreactive power control at constant values. The contribution current is determined by the following:
I d = P DG V DG ,   I q = Q DG V DG
where V DG is the bus voltage of DG, and P DG   and   Q DG are the active power and reactive power outputs of DG, respectively.
(2)
Case 2 is starting reactive power control of DG for 0.4   p . u   < V DG < 0.9   p . u , DG. The contribution currentus estimated by the following:
I d = P DG V DG ,   I q = k ( 1 V DG ) I n
where I n is the p.u nominal current of inverter-interfaced DG, and k is the constant voltage coefficient of reactive power current output of DG; it is about 2.
If
I d 2 + I q 2 > ( I DGmax ) 2 | I DG | = I DGmax ,   θ = tan 1 I q I DGmax
(3)
Case 3 is only reactive power control of DG for V DG 0.4   p . u . The contribution current is calculated by the following:
I d = 0 ,   I q = I max
The total contribution short-circuit current of DG is as follows:
I DG = I d + jI q
The calculated short circuit current at faulted bus r is I fr :
I fr = k N I frk
where I frk is the short circuit current of feeder linked between r and k buses and N is the number of feederslinked to bus r.
(b)
Repeat voltage and current steps by calculating to assure accuracy (10−4).
4.
For other DG locations, calculate all previous steps from step 1 to step 4.

2.3. Operation Scenario of the Distribution System during the Fault

Due to utilizing the three-phase to ground fault in the distribution system, the short circuit current is very high. For that, the protection device of the system will disconnect the faulted bus. The distribution system will divide into small subsystems for the faulted bus that is grid-connected and isolated. For example, when the fault occurs on bus #3, The protection device will disconnect faulted bus #3. The distribution system will divide into three subsystems, as shown in Figure 4.

2.4. Static Security Risk

The static security risk index (R) in research involves the loss load risk index ( L / r j ) , nodal limiting violation risk index R ( V / r j ) and frequency limiting violation risk index R ( f / r j ) .
The static security risk R ( r j ) of the system can be attained by the following:
R ( r j ) = L R ( L r j ) + V R ( V r j ) + f R ( f r j ) = L P r ( r j ) S sev ( L r j ) + V P r ( r j ) S sev ( V r j ) + f P r ( r j ) S sev ( f / r j )  
where S sev ( L / r j ) , S sev ( V / r j ) and S sev ( f / r j ) are the severity of loss load, node voltage limiting violation and frequency limiting violation under outage r j , respectively, and L , V and f are their comparable weight values, respectively. The likelihood of the jth component failing is P r ( r j ) .
The severity of the fault can be obtained by the following [23].
S sev ( C / r j ) = S sev ( x c ) = e x c 1
The loss value of loss load x L is attained by the following:
x L = h = 1 N FL P FLh y = 1 N ZL P ZLy
where N FL , N ZL , P FLh and P ZLy are the total number of loss load, the total number of load, the active loss power of the hth and the active power of the yth load point, respectively.
The nodal voltage limit violation loss value x V is obtained with the following:
x V = { V min V i                                                     0 V i V min 0                                                                   V min V i V max V i V max V i > V max
where V i is the voltage level of node i, and V max and V min are superior and lesser bands of voltage, respectively.
The frequency limiting violation loss value x f is obtained by the following:
x f = { f min f                                                     0 f f min 0                                                                   f min f f max f f max                                                                     f > f max
where f   is the frequency of the system, and f max and f min are the superior and lesser bandsof the set steady-state frequency, respectively.

2.5. Load Shedding Strategy

To assess load shedding, compare the entire output of the DG of system or islanded DGs subsystem to the total active power of the load.
If P DGZ P LZ ( 1 + σ ) and P DGZ P DGZmax , there is no load shedding. However, there are two techniques for calculating the load-shedding value P Lsh .
  • Compare the output of DGs with the overall active power of the demanded load. In this case, the load flow program does not have any results where the values of voltages, currents, and power of buses are not convergent:
    P D G Z < P L Z ( 1 + σ )
    P L a f t e r s h = P D G Z ( 1 + σ )
    P L s h = P L z P L a f t e r s h
    where P DGZ , P LZ and P Laftersh are the overall active output of the DGs, the active power of the load in the system or subsystem of islanded DGs and the full active power of the load after shedding, respectively, and   σ is the net loss coefficient.
  • Compare the output of DGs with a maximum output of DGs. In this case, the load flow program has results but the values of voltages are small and the output of power of DG is greater than its limit:
    P D G Z > P D G Z m a x
    P Laftersh = P DGZ P DGZmax
    where P DGZ , P DGZmax and P Laftersh are the overall active power output of the DGs, the total maximum active output of the DGs and the entire active power of the load after shedding, respectively, and σ is the net loss coefficient.

3. Results and Analysis

Figure 2 shows a three-phase fault in the IEEE 33-bus with a five DG distribution scheme. The study examines the short circuit current computation on the IEEE 33-bus distribution system, which has a rated voltage of 12.6 kV. Buses 8, 12, 22, 25, and 29 are interconnected to the same inverter-interfaced DGs. The virtual equivalent impedance is used to compute the short circuit current. Table 1 exhibits the proposed approach for grid-connected and islanded MGs for four distinct locations of five DGs. One MVA and 12.6 kV are the base power and voltage.

3.1. Grid-Connected Microgrid

On bus No. 8, a three-phase-to-ground fault is introduced to the IEEE 33-bus with a five DGs distribution system (see Figure 2). The short circuit current at bus No. 8 is estimated using virtual equivalent impedance and the proposed methodologies. The short circuit current value at bus No. 8 is depicted in Table 2 for four different cases. The output short circuit current levels of DG buses during the fault are indicated in Table 3 using two techniques.
As demonstrated in Table 2, in Case 1, the greatest value of the short circuit current is 72.90 p.u for the virtual equivalent impedance technique and 42.80 p.u for the suggested method, as shown in Table 2, when compared to other examples when all DGs linked to corresponding feeders (bus #6-bus #18) closed to a fault. When all DGs connected to the buses are far from the fault, the lowest short circuit current value is 47.71 p.u for the virtual equivalent impedance technique and 32.56 p.u for the suggested method in case 2. According to the results in Table 3, the short circuit current contribution of DG can be limited to up to 2 p.u using the proposed method, which is better than the virtual equivalent impedance method. The maximum value of this current is 13.5 p.u for virtual equivalent impedance when the fault occurs at bus 8 near DG while its maximum value is 2 p.u for the proposed method.
A three-phase to ground fault is applied to all buses. To calculate the fault current value in all buses using virtual equivalent impedance and proposed methods. Figure 5 shows the fault current value in all buses using virtual equivalent impedance and proposed methods. The current fault level computed using the proposed technique is lessthan the value obtained through the virtual equivalent impedance approach, as illustrated in Figure 5. For two different methods, fault current values are greater at buses adjoining the main grid; for the suggested technique, fault current values are 119 p.u at bus #1, 110 p.u at bus #2, 109.5 p.u at bus #19, and 73.2 p.u at bus #23; for the virtual equivalent impedance method, fault current levels are 153 p.u at bus #1, 151 p.u at bus #2, 131.7 p.u at bus #3, and 131.5 p.u at bus 19.DGs’ short circuit current contribution levels linked to buses 8, 12, 22, 25, and 29 are in the interior of their inverter-interfaced DG (2 p.u) limit value for the suggested technique during the fault, as shown in Figure 6, Figure 7, Figure 8, Figure 9 and Figure 10. When a failure occurs at the bus to which they are interconnected, the short circuit current contribution values of DGs are very large when using the virtual equivalent impedance method: 13.5 p.u. for DG 1 at faulted bus #8, 13.3 p.u. for DG 2 at faulted bus #12, 14.1 p.u. for DG 3 at faulted bus #22, 16.2 p.u. for DG 4 at faulted bus #25, and 15.7 p.u. for DG 5 at faulted bus #29.

Static Security Risk Evaluation Outcomes

The protection device will disconnect the faulted bus as a result of the short circuit current value, and the distribution system will be divided into subsystems. The power flow program is used to assess all buses’ voltage and active power. The static security risk (R) and load shedding can be calculated using Equations (13)–(20), in the values of the constants are L = V = f = 0.005 , P r ( r j ) = 1 / 33 , V max = 1.05 , V min = 0.95 , f max = 1.05 and f min = 0.95 . The net loss coefficient can be calculated using the steady-state load flow of the IEEE distribution system σ = P netlosses P gnet , P netlosses are the net losses of the network, and P gnet is the overall generation of the system. Table 4 shows the static security risk and load shedding values during the fault at buses #2, 3, 4, 6, 7, 8, 12 and 13.
Due to the fault at bus #3, the isolated subsystem has buses # 23, 24, 25 and 38, and the overall active power of the demanded load is greater than the active power generation of DG at bus #38. The values of voltages are equal to zero, and this subsystem needs to shed its load. The value of the shedding load is calculated by reducing the load by the percentage of load after shedding to total load. The static security risk is a high value as a result of faults occurring near the main grid at buses 2, 12 and 13. When the fault occurs at buses 12, 13 to 18, all load shedding comprise failure loads.
Due to the fault, the protection devices will remove the faulted bus, as explained in Section 2.3. The operation scenario divides the distribution system into grid-connected and isolated subsystems. Each subsystem works as a small distribution system. The modified Newton–Raphson and Trust–Newton–Raphson load flows are employed to evaluate the steady-state operation of subsystems and load shedding, which can be calculated using the strategy in Section 2.5. Figure 6 shows bus voltages at faulted bus #3 before and after load shedding. Others faulted buses #2, 4, 6, 7, 8, 12 and 13 do not need to shed their load.

3.2. Isolated Microgrid

On bus No. 8, a three-phase-to-ground fault was introduced to the IEEE 33-bus with the five DG distribution system (see Figure 2). The short circuit current at bus No. 8 is estimated using virtual equivalent impedance and the suggested techniques. For four different cases, Table 5 displays the short circuit current value at bus No. 8. Table 6 demonstrates the contribution of DGs to the short circuit current during the fault using two different strategies.
The short circuit current contribution of DG can be limited up to 2 p.u using the proposed method, which is better than the virtual equivalent impedance method. The maximum value of this current is 31.08 p.u for virtual equivalent impedance when the fault occurs at bus 8 near DG while its maximum value is 2 p.u for proposed method, as shown in Table 6. The short circuit current value for the isolated MG is independent of the DG location from the faulted bus. For four cases, the virtual equivalent impedance technique provides short circuit current values in the range (425–460) p.u and the proposed method yields short circuit current values in the range (226–232) p.u. Compared to other cases, as in Table 5, the virtual equivalent impedance technique’s greatest short circuit current value is 46.38 p.u and 23.24 p.u by the suggested method in case 3.In case 2, the virtual equivalent impedance technique yields 42.59 p.u, and the proposed method yields 22.67 p.u as the lowest short circuit current value. When all buses are equipped with a three-phase to ground fault, the virtual impedance and the proposed methodologies determine the fault current value in all buses. Figure 7 displays the fault current value in all buses using the two procedures. The fault current computed using the proposed methodology is lower than the value obtained using the virtual impedance method, as illustrated in Figure 7.In contrast to the grid-connected microgrid, the fault current values for buses near the DGs connection are higher for two methods: 627 p.u at bus #3, 623 p.u at bus #6, 543 p.u at bus #19, and 504 p.u at bus #26 for the proposed technique. For the virtual impedance approach, bus #2 has 2023.9p.u, bus #11 has 1125.1 p.u, bus #19 has 1222.5 p.u, and bus 26 has 1177.5 p.u.

Static Security Risk Evaluation Outcomes

The static security risk (R) and load shedding can be calculated using equations (13) to (20). Table 7 shows the static security risk and load shedding values during the fault at buses #2, 3, 4, 6, 7, 8, 12 and 13. For the other faulted buses # 3, 4, 6, 7 and 8, the total active power of the load is greater than the active power generation of DG in some isolated subsystems.
Figure 8 shows bus voltages at faulted bus #3 prior to and after load shedding. Figure 9 demonstrates bus voltages at faulted bus #4 prior to and after load shedding. Figure 10 shows bus voltages at faulted bus #6 prior to and after load shedding. Figure 11 displays bus voltages at faulted bus #7 prior to and after load shedding. Figure 12 shows bus voltages at faulted bus #8 prior to and after load shedding.
The generation units of subsystems can feed their total load before shedding and total losses. Figure 8, Figure 9, Figure 10, Figure 11 and Figure 12 given, the voltages profile is improved after load shedding where the entire output of the generator can feed the full load after shedding and total losses of the subsystem. Due to the fault at bus #3 and the isolated subsystem that has buses # 23, 24, 25 and 38, the total active power of the load is greater than the active power generation of DG at bus #38. The values of voltages are equal to zero, and this subsystem needs to shed loads. The value of the shedding load is calculated by reducing the load by the percentage of load after shedding to the total load. Due to faults at buses #7 and #8, the voltages profiles are less than 0.95 p.u. and the generation unit output power is exceeded its limit power. For that, the load shedding of faulted buses #7 and #8 is higher in order to improve the voltage profile.

4. Discussion

For grid-connected MG, the proposed strategy limits the short-circuit current contribution of inverter-interfaced DG to 2 p.u. On the other hand, the virtual equivalent impedance technique is incapable of limiting the short-circuit current contribution of inverter-interfaced DG to 2 p.u. for faulty buses near DGs. The short circuit current computed by the proposed technique is more than 30% less than the amount obtained using the virtual equivalent impedance method. The location of the faulty bus from the DG bus determines the contribution short-circuit current of DG.
The current fault level computed using the proposed technique is less than the value obtained through the virtual equivalent impedance approach. For two different methods, fault current values are greater at buses adjoining the main grid. DGs’ short circuit current contribution levels linked to buses 8, 12, 22, 25 and 29 are in the interior of their inverter-interfaced DG (2 p.u.) limit value for the suggested technique during the fault. When a failure occurs at the bus to which they are interconnected, the short circuit current contribution values of DGs are very large when using the virtual equivalent impedance method.
For isolated MG, the proposed approach computed DGs’ short circuit current contribution within its limit value of interface inverter up to 2 p.u. However, for DGs near the fault bus, the virtual equivalent impedance cannot keep this short circuit current contribution of DGs within their limits. As a result, the short circuit current computed using the proposed technique is roughly 50% lower than the current predicted using the virtual equivalent impedance method. When all buses are equipped with a three-phase to ground fault, the virtual impedance and the proposed methodologies determine the fault current value in all buses. The fault current computed using the proposed methodology is lower than the value obtained using the virtual impedance method.
For two modes (grid-connected and isolated MGs), the load shedding strategy is used to minimize the load. Before load shedding, the static security risk is a high value as a result of the fault, while a total load of subsystems is higher than their generation units. The load failure and load shedding need to be removed in order to improve the value of static security risks. After load shedding, the static security risk decreased its value to about 0.025%. Due to faults at bus #8, the voltages profiles minimized to values that are less than 0.95 p.u. and the generation unit output power exceeded its limit power. For that, the load shedding of faulted bus #8 is higher in order to improve the voltage profile but the static security risk is very small before and after load shedding. When the fault occurs at buses 12 and 13 to 18, all-load shedding is the failure load.
The results of proposed method are compared to the results of ref. [11]. In ref. [11], IEEE 33-bus with a four DG system was tested at three locations of faults. Its results showed that the contribution short circuit current of DG is greater than its limited inverter rating current (more than 2 p.u.) because the droop current control was used to calculate the virtual equivalent impedance. In contrast, the proposed method that is used in this paper can control the contribution short circuit current of DG within its limit (2 p.u.). The proposed method depends on the voltage value of DG bus to calculate the short circuit current of DG by the control criterion.

5. Conclusions

In this study, two methods of fault current calculation have been investigated for two modes: grid-connected and isolated microgrids using virtual equivalent impedance and proposed methods. The proposed method can control the contribution short circuit current of DG within its limit (2 p.u.) where it depends on the voltage value of DG bus to calculate the short circuit current of DG by the control criterion. In concluded the following results:
(1)
The proposed approach for calculating the fault current controls the contribution current of droop control model inverter-based DG during the fault within its limited current. In contrast, the virtual impedance cannot limit this current value of DG within its limit when the fault occurs near the DG bus;
(2)
The fault current value computed using the suggested method is more than 30% lower than the value obtained using the virtual impedance method for grid-connected MG and roughly 50% lower for isolated microgrids;
(3)
For grid-connected microgrid, the short circuit current contribution of DG depends on the location of the fault near or not from DG; the increasing percentage of fault current after installing DG at certain locations is very different. In contrast, for the results of the grid-connected microgrid in the isolated microgrid, the fault current value does not depend on the location of DG the location near or far from the fault;
(4)
The value of the shedding load calculated by reducing the load by the percentage of load after shedding to total load;
(5)
The static security risk is high value due to faults occurring near the main grid;
(6)
The load shedding strategy is used to minimize the load. Before load shedding, the static security risk is high value because the failure load is high. At the same time, the total load of subsystems is higher than their generation units. Load shedding is used to improve the value of static security risk. After load shedding, the static security risk decreased its value to about 0.025%.
(7)
To enhance the voltage profile, load shedding is employed. After load shedding, the voltage profile improves because the generator’s entire output can feed the complete load plus the subsystem’s total losses.

Author Contributions

Conceptualization, M.A. and M.A.M.; methodology, A.F.M.A., N.K.L. and V.O.; software, M.A. and M.A.M.; validation, M.A., M.A.M., N.V.Q. and A.F.M.A.; formal analysis, M.A.M., M.A. and V.O.; investigation, A.F.M.A., V.O., N.K.L. and N.V.Q.; resources, M.A.M., V.O. and A.F.M.A.; data curation, M.A., N.K.L. and A.F.M.A.; writing—original draft preparation, M.A. and M.A.M.; writing—review and editing, M.A., M.A.M.,A.F.M.A. and N.K.L.; visualization, M.A.M. and M.A.; supervision, A.F.M.A. and M.A.M.; project administration, M.A., M.A.M. and N.V.Q.; funding acquisition, M.A.M. and N.V.Q. All authors have read and agreed to the published version of the manuscript.

Funding

The study presented in this paper is funded in part by the Ministry of Higher Education in Egypt and in part by the Lac Hong University in Vietnam.

Data Availability Statement

The data presented in the study are available upon request from the first corresponding author.

Conflicts of Interest

The authors declare no conflict of interest.

Nomenclature

P D G Active Power of DG
Q D G Reactive Power of DG
m p Active Power Static Droop Gain
n p Reactive Power Static Droop Gain
ZbusImpedance Matrix of System
NfFaulted Bus Number
ZfFault Impedance
V f Faulted Bus voltage
I f Current Entering the Faulted Bus
k Voltage Coefficient of Reactive Power
I D G Current Output of DG
RSecurity Risk Index
S s e v Severity of the Fault
P r Probability of the Occurrence
Weight Value
P L s h Load-Shedding Value
P D G Z Total Active Output of the DG Device
P L Z Total Active Power of the Load in the System, or
P L a f t e r s h Total Active Power of the Load after Shedding
σ Net Loss Coefficient

References

  1. Minchala-Avila, L.I.; Vargas-Martinez, A.; Garza-Castanon, L.E.; Morales-Menendez, R.; Zhang, Y.; Calle-Ortiz, E.R. Fault-tolerant Control of a Master Generation Unit in an Islanded Microgrid. In Proceedings of the 19th World Congress the International Federation of Automatic Control Cape Town, Cape Town, South Africa, 24–29 August 2014; pp. 5327–5332. [Google Scholar]
  2. Ma, Y.; Wang, G.; Li, H.; Han, B. Short-circuit Calculation Method for Islanded Micro-grid Based on Master-Slave Control. In Proceedings of the 2016 China International Conference on Electricity Distribution (CICED), Xi′an, China, 10–13 August 2016; pp. 1–6. [Google Scholar]
  3. Shuai, Z.; Shen, C.; Yin, X.; Liu, X.; Shen, Z.J. Fault Analysis of Inverter-Interfaced Distributed Generators with Different Control Schemes. IEEE Trans. Power Delivery 2018, 33, 1223–1235. [Google Scholar] [CrossRef]
  4. Bui, D.M. Simplified and Automated Fault-Current Calculation for Fault Protection System of Grid-Connected Low-Voltage AC Microgrids. Int. J. Emerg. Electr. Power Syst. 2017, 18, 1–24. [Google Scholar] [CrossRef]
  5. Baghaee, H.R.; Gevork, M.; Gharehpetian, B.; Talebi, H.A. A new current limiting strategy and fault model to improve fault ride-through capability of inverter interfaced DERs in autonomous microgrids. Sustain. Energy Technol. Assess. 2017, 24, 71–81. [Google Scholar] [CrossRef]
  6. Sabzevari, K.; Karimi, S.; Khosravi, F.; Abdi, H. Modified droop control for improving adaptive virtual impedance strategy for parallel distributed generation units in islanded microgrids. Int. Trans. Electr. Energ. Syst. 2019, 29, e2689. [Google Scholar] [CrossRef] [Green Version]
  7. Liu, H.; Chen, Y.; Li, S.; Hou, Y. Improved Droop Control of Isolated Microgrid with Virtual Impedance. In Proceedings of the 2013 IEEE Power & Energy Society General Meeting, Vancouver, BC, Canada, 21–25 July 2013; pp. 1–5. [Google Scholar]
  8. Liu, X.M.; Lu, B.C.; Ren, Z.P.; Zhang, R.X. Research on Improved Droop Control Strategy Based on Virtual Impedance. IOP Conf. Ser. Earth Environ. Sci. 2018, 192, 012030. [Google Scholar] [CrossRef]
  9. Sun, Y.; Hou, X.; Yang, J.; Han, H.; Su, M.; Guerrero, J.M. New Perspectives on Droop Control in AC Microgrid. IEEE Trans. Ind. Electron. 2017, 64, 5741–5745. [Google Scholar] [CrossRef] [Green Version]
  10. Cao, W.; Ma, Y.; Wang, J.; Wang, F. Virtual Series Impedance Emulation Control for Remote PV or Wind Farms. In Proceedings of the 2014 IEEE Applied Power Electronics Conference and Exposition—APEC 2014, Fort Worth, TX, USA, 16–20 March 2014; pp. 411–418. [Google Scholar]
  11. Yang, S.; Tong, X. Integrated Power Flow and Short Circuit Calculation Method for Distribution Network with Inverter Based Distributed Generation. Math. Probl. Eng. 2016, 2016, 9404951. [Google Scholar] [CrossRef]
  12. Li, C.; Sanjay, K.; Chaudhary, J.; Vasquez, C.; Josep, M.G. Power Flow Analysis Algorithm for Islanded LV Microgrids Including Distributed Generator Units with Droop Control and Virtual Impedance Loop. In Proceedings of the 2014 29th Annual IEEE Applied Power Electronics Conference and Exposition (APEC), Fort Worth, TX, USA, 16–20 March 2014; pp. 3181–3185. [Google Scholar]
  13. He, J.; Li, Y.W. Analysis, Design, and Implementation of Virtual Impedance for Power Electronics Interfaced Distributed Generation. IEEE Trans. Ind. Appl. 2011, 47, 2525–2538. [Google Scholar] [CrossRef]
  14. Lu, X.; Wang, J.; Guerrero, J.M.; Zhao, D. Virtual-Impedance-Based Fault Current Limiters for Inverter Dominated AC Microgrids. IEEE Trans. Smart Grid 2018, 9, 1599–1612. [Google Scholar] [CrossRef] [Green Version]
  15. Abdel-Salam, M.; Ahmed, A.; Ziedan, H.; Kamel, R.; Sayed, K.; Amery, M.; Swify, M. Analysis of Protection System for a Microgrid Supplying Irrigation Load in Toshka Area. In Proceedings of the IECON 2012—38th Annual Conference on IEEE Industrial Electronics Society, Montreal, QC, Canada, 25–28 October 2012; pp. 5602–5606. [Google Scholar]
  16. Abdel-Salam, M.; Ahmed, A.; Ziedan, H.; Kamel, R.; Sayed, K.; Amery, M.; Swify, M.; El-kishky, H.; Khalaf, M. Adaptive and Intelligent Protection System for Micro Grid Operates In Both Grid Connected and Islanding Modes. In Proceedings of the INTELEC 2013, 35th International Telecommunications Energy Conference, Hamburg, Germany, 13–17 October 2013; pp. 22–27. [Google Scholar]
  17. Van Tuand, S.C.D. Fault Current Calculation in System with Inverter-Based Distributed Generation with Consideration of Fault Ride Through Requirement. ASEAN Eng. J. 2013, 2, 10–22. [Google Scholar]
  18. Tristiu, I.; Bulac, C.; Costinas, L.T.; Mandis, A.; Zabava, T. A New and Efficient Algorithm for Short-circuit Calculation in Distribution Networks with Distributed Generation. In Proceedings of the 9th International Symposium on Advanced Topics in Electrical Engineering, Bucharest, Romania, 7–9 May 2015; pp. 816–821. [Google Scholar]
  19. Zabava, T.-I.; Tristiu, I.; Mandis, T.; Bulac, C. Short-Circuit Currents Calculation In Distribution Electrical Networks In The Presence Of Distributed Generation. UPB Sci. Bull. Ser. C 2015, 77, 443–454. [Google Scholar]
  20. Tuyou, S.; Jiekang, W.; Weideng, Y.; Anan, D. Power supply risk assessment method for relay protection system faults. Arch. Electr. Eng. 2016, 65, 803–814. [Google Scholar] [CrossRef] [Green Version]
  21. Bhuiyan, Z.A.; George, J.; Anders, J.P.; Du, S. Review of static risk-based security assessment in power system. IET Cyber-Phys. Syst. Theory Appl. 2019, 4, 233–239. [Google Scholar] [CrossRef]
  22. Pukhrem, S.; Basu, M.; Conlon, M. Probabilistic risk assessment of power quality variations and events under temporal and spatial characteristics of increased PV integration in low voltage distribution networks. IEEE Trans. Power Syst. 2017, 33, 3246–3254. [Google Scholar] [CrossRef]
  23. Peng, H.; Su, M.; Li, S.; Li, C. Static Security Risk Assessment for Islanded Hybrid AC/DC Microgrid. IEEE Access 2019, 7, 37545–37554. [Google Scholar] [CrossRef]
  24. Manna, D.; Goswami, S.K.; Chattopadhyay, P.K. Optimization of droop coefficients of multiple distributed generators in a micro-grid. IET Gener. Transm. Distrib. 2018, 12, 4108–4116. [Google Scholar] [CrossRef]
  25. Abdelaziz, M.M.A.; Farag, H.E.; El-Saadany, E.F.; Mohamed, Y.A.I. A Novel and Generalized Three-Phase Power Flow Algorithm for Islanded Microgrids Using a Newton Trust Region Method. IEEE Trans. Power Syst. 2012, 28, 190–201. [Google Scholar] [CrossRef]
Figure 1. The equivalent circuit of DG during fault.
Inventions 07 00052 g001
Figure 2. IEEE 33 bus with 5 DGs Isolated Microgrid.
Inventions 07 00052 g002
Figure 3. Flow chart of the proposed technique.
Inventions 07 00052 g003
Figure 4. Three subsystems due to the removed faulted bus #3.
Inventions 07 00052 g004
Figure 5. The value of fault current in all buses using virtual impedance and proposed methods.
Inventions 07 00052 g005
Figure 6. Bus voltages at faulted bus #3 before and after load shedding.
Inventions 07 00052 g006
Figure 7. The value of fault current in all buses using two approaches.
Inventions 07 00052 g007
Figure 8. Bus voltages at faulted bus #3 prior to and after load shedding.
Inventions 07 00052 g008
Figure 9. Bus voltages at faulted bus #4 prior to and after load shedding.
Inventions 07 00052 g009
Figure 10. Bus voltages at faulted bus #6 prior to and after load shedding.
Inventions 07 00052 g010
Figure 11. Bus voltages at faulted bus #7 prior to and after load shedding.
Inventions 07 00052 g011
Figure 12. Bus voltages at faulted bus #8 prior to and after load shedding.
Inventions 07 00052 g012
Table 1. Four cases for DG placement in IEEE 33-bus distribution.
DG Bus No.Linked to Bus No.
Case 1Case 2Case 3Case 4
348113
35918812
361222921
3718251424
3824331829
Table 2. The estimated short circuit current at bus No. 8 for four different cases.
Fault CurrentCase 1Case 2Case 3Case 4
virtual impedance method (p.u)72.9047.7169.9952.94
proposed method (p.u)42.8032.5640.8042.45
Table 3. DG buses’ estimated short circuit current during the fault for two techniques.
DG BusCase1Case 2Case 3Case 4
Virtual ImpedanceProposed MethodVirtual ImpedanceProposed MethodVirtual ImpedanceProposed MethodVirtual ImpedanceProposed Method
3413.52.03.10.023.80.373.980.56
3510.931.807.071.1913.552.010.921.77
368.931.392.500.1111.171.842.640.11
376.160.953.970.617.641.224.090.61
385.080.747.061.225.520.788.511.47
Table 4. The static security risk and load shedding values.
Faulted Bus No.R, %Failure and Shedding Loads (kW)
20.0485100
30.1237530
40.0255120
60.04960
70.026200
80.05200
120.1955510
130.1477450
Table 5. The estimated short circuit current value at bus No. 8uses two techniques.
Fault CurrentCase 1Case 2Case 3Case 4
virtual impedance method (p.u)45.9042.5946.3843.11
proposed method (p.u)22.9622.6823.2422.96
Table 6. The calculated output short circuit current of the DG buses throughout the fault in two approaches.
DG BusCase1Case 2Case 3Case 4
Virtual ImpedanceProposed MethodVirtual ImpedanceProposed MethodVirtual ImpedanceProposed MethodVirtual ImpedanceProposed Method
3431.082.01.301.561.681.761.281.54
3510.781.050.770.8430.961.961.310.94
360.710.350.330.3310.330.580.320.32
370.771.051.291.281.021.061.241.23
380.470.440.420.420.230.270.600.41
Table 7. The static security risk and load shedding values.
Faulted Bus No.R before Load Shedding, %R after Load Shedding, %Failure and Shedding Loads (kW)
20.04850.0485100
30.12490.0244530
40.32050.0245430
60.36930.0243740
70.02660.0252993.1
80.05190.04941190
120.19440.1944510
130.14610.1461450
Publisher’s Note: MDPI stays neutral with regard to jurisdictional claims in published maps and institutional affiliations.

