
Design and Simulation of a Greenhouse FSS Nanofiber Film for Enhancing Agricultural Productivity by Selective Reduction of UV and NIR

Abstract
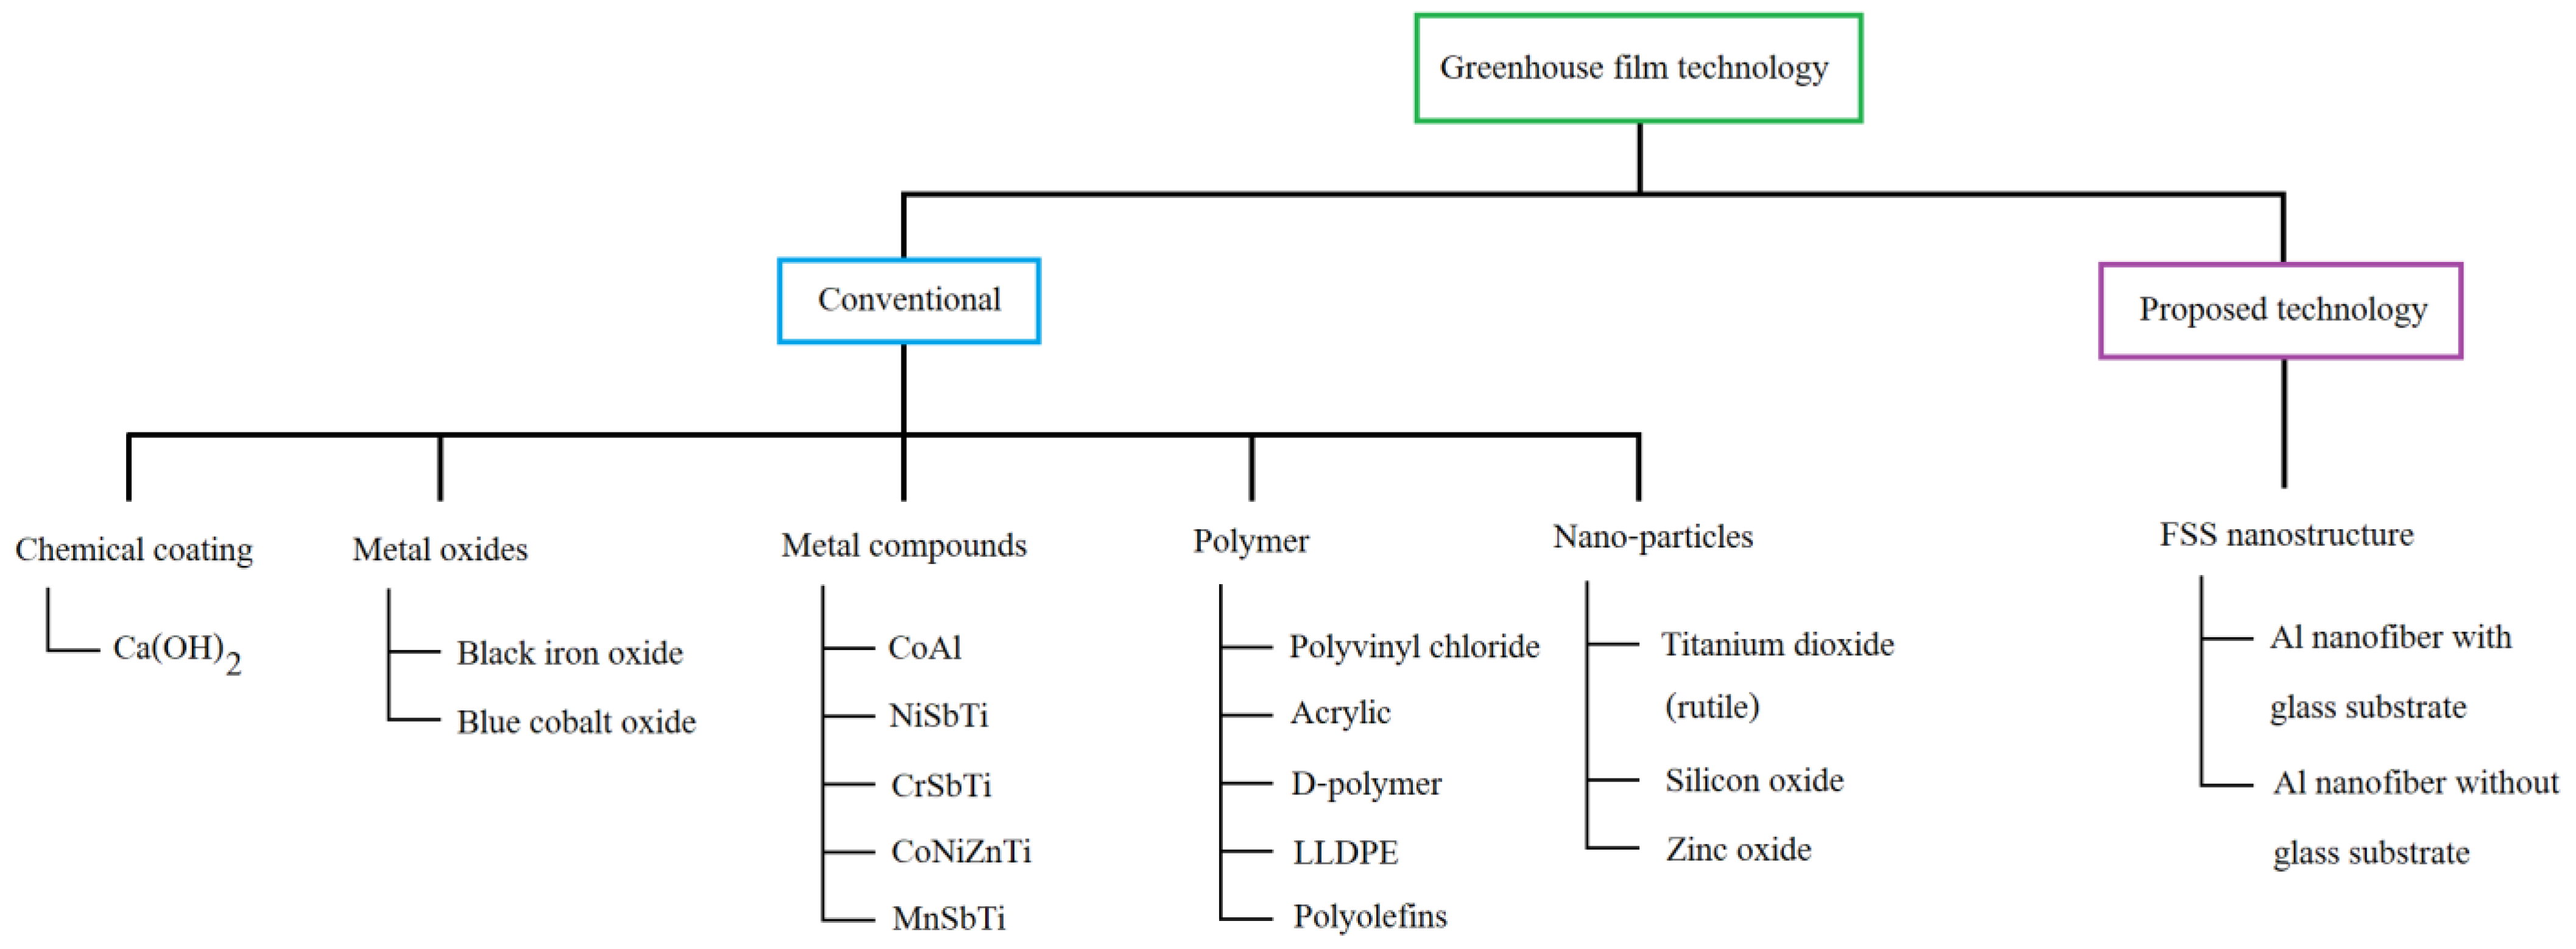
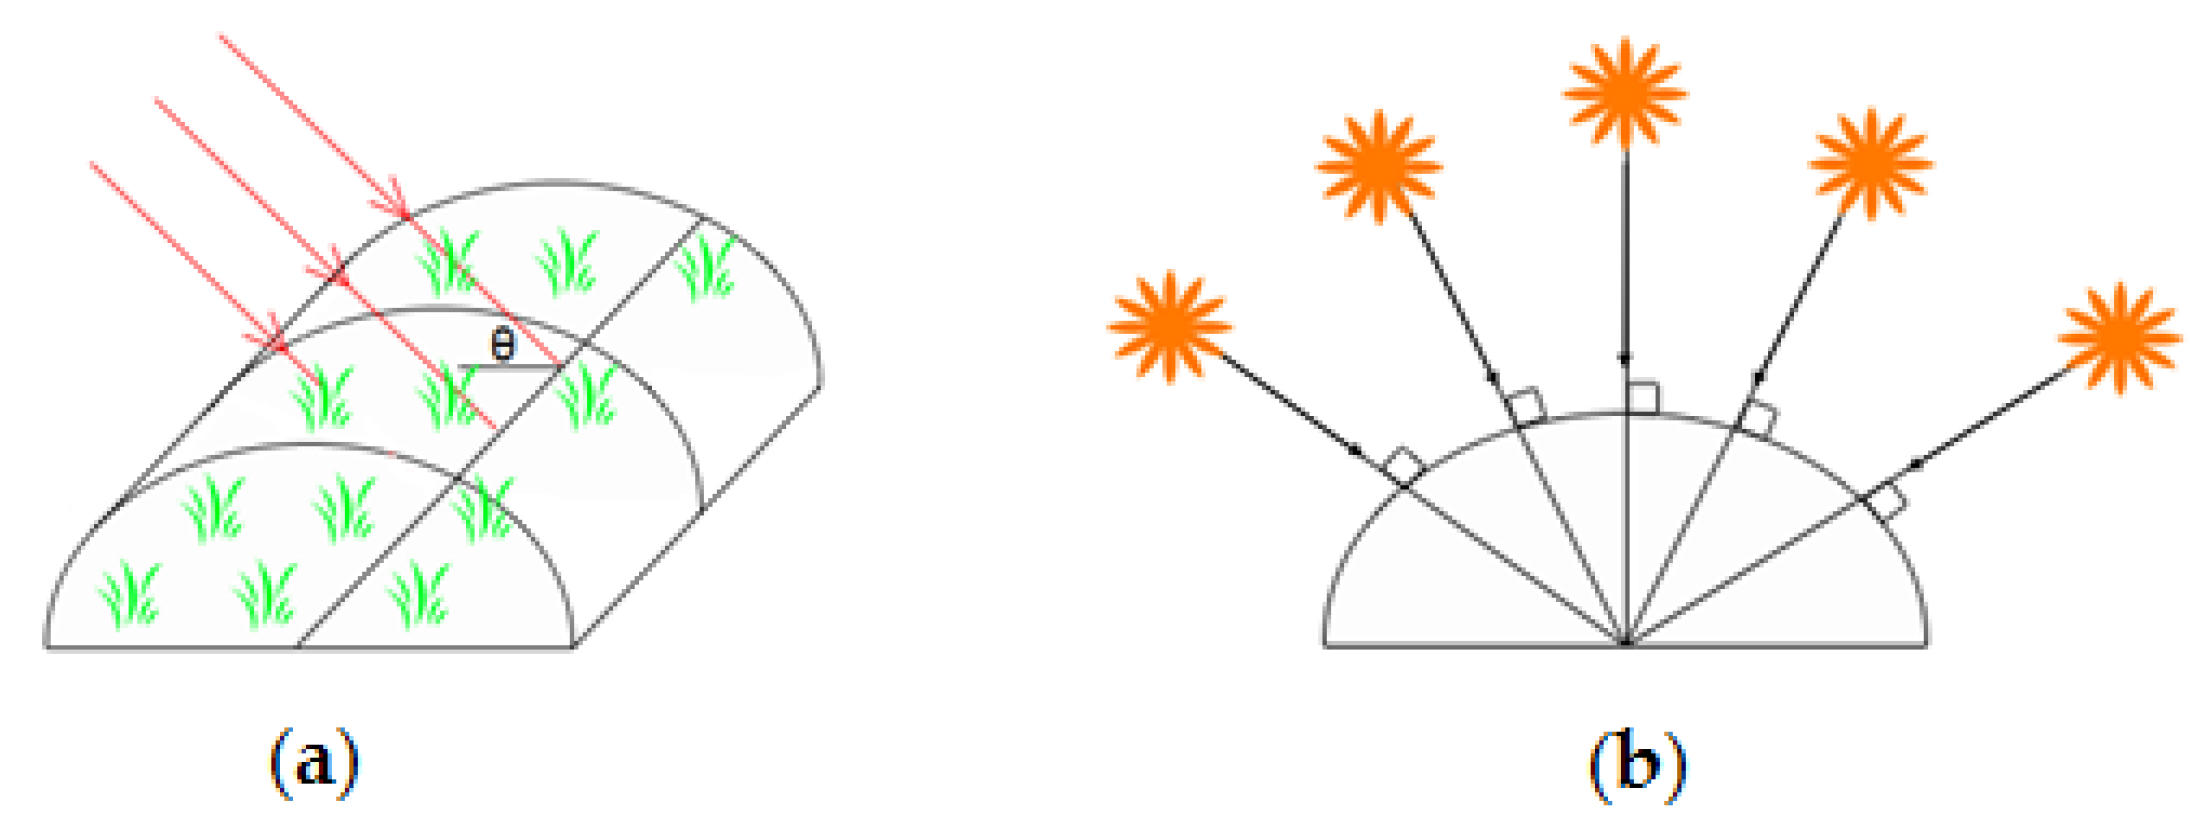
1. Introduction
2. Materials and Methods
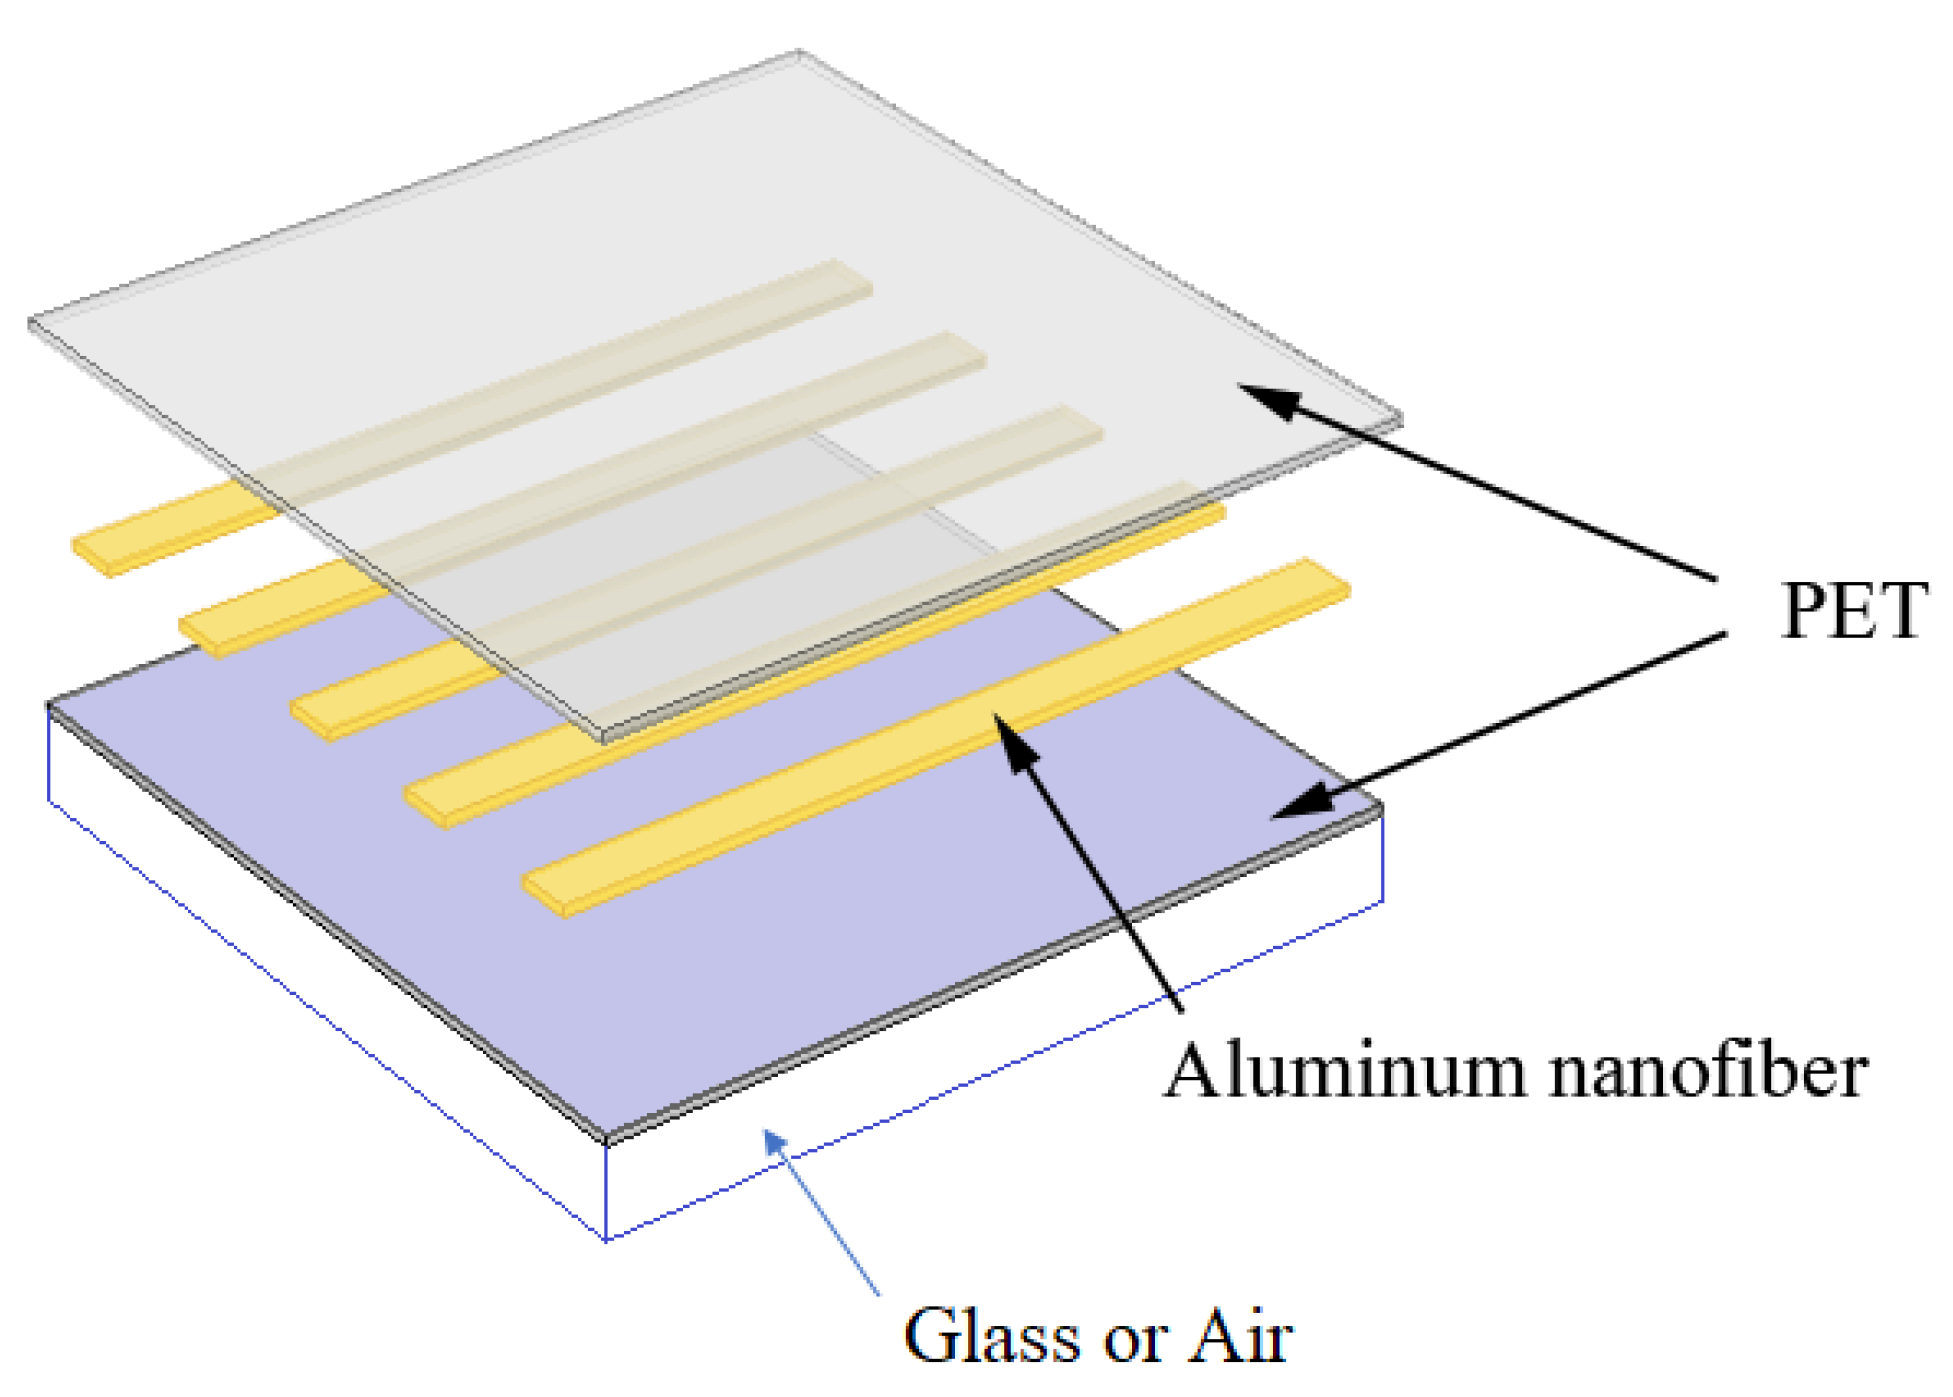
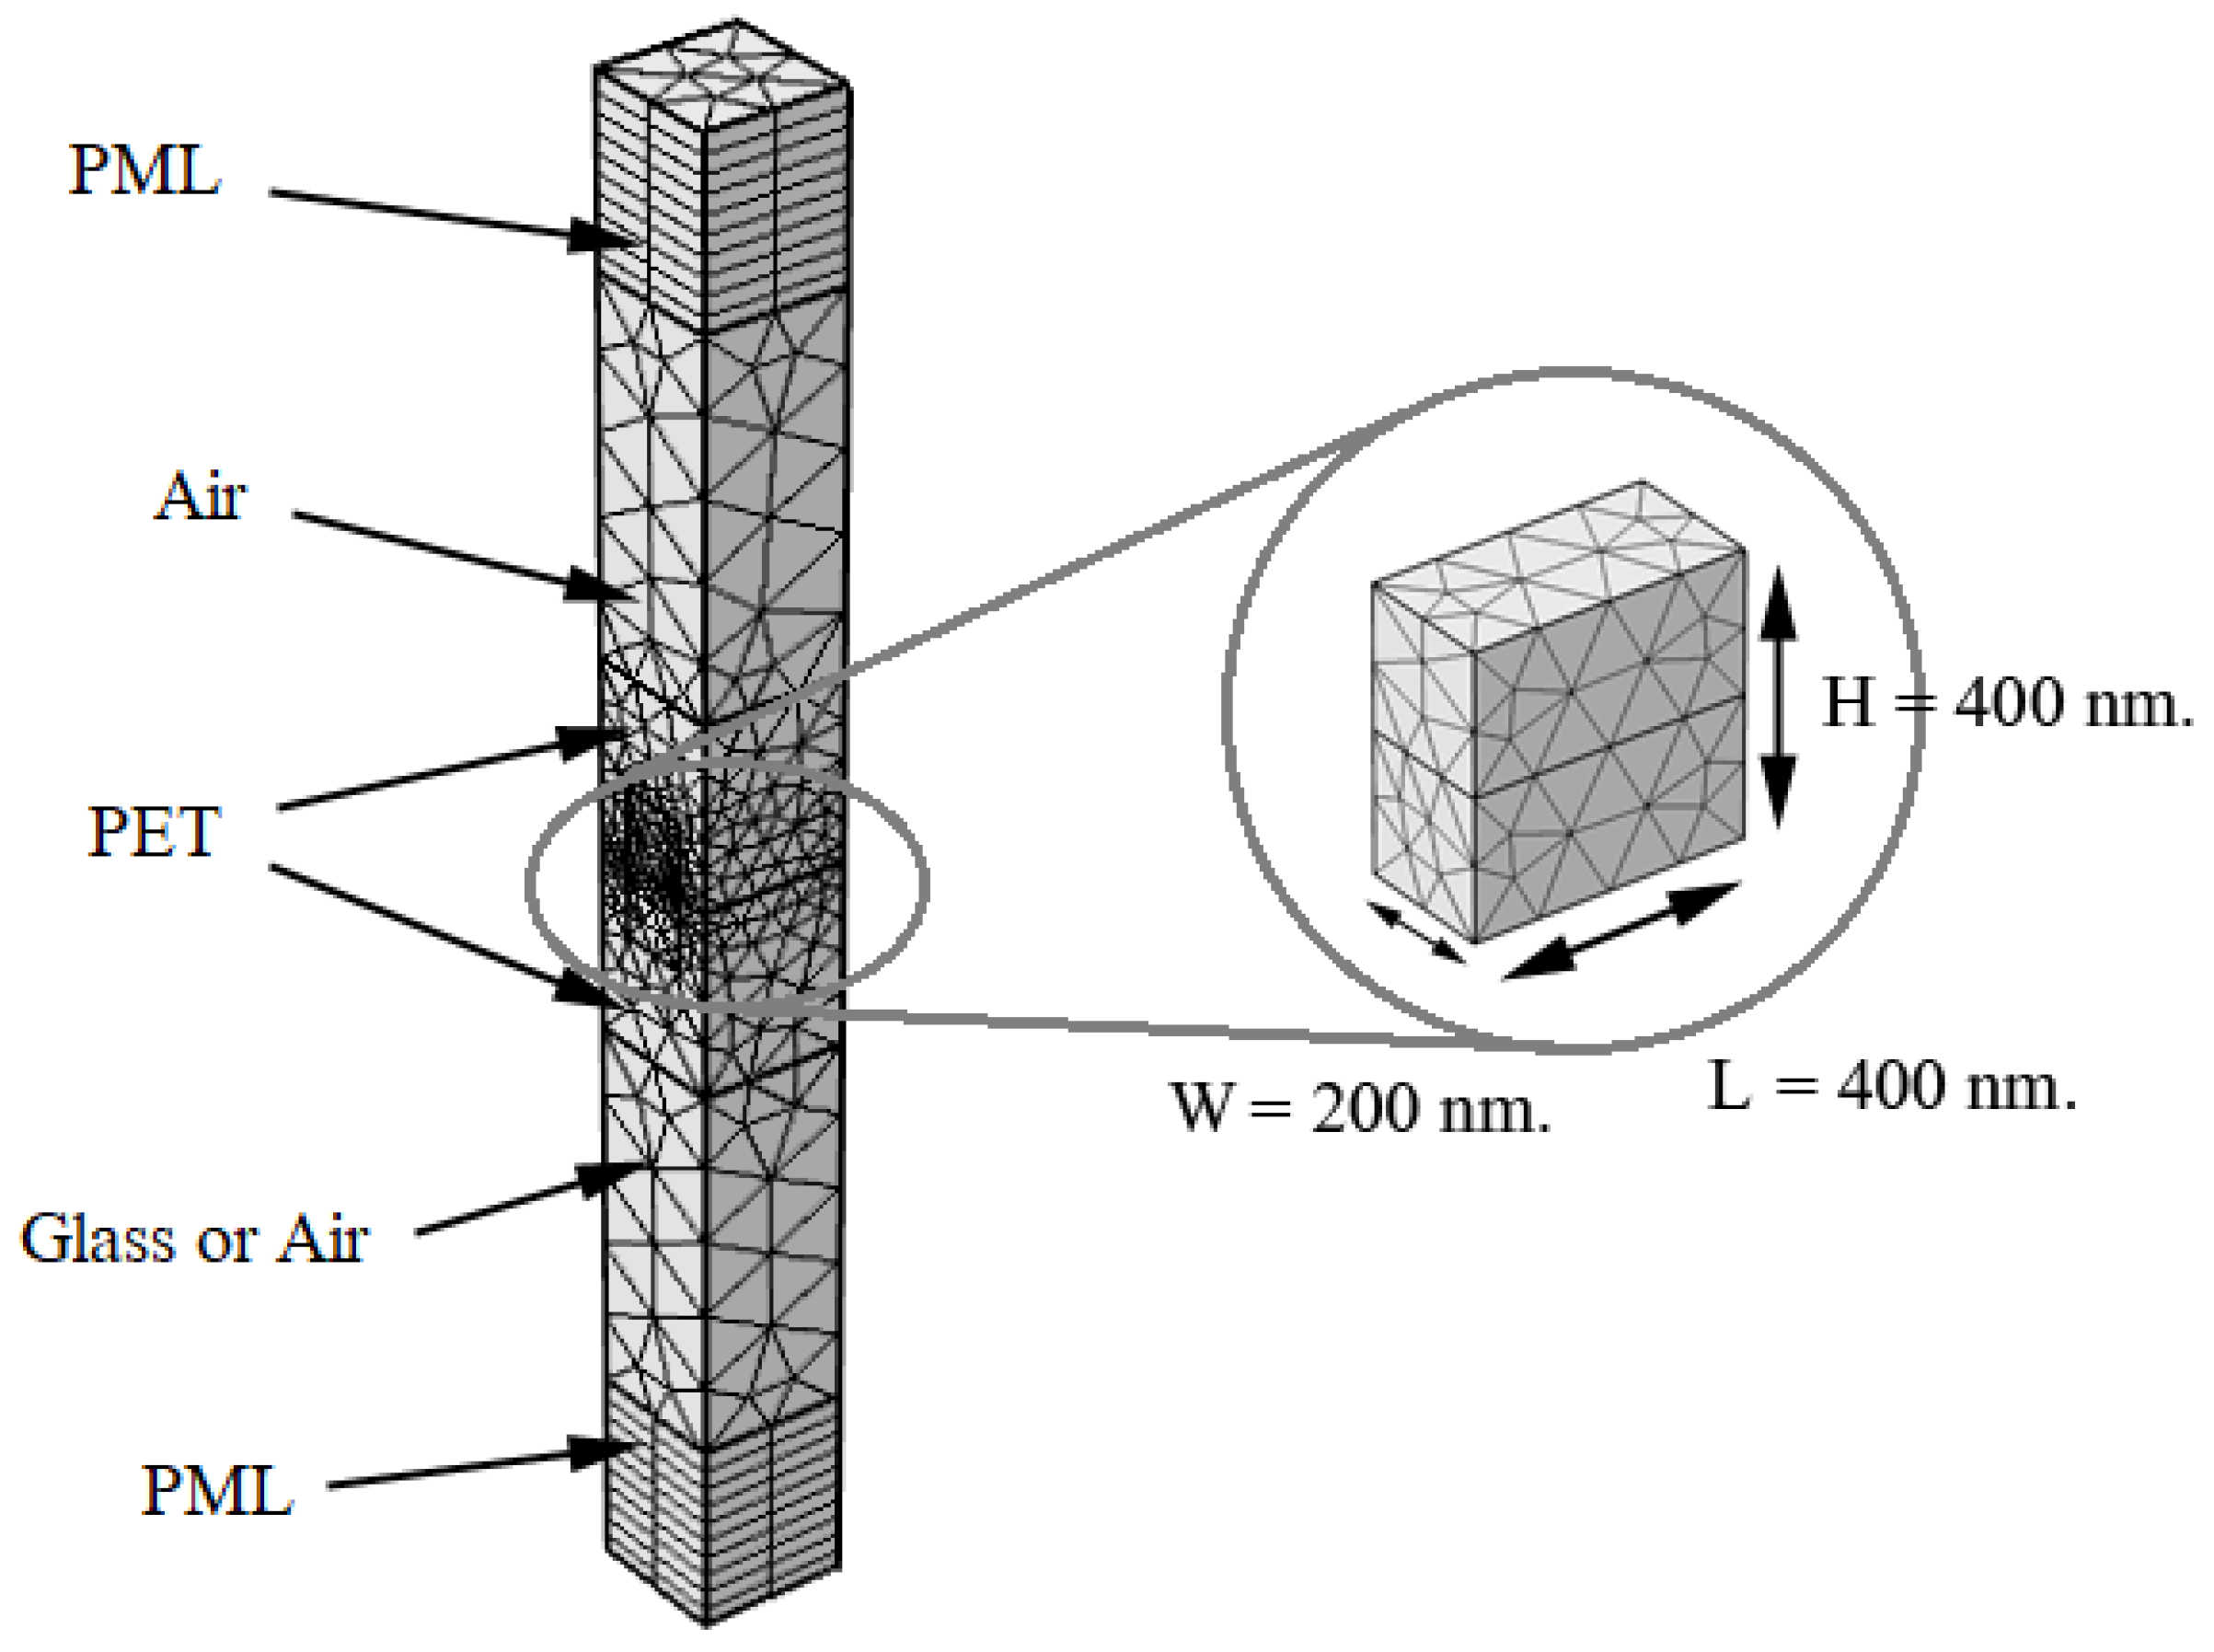
2.1. Design of Nanofiber Film
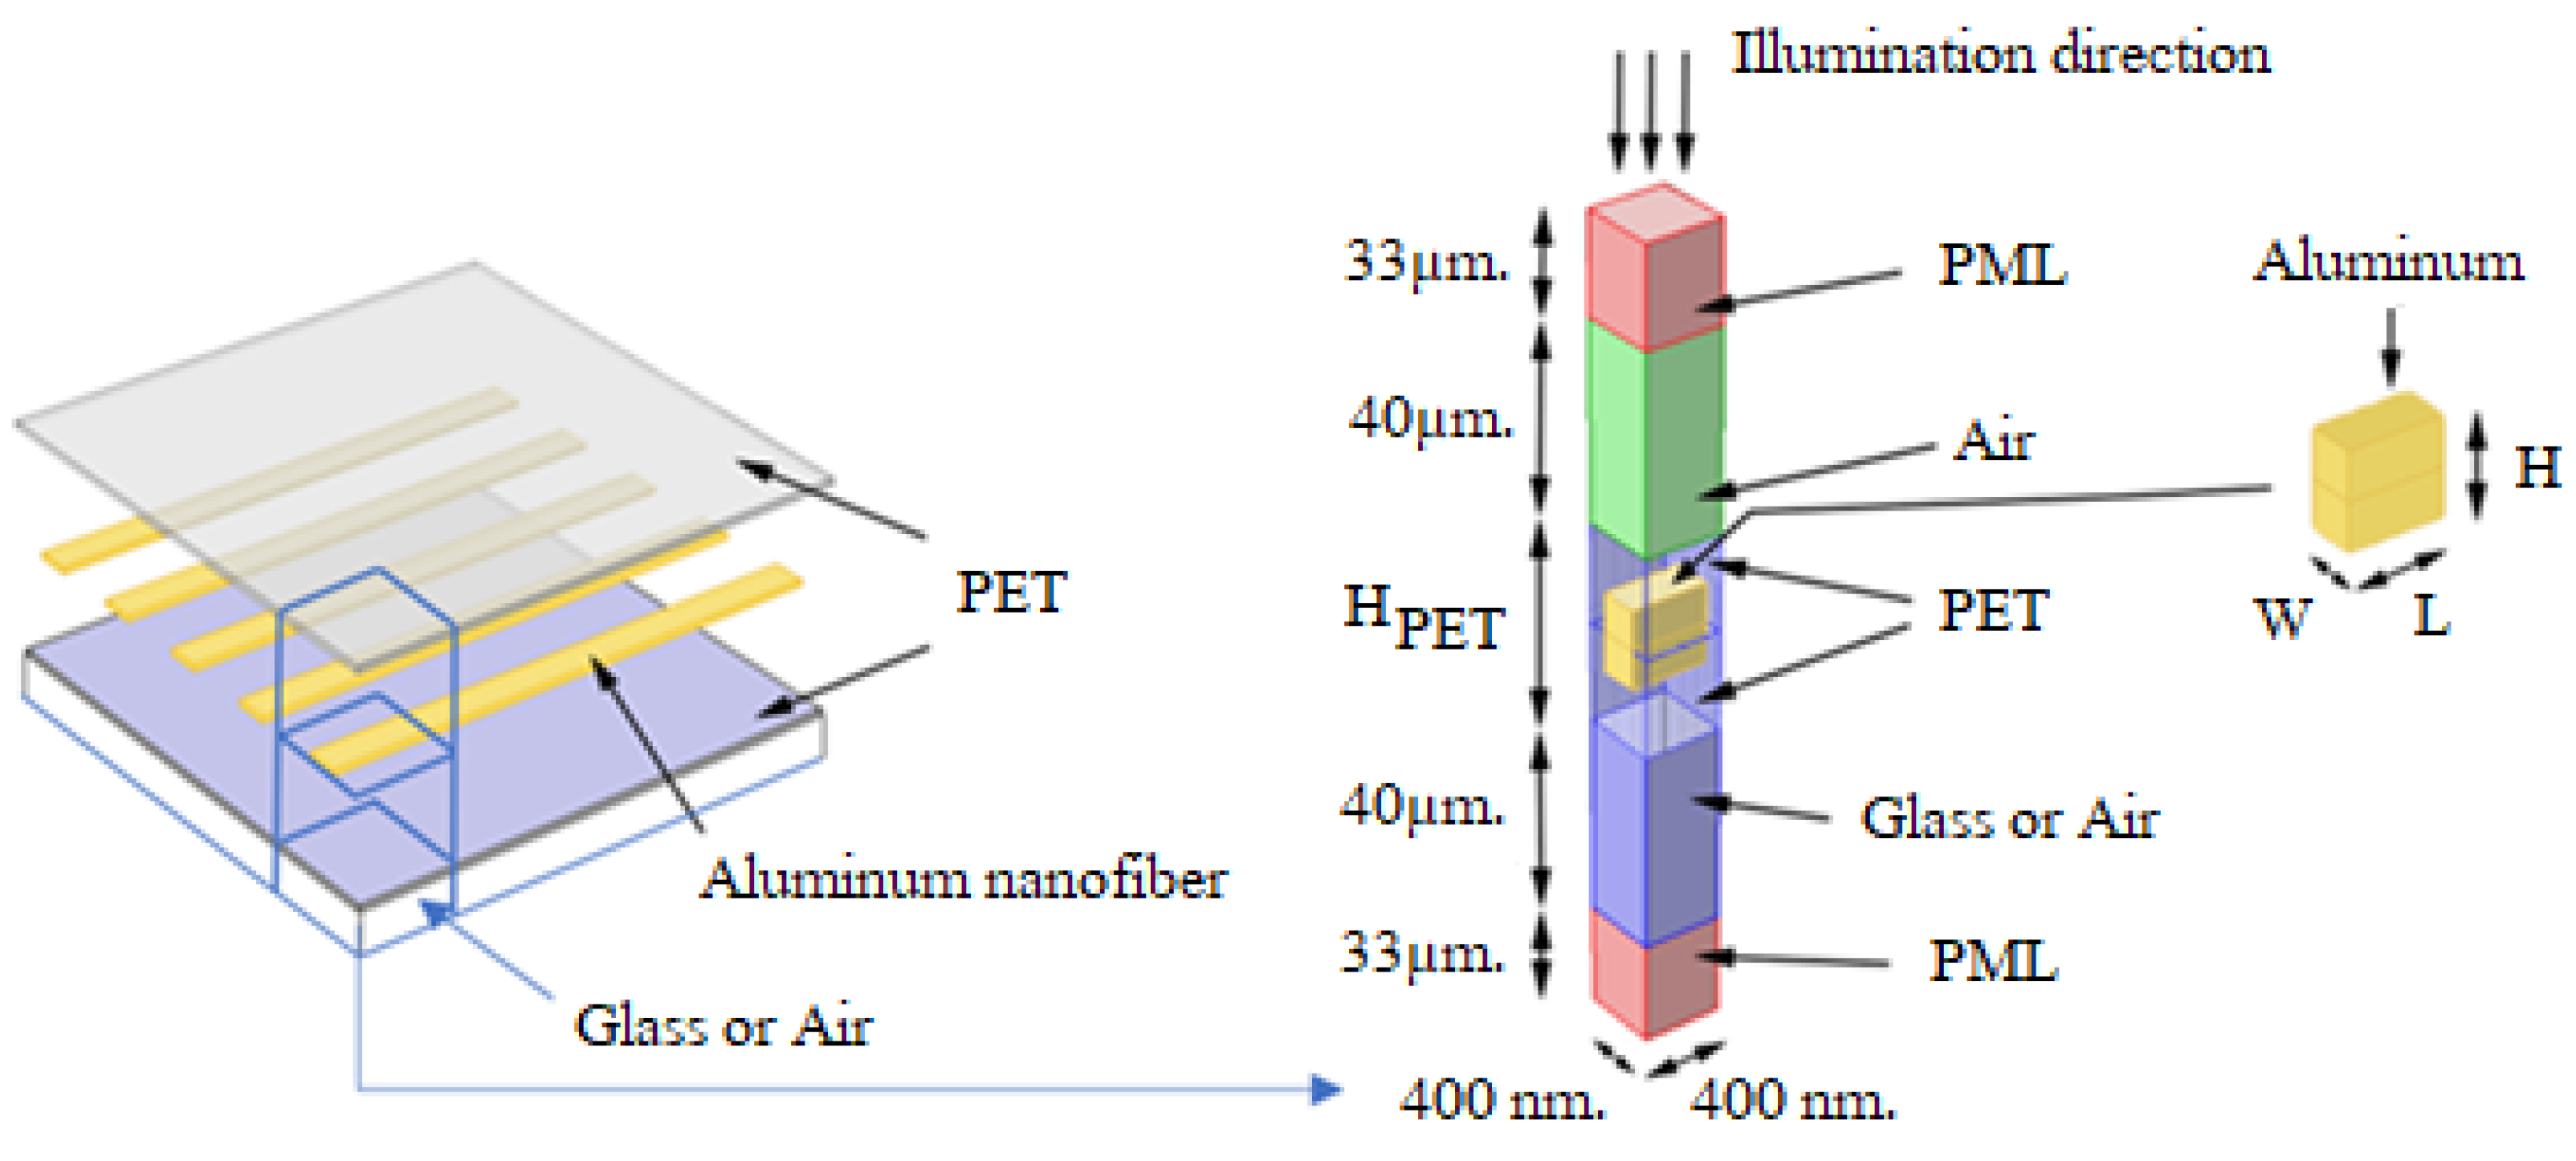
2.2. Evaluation and Domain Setup
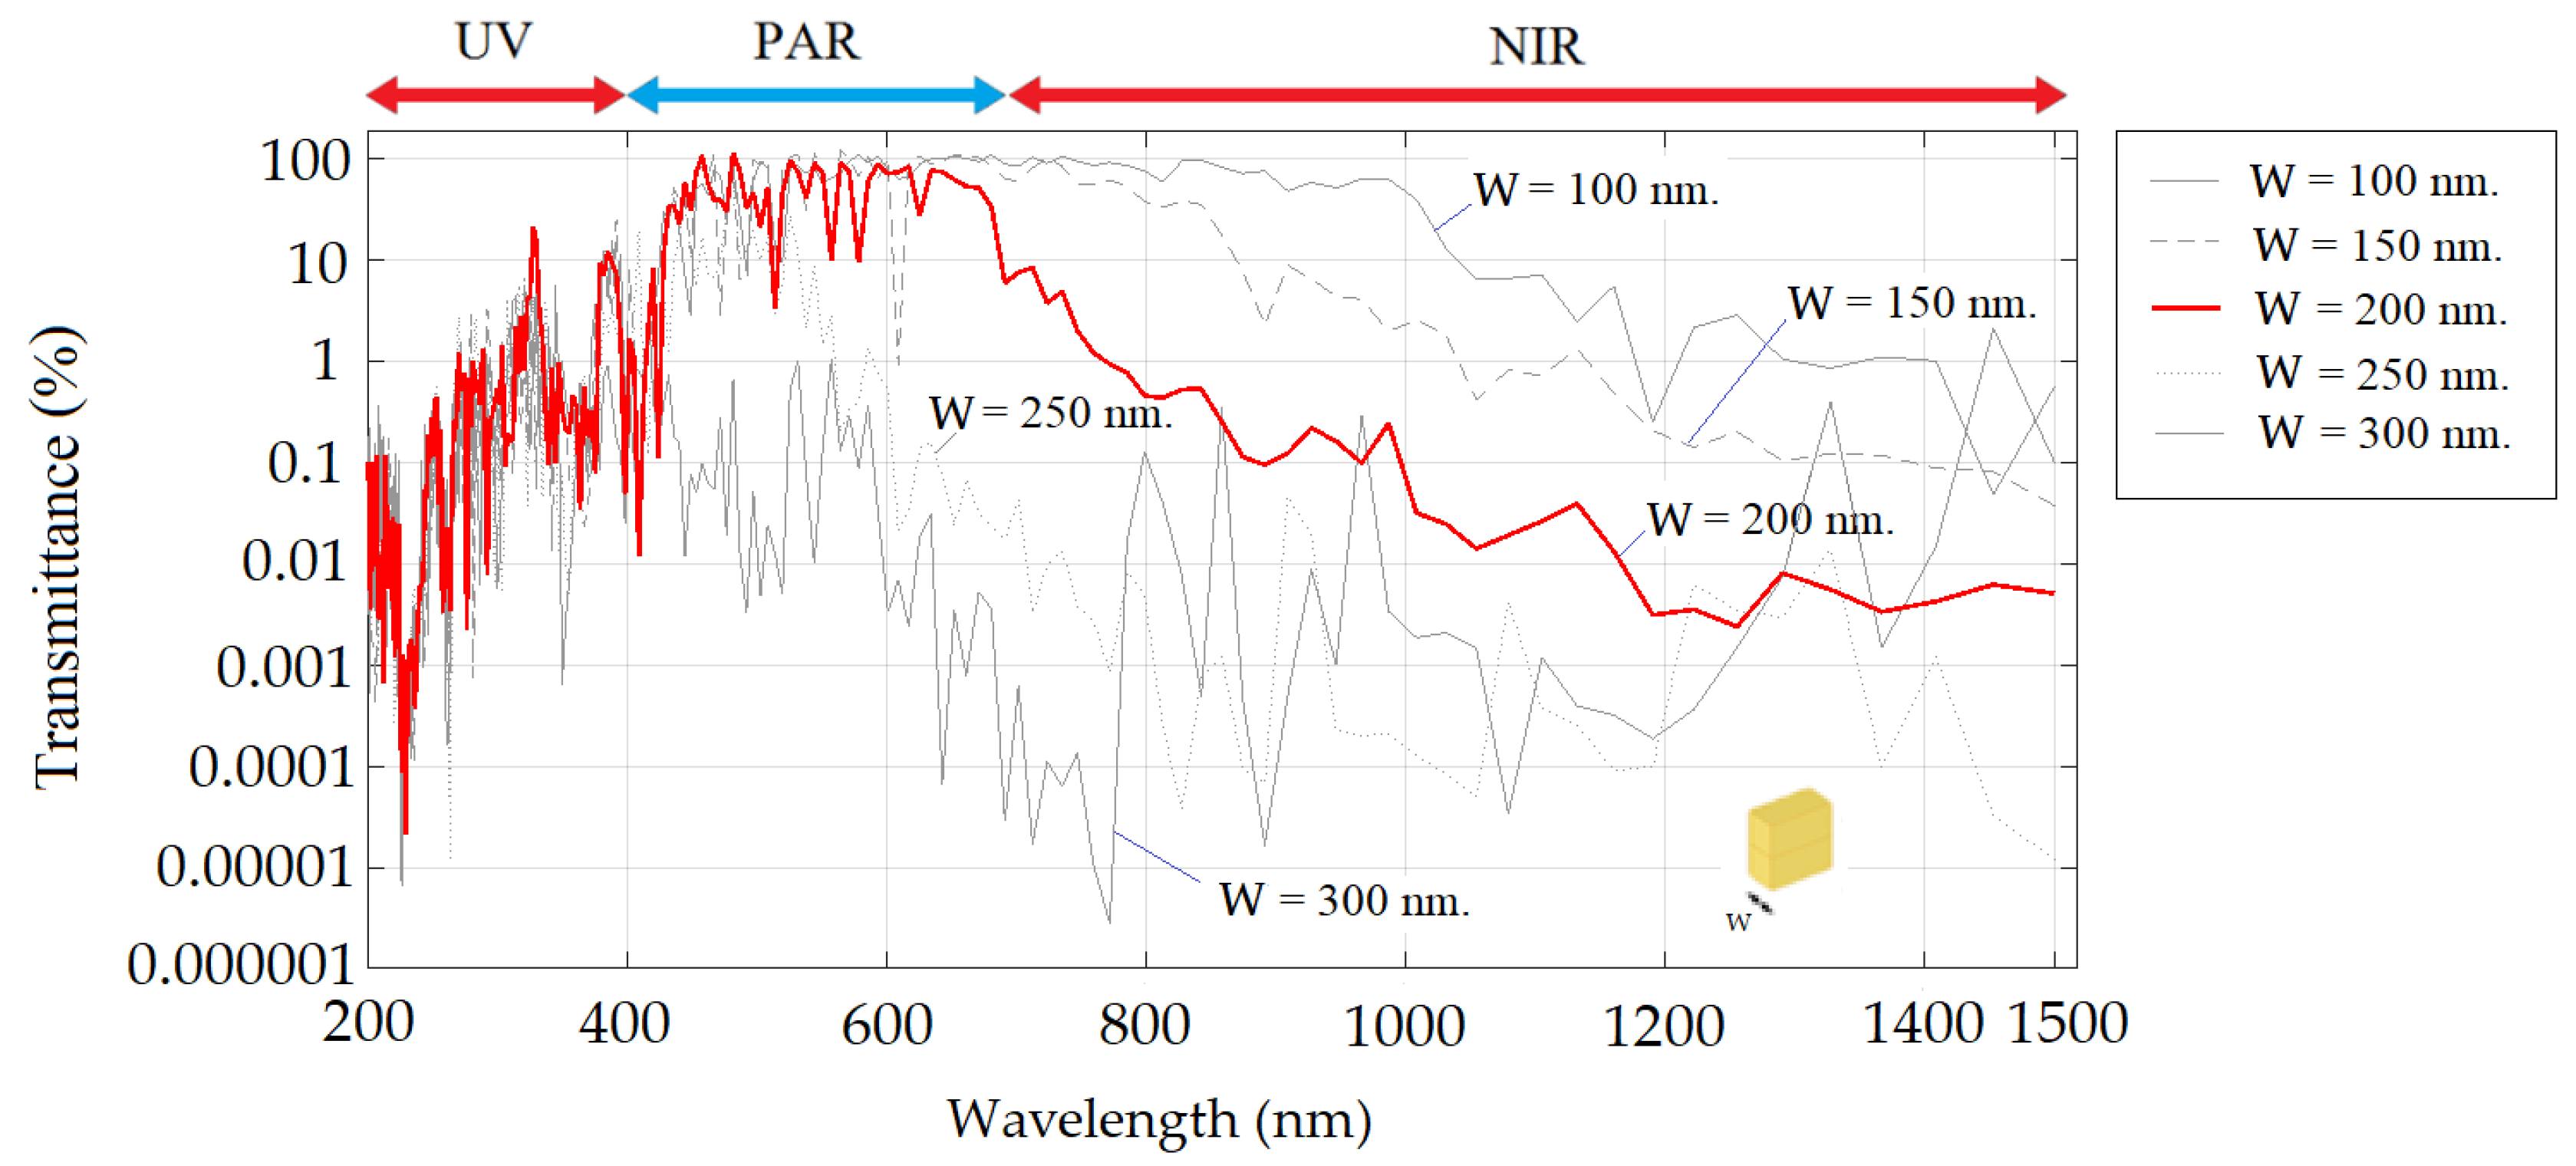
- Width (W) of the nanofiber in the range from 100 nm to 300 nm.
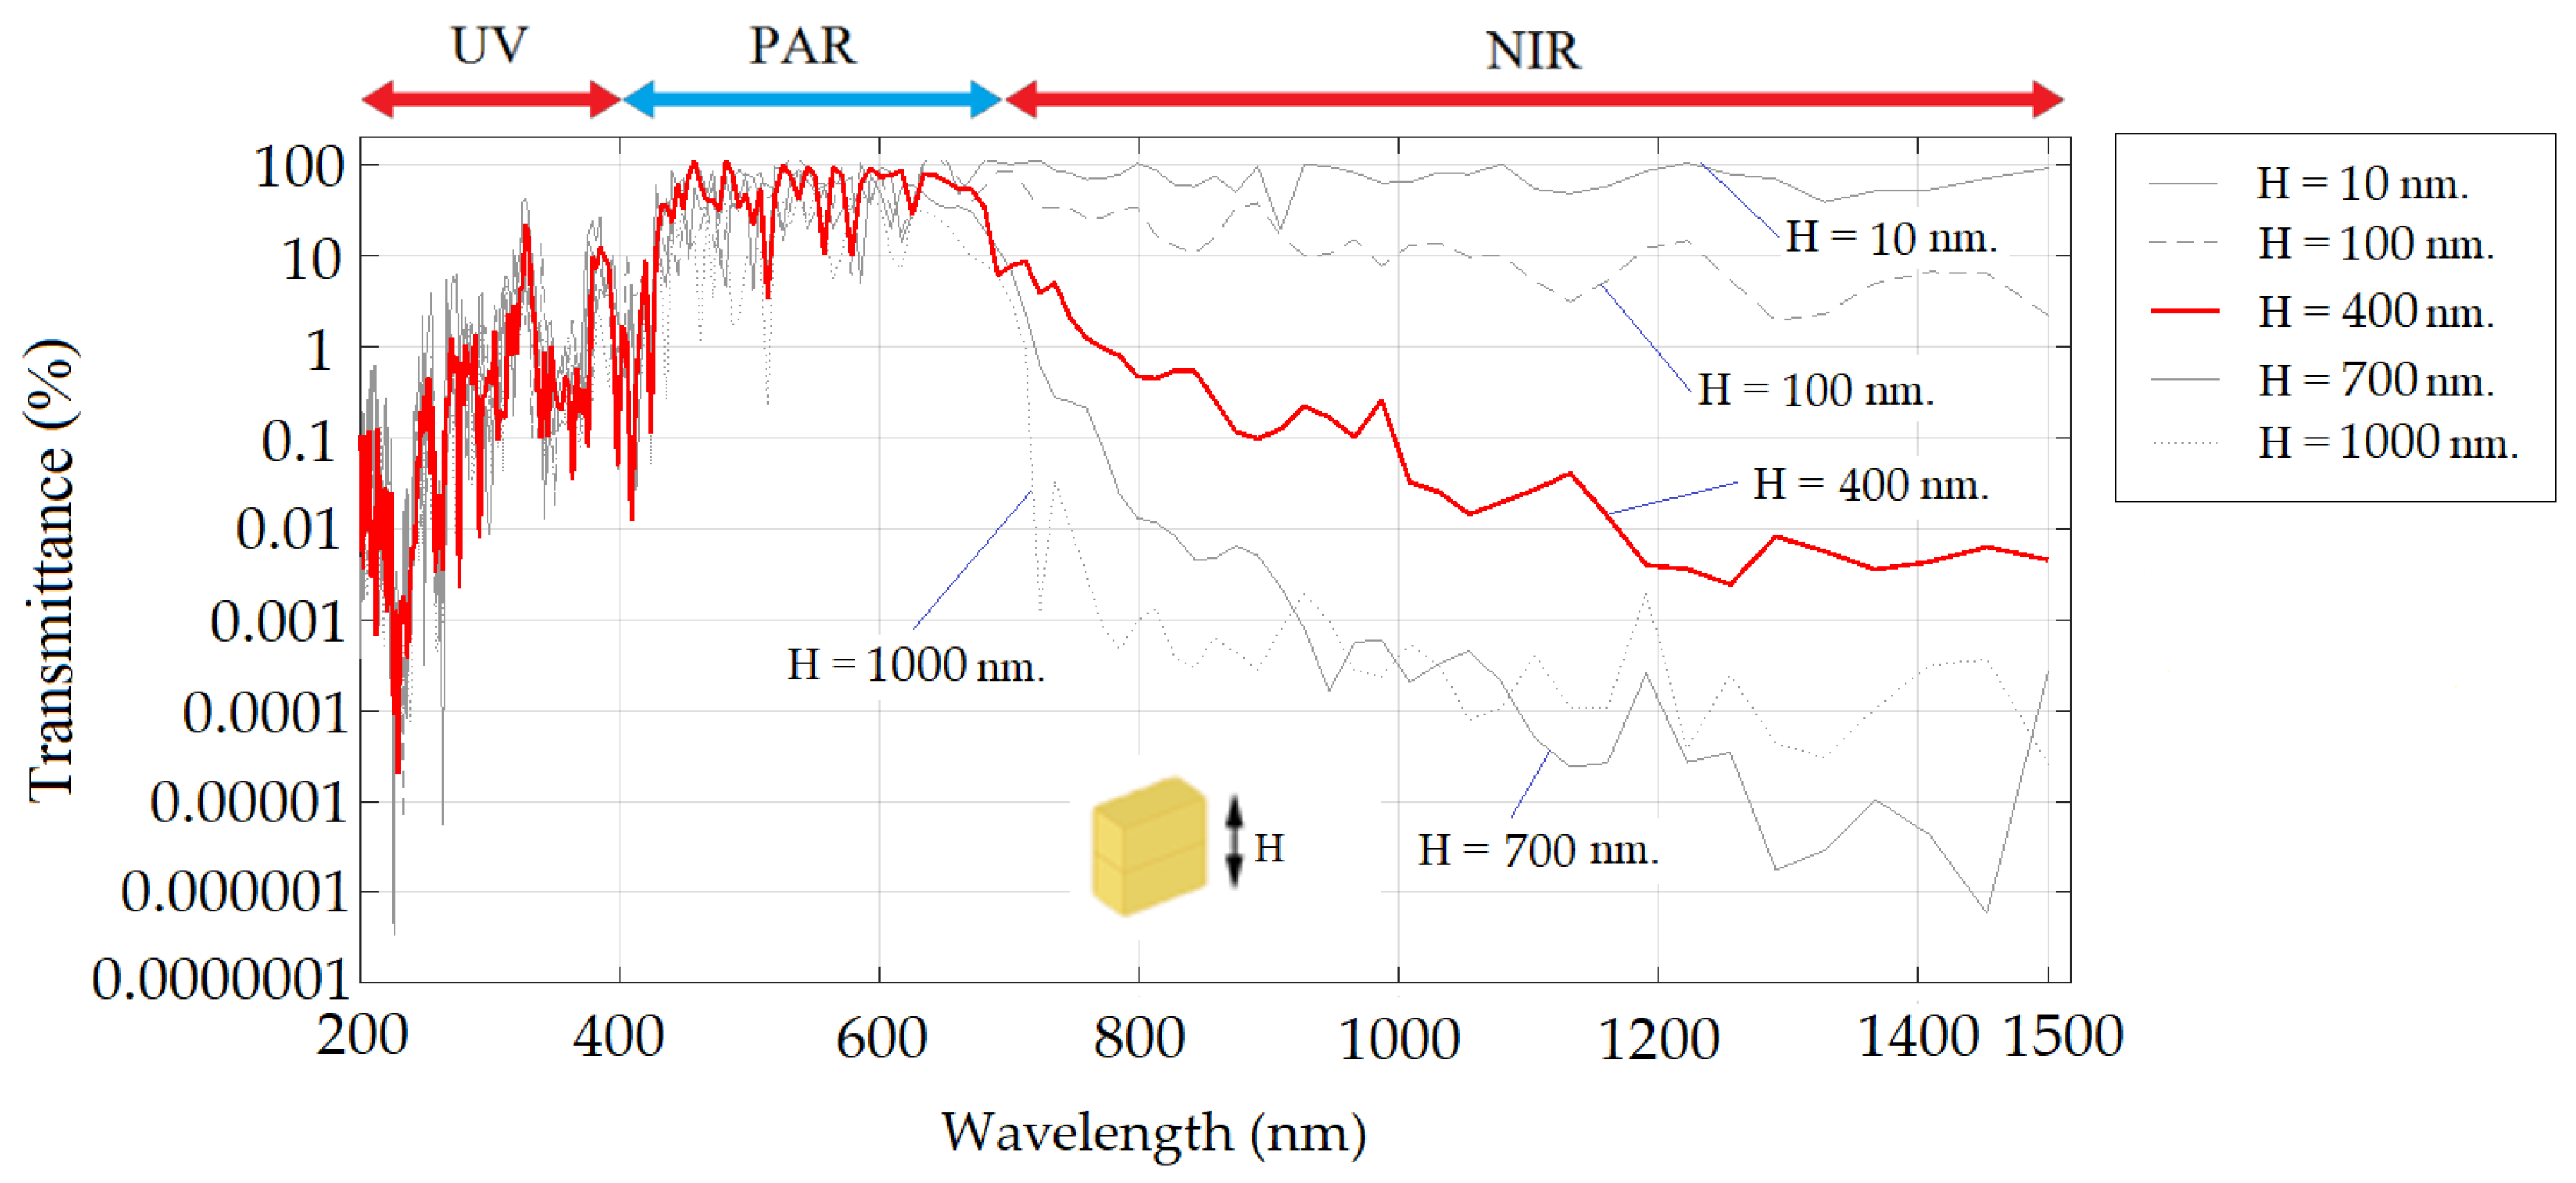
- Height (H) of the nanofiber in the range from 10 nm to 1000 nm.
3. Results and Discussion
3.1. Width of the Nanofiber (W)
3.2. Height of the Nanofiber (H)
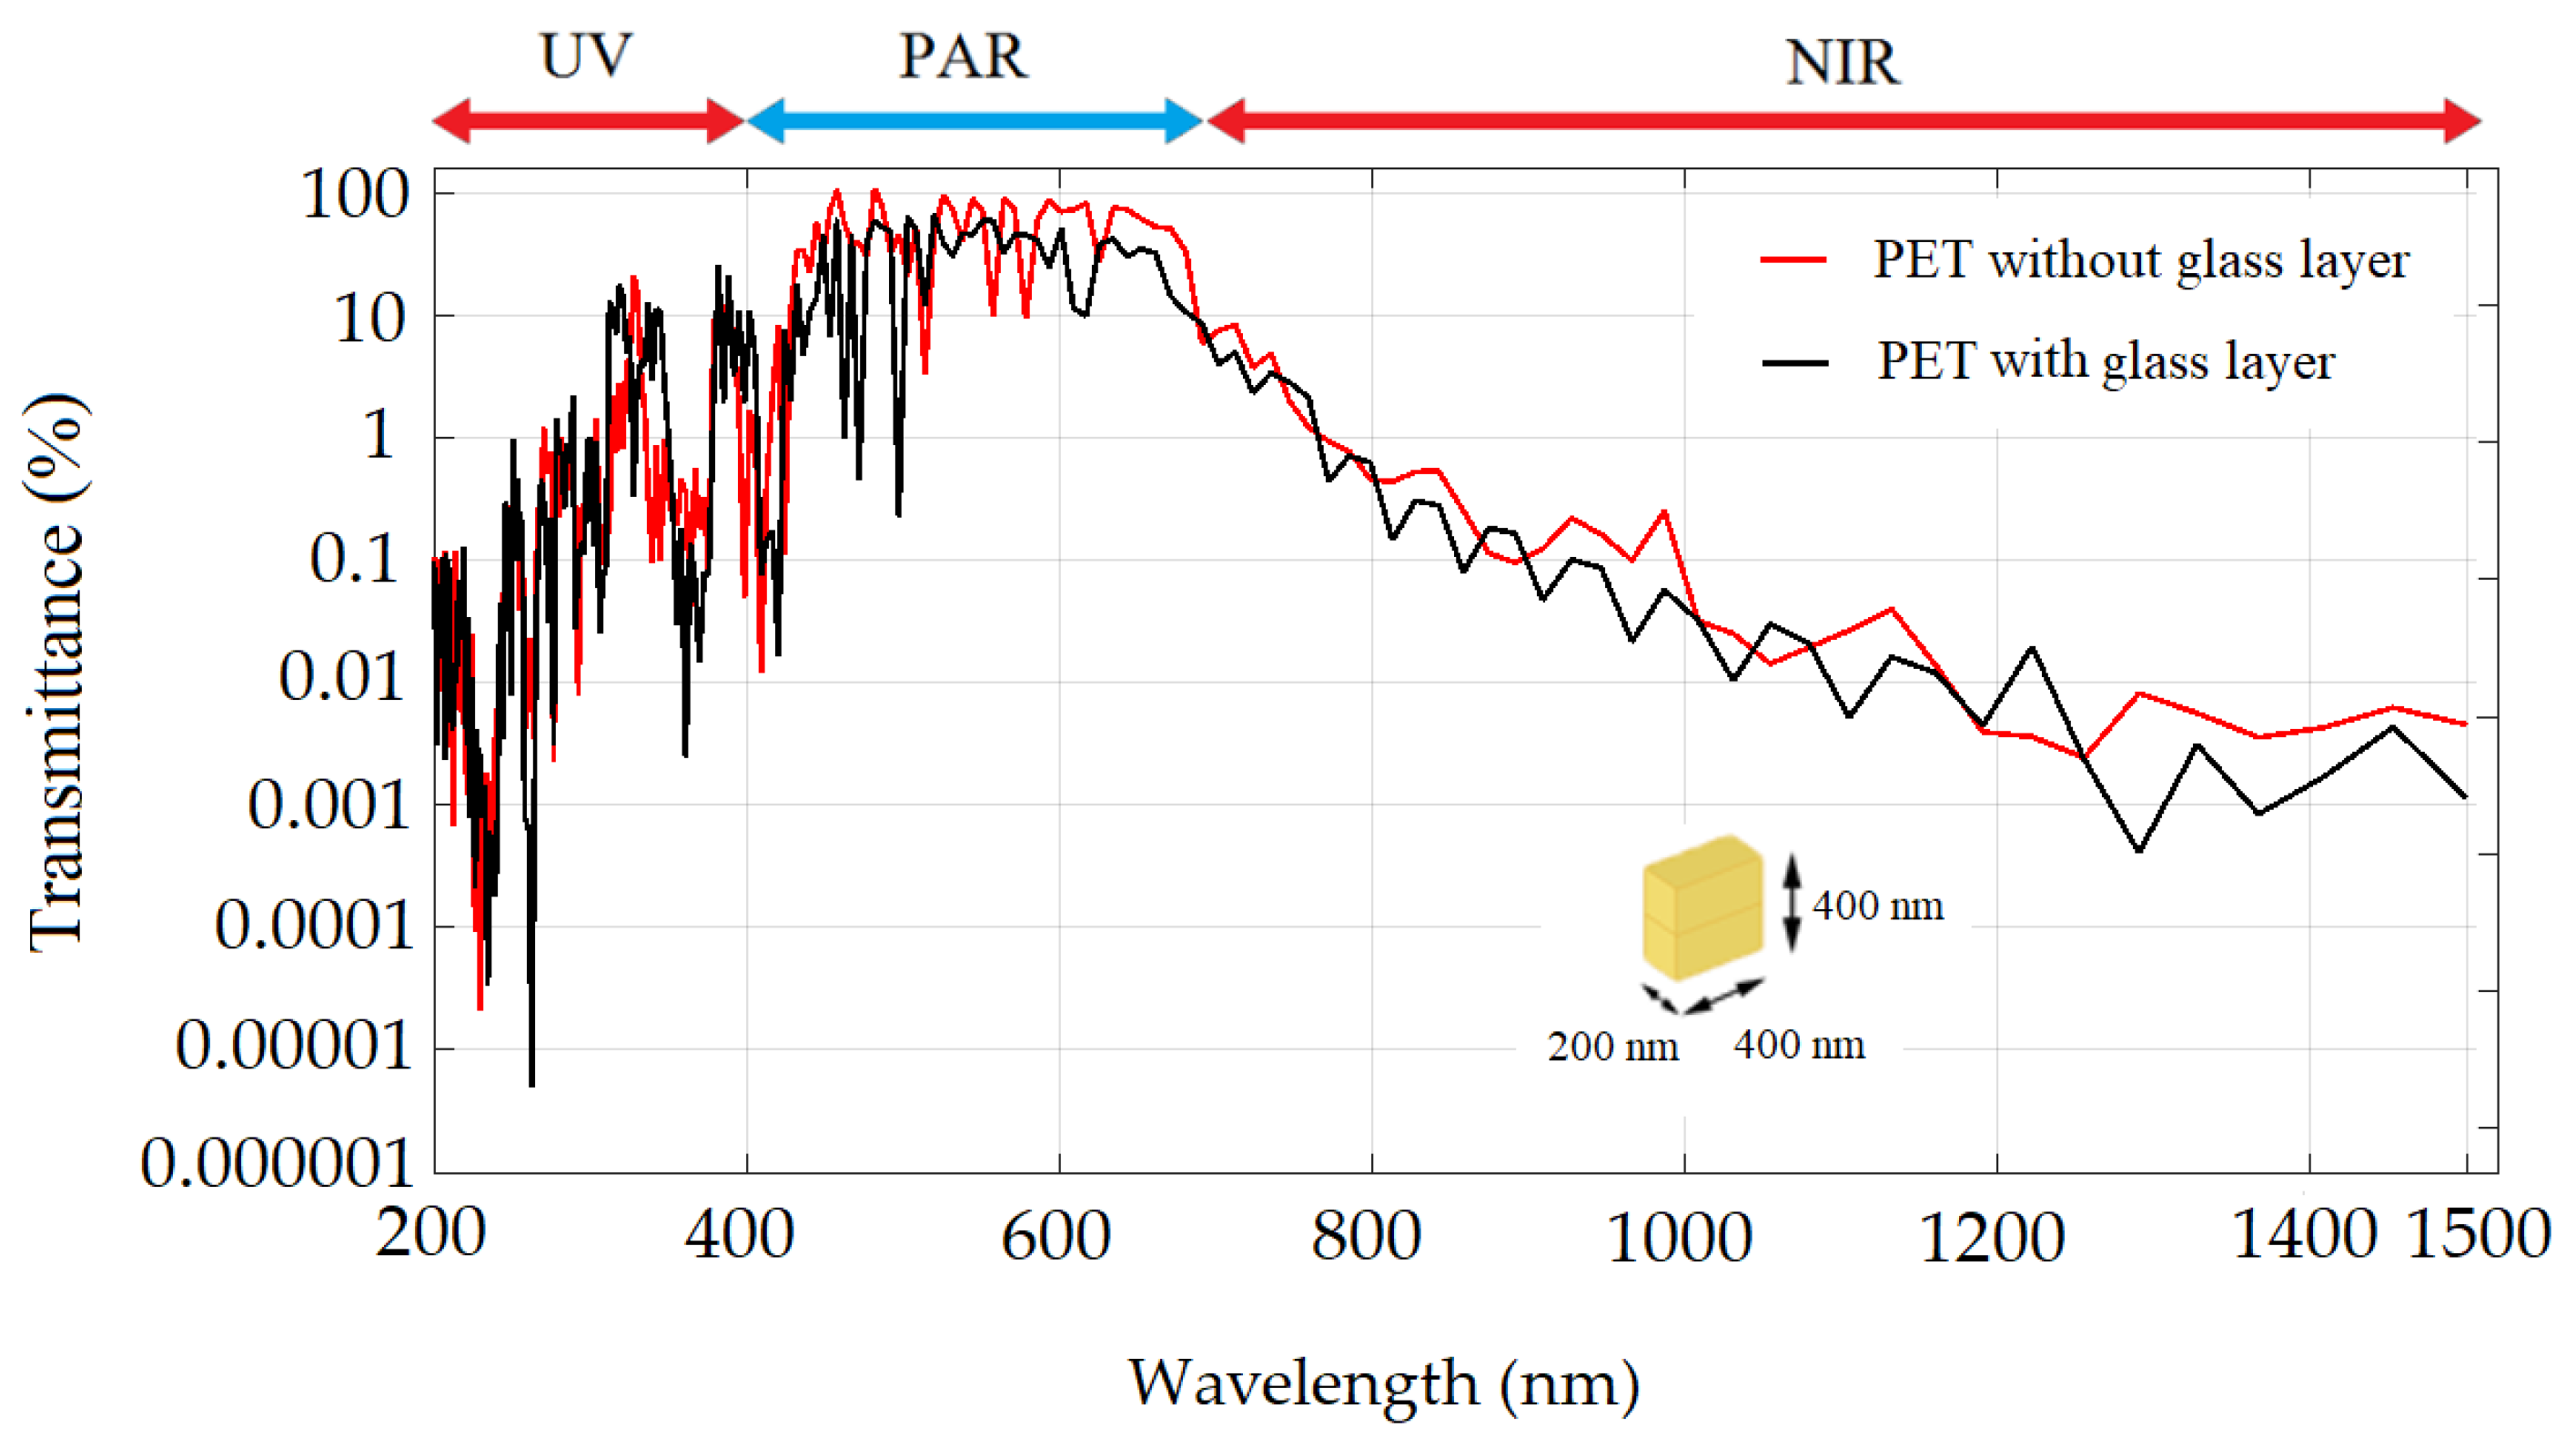
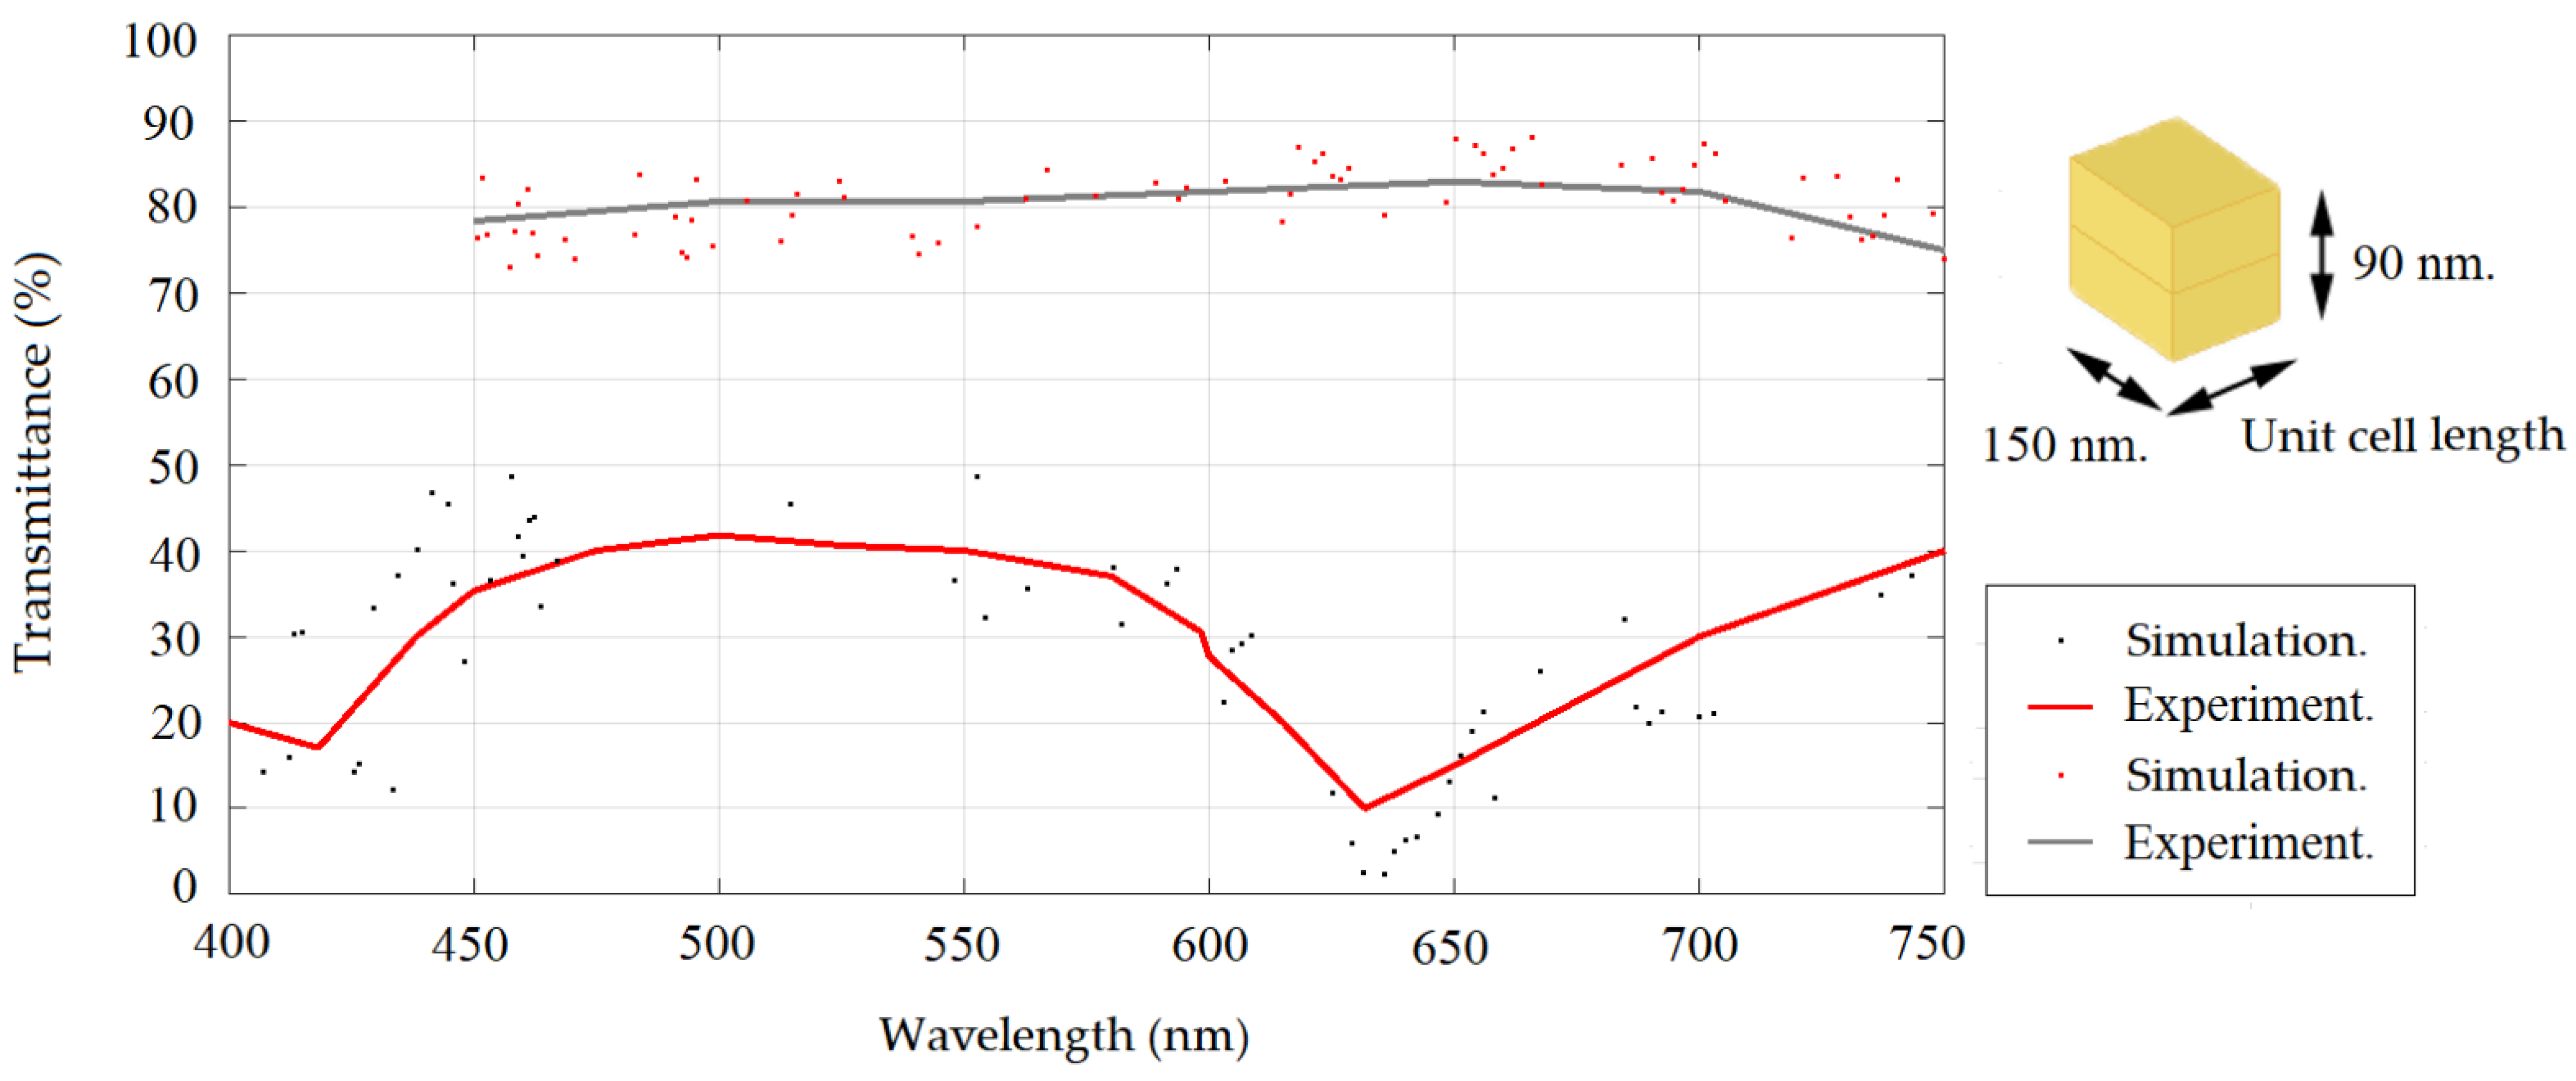
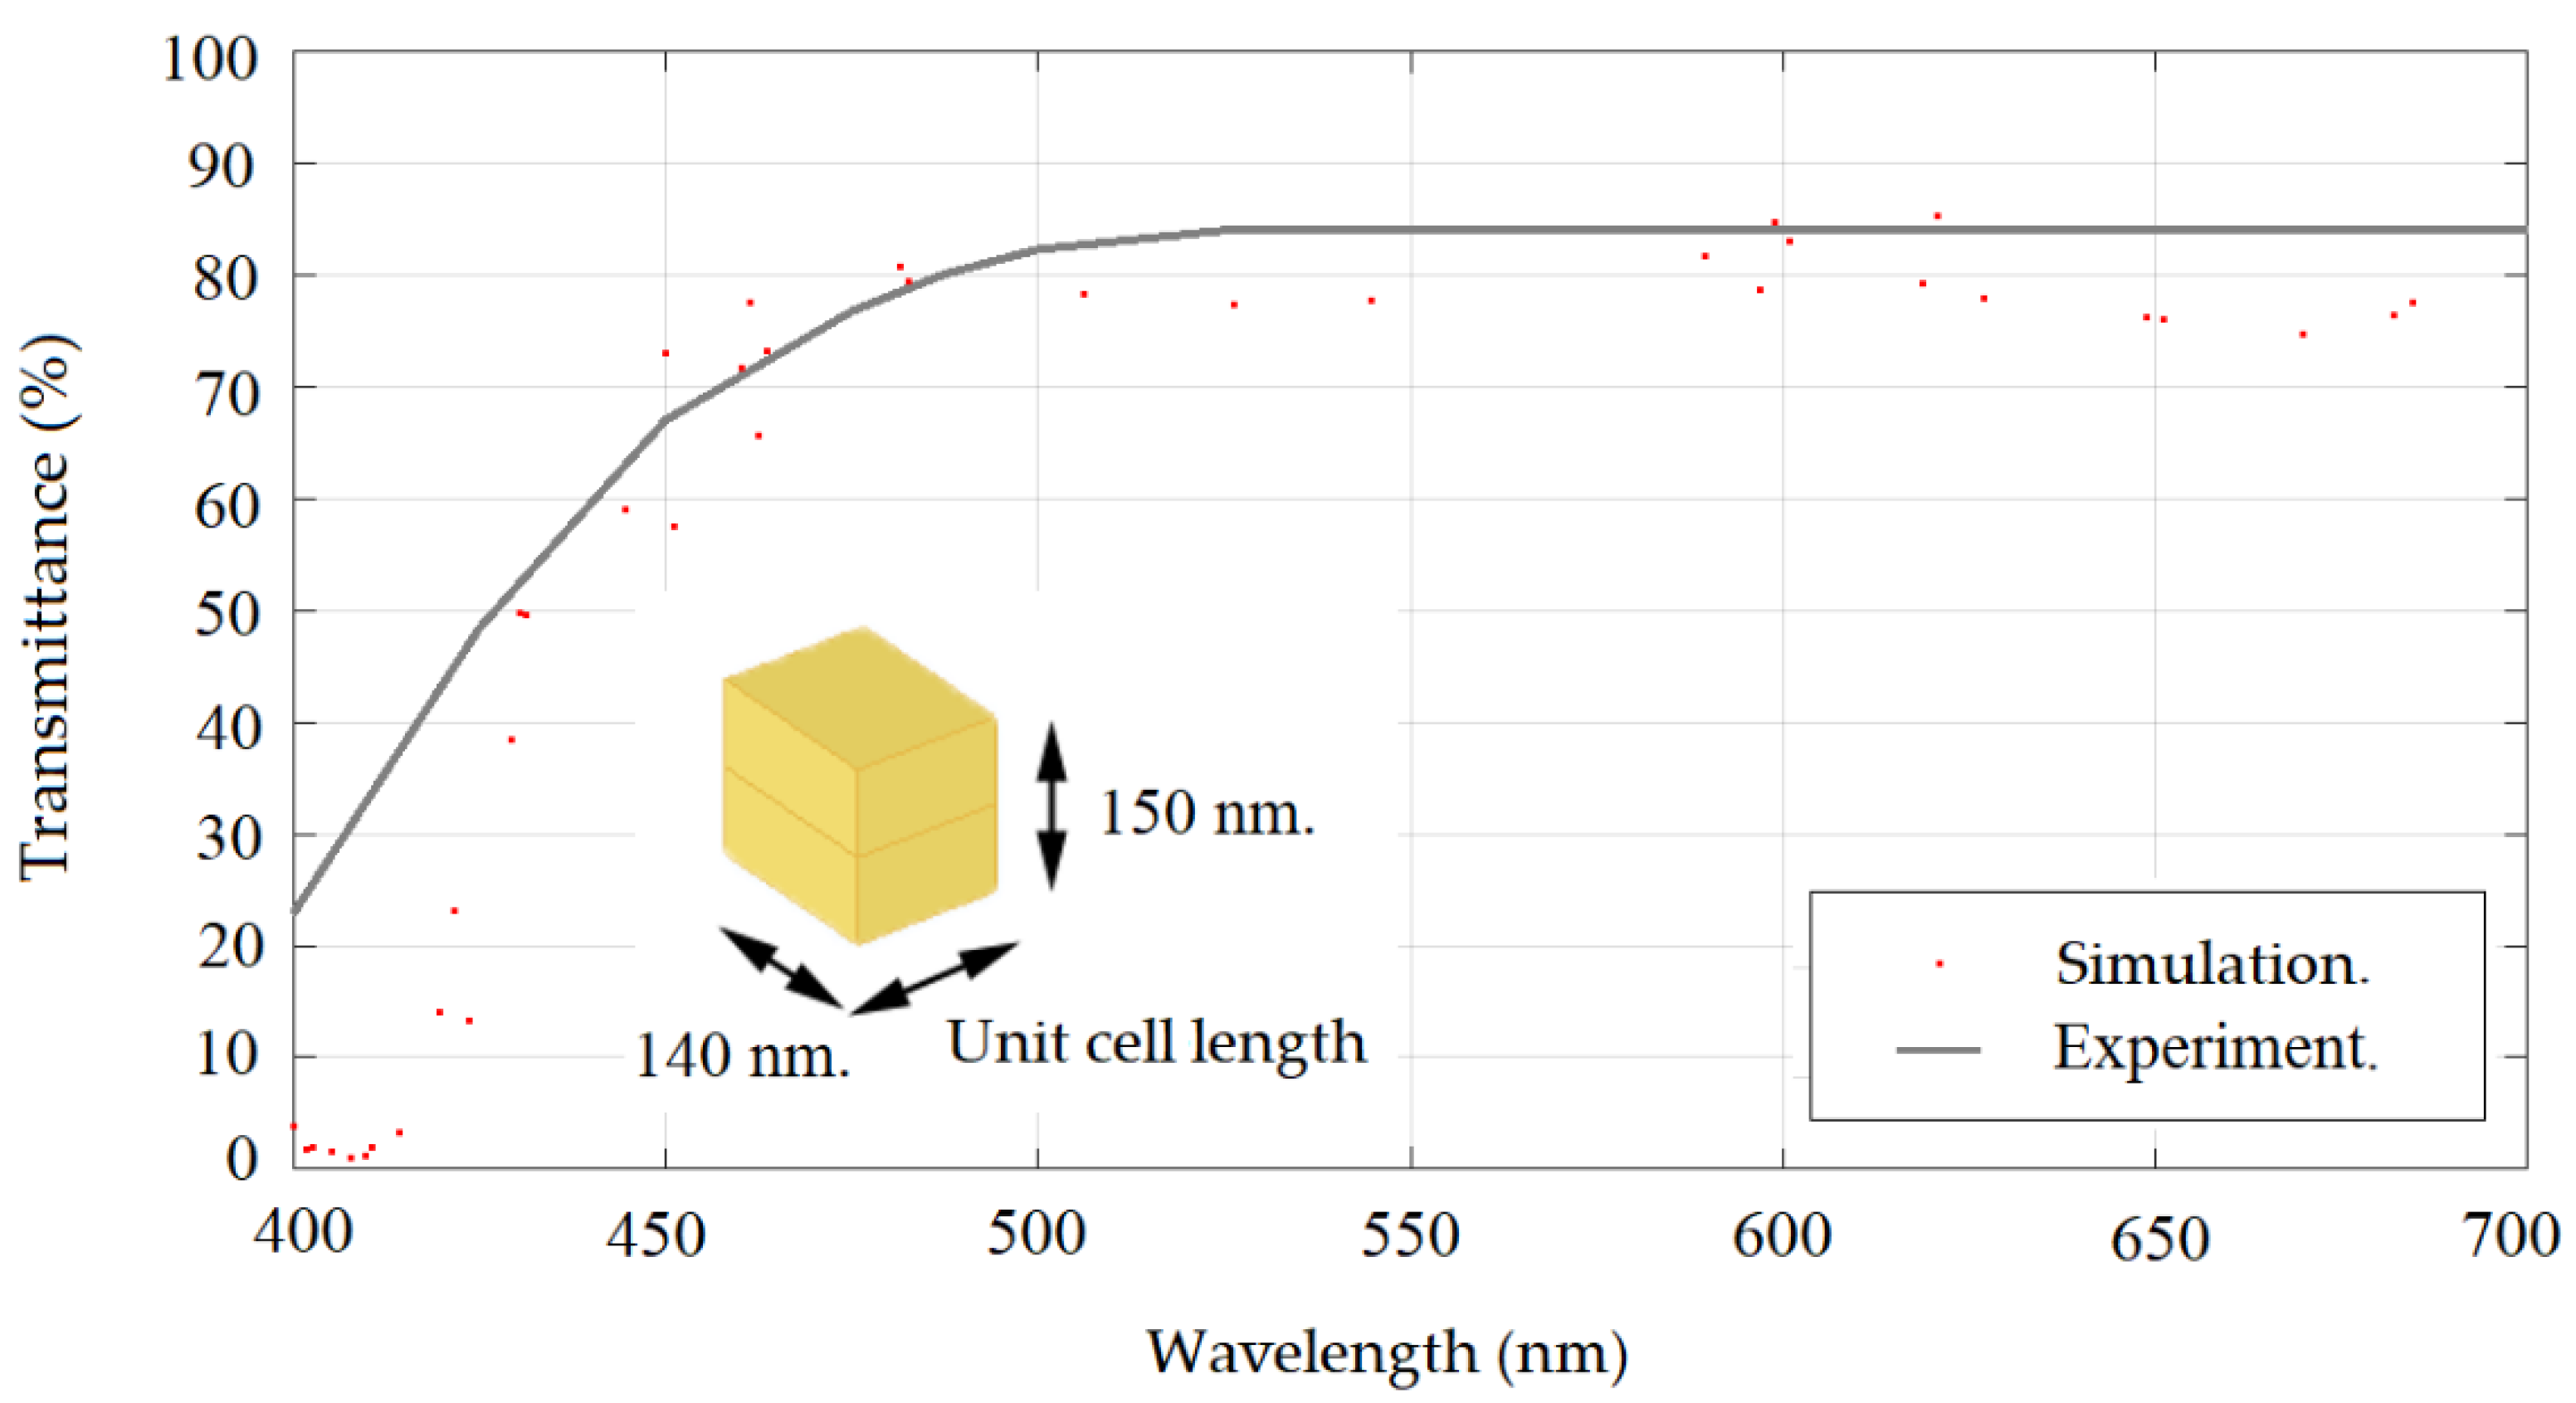
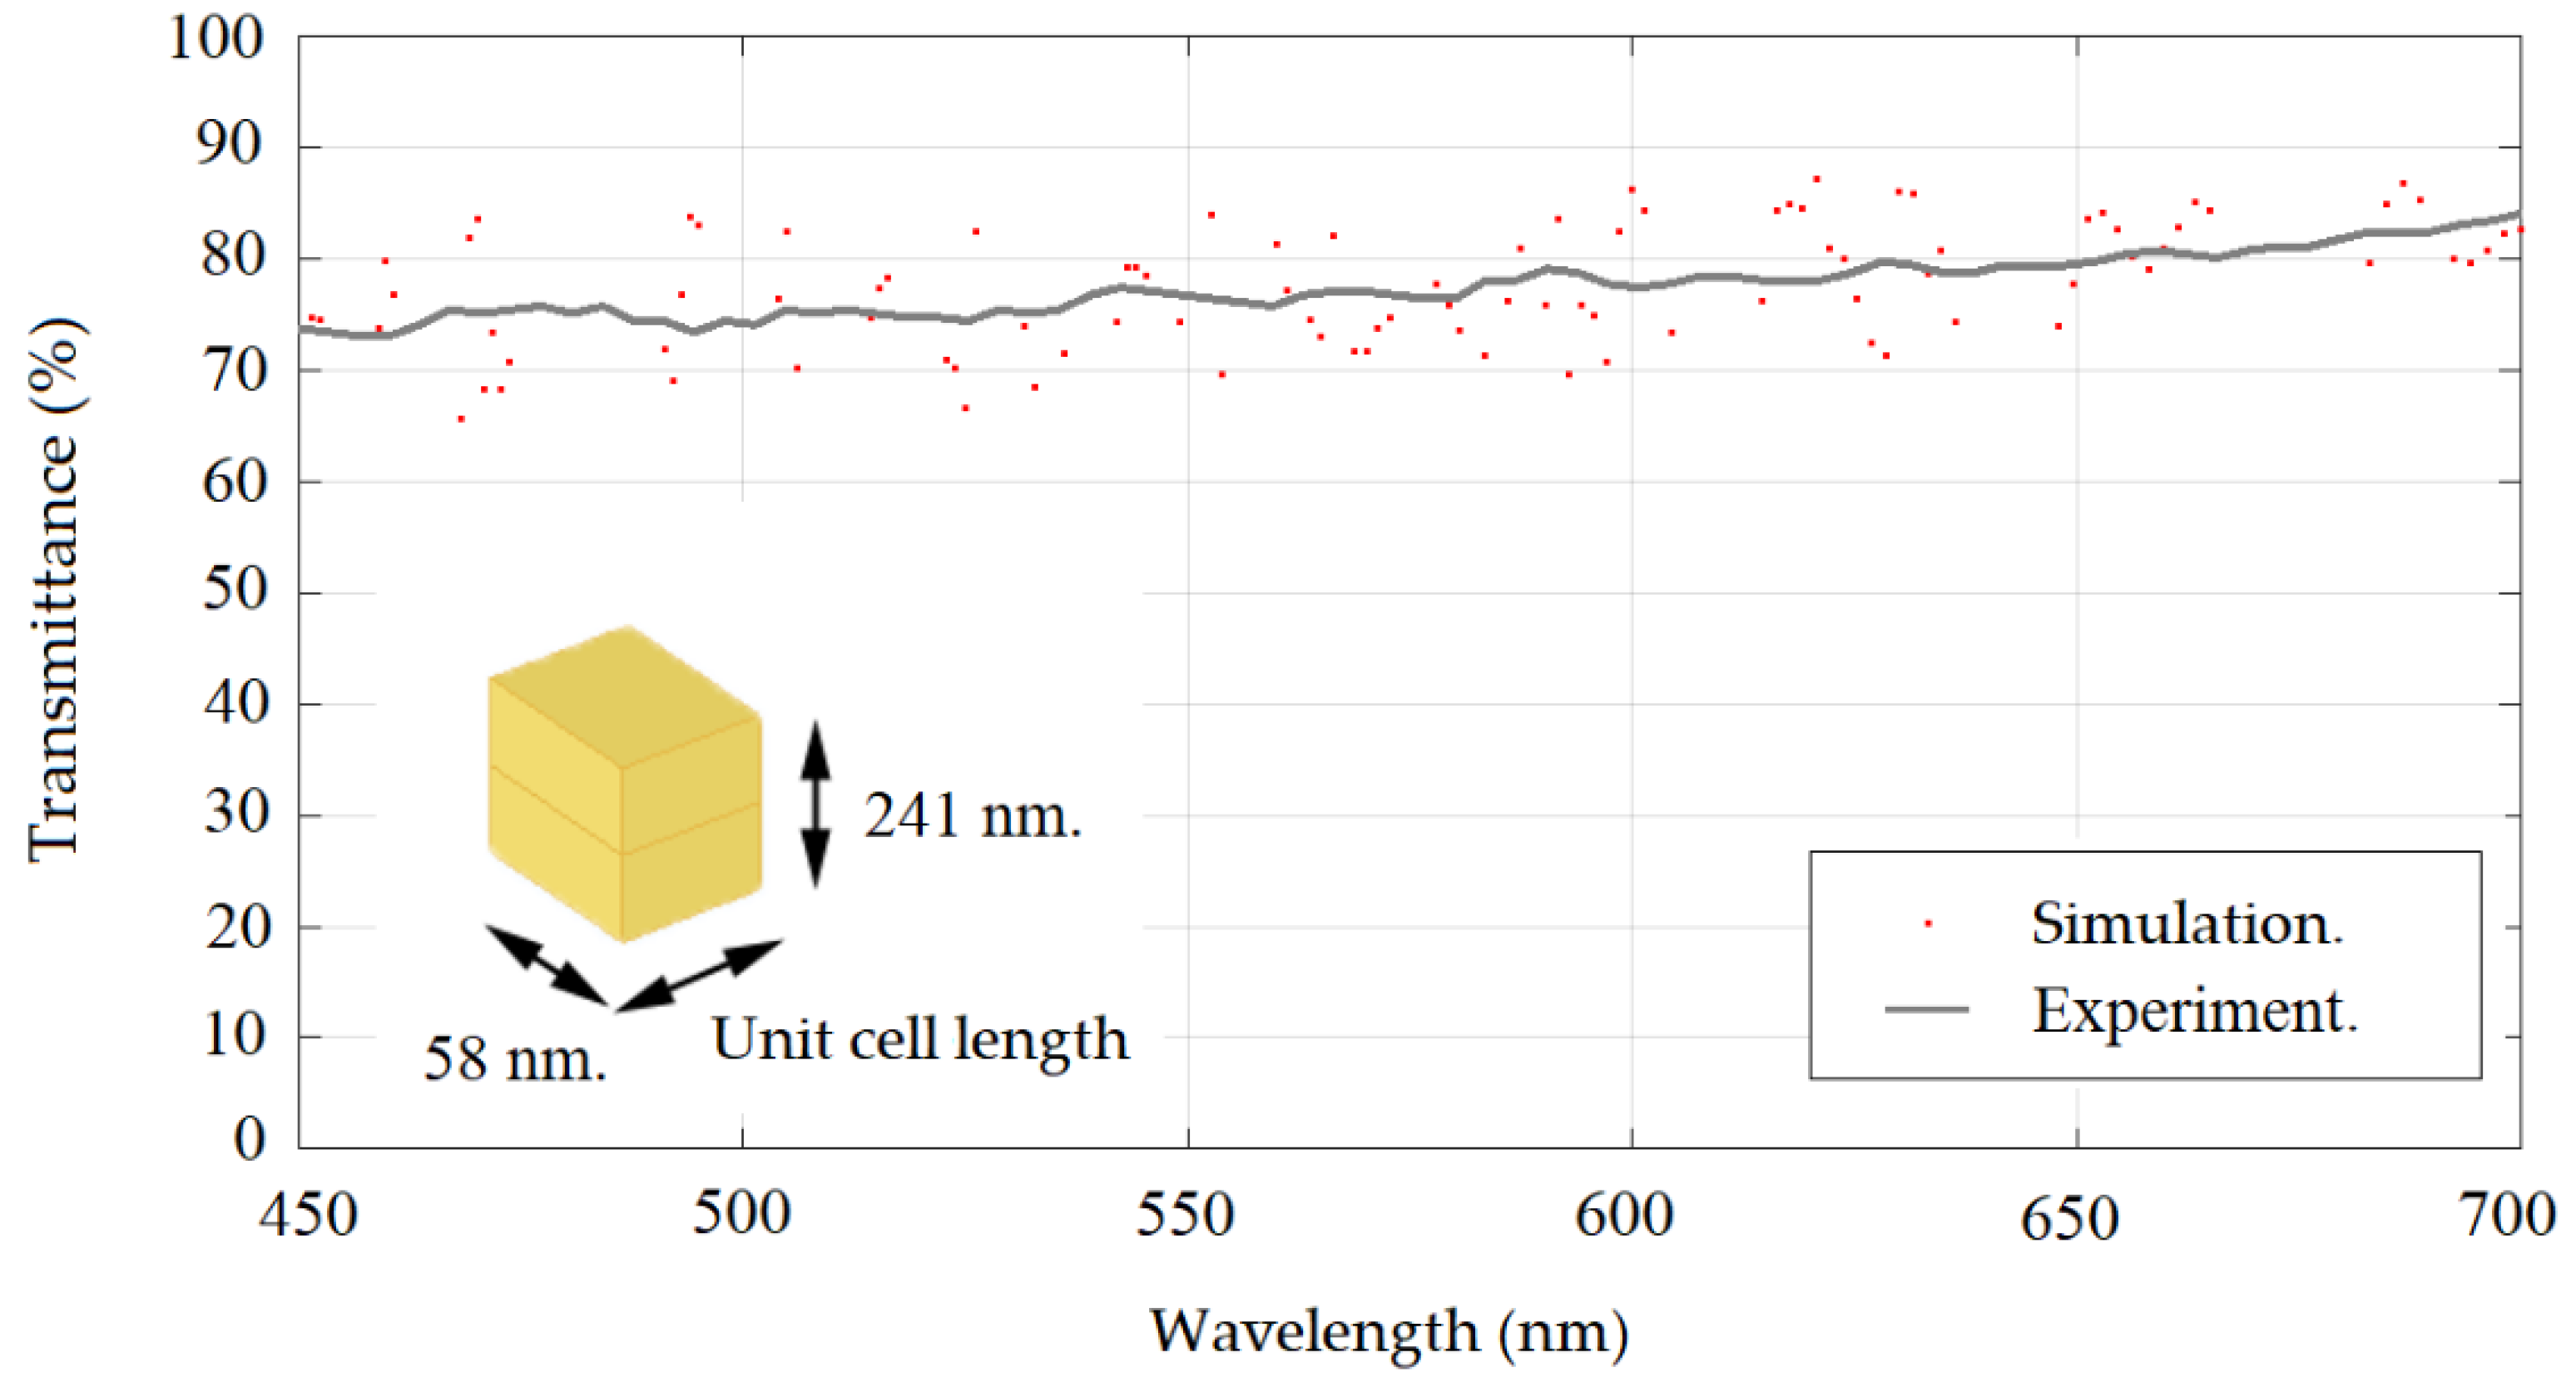
3.3. Validation of the Results
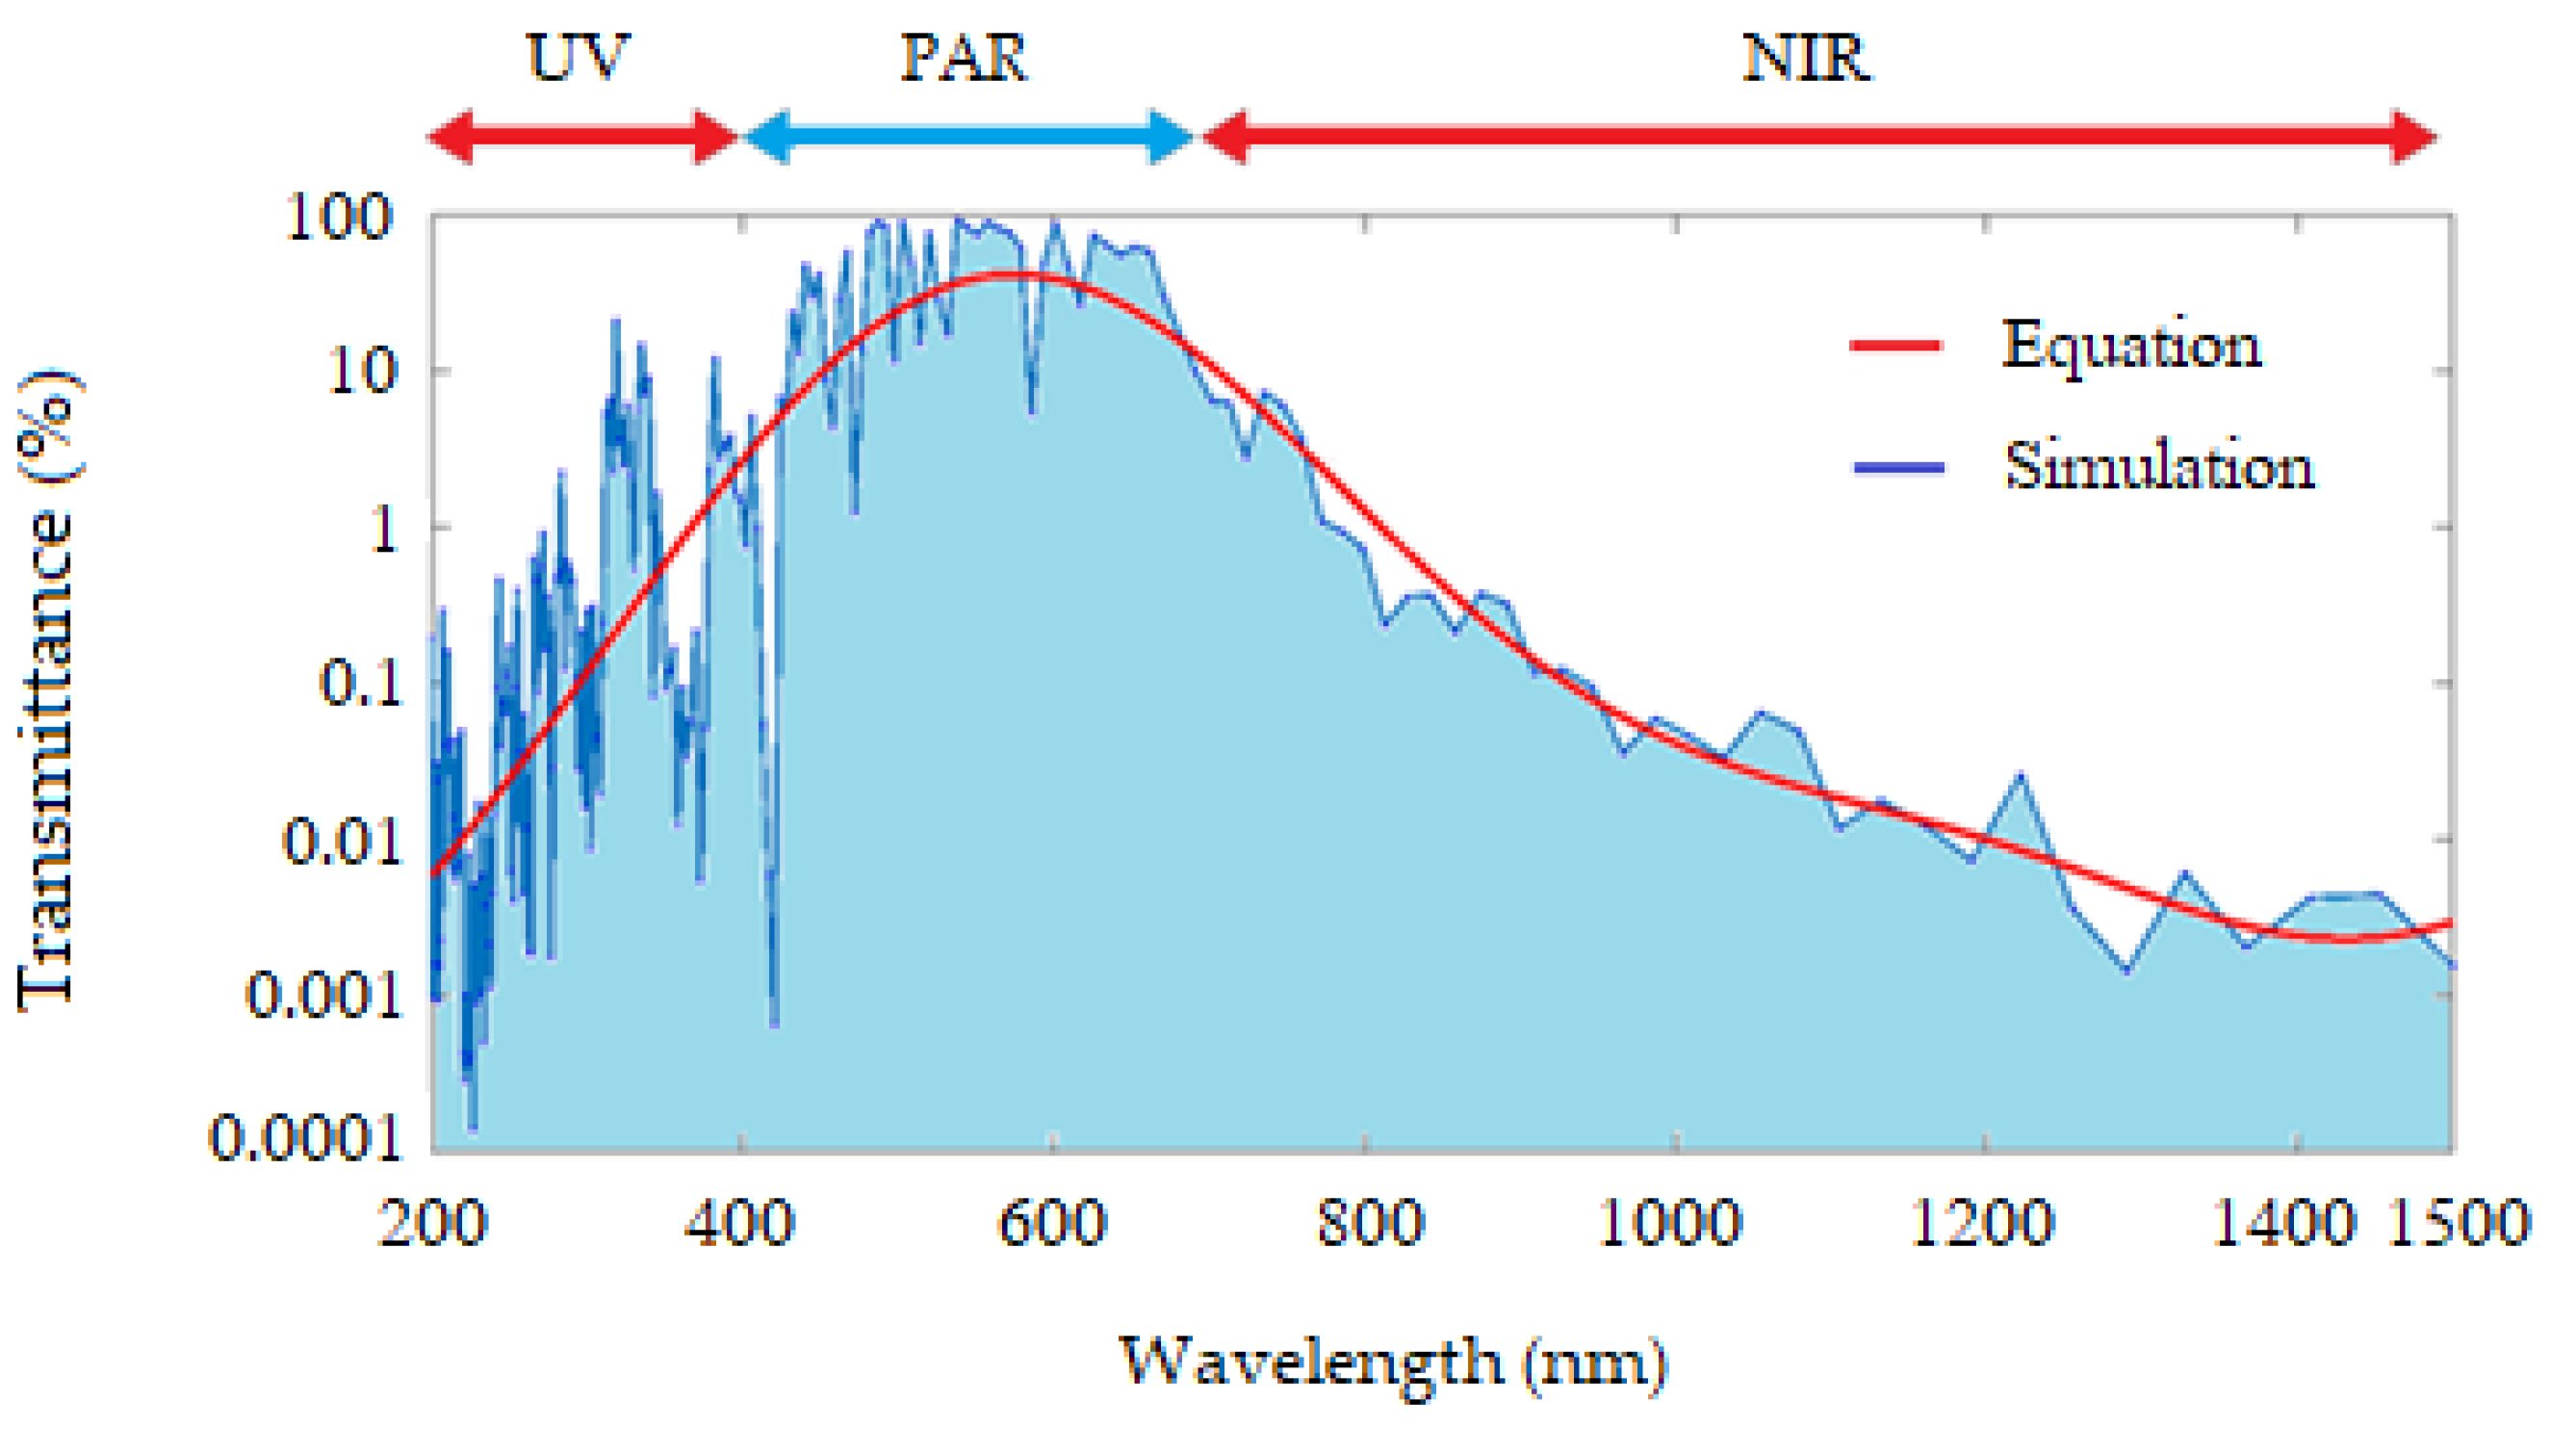
3.4. The Regression Analysis
4. Conclusions and Future Work
Author Contributions
Funding
Acknowledgments
Conflicts of Interest
Abbreviations
| BPF | Band-pass filter |
| FEA | Finite element analysis |
| FSS | Frequency selective surface |
| GMMs | Gaussian mixture models |
| LLDPE | Linear low-density polyethylene |
| Low-E | Low-emissivity |
| NIR | Near-infrared |
| PML | Perfectly matched layer |
| PAR | Photosynthetically active radiation |
| PE | Polyethylene |
| PET | Polyethylene terephthalate |
| PVC | Polyvinyl chloride |
| UV | Ultraviolet |
References
- Kumar, K.; Tiwari, K.; Jha, M.K. Design and technology for greenhouse cooling in tropical and subtropical regions: A review. Energy Build. 2009, 41, 1269–1275. [Google Scholar] [CrossRef]
- Behn, H.; Tittmann, S.; Walter, A.; Schurr, U.; Noga, G.; Ulbrich, A. UV-B transmission of greenhouse covering materials affects growth and flavonoid content of lettuce seedlings. Eur. J. Hortic. Sci. 2010, 75, 259–268. [Google Scholar]
- Abdel-Ghany, A.M.; Al-Helal, I.M.; Alzahrani, S.M.; Alsadon, A.A.; Ali, I.M.; Elleithy, R.M. Covering Materials Incorporating Radiation-Preventing Techniques to Meet Greenhouse Cooling Challenges in Arid Regions: A Review. Sci. World J. 2012, 2012, 1–11. [Google Scholar] [CrossRef]
- Dehbi, A.; Mourad, A.-H.I. Durability of mono-layer versus tri-layers LDPE films used as greenhouse cover: Comparative study. Arab. J. Chem. 2016, 9, S282–S289. [Google Scholar] [CrossRef]
- Chen, P.; Liu, T.; Wang, D.; Zhang, Q.; Hu, L. Modified Vinyl–POSS Materials as Sun Protection Factor and as Films for Greenhouse Cover. Ferroelectrics 2010, 411, 36–43. [Google Scholar] [CrossRef]
- Yang, X.; Miller, D.R. Calculation of Potential Broadband Biologically Active and Thermal Solar Radiation above Vegetation Canopies. J. Appl. Meteorol. 1995, 34, 861–872. [Google Scholar] [CrossRef][Green Version]
- Hemming, S.; Kempkes, F.; Van Der Braak, N.; Dueck, T.; Marissen, N. Greenhouse Cooling by Nir-Reflection. Acta Hortic. 2006, 719, 97–106. [Google Scholar] [CrossRef]
- Dehbi, A.; Mourad, A.-H.I.; Djakhdane, K.; Hilal-Alnaqbi, A. Degradation of thermomechanical performance and lifetime estimation of multilayer greenhouse polyethylene films under simulated climatic conditions. Polym. Eng. Sci. 2014, 55, 287–298. [Google Scholar] [CrossRef]
- Petchsuk, A.; Srinun, D.; Buchatip, S.; Supmak, W.; Sirikittikul, D. Development of Multifunctional Film for Greenhouse Applications in Tropical Regions. Adv. Mater. Sci. Eng. 2019, 2019, 1692126. [Google Scholar] [CrossRef]
- Maraveas, C. Environmental Sustainability of Greenhouse Covering Materials. Sustainability 2019, 11, 6129. [Google Scholar] [CrossRef]
- Solovyev, A.; Rabotkin, S.; Kovsharov, N. Polymer films with multilayer low-E coatings. Mater. Sci. Semicond. Process. 2015, 38, 373–380. [Google Scholar] [CrossRef]
- Sánchez, V.H.; López, R.; Ramón, G.M.; Enríquez-Pérez, A.; Camacho-López, M.; Villa-Sánchez, G. Annealing Control on the Anatase/Rutile Ratio of Nanostructured Titanium Dioxide Obtained by Sol-Gel. Crystals 2018, 9, 22. [Google Scholar] [CrossRef]
- Lu, P.J.; Fang, S.W.; Cheng, W.L.; Huang, S.C.; Huang, M.C.; Cheng, H.F. Characterization of titanium dioxide and zinc oxide nanoparticles in sunscreen powder by comparing different measurement methods. J. Food Drug Anal. 2018, 26, 1192–1200. [Google Scholar] [CrossRef] [PubMed]
- Kang, X.; Liu, S.; Dai, Z.; He, Y.; Song, X.; Tan, Z. Titanium Dioxide: From Engineering to Applications. Crystals 2019, 9, 191. [Google Scholar] [CrossRef]
- Espejo, C.; Arribas, A.; Monzó, F.; Díez, P. Nanocomposite films with enhanced radiometric properties for greenhouse covering applications. J. Plast. Film. Sheeting 2012, 28, 336–350. [Google Scholar] [CrossRef]
- Sripradit, A.; Theeradejvanichkul, T. A frequency selective surface with nano square ring resonators for enhancing banknote security. In Proceedings of the 2017 IEEE International Symposium on Antennas and Propagation USNC/URSI National Radio Science Meeting, San Diego, CA, USA, 9–14 July 2017; pp. 677–678. [Google Scholar]
- Max, J.F.; Reisinger, G.; Hofmann, T.; Hinken, J.; Tantau, H.-J.; Ulbrich, A.; Lambrecht, S.; Von Elsner, B.; Schurr, U. Glass–film-combination: Opto-physical properties and energy saving potential of a novel greenhouse glazing system. Energy Build. 2012, 50, 298–307. [Google Scholar] [CrossRef]
- Toor, F.; Guneratne, A.C.; Temchenko, M. Metal-dielectric frequency-selective surface for high performance solar window coatings. Photonic Phononic Prop. Eng. Nanostruct. VI 2016, 9756, 97561S. [Google Scholar]
- Refractive Index Database. Available online: https://refractiveindex.info/?shelf=mainbook=Alpage=Rakic (accessed on 4 December 2017).
- Hong, N.; Synowicki, R.A.; Hilfiker, J.N. Mueller matrix characterization of flexible plastic substrates. Appl. Surf. Sci. 2017, 421, 518–528. [Google Scholar] [CrossRef]
- Refractive Index Database. Available online: https://refractiveindex.info/?shelf=glassbook=soda-limepage=Rubin-clear (accessed on 9 December 2017).
- Poudel, K.N. Computational Modeling of Maximum Length Sequence (MLS) Multilayer and Grating Structures. Ph.D. Thesis, Middle Tennessee State University, Murfreesboro, TN, USA, February 2020. [Google Scholar]
- Frequency Selective Surface, Periodic Complementary Split Ring Resonator. Available online: https://www.comsol.com/model/download/281491/models.rf.frequencyselective (accessed on 4 December 2017).
- Fu, X.; Du, Q. Uptake of Di-(2-ethylhexyl) Phthalate of Vegetables from Plastic Film Greenhouses. J. Agric. Food Chem. 2011, 59, 11585–11588. [Google Scholar] [CrossRef]
- Xie, Z.-W.; Yang, J.-H.; Vashistha, V.; Lee, W.; Chen, K.-P. Liquid-crystal tunable color filters based on aluminum metasurfaces. Opt. Express 2017, 25, 30764–30770. [Google Scholar] [CrossRef] [PubMed]
- Lin, M.-Y.; Tsai, T.-H.; Hsiao, L.-J.; Tu, W.-C.; Wu, S.-H.; Wang, L.A.; Lee, S.-C.; Lin, H.Y. Design and Fabrication of Nano-Structure for Three-Dimensional Display Application. IEEE Photonics Technol. Lett. 2016, 28, 884–886. [Google Scholar] [CrossRef]
- Wu, C.-L.; Sung, C.-K.; Yao, P.-H.; Chen, C.-H. Sub-15 nm linewidth gratings using roll-to-roll nanoimprinting and plasma trimming to fabricate flexible wire-grid polarizers with low colour shift. Nanotechnology 2013, 24, 265301. [Google Scholar] [CrossRef] [PubMed]
- Shin, Y.J.; Pina-Hernandez, C.; Wu, Y.-K.; Ok, J.G.; Guo, L.J. Facile route of flexible wire grid polarizer fabrication by an-gled-evaporations of aluminum on two sidewalls of an imprinted nanograting. Nanotechnology 2012, 23, 344018. [Google Scholar] [CrossRef]
- Wu, C.-L.; Yao, P.-H.; Lin, C.-H.; Sung, C.-K.; Chen, C.-H. Fabrication of flexible metallic wire grid polarizer using thermal NIL and lift-off processes. Microelectron. Eng. 2012, 98, 117–120. [Google Scholar] [CrossRef]
- Chen, L.; Wang, J.J.; Walters, F.; Deng, X.; Buonanno, M.; Tai, S.; Liu, X.; Deng, D. 58 nm half-pitch plastic wire-grid polarizer by nanoimprint lithography. J. Vac. Sci. Technol. B Microelectron. Nanometer Struct. 2007, 25, 2654. [Google Scholar] [CrossRef]
- Ahn, S.-W.; Lee, K.-D.; Kim, J.-S.; Kim, S.H.; Park, J.-D.; Lee, S.-H.; Yoon, P.-W. Fabrication of a 50 nm half-pitch wire grid polarizer using nanoimprint lithography. Nanotechnology 2005, 16, 1874–1877. [Google Scholar] [CrossRef]


| Ref. | W (nm) | H (nm) | % Transmittance (Experiment) | % Transmittance (Simulation) | Wavelength (nm) | Difference (%) |
|---|---|---|---|---|---|---|
| [25] | 150 | 90 | Figure 9 | Figure 9 | Figure 9 | - |
| [26] | 70 | 200 | Figure 10 | Figure 10 | Figure 10 | - |
| [27] | 140 | 150 | Figure 11 | Figure 11 | Figure 11 | - |
| [28] | 58 | 241 | Figure 9 | Figure 9 | Figure 9 | - |
| [29] | 107 | 145 | 61 | 51.78 | 635 | 15.11 |
| [30] | 47 | 177 | 76 | 80.59 | 450 | 6.04 |
| [30] | 47 | 177 | 79 | 73.15 | 550 | 7.41 |
| [31] | 50 | 200 | 85 | 80.54 | 450 | 5.25 |
| 1 | b1 | c1 | 2 | b2 | c2 | 3 | b3 | c3 |
|---|---|---|---|---|---|---|---|---|
| 44.7 | 549.7 | 327.3 | −13.3 | 1462 | 238.8 | −3599 | −19,680 | 9754 |
Publisher’s Note: MDPI stays neutral with regard to jurisdictional claims in published maps and institutional affiliations. |
© 2022 by the authors. Licensee MDPI, Basel, Switzerland. This article is an open access article distributed under the terms and conditions of the Creative Commons Attribution (CC BY) license (https://creativecommons.org/licenses/by/4.0/).
Share and Cite
Sripradit, A.; Theeradejvanichkul, T. Design and Simulation of a Greenhouse FSS Nanofiber Film for Enhancing Agricultural Productivity by Selective Reduction of UV and NIR. Inventions 2022, 7, 16. https://doi.org/10.3390/inventions7010016
Sripradit A, Theeradejvanichkul T. Design and Simulation of a Greenhouse FSS Nanofiber Film for Enhancing Agricultural Productivity by Selective Reduction of UV and NIR. Inventions. 2022; 7(1):16. https://doi.org/10.3390/inventions7010016
Chicago/Turabian StyleSripradit, Abhisit, and Thorin Theeradejvanichkul. 2022. "Design and Simulation of a Greenhouse FSS Nanofiber Film for Enhancing Agricultural Productivity by Selective Reduction of UV and NIR" Inventions 7, no. 1: 16. https://doi.org/10.3390/inventions7010016
APA StyleSripradit, A., & Theeradejvanichkul, T. (2022). Design and Simulation of a Greenhouse FSS Nanofiber Film for Enhancing Agricultural Productivity by Selective Reduction of UV and NIR. Inventions, 7(1), 16. https://doi.org/10.3390/inventions7010016