Abstract
This paper aims to evaluate the energy potential of six sites located in the Black Sea, all of them near the Romanian shore. To conduct this study, a climate scenario was chosen which considers that the emissions of carbon dioxide will increase until 2040 when they reach a peak, decreasing afterward. This scenario is also known as RCP 4.5. The wind dynamics is considered for two periods of time. The first is for the near future with a duration of 30 years from 2021 to 2050, the second period is for the far-distant future with a span of 30 years from 2071 to 2100. In this study, parameters such as minimum, maximum, mean wind speed, interpolated at 90 m height were analyzed to create an overview of the wind quality in these areas, followed by an analysis of the power density parameters such as seasonal and monthly wind power. In the end, the annual electricity production and capacity factor were analyzed using five high-power wind turbines, ranging from 6 to 9.5 MW. For the purpose of this paper, the data on the wind speed at 10 m height in the RCP 4.5 scenario was obtained from the database provided by the Swedish Meteorology and Hydrology Institute (SMHI).
1. Introduction
Renewable energy is a crucial aspect for the future of human prosperity without causing damages to the environment. Increasing the supply of renewable energy allows for the replacement of the energy extracted from carbides (for example fossil fuels) and the reduction of greenhouse gas emissions. One of the many benefits of renewable energy is the ability to improve both public health (due to reduced air and water pollution) and environmental quality. Renewable energy sources are essential for long-term efforts to attenuate climate change and are expected to play an increasingly important role in improving the overall energy security of the entire planet [1]. By developing infrastructure to provide modern energy services with sustainable, reliable, and affordable access, people, communities, and countries can significantly improve their living standards and economic status [2]. Studies conducted to outline a global picture of climate changes have indicated a dependency relationship between future climate dynamics and emissions.
The demand for renewable energy has started to spread globally [3,4], especially in Europe, where emissions are very high [5]. According to statistics from the Global Carbon Project, emissions of from the burning of fossil fuels in the European Union member states peaked in 2017, when they had a value of 3.13 , followed by a continuous decrease, reaching 2.6 in 2020. The capacity of wind energy worldwide, both on land and water, has increased about 75 times, from 7.5 GW in 1997 to about 565 GW in 2018 (only 23 GW representing the offshore wind), according to the latest data from IRENA (International Renewable Energy Agency) [6]. Wind energy production doubled between 2009 and 2013, and in 2016 wind energy accounted for about 16% of the total renewable energy [7].
In the offshore wind market, the aim is to reduce the total cost of energy production to make this sector as competitive as possible, while increasing the level of safety [8,9]. This goal involves everyone able to improve the wind farm sector, from developers to design agencies to contractors.
The evolution of the price [10] from 2010 to 2019 shows a major decrease in the price of energy produced from renewable resources. The price of offshore wind energy has decreased from 0.161 (in 2010) to 0.115 (in 2019). By 2023, a substantial decrease is expected, the price of offshore wind energy could reach 0.082 . Comparing these values with the energy price obtained from conventional resources, whose LCOE (Levelized Cost of Energy) [11] is estimated at 0.14 we can say that renewable sources have become a pillar to combat global warming, having competitive prices in relation to conventional resources.
To combat global warming, more and more international agreements require prompt action to reduce carbon dioxide emissions so that pollution levels can be limited [12]. These agreements aim to dramatically reduce the gap between the production of energy from conventional sources and energy from renewable sources. In Europe, the European Union has been the first pillar in terms of renewable energy, through EU legislation, which desired a much more rational integration of renewable sources. In 2009 the European Union implemented the Renewable Energy Directive [13], which set targets at a national level for all EU member states; this step was seen as a novelty and was a model also for non-EU countries to follow. In addition to the project mentioned above, the EU has addressed a multitude of related projects. Thanks to these projects, the European Union is today a leader in renewable energy [14], and in the future, a continuous increase in renewable sources is expected. This is a competitive advantage for the EU, helping to boost growth and demand for new jobs.
The present study aims to provide an image of the dynamics of the wind energy resources near the Romanian Black Sea coast. Moreover, taking into account the performance of some wind turbines, the paper aims to present a direct comparison between them having as benchmarks wind speeds for the near and distant future. Finally, to provide a contextualized picture, the results of this study are compared with those reported in similar studies. Although the subject of offshore wind energy in the Black Sea has begun to spread, according to the desire to exploit it, this paper addresses an issue of novelty. For the beginning, the analyzed period refers to the future, without analyzing the past. The reason is that the analysis wants to simulate the possible location of a wind farm, the past climate being able to provide only a picture of the wind dynamics and the past wind speed helping to outline an image of the climate change trend in the chosen sites. Moreover, the height at which the wind speed was analyzed was interpolated at a height of 90 m because the lowest height of the hub for the chosen turbines is 92 m. In addition, the chosen turbines are some of the most powerful wind turbines; they are turbines used for the wind farms that already operate or turbines used in the component of the wind farms that are going to be commissioned. The purpose for which these wind turbine models were chosen was to finally determine which type of turbine is more suitable for the areas of interest that will be further analyzed. Knowing the climate in the Black Sea and the type of turbines that best fit these areas, such aspects can help in the future to develop new wind farm projects.
2. Materials and Methods
2.1. Target Area and Wind Datasets
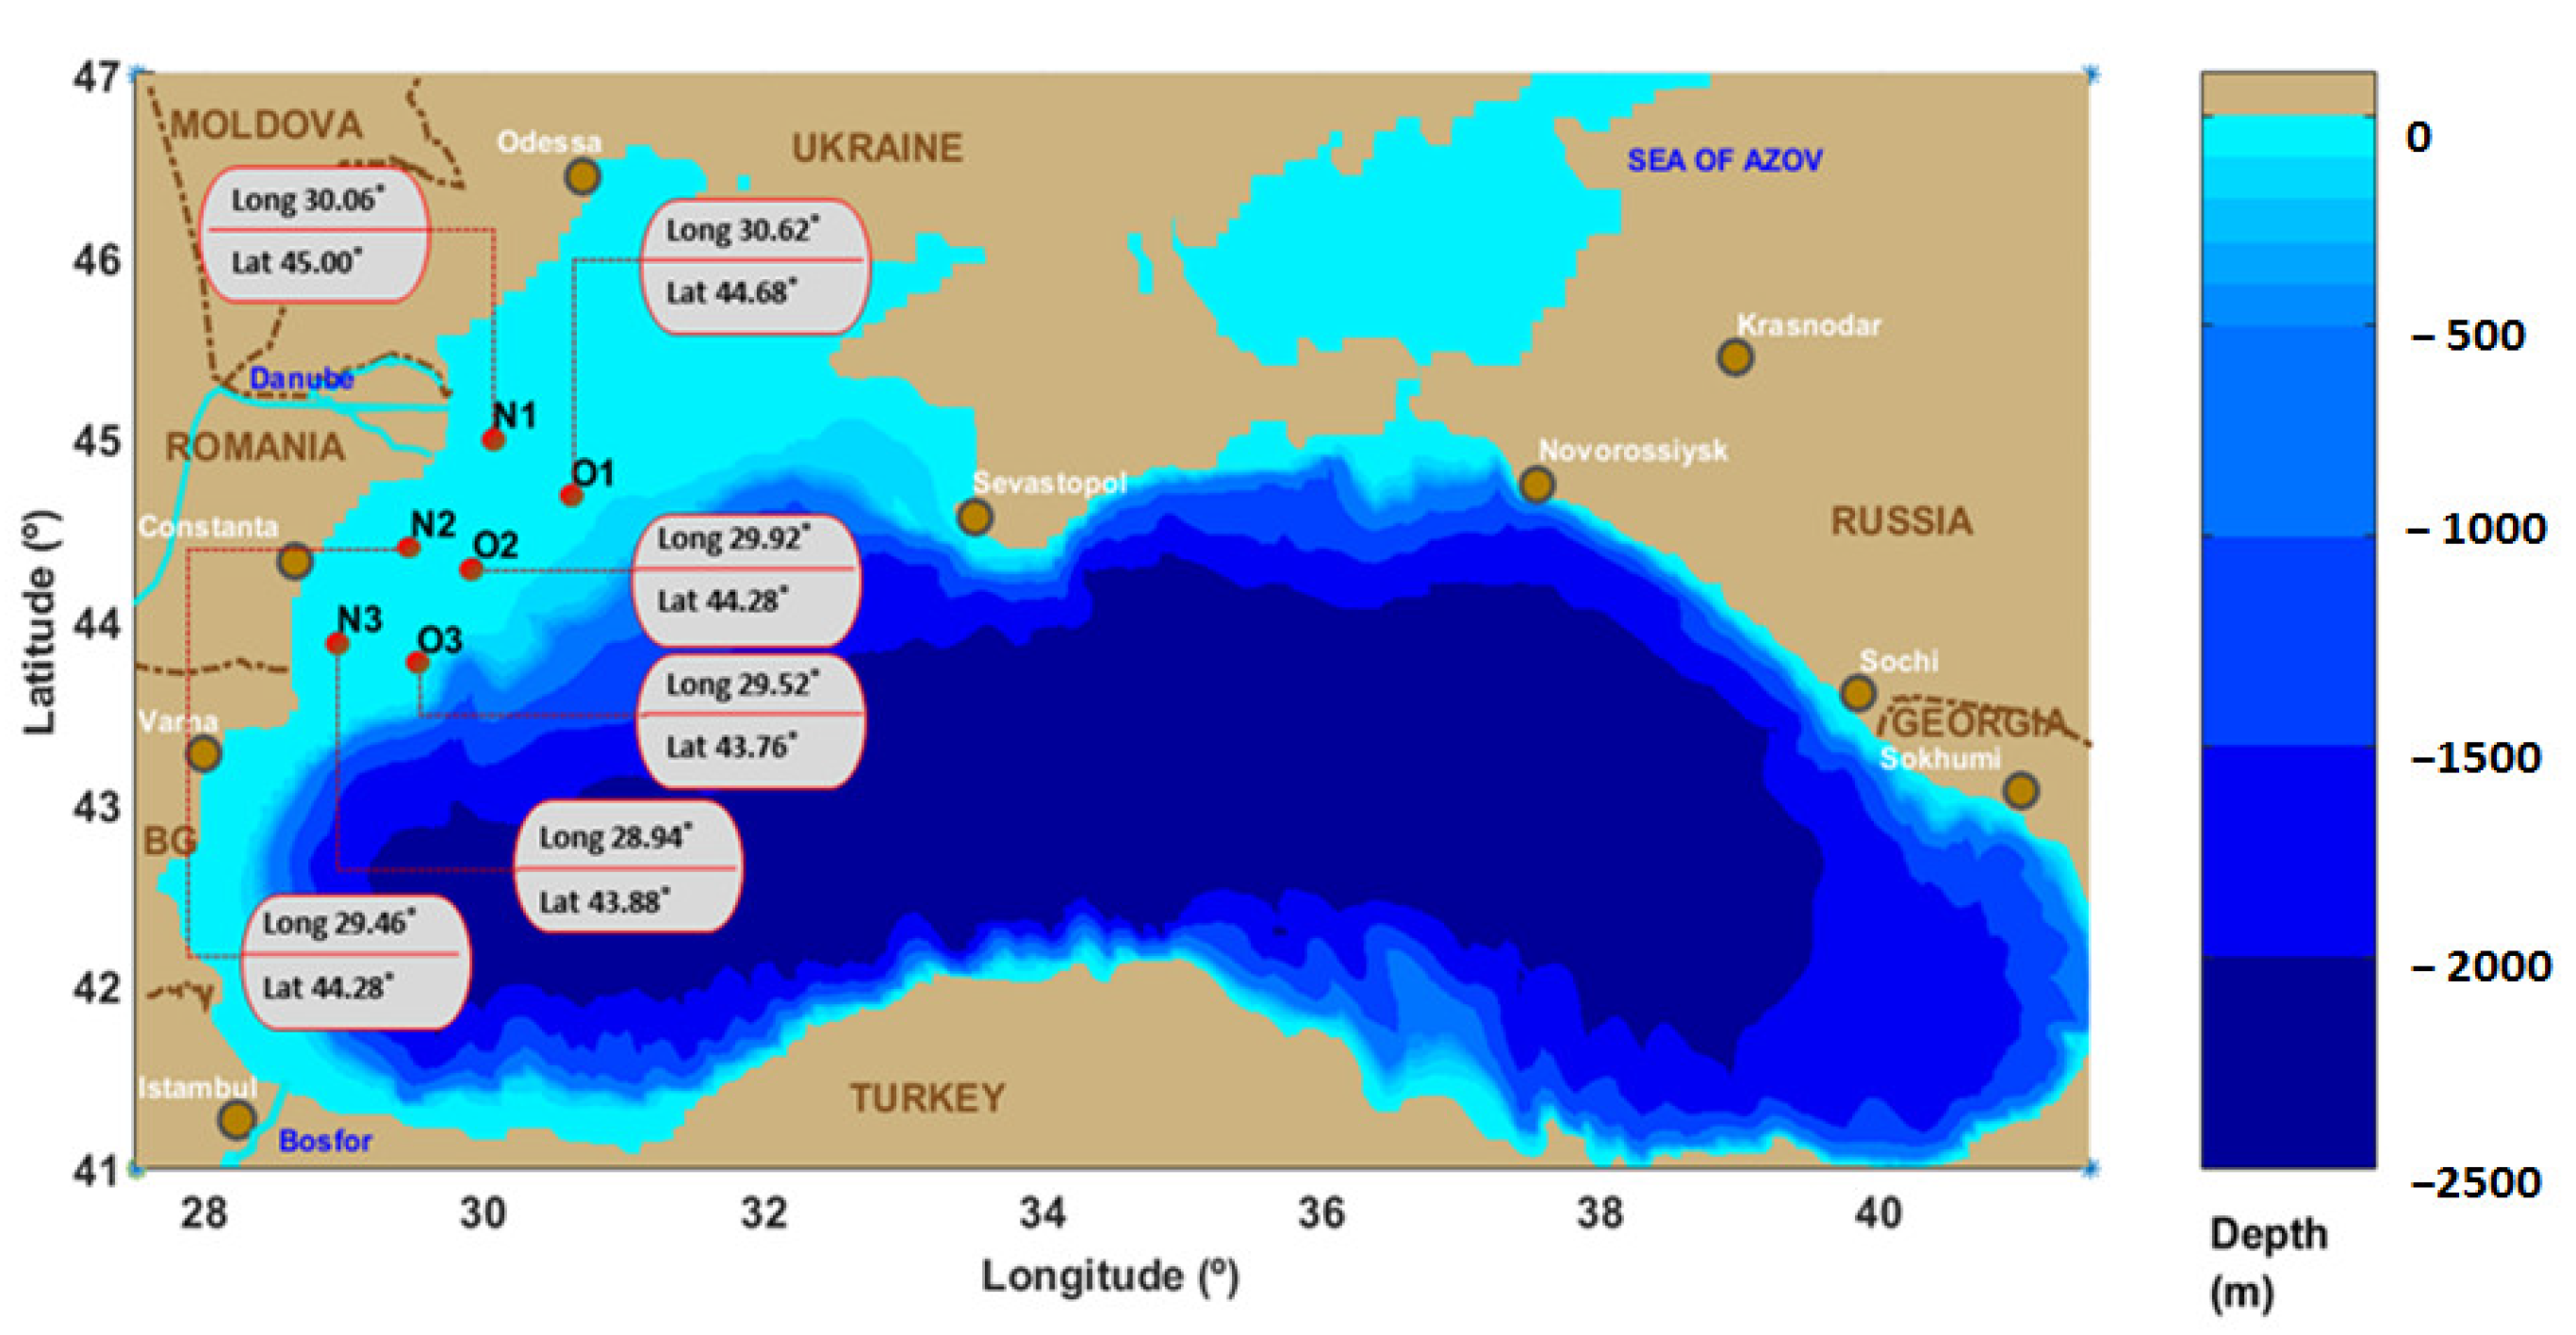
For this study, six sites were chosen. They are located on the west side of the Black Sea. Their exact position is shown in Figure 1. The water depth for all these sites does not exceed 50 m, but the most popular turbine anchoring technologies are those with monopile structures or floating structures which are used mainly at such depth. The wind speeds considered were obtained from the Rossby Centre atmospheric climate model, which is part of the Swedish Meteorological and Hydrological Institute (SMHI). The version of the atmospheric model used is RCA4 [15], which is an upgrade of the RCA3 [16] version. It seems that the previous version had two major disadvantages, being difficult to be configured and in principle, it was a Europe-tuned regional climate model (RCM). Thus, with a lower compensation error, the new version became more efficient and even easier to use.
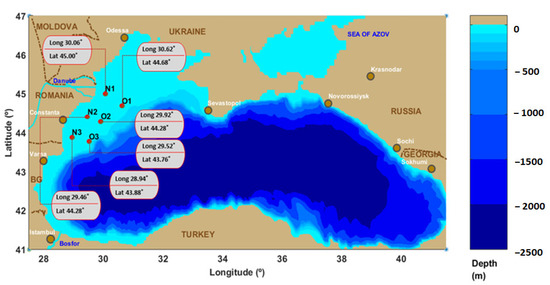
Figure 1.
The bathymetric map of the Black Sea and the locations of the six reference sites considered.
Euro-CORDEX (Coordinated Regional Climate Downscaling Experiment) [15] runs RCA4 at two different horizontal resolutions: corresponds to the distance between the grids of about 50 km, and a resolution of corresponds to the distance between the grids of 12.5 km [17]. The RCA4 version makes predictions using RCP 4.5 and 8.5 scenarios that are employed in Phase 5 of the Climate Model Comparison Project (CMIP5) which simulates past and future climate results for two intervals of time, past and near future, and distant future. Scenarios RCP 4.5 and 8.5 [18] show that the climate is strongly influenced by global warming. Scenarios 4.5 and 8.5 correspond to radiative forces of and respectively . Scenario 8.5 is the most pessimistic one as the temperature increase is expected to be around by the end of the 21st century, while radiative forces increase almost linearly. Scenario 4.5 expects the temperature to increase by at most , and the radiative forces increase linearly until 2060, then growth slows down until 2100 when it finally stabilizes.
For this study, the most favorable RCP 4.5 scenario was considered, analyzing data on wind speed for the near future (2021–2050) and the distant future (2075–2100).
2.2. Proposed Wind Turbines
The crisis caused by Coronavirus poses a threat to the global economy and the living standards of its citizens. The COVID-19 impact was different from one sector to another. For the green energy area, however, it seems that this pandemic did not have a major negative impact; the one from conventional sources is more threatening.
For the post-covid economic recovery, however, the wind renewable energy industry is an opportunity for the whole world, and especially for Europe which maintains its leading position in this field. Thus, it will be an opportunity to create new jobs, not only in the field of design, manufacture, and maintenance but also in the field of research and innovation of green energy. Even for Romania, the development of technological solutions of this kind would represent an economic advantage. There are no wind farms in the Black Sea so far, but studies have been conducted on its potential using wind turbines with capacities between 2–4.5 MW. However, according to their technological development, these types of turbines are used for wind farms that are already in operation. For those that will be put into operation soon, turbines of powers exceeding 6 MW reaching even 15 MW were chosen. As this paper focuses on the energetic potential of the Black Sea for the near and distant future, turbines of higher power have also been considered.
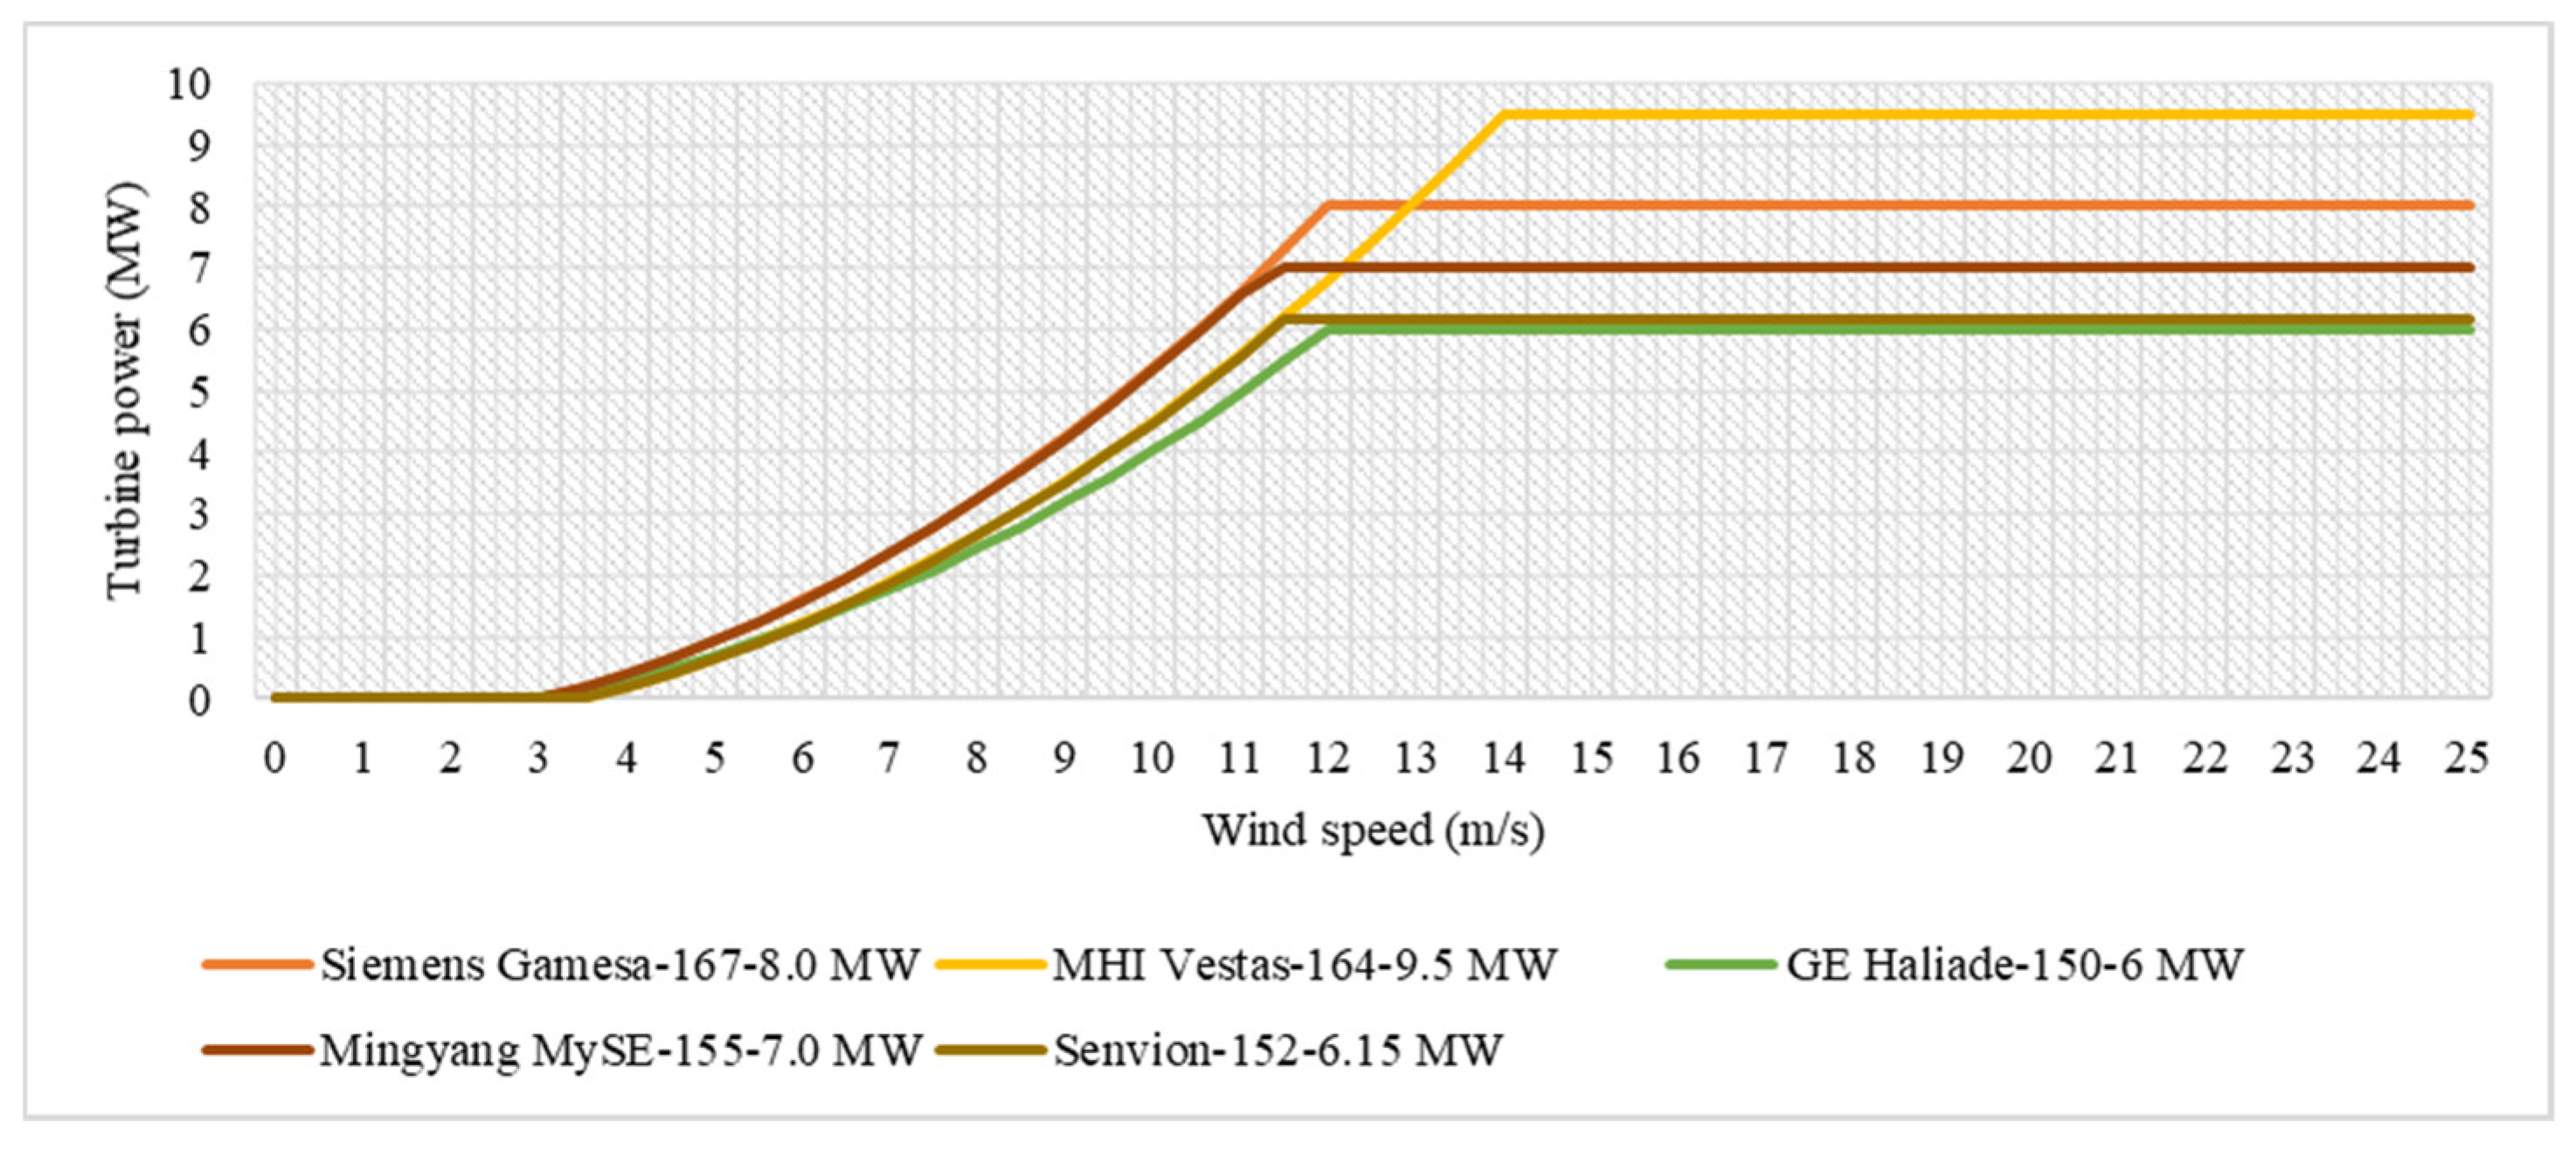
The chosen turbines have rated powers between 6–9.5 MW, and the height of the tower is between 92–100 m. These turbines are already used in other offshore wind farms operating in Europe. To standardize future calculations, the height for all five turbines was approximately 90 m, providing a better comparative criterion of performance. Their power curves are shown in Figure 2.
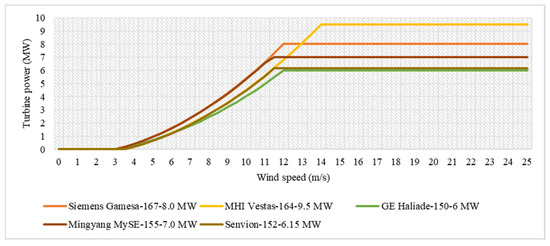
Figure 2.
Power curves of the selected wind turbines.
The power curve of a turbine specifically describes how much power can be generated at a certain wind speed. To draw this curve, wind speed and turbine power are required. A quadratic equation was used to obtain the power curve (Equation (1)) [19], the necessary parameters being shown in Table 1, more precisely, cut-in speed, cut-out speed, and rated speed, all related to the hub height of 90 m.
where (in m/s) is the cut-in wind speed, U (in m/s) is the wind speed at the height of 90 m, (in m/s) is the rated wind speed, (in m/s) is the cut-out wind speed, and is the rated power in MW.

Table 1.
Characteristics of the five wind turbines evaluated.
2.3. Methods
The wind profile power law is used to measure the wind at a specific height and is given by the formula [20]:
where U(z) represents the wind speed (Table 2) in m/s at height (the hub height), is the reference wind speed in m/s, at height (the reference height), and α is the power law exponent (known also as Hellman exponent) [21,22]. The value of this coefficient is estimated to be 1/7 (approximately 0.143) [23] and evaluates the wind profile under normal weather conditions, but this ratio can cause computation errors especially in the field of offshore wind; therefore, for open water, it is recommended to use the value of 0.11 [24] which helps to analyze the wind profile under extreme weather conditions.

Table 2.
Wind classes.
Since the data obtained from the database are at the height of 10 m, it will be necessary to interpolate these values to attain the wind speed at a hub height of 90 m (representing the parameter z from the equation below), which was adopted for all five wind turbines. To obtain this data, the logarithmical wind profile expression will be used, which describes the vertical distribution of the wind speed. This parameter can be expressed by the following equation [25]:
(in m/s) represents the reference wind speed, at the height of 10 m ( in m), which was obtained from the database, the sea surface roughness length is a corrective measure that has the value of 0.0002 m which was adopted following the Reference [26].
After obtaining the wind speed at the desired height, we will move on to the analysis of some energetic parameters. One of them is the wind power density which helps to evaluate the energetic capacity of the wind. It is noted with (in ) and its value can be obtained using the Equation (4) [27,28]:
where is the air density and has the value of 1.225 , U (in m/s) is the wind speed at the height of 90 m.
Knowing the mean wind speed, the Annual Electricity Production (AEP-MWh) can be roughly calculated. This parameter allows developers and operators to quantify the expected energy production of a specific wind turbine. The Annual Electricity Production can be expressed as [29]:
where T = 8760 h/year is the annual operating time of the turbine. Cut-in corresponds to the wind value at which the wind turbine starts to operate; the turbine continues to rotate until attains maximum efficiency at cut-out wind speed [30]. Those two parameters are measured in m/s. P(U) is the power curve of a specific wind turbine. f(U) is the Weibull distribution function and has the formula [31,32,33]:
where k represents the shape parameter (known also as the Weibull slope), and it is a dimensionless parameter, c is the dimensionless scale parameter, U is the wind speed (in m/s).
Another parameter that helps to evaluate the performance of the wind turbine is represented by the Capacity factor noted as , which is expressed in percentages. It is expressed as the ratio between the total power in a certain period P and the maximum rated power . It has the following mathematical expression [34]:
The last parameters to be analyzed are the seasonal (SV) and monthly (MV) variability of the wind. These parameters help to get an image of the wind intensity over one year. They are defined as follows [35]:
where , are the maximum values from all seasons respectively months; , are the minimum values from all seasons respectively months; and is the average value of the entire dataset. All these parameters are measured in . For the seasonal variability, the distribution of the season was adopted as follows: winter (December, January, February), spring (March, April, May), summer (June, July, August), and autumn (September, October, November).
3. Results
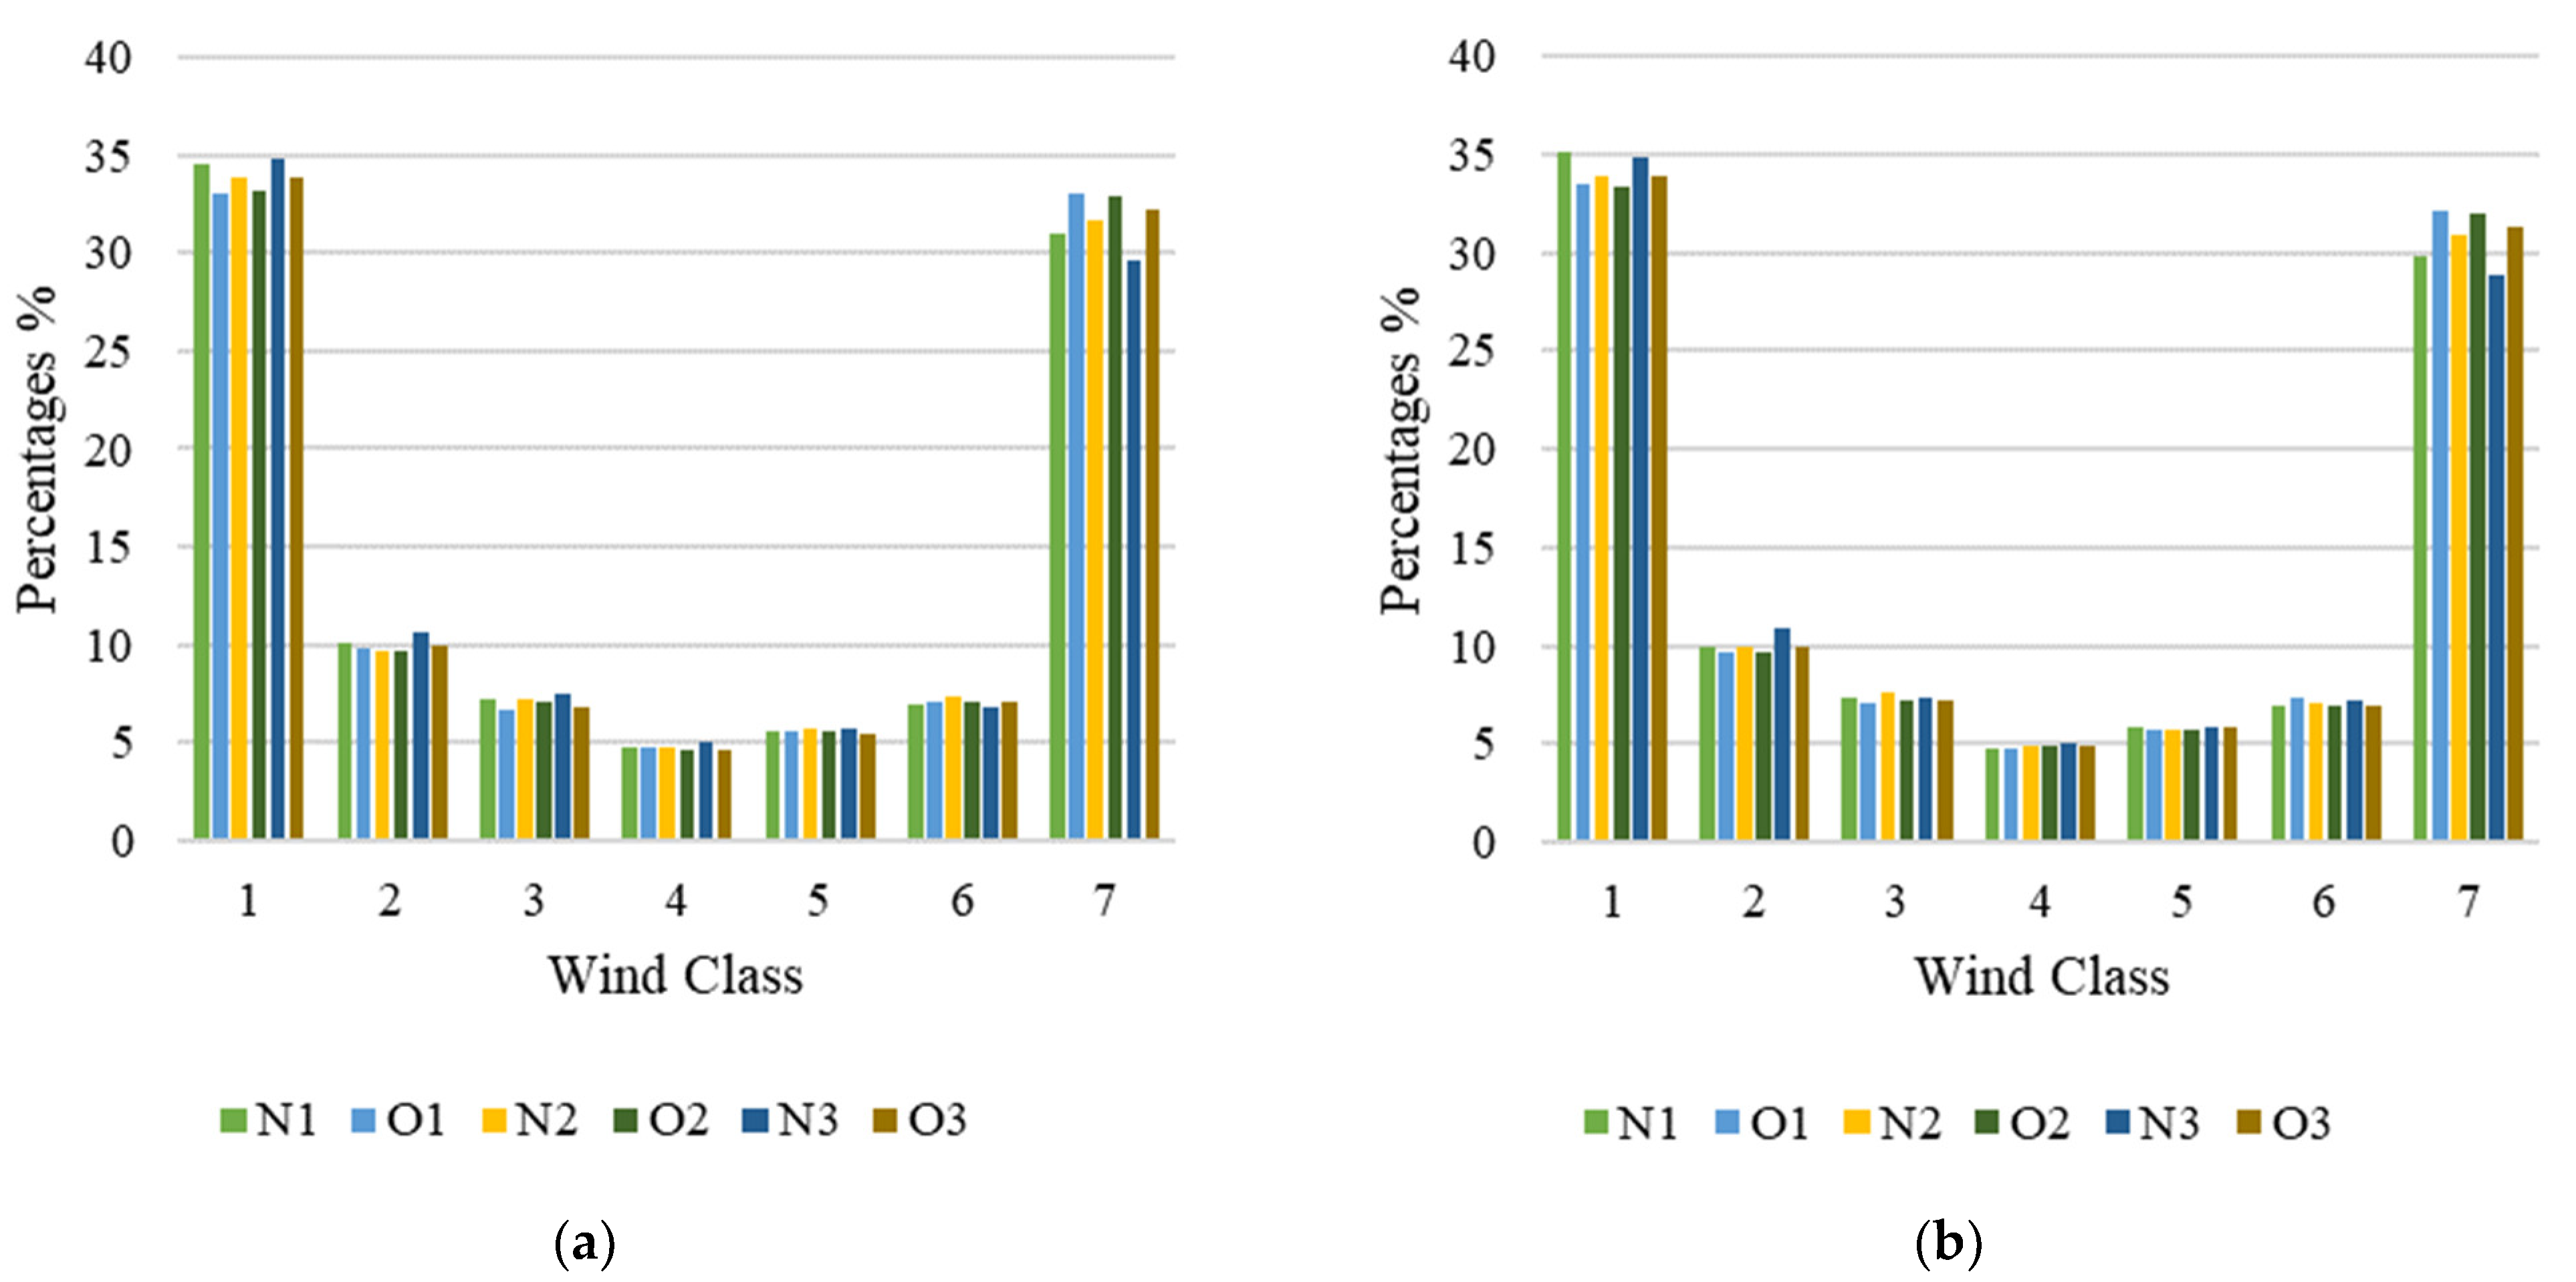
In order to obtain the wind speed related to the 7 wind classes, Equation (2) was used, in which the Hellmann exponent with the value 0.143 was considered, obtaining the wind speed interpolated at a height of 90 m. It can be seen from Figure 3 that the most predominant classes are C1 and C7, both in fairly similar percentages. From the literature, it has been established that wind classes are not indicated for the wind industry. From class 2, there are certain restrictions on the use of wind turbines, for example, class 3 requires a certain height of the pillar. Thus, based on the results, one can say that the wind quality in the chosen sites is relatively good for the offshore industry. Up to 65%, the wind intensity is sufficient for the use of wind turbines, even if they will not have a 100% capacity because the speeds at which the chosen turbines have these results must exceed 11.5 m/s. To achieve a successful project, at least wind class 3 is recommended.
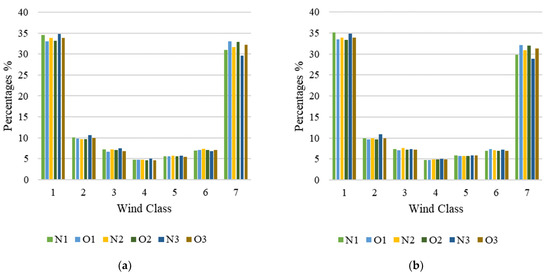
Figure 3.
The distribution of the wind at the height of 90 m (a) near future; (b) distant future.
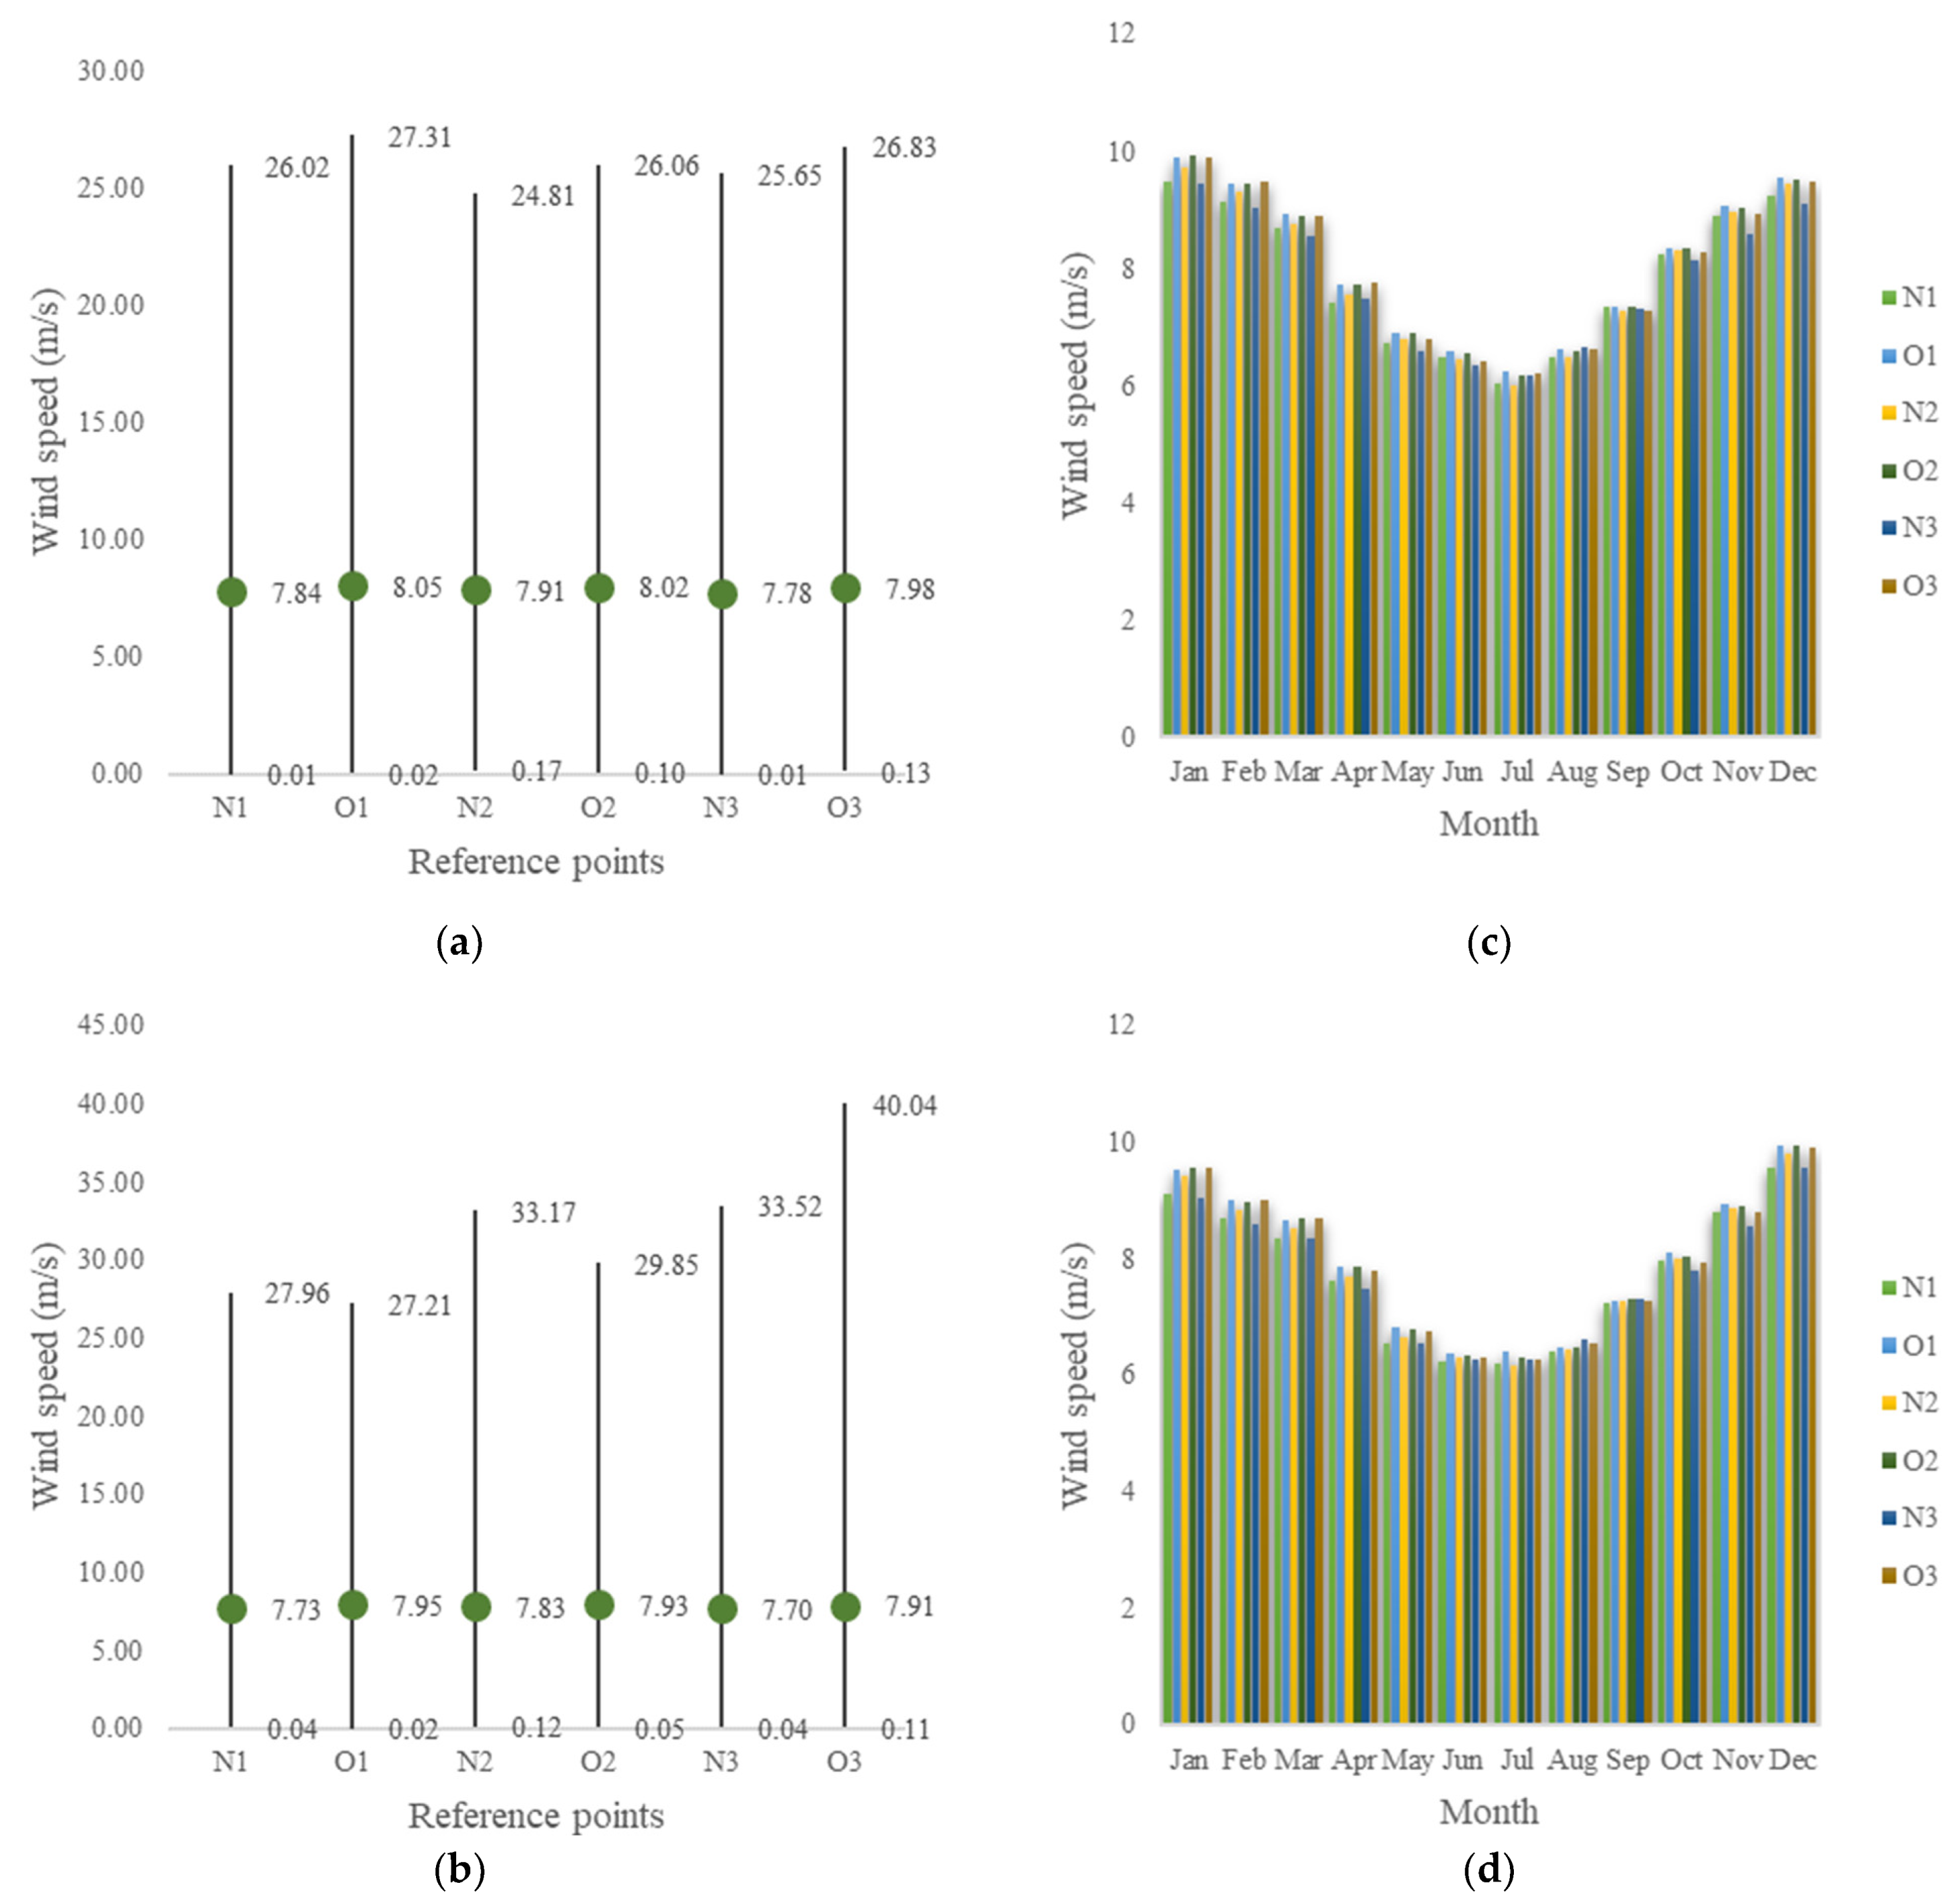
For a better analysis of the wind quality in all six sites, the average, minimum and maximum wind speeds have been illustrated (Figure 4a,b). Moreover, these speeds were grouped by months, as shown in Figure 4c,d. All these values were obtained at a height of 90 m using the logarithmic wind profile expression. From this figure, it can be seen that the values of the average wind speed for all six sites are located somewhere near wind class 4. The highest value of this speed can be represented by site O1, both for the near future and the distant future. It is also observed that there are large oscillations between wind speeds, being moments in which values close to 0 m/s are recorded, suggesting that the turbines could not work at that time. There are also records of high wind speeds, such as the one in the distant future of site O3, where a wind speed of over 40 m/s is reached. However, it seems that the most constant speed is maintained at site O1 which has the highest value of the average wind speed and where the maximum speed exceeds by at least 27 m/s. The Black Sea is located in a temperate zone, which is characterized by two extreme seasons, summer and winter, between which climate change takes place generating two intermediate seasons, spring and autumn. Winter is characterized as cold with minimum temperatures in the northwest, winds are stronger in a predominant direction from north-northeast to west, and summers are warmer with relatively uniform temperatures. Thus, it becomes obvious why the highest average wind speeds are recorded in December, January, February, and the adjacent months. This phenomenon is representative for both the near and distant future. The lowest values will be recorded in the summer months (June, July, August). For all these records, site N3 has the lowest values.
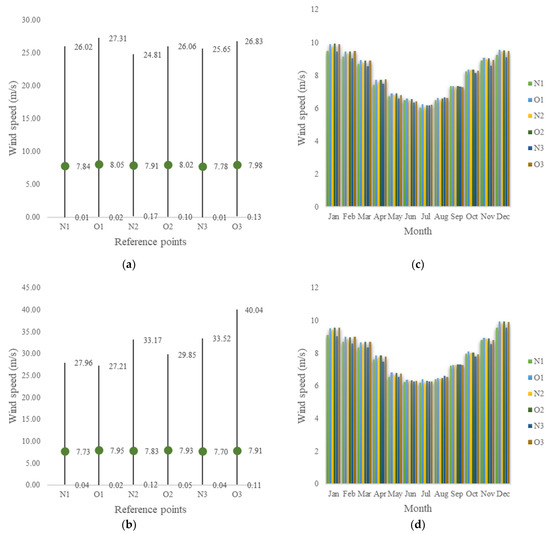
Figure 4.
Wind characteristics at 90 m height (a) minimum, mean, maximum of the wind for the near future; (b) minimum, mean, maximum of the wind for the distant future; (c) monthly variation of the wind for the near future; (d) monthly variation of the wind for the distant future.
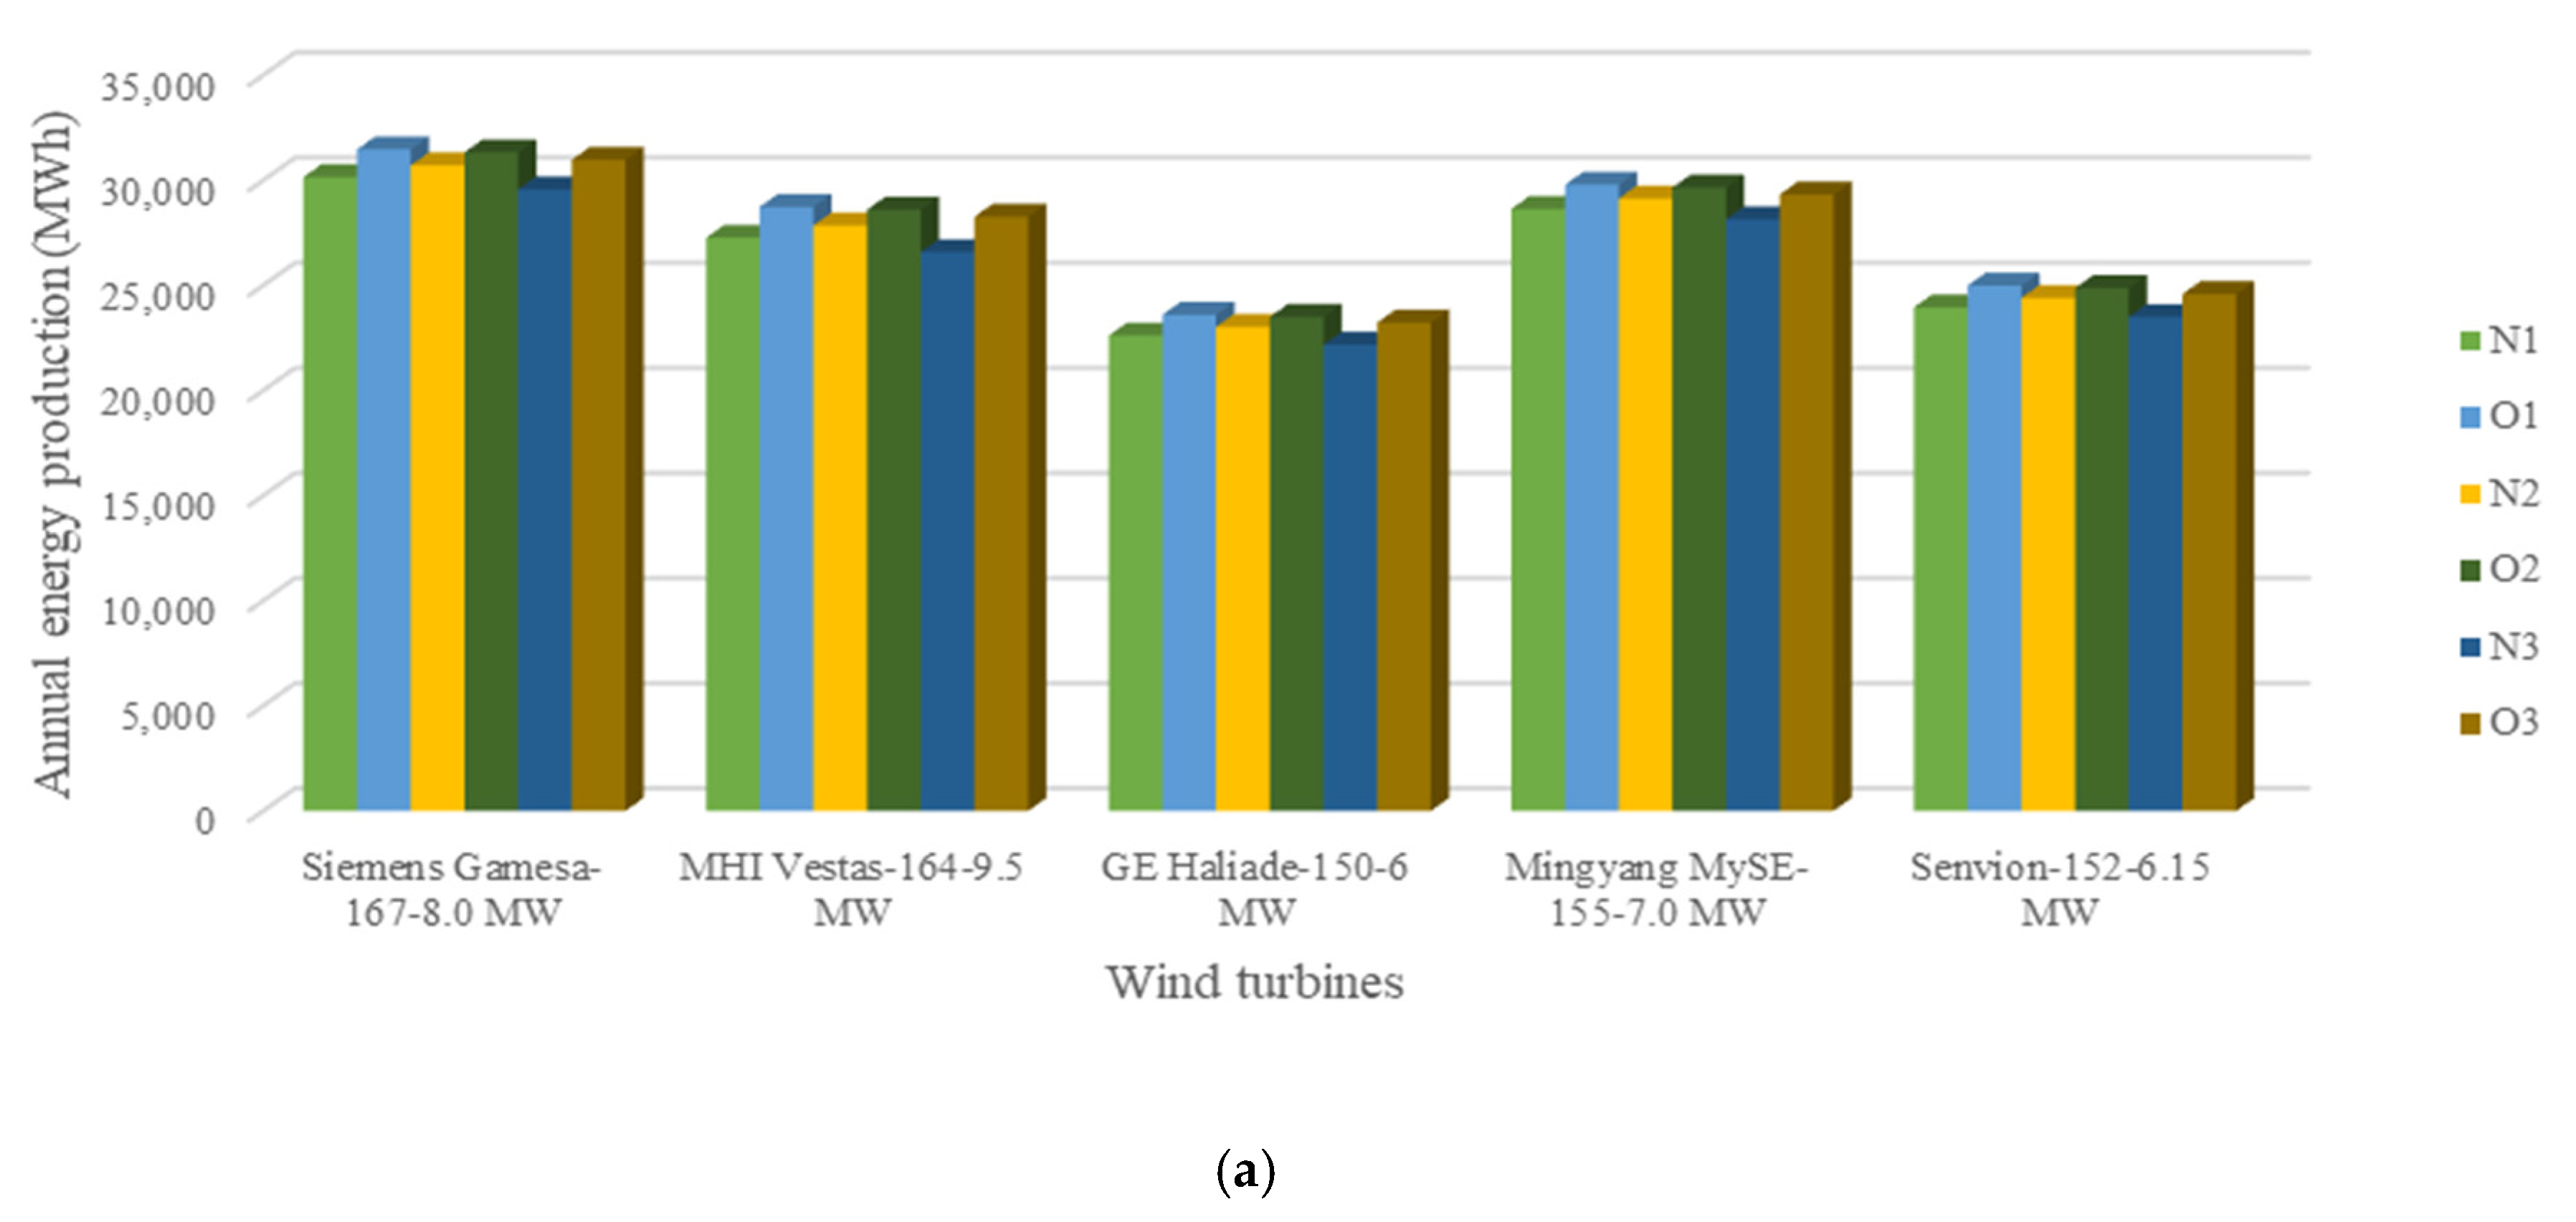
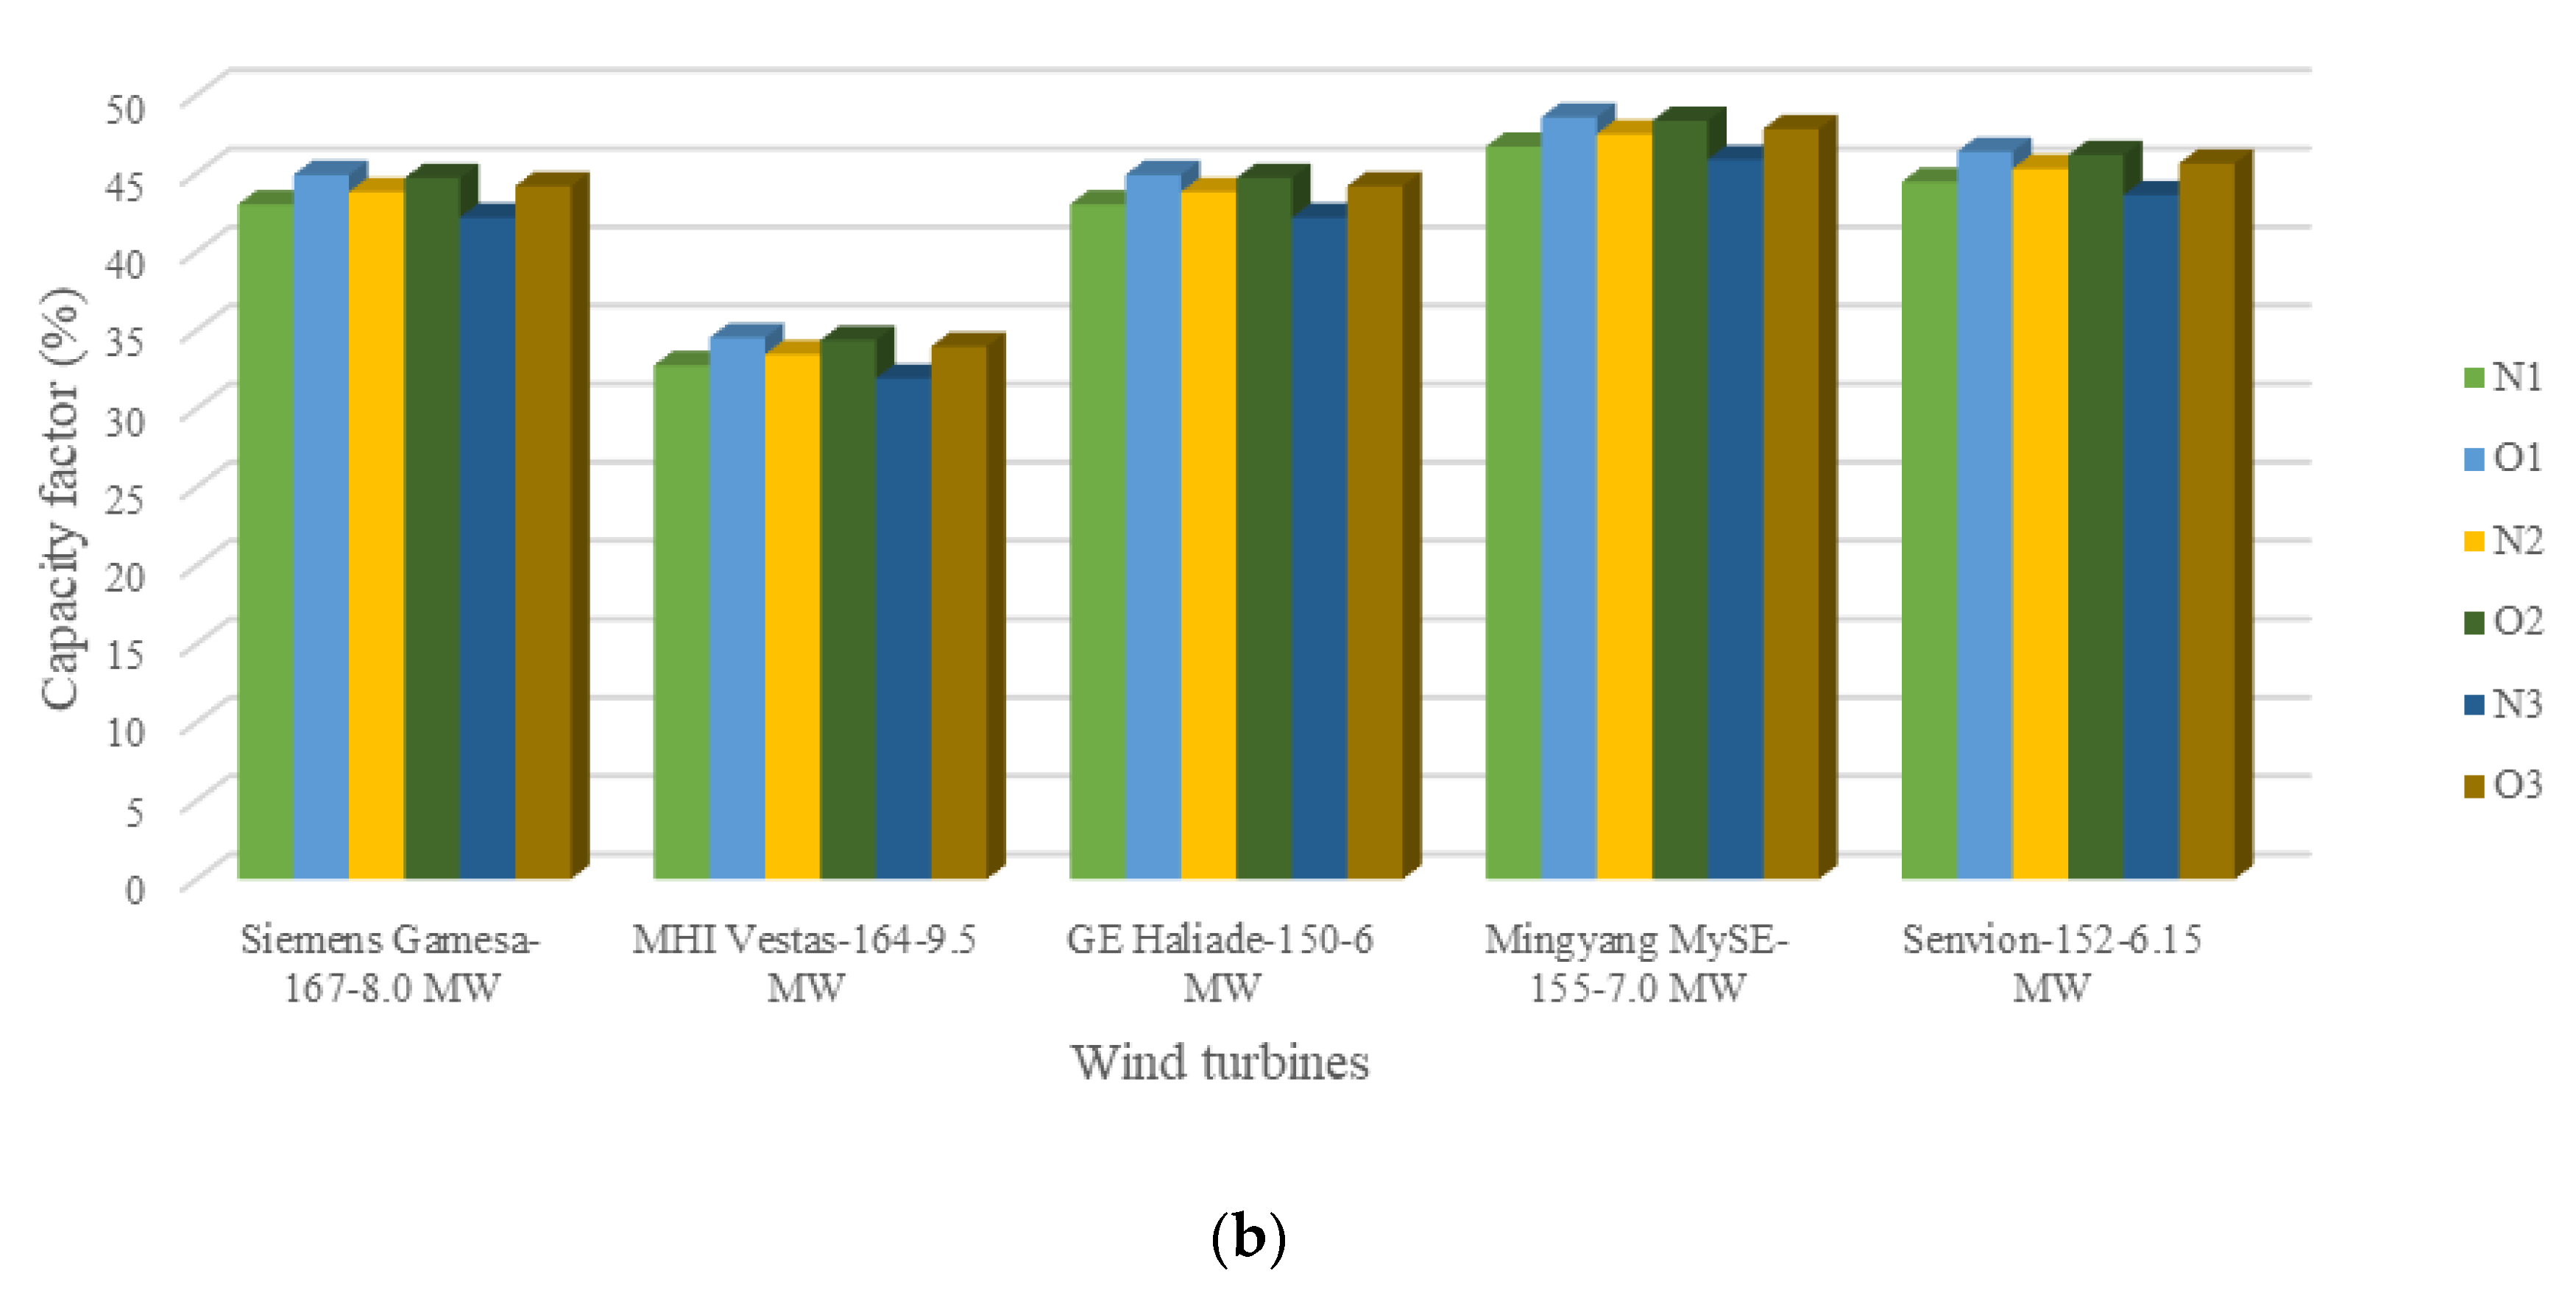
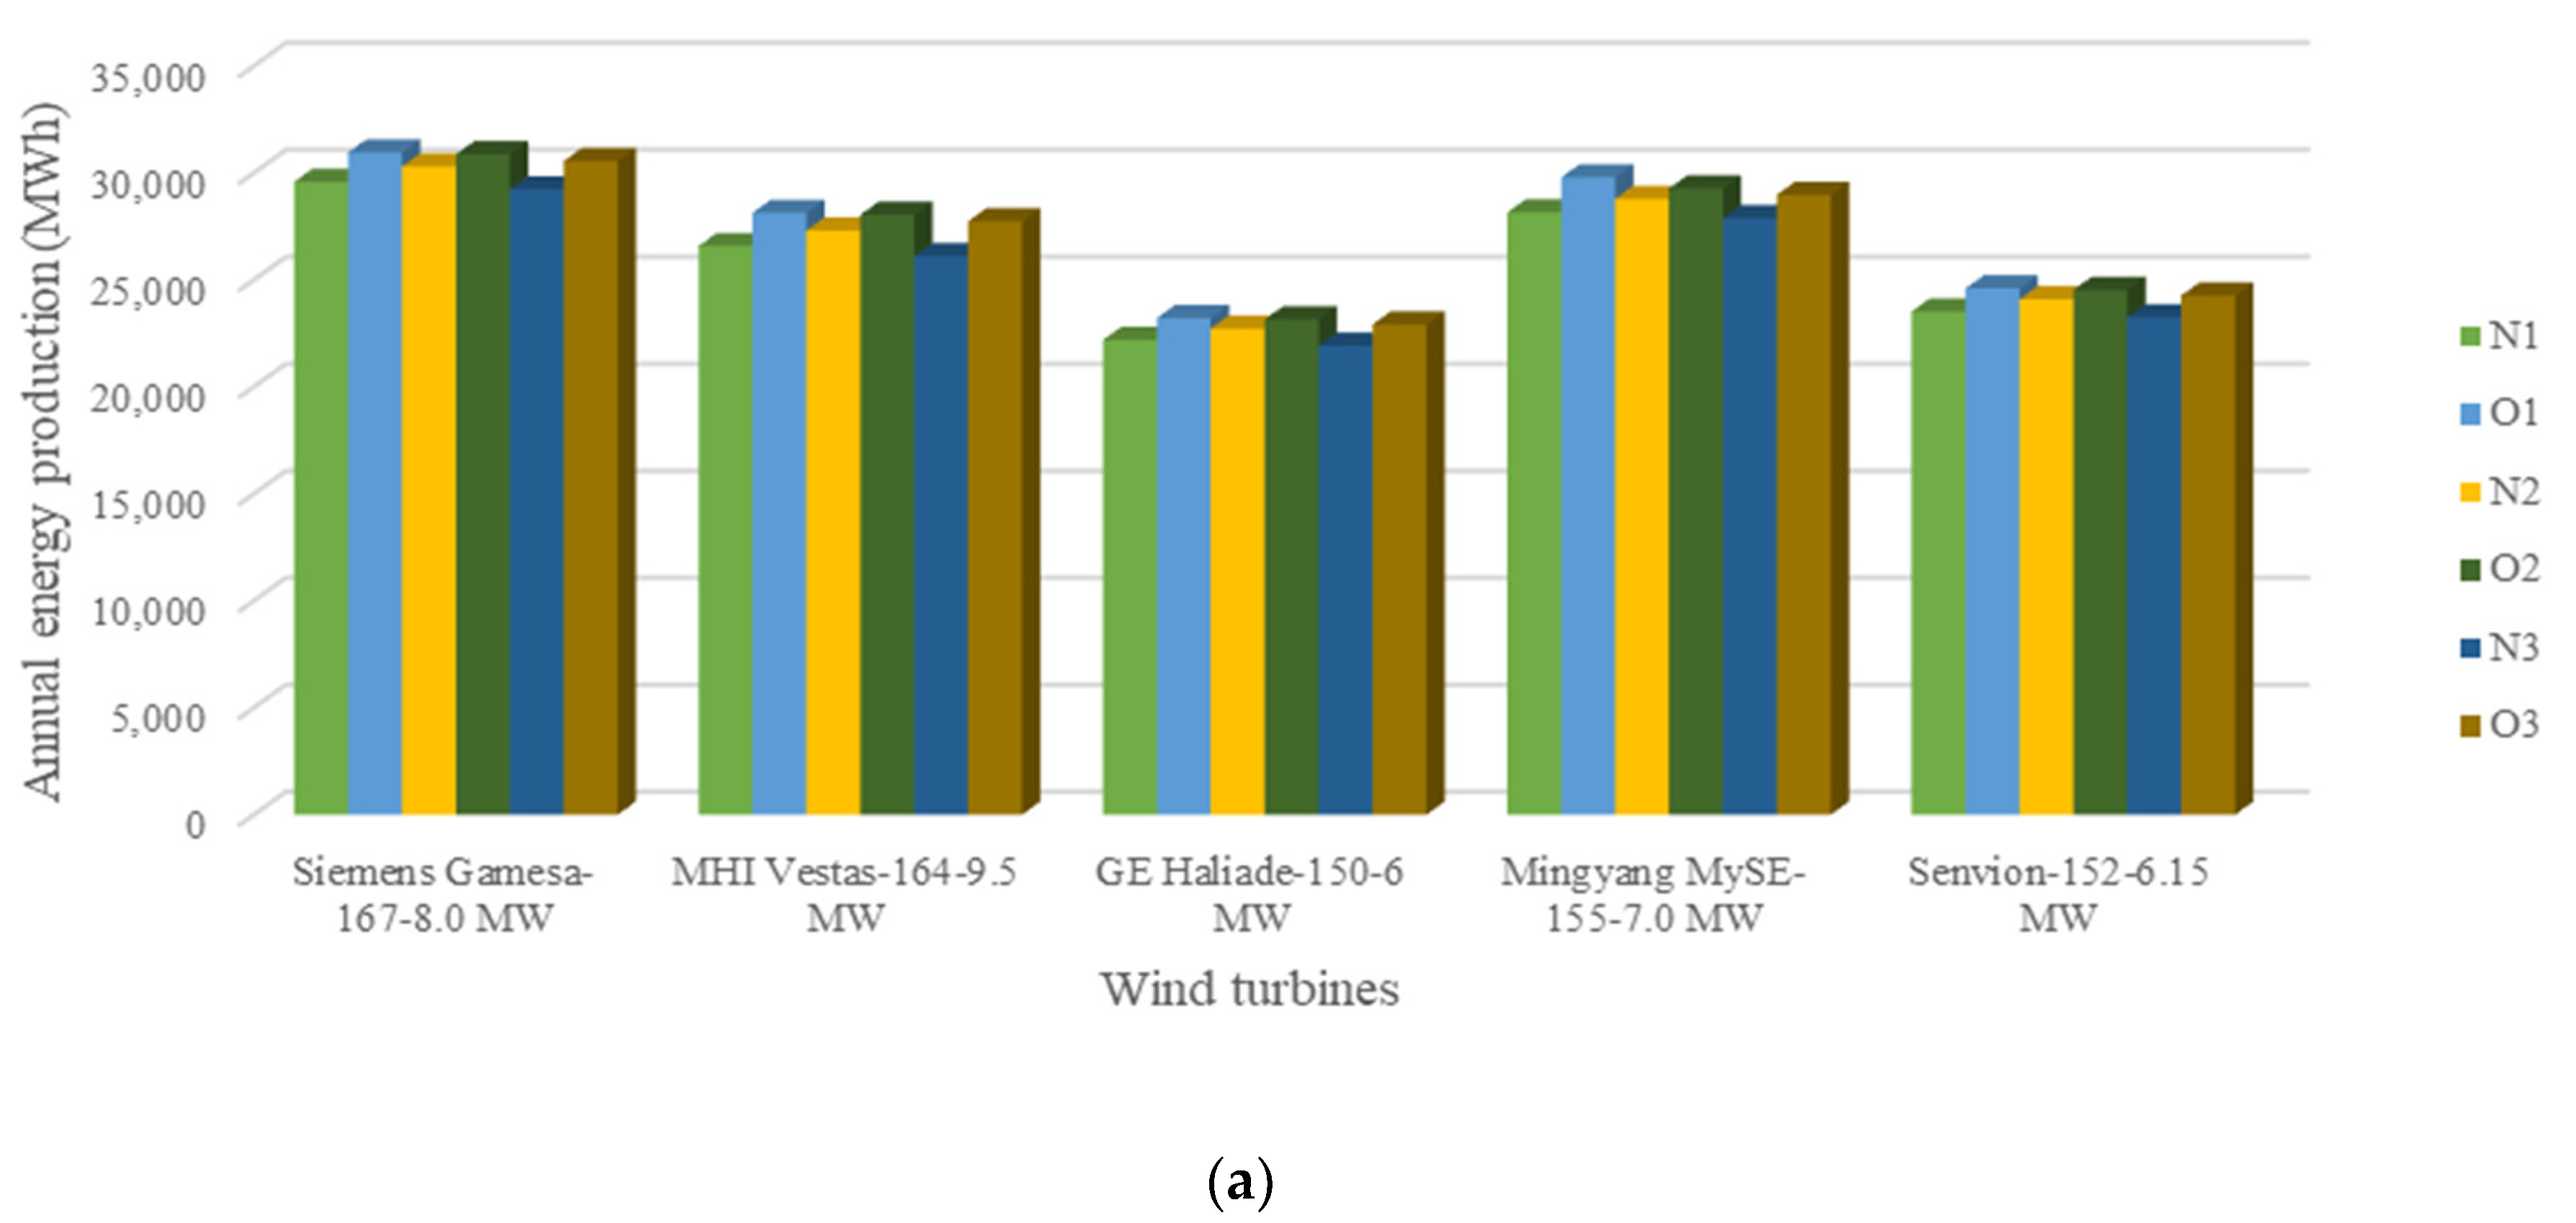
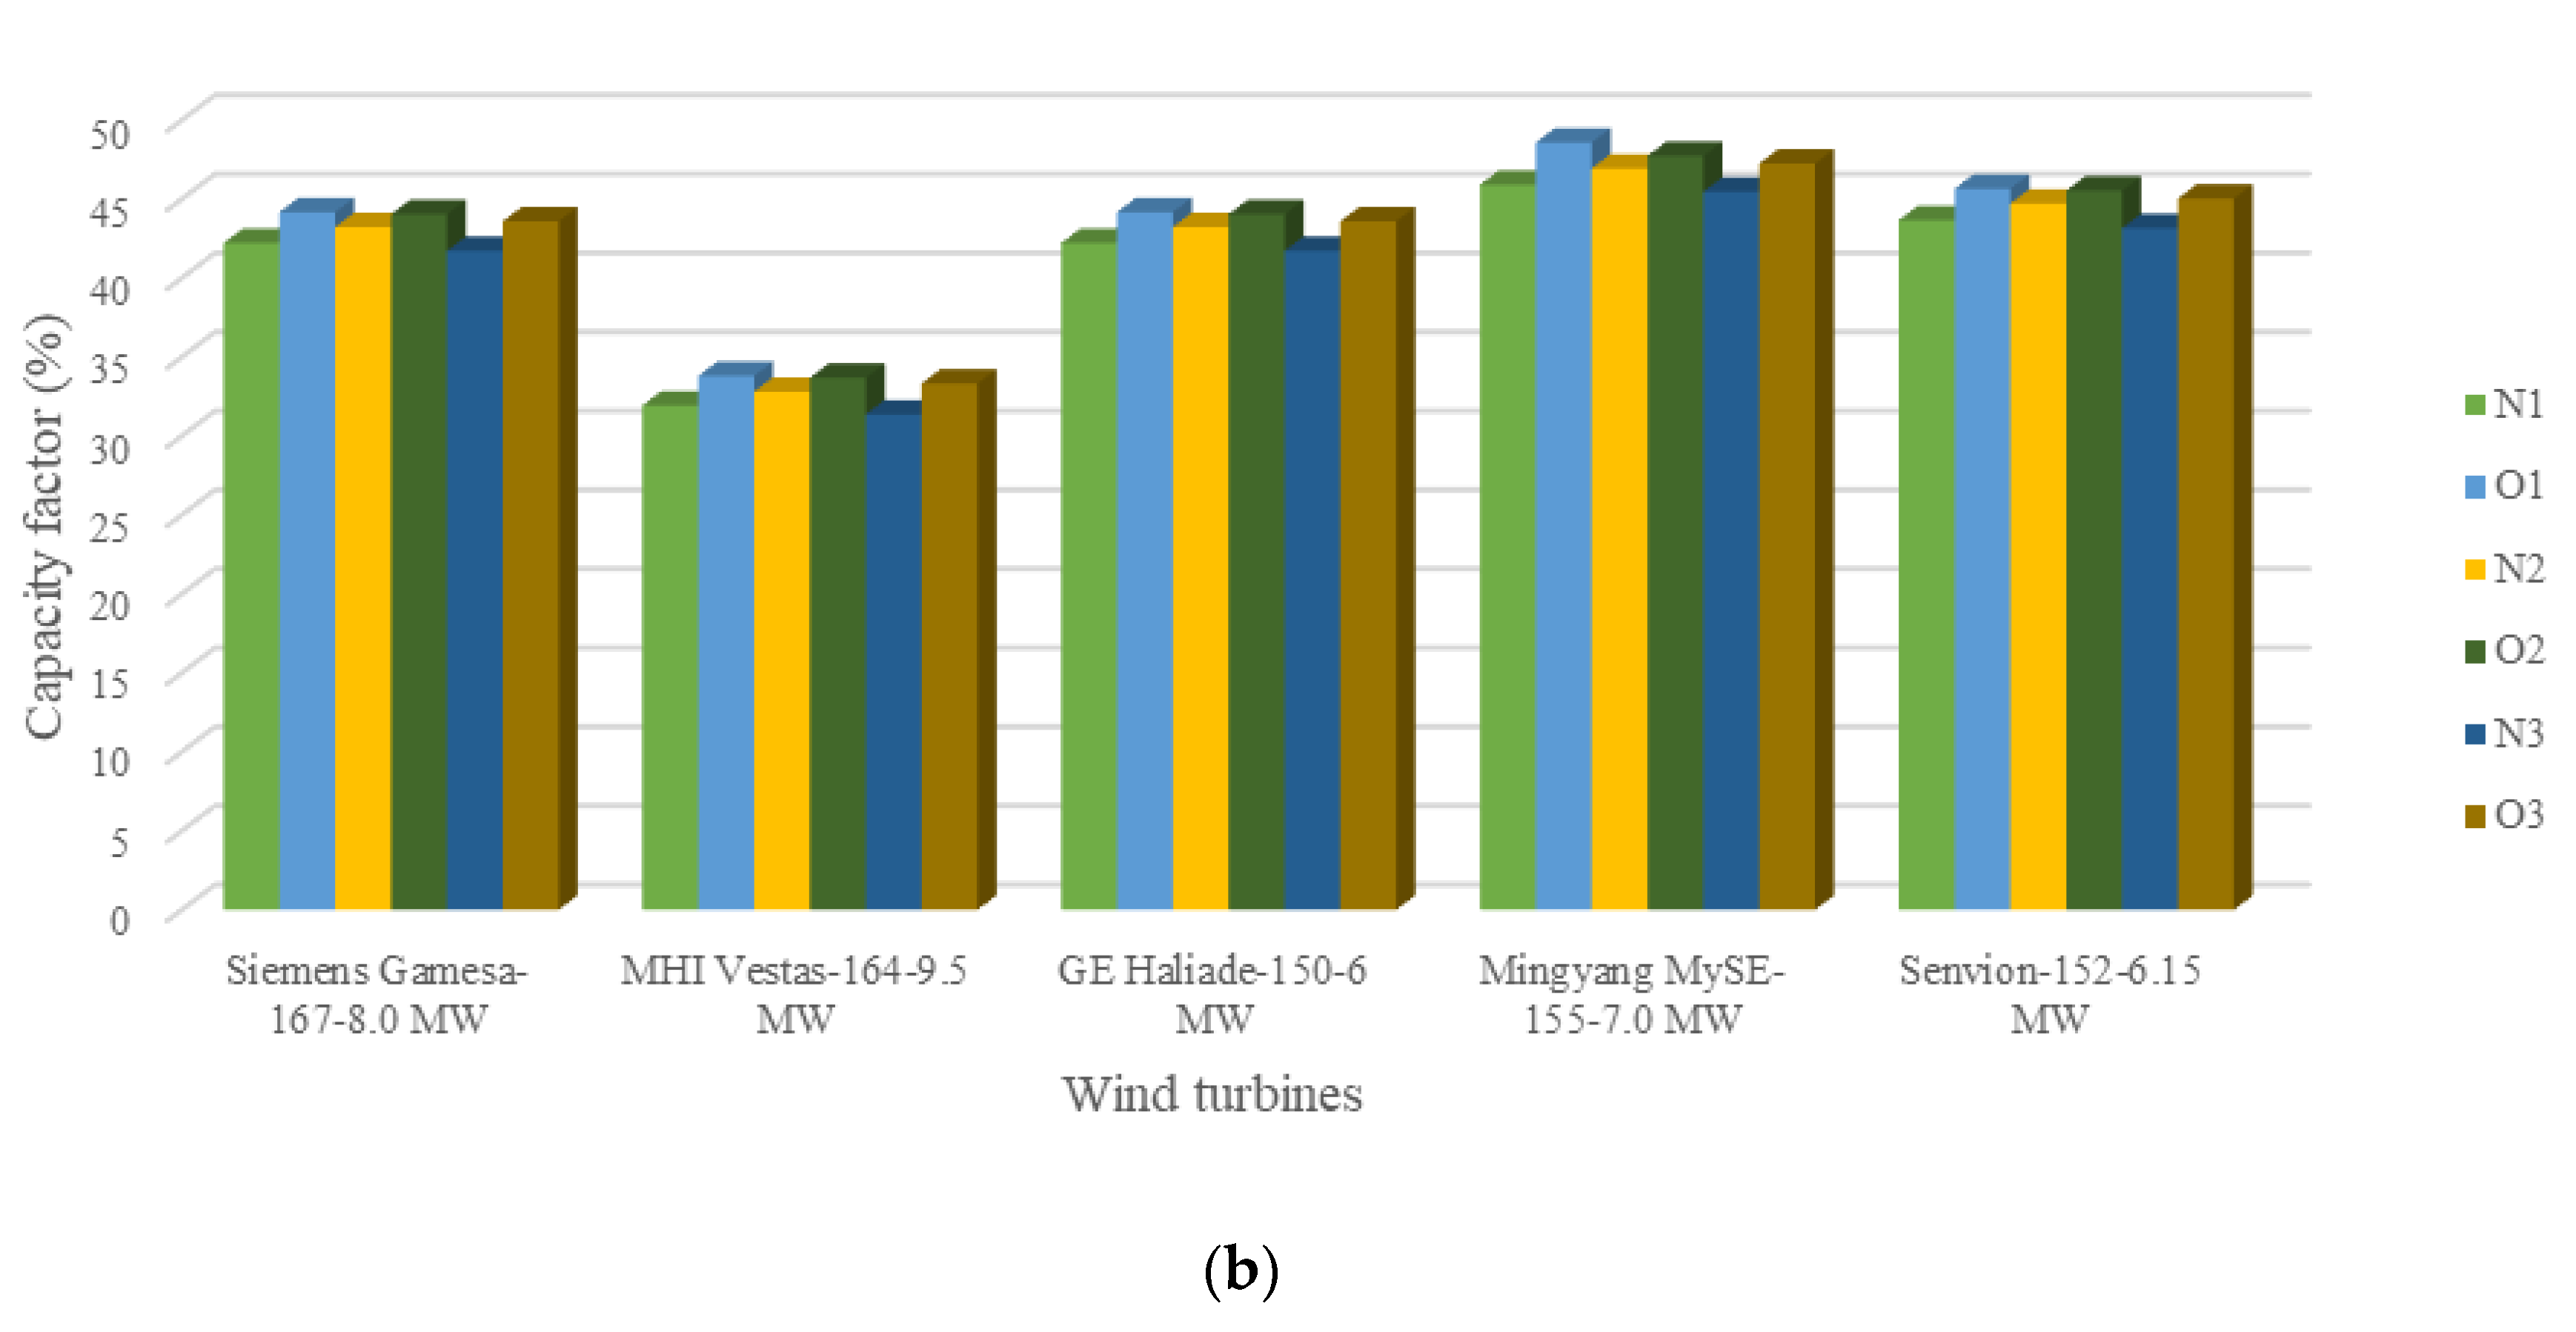
Figure 5a,b and Figure 6a,b indicates the annual electricity production of a specific turbine (expressed in MWh) and its capacity factor (expressed as a percentage). AEP is an optimization parameter that is related to a certain type of turbine and the location area. Through this parameter, one can choose the best turbine from a functional point of view according to the meteorological conditions of a particular area. In the current study, five wind turbines were chosen of power between 6 and 9.5 MW, the best turbine in terms of power being the MHI Vestas-164-9.5 MW turbine. Analyzing the two Figures, we can see that the best results are the Siemens Gamesa-167-8.0 MW turbine whose annual productivity is around 30,000 MWh and whose capacity factor is about 43%. The turbine with the lowest value is also the one with the lowest power. These results are valid for both the near and distant future.
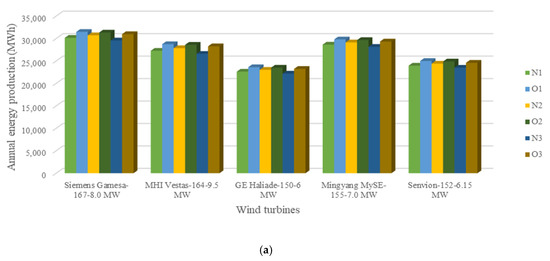
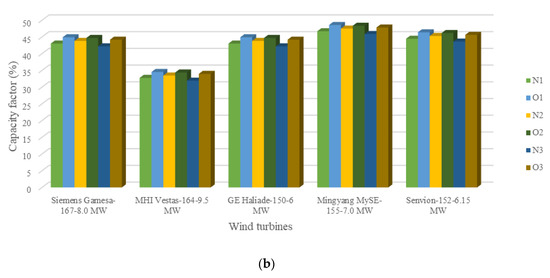
Figure 5.
(a) Annual energy production and (b) capacity factor expected from each type of turbine for six sites in Black Sea using the wind data for the near future.
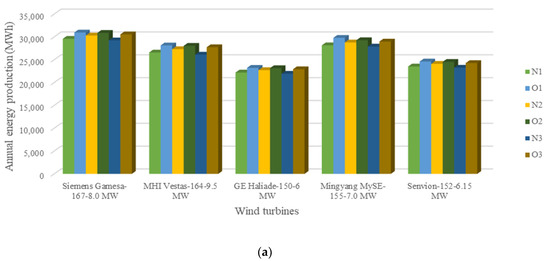
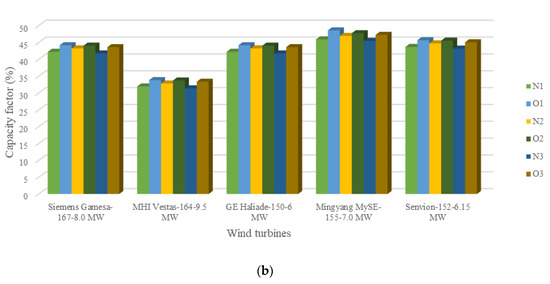
Figure 6.
(a) Annual energy production and (b) capacity factor expected from each type of turbine for six sites in Black Sea using the wind data for the distant future.
Although the MHI Vestas-164-9.5 MW turbine features the highest power, it seems that it is not indicated to operate in the chosen area of the Black Sea basin, as it has the lowest capacity factor (approximately 33%) which results in low AEP values. This aspect can be argued by the fact that the characteristics of the turbine, more precisely the speed at which the rated power is reached, has the highest values. This turbine requires a speed of 14 m/s to achieve the best performance. For the analyzed sites, it has already resulted that the predominant wind speeds for the six sites are close to the value of 7 m/s, while those with an intensity of over 14 m/s occur rarely (in a proportion of 8%).
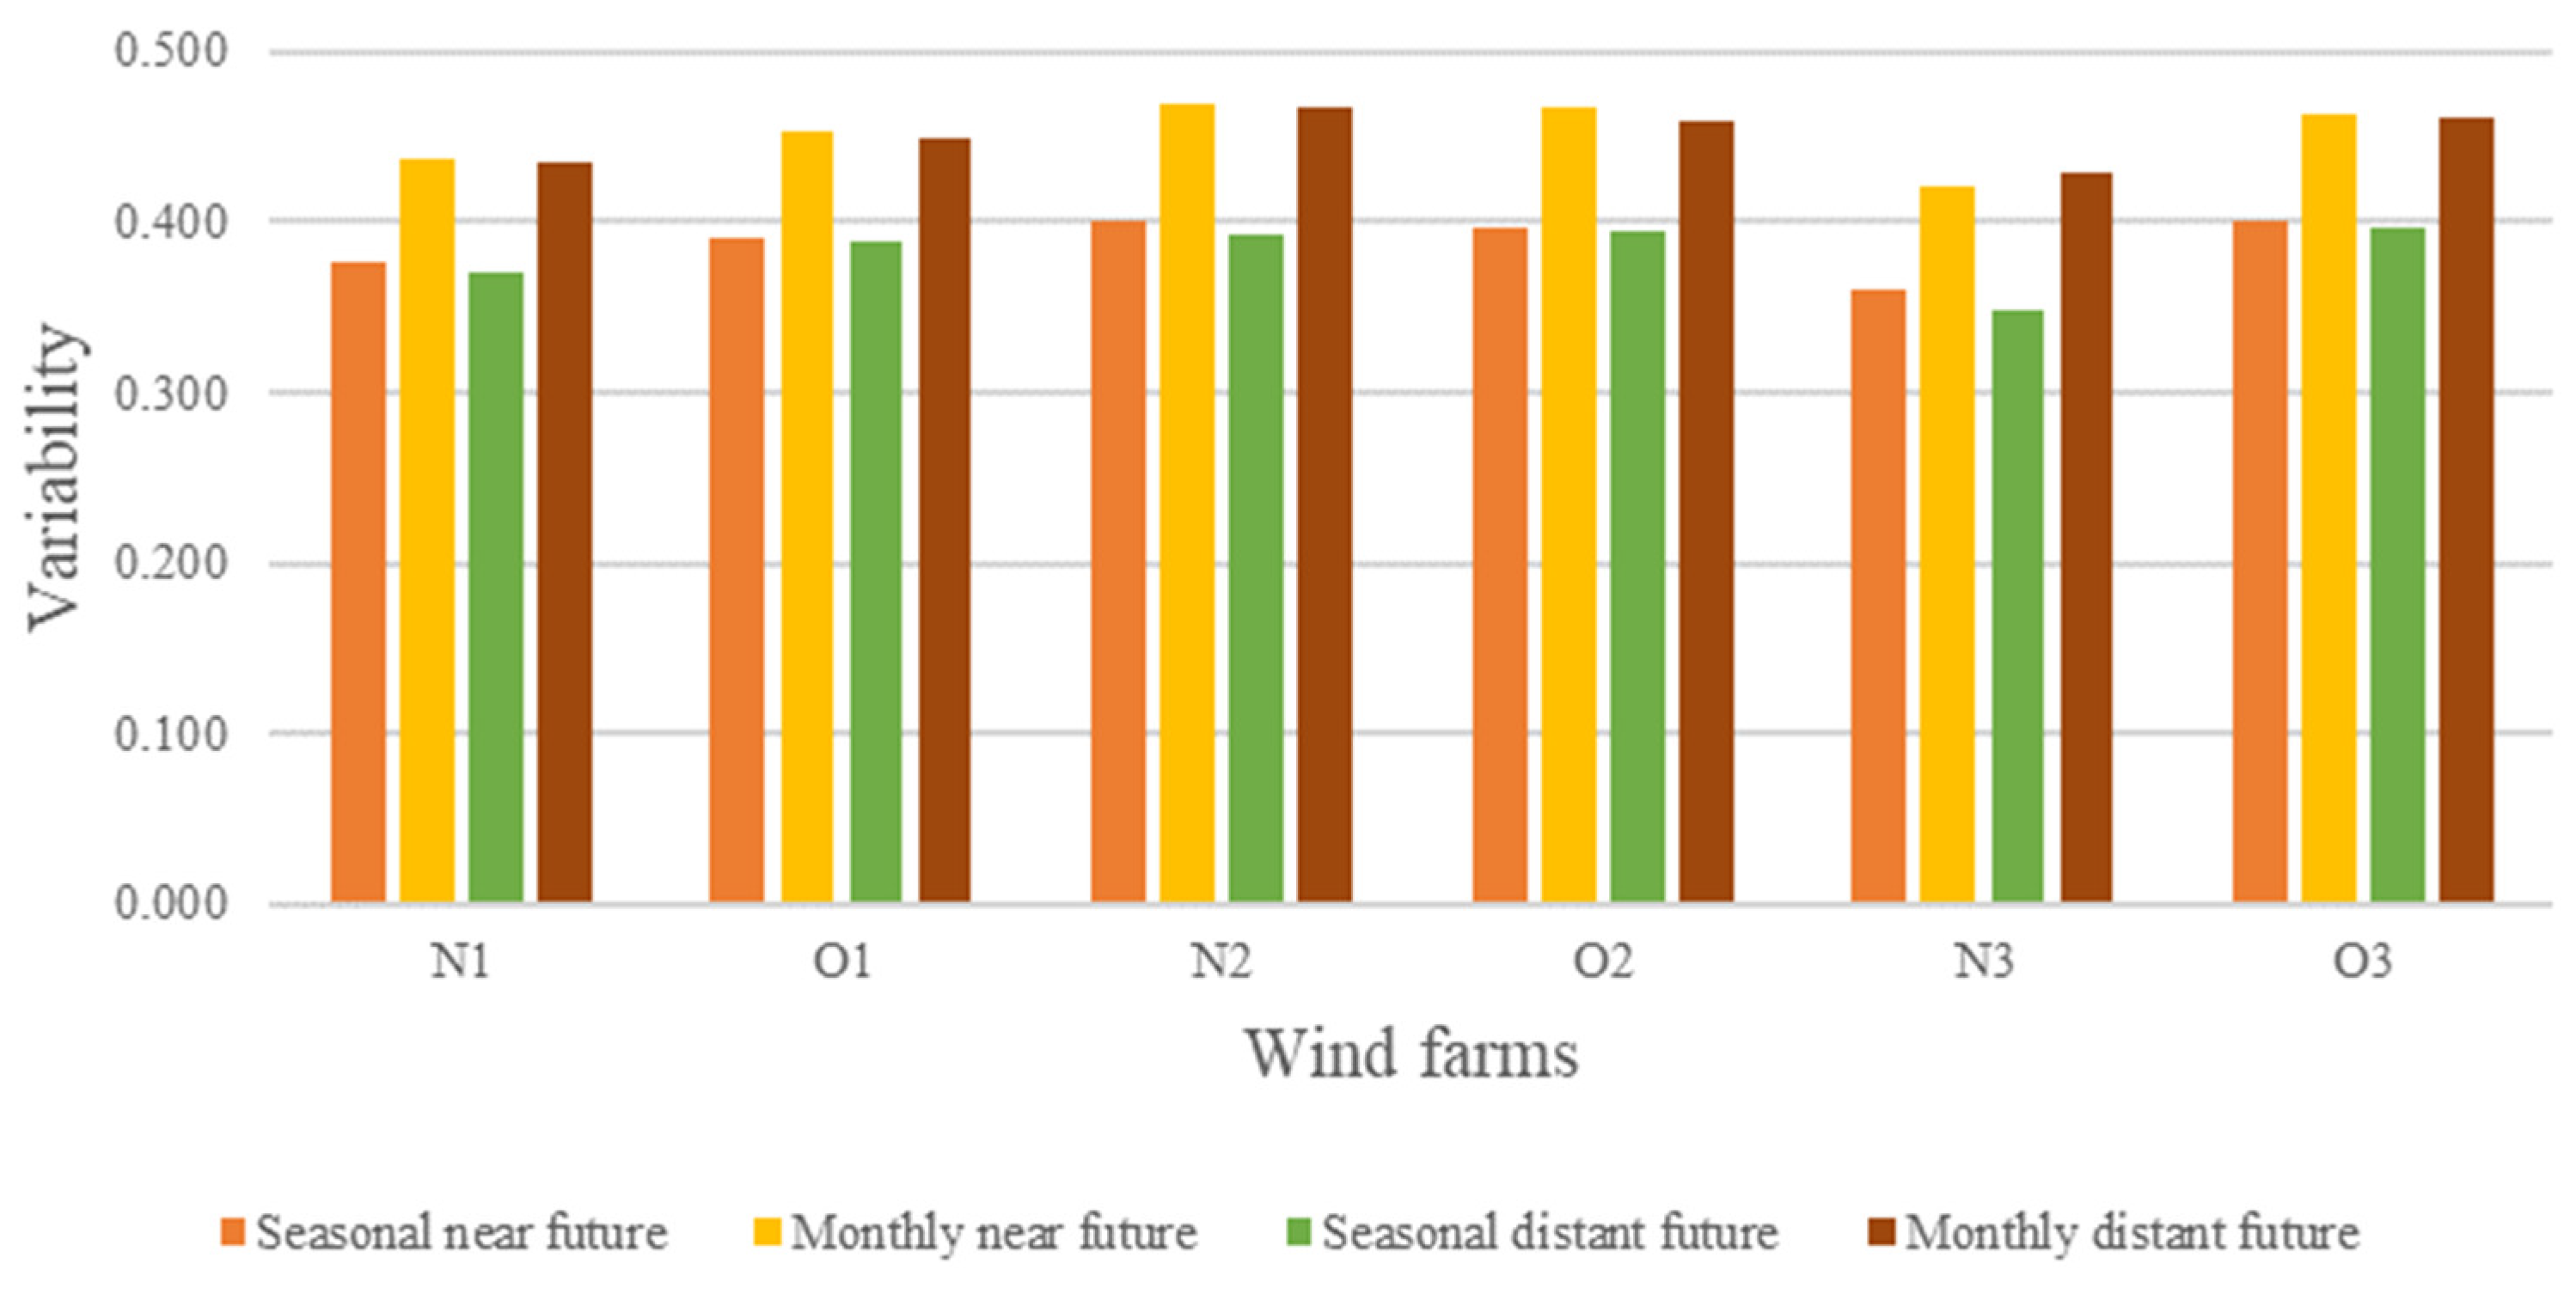
Figure 7 shows the evolution of the seasonal (SV) and monthly (MV) variations as defined in Equation (8). The results presented in this figure show that the monthly variations present higher values than the seasonal ones. All these values are reported to the height of 90 m. For the seasonal values, we can mention that all sites exhibit values below 0.4, the highest value corresponding to site N1 for the near future and the distant future to site O3. In this case, the lowest value seems to define the sites N3, both in near and distant future. For the monthly variations, almost all of the sites have the same value, with a small difference. The only site with a lower value is identified for site N3.
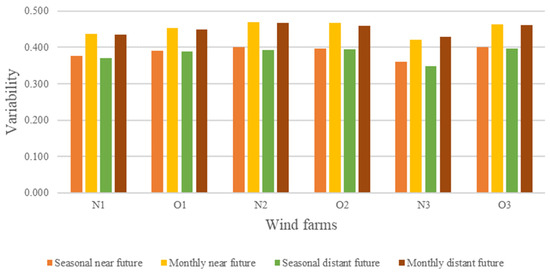
Figure 7.
Seasonal and monthly variability of the wind speed.
4. Discussion
In this paper, several reference sites have been selected to identify some suitable projects that could be implemented in this area since in the Black Sea there are still no operational projects for wind farms. They are all located near the West coast of the Black Sea at a maximum distance of 100 km from the shore, and where the water depth is of maximum 50 m.
Given the position and climate of the Black Sea, climate changes such as increases and decreases in temperature will be noticeable, this aspect having implications on atmospheric parameters, such as changes in the wind speed. Wind resources are directly related to wind speed and their productivity will be influenced by the climate. To understand how these climate changes influence the operation of wind turbines, this study will focus on the dynamics of the wind energy resources, which will then be compared with other relevant studies in the field. For this study, data on wind speed were obtained using the Euro-CORDEX database, considering two periods, the near future (from 2021–2050) and the distant future (from 2075–2100). Each reference site is related to 5 possible types of turbines (Table 1). To identify relevant trends, studies of mean and maximum wind speed, as well as their seasonal variations were conducted. Moreover, an evaluation of the wind performance is presented.
Analyzing the data obtained for the mean wind speed in the present study, it can be seen that the speeds are close; there are no significant variations between the speeds in the near and distant future. In a study by Daniel Ganea et al. [36] on the same field, the wind and waves in the Black Sea were analyzed, the sea being divided into 5 zones. Zone A, which is also the area of interest of the current study, has a value of the mean wind speed of about 6.9 m/s, this value is close to that obtained in this paper, which is about 6.7 m/s at the height of 10 m (Figure 4 shows the wind speed which is interpolated at a height of 90 m). In another study focused on the same field [37] but with data provided for the past wind, a value of 6.5 m/s of the mean wind speed was obtained. From the two papers and the present study, it is observed that the values obtained are close. The tendency to intensify the wind speed in the future is also highlighted.
From the analysis of the data on the productivity of the 5 turbines, both for the near and distant future, values of AEP between 22,000–32,000 MWh were obtained. Reference is made to similar studies focused on the potential of the Black Sea, such as that of Ganea et al. [38] which analyzes the performance of two wind turbines with powers of 3 MW (for the Vestas V90-3 turbine) and 5 MW (for the Areva M5000-116 turbine) for the near future. In that paper, 12 reference sites are studied, site O1 being the one of interest. The AEP value for the Areva turbine was identified as approximately 15,000 MWh, and that of the Vestas turbine approximately 8800 MWh. The capacity factor for both models is about 34%. Given the low power of the turbines, the results obtained were also lower in the reference work; the results of this paper are interpolated at a height of 90 m while those from the reference study are interpolated at 80 m height, so the present results have an addition of no more than 2%.
In the paper, it can be noticed that for the highest power turbine, the annual energy production is quite low in terms of its power. This is due to the speeds at which the rated power is reached. In the case of the Vestas V164-9.MW turbine, as well as the 2 turbines in the mentioned study, the rated speeds are higher than 12.5 m/s, this aspect directly affecting the turbine productivity. Another work considered was the one in reference [39] which made a study on the efficiency of the wind speed in the Black Sea using data from the past. This study focused on several models of turbines, one of them being the Vestas V164-9.5 MW turbine which is also studied in this paper and whose historical data indicated a productivity of approximately 20,000 MWh and a capacity factor of no more than 25%. With these data, an image of the wind was outlined which for the past showed an average speed below those obtained in this paper.
We can conclude that wind energy resources feature a slight decrease in the climate change scenario for the distant future. Wind speeds are in close connection with the turbine performance. We can also say that for our area of interest, more advanced wind turbine technologies are not necessary, turbines such as those from Siemens Gamesa being quite sufficient. From previous studies on the potential of the North Sea [40], it becomes apparent that the capabilities of the Black Sea in terms of wind intensity do not reach that level. The North Sea is considered to have the highest potential for renewable wind energy in Europe, having the highest number of wind farms. However, the Black Sea, which is not fully exploited yet, could also become a source of renewable resources.
5. Conclusions
This paper aimed to analyze the dynamics of the wind along the west coast of the Black Sea, and for this, six sites located near Romania were considered. Wind speed data were obtained from the Euro-CORDEX database considering the RCP4.5 scenario, in which the radiative forces are approximated to . Two periods of time were considered for this study, the near future (from 2021 to 2050) and the distant future (from 2075 to 2100).
The study outlines relevant trends in wind dynamics, resulting from the analysis of mean, maximum and minimum values of the wind, but also its seasonal and monthly variations. Moreover, five possible types of turbines that could be mounted in these locations were studied, all with high-power, over 6 MW. For these, parameters such as the Annual energy production but also the Capacity factor were analyzed.
From the comparative analysis made for the 2 periods, it was observed that the wind speeds are close, the wind resources for the distant future suffering a slight decrease compared to those in the near future. It was also observed that wind speeds are grouped into two major classes, the most predominant classes being C1 and C7, basically the two extreme classes. Taking into account the seasonal and monthly variation of the wind, the image of a temperate region has been outlined in which there are two opposite seasons, winter and summer, the main cause being the increase or decrease of temperature during these periods. However, there are also two transitional seasons in which the months close to those of the mentioned seasons acquire some of their characteristics. It can be concluded that these locations have positive wind dynamics.
Although the onshore wind turbine industry is often used in Romania, there is still no wind farm on the water, although the superior qualities of wind on the water have been demonstrated. In this idea, the parameters regarding the performance of wind turbines were analyzed. The obtained results showed that in these sites there are remarkable wind resources. It was also noted that advanced technologies of wind turbines are not indicated for these locations, as in the case of high-power turbines such as Vestas V164-9.5 MW, because they require high wind speeds to reach the rated power. The Black Sea is a suitable area for the development of projects with wind farms and could serve as a rich source of renewable energy bringing about an economic advantage for Romania.
Author Contributions
G.A. performed the literature review, supervision, and contributed to the design of the article; A.I.D. carried out the statistical analysis and interpreted the results, wrote the final form of the manuscript, and drew the conclusions; L.R. conceived the paper scope, validated the methods, and also gathered the data. The final manuscript was approved by all authors. All authors have read and agreed to the published version of the manuscript.
Funding
This work was carried out in the framework of the research project DREAM (Dynamics of the REsources and technological Advance in harvesting Marine renewable energy), supported by the Romanian Executive Agency for Higher Education, Research, Development and Innovation Funding-UEFISCDI, grant number PN-III-P4-ID-PCE-2020-0008.
Institutional Review Board Statement
Not applicable.
Data Availability Statement
The data used in this study are openly available. The data used in this study were obtained from the EURO-CORDEX data server.
Acknowledgments
This work will be also presented to the 9th edition of the Scientific Conference organized by the Doctoral Schools of “Dunărea de Jos” University of Galati (SCDS-UDJG) http://www.cssd-udjg.ugal.ro/ (accessed on 28 May 2021) that will be held on 10th and 11th of June 2021, in Galati, Romania.
Conflicts of Interest
The authors declare no conflict of interest.
References
- Ellabban, O.; Abu-Rub, H.; Blaabjerg, F. Renewable energy resources: Current status, future prospects and their enabling technology. Renew. Sustain. Energy Rev. 2014, 39, 748–764. [Google Scholar] [CrossRef]
- Bull, S.R. Renewable energy today and tomorrow. Proc. IEEE 2001, 89, 1216–1226. [Google Scholar] [CrossRef]
- Menegaki, A.N. Growth and renewable energy in Europe: A random effect model with evidence for neutrality hypothesis. Energy Econ. 2011, 33, 257–263. [Google Scholar] [CrossRef]
- Apergis, N.; Payne, J.E. Renewable and non-renewable energy consumption-growth nexus: Evidence from a panel error correction model. Energy Econ. 2012, 34, 733–738. [Google Scholar] [CrossRef]
- Saidi, K.; Hammami, S. The impact of CO2 emissions and economic growth on energy consumption in 58 countries. Energy Rep. 2015, 1, 62–70. [Google Scholar] [CrossRef] [Green Version]
- Van de Graaf, T. Fragmentation in global energy governance: Explaining the creation of IRENA. Glob. Environ. Polit. 2011, 13. [Google Scholar] [CrossRef] [Green Version]
- International Renewable Energy Agency. Future of Wind: Deployment, Investment, Technology, Grid Integration and Socio-Economic Aspects (A Global Energy Transformation paper); International Renewable Energy Agency: Abu Dhabi, United Arab Emirates, 2019. [Google Scholar]
- Hearps, P.; Mcconnell, D. Renewable Energy Technology Cost Review; Melbourne Energy Institute: Melbourne, Australia, 2011. [Google Scholar]
- Aldersey-Williams, J.; Broadbent, I.D.; Strachan, P.A. Better estimates of LCOE from audited accounts—A new methodology with examples from United Kingdom offshore wind and CCGT. Energy Policy 2019, 128, 25–35. [Google Scholar] [CrossRef]
- IRENA. Renewable Power Generation Costs in 2019; International Renewable Energy Agency: Abu Dhabi, United Arab Emirates, 2020. [Google Scholar]
- Short, W.; Packey, D.J.; Holt, T. A Manual for the Economic Evaluation of Energy Efficiency and Renewable Energy Technologies; National Renewable Energy Lab: Golden, CO, USA, 1995.
- De Cara, S.; Rotillon, G. Multi-greenhouse gas international agreements. In Working Papers in Agricultural Economics, 2003-03; Institut National de la Recherche Agronomique: Paris, France, 2003. [Google Scholar]
- Maes, D.; van Dael, M.; Vanheusden, B.; Goovaerts, L.; Reumerman, P.; Márquez Luzardo, N.; van Passel, S. Assessment of the sustainability guidelines of EU Renewable Energy Directive: The case of biorefineries. J. Clean. Prod. 2015, 88, 61–70. [Google Scholar] [CrossRef]
- Kaygusuz, K.; Yüksek, Ö.; Sari, A. Renewable energy sources in the European Union: Markets and capacity. Energy Sources Part B Econ. Plan. Policy 2007, 2, 19–29. [Google Scholar] [CrossRef]
- Strandberg, G.; Bärring, L.; Hansson, U.; Jansson, C.; Jones, C.; Kjellström, E.; Kupiainen, M.; Nikulin, G.; Samuelsson, P.; Ullerstig, A. CORDEX scenarios for Europe from the Rossby Centre regional climate model RCA4. In RMK, Rapport Meteorologi och Klimatologi; SMHI: Norrköping, Sweden, 2015. [Google Scholar]
- Kjellström, E.; Bärring, L.; Gollvik, S.; Hansson, U.; Jones, C.; Samuelsson, P.; Ullerstig, A.; Willén, U.; Wyser, K. A 140-year simulation of European climate with the new version of the Rossby Centre regional atmospheric climate model (RCA3). In RMK, Rapport Meteorologi och Klimatologi; SMHI: Norrköping, Sweden, 2005. [Google Scholar]
- Fantini, A.; Raffaele, F.; Torma, C.; Bacer, S.; Coppola, E.; Giorgi, F.; Ahrens, B.; Dubois, C.; Sanchez, E.; Verdecchia, M. Assessment of multiple daily precipitation statistics in ERA-Interim driven Med-CORDEX and EURO-CORDEX experiments against high resolution observations. Clim. Dyn. 2018, 51, 877–900. [Google Scholar] [CrossRef]
- Chou, S.; Lyra, A.; Mourão, C.F.B.; Dereczynski, C.; Pilotto, I.L.; Gomes, J.L.; Bustamante, J.F.; Tavares, P.; Silva, A.; Rodrigues, D.; et al. Assessment of climate change over South America under RCP 4.5 and 8.5 downscaling scenarios. Am. J. Clim. Chang. 2014, 3, 512–527. [Google Scholar] [CrossRef] [Green Version]
- Diaf, S.; Notton, G.; Belhamel, M.; Haddadi, M.; Louche, A. Design and techno-economical optimization for hybrid PV/wind system under various meteorological conditions. Appl. Energy 2008, 85, 968–987. [Google Scholar] [CrossRef]
- Liu, Y.; Chen, D.; Yi, Q.; Li, S. Wind profiles and wave spectra for potential wind farms in South China Sea. Part I: Wind speed profile model. Energies 2017, 10, 125. [Google Scholar] [CrossRef] [Green Version]
- Manwell, J.F.; McGowan, J.G.; Rogers, A.L. Wind Energy Explained: Theory, Design and Application; Wiley: Chichester, UK, 2009. [Google Scholar]
- Hellmann, G. Über die Bewegung der Luft in den untersten Schichten der Atmosphäre. Meteoral. Z. 1916, 34, 273. [Google Scholar]
- Albani, A.; Ibrahim, M.Z. Wind energy potential and power law indexes assessment for selected near-coastal sites in Malaysia. Energies 2017, 10, 307. [Google Scholar] [CrossRef] [Green Version]
- American Bureau of Shipping (ABS). Guide for Building and Classing Offshore Wind Turbine Installation; American Bureau of Shipping: Houston, TX, USA, 2014. [Google Scholar]
- Stull, R. Practical Meteorology. An Algebra-based Survey of Atmospheric Science; Univ. Br. Columbia: Vancouver, BC, Canada, 2015. [Google Scholar]
- Jarraud, M. Guide to meteorological instruments and methods of observation. In WMO—No. 8; World Meteorological Organization: Geneva, Switzerland, 2008; Volume 29. [Google Scholar]
- Chaurasiya, P.K.; Ahmed, S.; Warudkar, V. Study of different parameters estimation methods of Weibull distribution to determine wind power density using ground based Doppler SODAR instrument. Alexandria Eng. J. 2018, 57, 2299–2311. [Google Scholar] [CrossRef]
- Rusu, E.; Diaconita, A.; Raileanu, A. An assessment of the wind power dynamics in the European coastal environment. In E3S Web of Conferences; EDP Sciences: Paris, France, 2020; Volume 173, p. 1002. [Google Scholar]
- Song, D.; Zheng, S.; Yang, S.; Yang, J.; Dong, M.; Su, M.; Joo, Y.H. Annual energy production estimation for variable-speed wind turbine at high-altitude site. J. Mod. Power Syst. Clean Energy 2020, 1–4. [Google Scholar] [CrossRef]
- Afungchui, D.; Aban, C.E. Analysis of wind regimes for energy estimation in Bamenda, of the North West Region of Cameroon, based on the Weibull distribution. Rev. Energ. Renouvelables 2014, 17, 137–147. [Google Scholar]
- Al-Nassar, W.; Alhajraf, S.; Al-Enizi, A.; Al-Awadhi, L. Potential wind power generation in the State of Kuwait. Renew. Energy 2005, 30, 2149–2161. [Google Scholar] [CrossRef]
- Gómez-Lázaro, E.; Bueso, M.C.; Kessler, M.; Martín-Martínez, S.; Zhang, J.; Hodge, B.-M.; Molina-García, A. Probability density function characterization for aggregated large-scale wind power based on Weibull mixtures. Energies 2016, 9, 91. [Google Scholar] [CrossRef] [Green Version]
- Akinsanola, A.A.; Ogunjobi, K.O.; Abolude, A.T.; Sarris, S.C.C.; Ladipo, K.O. Assessment of wind energy potential for small communities in South-South Nigeria: Case study of Koluama, Bayelsa State. J. Fundam. Renew. Energy Appl. 2017, 7, 1–6. [Google Scholar] [CrossRef] [Green Version]
- Gul, M.; Tai, N.; Huang, W.; Nadeem, M.H.; Yu, M. Assessment of wind power potential and economic analysis at Hyderabad in Pakistan: Powering to local communities using wind power. Sustainability 2019, 11, 1391. [Google Scholar] [CrossRef] [Green Version]
- Rusu, E.; Onea, F. An assessment of the wind and wave power potential in the island environment. Energy 2019, 175, 830–846. [Google Scholar] [CrossRef]
- Ganea, D.; Mereuta, E.; Rusu, L. Estimation of the near future wind power potential in the Black Sea. Energies 2018, 11, 3198. [Google Scholar] [CrossRef] [Green Version]
- Rusu, L.; Raileanu, A.; Onea, F. A comparative analysis of the wind and wave climate in the Black Sea along the shipping routes. Water 2018, 10, 924. [Google Scholar] [CrossRef] [Green Version]
- Ganea, D.; Rusu, L.; Mereuta, E. Turbines evaluation in the nearshore and offshore of the Black Sea. In Proceedings of the International Multidisciplinary Scientific GeoConference SGEM, Albena, Bulgaria, 30 June–6 July 2019; Volume 19, pp. 585–592. [Google Scholar]
- Onea, F.; Rusu, L. Evaluation of some state-of-the-art wind technologies in the nearshore of the Black Sea. Energies 2018, 11, 2452. [Google Scholar] [CrossRef] [Green Version]
- Diaconita, A.; Florin, O.; Eugen, R. An evaluation of the wind energy in the North Sea Coast. Mech. Test. Diagn. 2019, 9, 17–22. [Google Scholar] [CrossRef] [Green Version]
Publisher’s Note: MDPI stays neutral with regard to jurisdictional claims in published maps and institutional affiliations. |
© 2021 by the authors. Licensee MDPI, Basel, Switzerland. This article is an open access article distributed under the terms and conditions of the Creative Commons Attribution (CC BY) license (https://creativecommons.org/licenses/by/4.0/).

