Article

The Expected Impact of Marine Energy Farms Operating in Island Environments with Mild Wave Energy Resources—A Case Study in the Mediterranean Sea

Department of Mechanical Engineering, Faculty of Engineering, ‘Dunarea de Jos’ University of Galati, 47 Domneasca Street, 800008 Galati, Romania
*
Author to whom correspondence should be addressed.
Inventions 2021, 6(2), 33; https://doi.org/10.3390/inventions6020033
Submission received: 23 March 2021 / Revised: 29 April 2021 / Accepted: 6 May 2021 / Published: 9 May 2021

Abstract

:
A particularity of island areas is that they are subjected to strong sea state conditions that can have a severe impact on the beach stability, while on the other hand, they rely mainly on diesel combustion for electricity production which in the long run is not a sustainable solution. The aim of this work is to tackle these two issues, by assessing the impact of a hybrid marine energy farm that may operate near the north-western part of Giglio Island in the Mediterranean Sea. As a first step, the most relevant environmental conditions (wind and waves) over a 27-year time interval (January 1992–December 2018) were identified considering data coming from both ERA5 and the European Space Agency Climate Change Initiative for Sea State. An overview of the electricity production was made by considering some offshore wind turbines, the results showing that even during the summertime when there is a peak demand (but low wind resources), the demand can be fully covered by five wind turbines defined each by a rated power of 6 MW. The main objective of this work is to assess the coastal impact induced by a marine energy farm, and for this reason, various layouts obtained by varying the number of lines (one or two) and the distance between the devices were proposed. The modelling system considered has been already calibrated in the target area for this type of study while the selected device is defined by a relatively low absorption property. The dynamics of various wave parameters has been analysed, including significant wave height, but also parameters related to the breaking mechanics, and longshore currents. It was noticed that although the target area is naturally protected by the dominant waves that are coming from the south-western sector, it is possible to occur extreme waves coming from the north-west during the wintertime that can be efficiently attenuated by the presence of the marine energy farm.

1. Introduction

For decades, the idea of using marine renewable energy has been an attractive one, making it possible to develop various applications, ranging from electricity production to coastal defense. Moreover, a significant percentage of island areas, including both islands located in the ocean or enclosed seas, is defined by important wave and wind power resources [1,2,3,4]. From this perspective, there are numerous studies suggesting that the Mediterranean Sea could be successfully used for the implementation of some marine energy farms, especially as regards the development of joint wind-wave projects [5,6].
On the other hand, continuous erosion and accretion processes naturally shape the morphology of a particular coastal area. For the continental coasts, this balance can be relatively easy to shift by using in an efficient way the sediments coming from the local rivers. Nevertheless, in some cases, it is necessary to consider also hard engineering solutions for coastal protection that are neither cheap nor efficient, or environmentally friendly [7,8]. Furthermore, an island shoreline is more sensitive to wave conditions, especially if we take into account the expected issues associated with climate change and sea level rise [9]. In general, the coastlines of the Mediterranean Sea are stable, with higher erosion threats being noticed for the Adriatic and Ionian seas, that can go up to up to 25.6% from the coast length. The Aegean Sea indicates a minimum value of 7.4%, being followed by the Gulf of Lion (14.4%) and Sardinia (18.4%). If we discuss sedimentation, this was only 1.2% for the Ionian Sea, 2.4% in the case of the Balearic Islands, and can go up to 7.8% in the case of the Gulf of Lion [10]. All the abovementioned statistics are reported for each basin or region (ex: Aegean Sea—7.4%). Nevertheless, the erosion of the Mediterranean coasts is a real problem, being estimated that almost 40% of the beaches (on the European side) are severely affected, including the Italian beaches where almost 27% are currently under recession. The current situation may have severe implications for the near future, taking into account that almost 85% of the European Mediterranean population lives close to the sea, among which 65% are concentrated in urban areas [11]. The Barcelona Convention [12] was adopted to protect the natural resources of the Mediterranean basin, and this clearly indicates that the regional coastal erosion is directly related to the alteration of the sediment supply.
Although wave power has a higher density than wind power, the wave industry is far behind the offshore wind industry regardless of the technical-economic criteria taken into account [13,14,15]. One way to accelerate the development of this sector is to find a niche, as in the case of the coastal defence, whereby using a marine energy farm it would be possible to protect a particular coastal area, although the electricity production might not be great. This type of approach is considered to be a viable option, various case studies being discussed for areas as Spain [16,17], Portugal [18,19], or the Black Sea [20]. At this point, it is important to mention that the Mediterranean Sea is defined by moderate wave resources, that are specific to a semi-enclosed basin, being estimated relatively small expectations for the electricity production only from the waves [21]. Nevertheless, in a more recent study published by Lavidas and Blok [22] it was highlighted the fact that even for milder resources, a wave energy project can become competitive from a technical-economical point of view.
All the above-mentioned studies are based on “what if” case studies since there are many types of wave energy converters (WECs) and each coastal area is defined by specific geographical features. For example, in the case presented in Bergillos et al. [23] a dual wave farm is proposed for Playa Granada (in the south of Spain). The results of this study showed that the efficiency of the coastal protection is more visible in the case of the long waves and on the other hand it is important to dynamically adjust the WEC geometry. The same target area was considered in Rodriguez-Delgado et al. [24] to identify the optimum variation of the inter-WEC spacing. According to these results, an intermediate inter-WEC of 2d spacing or 3d spacing represents the ideal combination for coastal defence purposes. In Rusu and Onea [18], the coastal effects for the Pinheiro da Cruz area (south of Lisbon) were evaluated considering the influence of the distance from the coast of a generic wave farm. It was found that a wave farm located close to the shore (at 1 to 4 km) will significantly influence the wave conditions, while an offshore farm (located at about 7 km) may change the direction of the local waves. In the work of Mendoza et al. [25], two different coastal environments were considered for evaluation: Santander Bay (Spain) and Las Gloria Beach (Mexico). Several wave farm layouts were designed, including commercial WECs like Wave Dragon, Blow-Jet, or Dexa. According to this work, it is not recommended to design a wave farm with larger longshore gaps, being more efficient to consider a multi-line configuration. If the WECs are defined by low transmission coefficients or the impact on the waves needs to be more severe, then it is recommended to place a wave farm closer to the shore.
In the work of Raileanu et al. [26], several geographical environments were considered to assess the impact of a wave farm, among them being included also the Porto Ferro area in Sardinia Island. According to these results, a wave farm located at approximately 2 km from the shore may reduce the wave height by 1.37 m in the case of an extreme storm, which subsequently will attenuate the wave forces acting in the surf zone. It was also found that in the case of a high storm, the sediment transport rate (only due to the wave action) may be reduced by a maximum value of 2389 m3/24 h. This value is significantly lower than in other regions like the ones from Portugal (ex: Leixoes–41,702 m3/24 h). The same target area was also considered for the implementation of a hybrid wind-wave farm [27], for which several transmission criteria were considered. These results show that the wave heights are significantly reduced at the contact with the wave farm (by almost 50%), being noticed a tendency of the wave fields to regenerate until they reach the shoreline. By looking at the existing literature, we can notice that most of the studies tackling with the coastal defense through wave farms are related to the continental coasts, and very little importance is given to the island areas. Therefore, the aim of this work is to cover this gap and to provide a better understanding of the coastal processes induced by a generic marine energy farm (a hybrid approach containing floating wind turbines and wave energy converters) that may operate in the vicinity of an island environment, such as Giglio in the Mediterranean Sea. The following research questions guide the present work:
(a)
What is the long-term wind and wave energy pattern in the vicinity of Giglio Island according to some state-of-the-art data (satellite and reanalysis).
(b)
What is the impact of a hybrid marine energy farm on the local area.
(c)
Hw the coastal dynamics will be affected by the presence of such a marine energy farm.
The Mediterranean Sea, in general, and the coastal environment of Giglio Island that is targeted in this work, in particular, are not very rich in wave power resources. From this perspective, the idea of implementing a wave energy farm only for wave energy production may not be very realistic. On the other hand, the implementation of a hybrid wind-wave farm may be economically effective and at the same time may provide coastal protection for certain nearshore areas as this particular environment is. Following this approach, the wind turbines would be the main source of energy and the wave energy converters would complete the energy extraction and they are also effectively used for coastal defence.
In the first part describing the methods and materials, the characteristics of the target area (Giglio Island) are discussed together with the computational environment considered and the case studies defined. The case studies are designed based on an analysis of the wind and wave data coming from ERA5 and CCI-SS datasets. Further on, model system simulations are performed for the case studies defined considering the current situation (no farm) and also various marine energy farm configurations. The field variations of the significant wave heights and wave direction due to the different marine farm configurations have been assessed. These evaluations provide a comprehensive picture of the near and far field effects induced by the presence of the marine energy farms under different wave propagation patterns. Furthermore, the local effects are evaluated in some nearshore points in terms of particle orbital velocity and wave induced forces. Finally, the impact of the marine energy farms on the nearshore circulation is also assessed by proving the expected variations of the longshore currents’ velocities along several reference lines.

2. Materials and Methods

2.1. Target Area

Giglio Island (also known as Isola del Giglio) is located in the Tyrrhenian Sea. The island is included in the Tuscan Archipelago and, like many islands in this area, has a volcanic origin. The island has an area of 21 km2 and the maximum height is 498 m. It is a major touristic attraction, being mostly known for the bathing area (in north-west Campese bay), offshore fishing, and more recently for the capsizing of Costa Concordia cruise ship [28]. As Figure 1 illustrates, the only connection to the mainland is made through ferries that operate on the eastern coast from the Giglio port.
This island is defined by a main axis that goes from N–NW to S–SE and has an elliptical shape with 8.5 km (long) × 4.5 km (wide). The shoreline area is characterized by high and rocky coasts, including several inlets and bays. The Giglio Port area is defined by a steep-rock slope and at approximately 350 m from the coast, the water depth easily exceeds 100 m in depth. It is estimated that the clay accumulations cover almost 60% of the depth areas that exceed 50 m. Another important aspect is related to the wind conditions, being frequently noticed local storm conditions generated by winds coming from the northern sector [29]. The target area of this study is Campese Bay on the northwestern side of the island. This is the largest beach on the island being also its most important tourist resort. It is a long and wide beach with coarse sand separated by a cliff in the middle. A reference point (10°84′ E/42°38′ N) is considered to collect wind and wave data relevant to this coastal environment.

2.2. ISSM Computational Platform and Case Studies

2.2.1. The ISSM Interface

The present work aims to assess the coastal impact of four marine energy farm configurations (single and double lines), which will be done by using the ISSM (Interface for SWAN and Surf Models) computational environment [30,31]. In ISSN the SWAN spectral wave model is used for the evaluation of the wave conditions. This integrates the spectral action balance equation in five dimensions (time, geographical and spectral spaces), which is defined in Equation (1) [32]:
N t + c g + U N + σ c σ N + θ c θ N = S σ
where: σ—relative frequency, N—action density spectrum, θ—wave direction or U —velocity of the ambient current (uniform). The quantities denoted with S are related to the sink and source terms. As a next step, the information provided by the SWAN model is used to run the Navy Standard Surf Model (or Surf) that can examine in more details the nearshore processes, including here the longshore currents [33]. More details about the SWAN set-up and the physical processes activated can be found in Table 1.
At this point, it has to be highlighted that in the present work wave energy extraction is modelled using transmission coefficients, while the frequency dependence of the wave energy harvesting was not taken into consideration. However, it should be underlined that wave energy converters do not extract energy equally for all frequencies. Thus, by ignoring this property of the wave energy converters we may overestimate the impacts they will have in the wave field in the lee of the arrays. See for example [34] and also the similar study [35]. On the other hand, the objective of the present work was to assess the coastal impact of various marine energy farm configurations and not to model in a very accurate way the wave energy extraction for a certain device. For this reason, the approach using transmission coefficients is considered.
It is also important to mention that the SWAN model was already implemented and calibrated in the targeted area (Campese Bay), and the results concerning the reliability of the model predictions are discussed in Rusu et al. [30] and Rusu [36].
In relationship with the way how the transmission and reflection processes are considered in the model simulations, some additional details are provided next. The SWAN model can estimate wave transmission through a (line-) structure assuming that the obstacle is narrow compared to the grid size, and this is also the case of the generic marine energy farms considered. There are several mechanisms for wave transmission accounted in numerical modelling and SWAN can reasonably account for waves around an obstacle if the directional spectrum of incoming waves is not too narrow. In the present approach, the transmission of waves passing over an obstacle with a closed surface has been modelled using the expression of Goda et al. [37].
Depending on the nature of the obstacle, the reflected wave field can be more or less scattered. In the present work, the reflection over wave components was considered diffused in different directions. Furthermore, according to this approach in case the obstacle becomes flooded, its reflection and transmission properties change as a function of the relative freeboard, defined as the ratio of the difference in dam height and the water level by the (incident) significant wave height.

2.2.2. Case Studies

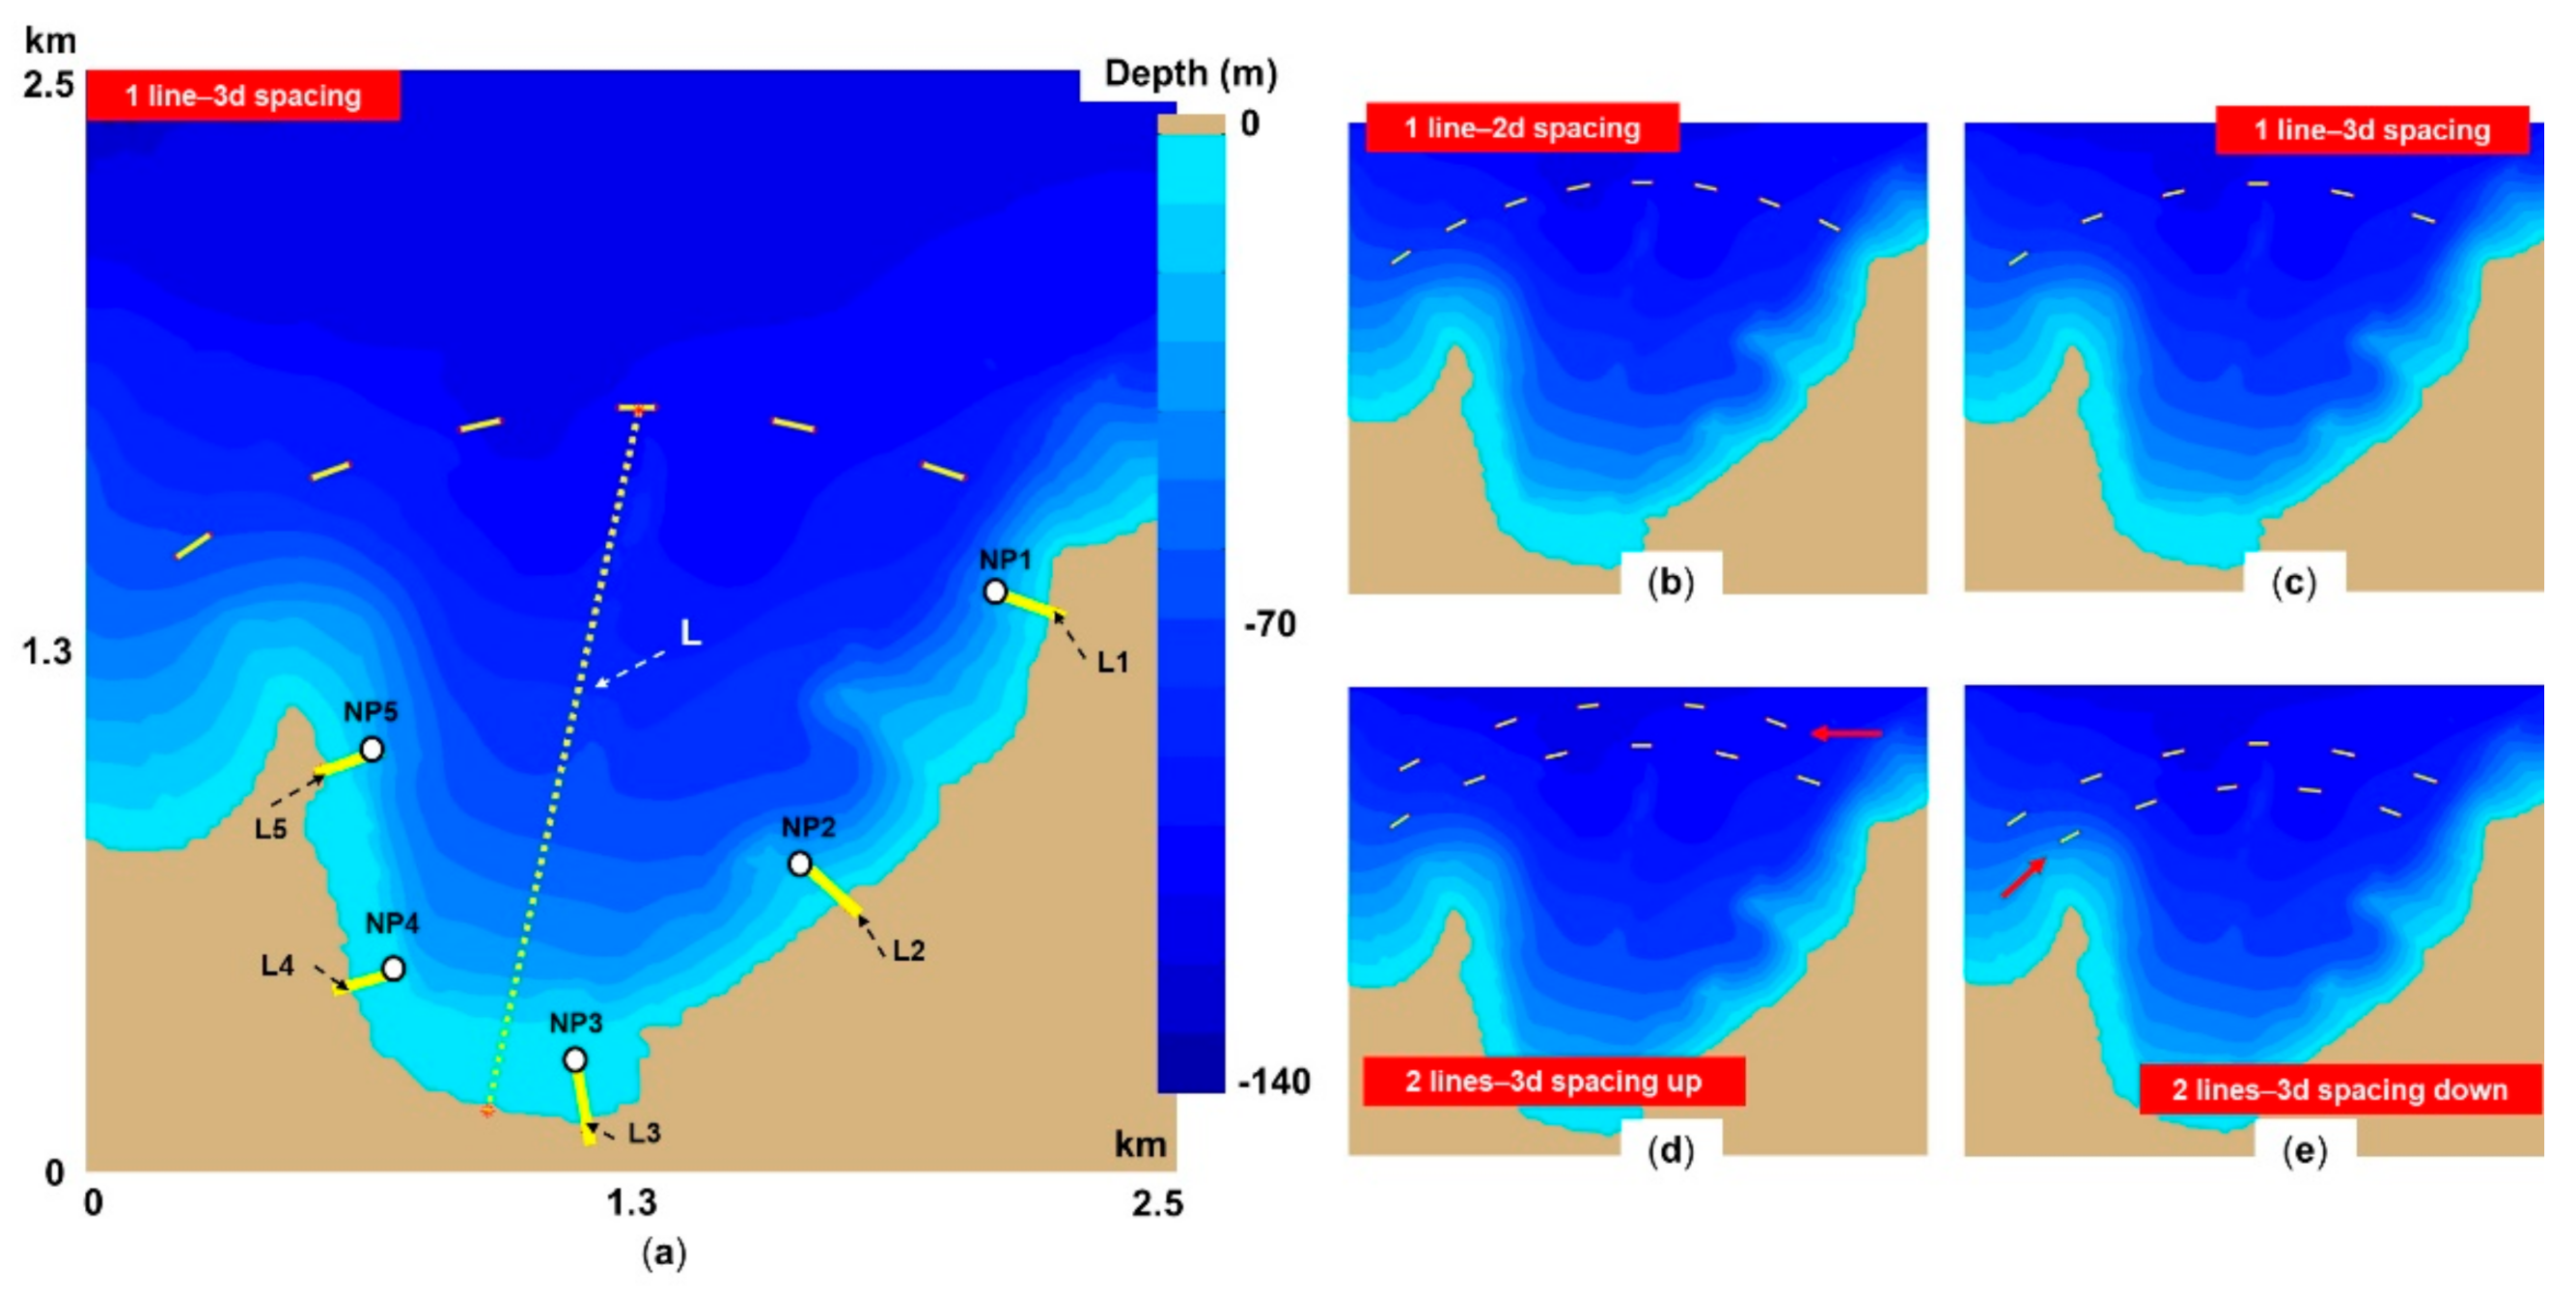
Figure 2 presents the computational domain, which is defined by a 2.5 km length (equal in x and y directions) and a maximum depth of 140 m in the offshore area. A generic marine energy farm defined as an arc was placed in front of Campese Bay, the expected impact being quantified by the nearshore points (denoted as NP1 to NP5), and L reference lines (L1–L5 in the nearshore and another longer line L-coming from offshore in the central part). The configuration replicates a wave farm assembled from WaveCat systems. These wave energy converters are defined by: length = 90 m; transmission coefficient = 0.76; reflection coefficient = 0.43 [38,39]. At this point, it has to be also highlighted that the WaveCat device is a variable geometry in that the wave interaction area of the converter can be changed depending on the sea state to prevent overloading the device in storm conditions, like the case studies considered in this paper. As a result, the energy capture in high energy sea states could be less than the nominal values, but on the other hand, the dissipation through whitecapping and wave breaking is much higher in such cases compensating the effects from the perspective of the coastal protection. Several case studies were designed (one line and two lines farms), by modifying the inter-device spacing from 2d spacing (two distances) to 3d spacing, which is based on the length of the WaveCat system [23]. For the two-line configuration, at the marine energy farm layout presented in Figure 2a, a line up was added (Figure 2d) and one down (Figure 2e), to see if there are any differences.

2.3. Wind and Wave-Data and Analysis

The ERA5 database is frequently used for renewable applications, being available on a global scale [40]. This replaces the ERA-Interim database and has a better resolution and accuracy than the previous dataset. For the present work, the time series of the wind and wave data covering the 27-year time interval (January 1992–December 2018) were extracted for the Giglio point (10°84′ E; 42°38′ N), which is illustrated in Figure 1. The wind speed (u and v components) is directly reported at 100 m (denoted as U100) by the ERA5 data, this being the height at which most of the offshore wind turbines operate [4]. The same time interval is considered to assess the wave conditions, the following parameters being processed: significant wave height (Hs), wave period (Tm), and wave direction (Dir). Although the wind and wave data are available on an hourly temporal resolution, only four data per day (00-06-12-18 UTC) were used in the present work.
The second database considered in the work is related to the European Space Agency Climate Change Initiative for Sea State (CCI-SS) project [41]. This involves only the Hs parameter that is obtained from a multi-mission satellite altimeter measurement, processed for the time interval 1992–2018. These measurements were compared with in situ data and a good correlation is noticed [42]. The Hs time series corresponding to the Giglio point were extracted from a fix resolution grid (1° × 1°). They are related to the CCI-SS dataset v1.1 and correspond to each month. The idea is to use the CCI-SS measurements to evaluate the Hs values provided by ERA5, and since the altimeter missions do not provide additional information regarding the wave parameters, this can be considered a limitation of the present work. Another limitation is related to the fact that only the wind conditions provided by ERA5 will be considered, being difficult to estimate the accuracy of this data for a semi-enclosed basin, such as the Mediterranean Sea.
Another objective of the present work was to determine the performance of some offshore wind turbines that may operate in the vicinity of the target area. Such analysis can be opportune considering that most of the Giglio electricity production is provided by the diesel generators, with the mention that during the summer there is a peak demand due to the tourist activities. It has to be highlighted also that there is interest for renewable projects in this island, already being in progress a project called Giglio Smart Island, aiming to incorporate solar energy into the local electricity grid [43].
In Table 2 the wind turbines selected are presented, they are sorted from the smallest to the highest rated power (3 to 9.5 MW). Considering that the ERA5 wind data are provided at 100 m, also the hub height of these turbines was set to this value. This is also in line with the guideline provided by the manufactures. The first three turbines (denoted from T1 to T3) are frequently used in offshore projects, while the last represents the trend of this industry to focus on large scale generators.
The Annual Electricity Production (AEP) of a particular wind turbine, can be estimated by the Equation (2) [45]:
A E P = T · c u t i n c u t o u t f u P u d u
where: AEP is expressed in MWh, T—represents the number of hours per year (8760 h/year), f(u)—probability distribution of the wind speed, P(u)—P(u)power curve of a turbine, Cut-in/Cut-out—turbine characteristics.
Of course the above inclusion of the wind turbine power production does not contribute to the understanding of the impact on the coastal environment of the marine energy farm. On the other hand, it indicates that a marine energy farm will make sense to be deployed in that specific area and a hybrid approach appears to be more effective than considering only wave energy converters. Thus, considering that the average wave energy is not very high in the coastal environment targeted and also that the technologies for the wave energy extraction have not reached yet an industrial stage, only a wave energy farm will not be very effective from the point of view of the electric energy produced, although it might be very effective for coastal protection. For this reason, since the wind energy production expected in that coastal area is relatively good, it would make more sense from an economic point of view to consider a generic marine energy farm including a hybrid approach wind-waves energy converter. In fact, that is way the term marine energy farm was used throughout the work.

3. Results

3.1. Wind and Wave-Data and Analysis

Figure 3 presents a first analysis of the wave conditions, by comparing the Hs values (average and extreme) as provided by the ERA5 and CCI-SS datasets. Regarding the monthly distribution (Figure 3a,b), it can be noticed that for the average values, ERA5 indicates lower Hs results than the satellite data, while for the extreme values an opposite trend is noticed.
For the ERA5 data the results are in the range [0.4–0.9] m (average values) or can go up to [2.15–5] m (extreme values), while for the satellite data the corresponding ranges are [0.62–1.25] m (average) or [1.74–3.41] m (extreme), respectively. As expected, higher values occur during the wintertime, being noticed maximum peaks for October and December. The seasonal distribution is presented in Figure 3c, where both datasets indicate higher values during the springtime (compared to summer). Comparing the autumn and winter extreme values, it is noticed that ERA5 data indicate a peak of 5.4 m (autumn) while the CCI-SS shows a 3.4 m value in winter. Per total, the satellite data indicate an average Hs value of 1.09 m, while ERA5 goes down to 0.64 m.
Figure 3 presents the wave statistics based on information coming from the two databases considered (ERA5 and CCI-SS). The reason for considering two different sources is that in this way a more realistic picture of the wave conditions is provided. The satellite measurements present more accurate results than the ERA5 model; even these are using data assimilation techniques to improve their hindcast. From this figure, we can define the average and extreme values corresponding to the seasons and to each month.
Looking at the position of the Giglio Island in the Mediterranean Sea and the orientation of Campese Bay, we may expect that a severe threat for this coastal area to come from the waves associated with the north-western sector, that are entering in this target area. For this reason and in order to identify the extreme events, the ERA5 time series were filtered to select only the waves coming from this sector. Several case studies were identified as being considered more significant, as can be noticed from Table 3. The first one (CS1) occurs in December, indicating a maximum Hs value of 4.72 m with waves coming from the western sector. Extreme waves can occur also from the northern sector, as it can be noticed in the case of CS4 where a Hs value of 3.17 m was recorded in November 2013. These four case studies are further considered as an input for the SWAN simulations, to see the influence of the marine energy farm in the target area.
Figure 4 provides a general picture of the local wind resources, according to the ERA5 data. From the monthly distribution of the U100 parameter (Figure 4a,b), we can see that during the summertime we may expect lower values (4.54 m/s), while for the interval October–March the average values exceed 6.8 m/s. As for the extreme values, during October it is possible to have wind speeds higher than 25 m/s, which means that the wind turbine would need to be shut down under such conditions. Per total, the maximum wind speed values are in the working range [15.6–23.8] m/s. This means nearly no downtime for the selected wind turbines. At this point a comparison was made between two high capacity wind turbines, T4 (8.8 MW) and T5 (9.5 MW). The results show that they produce almost the same amount of electricity. From this perspective, even if T5 has a higher capacity, T4 seems to be more efficient since has a lower rated speed and arrives faster to the optimal production capacity. On the other hand, if we consider the CAPEX, this is in Europe about €1.23 million/MW implying a difference of about €0.86 million (9.5–8.8 MW), which would not be justified.
As expected, the AEP performances (Figure 4c) are related to the capacity of each generator, and therefore a direct comparison between them is not fair. Lower production is reported during the summertime (0.53–2.15 GWh), which starts to increase as we reach the wintertime (1.46–5.4 GWh). The AEP provided by T2 and T3 is relatively close (ex: 3.26 GWh-T2/3.71 GWh-T3 in winter), while T4 and T5 are almost identical, which suggests that a 9.5 MW wind turbine should not be the best economical solution. Per total, each turbine is expected to produce at least: 4.13 GWh-T1; 9.49 GWh-T2; 10.82 GWh-T3; 15.66 GWh-T4; and 15.68 GWh-T5. As for the capacity factor, lower performances are noticed during summer (ex. 8.07%-T1), reaching a maximum of 29.79% during winter (T2 turbine). The turbine T2 (Areva M5000-116) shows in general better results, providing an overall capacity factor of 21.68%, being followed by T4 (20.31%) and T3 (20.09%).

3.2. Coastal Impact Induced by the Generic Marine Energy Farm

3.2.1. Analysis of the Significant Wave Heights

Figure 5 presents a typical storm event that might occur in the target area with waves coming from the south-western sector, this being the dominant direction for Giglio Island. Figure 5a illustrates the no farm situation, while in Figure 5b four different case studies of marine farm layouts are presented. On the upper side, a single line marine farm is shown the difference between the two subplots presented being the distance considered between the devices (2d or 3d spacing, respectively).
In the lower side of Figure 5b, the second line of devices was added, up from the initial line on the left side and down from the initial line on the right side. The peninsula located on the left side of Campese Bay acts as a natural dam, decreasing the incoming waves by almost 50%. Regarding the marine energy farms, the impact on the local wave fields is insignificant, the waves passing between the rows. More than this, it was noticed locally that due to the reflection properties of the farm, it is possible to induce a small increase of the Hs values. At a first look, it seems that a two-line configuration could be a viable option for electricity production since for this sea state the shielding effect induced by the first line (from shore) will be minimal.
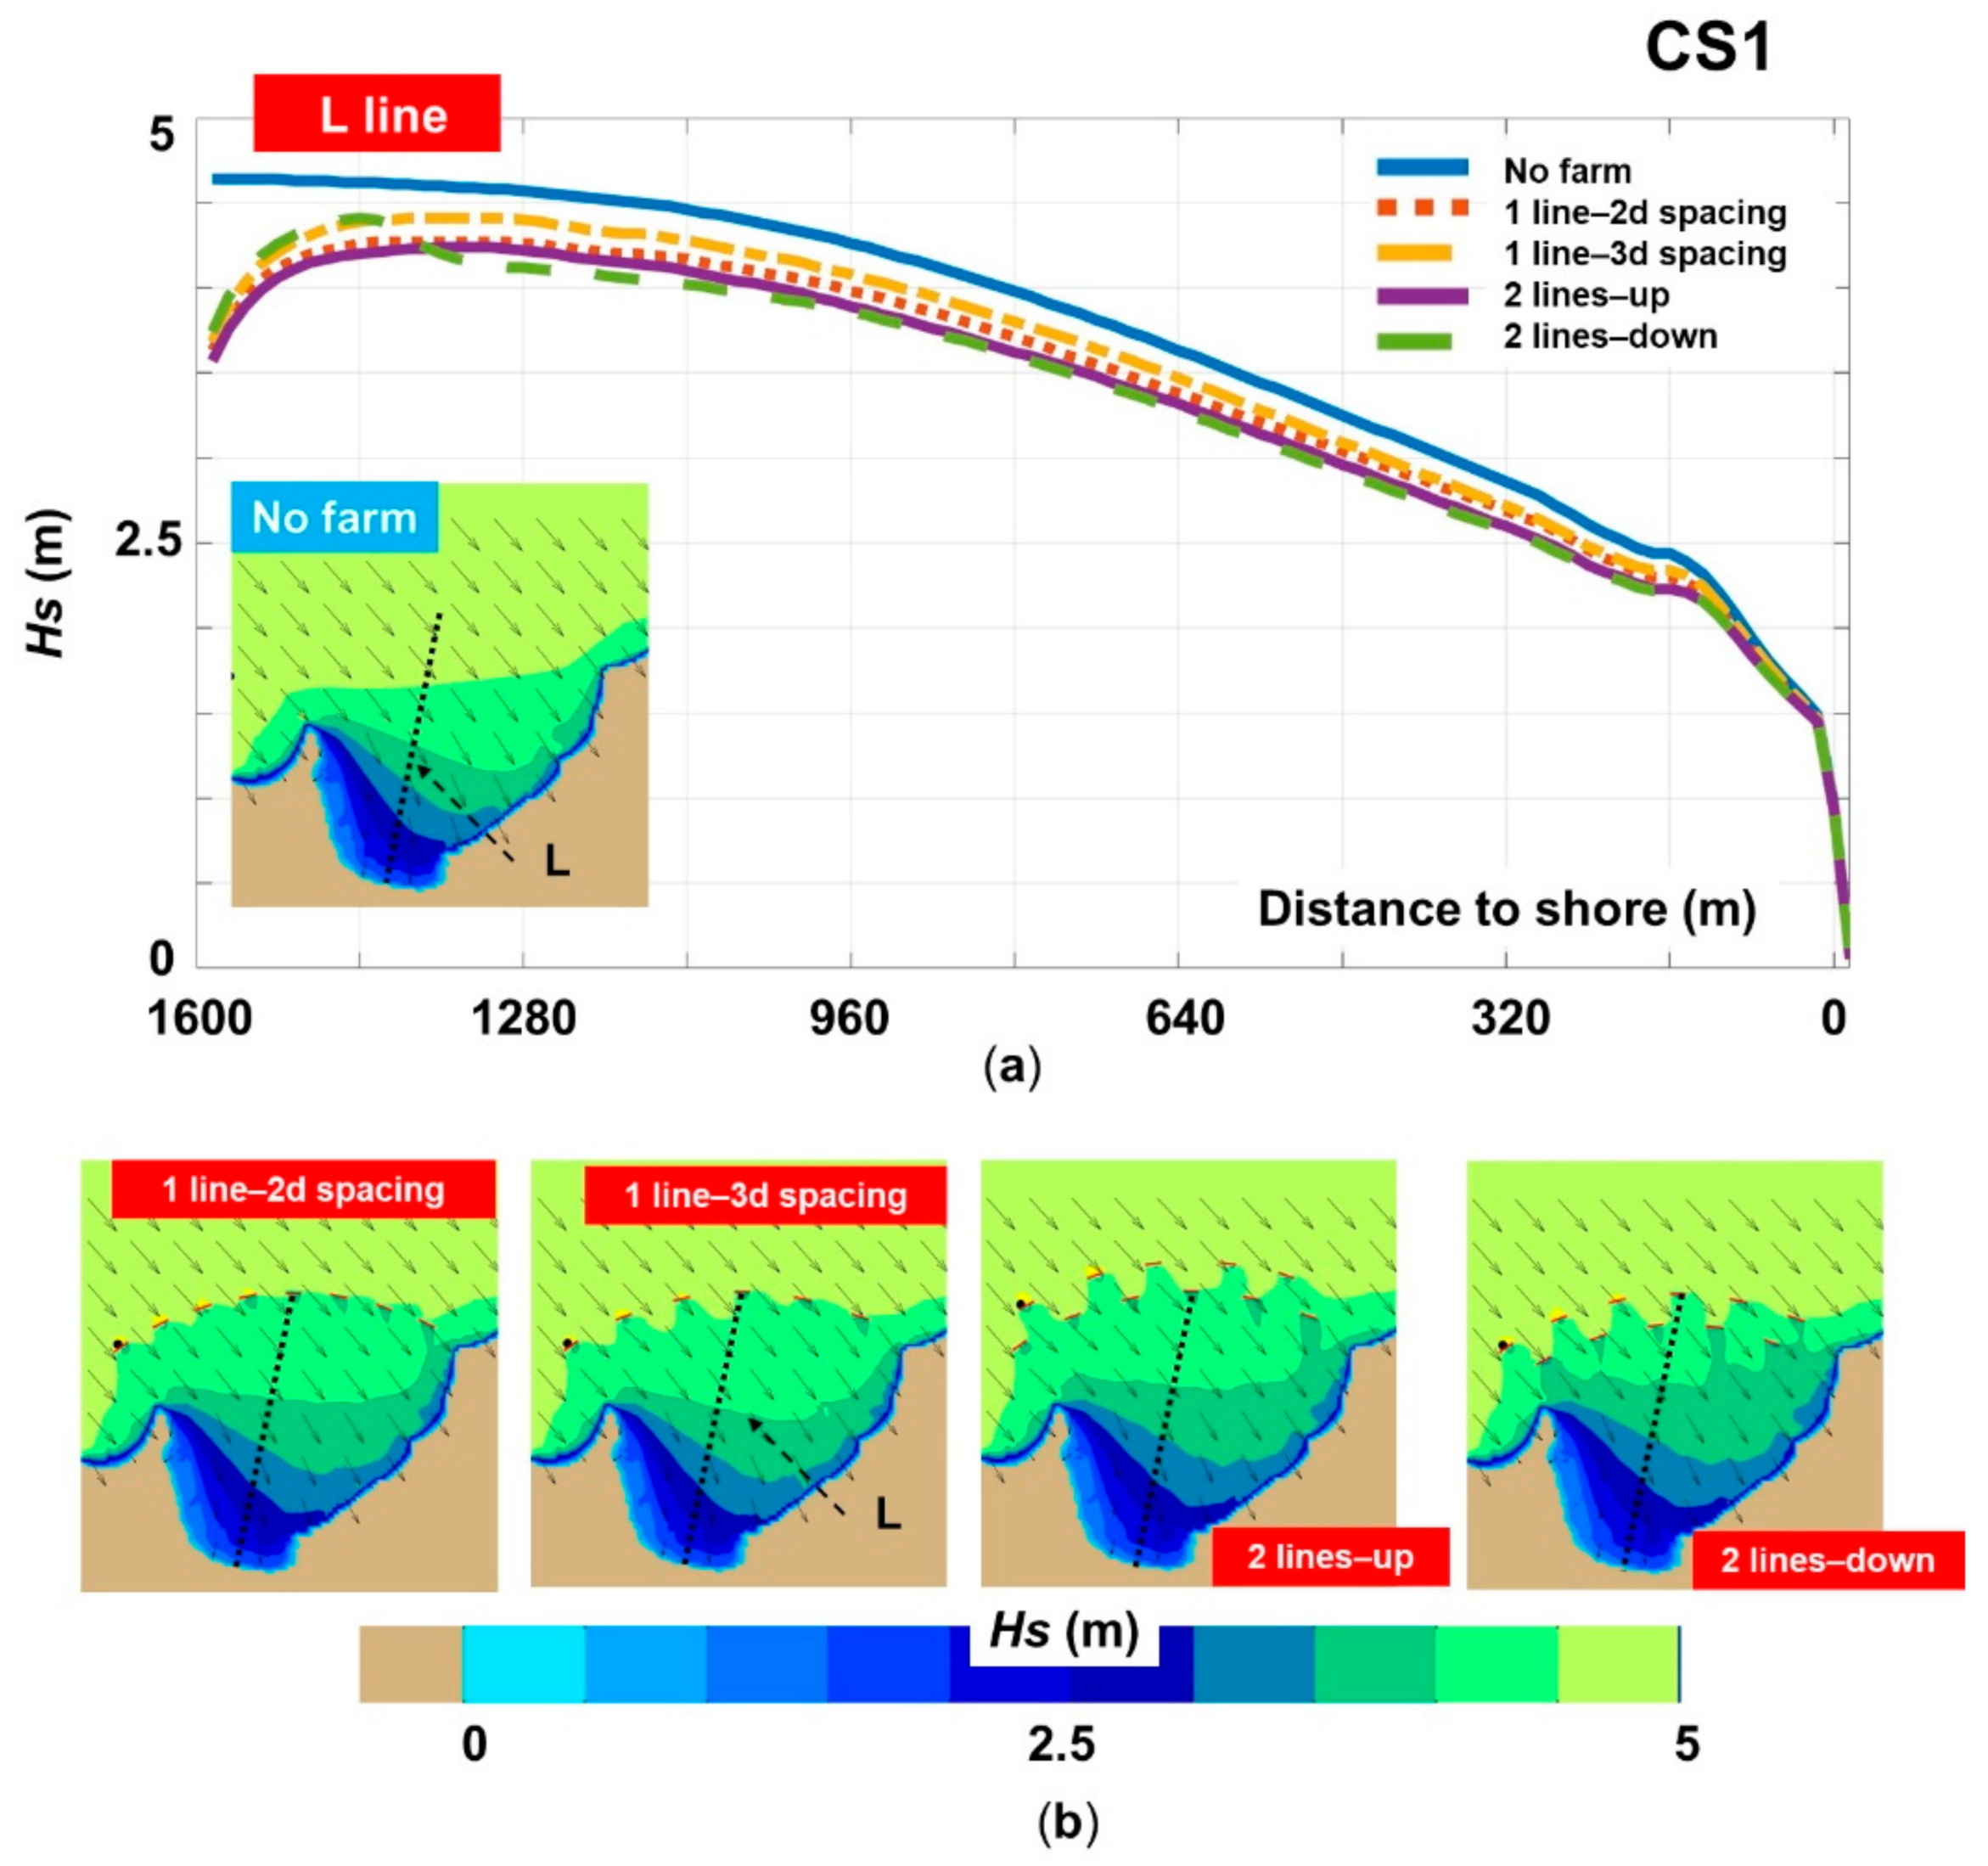
Going to the case studies, in Figure 6 the spatial maps related to scenario CS1 are presented, including the evolution of the Hs values along the L line (central area). According to the information provided by the wave profile along the L line, all the marine energy farms indicate an attenuation that is more visible for the two-line layout. A maximum Hs value of 4.64 m is indicated for the no farm situation, while at the contact with the farm the values may decrease to 3.57 m (2 lines-up). Nevertheless, the waves are starting to regenerate relatively quickly after they pass the farm area.
Regarding the spatial map, the farm impact is visible locally (behind each device) and also on the general wave field distribution. In the left side, a small peninsula can be noticed. This seems to have a more significant influence than the marine energy farm. However, the first two or three systems from the left side of the marine energy farm have also a certain influence in relationship to this wave direction considered. Some regeneration processes can be also noticed, and it has to be taken into account the fact that maps are presented, while a more detailed analysis in points or along lines would reflect in a more obvious way the differences.
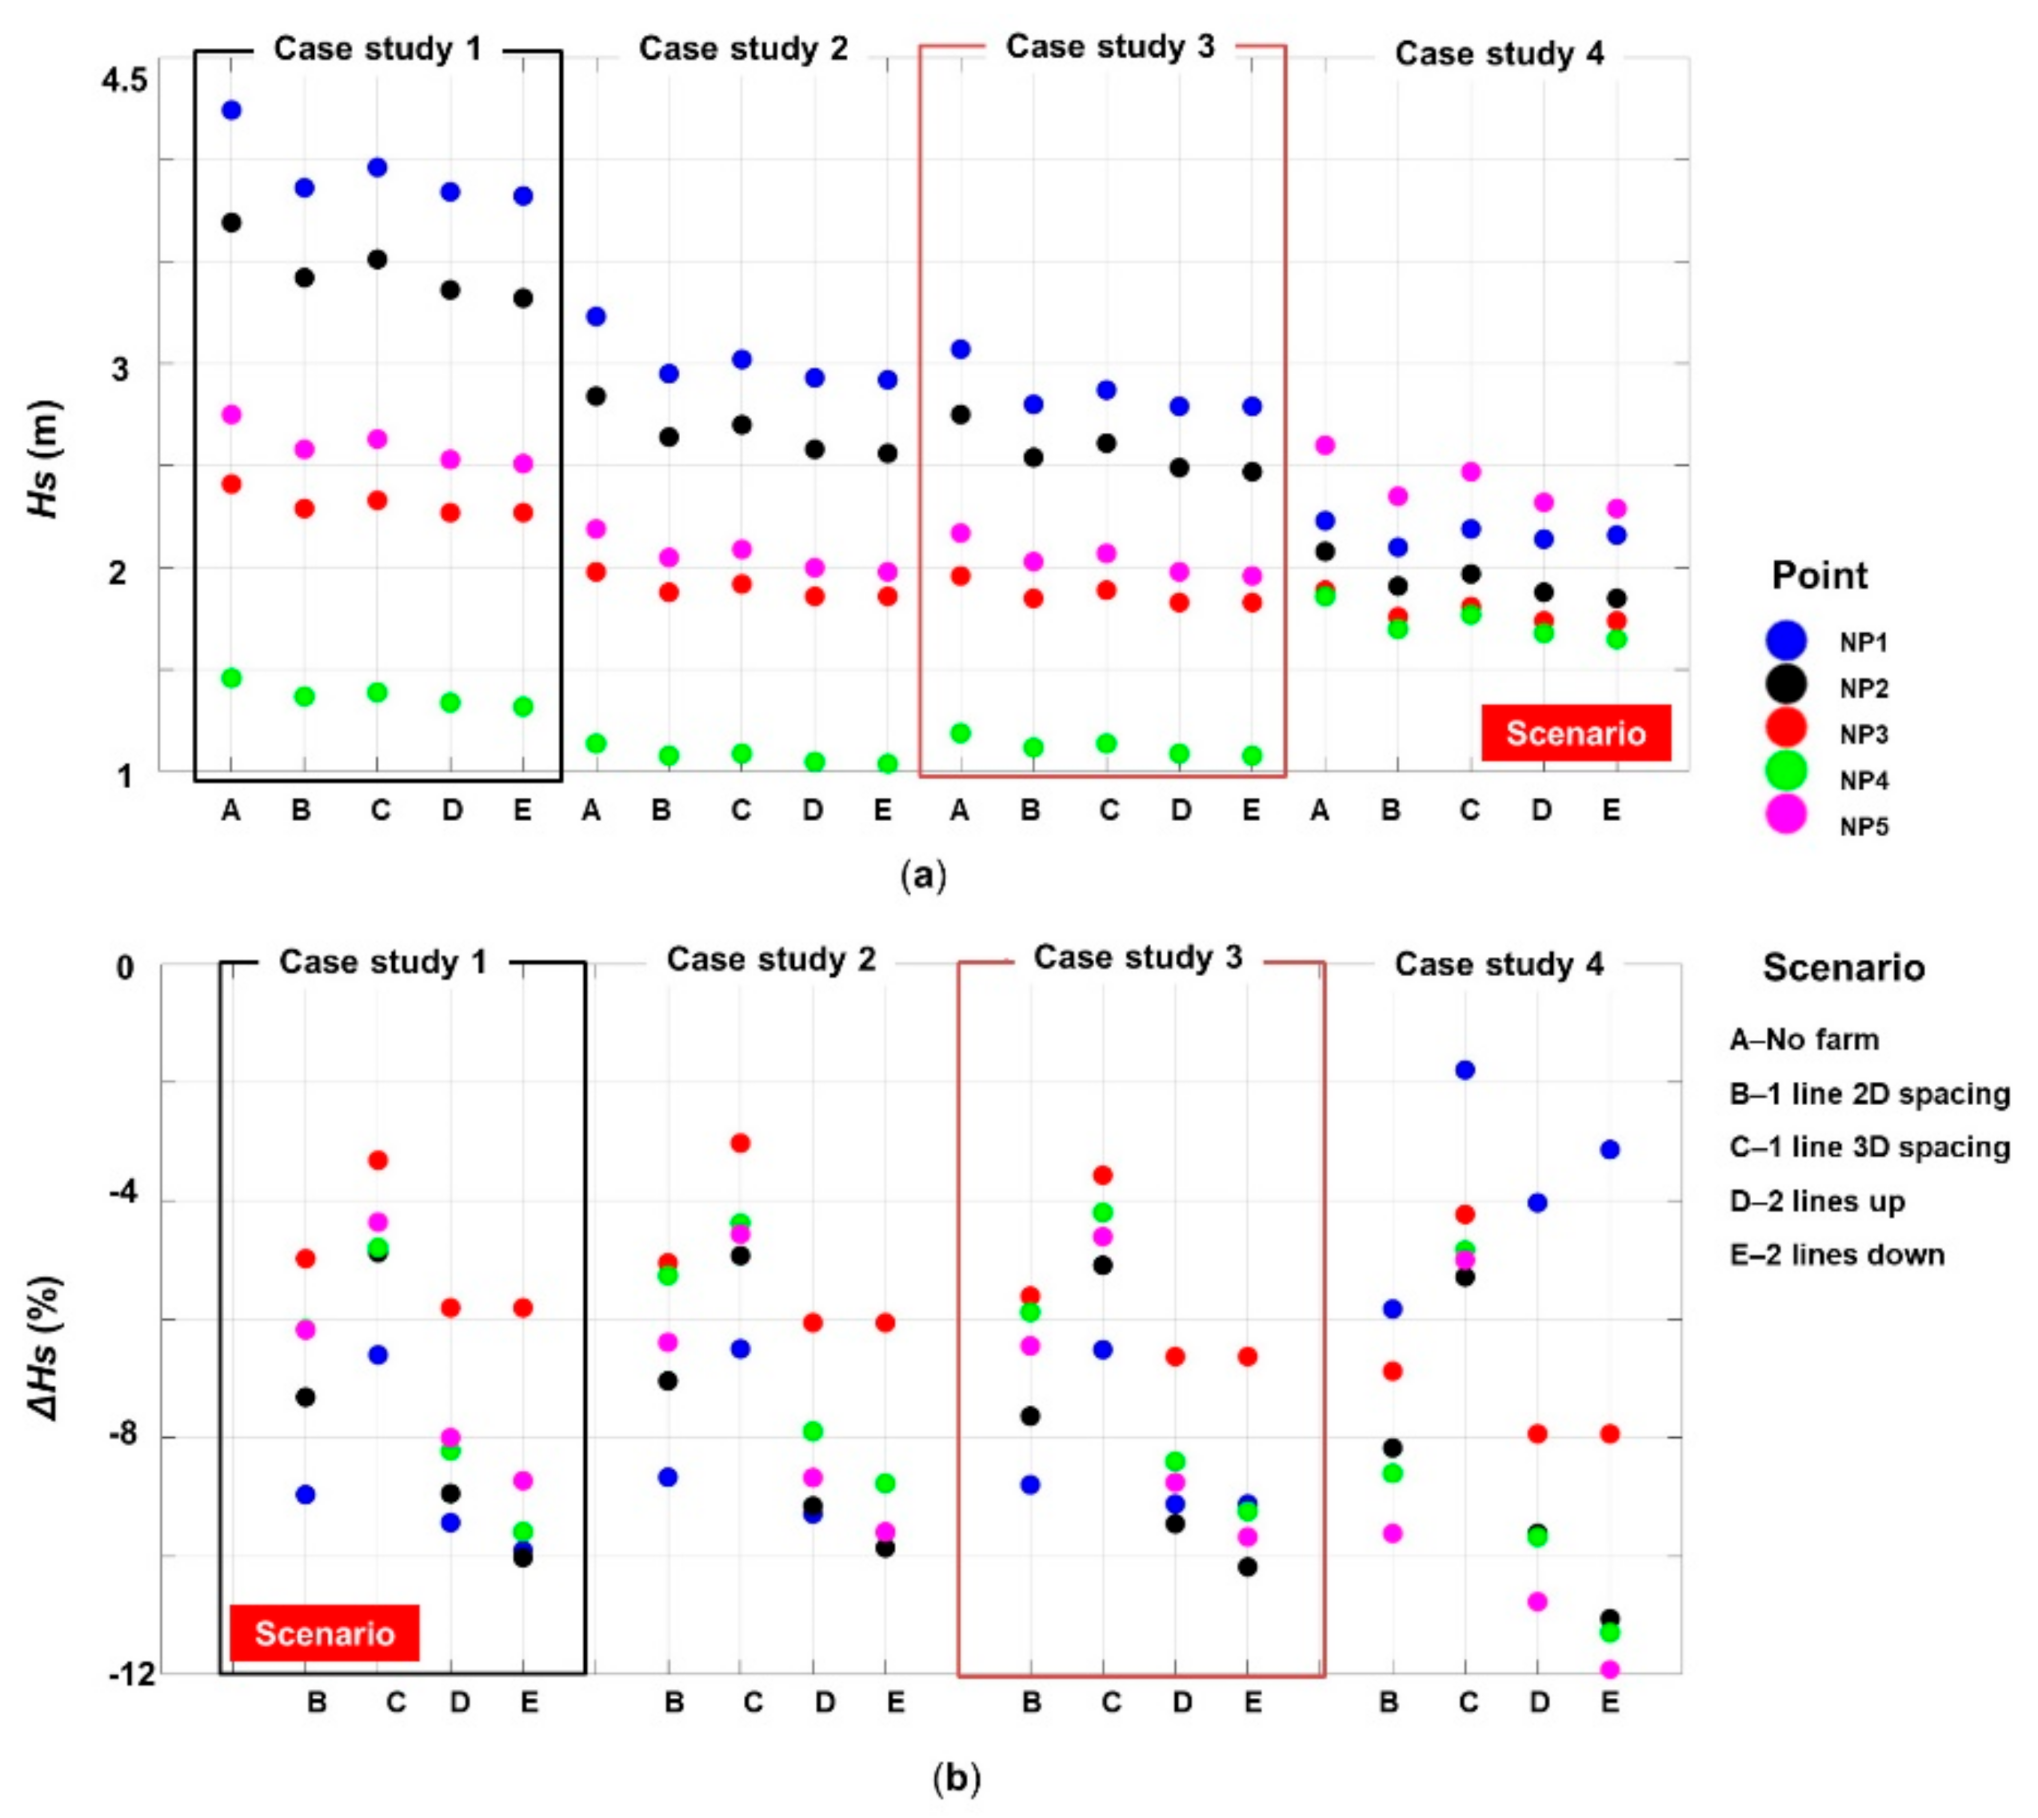
The far field effect is better quantified by the nearshore points, as it can be noticed in Figure 7. The relative differences (in %) reported between the no farm situation (scenario A) and the presence of the wave farms (scenarios B–E), are quantified in Equation (3):
E = (Xfarm − Xno farm)/Xno farm
where Xno farm—situation with no farm; Xfarm—presence of a wave farm.
All the points indicate an attenuation of the waves, with the mention that for a single line layout a 2d spacing is more efficient than a 3d spacing, while for a two-line layout, the two lines-down set up shows slightly better values. The points located on the right side, indicate higher Hs values compared to NP4 where the attenuation can go from 1.46 m to 1.32 m (2 lines-down).
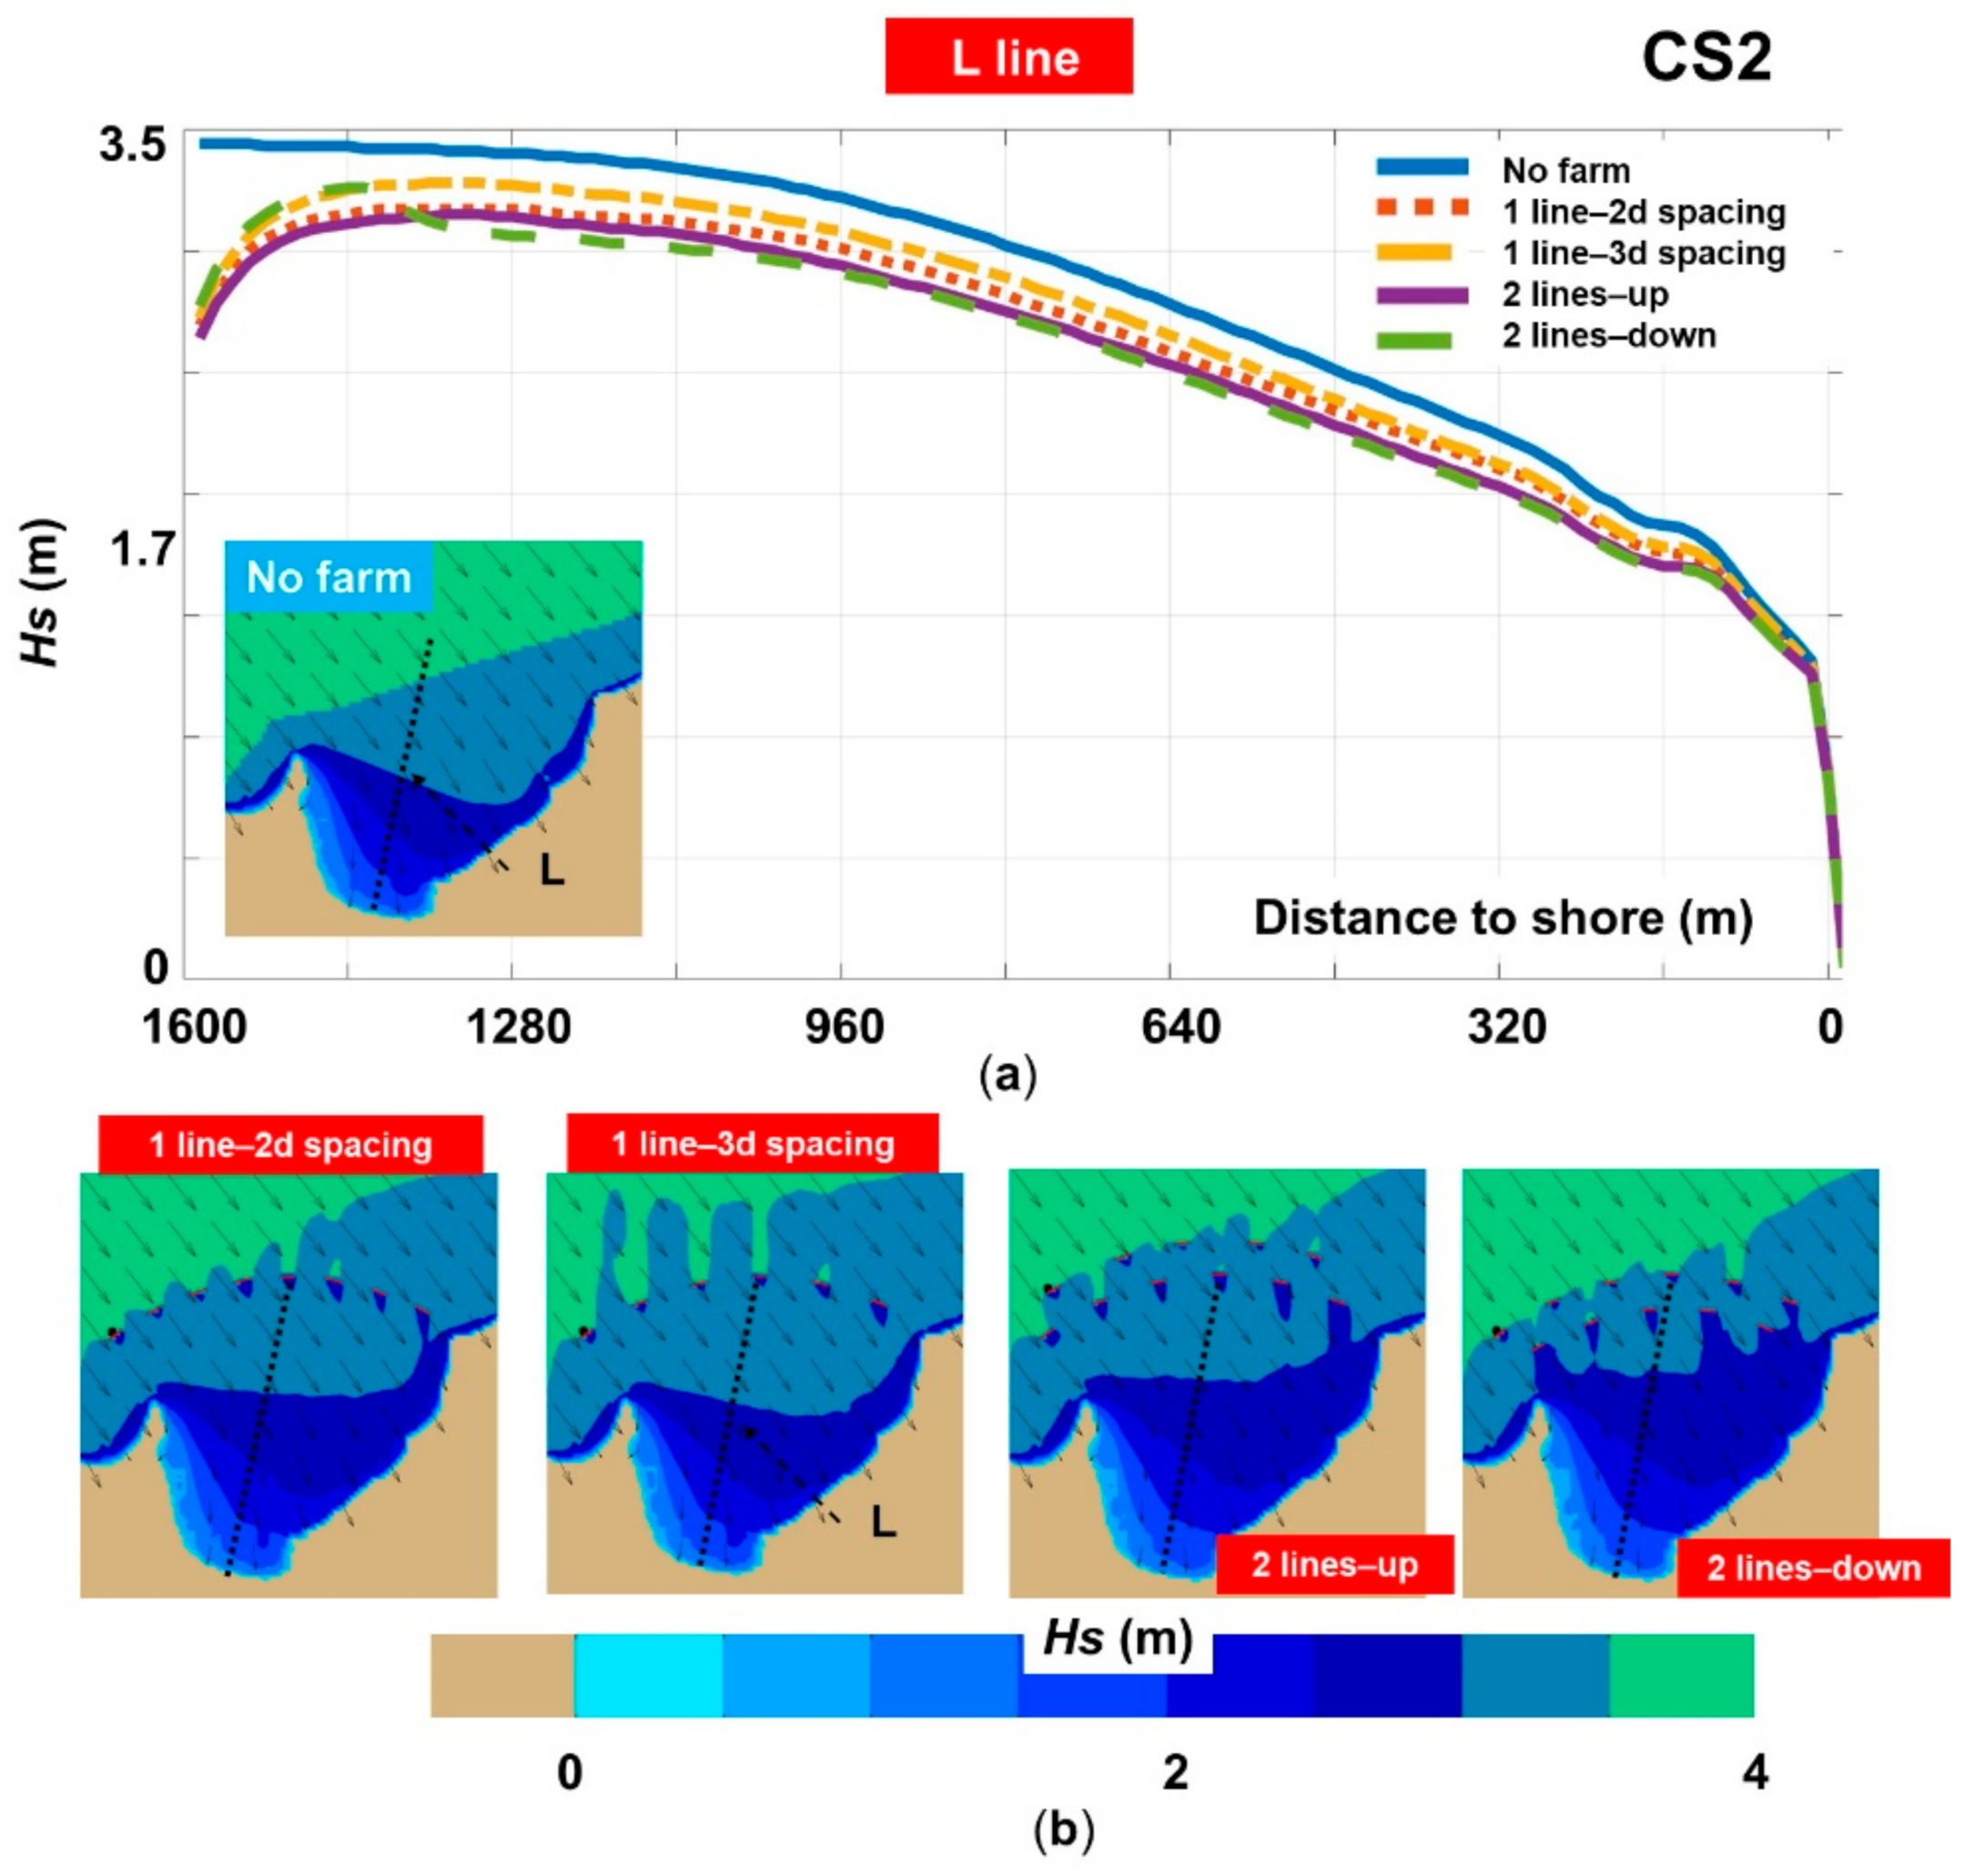
Figure 8 indicates a similar analysis related this time to CS2. The Hs profile shows a similar pattern as in the case of CS1, being noticed a sharp attenuation from 3.44 m to 2.64 m (2 lines-up). According to the spatial maps, in the case of the no farm scenario the waves are already starting to decrease as they enter in Campese Bay, being noticed a rough attenuation of 0.5 m from the area where the two-line farms begin. The presence of the farm seems to modify the characteristics of the incoming waves, this being the case of 1 line-3d spacing, where there are some gaps in the incoming waves. A possible explanation for this interference could be related to the arc shape of this farm and the reflective properties. Compared to the no farm scenario, we can see that for this wave direction there is a significant impact on the nearshore conditions, the wave field of 2.5 m extending further into offshore. As for the nearshore points (Figure 7), the wave attenuation is directly related to the severity of the waves corresponding to each point. For example, in the case of NP1, the Hs values decrease from 3.23 m to 2.92 m, while for NP3 a similar pattern is noticed, but in this case, there is a maximum attenuation of 0.13 m.
In Figure 9 the case study CS3 is presented. Although CS2 and CS3 are relatively similar, we can notice that even a small change of the wave characteristics may lead to different shielding effects induced by the wave farm. In this case, the shadow area is more uniform, covering in most of the cases the entire space between the farm and the shoreline. Locally, an increase of the wave heights (up to 4 m) can be noticed as in the case of 2 lines-up layout, more precisely in front of the first line of devices (from offshore). According to the values presented in Figure 7, Hs is in the ranges [1.19–3.07] m (no farm); [1.12–2.8] m (1 line—2d spacing); [1.14–2.87] m (1 line—3d spacing); [1.09–2.79] m (2 lines—up); and [1.08–2.79] m (2 lines—down).
One of the most unfavourable scenarios for coastal stability is presented in Figure 10 (CS4), not because of the extreme Hs values, but especially because of the direction of the waves that are directly entering in Campese Bay without any restriction. In this case, the position of the farm (ex: a single line) seems to be opportune being located at the edge where the waves are starting to decrease in a natural way (Figure 10a—no farm). More details regarding the nearshore impact are illustrated in Figure 7.

3.2.2. Additional Wave Parameters

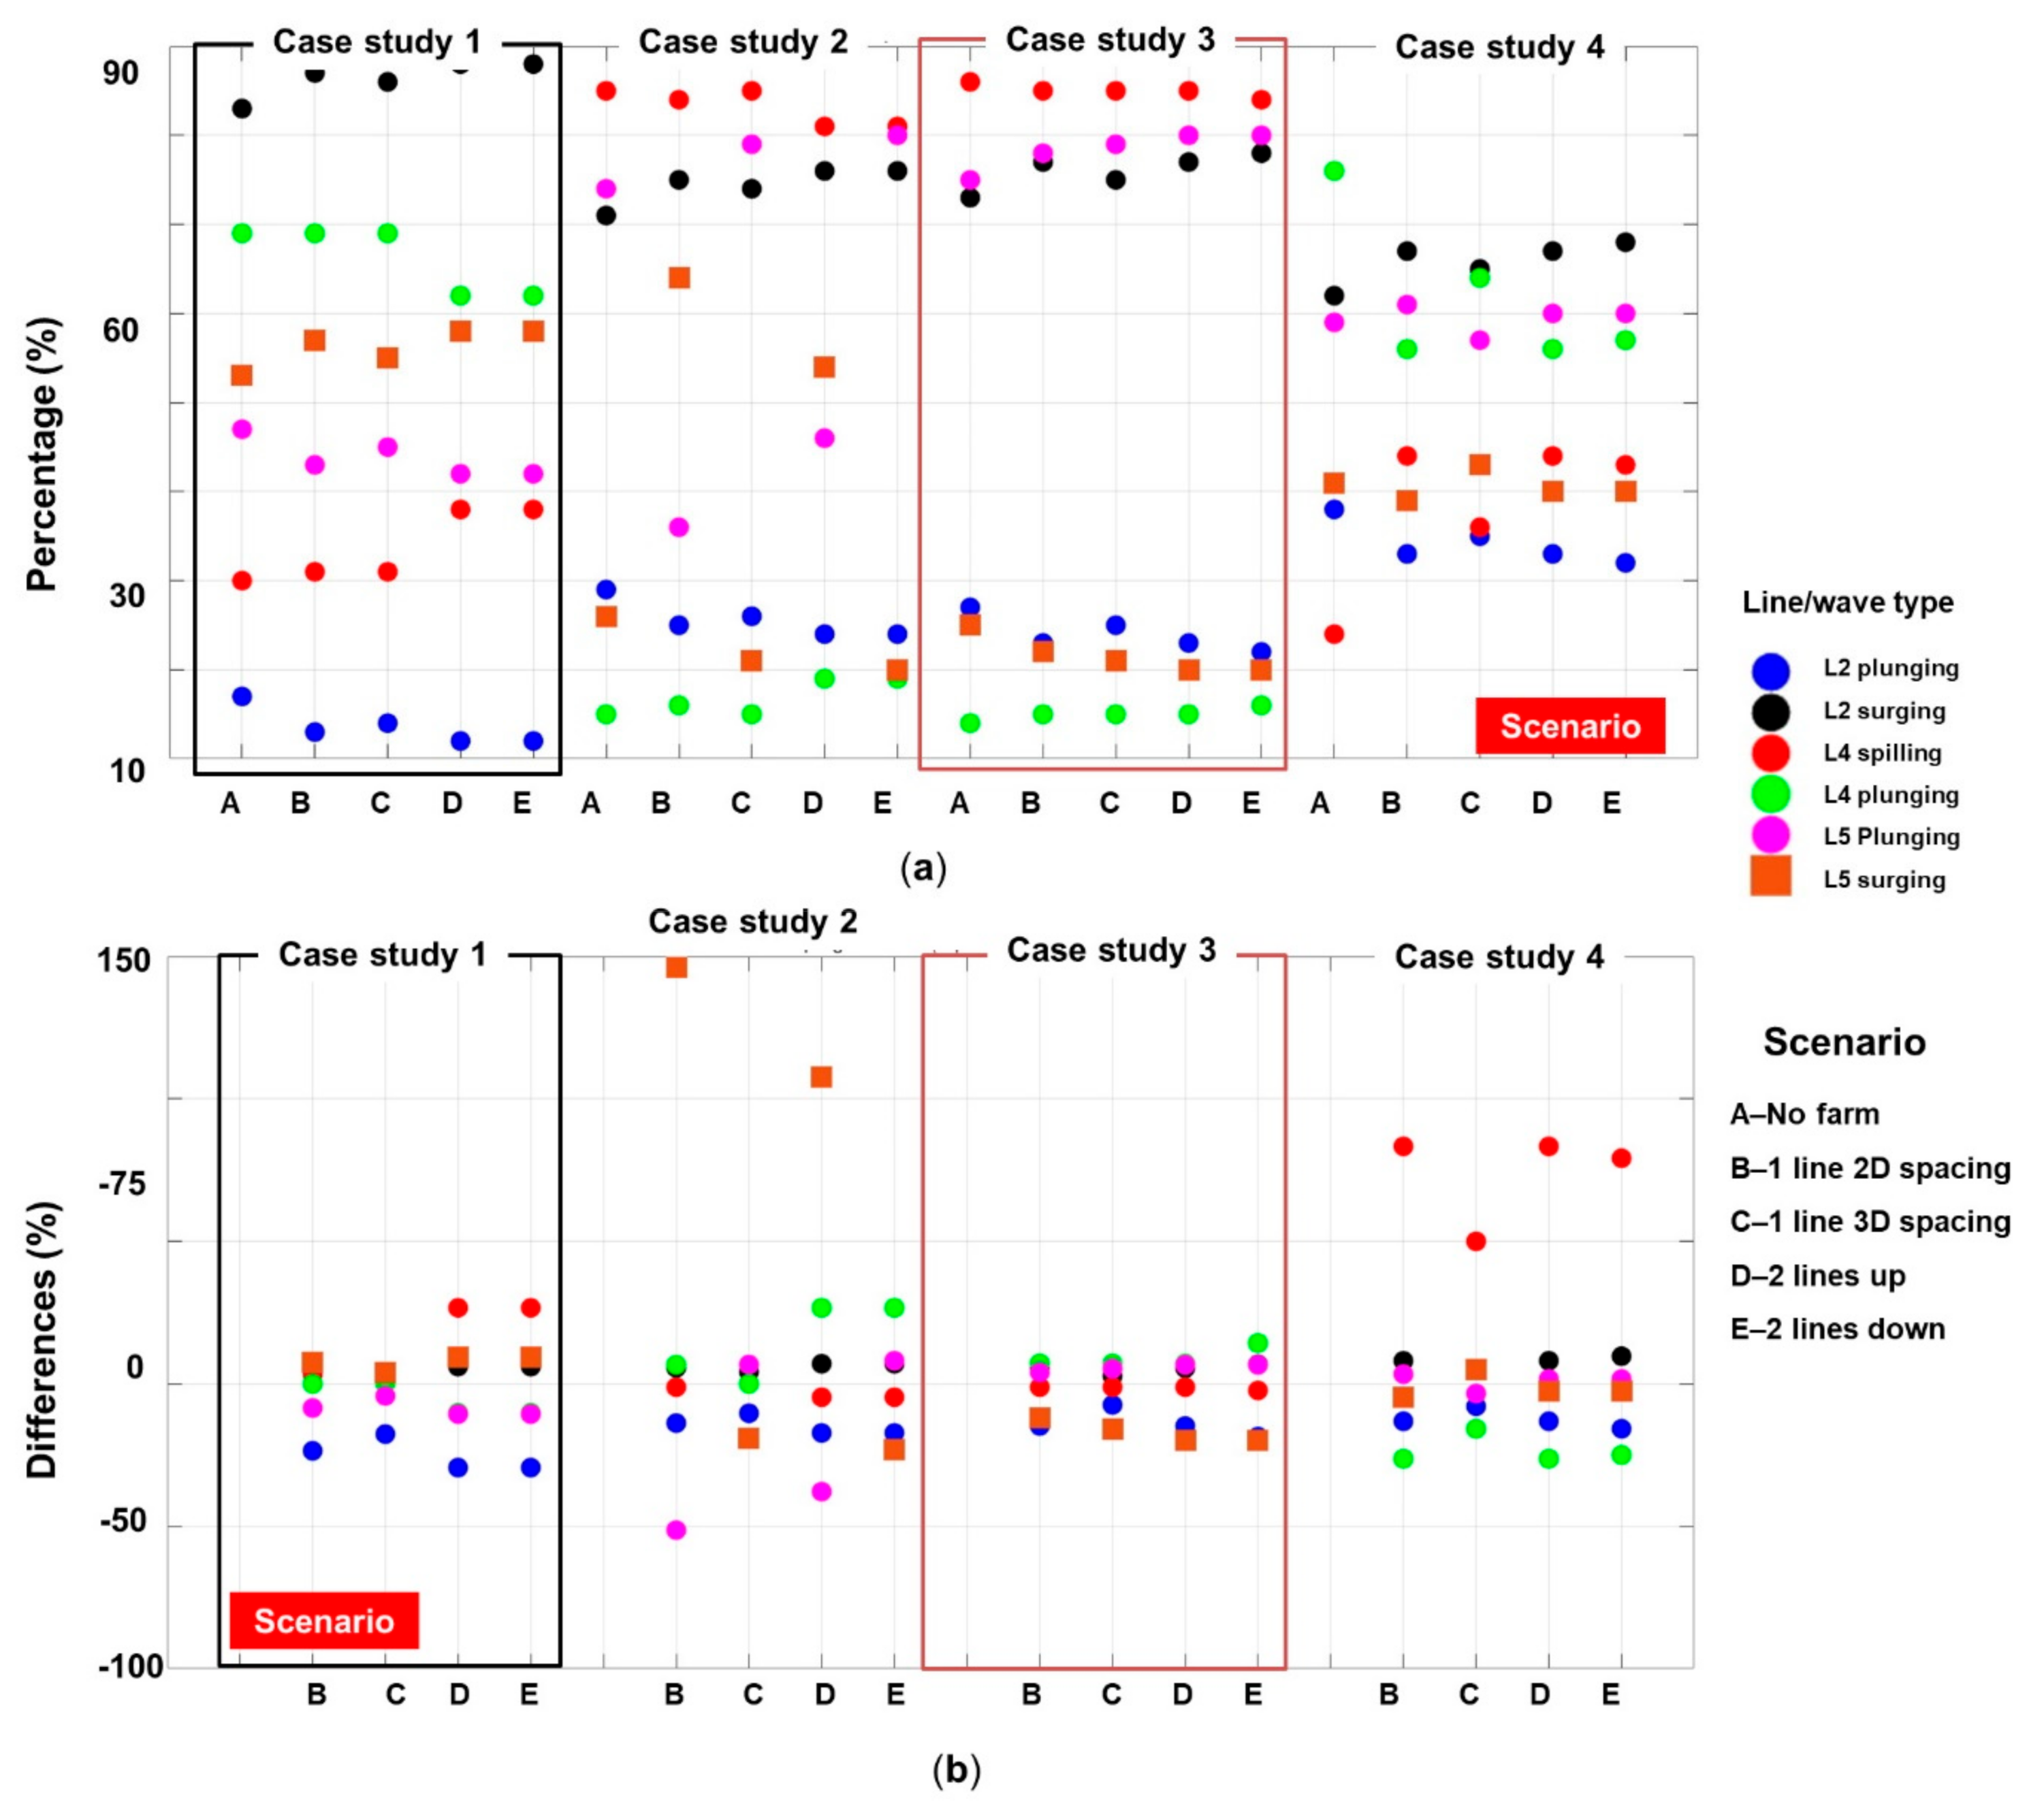
One indicator for the stability of a beach sector is represented by the dominant breaking mechanisms of the waves that for the Giglio Island are divided between spilling, plunging, and surging [46]. It is considered that a spilling wave is the only one capable to bring sediments from the offshore area, and therefore it will be ideal to obtain this type of wave throughout the use of a marine energy farm [47]. In Figure 11 is presented such an evaluation, considering only the nearshore lines L2, L4, and L5. For line L1, the surging waves are dominant (100%), while for line L3 the spilling waves are representative (100%). The spilling waves may also occur near the line L4, being the dominant ones in the cases CS2 and CS3 (>80%), while for CS1 a two-line farm will be more recommended since will increase the spilling waves from 30% to 38%. For CS4, all the farm configurations increase the spilling waves, the lowest value corresponding to 1 line-3d spacing (36%), while the remaining layouts indicate similar values (44%). The line L2, indicates no spilling waves, in this case, the surging waves are dominant (maximum 88%) compared to the plunging waves. Regarding line L5, for CS1 the surging waves are more important (up to 58%), this pattern is shifted in the cases CS2, CS3, CS4, when the plunging waves can go up to 80%.
A more complete picture of the wave transformation can be done by considering some other wave characteristics, such as the orbital velocity at the bottom (Ubot in m/s). In shallow water, the orbital motions of the water particles, induced by surface waves, extend down to the seafloor. This gives rise to an interaction between the surface waves and the bottom. An overview of different wave-bottom interaction mechanisms and of their relative strengths is given by Shemdin et al. [48]. They are scattering on bottom irregularities, the motion of a soft bottom, percolation into a porous bottom, and friction in the turbulent bottom boundary layer. The first process results in a local redistribution of wave energy by scattering of wave components. The last three are dissipative and their strength depends on the bottom conditions. The orbital velocity Ubot is the root-mean-square value (in m/s) of the maxima of the orbital motion near the bottom as computed in the SWAN model [49].
Figure 12 presents the distribution of this parameter only for CS1, the other case studies showing a similar pattern, with the NP3 indicating maximum values. In the absence of any wave farm, the orbital velocity indicates values in the range [0.32–1.78] m/s. The presence of the marine energy farm decreases the value of the parameter Ubot, being noticed a maximum attenuation of 11% for line L1, L2, and L4, while for the L5 these values go down to 9.4%, being followed by L3 with 6.1%.
The wave forces represent another relevant parameter that can be used to assess the impact of the waves on a particular system, such as dams or other coastal structures. Figure 13 presents such an evaluation, including all the case studies considered, from which it can be noticed that for CS2 and CS3 the values are not exceeding 9 N/mm2, compared to CS1, where a maximum value of 25.6 N/mm2 is reported. Another particularity is related to the CS4 situation, where the point NP4 indicates significantly higher values (at least of 16.2 N/mm2) in the condition when the site NP5 indicates a maximum value of 7.6 N/mm2. The presence of the wave farms may significantly reduce the wave forces, as in the case of the point NP3, where a maximum attenuation of 55% is noticed for CS2 and CS3. From all the layouts, the 1 line-3d spacing represents the least attractive solution for the attenuation of the wave forces.
Another objective of the present work is to assess the evolution of the longshore currents in the presence of marine energy farms. In Figure 14 the maximum values of the current velocity along the profile lines (L1–L5) are presented.
In general, the impact of the farm lines is minimal, regardless of the configuration and case study considered. Much higher values are noticed along the lines located on the extremity, where the current velocity can reach maximum values in the range [1.8–2] m/s. Nevertheless, there are situations where the presence of the marine farm is visible, as in the case CS2-L5, where the values can decrease from 1.8 m/s to 0.6 m/s (one line—2d spacing and two lines—up). In some other situations, the attenuation is in the range [0.1–0.2] m/s this being reported for CS1-L4, CS2-L1, or CS4-L2 and L5.
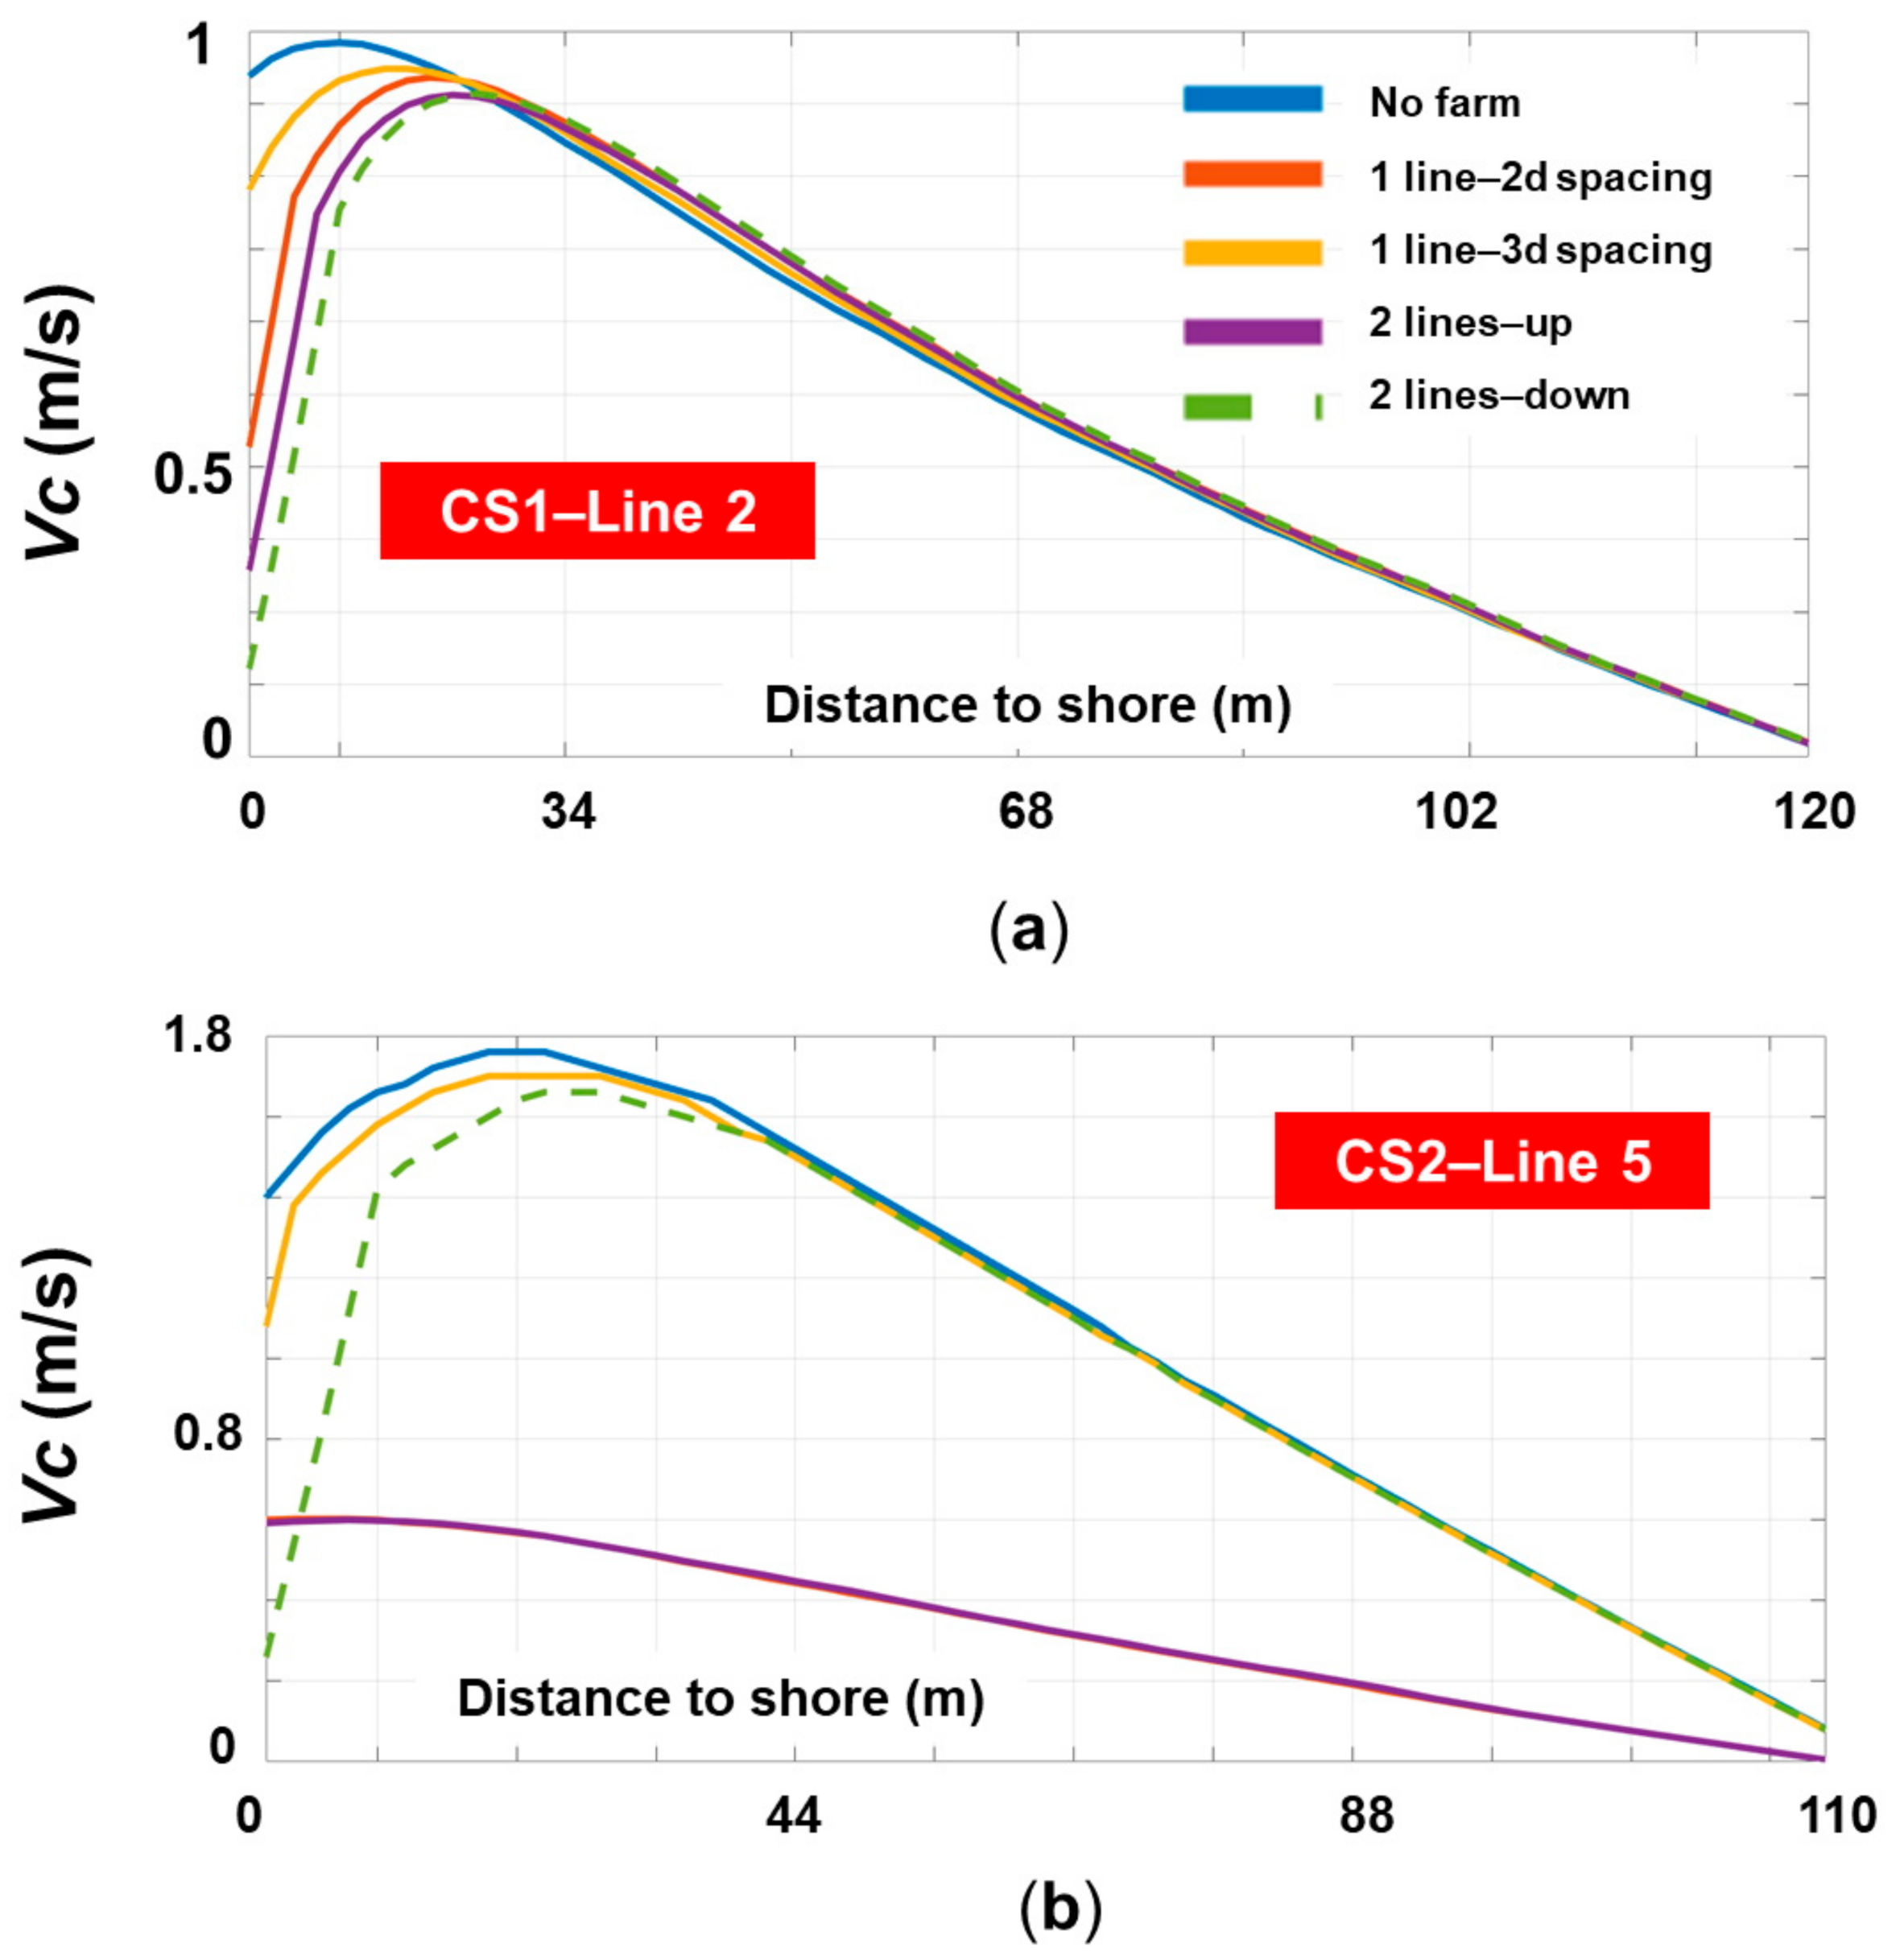
A more complete picture of the longshore currents can be provided from the analysis of the current profiles, as can be noticed from Figure 15. The points from the left side (distance to shore = 0 m) are located offshore. The presence of the marine farms is visible first in the evolution of the currents, CS1-L2 can go from 0.94 m/s (no farm) to 0.43 m/s (1 line-2d spacing) or 0.12 m/s (two lines—down), respectively. After this step, the current velocity is increasing very rapidly, reaching the maximum value, and after that, they gradually decay until they dissipate. In the case CS2-L5, the two lines-up layout indicates a different pattern and significant differences compared to the other scenarios.

4. Discussion

From the comparison of the Hs values related to the two datasets, ERA5 and CCI-SS (satellite), some differences for the Giglio area are noticed. For the results reported between January 1992 and December 2018 (27-years), the average values associated with ERA5 are sensible smaller than the CCI-SS data, while for the extreme events an opposite pattern is noticed. As for the wind conditions, the U100 data provided by ERA5 was selected for assessment, considering that this source of data is frequently used for renewable studies [50]. A direct comparison was not carried out with in situ measurements, and this will be performed in future work.
Regarding the wind conditions, it was found that during the wintertime the average wind speed is in the range [6–7] m/s, which is close to the 7 m/s threshold considered to be ideal for the development of an offshore wind project [51]. However, during the summertime, the wind conditions are lower (ex. 4.5 m/s in August), while the touristic activities reach maximum peaks and there is a higher electricity demand. According to Palone et al. [43] there is a peak of 7.5 GWh during the summertime, while the annual electricity consumption is estimated to be around 10 GWh. This production needs to be covered by diesel generators, including the run of a 500 kW desalination plant, the best prediction being to cover in the near future at least 30% from the electricity production with renewables (ex: photovoltaic). Looking now at the turbine performances presented in this work, we can notice that on an annual scale a single Areva M5000-116 (T2) will cover the entire production. As for the summertime, in order to fully cover this demand, it will be required to install at least: V90-3.0 (13 units); Areva M5000-116 (five units); Senvion 6.2M126 (four units); V164-8.8 MW and V164-9.5MW (three units). In this selection it is important to consider also the financial aspects, taking into account that around 1500 people live permanently on Giglio Island.
Looking at the position of Giglio Island and at the dominant wave direction (south-west) we notice that Campese Bay is naturally protected against most of the storm events. Nevertheless, by filtering the time series associated to ERA 5, some extreme events were identified during the wintertime, when the waves can directly enter in the target area of the present study. Taking this info into account, the aim of the work is to establish how a marine energy farm can influence the nearshore processes induced by some sea states. The marine farm was assembled from WaveCat devices and floating wind turbines, and based on the physical modelling it was indicated that the transmission coefficient of this system is close to 0.76 [39]. This can be considered a realistic scenario, in the conditions where there are studies suggesting that even higher absorption values could be obtained [20,26]. Four case studies were identified (C1 to C4), corresponding to different time frames, each being related to a different sea state. As expected, the two-line configuration reports slightly better results, while for the single line configuration an inter-device spacing of 3 lengths indicates a smaller coastal impact. In general, the Hs values can be reduced by a maximum of 11%, being significantly influenced by the direction of the incoming waves. Although this can be very small, it is important to mention that even a small attenuation of the wave height can reduce sediment transport. For example, in Raileanu et al. [26] it was found that for oblique waves, the transport rate of the sediments can be reduced in the range [1.8–74.4]%, according to the sea state considered for evaluation.
Spilling waves are beneficial for a beach sector since they bring in sediments from the offshore area. It was noticed that the presence of the wave farm may increase the occurrence of the spilling waves, this being the case of the line L4 (up to 44%—CS4). The area located between lines L3 and L4 seems to be suitable for spilling waves, while the other regions from Campese Bay may be more vulnerable to erosion processes.
At this point, it can be mentioned that for scenario CS2 the wave conditions seem to be more sensitive to the presence of the wave farm, especially in the case of the area close to the line L5 (left side of the target area). For this scenario, all the Hs values are reduced by the WEC lines, from 1.14 m to almost 1.04 m, with very small differences being noticed between the wave farms considered. Nevertheless, if we consider the breaking of the waves, the balance between plunging and surging waves is changing very fast. Thus, the plunging waves are dominant in the case of scenarios A, C, and E indicating percentage values in the range of 74–80%. On the other hand, for the surging waves, a maximum value of 64% corresponds to scenario B. By comparing these values with those from scenario CS3 (that is very similar to CS2), the results look counterintuitive since, in this case, the dominant breaking waves are plunging. It can be noticed that the presence of the wave farms seems to be favourable for the occurrence of these waves since increases the percentage from 75% (no farm) to 80% (double line configurations). A possible explanation for this variation (Case 2—line 5) may be found in the evolution of the longshore currents (Figure 14) that also indicates a similar pattern, with the scenarios A, C, and E with higher values (~1.7 m/s) while on the opposite side are the scenarios B and D (~0.6 m/s).
At this point it has to be also highlighted that the hybrid approach considered herewith represents, in general, a more efficient use of the marine space, by harnessing in the same area wind and waves resources, increasing the power production by occupied square meters. In this particular case of Campese Bay, as in many other coastal environments characterized by mild wave energy resources, the main reason for including the wind turbines was the low energy capture of the wave device. However, if there is a mismatch between the seasonal load and the wind turbine generation then its increased energy capture is wasted. A small wind turbine array can have a highly variable output which is difficult for a small grid powered by diesels to accommodate, so the modest, but less variable, output from a wave farm may be more compatible and more beneficial on a year-round basis. In addition, it may meet the local needs better in the off-peak season on the island, as well as help in paying the cost of installing the wave farm over the long run. Furthermore, a very promising solution considered now in optimizing marine renewable energy extraction is to solve the problem of grid connection through a power-to-X approach. This uses the offshore electricity obtained in the electrolysis process to produce hydrogen, which will act as an energy vector. Hydrogen storage represents a viable response to the energy demand with large amounts of energy being stored during long periods, providing in this way a better management of the energy produced.

5. Conclusions

The development of the renewable systems designed for the marine areas brings into discussion the possible implications for the sustainable development of a particular environment, such as the Giglio Island, which is a well-known touristic destination in the Mediterranean Sea. More than this, it was demonstrated that even the enclosed seas defined by milder wave resources can provide suitable conditions for the development of a renewable project [22]. The first step in this direction is related to the assessment of the environmental conditions, and due to the latest research in this field, it is possible to have a broader view, by using both data from satellite measurements and numerical simulations.
By looking at the original research questions, the following conclusions can be drawn:
(a)
The ERA 5 dataset indicates for the Giglio site higher extreme values than those provided by altimeter data. The accuracy of the satellite measurements in predicting the wave heights close to the shoreline area can be put into discussion, taking into account the interference problems that may occur near the land-water interface. From the analysis of the wave conditions, it was found that the target area is naturally protected by a peninsula, but there are also certain situations when the storm conditions may enter in the target area without any restriction. As for the wind conditions, a small offshore wind farm can cover a large percentage of the Giglio’s electricity demand during the touristic season.
(b)
The proposed wave farm made up of WaveCat systems, may reduce the wave heights close to the shore by almost 12%, a more significant effect being noticed for the two-line configuration. From the analysis of the spatial maps, it is difficult to quantify the far field effect, a short attenuation of the waves close to the WEC line followed by a quick regeneration of the wave fields being observed. It is also important to mention that the type of the breaking waves can significantly change, being possible to increase the percentage of the spilling waves (ex. Case 4—Line 4) that can carry sediments from the offshore area.
(c)
The impact of the wave farms on the longshore currents is minimal, being noticed however various patterns, such as the increase of the currents (up to 20%) or attenuation (up to 70%).
We need to mention also that a complete picture of the implications related to a marine energy farm is difficult to provide, but from the results presented in this work, it appears that a wave farm coupled with some offshore wind turbines, could be a win-win solution for Giglio Island, as well as for many others island environments.
From this perspective, it can be concluded that the proposed approach would provide significant shoreline protection in the area targeted, which is Campese Bay in Giglio Island. At the same time, the main reason for considering such a hybrid marine energy farm and evaluating its economic efficiency under the local wind conditions is to show that although the average wave power is not high in this coastal environment, such a hybrid marine energy farm can be also effective from an economic point of view. This is especially due to the wind turbines while the wave energy converters will only complete the energy production, but on the other hand, will have a beneficial influence on the shoreline dynamics. Furthermore, it can be also underlined that as regards the coastal protection and the near and far field effects of various marine farm configurations, the results can be considered of interest for many similar coastal environments.

Author Contributions

L.R. contribute to the interpretation of the results and assembled the manuscript. F.O. performed the literature review, processed the datasets and case studies. E.R. designed and supervised the present work. All authors have read and agreed to the published version of the manuscript.

Funding

This research was funded by the European Space Agency, Climate Change Initiative (CCI) for Sea State project, ESA grant number 4000123651/18/I-NB.

Institutional Review Board Statement

Not applicable.

Informed Consent Statement

Not applicable.

Acknowledgments

The data used in this study are openly available. ERA5 data used in this study were obtained from the ECMWF data server. CCI Sea State data are available for download from https://climate.esa.int/en/projects/sea-state/data/ (accessed on 14 January 2021).

Conflicts of Interest

The authors declare no conflict of interest.

Nomenclature

σRelative frequency
θWave direction
U Velocity of the ambient current
AEPAnnual Electricity Production
CAPEXCapital expenditures
CCI-SSEuropean Space Agency Climate Change Initiative for Sea State
DirWave direction
f(u)Probability distribution of the wind speed
HsSignificant wave height
ISSMInterface for SWAN and Surf Models
NAction density spectrum
P(u)Power curve of a turbine
SSink and source terms
SWANSimulating Waves Nearshore
TNumber of hours per year
TmWave period
U100Wind speed reported at 80 m above sea level
UTCUniversal Time Coordinated
UbotOrbital velocity at the bottom
VcmaxLongshore currents maximum velocity
WECsWave Energy Converters
WTWind turbines
T1Vestas 90-3.0MW
T2Areva M5000-116
T3Senvion 6.2M126
T4Vestas 164-8.8 MW
T5Vestas 164-9.5 MW
CSCase studies considered
CS1, CS2, CS3, CS4
Marine farm configurations
Scenario ANo farm
Scenario B1 line—2d spacing
Scenario C1 line—3d spacing
Scenario D2 lines—up (the second line is up in relationship with the 1 line case)
Scenario E2 lines—down (the second line is down in relationship with the 1 line case)
Reference lines (L) defined in the nearshore
L1, L2, L3, L4, L5
Nearshore points (NP)NP1, NP2, NP3, NP4, NP5, reference points defined in the offshore extremity of the reference lines

References

  1. Bernardino, M.; Rusu, L.; Soares, C.G. Evaluation of the wave energy resources in the cape verde islands. Renew. Energy 2017, 101, 316–326. [Google Scholar] [CrossRef]
  2. Mattiazzo, G. State of the art and perspectives of wave energy in the mediterranean sea: Backstage of ISWEC. Front. Energy Res. 2019, 7, 114. [Google Scholar] [CrossRef] [Green Version]
  3. Vannucchi, V.; Cappietti, L. Wave energy assessment and performance estimation of state of the art wave energy converters in italian hotspots. Sustainability 2016, 8, 1300. [Google Scholar] [CrossRef] [Green Version]
  4. Rusu, E.; Onea, F. An assessment of the wind and wave power potential in the island environment. Energy 2019, 175, 830–846. [Google Scholar] [CrossRef]
  5. Lavidas, G.; Venugopal, V. A 35 year high-resolution wave atlas for nearshore energy production and economics at the aegean sea. Renew. Energy 2017, 103, 401–417. [Google Scholar] [CrossRef] [Green Version]
  6. Ferrari, F.; Besio, G.; Cassola, F.; Mazzino, A. Optimized wind and wave energy resource assessment and offshore exploitability in the mediterranean sea. Energy 2020, 190, 116447. [Google Scholar] [CrossRef]
  7. Rangel-Buitrago, N.; Williams, A.T.; Anfuso, G. Hard protection structures as a principal coastal erosion management strategy along the caribbean coast of colombia. A chronicle of pitfalls. Ocean Coast. Manag. 2018, 156, 58–75. [Google Scholar] [CrossRef]
  8. Andre, C.; Boulet, D.; Rey-Valette, H.; Rulleau, B. Protection by hard defence structures or relocation of assets exposed to coastal risks: Contributions and drawbacks of cost-benefit analysis for long-term adaptation choices to climate change. Ocean Coast. Manag. 2016, 134, 173–182. [Google Scholar] [CrossRef]
  9. Veron, S.; Mouchet, M.; Govaerts, R.; Haevermans, T.; Pellens, R. Vulnerability to climate change of islands worldwide and its impact on the tree of life. Sci. Rep. 2019, 9, 14471. [Google Scholar] [CrossRef] [PubMed] [Green Version]
  10. State and Pressures of the Marine and Coastal Mediterranean Environment|Semantic Scholar. Available online: https://www.semanticscholar.org/paper/State-and-pressures-of-the-marine-and-coastal-Map/5cde8bbfa6ce871e82f450a3135231ccbaaf604a (accessed on 14 January 2021).
  11. Erosion of the Mediterranean Coastline: Implications for Tourism. Available online: https://assembly.coe.int/nw/xml/XRef/X2H-Xref-ViewHTML.asp?FileID=10340&lang=EN (accessed on 14 January 2021).
  12. Barcelona Convention-Marine-Environment-European Commission. Available online: https://ec.europa.eu/environment/marine/international-cooperation/regional-sea-conventions/barcelona-convention/index_en.htm (accessed on 14 January 2021).
  13. Onea, F.; Rusu, E. Sustainability of the reanalysis databases in predicting the wind and wave power along the european coasts. Sustainability 2018, 10, 193. [Google Scholar] [CrossRef] [Green Version]
  14. Rusu, E.; Onea, F. Joint evaluation of the wave and offshore wind energy resources in the developing countries. Energies 2017, 10, 1866. [Google Scholar] [CrossRef] [Green Version]
  15. Clemente, D.; Rosa-Santos, P.; Taveira-Pinto, F. On the potential synergies and applications of wave energy converters: A review. Renew. Sustain. Energy Rev. 2021, 135, 110162. [Google Scholar] [CrossRef]
  16. Bergillos, R.J.; Lopez-Ruiz, A.; Medina-Lopez, E.; Monino, A.; Ortega-Sanchez, M. The role of wave energy converter farms on coastal protection in eroding deltas, guadalfeo, southern spain. J. Clean. Prod. 2018, 171, 356–367. [Google Scholar] [CrossRef]
  17. Abanades, J.; Flor-Blanco, G.; Flor, G.; Iglesias, G. Dual wave farms for energy production and coastal protection. Ocean Coast. Manag. 2018, 160, 18–29. [Google Scholar] [CrossRef] [Green Version]
  18. Rusu, E.; Onea, F. Study on the influence of the distance to shore for a wave energy farm operating in the central part of the portuguese nearshore. Energy Conv. Manag. 2016, 114, 209–223. [Google Scholar] [CrossRef]
  19. Onea, F.; Rusu, E. The expected efficiency and coastal impact of a hybrid energy farm operating in the portuguese nearshore. Energy 2016, 97, 411–423. [Google Scholar] [CrossRef]
  20. Zanopol, A.T.; Onea, F.; Rusu, E. Coastal impact assessment of a generic wave farm operating in the romanian nearshore. Energy 2014, 72, 652–670. [Google Scholar] [CrossRef]
  21. Fairley, I.; Lewis, M.; Robertson, B.; Hemer, M.; Masters, I.; Horrillo-Caraballo, J.; Karunarathna, H.; Reeve, D. Global wave resource classification and application to marine energy deployments. In Proceedings of the EGU General Assembly Conference Abstracts, Online Conference. 4–8 May 2020. [Google Scholar]
  22. Lavidas, G.; Blok, K. Shifting wave energy perceptions: The case for Wave Energy Converter (WEC) feasibility at milder resources. Renew. Energy 2021, 170, 1143–1155. [Google Scholar] [CrossRef]
  23. Bergillos, R.J.; Rodriguez-Delgado, C.; Allen, J.; Iglesias, G. Wave energy converter configuration in dual wave farms. Ocean Eng. 2019, 178, 204–214. [Google Scholar] [CrossRef]
  24. Rodriguez-Delgado, C.; Bergillos, R.J.; Iglesias, G. dual wave farms and coastline dynamics: The role of inter-device spacing. Sci. Total Environ. 2019, 646, 1241–1252. [Google Scholar] [CrossRef] [PubMed]
  25. Mendoza, E.; Silva, R.; Zanuttigh, B.; Angelelli, E.; Andersen, T.L.; Martinelli, L.; Norgaard, J.Q.H.; Ruol, P. Beach response to wave energy converter farms acting as coastal defence. Coast. Eng. 2014, 87, 97–111. [Google Scholar] [CrossRef]
  26. Raileanu, A.; Onea, F.; Rusu, E. An overview of the expected shoreline impact of the marine energy farms operating in different coastal environments. J. Mar. Sci. Eng. 2020, 8, 228. [Google Scholar] [CrossRef] [Green Version]
  27. Onea, F.; Rusu, L. Coastal Impact of a Hybrid Marine Farm Operating Close to the Sardinia Island; IEEE: New York, NY, USA, 2015; ISBN 978-1-4799-8737-5. [Google Scholar]
  28. Piazzi, L.; Cecchi, E.; Gennaro, P.; Penna, M.; Trabucco, B.; Ceccherelli, G. Spread of non-indigenous macroalgae and disturbance: Impact assessment of the costa concordia shipwreck (Giglio island, Italy) using the ALEX index. Ocean Coast. Manag. 2020, 183, 104999. [Google Scholar] [CrossRef]
  29. Cutroneo, L.; Ferretti, G.; Scafidi, D.; Ardizzone, G.D.; Vagge, G.; Capello, M. Current observations from a looking down vertical V-ADCP: Interaction with winds and tide? The case of Giglio island (Tyrrhenian sea, Italy). Oceanologia 2017, 59, 139–152. [Google Scholar] [CrossRef]
  30. Rusu, E.; Conley, D.; Ferreira-Coelho, E. A hybrid framework for predicting waves and longshore currents. J. Mar. Syst. 2008, 69, 59–73. [Google Scholar] [CrossRef]
  31. Rusu, E.; Macuta, S. Numerical modelling of longshore currents in marine environment. Environ. Eng. Manag. J. 2009, 8, 147–151. [Google Scholar] [CrossRef]
  32. Booij, N.; Ris, R.C.; Holthuijsen, L.H. A third-generation wave model for coastal regions: 1. model description and validation. J. Geophys. Res. 1999, 104, 7649–7666. [Google Scholar] [CrossRef] [Green Version]
  33. Mettlach, T.R.; Earle, M.D.; Hsu, Y.L. Software Design Document for the Navy Standard Surf Model Version 3.2; Defense Technical Information Center: Fort Belvoir, VA, USA, 2002. [Google Scholar]
  34. Smith, H.C.M.; Pearce, C.; Millar, D.L. Further analysis of change in nearshore wave climate due to an offshore wave farm: An enhanced case study for the wave hub site. Renew. Energy 2012, 40, 51–64. [Google Scholar] [CrossRef]
  35. O’Dea, A.; Haller, M.C.; Özkan-Haller, H.T. The impact of wave energy converter arrays on wave-induced forcing in the surf zone. Ocean Eng. 2018, 161, 322–336. [Google Scholar] [CrossRef]
  36. Rusu, E. A matlab toolbox associated with modeling coastal waves. Curr. Dev. Oceanogr. 2011, 2, 17–52. [Google Scholar]
  37. Goda, Y.; Takeda, H.; Moriya, Y. Laboratory Investigation of Wave Transmission over Breakwaters; 13 (from Seelig, 1979); Port and Harbour Technical Research Institute: Yokosuka, Japan, 1967. [Google Scholar]
  38. Bergillos, R.J.; Rodriguez-Delgado, C.; Iglesias, G. Wave farm impacts on coastal flooding under sea-level rise: A case study in southern spain. Sci. Total Environ. 2019, 653, 1522–1531. [Google Scholar] [CrossRef]
  39. Carballo, R.; Iglesias, G. Wave farm impact based on realistic Wave-WEC interaction. Energy 2013, 51, 216–229. [Google Scholar] [CrossRef]
  40. Hersbach, H.; Bell, B.; Berrisford, P.; Hirahara, S.; Horányi, A.; Muñoz-Sabater, J.; Nicolas, J.; Peubey, C.; Radu, R.; Schepers, D.; et al. The ERA5 global reanalysis. Q. J. R. Meteorol. Soc. 2020. [Google Scholar] [CrossRef]
  41. Dodet, G.; Piolle, J.-F.; Quilfen, Y.; Abdalla, S.; Accensi, M.; Ardhuin, F.; Ash, E.; Bidlot, J.-R.; Gommenginger, C.; Marechal, G.; et al. The sea state CCI dataset v1: Towards a sea state climate data record based on satellite observations. Earth Syst. Sci. Data 2020, 12, 1929–1951. [Google Scholar] [CrossRef]
  42. Rusu, L.; Rusu, E. Evaluation of the worldwide wave energy distribution based on ERA5 data and altimeter measurements. Energies 2021, 14, 394. [Google Scholar] [CrossRef]
  43. Palone, F.; Portoghese, P.; Buono, L.; Necci, A.; Gatta, F.M.; Geri, A.; Lauria, S.; Maccioni, M. Replacing diesel generators with hybrid renewable power plants: Giglio smart island project. In Proceedings of the 2017 IEEE International Conference on Environment and Electrical Engineering and 2017 IEEE Industrial and Commercial Power Systems Europe (EEEIC/I CPS Europe), Milan, Italy, 6–9 June 2017; pp. 1–6. [Google Scholar]
  44. Onea, F.; Rusu, L. Evaluation of some state-of-the-art wind technologies in the nearshore of the black sea. Energies 2018, 11, 2452. [Google Scholar] [CrossRef] [Green Version]
  45. Manwell, J.F.; McGowan, J.G.; Rogers, A.L. Wind Energy Explained: Theory, Design and Application; John Wiley and Sons: Hoboken, NJ, USA, 2010. [Google Scholar]
  46. CERC. Shore Protection Manual; Coastal Engineer Research Center, U.S. Army Corps of Engineers, U.S. Government Printing Office: Vicksburg, MS, USA, 1984.
  47. Onea, F.; Rusu, E. The expected shoreline effect of a marine energy farm operating close to sardinia island. Water 2019, 11, 2303. [Google Scholar] [CrossRef] [Green Version]
  48. Shemdin, P.; Hasselmann, K.; Hsiao, V.; Herterich, K. Non-linear and linear bottom interaction effects in shallow water. In Turbulent Fluxes through the Sea Surface, Wave Dynamics and Prediction; Springer: Boston, MA, USA, 1978; pp. 347–372. [Google Scholar]
  49. The SWAN Team. SWAN User Manual, SWAN Cycle III Version 41.31A; Delft University of Technology: Delft, The Netherlands, 2020. [Google Scholar]
  50. Ulazia, A.; Sáenz, J.; Ibarra-Berastegi, G.; González-Rojí, S.J.; Carreno-Madinabeitia, S. Global estimations of wind energy potential considering seasonal air density changes. Energy 2019, 187, 115938. [Google Scholar] [CrossRef]
  51. Assessment of Offshore Wind Energy Resources for the United States. Available online: https://www.energy.gov/eere/wind/downloads/assessment-offshore-wind-energy-resources-united-states (accessed on 15 February 2021).
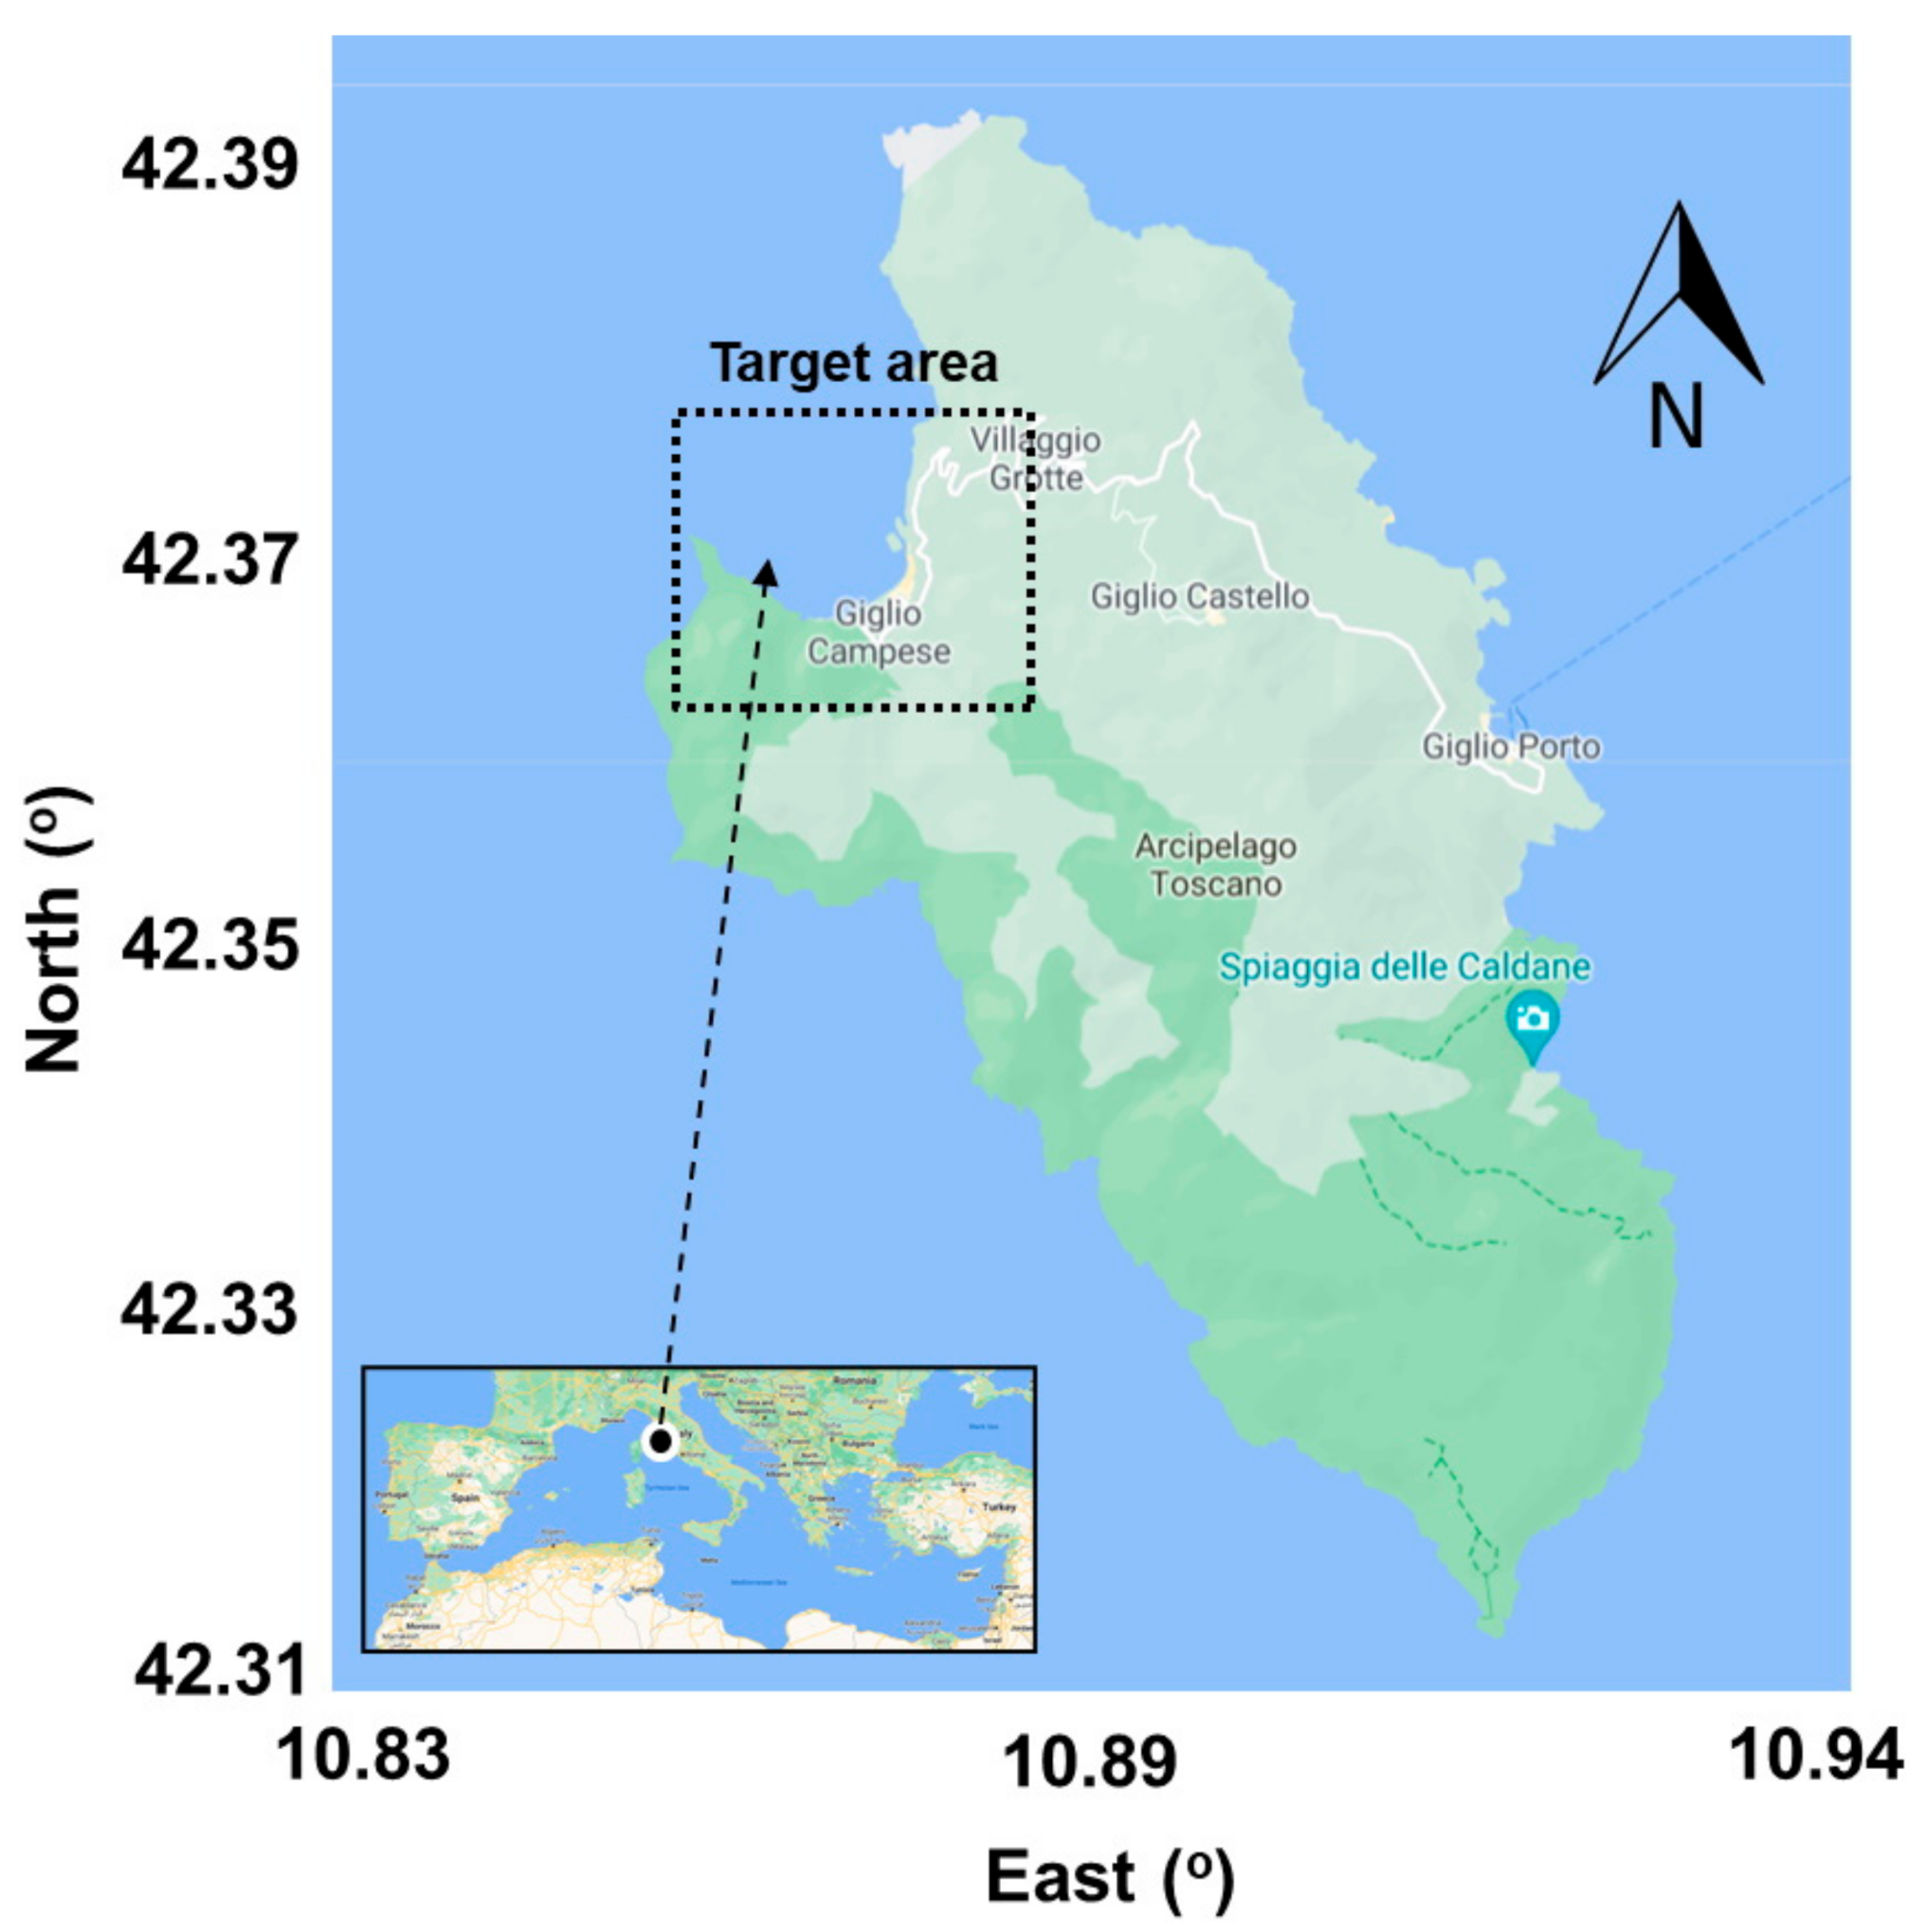
Figure 1. Map of the target area, Giglio coastal environment in the Mediterranean Sea (figure processed from Google Maps, 2021).
Inventions 06 00033 g001
Figure 2. SWAN computational domain, where: (a) bathymetric map including the positions of the nearshore points (NP) and of the L-lines, respectively; (be) proposed marine farm layouts focused on various inter-device distances (2d spacing and 3d spacing) and lines (one or two lines).
Inventions 06 00033 g002
Figure 3. Wave statistics based on the CCI-SS and ERA5 datasets corresponding to the 27-year time interval (January 1992–December 2018), where: (a,b) monthly Hs values related to the average and extreme values, respectively; (c) seasonal Hs values—average and extreme.
Inventions 06 00033 g003
Figure 4. Giglio offshore wind energy as provided by the ERA5 data for the 27-year time interval (January 1992–December 2018). The results are indicated in terms of: (a,b) U100—monthly average and extreme values; (c,d) AEP (GWh) and Cf (%)—seasonal values provided by the turbines T1–T5.
Inventions 06 00033 g004aInventions 06 00033 g004b
Figure 5. Significant wave heights scalar fields and wave vectors in the Giglio area based on the statistics related to a typical storm event reported during the wintertime (Hs = 3.41 m; Tm = 9.11 s; Dir = 194.18). The case studies are related to extreme conditions while the results correspond to: (a) no farm; (b) wave farms.
Inventions 06 00033 g005
Figure 6. CS1 scenario—Evaluation in the geographical space of the marine energy farm influence. The results correspond to: (a) no farm map and Hs variation along the line L; (b) maps involving the wave farms considered. The case studies are related to extreme conditions while the figures also include the position of the L line.
Inventions 06 00033 g006
Figure 7. Hs variation in the nearshore points due to the presence of the marine energy farms. The results are presented for: (a) Hs distribution (in m); (b) relative change (in %) reported between the no farm scenario (A scenario) and wave farms (scenarios B–E). The case studies are related to extreme conditions.
Inventions 06 00033 g007
Figure 8. CS2 scenario—Evaluation in the geographical space of the marine energy farm influence. The results correspond to: (a) no farm map and Hs variation along the line L; (b) maps involving the wave farms considered. The figures also include the position of the L line. The case studies are related to extreme conditions.
Inventions 06 00033 g008
Figure 9. CS3 scenario—evaluation in the geographical space of the influence of a marine energy farm. The case studies are related to extreme conditions while the results correspond to: (a) no farm; (b) marine energy farms.
Inventions 06 00033 g009
Figure 10. CS4 scenario—evaluation in the geographical space of the influence of a marine energy farm. The case studies are related to extreme conditions while the results correspond to: (a) no farm; (b) marine energy farms.
Inventions 06 00033 g010
Figure 11. Breaking waves properties along the L-lines, where: (a) type of the waves—percentage from the total events; (b) relative change (in %) reported between the no farm scenario (A scenario) and wave farms (scenarios B–E). The case studies are related to extreme conditions.
Inventions 06 00033 g011
Figure 12. Variation of the Ubot parameter (in m/s) in the presence of the marine energy farms. The results are related to the CS1 scenario being associated to nearshore points: (a) NP1; (b) NP2, (c) NP3; (d) NP4, (e) NP5. The numerical values in the subplots represent the relative changes (in %) reported by the wave farm (scenarios B–E) to the no farm situation (scenario A). The case studies are related to extreme conditions.
Inventions 06 00033 g012
Figure 13. Variation of the wave forces (N/mm2) corresponding to the nearshore points, where: (a) CS1; (b) CS2; (c) CS3; (d) CS4. The case studies are related to extreme conditions.
Inventions 06 00033 g013
Figure 14. Maximum current velocity estimated along the five reference lines considered (L1–L5), where: (a) current velocity (Vcmax in m/s); (b) relative change (in %) between the no farm scenario (A scenario) and wave farms (scenarios B–E). The case studies are related to extreme conditions.
Inventions 06 00033 g014
Figure 15. Representation of the current profiles (in m/s), indicated for: (a) CS1-line 2; (b) CS2-line. The case studies are related to extreme conditions.
Inventions 06 00033 g015
Table 1. Characteristics of the SWAN model configuration corresponding to the Giglio computational domain. (x—indicates that the process is activated).
Input/
Process
WaveWindTideCrtGenWcapQuadTriadDiffBfricSetupBr
xx-xxxxxxxxx
Computational
domain
Coordinates∆x × ∆y (m)∆θ (°)Modnfngx × ngy = np
Cartesian25 × 255Stat/BSBT363499 × 101 = 9999
Crt—current fields; Gen—generation by wind; Wcap—whitecapping process; Quad—quadruplet nonlinear interactions; Triad—triad nonlinear interactions; Diff—diffraction process; Bfric—bottom friction; Setup—wave induced setup; Br—activation of the depth-induced wave breaking. Stat—stationary mode of model simulations; BSBT—scheme selection. ∆x; ∆y—resolutions in geographical space; ∆θ—resolution in directional space; nf—number of frequencies; nθ—number of directions; np—number of grid points.
Table 2. The main characteristics of the offshore wind turbines considered [44].
TurbineIDHub Height
(m)
Cut-in Speed
(m/s)
Rated Speed
(m/s)
Cut-Out Speed
(m/s)
Projects
V90-3.0T110041525Barrow (UK)
Areva M5000-116T2100412.525Global Tech I (DE)
Senvion 6.2 M126T31003.513.530Nordsee Ost (DE)
V164-8.8 MWT410041325Aberdeen (UK)
V164-9.5MWT51003.51425EolMed (FR)
Table 3. Extreme offshore sea states related to the Giglio site, based on the ERA5 dataset. The results are computed for the 27-year time interval (January 1992–December 2018) and the case studies are selected from the time interval quoted.
Case Study Time FrameHs (m)Tm (s)Dir (°)
CS11999.12.28-h184.728.20273.7
CS21999.02.22-h183.496.96275.6
CS32018.01.17-h123.346.75280.8
CS42013.11.11-h123.176.32353
Publisher’s Note: MDPI stays neutral with regard to jurisdictional claims in published maps and institutional affiliations.