Article

The Thermodynamics of Internal Combustion Engines: Examples of Insights

Department of Mechanical Engineering, Texas A&M University, College Station, TX 77843, USA
Inventions 2018, 3(2), 33; https://doi.org/10.3390/inventions3020033
Submission received: 27 April 2018 / Revised: 14 May 2018 / Accepted: 16 May 2018 / Published: 22 May 2018
(This article belongs to the Special Issue Thermodynamics in the 21st Century)

Abstract

:
A major goal of the development of internal combustion (IC) engines continues to be higher performance and efficiencies. A major aspect of achieving higher performance and efficiencies is based on fundamental thermodynamics. Both the first and second laws of thermodynamics provide strategies for and limits to the thermal efficiencies of engines. The current work provides three examples of the insights that thermodynamics provides to the performance and efficiencies of an IC engine. The first example evaluates low heat rejection engine concepts, and, based on thermodynamics, demonstrates the difficulty of this concept for increasing efficiencies. The second example compares and contrasts the thermodynamics associated with external and internal exhaust gas dilution. Finally, the third example starts with a discussion of the Otto cycle analysis and explains why this is an incorrect model for the IC engine. An important thermodynamic property that is responsible for many of the observed effects is specific heat.

1. Introduction

Internal combustion (IC) engines are prevalent in a wide range of applications throughout the world. Applications for IC engines include small utility (e.g., garden equipment such as edgers and trimmers), recreation, agriculture, construction, light-duty vehicles, heavy-duty vehicles, marine, and electric power generation. As one example, the number of vehicles and their associated engines in the world is estimated at 1.2 billion, and is estimated to be over 2 billion by 2035. For such a complex device, these are exceptional numbers.
The reasons for the success of the IC engine are well documented (e.g., [1,2,3]). These reasons include relatively low initial cost, high power density, reasonable efficiencies, ability to meet emission standards, and being well matched to available fuels. This latter reason is particularly important. Since liquid hydrocarbon fuels possess high energy densities, the IC engine is able to provide a continual operation with minimum refueling needs. Typical refueling times for many vehicles are of the order of ten minutes or so. These features are particularly important in the transportation sector.
Although the popular press occasionally publishes opinions on the demise of the IC engine (e.g., [4]), the IC engine remains a successful device. Alternative power plants continue to be examined, but none have managed to displace the IC engine. Future improvements to fuel cells and batteries will be required, such that these alternatives will be acceptable to the consumer. For these reasons, the IC engine is expected to be the dominant power plant for many of the above applications for many more decades.
Finally, when it comes to transportation, IC engines should continue to be the dominant technology for commercial marine vessels, large trucks, and aircraft for the foreseeable future. While there are possible alternatives, none offer the same combination of low cost and high energy density found with a simple tank of fuel and an IC engine.
One of the major current goals of IC engine development is to achieve higher performance and thermal efficiencies. Perhaps the most important aspects of the performance and efficiency of engines is related to the fundamental thermodynamics. An engine’s performance and efficiency is limited by the first and second laws of thermodynamics. To provide quantitative examples of the thermodynamics of engines, a cycle simulation is used in this work. This cycle simulation incorporates all features of the first and second laws of thermodynamics.
Although many examples exist of the importance of thermodynamics relative to engine efficiency and performance, this paper will select three examples to illustrate the insights available. These three examples are the thermodynamics of low heat rejection engines, the thermodynamics of exhaust gas dilution, and the thermodynamics of the ideal Otto cycle. This paper includes subsections on the laws of thermodynamics and a description of the engine cycle simulation. The paper ends with a summary, and a list of conclusions and findings.

2. Brief Review of the Laws of Thermodynamics

The primary laws of thermodynamics that are relevant to this discussion are the first and second laws. These laws are well described in numerous thermodynamic (e.g., [5,6]) and engine text books [1,2,7]. The following is a brief summary.
The first law of thermodynamics is often attributed to James Joule and Julius Mayer [5]. In the early 1840s, they individually recognized that heat transfer and work were different forms of the same quantity. This observation led quickly to the idea that energy remained constant, but could change form. The first law of thermodynamics is often called the conservation of energy law. Basically, energy cannot be created or destroyed. This means that for a control volume, the change of energy must be equal to the net result of all inputs and outputs of energy.
The second law of thermodynamics is perhaps a much richer and more complex law than the first law. This law is often attributed to the original work of Carnot [8] in 1824. The second law is based on a number of related physical observations that have a wide range of implications with respect to engineering design and operation of thermal systems. For example, the second law can be used to determine the direction of processes, to establish the conditions of equilibrium, to specify the maximum possible performance of thermal systems, and to identify those aspects of processes that are detrimental to overall performance. Because of this large number of related observations, there is no simple, single statement that captures the full extent of the second law of thermodynamics. Although thermodynamic text books commonly use the Kelvin-Planck and Clausius observations as statements of the second law, these are but two aspects of the second law. The second law is basically a set of observations that share a common fundamental principle that relates to the quality of energy. As described below, one way to quantify this quality of energy is to introduce a property (exergy or availability) that captures this concept. This will be described in the following subsection on the second law.

3. Description of the Engine Cycle Simulation

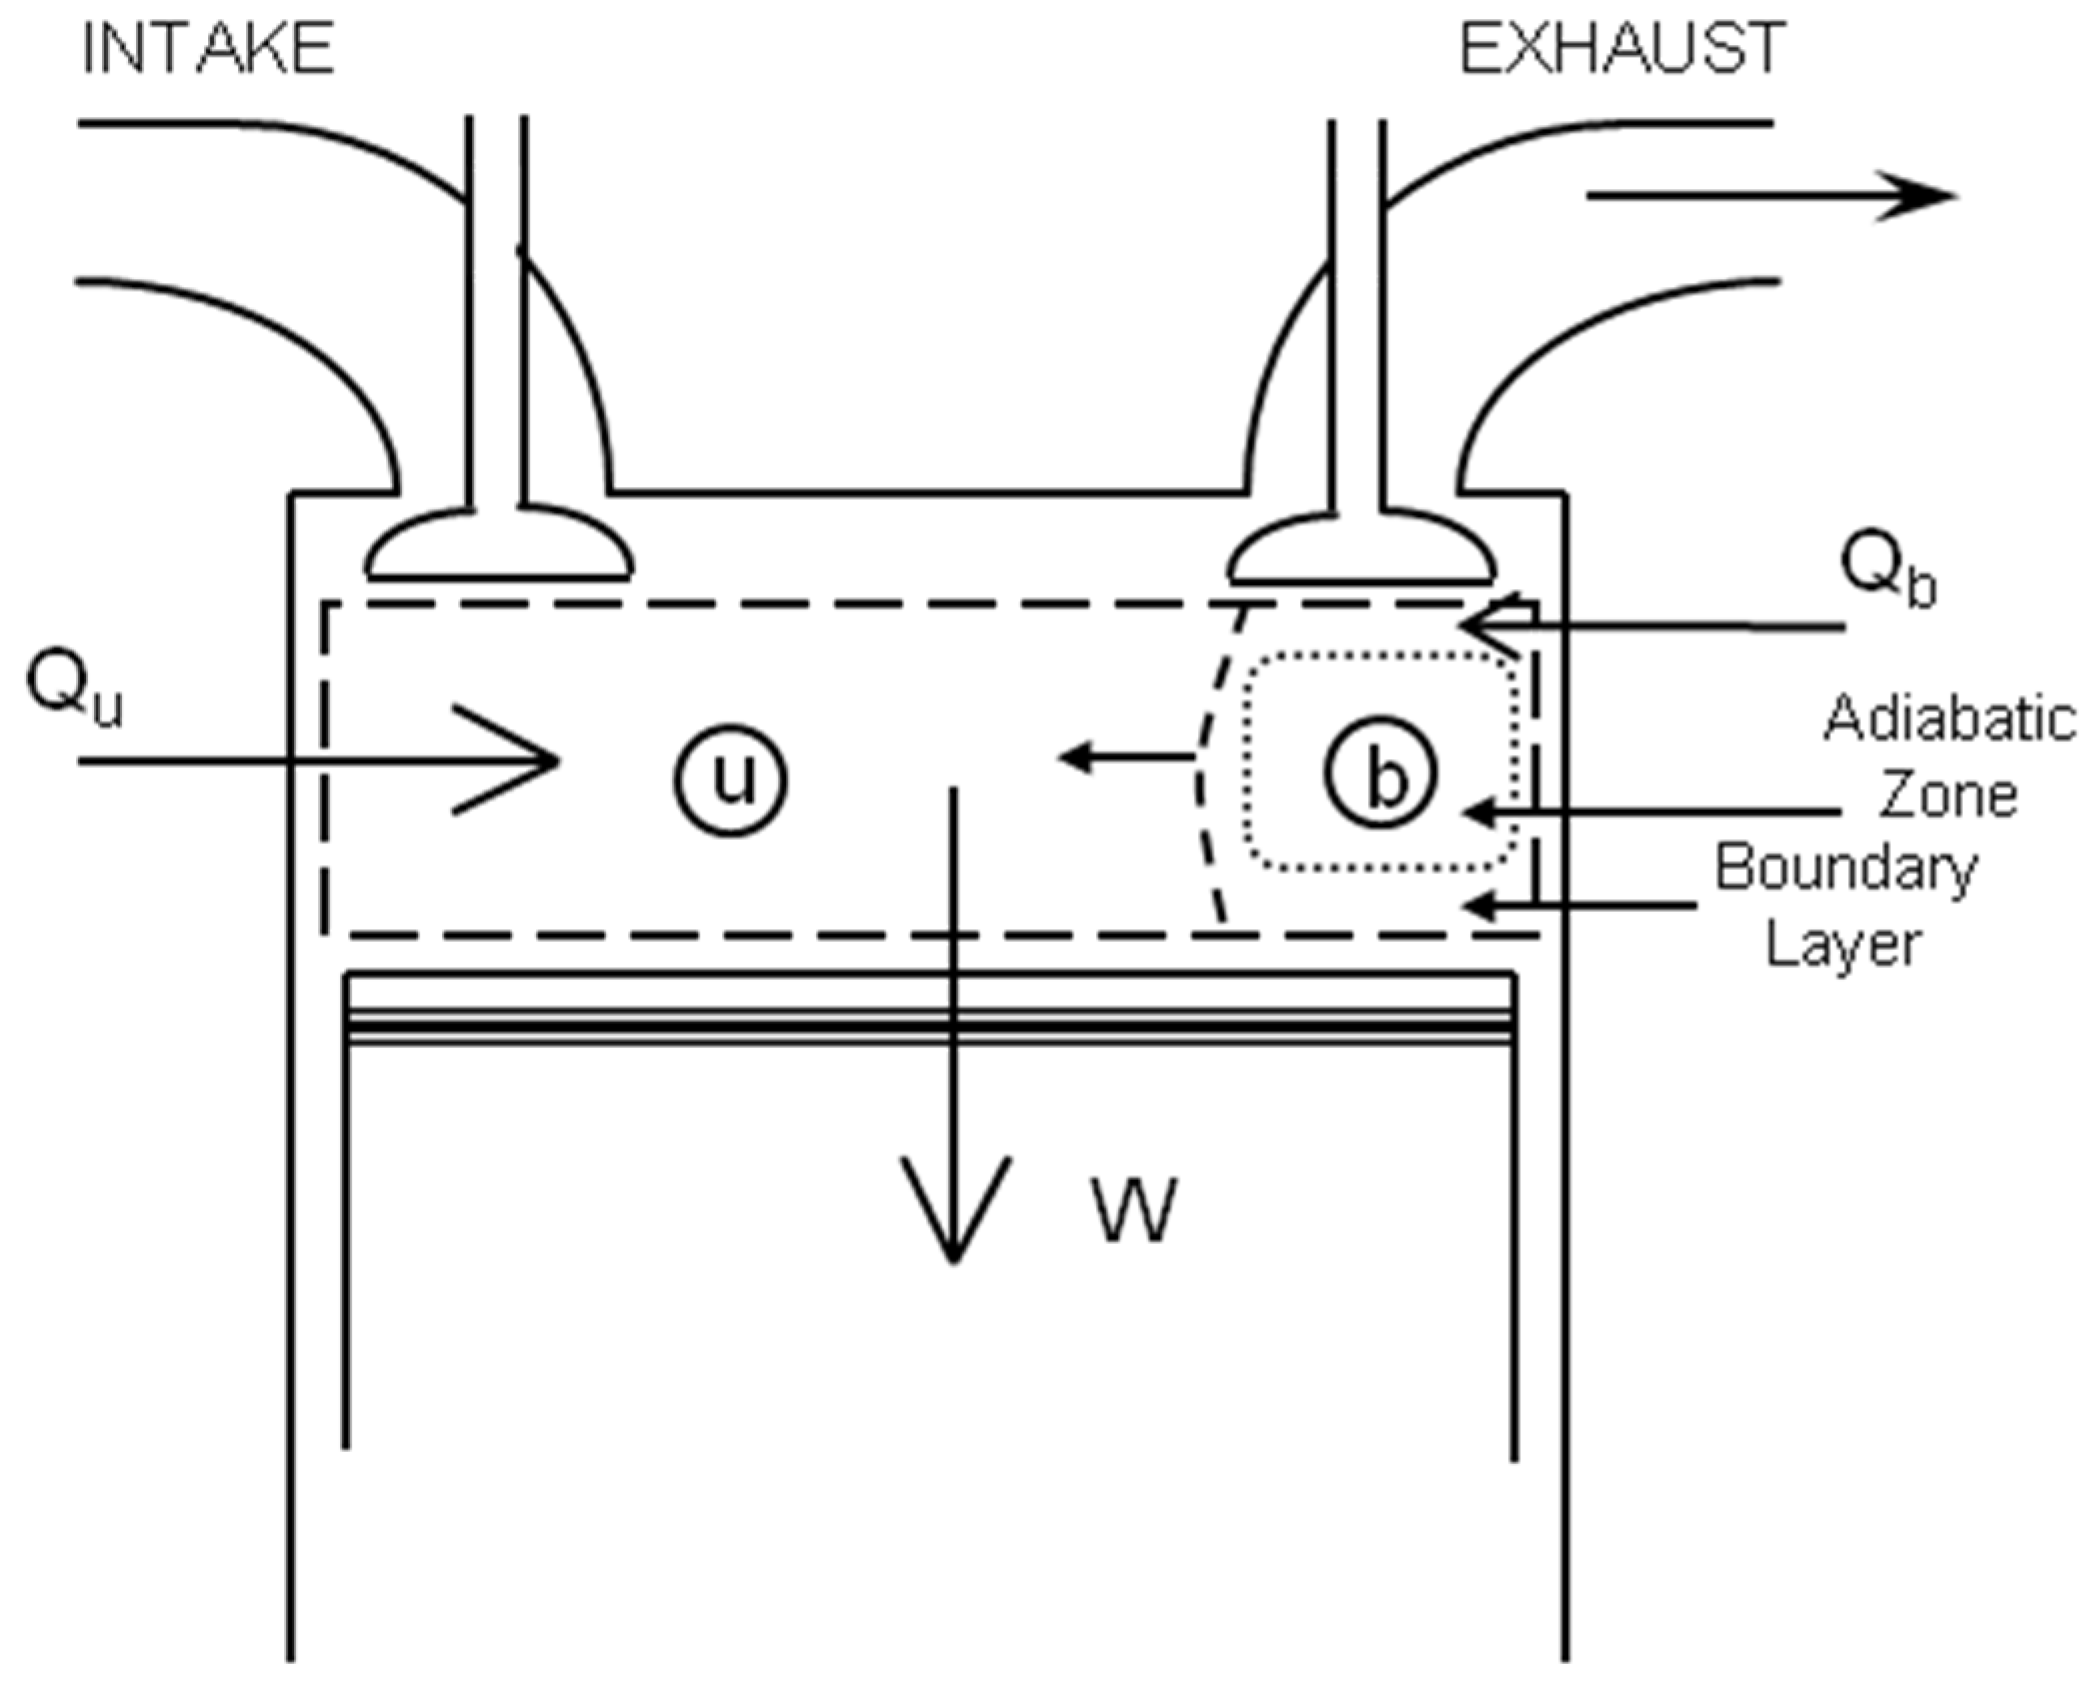
3.1. Basics of the Simulation

The engine cycle simulation used in this work is a zero-dimension formulation that includes all four strokes, uses three-zones for the combustion process, and requires a number of empirical sub-models. The details of this cycle simulation are available in a book [9] and in numerous technical articles (e.g., [10,11,12,13]). The following is a brief description of the simulation. This will be followed by subsections on the required items for solutions, descriptions of the engine and operating conditions, and strategies for the following computations.
Figure 1 is a schematic of the control volume for the three-zone simulation. The three-zones are the unburned zone, the adiabatic core, and the boundary layer. The latter two regions comprise the burned zone. Cylinder heat transfer is based on one of several heat transfer correlations (described below). The cylinder heat transfer is allocated to the unburned zone and the boundary layer (of the burned zone) based on the temperatures and volumes of the zones [9].

3.2. Formulations

The first law of thermodynamics is used to derive expressions for the time (crank angle) derivatives of the pressure, the three temperatures, the three volumes, and the three masses in terms of engine design variables, operating parameters, and sub-model constants. For this development, only steady state operation is considered. The fuel is assumed to be completely vaporized and mixed with the incoming air. Any blow-by is neglected, and combustion is assumed 100% complete (Note that due to the Wiebe function used for combustion a small amount (0.7%) of fuel is not consumed).
The set of ordinary differential equations is solved numerically as a function of crank angle. The items needed for the solutions include the thermodynamic properties, piston-cylinder kinematics, combustion process descriptions, cylinder heat transfer, mass flow rates, and algorithms for the mechanical friction. Each of these is briefly described next.

3.3. Items Needed for Solutions

3.3.1. Properties

The properties of the working fluid are based on air, fuel vapor, and combustion properties. For the thermodynamic conditions of IC engines, the working fluid may be assumed to obey the ideal gas model. The concentrations of combustion products may be “frozen” for the lower temperatures, or based on instantaneous (shifting) chemical equilibrium for the higher temperatures. The unburned mixture during the compression stroke prior to combustion consists of the inlet mixture of air, fuel vapor, exhaust gas recirculation (if specified), and the residual gases (combustion products). The burned gases are determined from the stoichiometry and either the frozen or equilibrium composition. Once the composition of the gas mixtures is known, the thermodynamic properties may be determined. Properties for each species are determined from polynomial curve-fits to the property data for the species [1,9].

3.3.2. Kinematics

The kinematics and geometric parameters are based on standard reciprocating engines [9]. The required inputs include the cylinder bore, stroke, connecting rod length, and compression ratio. With these inputs, the instantaneous cylinder volume, the rate of change of the cylinder volume, and the instantaneous surface area may be determined.

3.3.3. Combustion

For the version of the cycle simulation used here, the mass fraction of the burned fuel as a function of crank angle is needed. For this work, this is supplied by a Wiebe function [14].
x b = 1 exp ( a y m + 1 )
in which xb is the mass fraction of fuel burned, and a and m are constants that are selected to provide an appropriate burn curve. For this work, as suggested by Heywood [1], a = 5.0 and m = 2.0. In this equation, y represents the non-dimensional progress variable
y = θ θ o θ b
in which θ is the instantaneous crank angle, θo is the start of combustion, and θb is the combustion duration.
This provides a good representation of the actual combustion process. At the start of combustion, the mass fraction burned increases slowly, which is representative of the slow ignition process. Then, the mass fraction burned increases more rapidly, representing the rapid flame propagation during the mid-parts of the combustion process. Finally, at the end of combustion, the mass fraction burned slows due to lack of reactant material and greater heat transfer as the flame nears the combustion chamber walls.
The burn duration (θb) for this study is defined as the 0–100% duration. Another common interval is the 10–90% duration. These two definitions of the burn duration are related. For the Wiebe constants used in this study, the 10–90% duration is about one-half of the 0–100% duration.

3.3.4. Cylinder Heat Transfer

Cylinder heat transfer is a complex phenomenon that continues to be studied. In the current work, the cylinder heat transfer is approximated by empirical expressions from the literature for the convective heat transfer, which are given by
Q ˙ = h A ( T w a l l T g a s )
in which h is the instantaneous heat transfer coefficient, A is the instantaneous cylinder surface area, Twall is the cylinder wall temperature, and Tgas is the one-zone gas temperature. Numerous correlations are available for the heat transfer coefficient (e.g., [15,16]). For the work reported here, the correlation from Hohenberg [16] is used. For convenience, the heat transfer results will be reported as positive from the gases to the walls.

3.3.5. Mass Flow Rates

The mass flows are estimated from standard quasi-steady, one-dimensional flow equations [1,9]. An empirical discharge coefficient is used to account for real flow effects. At each calculation step, the flow conditions are examined to determine if the flow is sonic or sub-sonic. Sonic (also known as choked or critical) flow may exist if the upstream pressure is sufficiently high relative to the downstream pressure. In addition to the flow equations, the details of the valve operation are needed to estimate the flow open area.

3.3.6. Mechanical Friction

To determine brake values for the performance and efficiency determinations, values for the mechanical friction are needed. Mechanical friction is estimated using a series of algorithms that has been developed for automotive engines [17]. These algorithms provide friction values for groups of components: rubbing (crankshaft, bearings, pistons, valve train, etc.), pumping, and auxiliaries (oil and water pumps and alternators).

3.4. Description of the Engine

All the results reported below are for the same engine: a 5.7 L, V-8 configuration with a bore and stroke of 101.6 and 88.4 mm, respectively. Most of the following results, however, are not too sensitive to the actual engine. Table 1 lists some of the engine specifications, and Table 2 lists some of the parameters (and “how obtained”) that are needed to complete the computations. Note that the open and close crank angles for the valve events represent a valve lift of zero.
As noted in Table 2, the exhaust pressure is set as 10 kPa greater than the inlet pressure. This is an approximation, since this difference is a function of the exhaust system and whether superchargers or turbochargers are used.
A base case operating condition has been selected for the following study. This will be called case 1, and consists of a bmep of 900 kPa, and an engine speed of 2000 rpm. Other parameters for case 1 are a compression ratio of 10, stoichiometric mixtures, and a burn duration of 50 °CA. The fuel is isooctane, but again, the results are fairly independent of the actual fuel. Table 3 lists some of major items that define case 1.
In general, the following results are based on a similar methodology and are subject to a similar set of constraints. First, combustion is considered successful and proceeds according to the Wiebe function. The advantage of this approach is that the role of the thermodynamics is clear. The disadvantage is that items such as combustion stability, cycle-to-cycle variations, and knock or other combustion issues are not considered.
Second, the general methodology of the following studies is to vary one parameter at a time. This provides a consistent and unambiguous examination of the various effects. Third, the combustion timing is adjusted to provide the maximum brake torque (MBT). Consistent with the above, combustion timing was adjusted for MBT with no concern for knock or other abnormal combustion behavior.

3.5. Second Law

Results from the second law of thermodynamics provide additional insights on engine performance that are not available from the first law. The second law leads to the property entropy that is central to using the second law to evaluate engine operation. As mentioned above, an important thermodynamic property related to the second law is exergy. Exergy is also known as availability, available energy, and essergy (essence of energy). Exergy, a property of the system and the environment, is a measure of the maximum useful work that a given system may produce, as the system is allowed to reversibly transition to a state that is in equilibrium with the environment. The energy of a system may be divided into a part that is available to produce work (the exergy) and a part that is not able to produce work (the unavailable energy). In addition, unlike energy, exergy may be destroyed by irreversible processes. One of the key parts of the second law analyses for engines is to determine this exergy destruction.
Once the thermodynamic properties (including entropy) are known for a given cycle, the exergy may be computed. The system specific exergy is given by
b = ( u u o ) + ( p o ( v v o ) ) T o ( s s o )
in which b is the specific exergy, and u, v, and s are the specific internal energy, specific volume, and specific entropy, respectively. uo, vo, and so are the specific values at the dead state. The dead state is defined as the condition of the environment at po and To. Once the system is in equilibrium with the dead state, there is no further opportunity of it to produce useful work.
Exergy may be destroyed by irreversible processes such as combustion, heat transfer through a finite temperature difference, friction, or mixing.
For completing the exergy analyses, the exergy of the fuel is needed
B f u e l = ( Δ G ) T o , p o
in which ΔGTo,po is the change of the Gibbs free energy for reactants to products. For many hydrocarbon fuels, the fuel exergy is not much different than the lower heating value (LHV). For isooctane, the fuel exergy is 1.0286 greater than the LHV.
The destroyed exergy (Bdest) during combustion (CD) will be expressed as a percentage of the fuel exergy,
C D = B d e s t B f u e l × 100 %
Complete details of the exergy analyses may be found elsewhere (e.g., [9,12]).
Figure 2 shows the partition of the fuel energy (left bar) and exergy (right bar) for case 1. From the bottom, the first item is the indicated work. This is the same value on a “kJ” basis for both energy and exergy, but the percentages are slightly different, since the LHV and fuel exergy values are slightly different. Mechanical friction is noted in the figure and represents the difference between the brake and net indicated work. The next item is the heat transfer. The energy percentage is 16.4%, and the exergy percentage is 13.5%. This recognizes that not all the energy associated with the heat transfer is available to produce work. Similarly for the net transfer due to the flows, the energy percentage is 43.2% and exergy percentage is 26.2%. A large fraction of the exhaust gas energy is not available to produce work.
On the right bar for exergy, additional items are shown that represent the destruction of exergy. The largest of these is the 20.1% of the fuel exergy destroyed during the combustion process. Combustion is highly irreversible due to the chemical reactions, heat transfer, and mixing associated with the combustion process. The next item is the exergy destruction due to the fresh inlet charge mixing with the residual gases. For this case, this is 0.8% of the fuel exergy. The final item (for both energy and exergy) is the unburned fuel (0.7%).
As described above, one of the unique results from the second law of thermodynamics is the quantification of the exergy destruction during the combustion process. Extensive work has shown that, in general, this destruction correlates with the combustion temperatures [18]. For conditions that result in higher combustion temperatures, more of the fuel exergy is preserved. Conversely, lower combustion temperatures result in less fuel exergy being preserved. This is an important insight not available from the first law of thermodynamics. This aspect is highlighted in the following results.

4. Example One: Thermodynamics of Low Heat Rejection Engines

4.1. Introduction

Cylinder heat transfer is an important aspect of IC engines. Since the metal components (cylinder head, cylinder walls, and piston crown) and lubricating oil in the cylinder must be maintained at temperatures less than those of the combustion gases, the cylinder components are cooled to temperatures significantly below the gas temperatures. This results in heat transfer from the gases to the components during the high temperature portions of the cycle. In terms of the efficiency, the heat transfer is moving thermal energy out of the cylinder, and then this energy is not available to produce work. As shown below, however, even if the heat transfer energy could be retained in the cylinder, not much of this energy can be converted to work.
In general, engines designed for lower heat losses are often called low heat rejection (LHR) engines. Some of the past work has referred to this technology as adiabatic engines, but this description is not preferred, since no engine can be 100% adiabatic. Much literature (e.g., [19,20,21,22]) is available that describes previous attempts at achieving LHR engines. Since LHR engines would be expected to possess higher gas temperatures, these concepts have not been applied to spark-ignition engines, since spark knock would be more likely.
Many concepts have been examined to achieve LHR engines. These concepts have included the use of ceramic and other low-conducting materials to minimize the cylinder heat losses. Most of these materials are less ductile than the cast iron and steel components that they replace. Due to this characteristic, these materials suffer low durability and often have not been able to sustain the harsh environment of the engine combustion chamber [19,20,21,22].
In addition to the potential of higher efficiencies, other advantages of the LHR engine concept include the possible minimization or elimination of the cooling system. This may result in weight decreases and reduction of a maintenance item. Removing cooling water pumps would reduce the mechanical friction. In addition, higher exhaust gas temperatures may be beneficial for turbocharging and some emission aftertreatment devices.
This subsection will examine reductions of cylinder heat transfer by increasing the cylinder wall temperatures. To decrease cylinder heat losses, most of these previous attempts employed high temperature materials (e.g., ceramics) and high temperature lubricants. These approaches effectively increase the component temperatures.
In terms of increasing thermal efficiencies, most of the previous work has not been successful. The results from thermodynamics in this subsection help explain why these previous attempts were not successful, and the difficulty of significantly increasing thermal efficiency by reducing the heat losses.

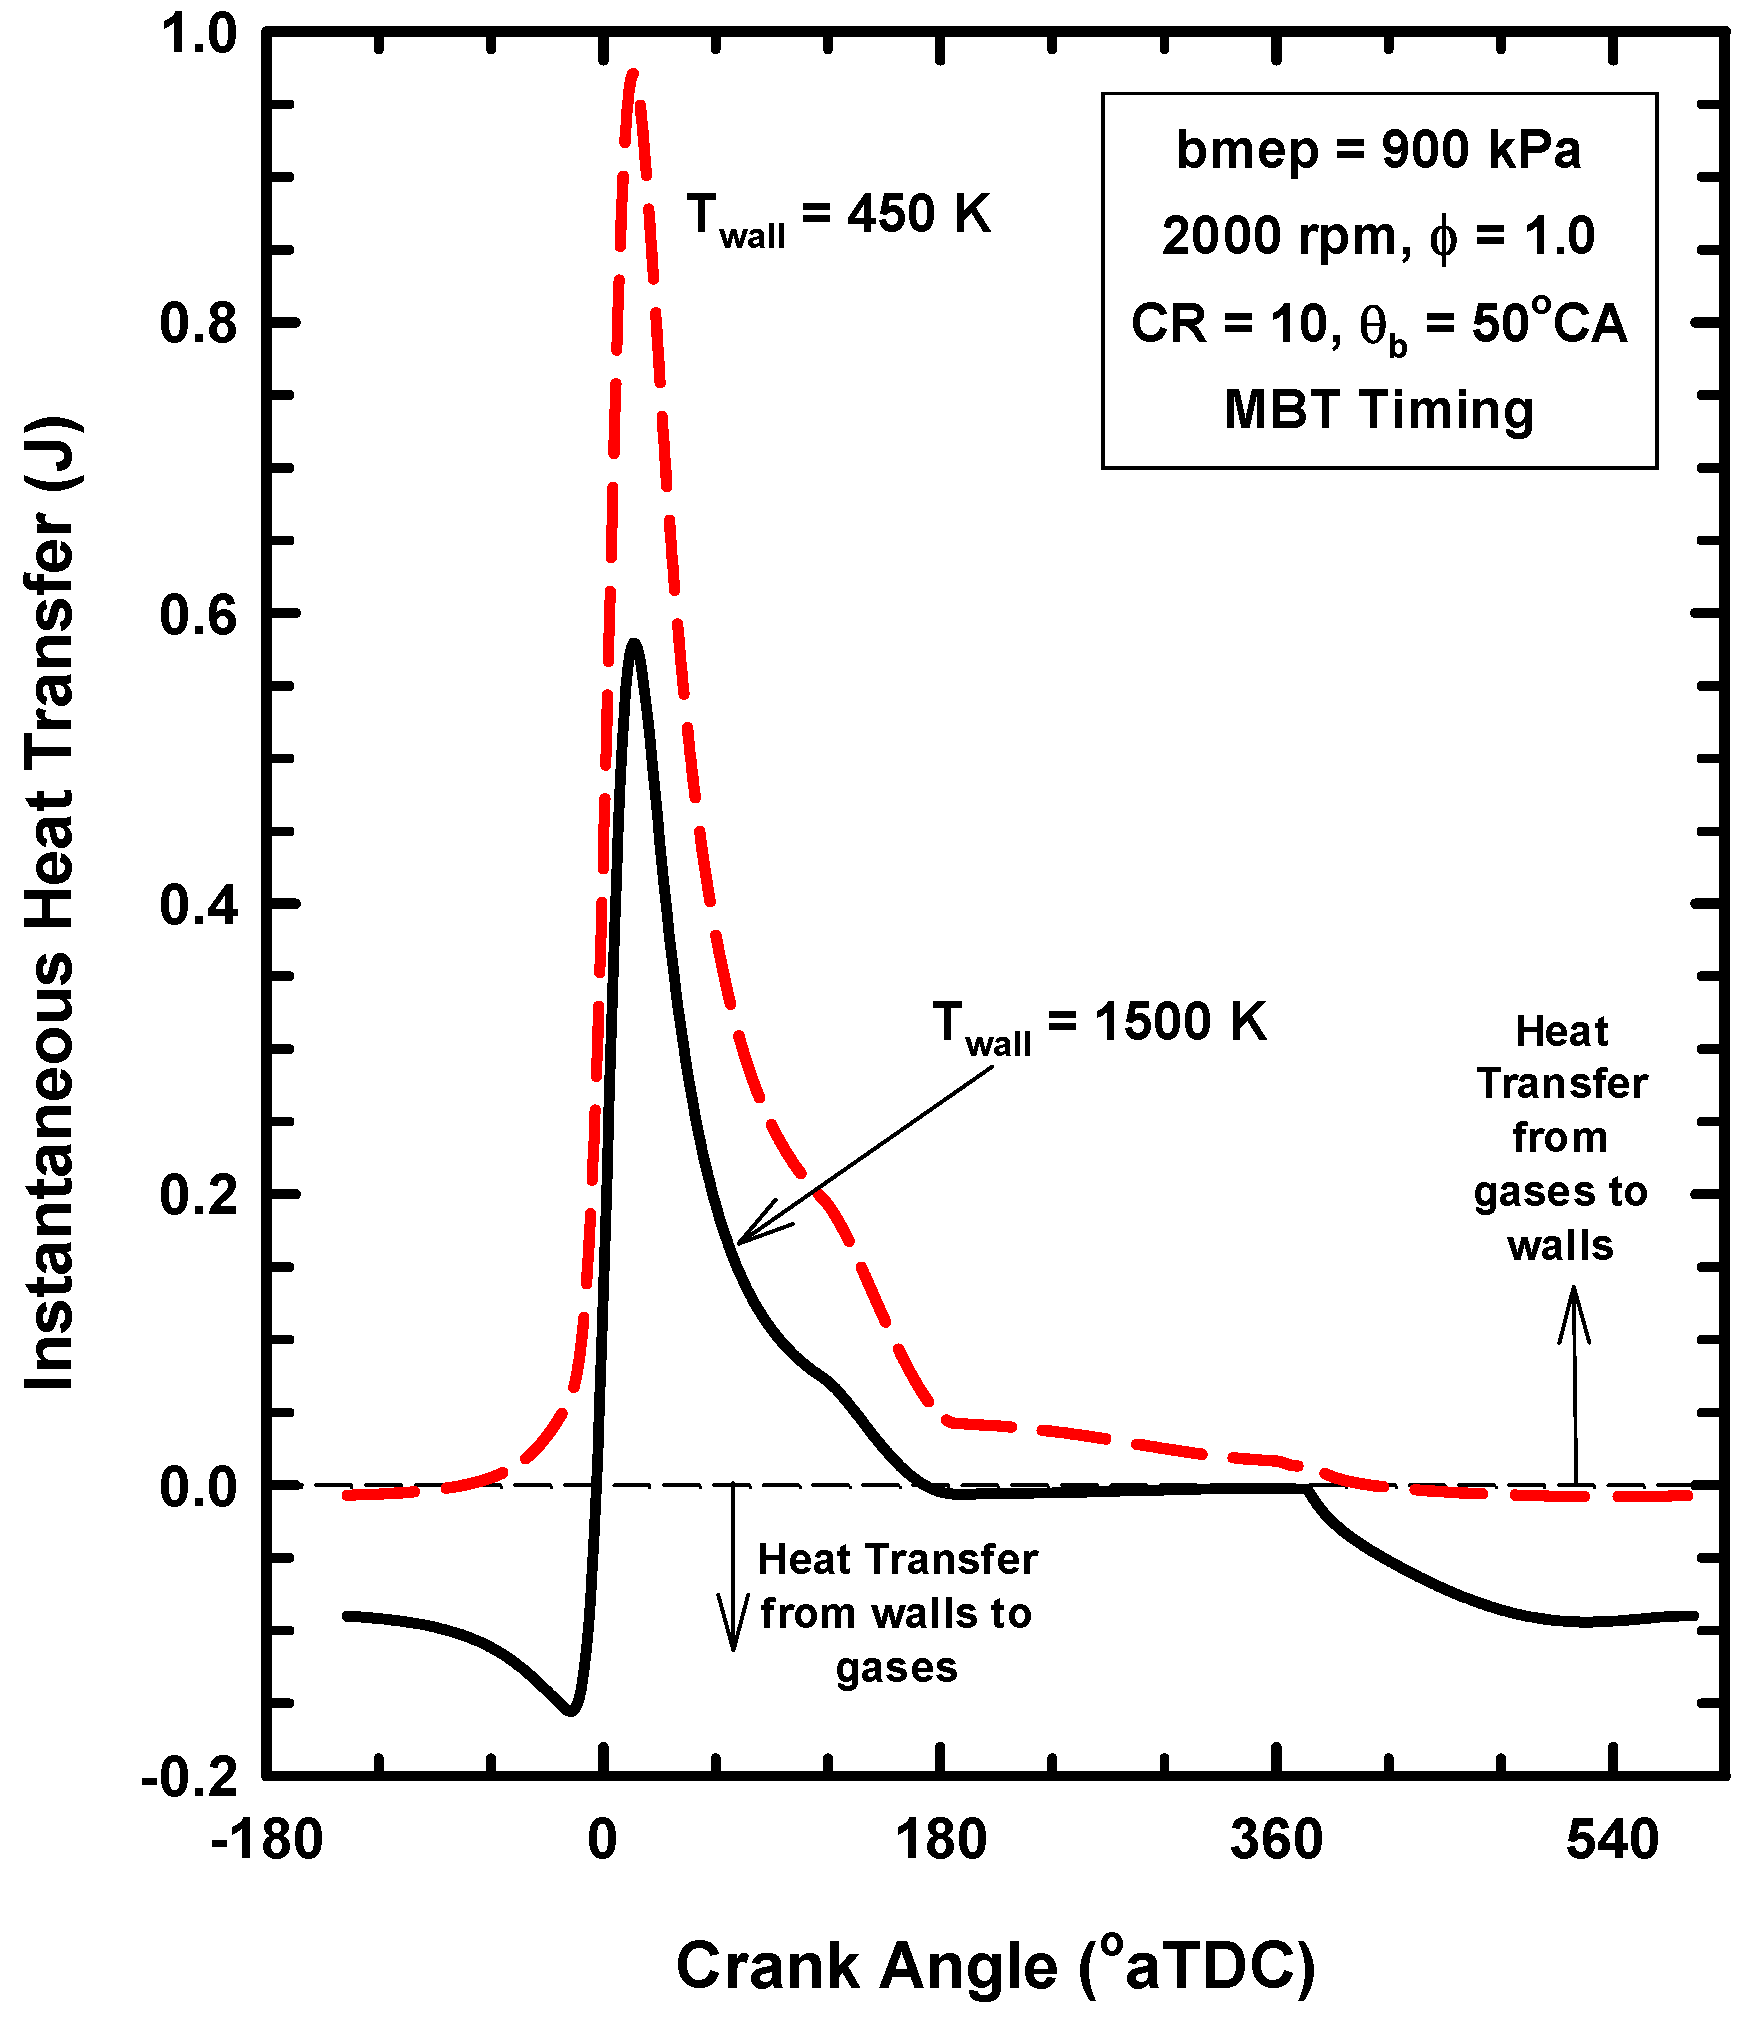
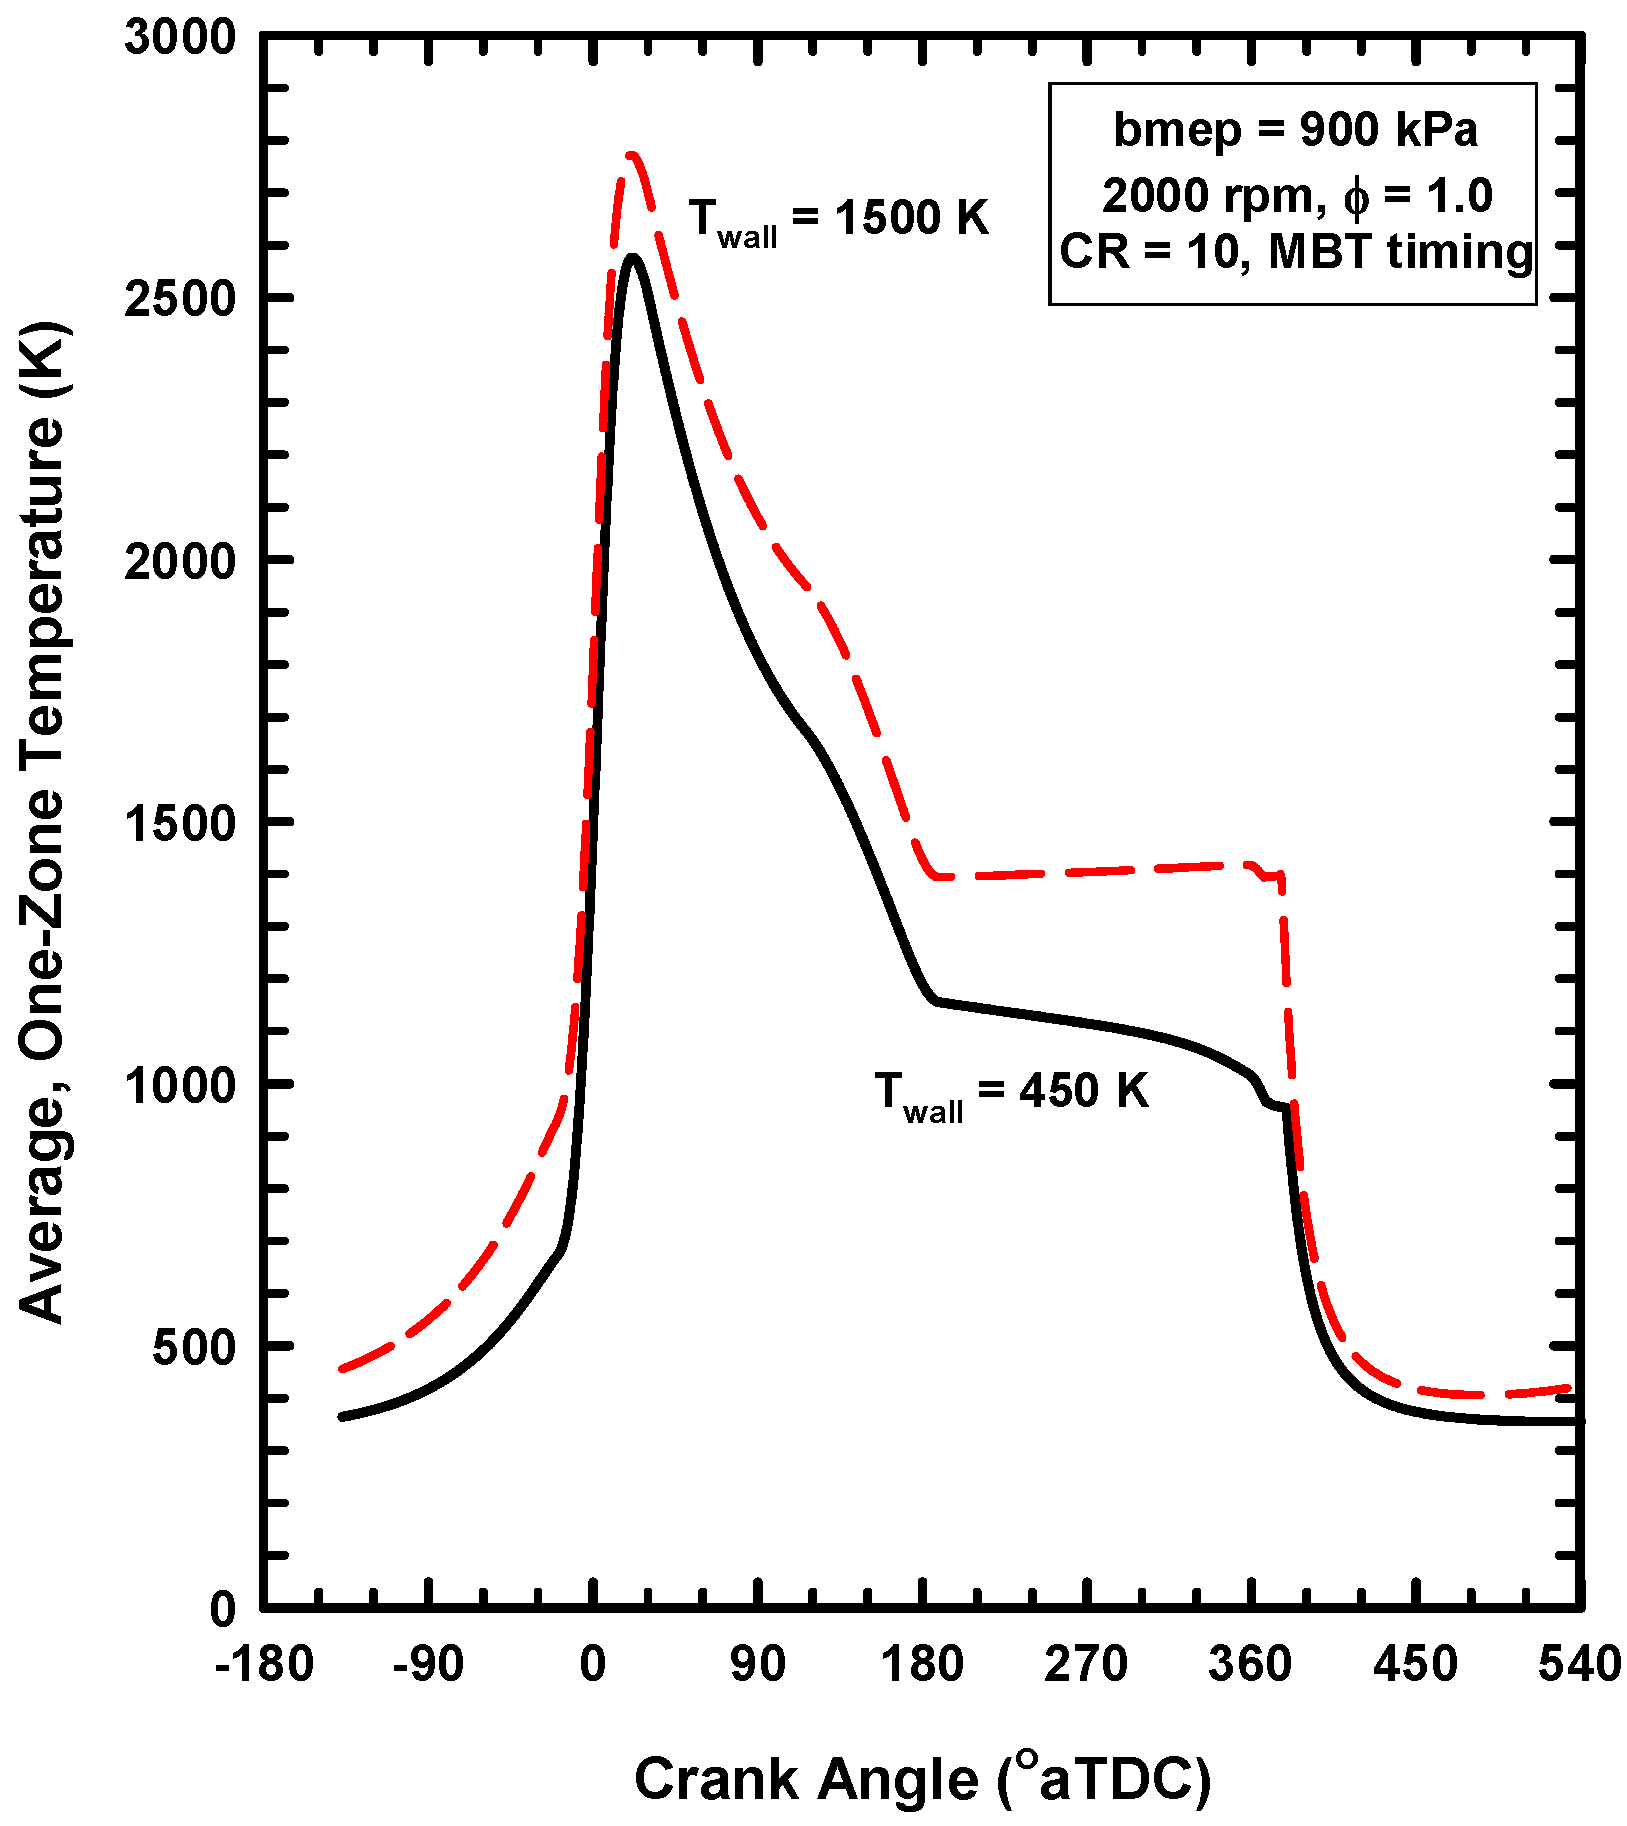
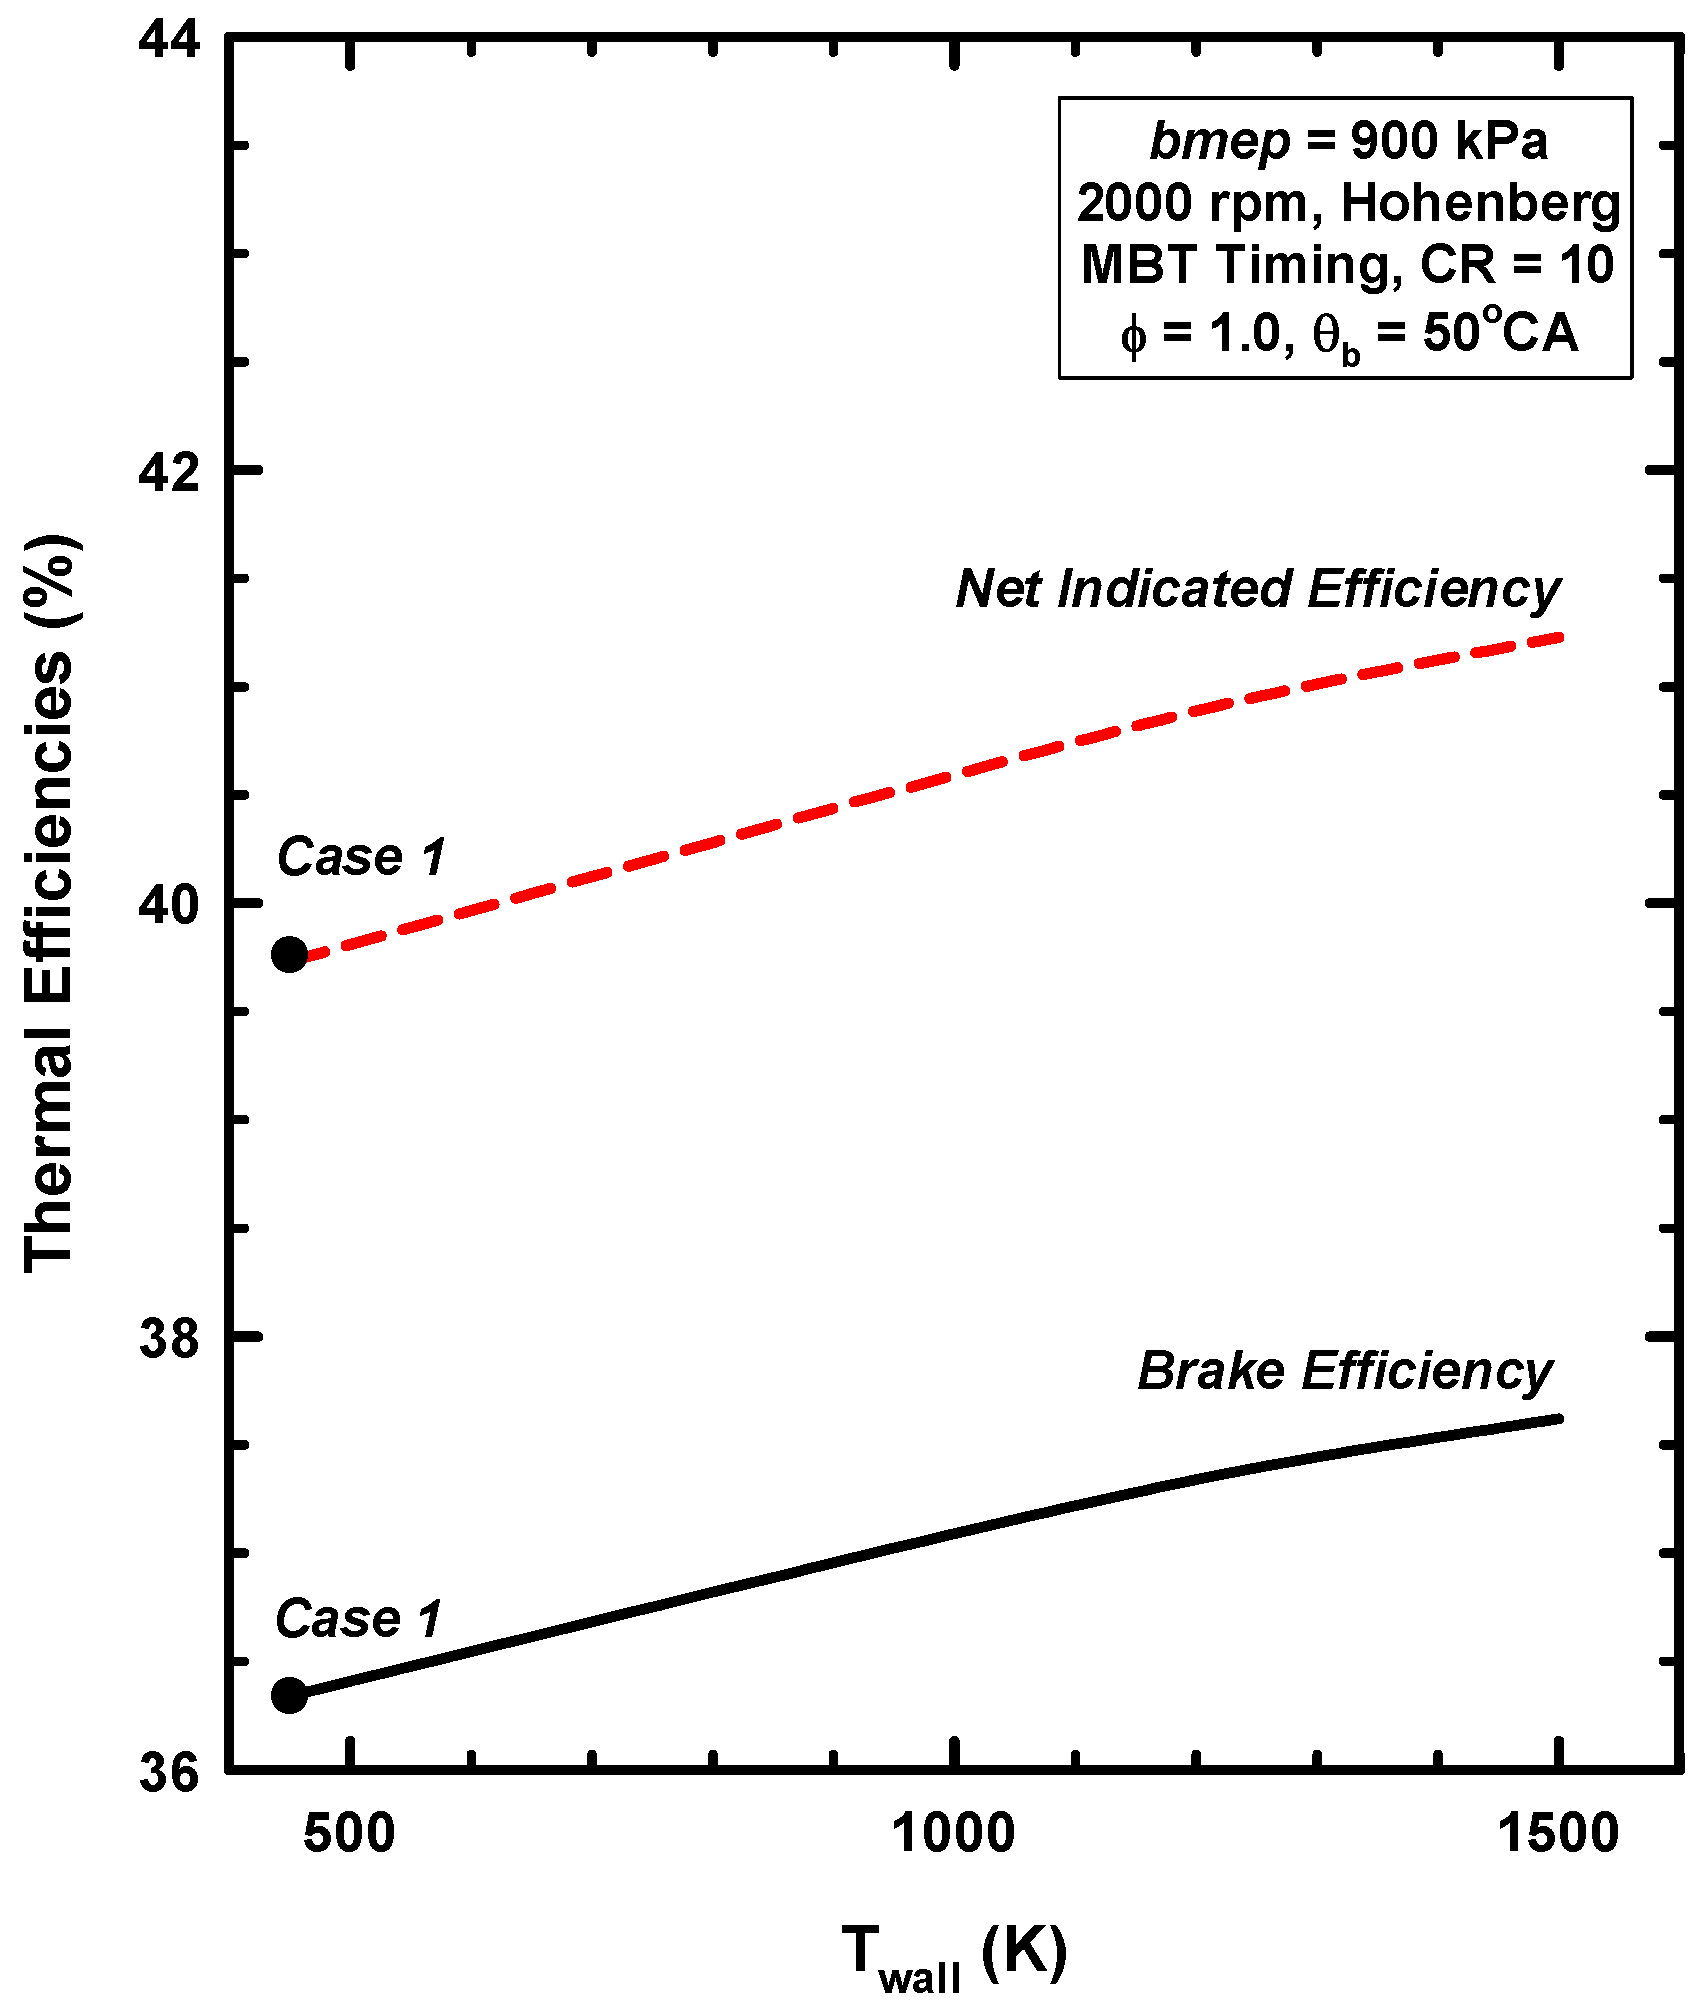
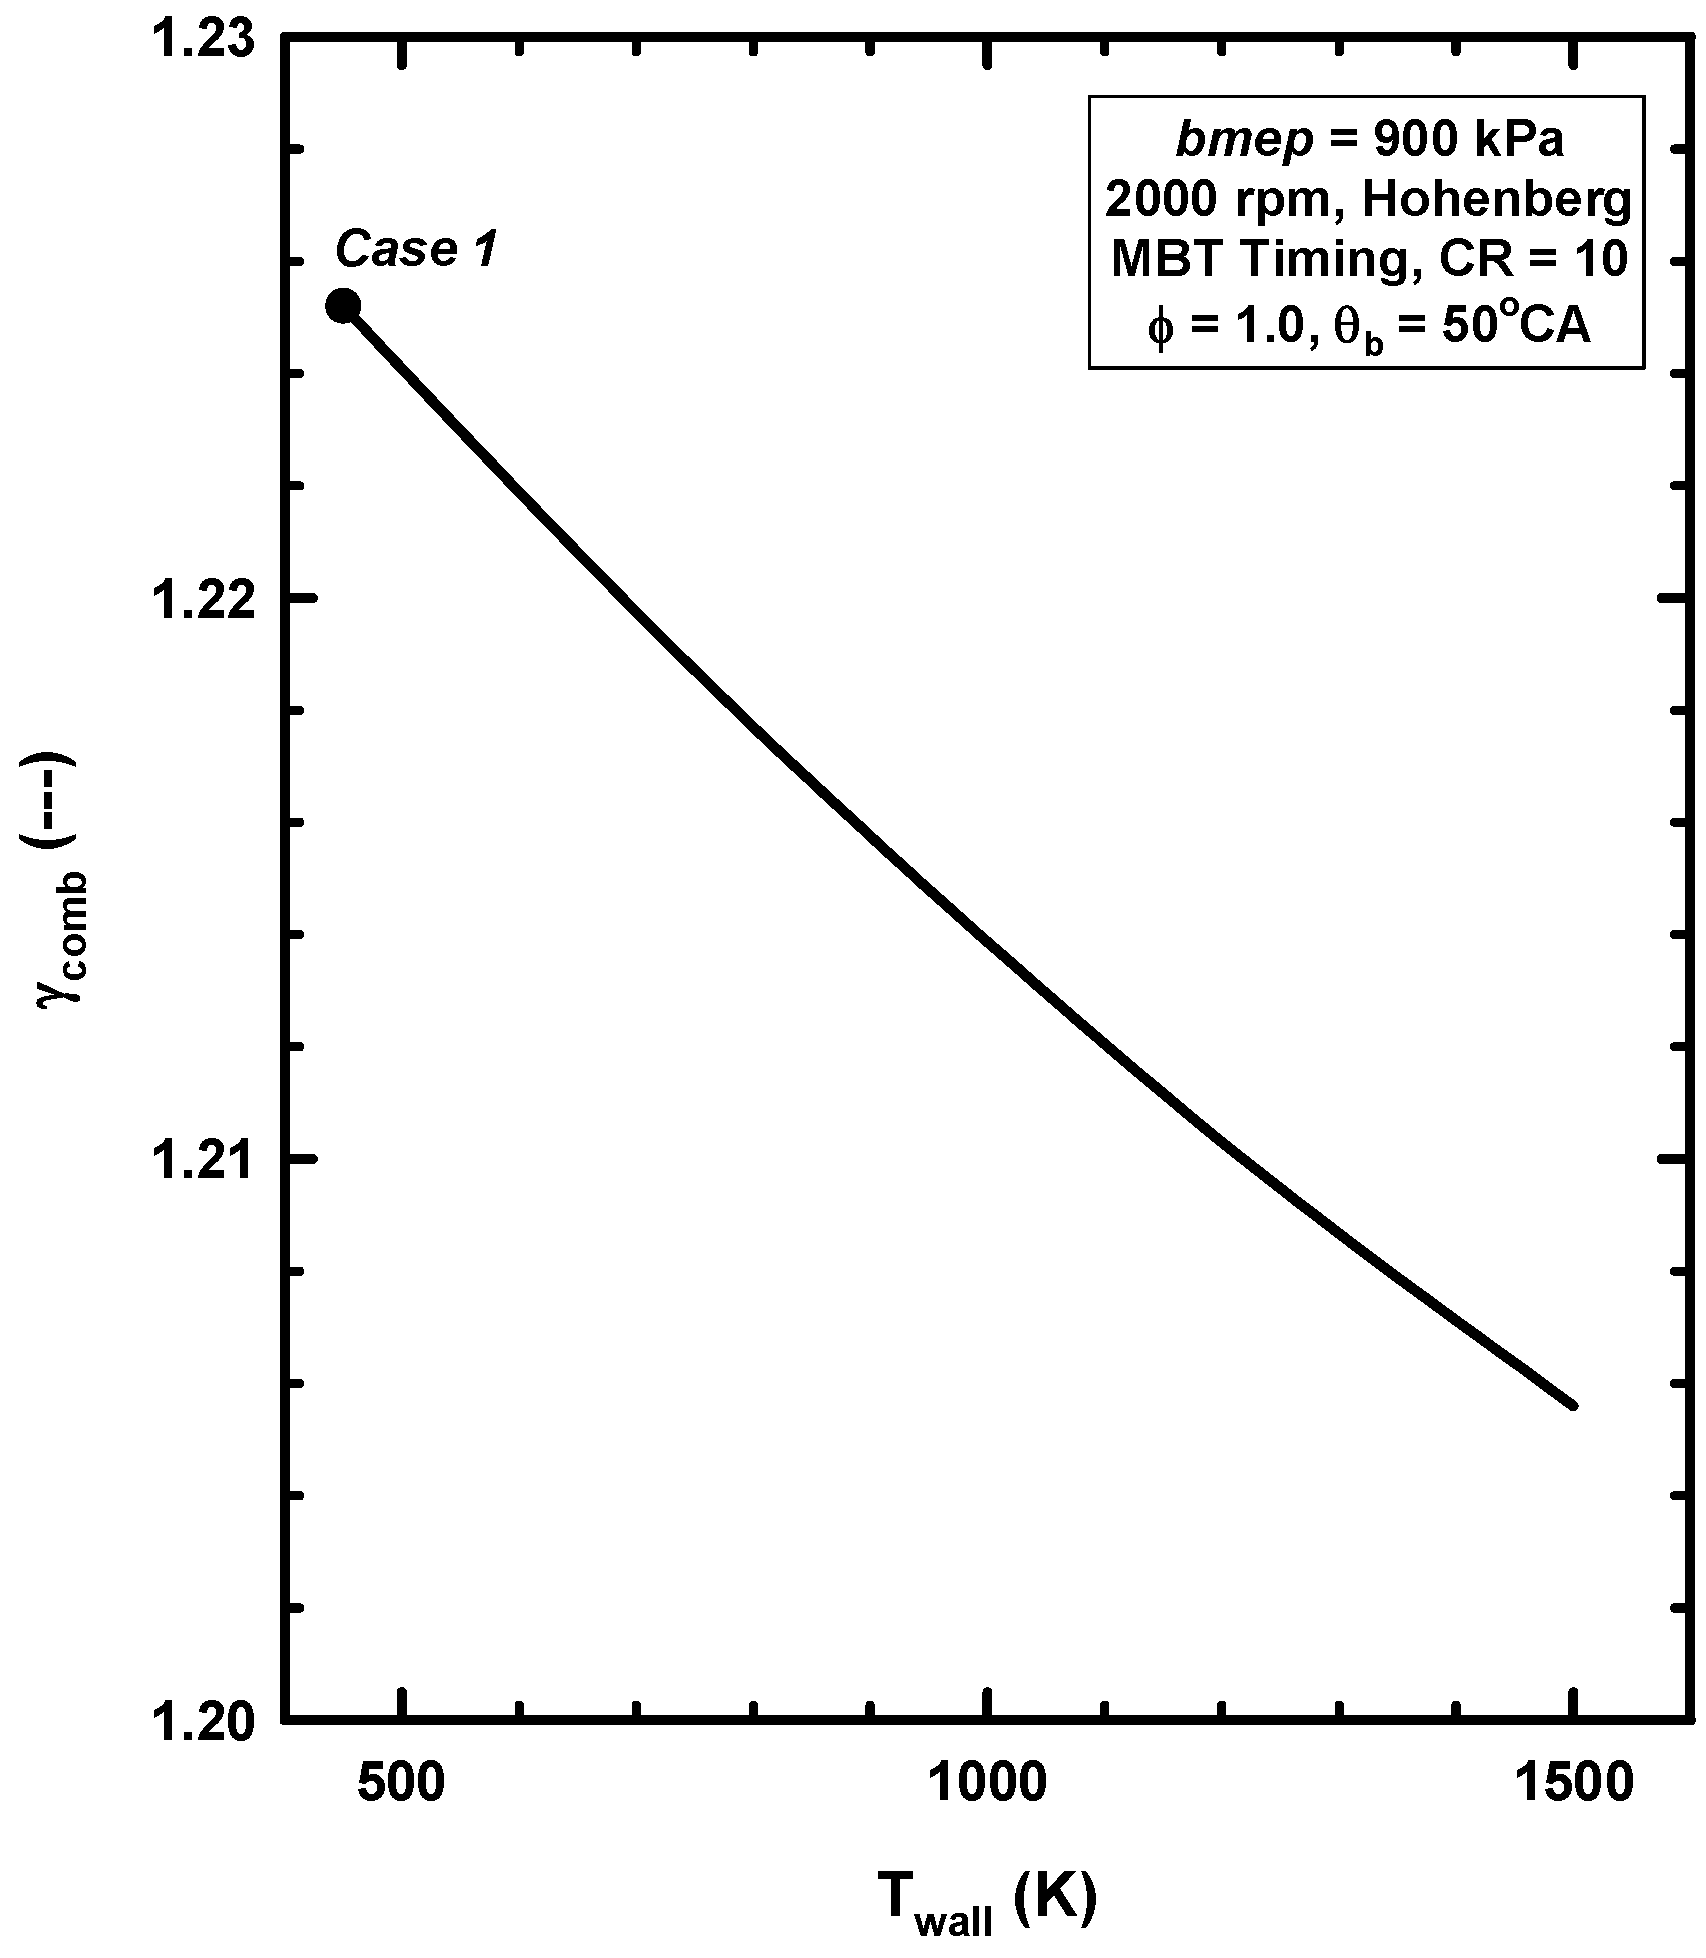
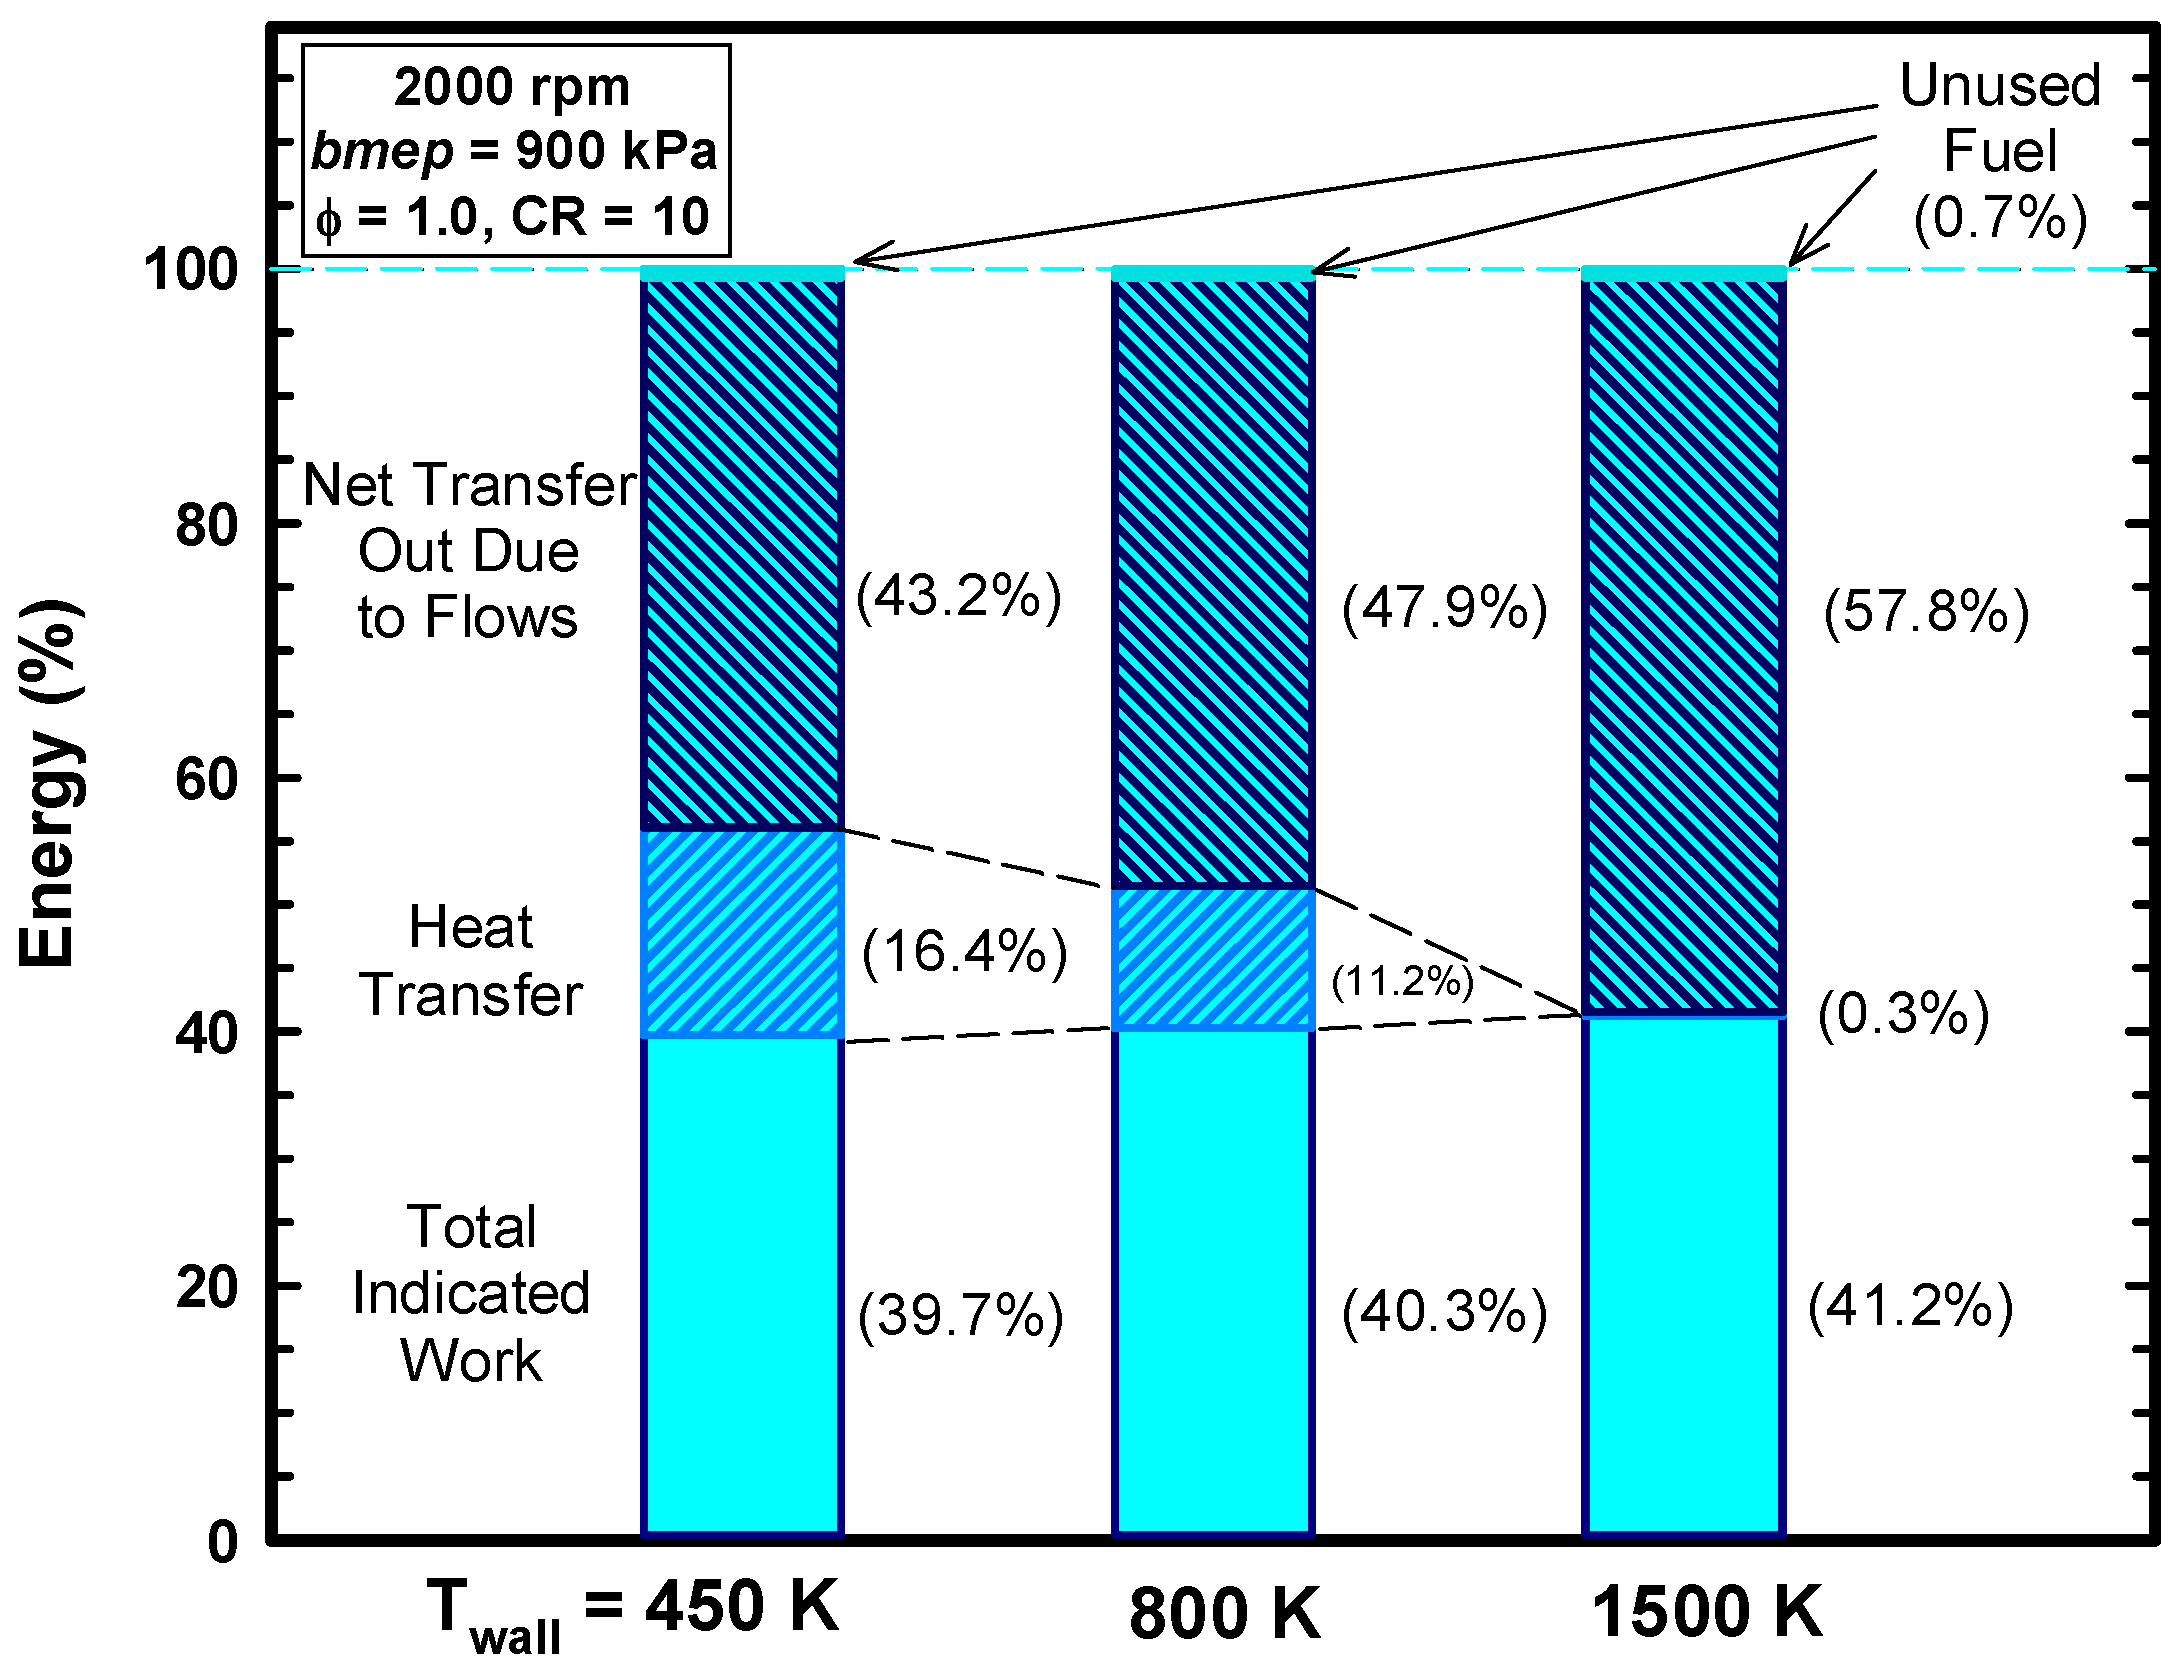
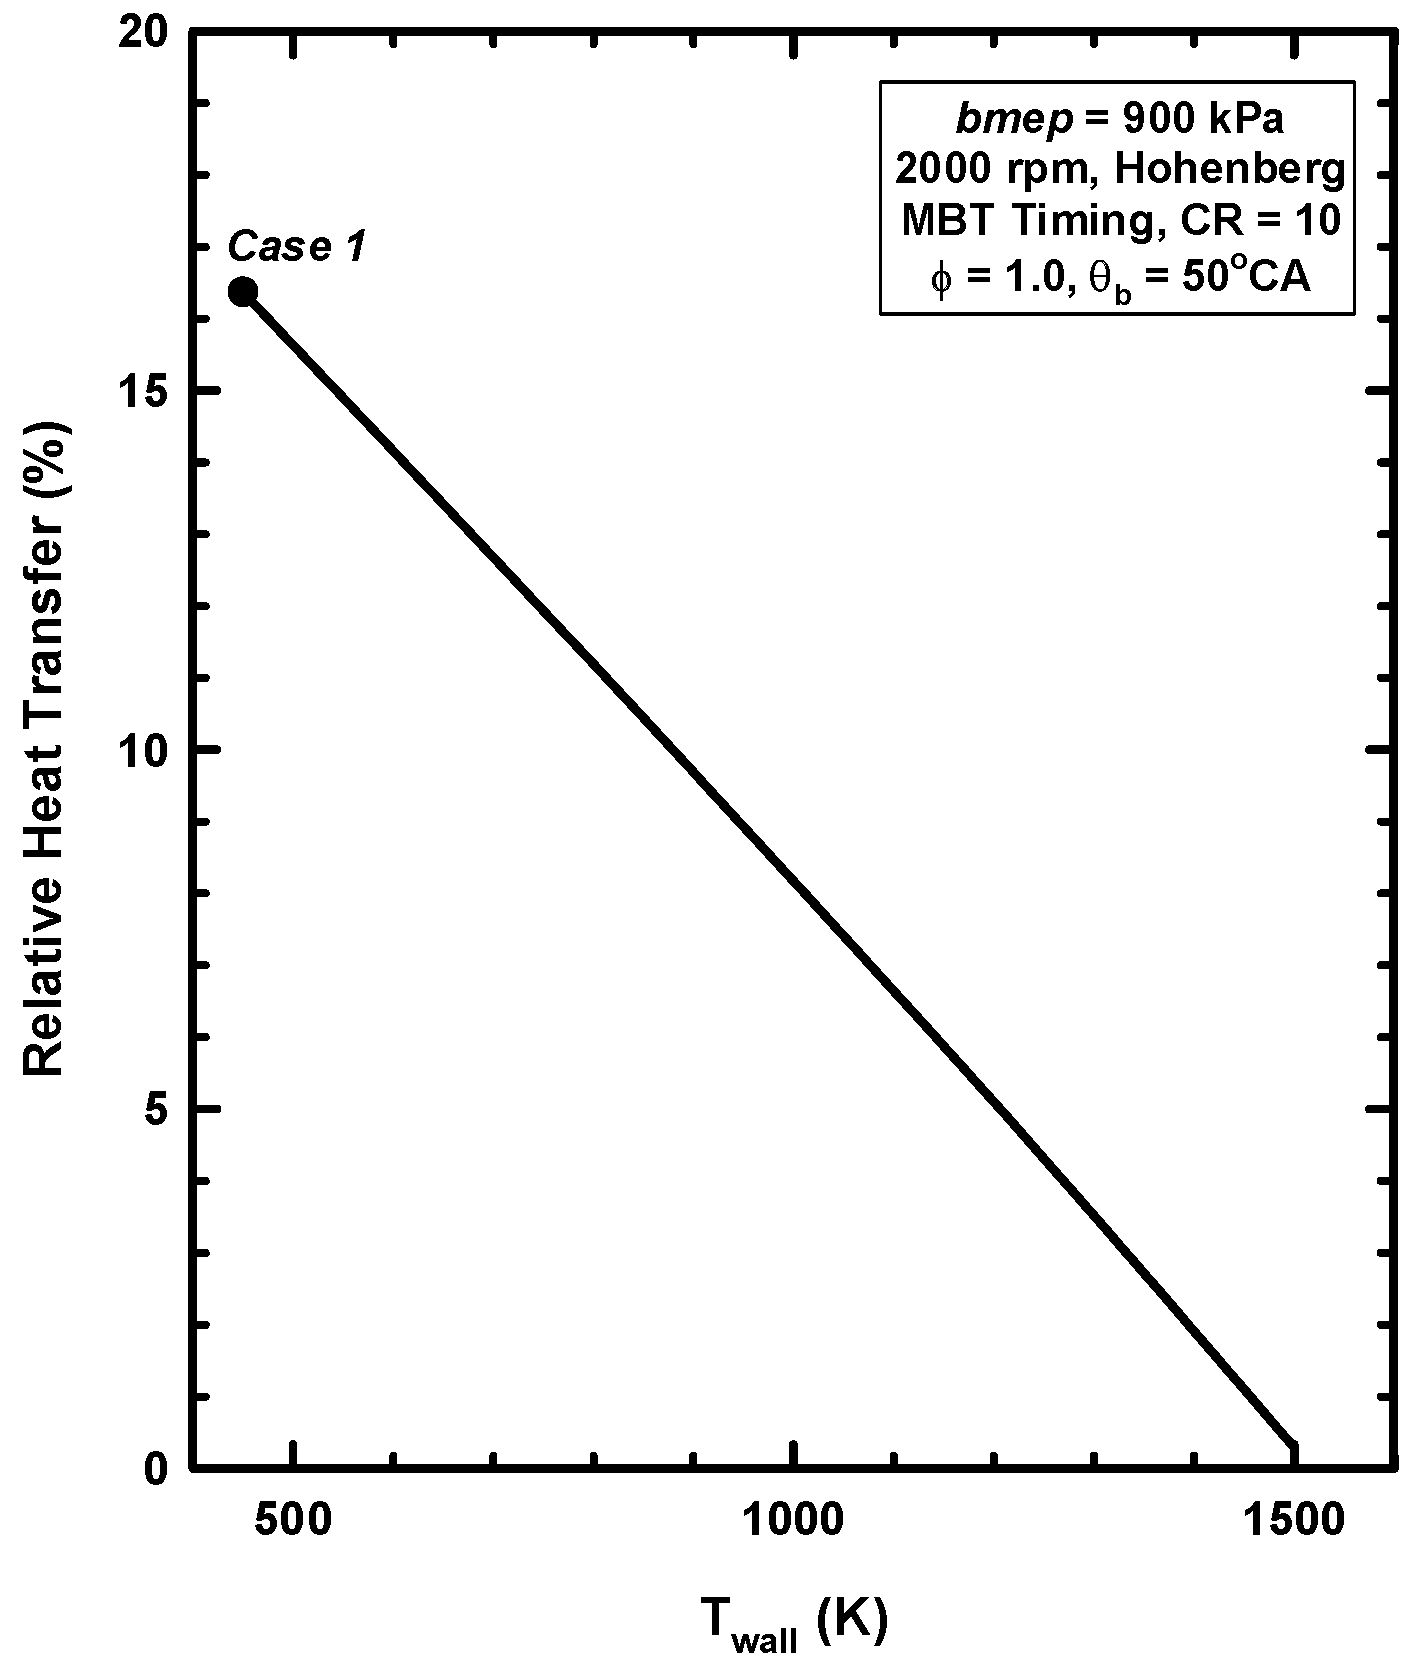
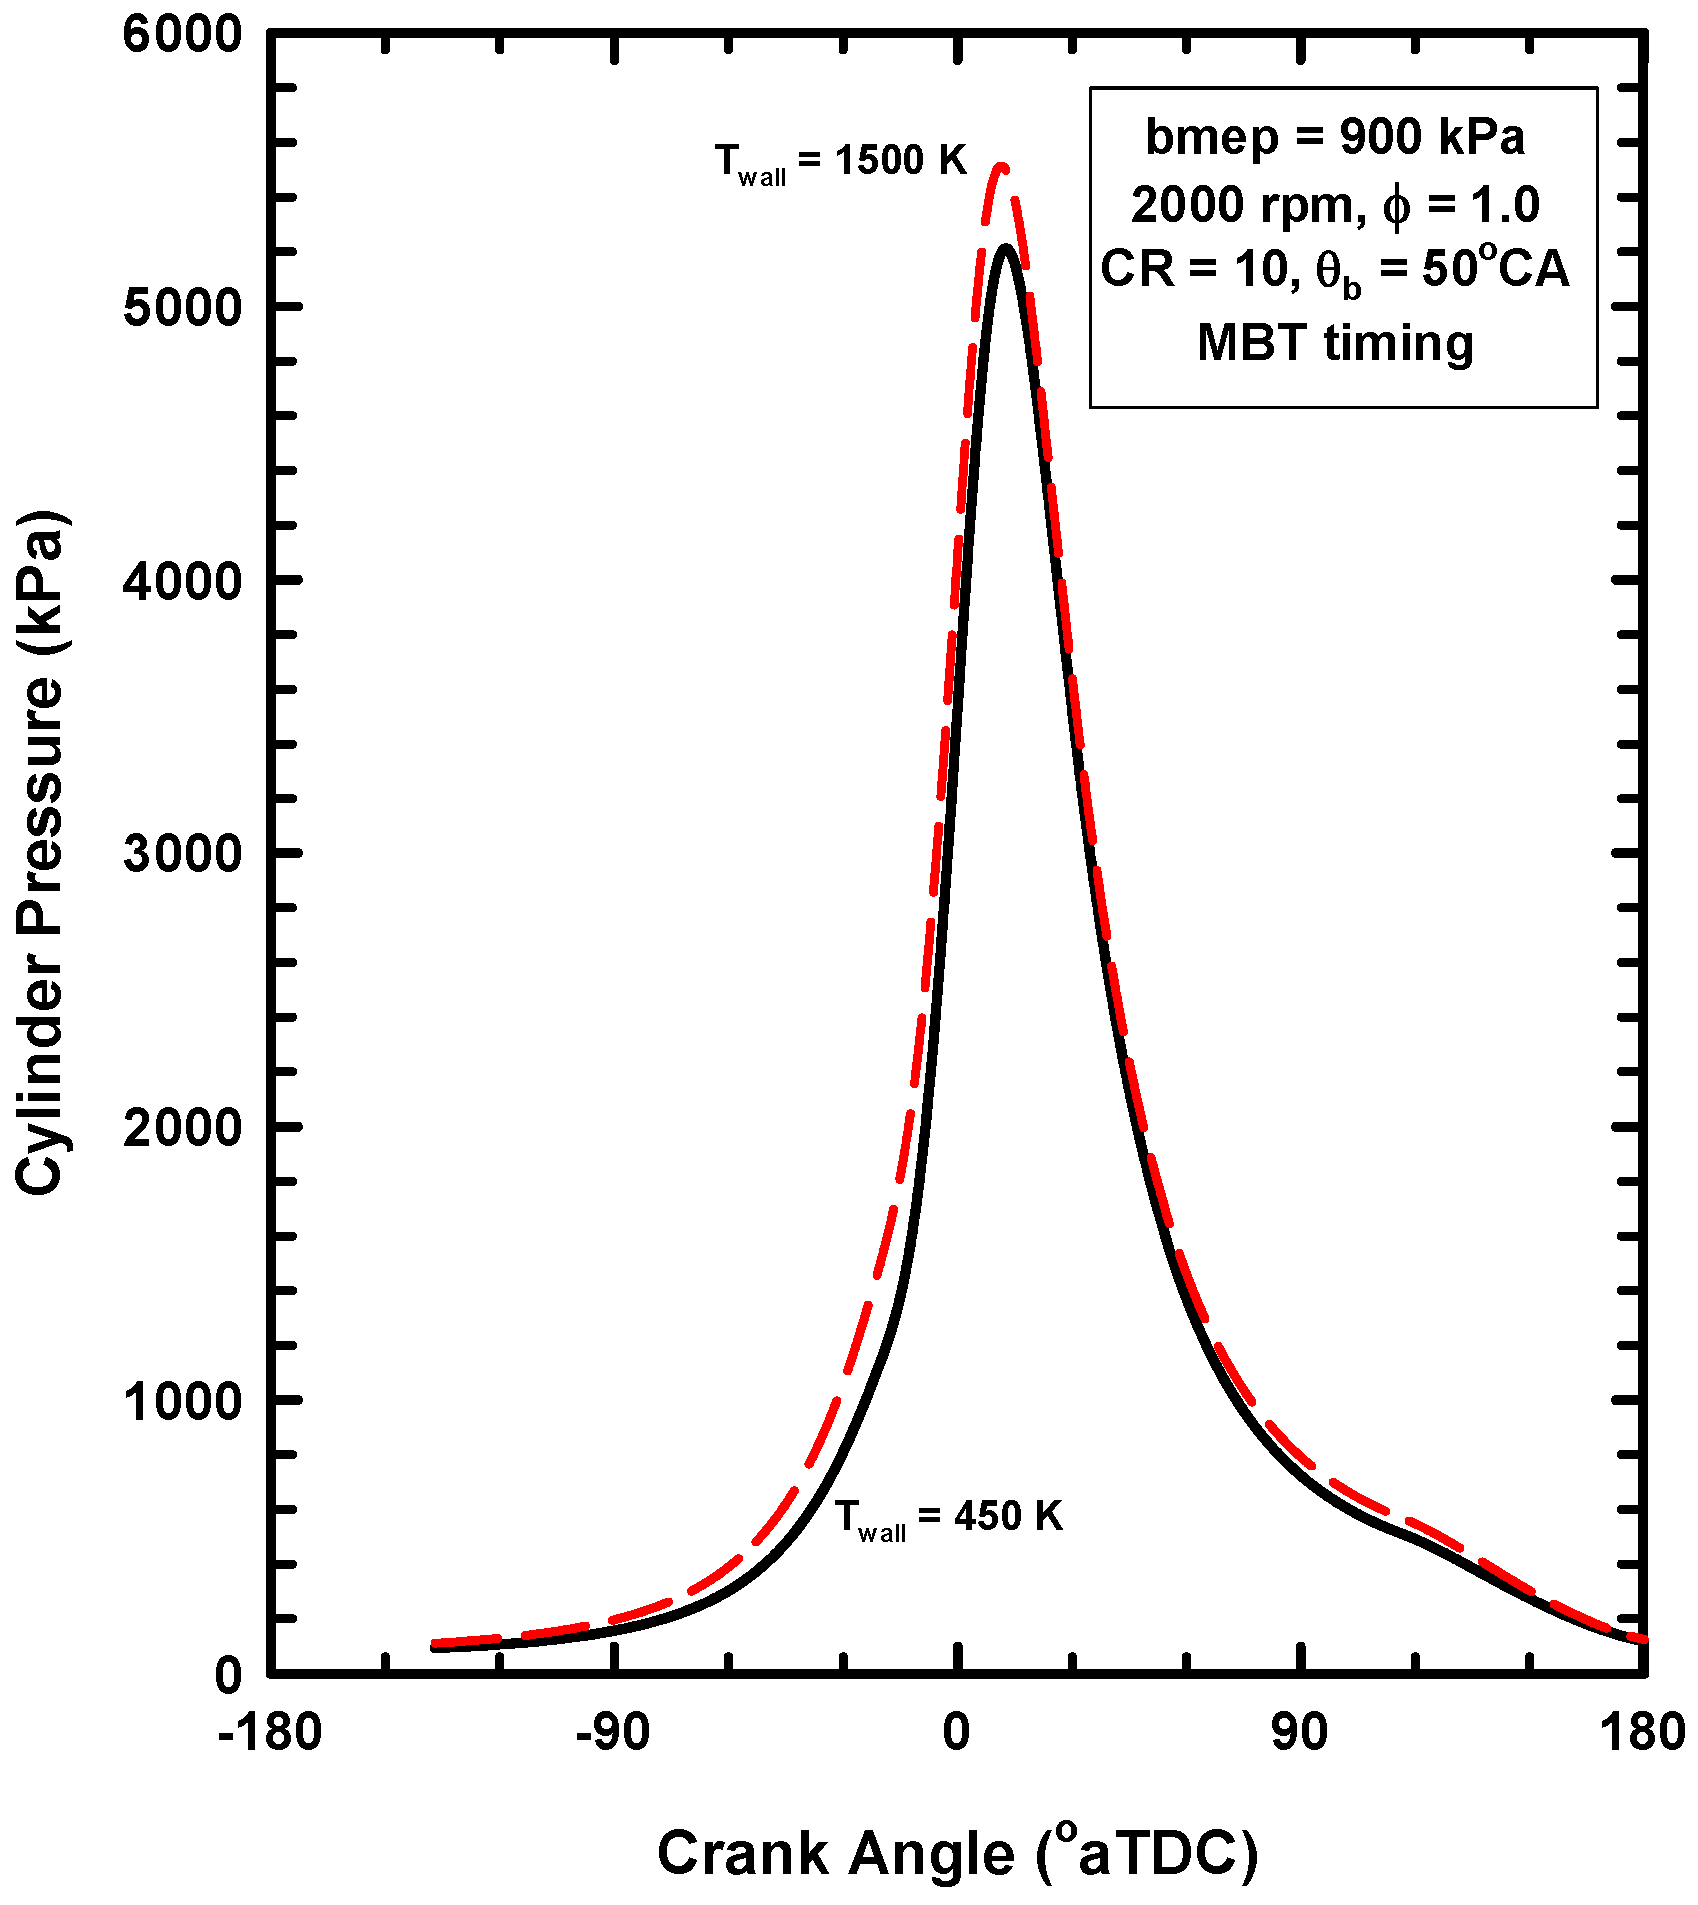
4.2. Results for Increases of the Wall Temperature

Figure 3 shows the relative heat transfer as a function of the cylinder wall temperature. The relative heat transfer is the ratio of the actual heat transfer and fuel energy. The high wall temperatures are not realistic, but the attempt was to capture the trends. The heat transfer decreases in a linear fashion as the wall temperature increases. For a cylinder wall temperature of about 1500 K, the net cylinder heat transfer is near zero. For this high wall temperature, heat transfer is first from the cylinder walls to the gases, and then later in the cycle, the heat transfer is from the gases to the walls. The heat transfer into the cylinder and out of the cylinder is equal, such that the net heat transfer is near zero for a cylinder wall temperature of 1500 K.
Details from the cases with wall temperatures of 450 K (case 1) and 1500 K (case 1a) will now be presented to better illustrate the nature of the LHR engine concept. Table 4 lists some of the inputs and outputs for these two cases. Note that to maintain the constant bmep of 900 kPa, the inlet pressure needed to increase for the high wall temperature case. Also, for the high wall temperature case, the heat transfer is near zero. Figure 4 shows the instantaneous heat transfer as functions of crank angle for the two cases. The higher heat transfer for the lower wall temperature is obvious. The heat transfer is identified as either from the gases to the walls or from the walls to the gases. For the higher wall temperature, heat transfer from the walls to the gases is significant. For the higher wall temperature, the heat transfer from the walls to the gases is equal to the heat transfer from the gases to the walls.
Figure 5 shows the instantaneous average, one-zone gas temperature as functions of crank angle for the two wall temperature cases. For the case of the high wall temperature, the gas temperatures are higher throughout the complete cycle. These higher temperatures are discussed below as part of the reason for the difficulty of achieving higher thermal efficiencies with LHR engine concepts.
Figure 6 shows the instantaneous cylinder pressure as functions of crank angle for the two cases. The cylinder pressures are higher for the high wall temperature case. For the compression process, these higher pressures contribute to higher compression work, which detracts from increasing the efficiencies. For the expansion process, these higher pressures increase the efficiencies. The net result is reflected in the thermal efficiencies—which are described next.
Figure 7 shows the net indicated and brake thermal efficiencies as functions of the wall temperature. The efficiencies increase nearly linearly as the wall temperature increases. As the wall temperature increased from 450 to 1500 K, the relative heat transfer decreased about 16% (absolute). For this change in the wall temperature, however, the net indicated and brake efficiencies increased only about 1.5% and 1.3% (absolute), respectively. This small increase of the efficiencies relative to the greater decrease of the heat loss is consistent with the cited literature above that demonstrated similar results in numerous experiments. The thermodynamic reasons for this are explained below.
Figure 8 shows the average of gamma (the ratio of specific heats) as a function of the cylinder wall temperature. Due to the increasing temperatures, gamma decreases from about 1.225 to 1.206 as the cylinder wall temperature increases. Although a small change of gamma, this contributes to the difficulty of converting the thermal energy to work. In other words, low heat rejection engine concepts have the disadvantage of decreasing gamma values, which causes less thermal energy to be converted to work. In the subsection concerning the ideal Otto cycle, this aspect of the importance of gamma is illustrated.
For completeness, Figure 9 and Figure 10 show the partition of the fuel energy and exergy, respectively, for three cylinder wall temperatures. As the wall temperature increases, the energy and exergy of the heat transfer decreases, the indicated work increases slightly, and the energy of the exhaust increases. As mentioned above, the exergy destroyed during the combustion process decreases as the gas temperatures increase.

4.3. Reasons for Negligible Efficiency Increases

For an explanation of the efficiency results (Figure 7), this discussion will consider the two cases with wall temperatures of 450 K (case 1) and 1500 K (case 1a). The following items are responsible for limiting the increase of the thermal efficiencies when the net heat transfer is reduced to near zero.
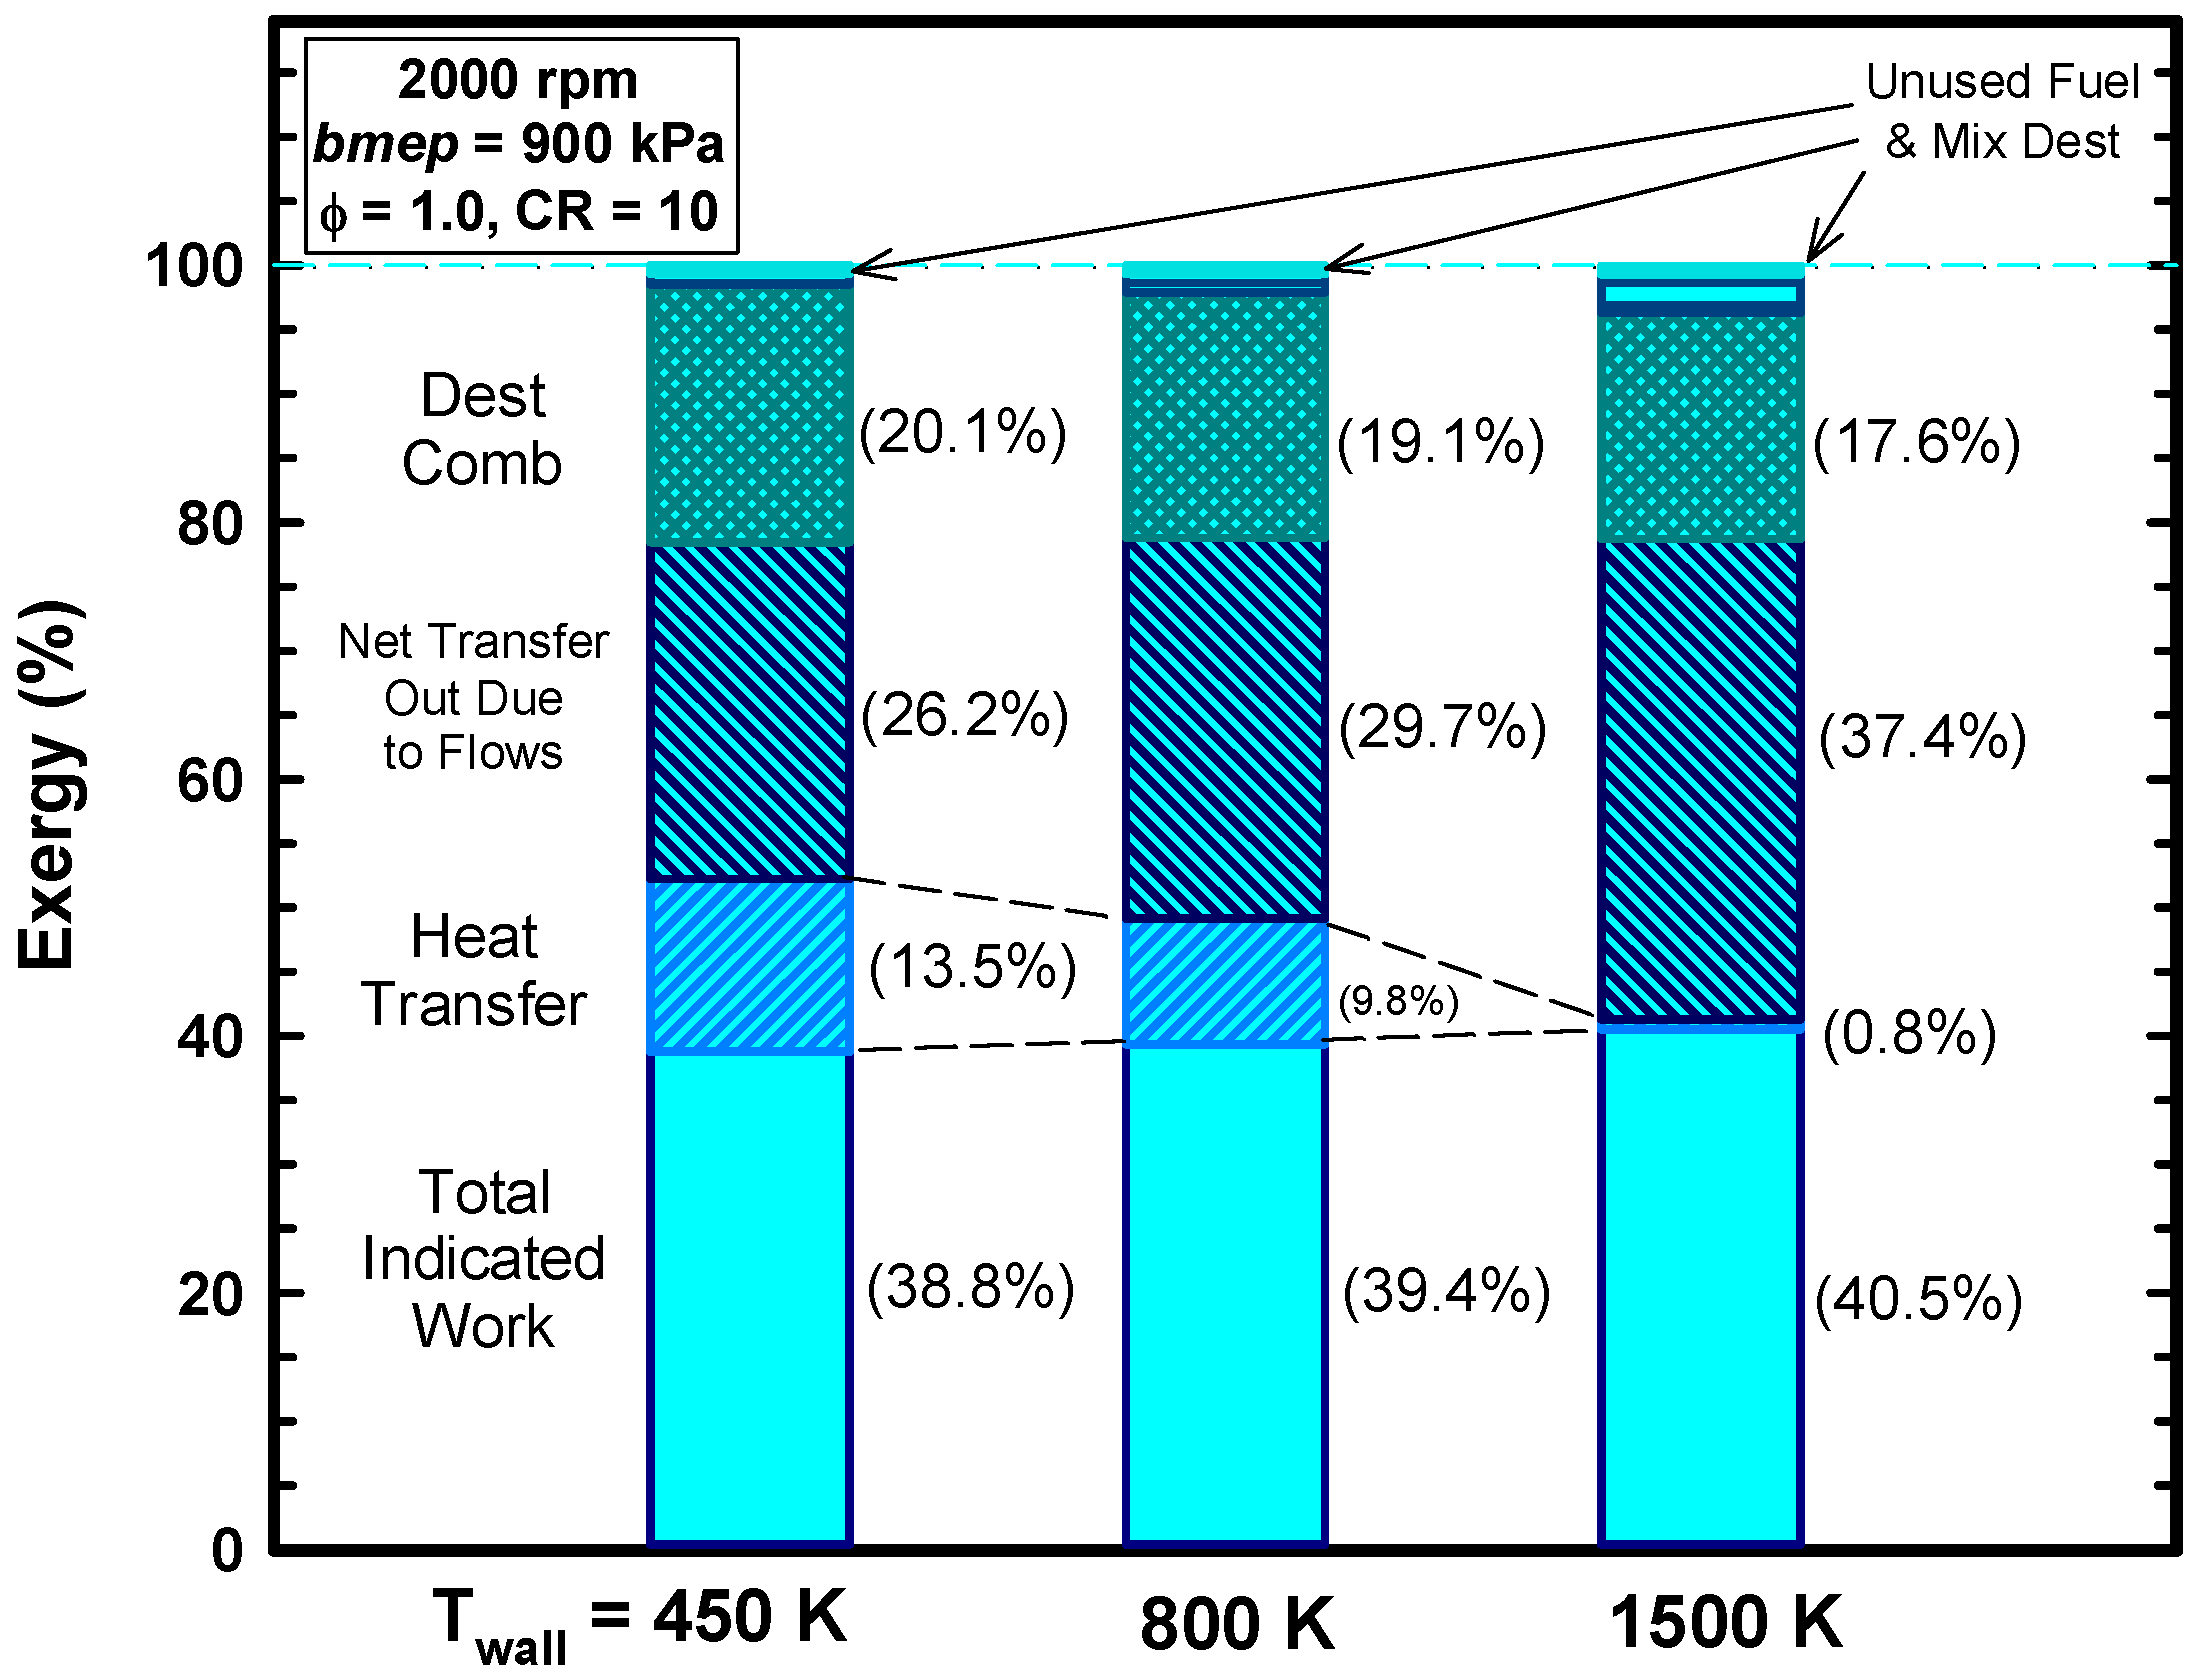
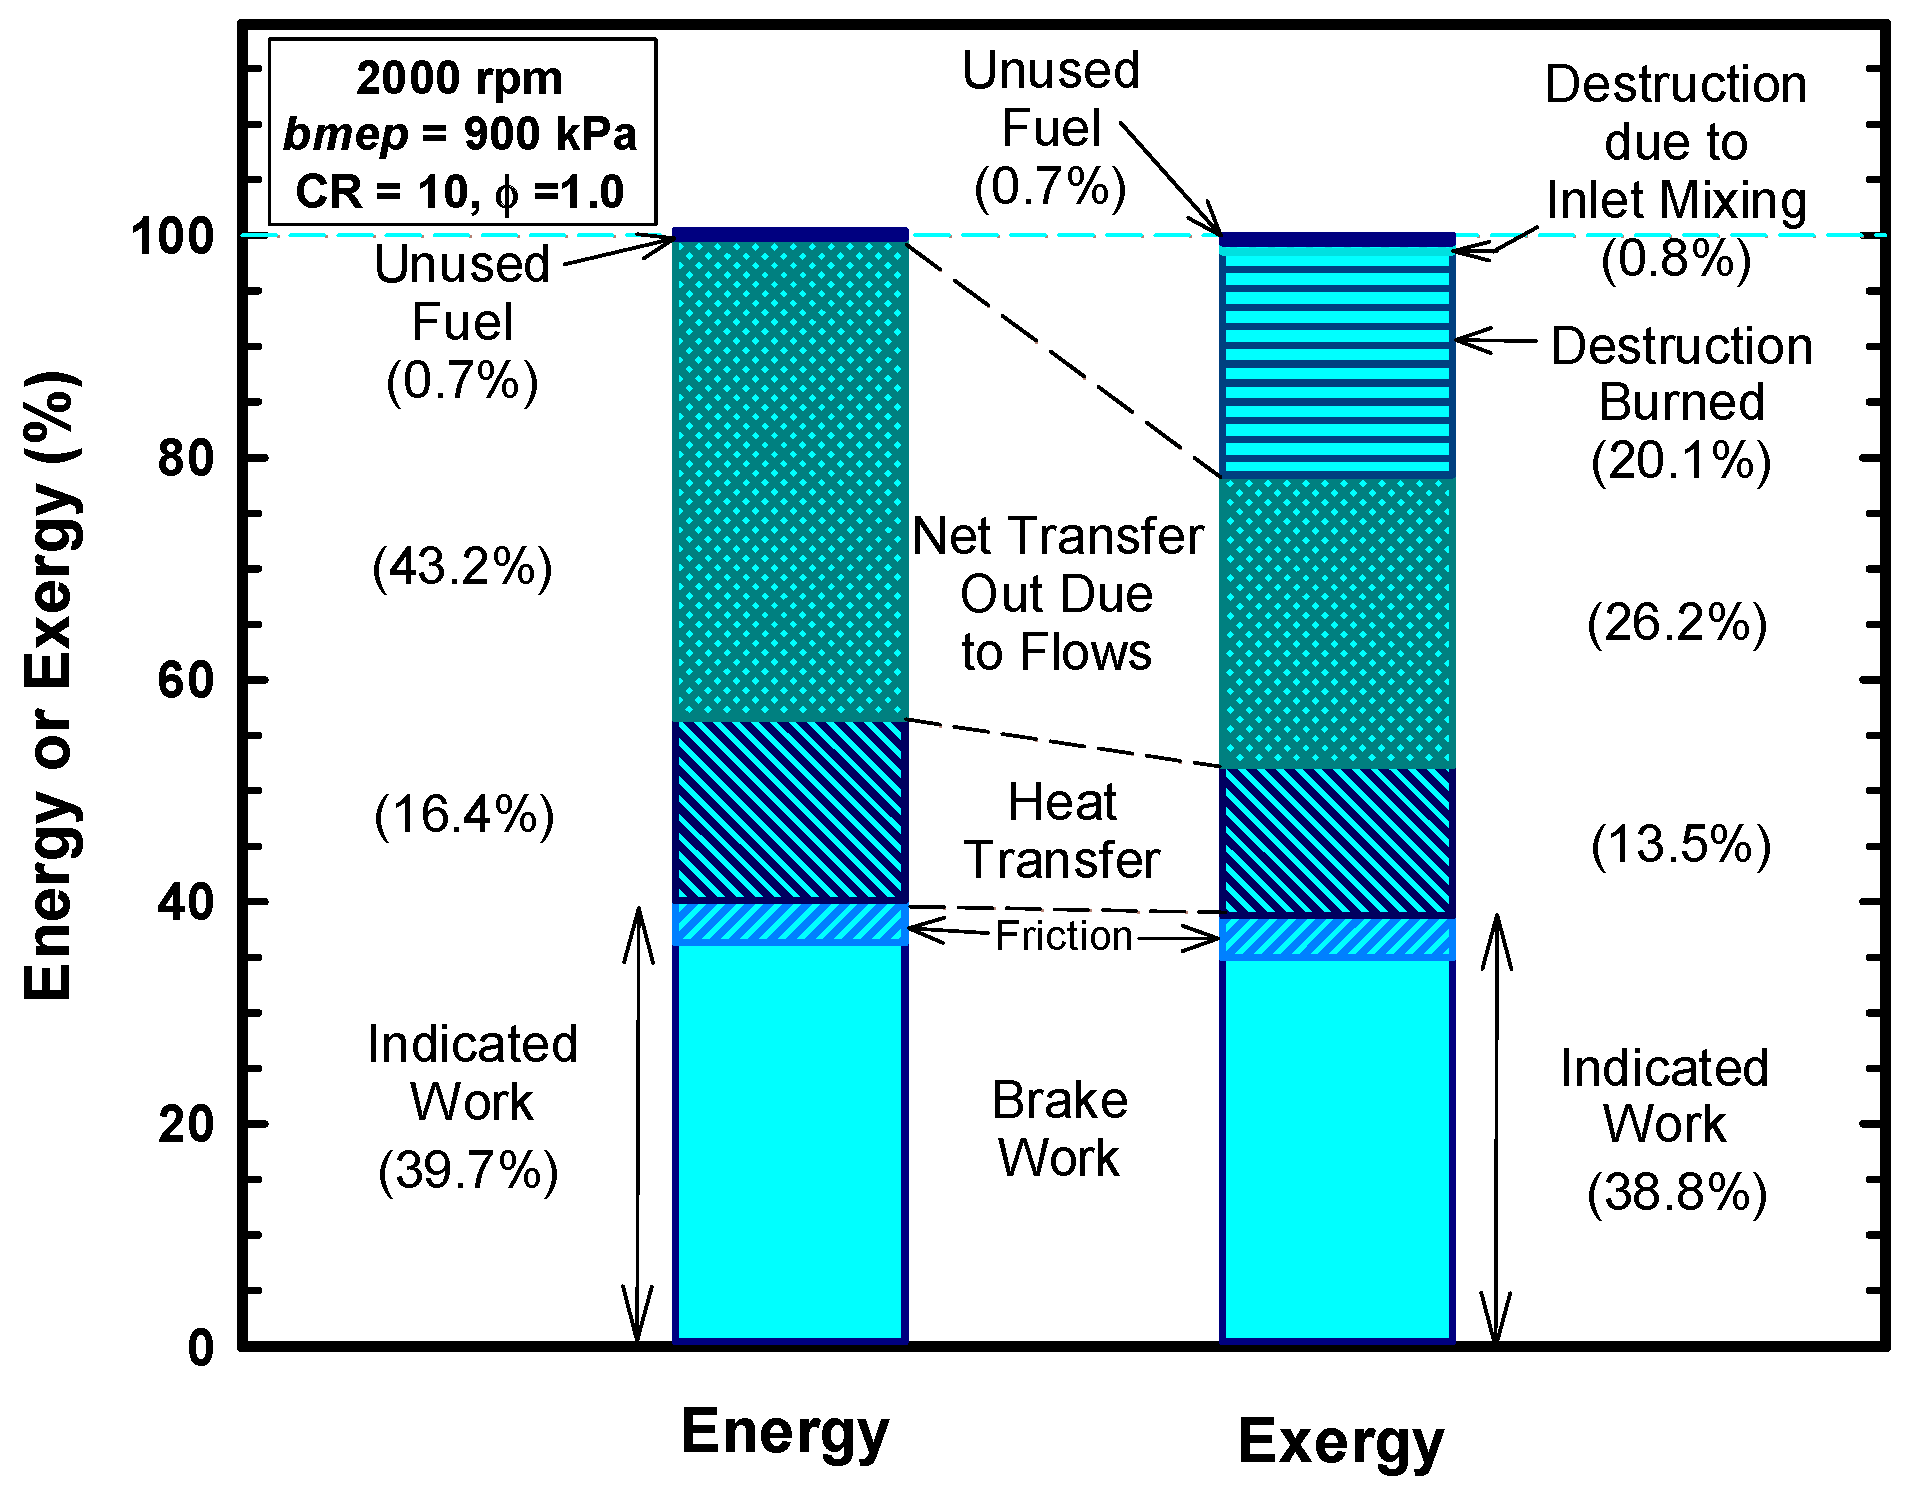
  • Not all the heat energy is available to do work. The total exergy of the heat transfer is about 13% (as opposed to the 16% based on energy).
  • Some of the preserved heat transfer is during compression. This increases compression pressures and causes additional compression work, which negates some of the gains during the expansion.
  • The volumetric efficiency decreases slightly for the high cylinder wall temperature case due to the higher gas temperatures.
  • Only the heat transfer preserved near TDC will contribute to additional expansion work.
  • Only a fraction of the preserved thermal energy near TDC can be converted to work.
  • As shown above, gamma decreases due to the higher temperatures for the high cylinder wall temperature case. This decreases the conversion of thermal energy to work.
  • For this case, the exhaust gas temperature increases from about 1310 K for the 450 K case to about 1600 K for the 1500 K case (Table 4). This is evidence that a considerable amount of the energy preserved remains in the gases.
  • Due to the higher gas temperatures, the exergy destroyed during the combustion process is reduced from 20.1% to 17.6% (Table 4). This improvement is offset by the items mentioned above.
The following is a quantitative estimate of how the preserved thermal energy contributes to additional work. First, only the 13% of the heat transfer energy is available (exergy) for work production (Figure 2). As mentioned above, only a portion of this is available near TDC. If 30% of this exergy is available near TDC, this means about 4% of the exergy could be converted to work. The efficiency is a measure of thermal energy conversion to work—say this is about 40%. This results in about 1.6% (absolute) thermal efficiency gain due to the reduction of the heat transfer, which is in rough agreement with the results presented above.
Finally, the above discussion considered the unrealistic cylinder wall temperature of 1500 K. Any actual implementation of a LHR engine design will operate at lower wall temperatures. This means any actual gains will be near zero and essentially impossible to separate from experimental uncertainties. This then, explains the thermodynamics related to trying to improve engine efficiency by reducing the cylinder heat transfer.
Although the LHR engine concept is not particularly effective for increasing thermal efficiencies, this concept does convert energy that originally would be part of the heat loss to energy in the exhaust. The energy in the exhaust may be useful for items such as turbocharging or aiding in heating exhaust system emission control devices. In addition, energy in the exhaust may justify exhaust gas energy recovery devices such as those related to turbo-compounding.
The results presented above are not unique to case 1 engine operating conditions. Similar analyses were completed for other conditions, and the results were comparable.

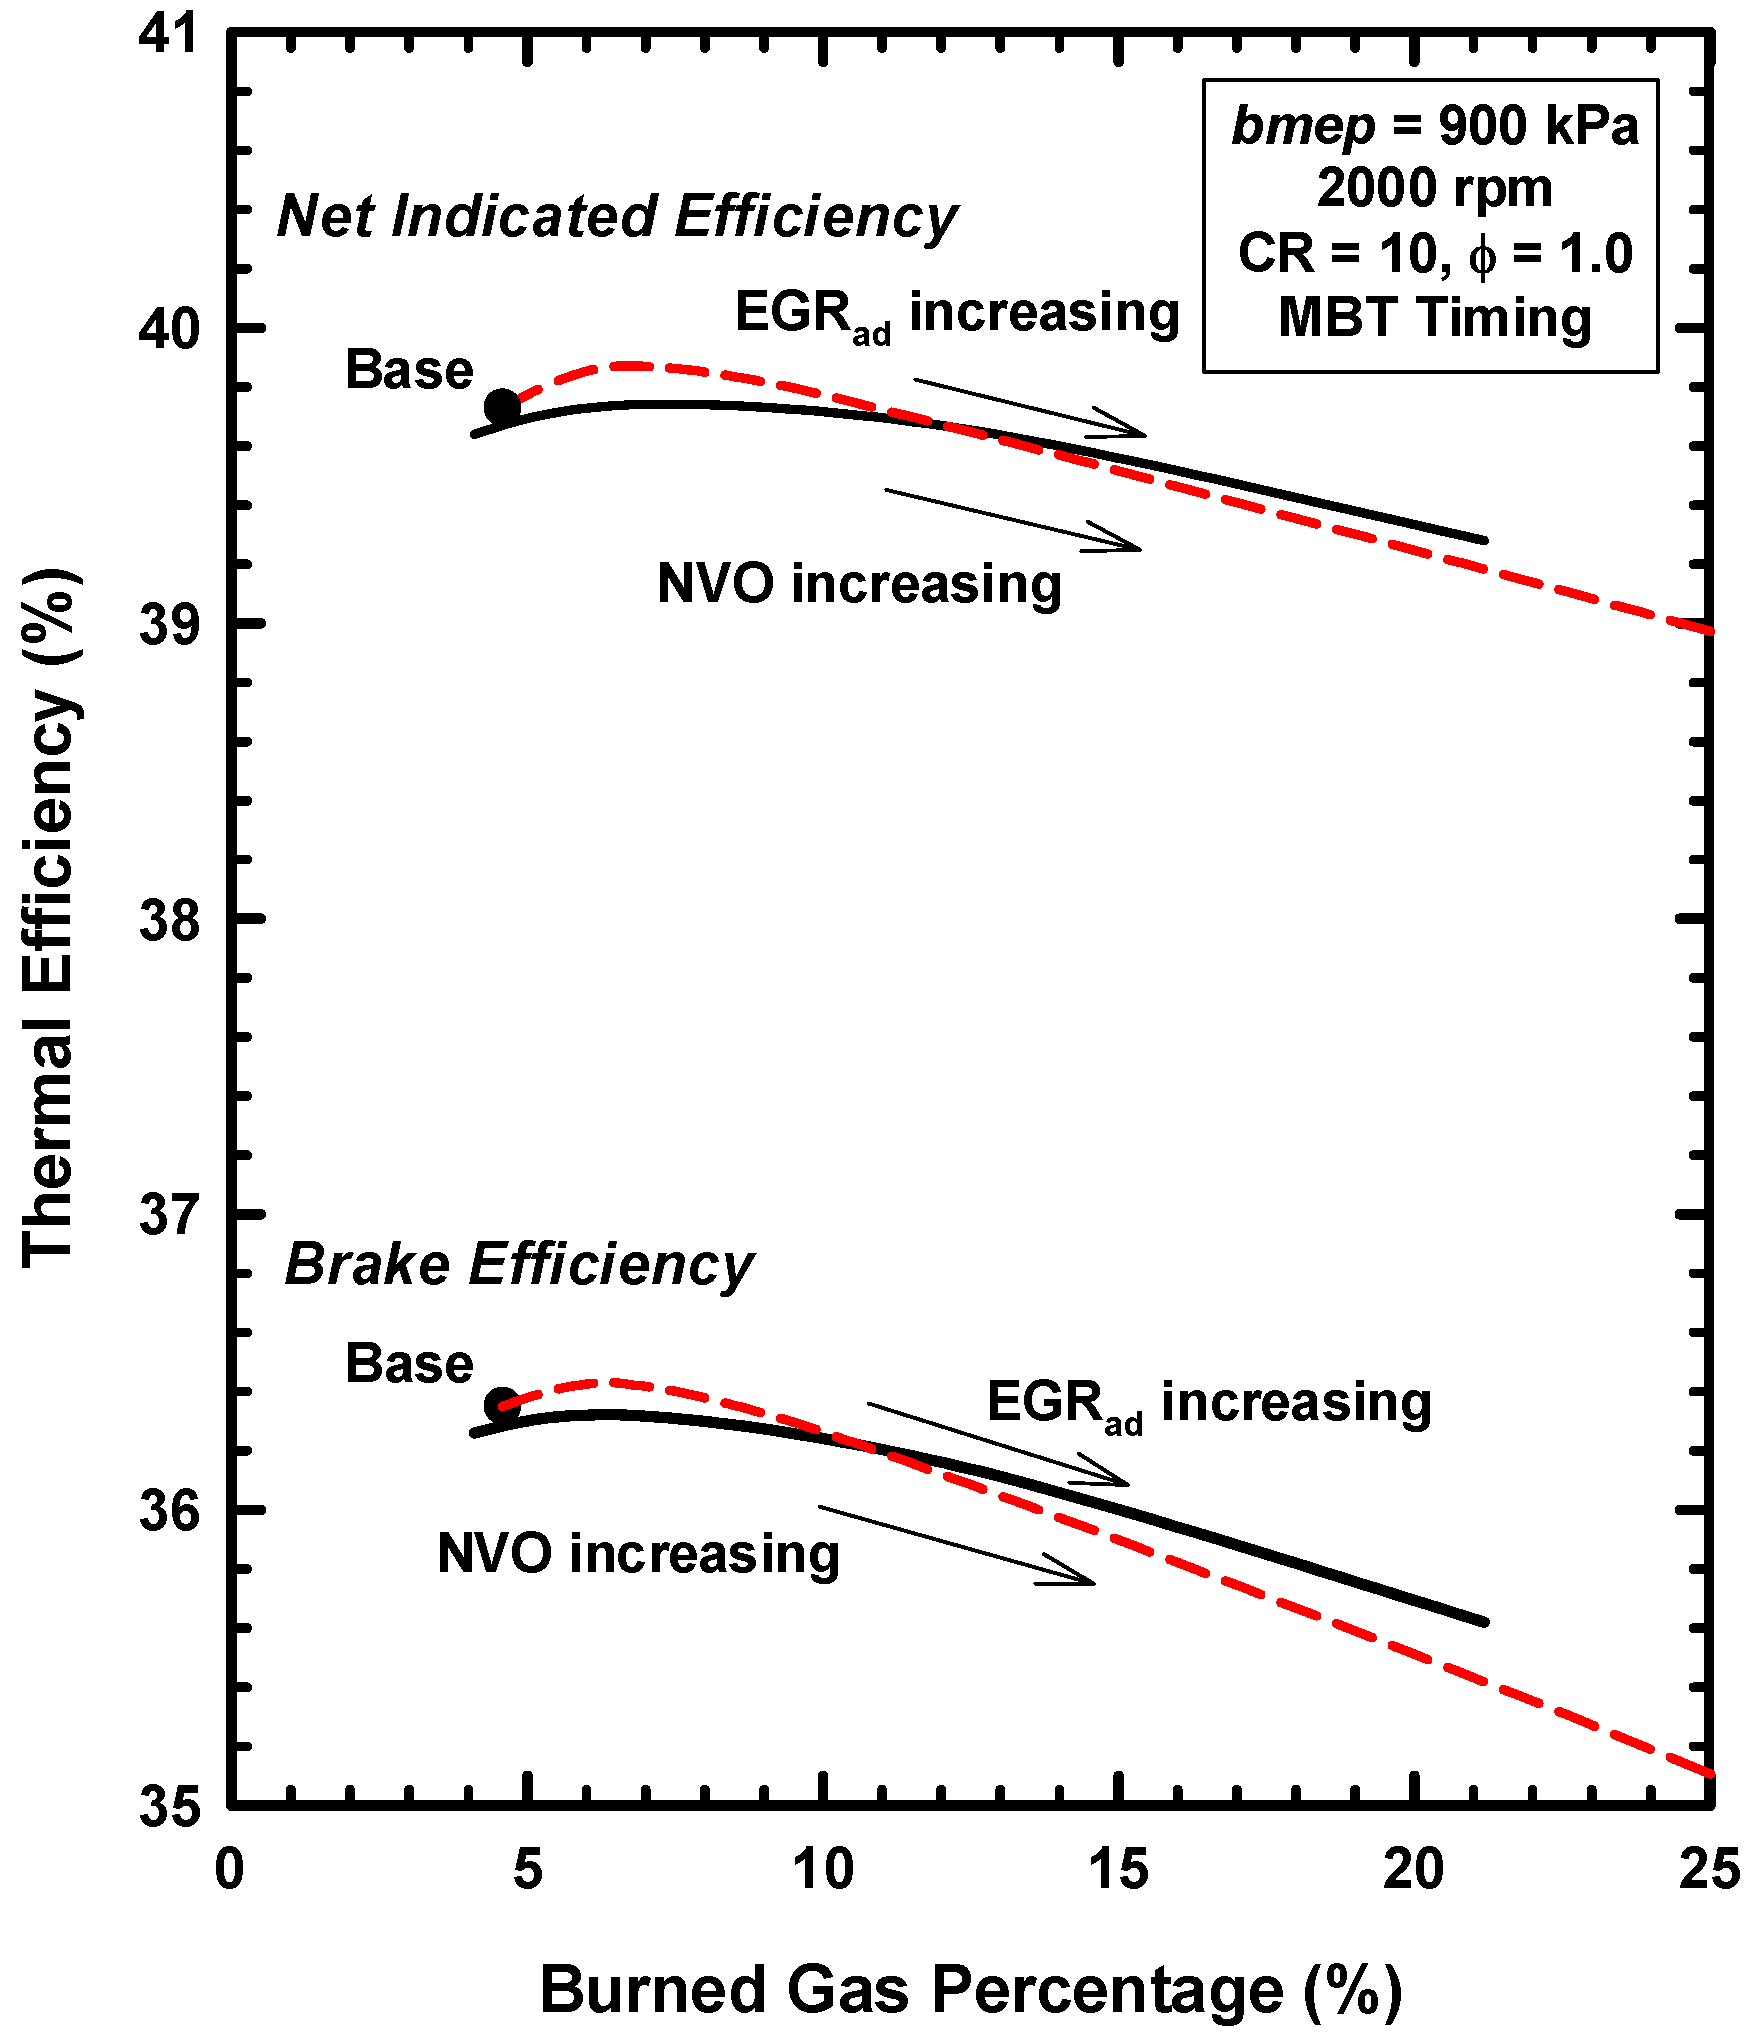
5. Example Two: Thermodynamics of Exhaust Gas Dilution

5.1. Introduction

Investigations of exhaust gases as diluent for IC engines have a long history. For example, Berger et al. [23] reported on engine operation in mines in which the inlet mixture was contaminated with exhaust gases. Miller et al. [24] reported on the use of exhaust gases as part of the inlet mixture to minimize knock. Perhaps the most widely known use of exhaust gas dilution is to suppress nitric oxide formation. Some of the first work on this topic was reported by Kopa and Kimura [25] and by Kopa et al. [26]. This work and work that has followed have shown the dramatic effectiveness of exhaust gas dilution to reduce nitric oxides.
This subsection will examine the thermodynamics associated with the use of exhaust gas dilution. Exhaust gas dilution may be accomplished by mixing a portion of the exhaust gases with the entering fuel–air mixture via external piping, or the exhaust gases may be retained in the cylinder via the selection of certain valve timings. The use of the external approach is known as exhaust gas recirculation (EGR). Both of these approaches supply a level of dilution, but the processes are different. Each of these approaches is discussed in the following.

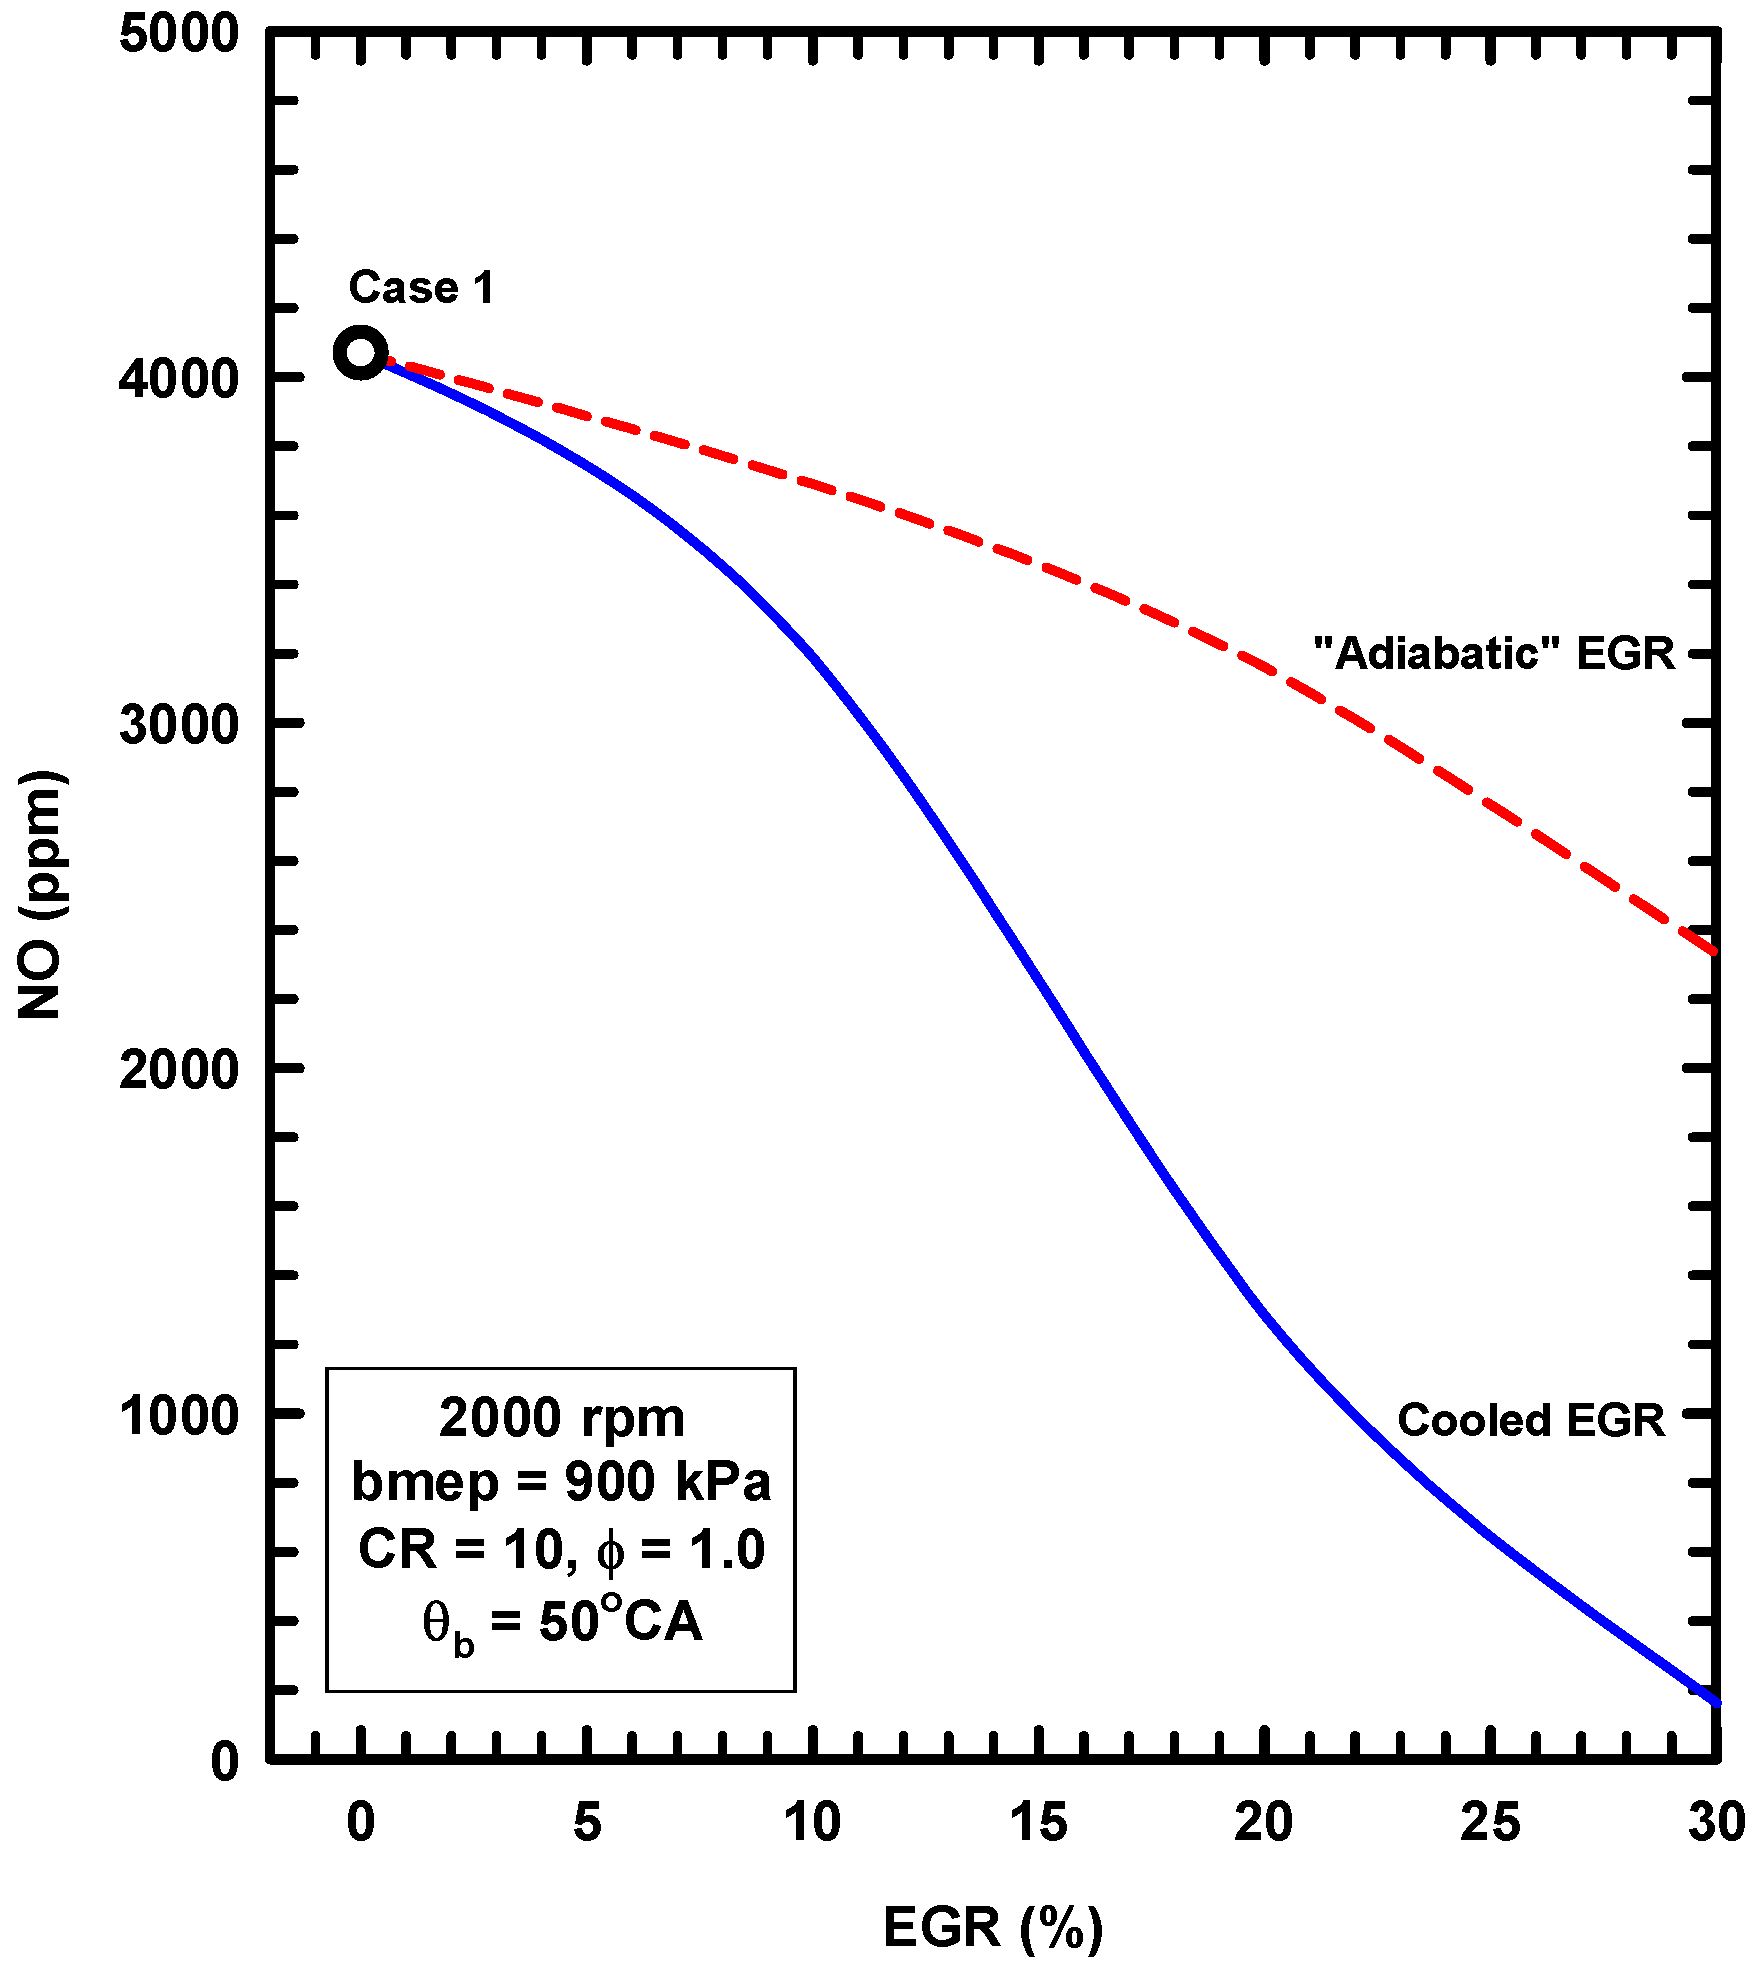
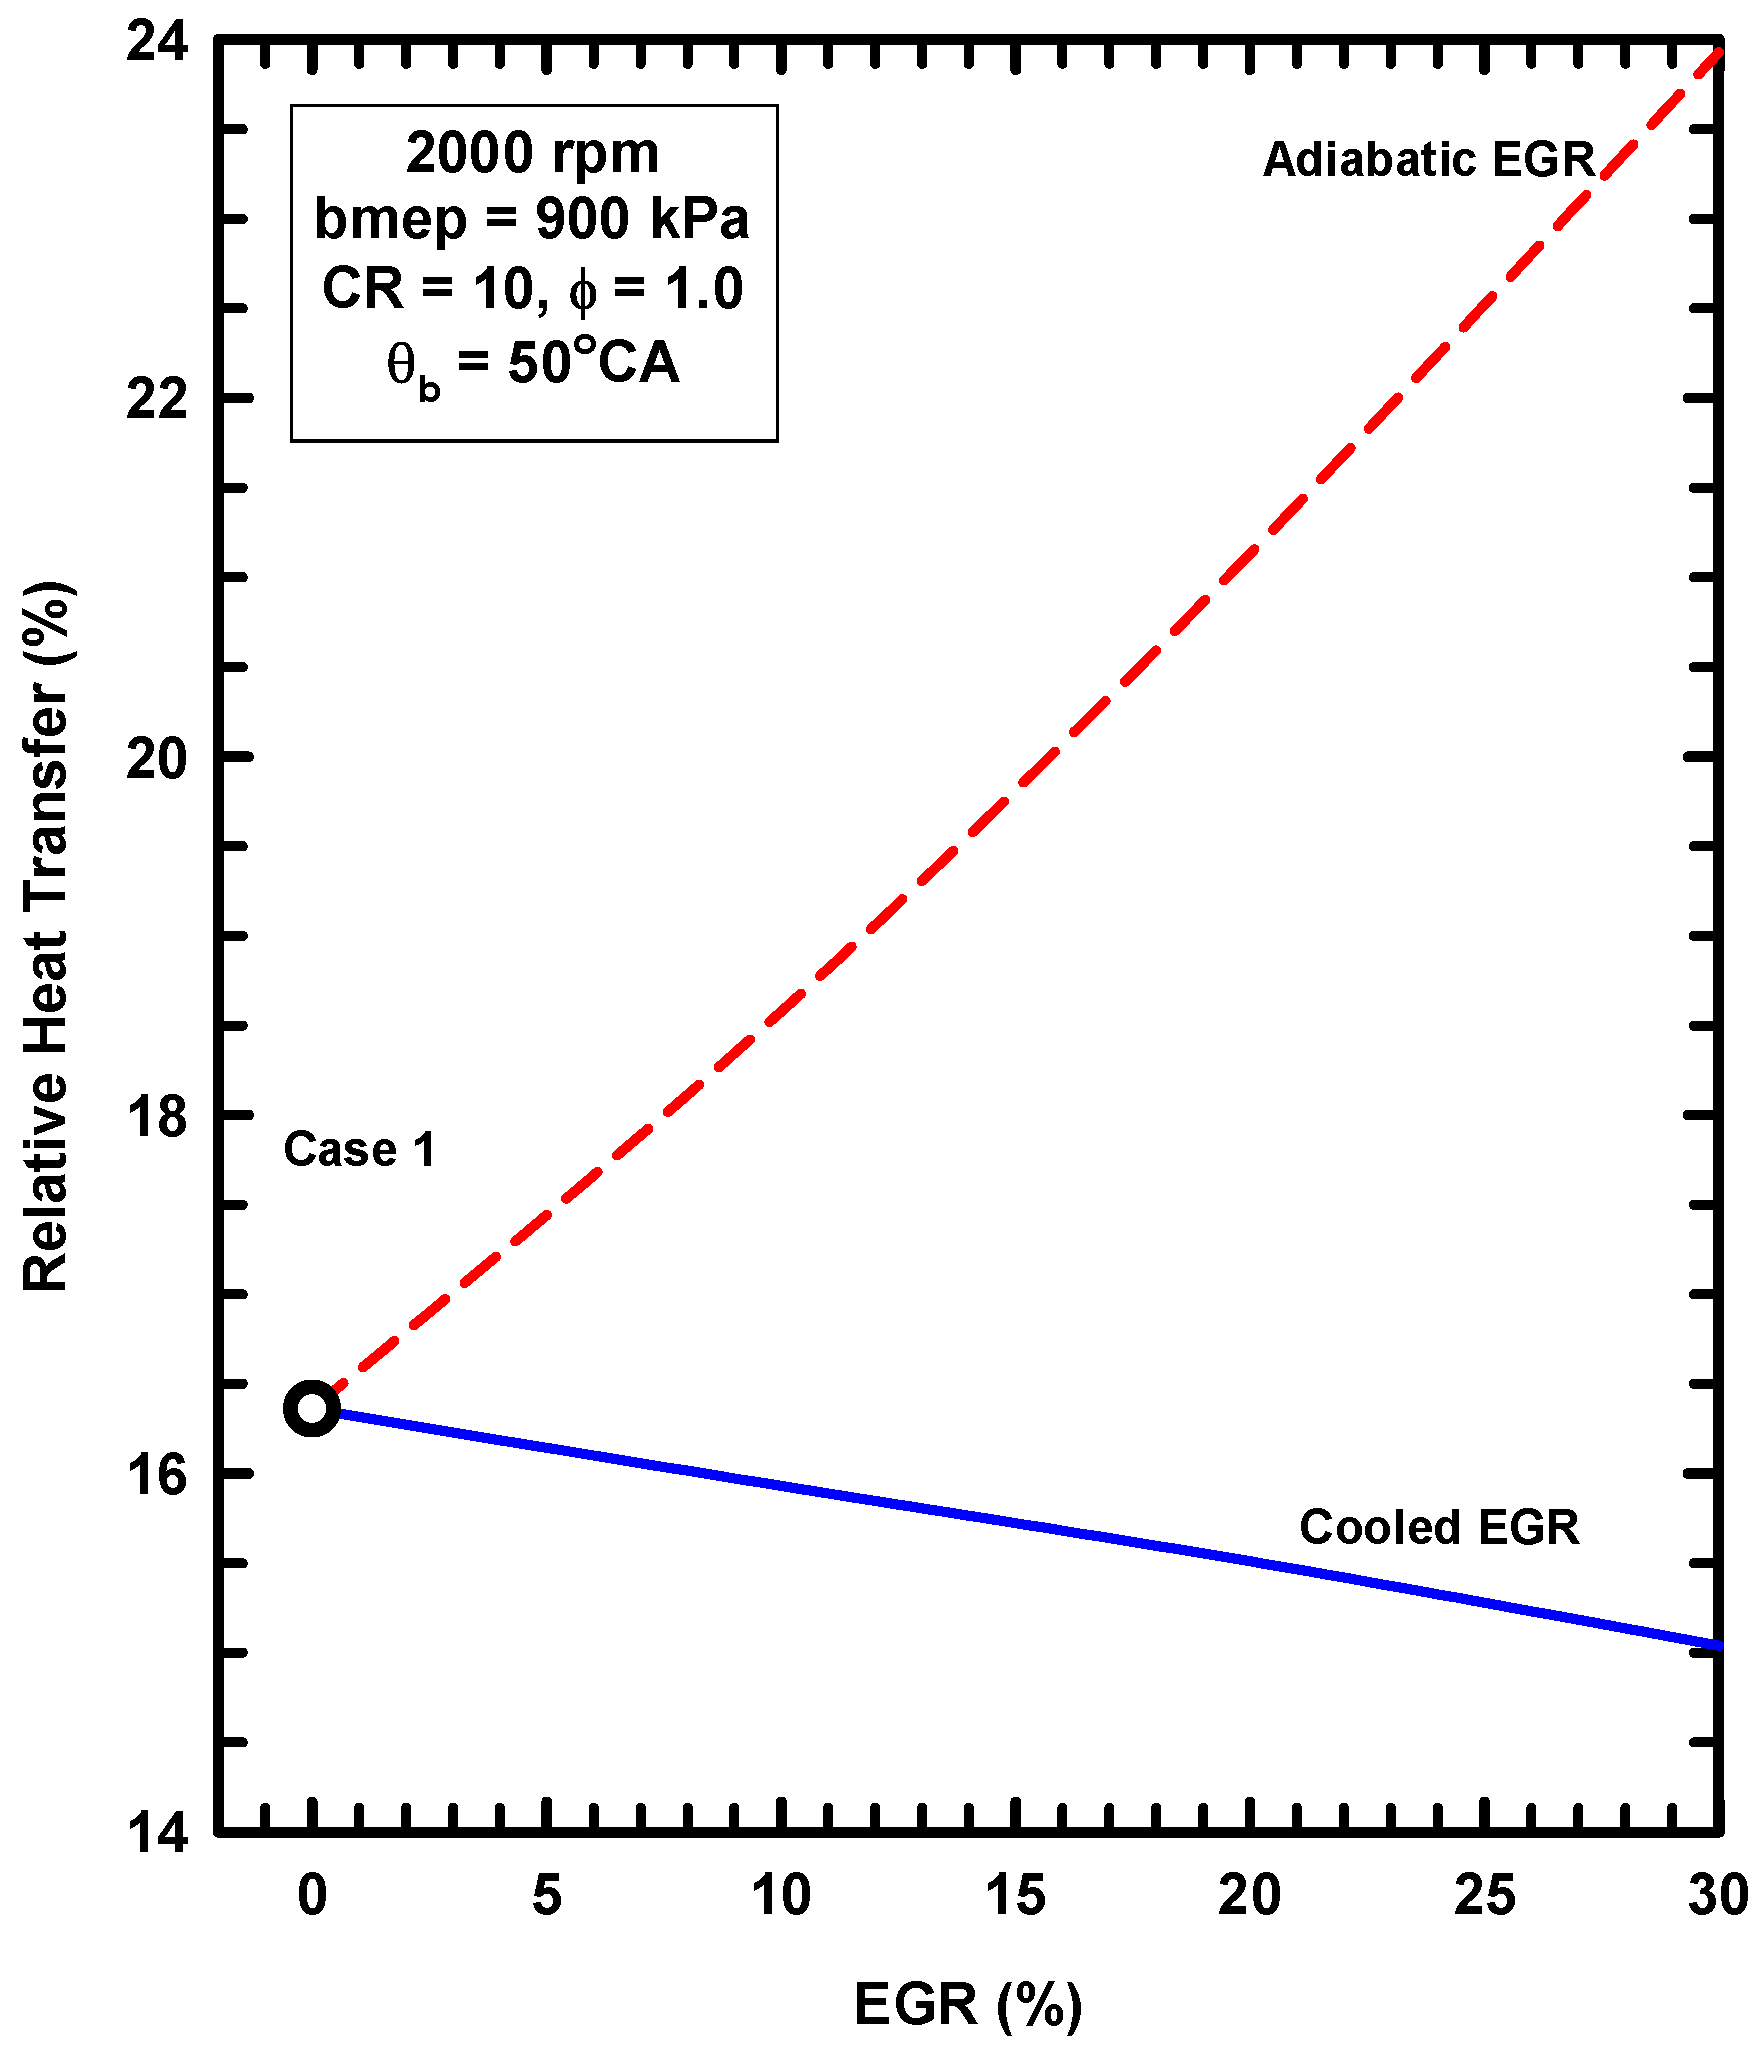
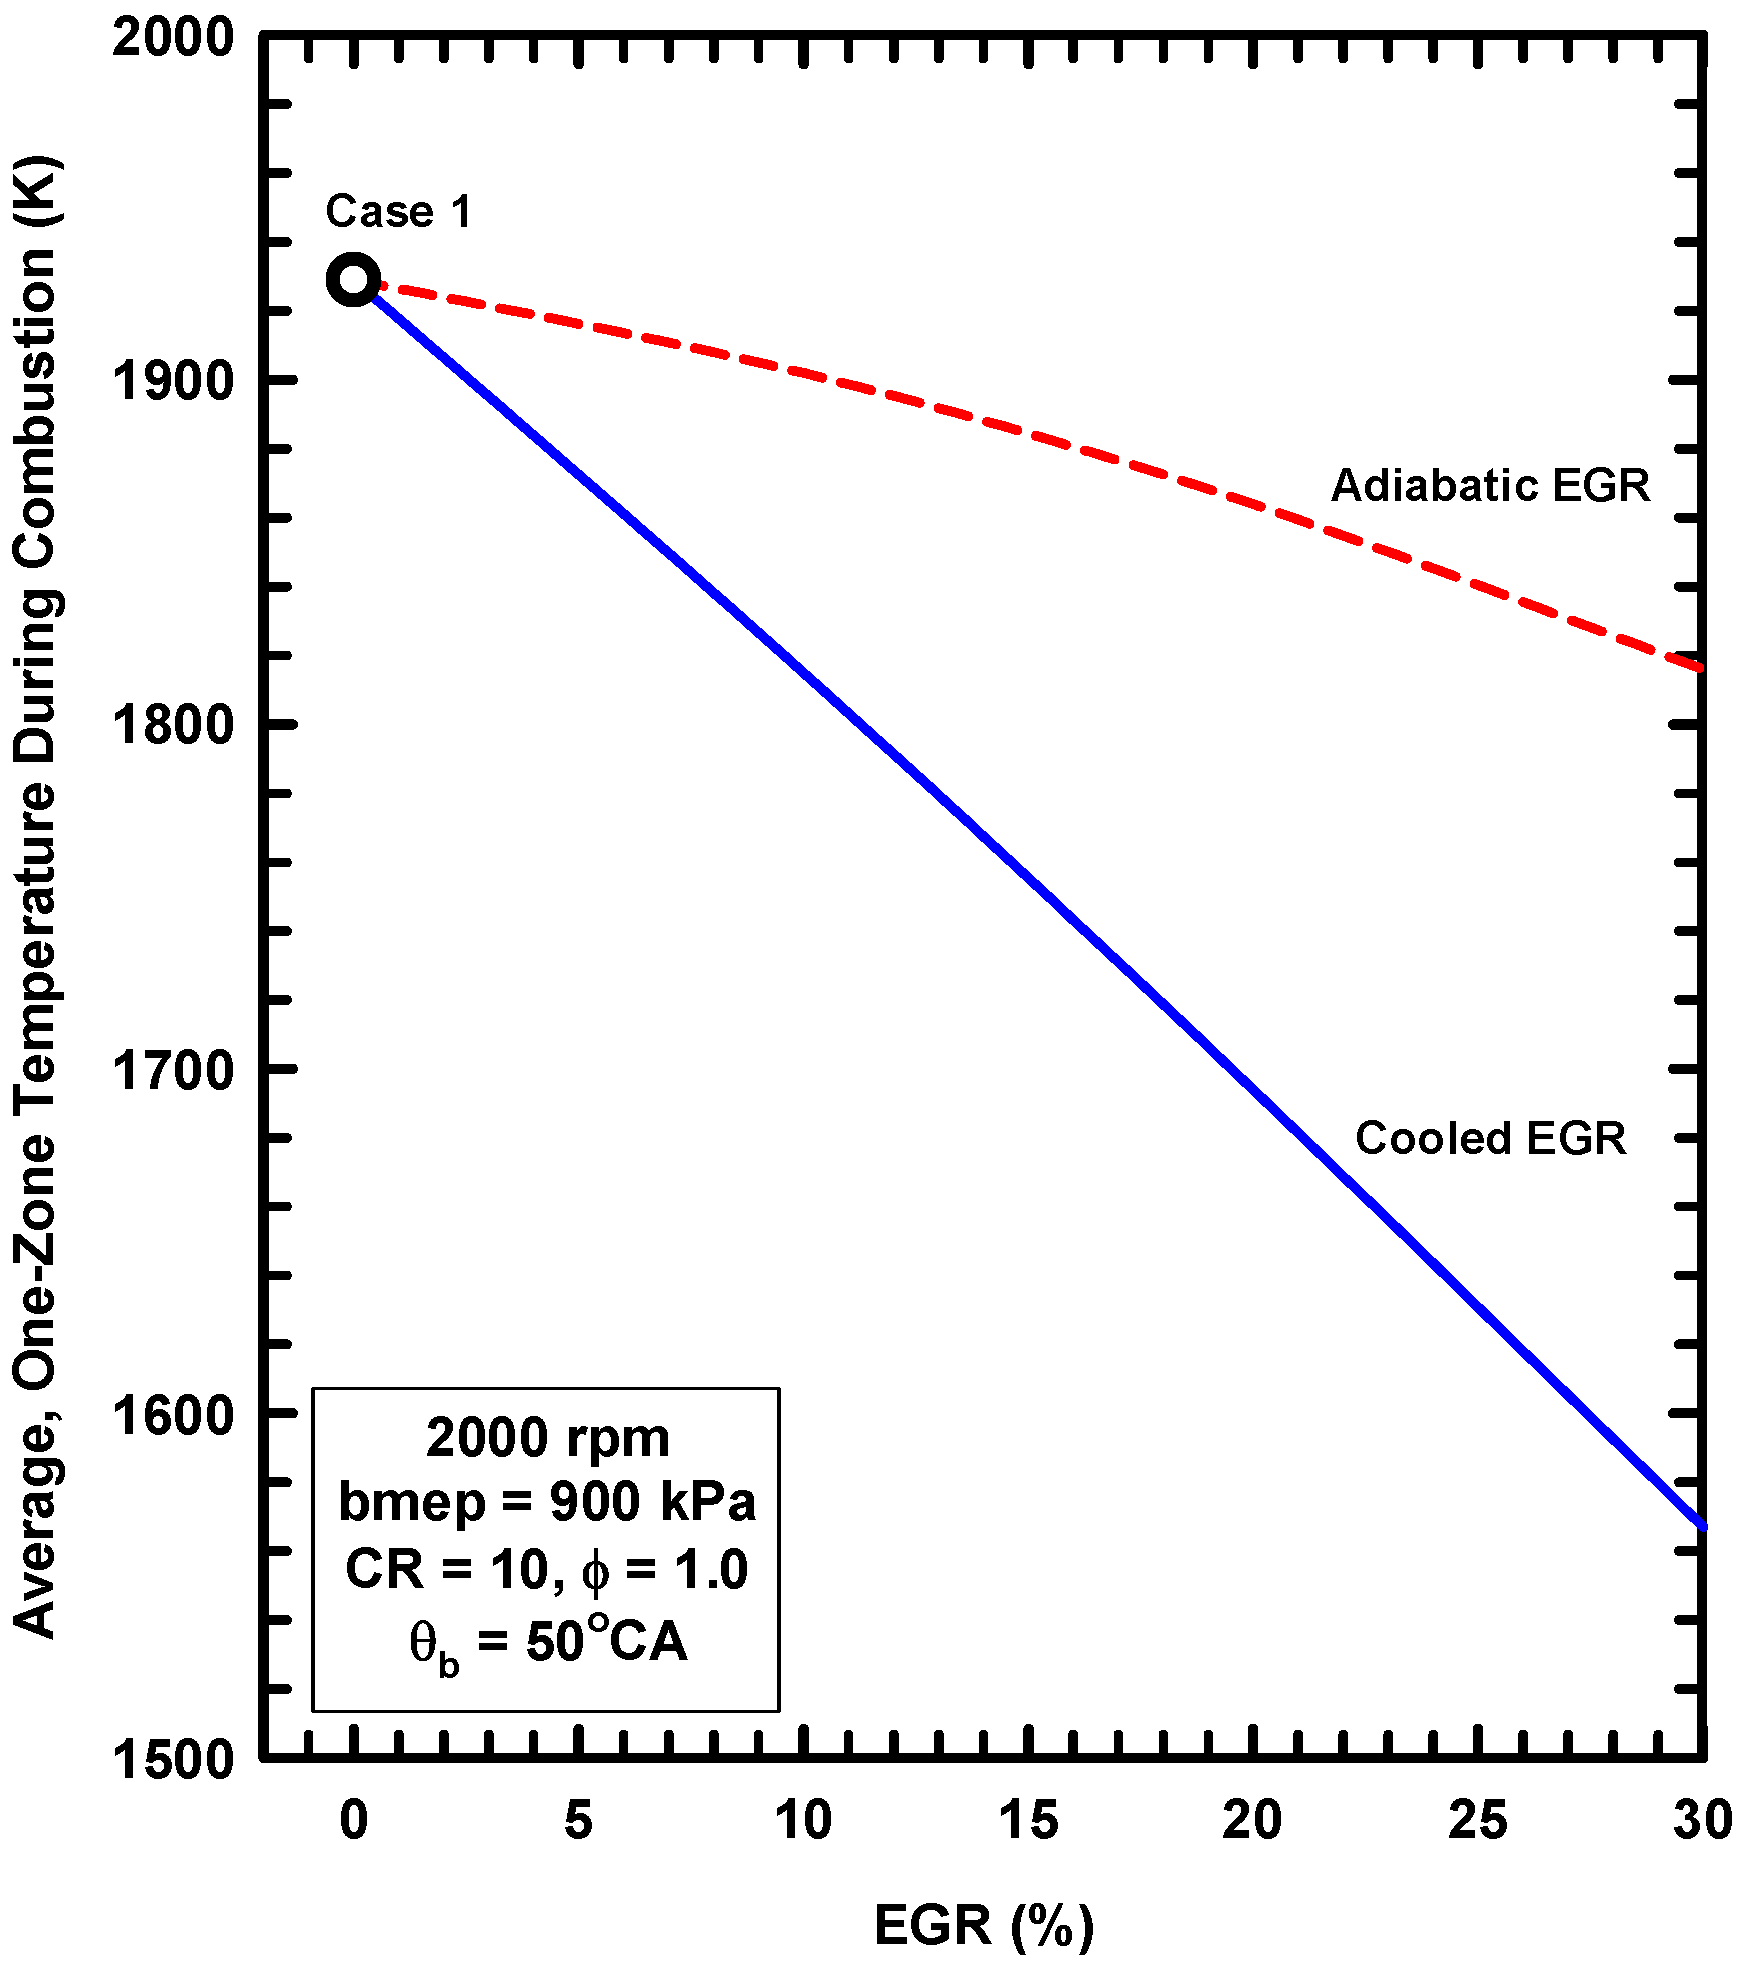
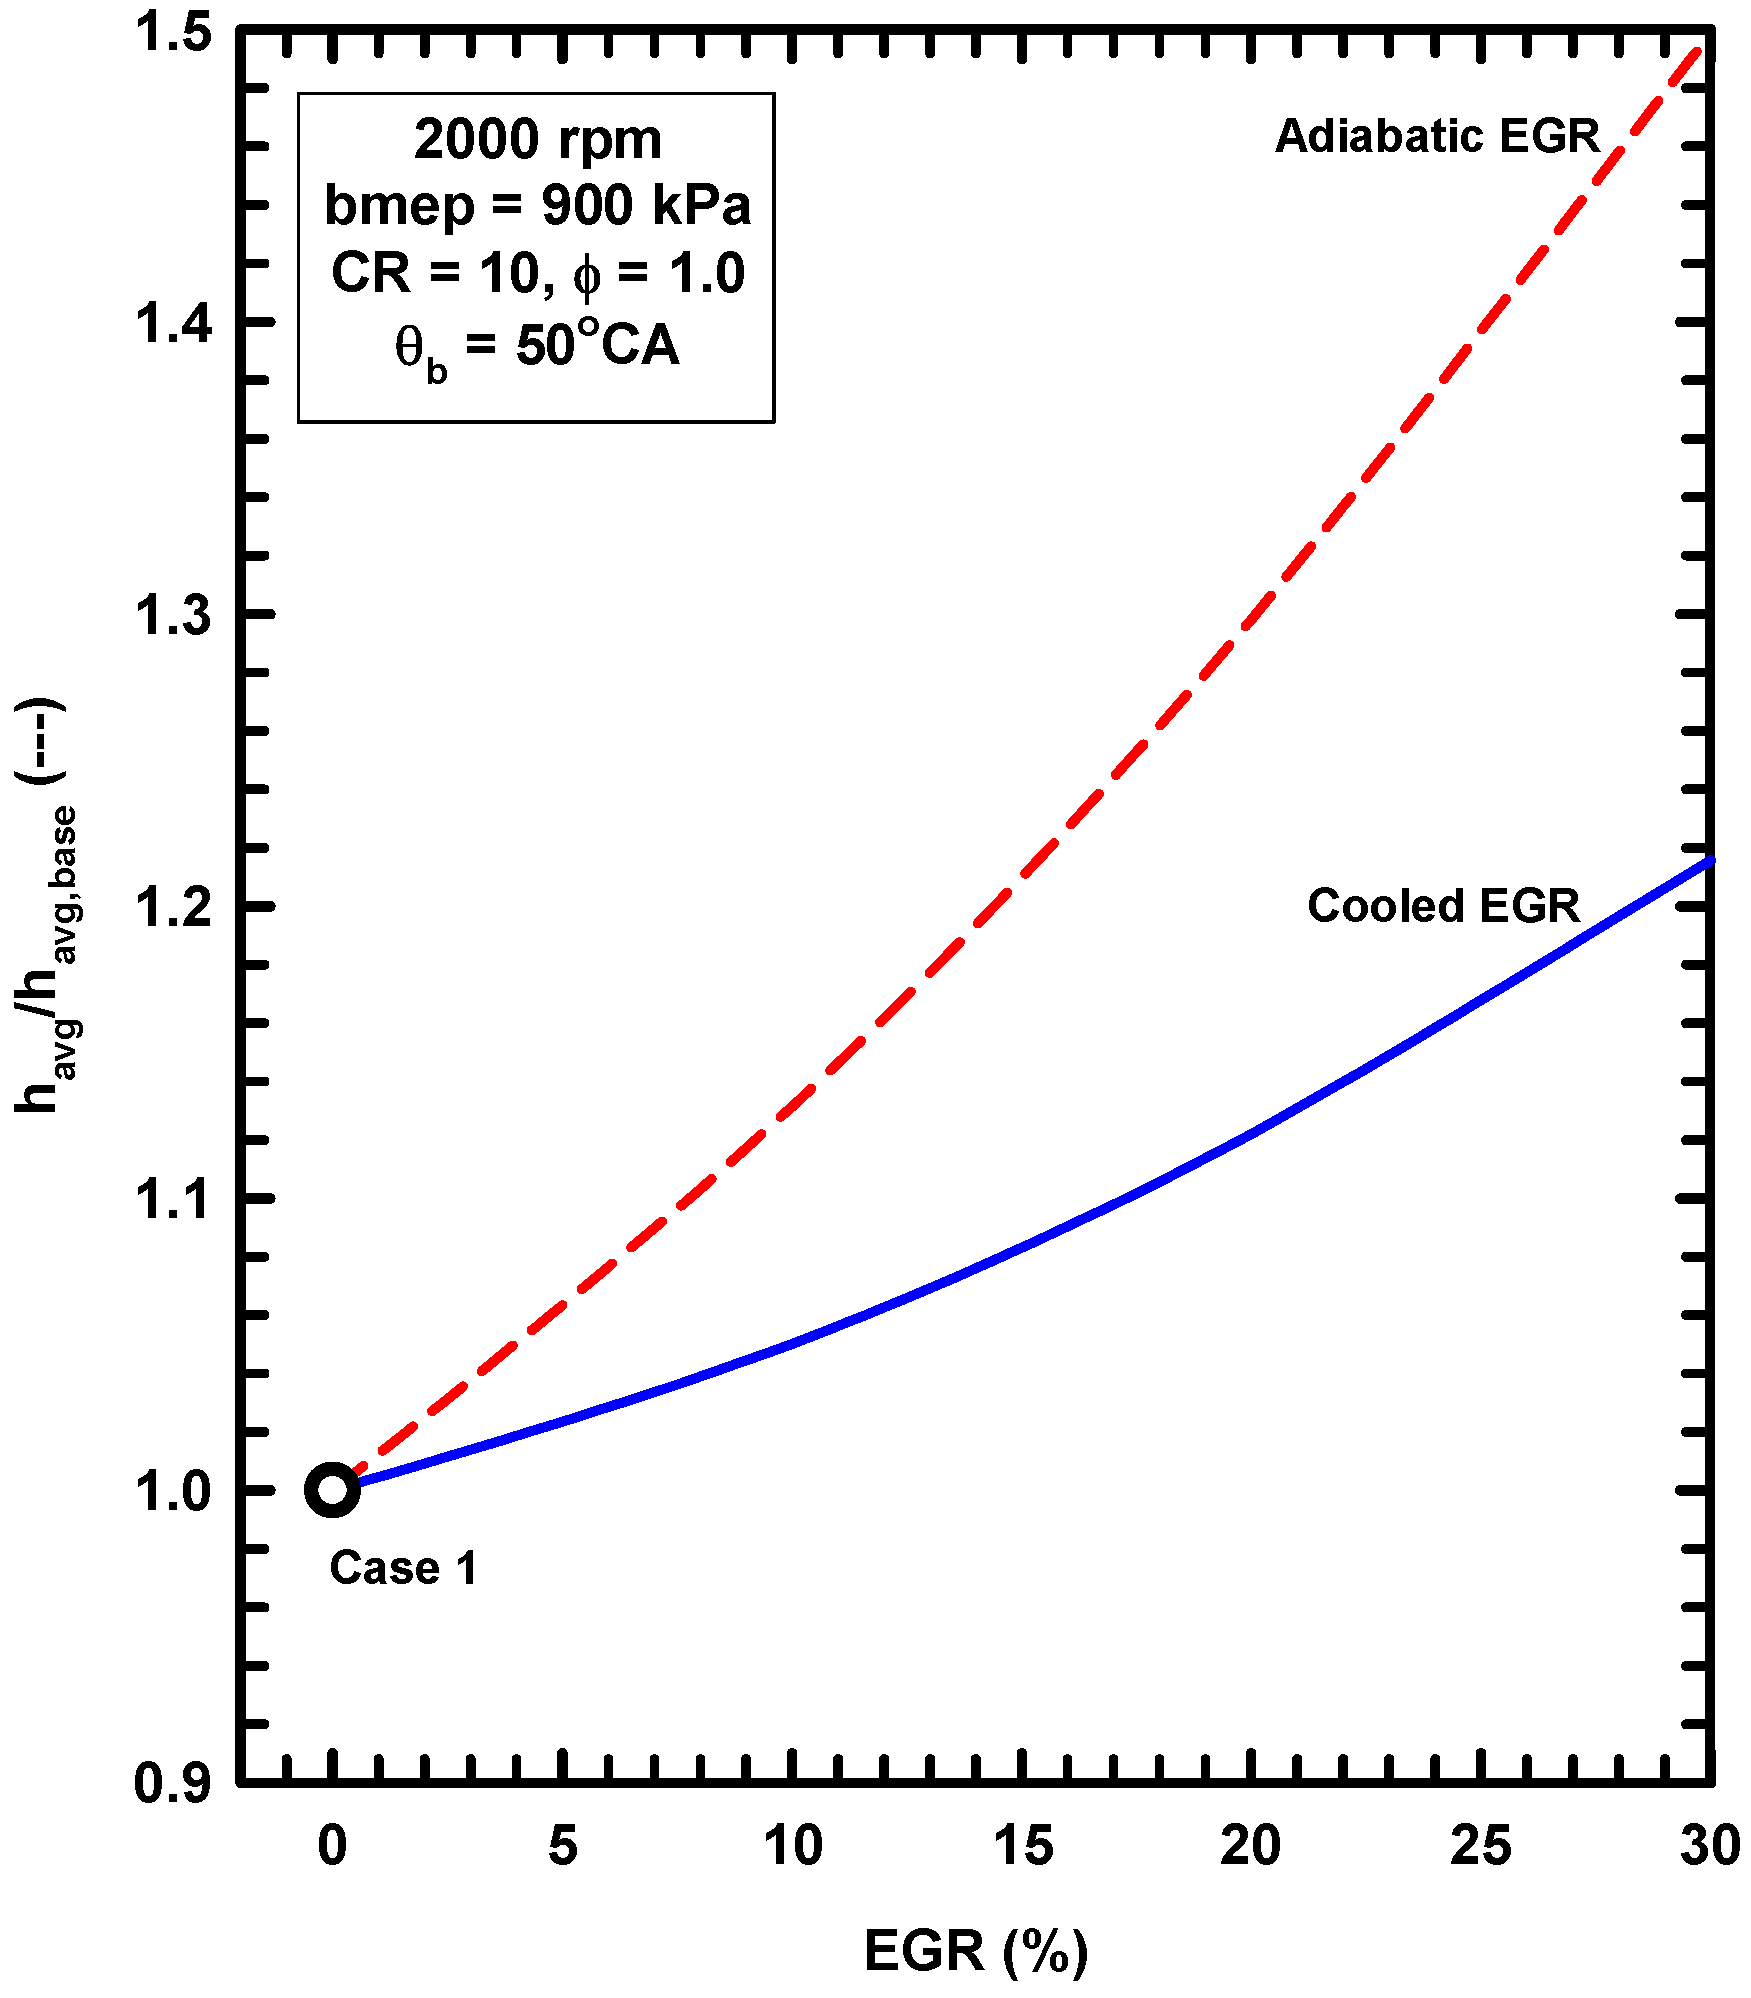
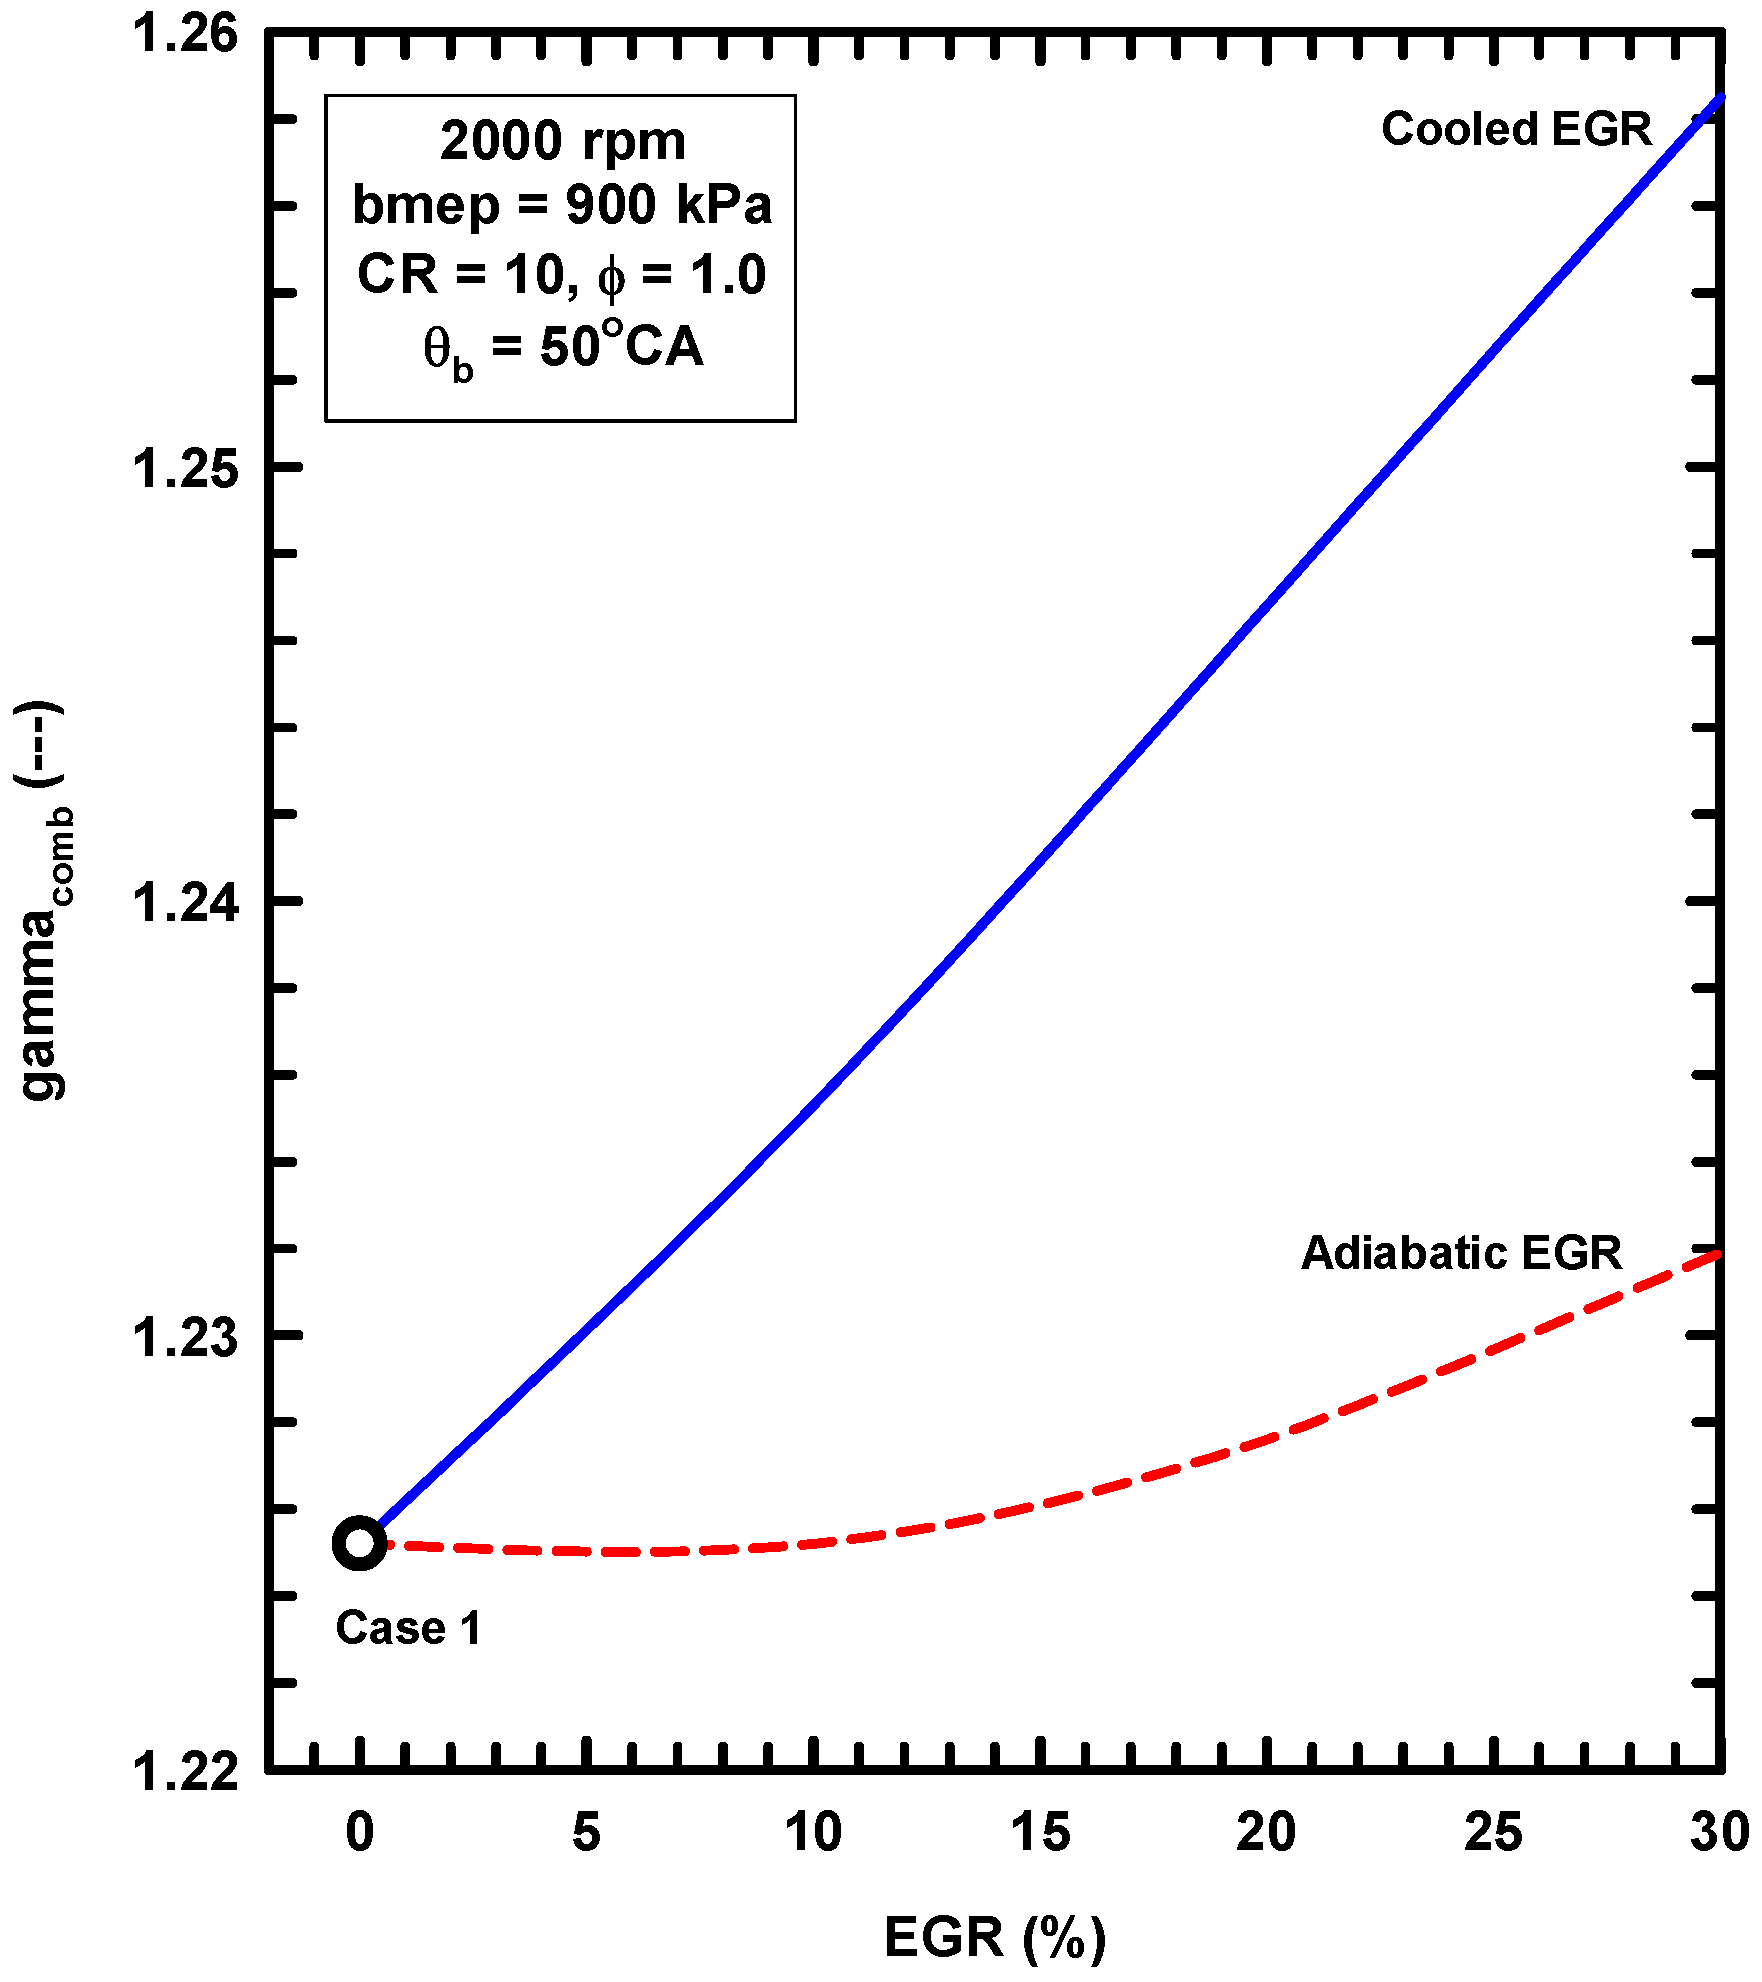
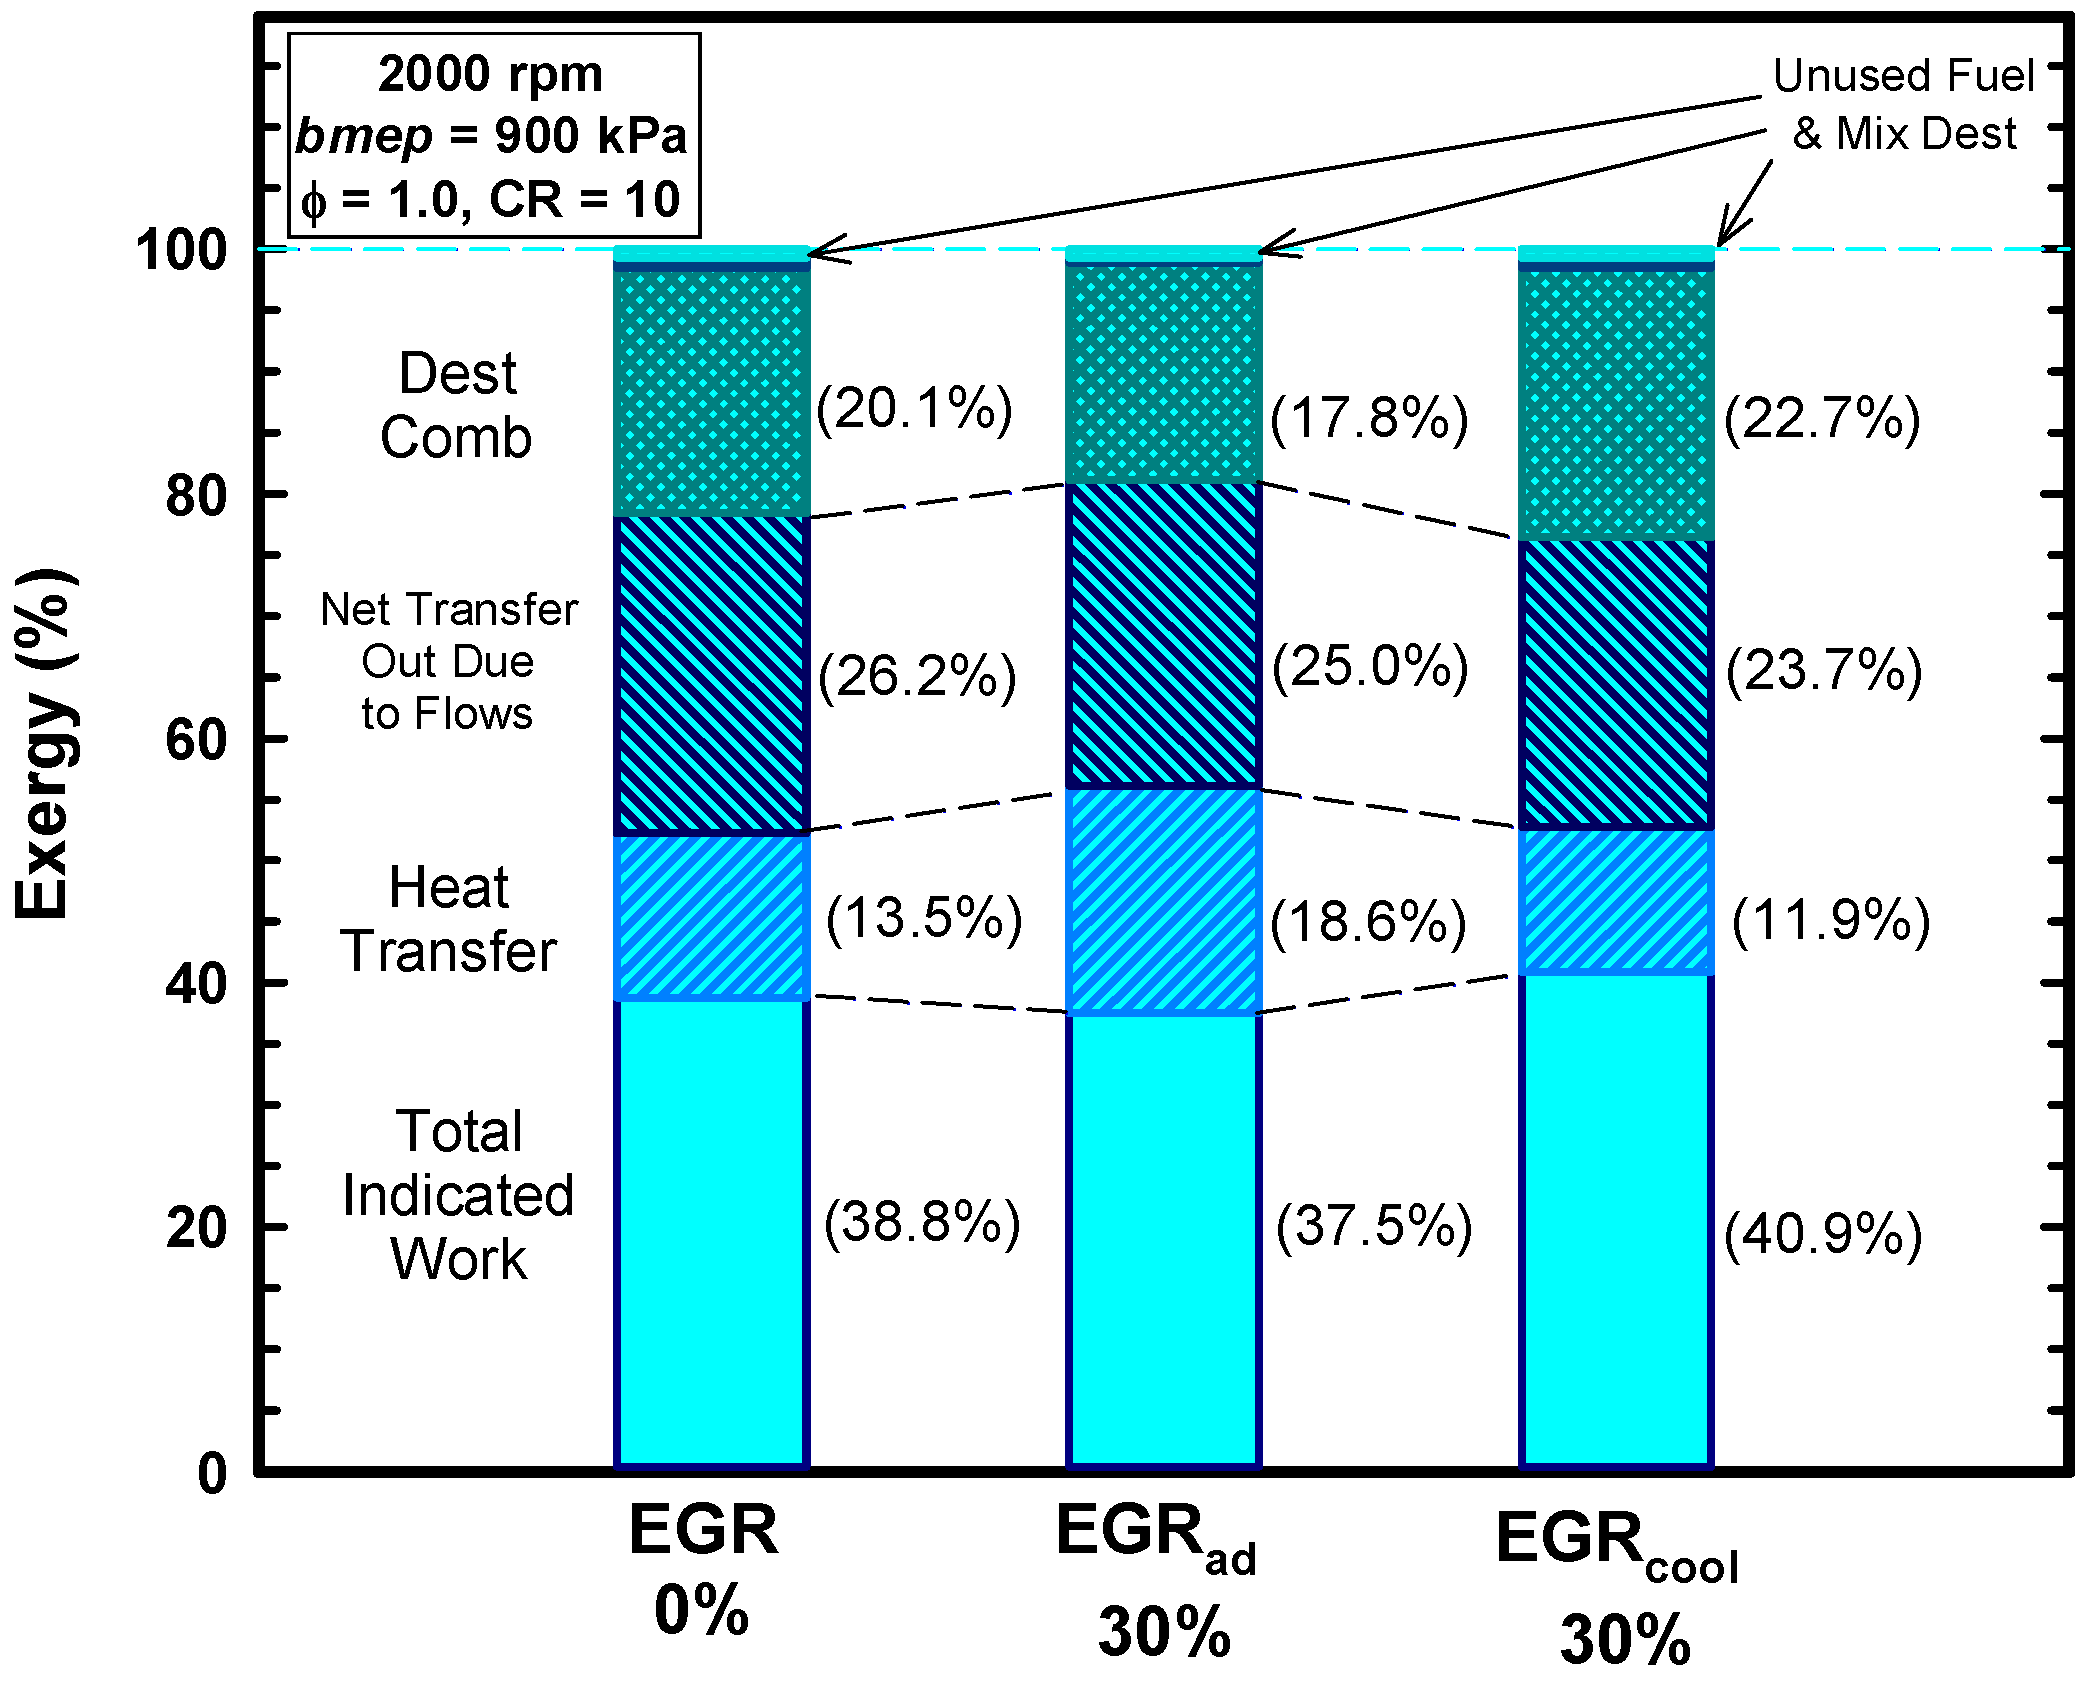
5.2. External Exhaust Gas Dilution

The use of exhaust gas dilution alters the thermodynamic properties of the working fluid. First, the concentrations of the species of the inlet charge change. In particular, the concentrations of nitrogen, carbon dioxide, water, and other combustion products increase in the inlet charge. Also, the exhaust gas dilution causes decreases of the combustion temperatures. These changes tend to increase the ratio of the specific heats, which may have a significant effect on thermal efficiencies.
The use of external piping to redirect exhaust gases into the inlet stream provides the option of cooling the recirculated exhaust gases. Two configurations are examined here, which bracket the various cooling designs. An adiabatic configuration assumes that the exhaust gases retain their cylinder exit temperature and no cooling occurs. The cooled configuration assumes that the exhaust gases are cooled to the inlet temperature of the air-fuel mixture (319.3 K (115 °F) for this study). These two configurations result in final inlet temperatures that range between the possible temperatures in practice.
Figure 11 shows the inlet temperature as a function of the EGR percentage for the two configurations. For the cooled EGR configuration, the inlet temperature remains at a constant 319.3 K. For the adiabatic EGR configuration, the inlet temperature increases as the EGR percentage increases. As the EGR percentage increases, the exhaust gas temperature decreases, and therefore, the rate of increase of the inlet mixture temperature decreases for the higher EGR levels.
Although the main focus of this discussion is on the thermodynamics related to the use of exhaust gas dilution, for completeness, a brief illustration of the nitric oxide reduction is presented. Figure 12 shows the nitric oxide concentrations as functions of the EGR percentage for the two EGR configurations. For case 1, with no EGR, the nitric oxide concentration is 4070 ppm. Both EGR configurations result in decreases of the nitric oxides, but the cooled EGR configuration is much more effective. For 20% EGR, the cooled EGR configuration results in 1284 ppm or about a 68% reduction of nitric oxide. For 20% EGR for the adiabatic EGR configuration, the nitric oxide is 3161 ppm or about a 22% reduction. These are significant reductions, especially for this relatively high load engine condition. More information on the nitric oxide computations is available elsewhere [9].
Figure 13 shows the net indicated and brake efficiencies as functions of the EGR percentage for the two EGR configurations. For the cooled EGR configuration, the efficiencies increase, whereas for the adiabatic EGR configuration, the efficiencies decrease with increasing EGR percentages. These results can be understood by examining some of the thermodynamics associated with these conditions. Figure 14, Figure 15, Figure 16, Figure 17, Figure 18 and Figure 19 show, as functions of the EGR percentage, the relative heat transfer, the average, one-zone gas temperature during combustion, the heat transfer coefficients, the average ratio of the specific heats during combustion, and the exergy destroyed during the combustion process.
The efficiencies increase for the cooled EGR configuration largely because the heat transfer decreases (Figure 14) and the ratio of the specific heats (Figure 17) increases. The ratio of specific heats increases due to the composition change and the lower temperatures. The heat transfer decreases, since the gas temperatures decrease (Figure 15) even though the heat transfer coefficient increases (Figure 16). The heat transfer coefficient increases for both configurations, since the temperatures decrease and the pressures increase. The pressures increase as the EGR percentage increases, since to maintain the same load (bmep = 900 kPa), the inlet pressure increases. The heat transfer coefficient for the Hohenberg correlation [16] depends on the pressures and temperatures as follows
h ~ p 0.8 T 0.4
The efficiencies decrease for the adiabatic EGR configuration due to increased heat transfer (Figure 14) in spite of a modest increase of the ratio of specific heats (Figure 17). The heat transfer increases even though the gas temperatures decrease as the EGR percentage increases. This is due to the increase of the heat transfer coefficient (Figure 16), which, as mentioned above, increases with increases of cylinder pressure and decreases of the gas temperatures.
Figure 18 shows the exergy destruction during the combustion process as functions of the EGR percentage for the two EGR configurations. The exergy destruction increases for the cooled EGR configuration largely due to the significant temperature decrease associated with increasing EGR percentage. In spite of the increase of the exergy destruction, the thermal efficiencies increase with increasing EGR percentage due to the items mentioned above.
The exergy destruction decreases for the adiabatic EGR configuration in spite of the modest decrease of the temperatures (Figure 15). This is due to the combined effects of increasing inlet temperatures, lower combustion temperatures, higher heat transfer, and increasing dilution as the EGR percentage increases.
Finally, Figure 19 shows the partition of the fuel exergy among work, heat transfer, exhaust, and destruction for the 0% EGR case and the two 30% EGR cases. The indicated work is less for the adiabatic EGR configuration and is higher for the cooled EGR configuration compared to the 0% EGR case. The exergy associated with the heat transfer is highest for the adiabatic EGR configuration and lowest for the cooled EGR configuration. The exergy associated with the net flow out is lowest for the cooled EGR configuration. Additionally, the exergy destruction is lowest for the adiabatic EGR configuration, as discussed above.

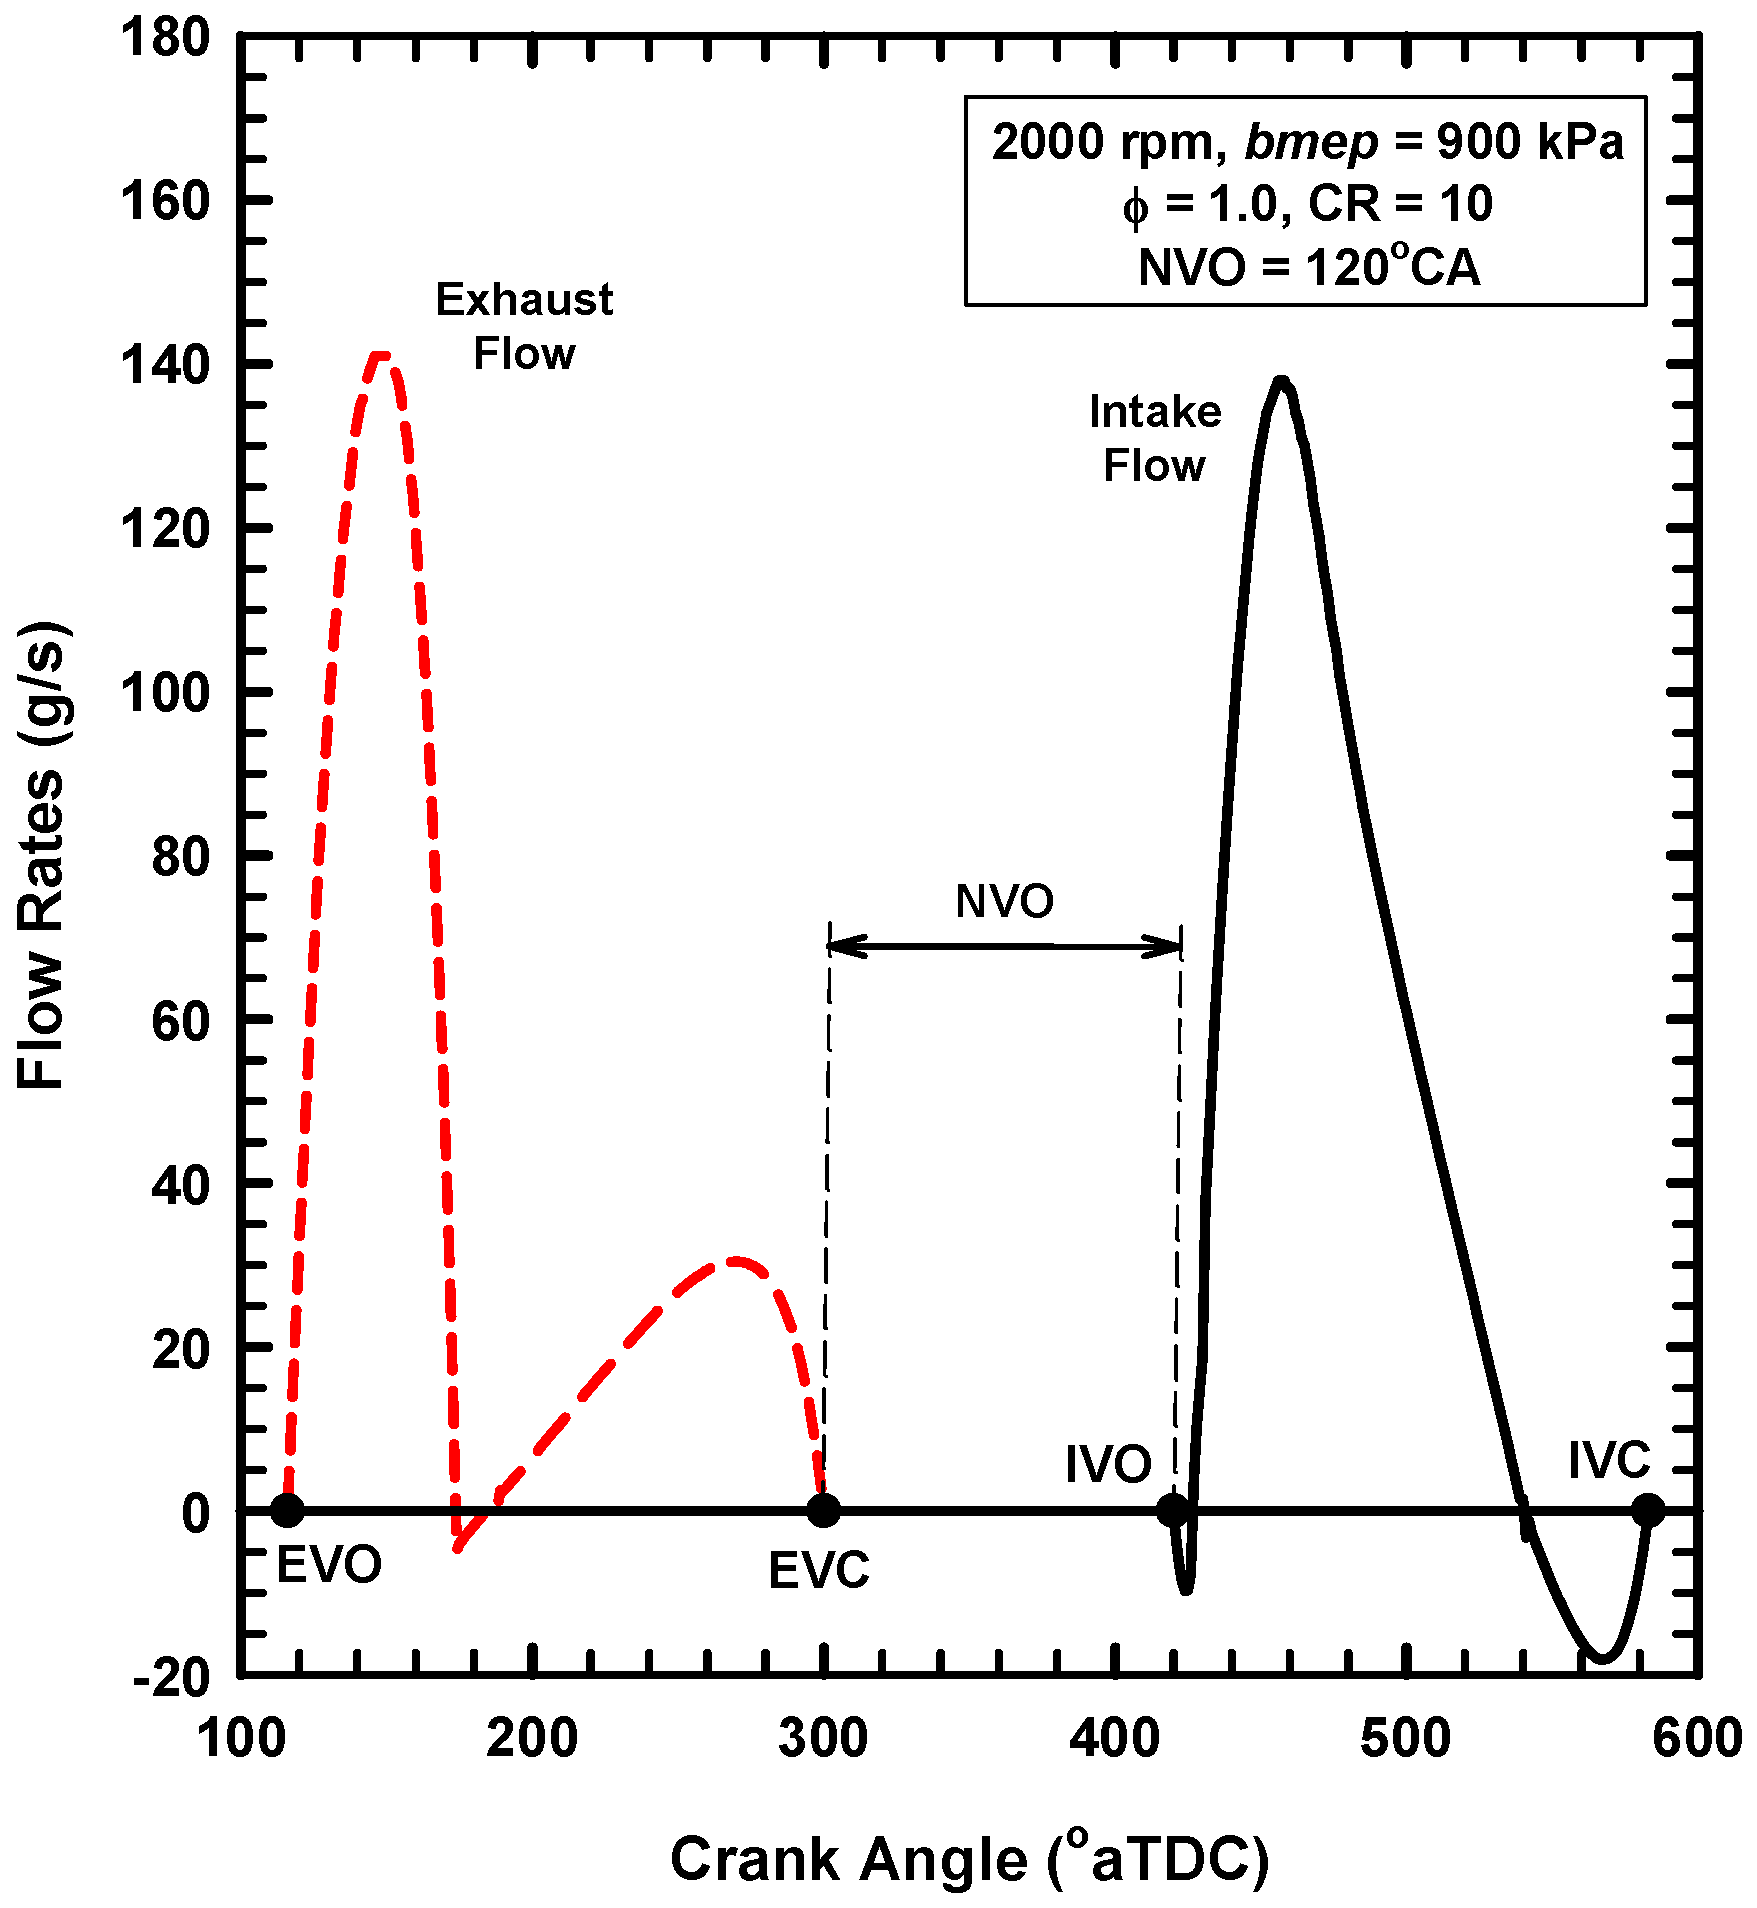
5.3. Internal Exhaust Gas Dilution

As an alternative to external exhaust gas recirculation, the retention of combustion gases from the previous cycle may be accomplished using certain valve timing strategies. This approach may have first been reported by Onishi et al. [27] and Noguschi et al. [28]. A major fundamental difference between the external and internal exhaust gas dilution approaches is that the retention of combustion gases provides higher temperatures and perhaps a more reactive mixture. This may have advantages for certain combustion systems in which ignition aid is useful. This may be true for a number of low temperature combustion systems such as homogeneous charge compression ignition (HCCI), controlled autoignition (CAI), and partially premixed combustion (PPC).
A wide variety of valve strategies have been used to accomplish the internal exhaust gas dilution [29]. These strategies include negative valve overlap (NVO), delayed exhaust valve closing (dEVC), and the use of a second exhaust event during the intake process.
This brief evaluation will consider the negative valve overlap strategy. Table 5 shows the conventional (positive valve overlap) valve timing and the negative valve overlap valve timings. These schematics show the qualitative valve lift as a function of crank angle. As shown, for the NVO strategy, the exhaust valve closes before the intake valve opens. This provides a period near TDC in which no valves are open, and therefore the piston compresses the cylinder gases. This is one reason that the NVO strategy is sometimes referred to as “recompression.” In any case, the strategy is effective for increasing the retention of combustion gases and providing internal exhaust gas dilution.
The unique characteristics of NVO strategies are illustrated in the next two figures. Figure 20 shows the exhaust and intake mass flow rates as functions of crank angle for the case of a NVO of 120 °CA. To achieve the same load, the flow rates for NVO strategies are higher than for the original valve timings. In addition, the period near TDC has no flows. Figure 21 shows the cylinder pressure as a function of crank angle for the case of a NVO of 120 °CA. The peak cylinder pressure is higher for the NVO case compared to the conventional valve timing. In addition, the “recompression” around 360 °TDC is illustrated.
Figure 22 shows the net indicated and brake thermal efficiencies as functions of the negative valve overlap. The efficiencies decrease as the NVO increases due to the following. As the NVO increases, the burned gas percentage increases from about 4% to 21% for these conditions and range of NVO. Due to the conflicting effects of retaining high temperature gases and the dilution, the average combustion temperatures (the average combustion temperature represents the average of the one-zone gas temperature during the combustion event) decreased from 1932 to 1814 K as the NVO increased. The heat transfer increases as the NVO increases due to increases of the heat transfer coefficient. The effects of increasing heat transfer on the thermal efficiency are somewhat offset by the increase of the ratio of specific heats as the NVO increases.
Of interest is a comparison of the external and internal exhaust gas dilution approaches relative to the thermal efficiencies. Since the internally retained gases maintain their high temperatures, the comparison is with the adiabatic EGR configuration, which would be expected to be similar to the internal exhaust gas dilution approach. To compare the two approaches, the total burned gas percentage is used. For the internal exhaust gas dilution, the burned gas percentage is identical to the residual gas percentage. For the external exhaust gas dilution, the burned gas percentage is a combination of the residual gases and the recirculated exhaust gases.
Figure 23 shows the net indicated and brake thermal efficiencies as functions of the burned gas percentage for the NVO approach and the adiabatic EGR approach. For both approaches, the efficiencies decrease with increasing burned gas percentage for these conditions. The two approaches result in about the same thermal efficiencies. The use of the adiabatic EGR configuration provides a slight advantage for the lower burned gas percentages. This appears to be due to a slight decrease of the exergy destruction during combustion and a slight decrease of the pumping work for the adiabatic EGR approach compared to the NVO approach.

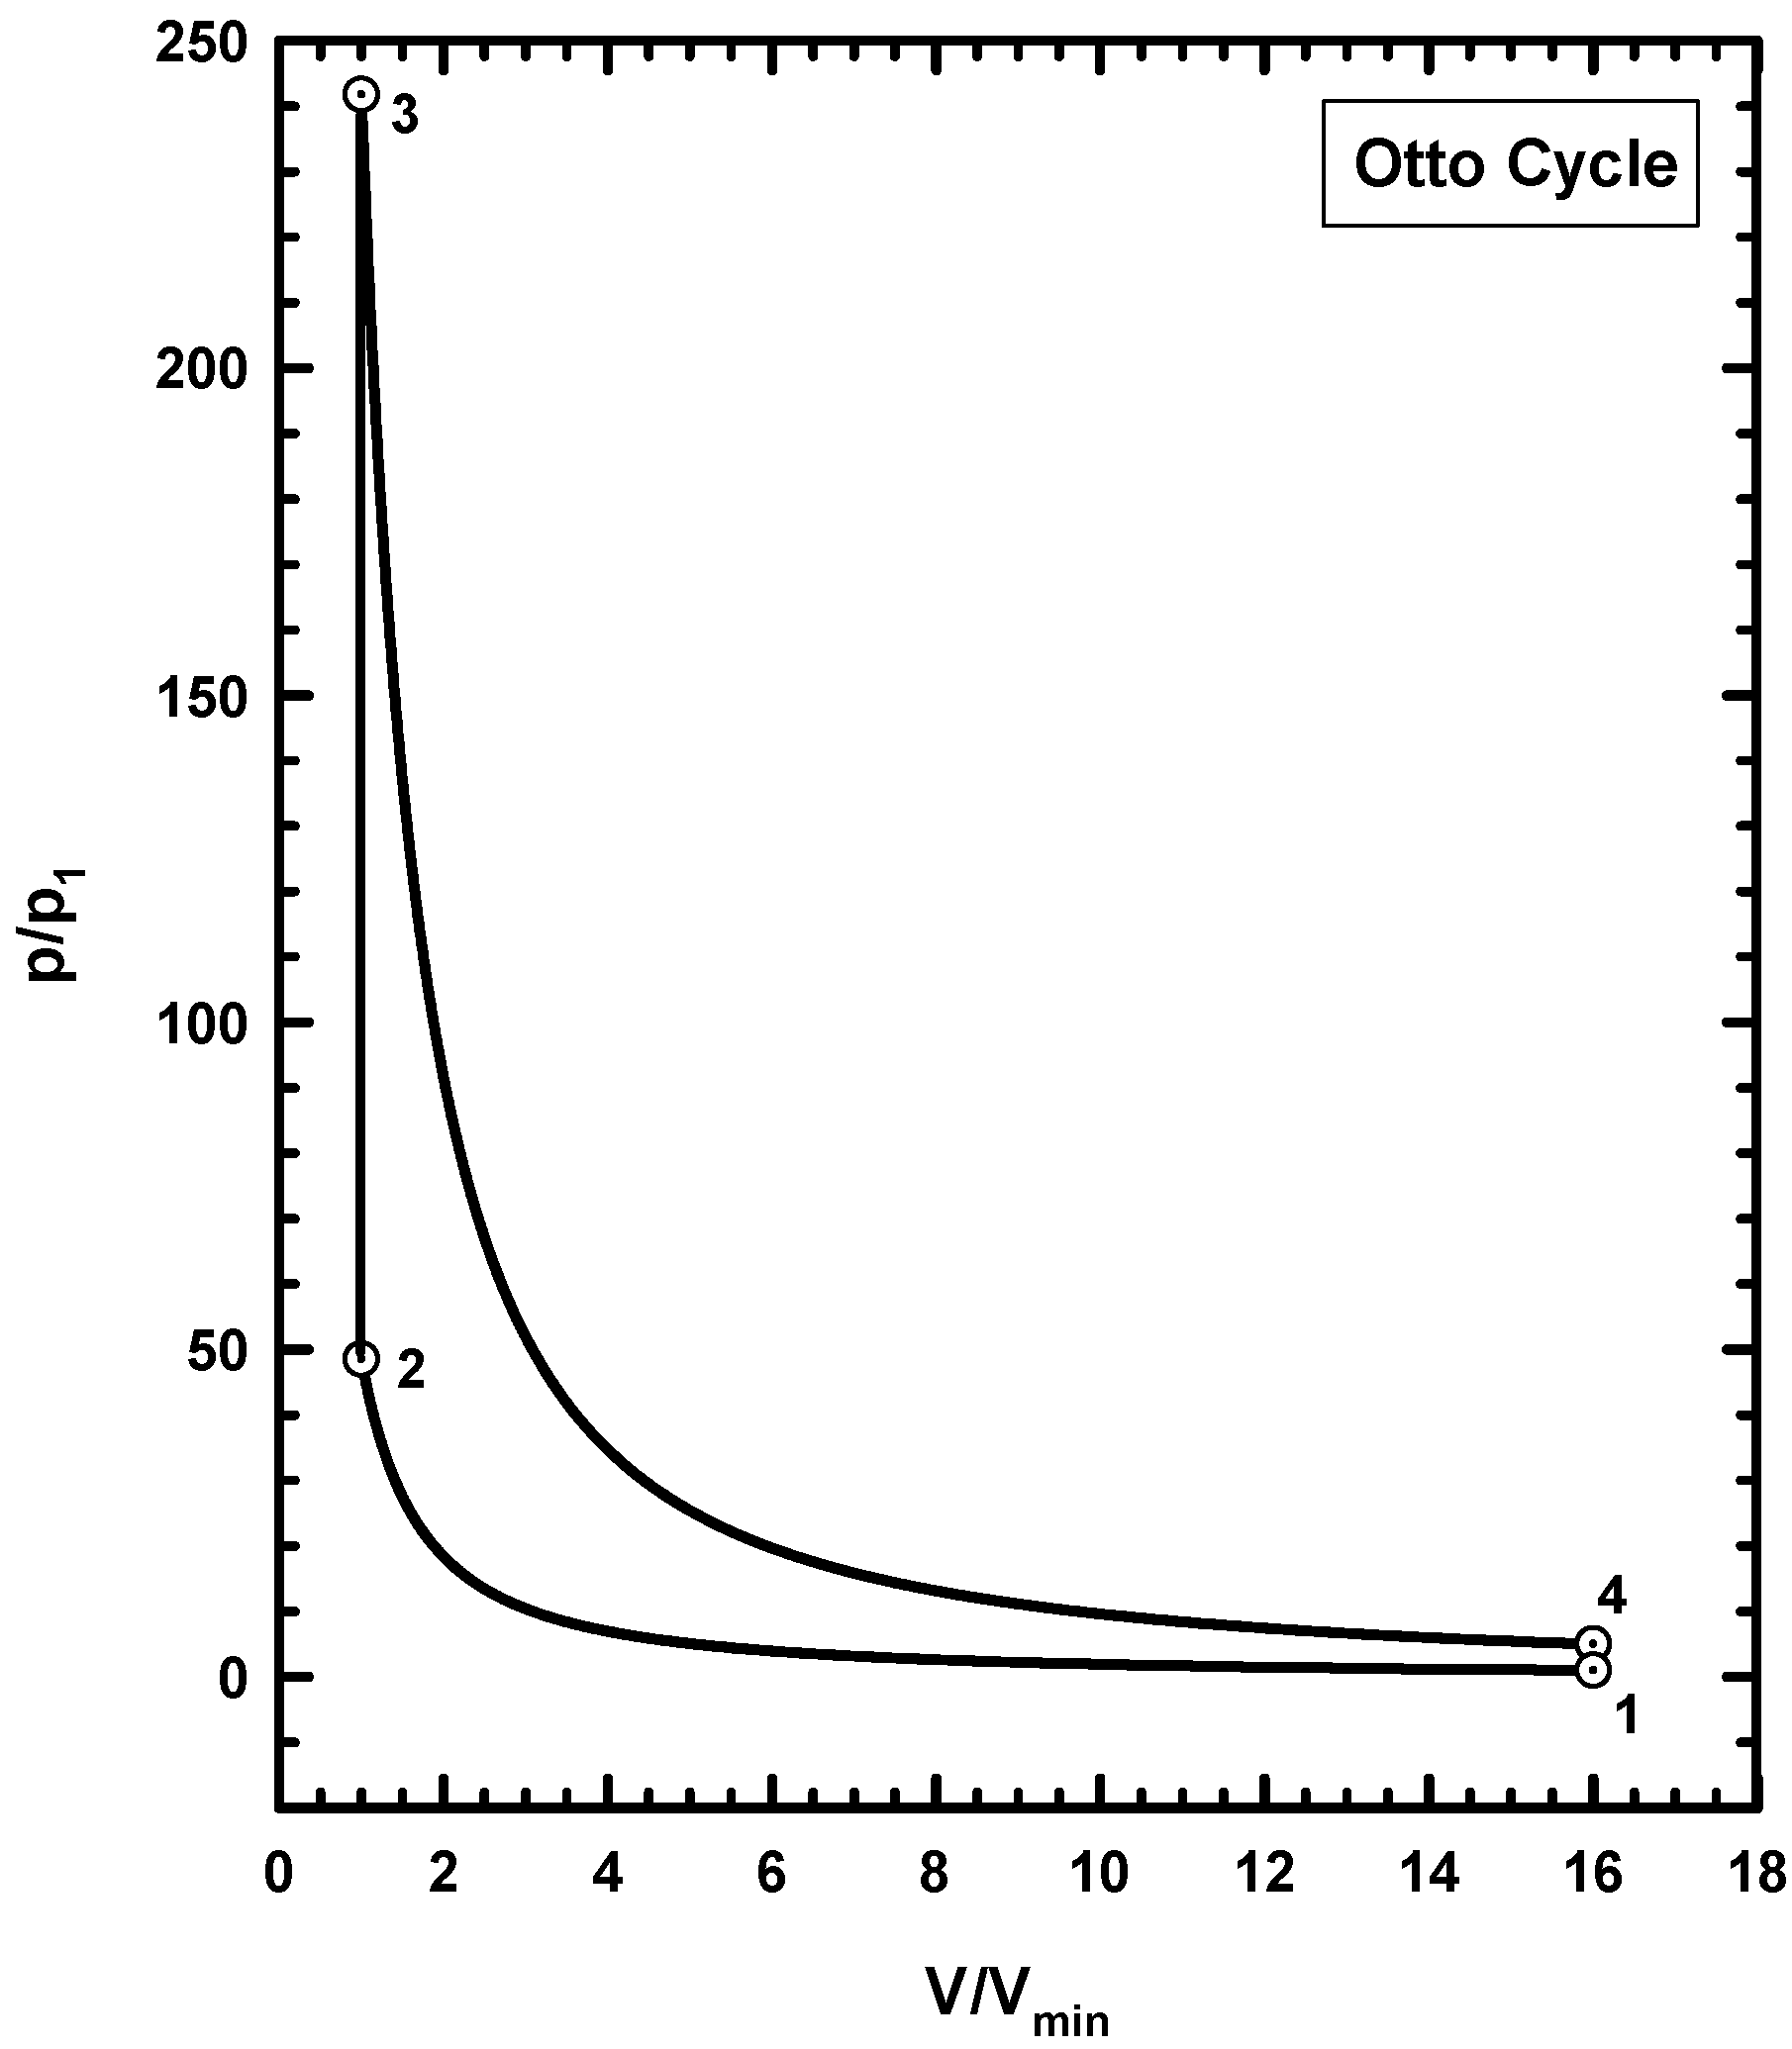
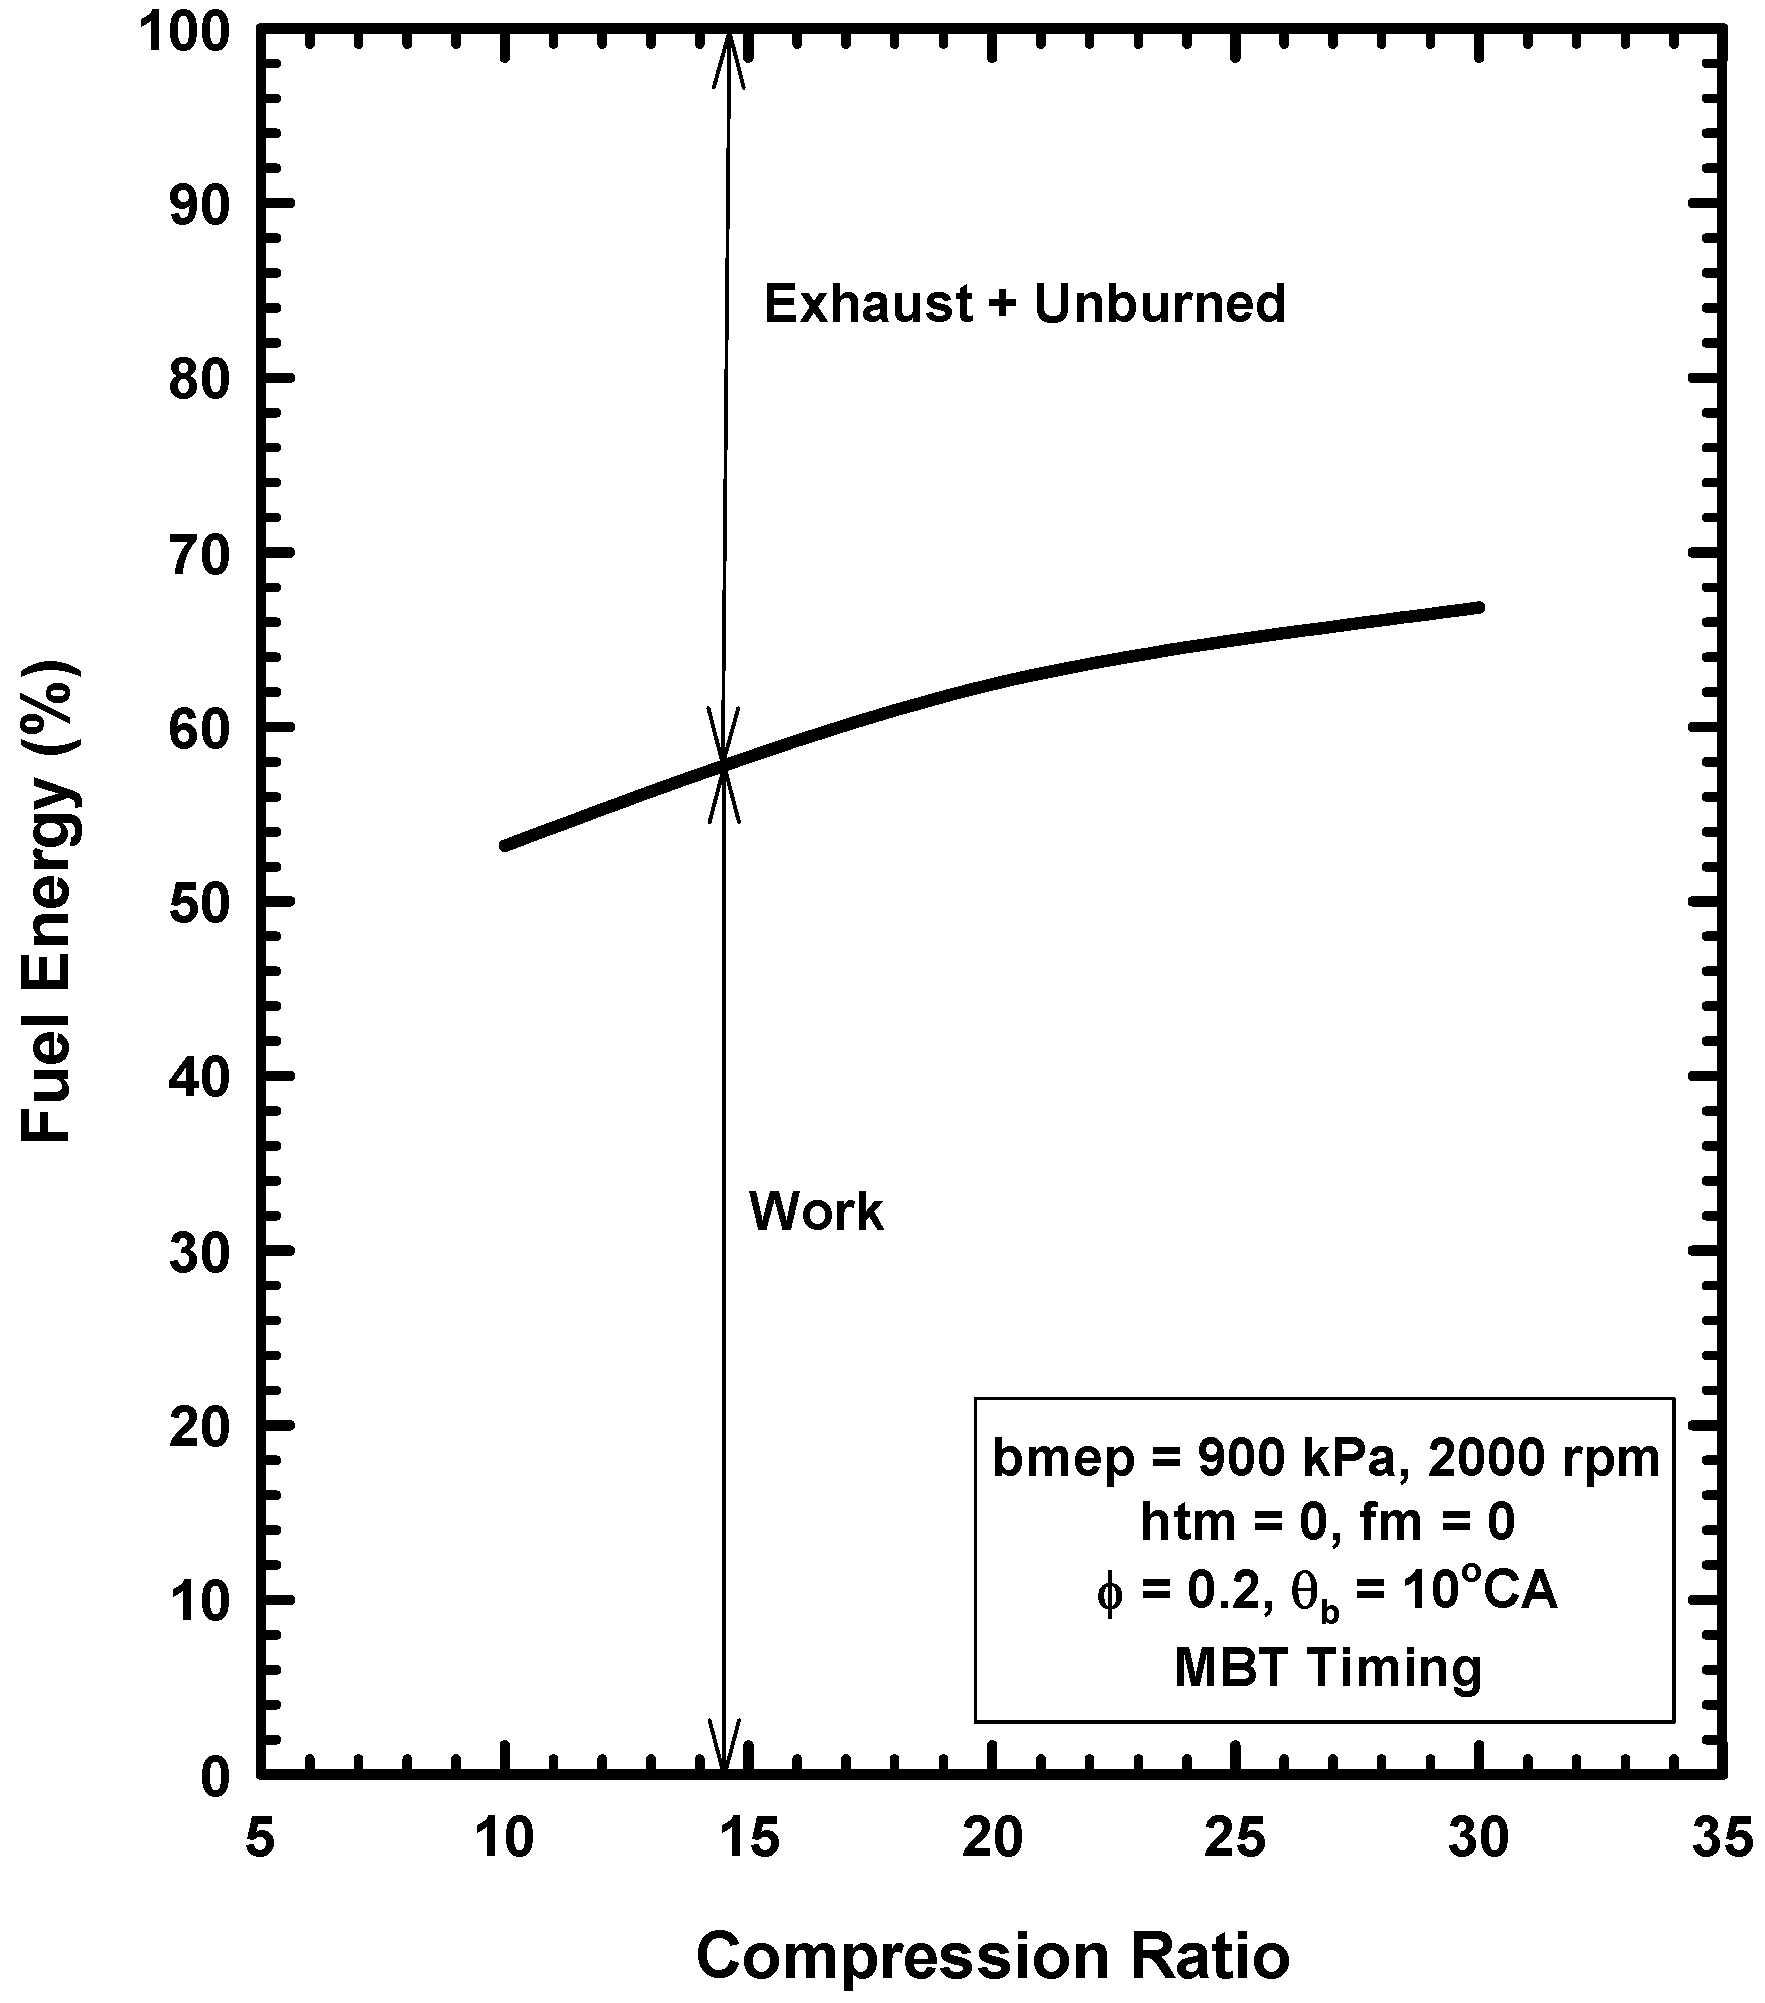
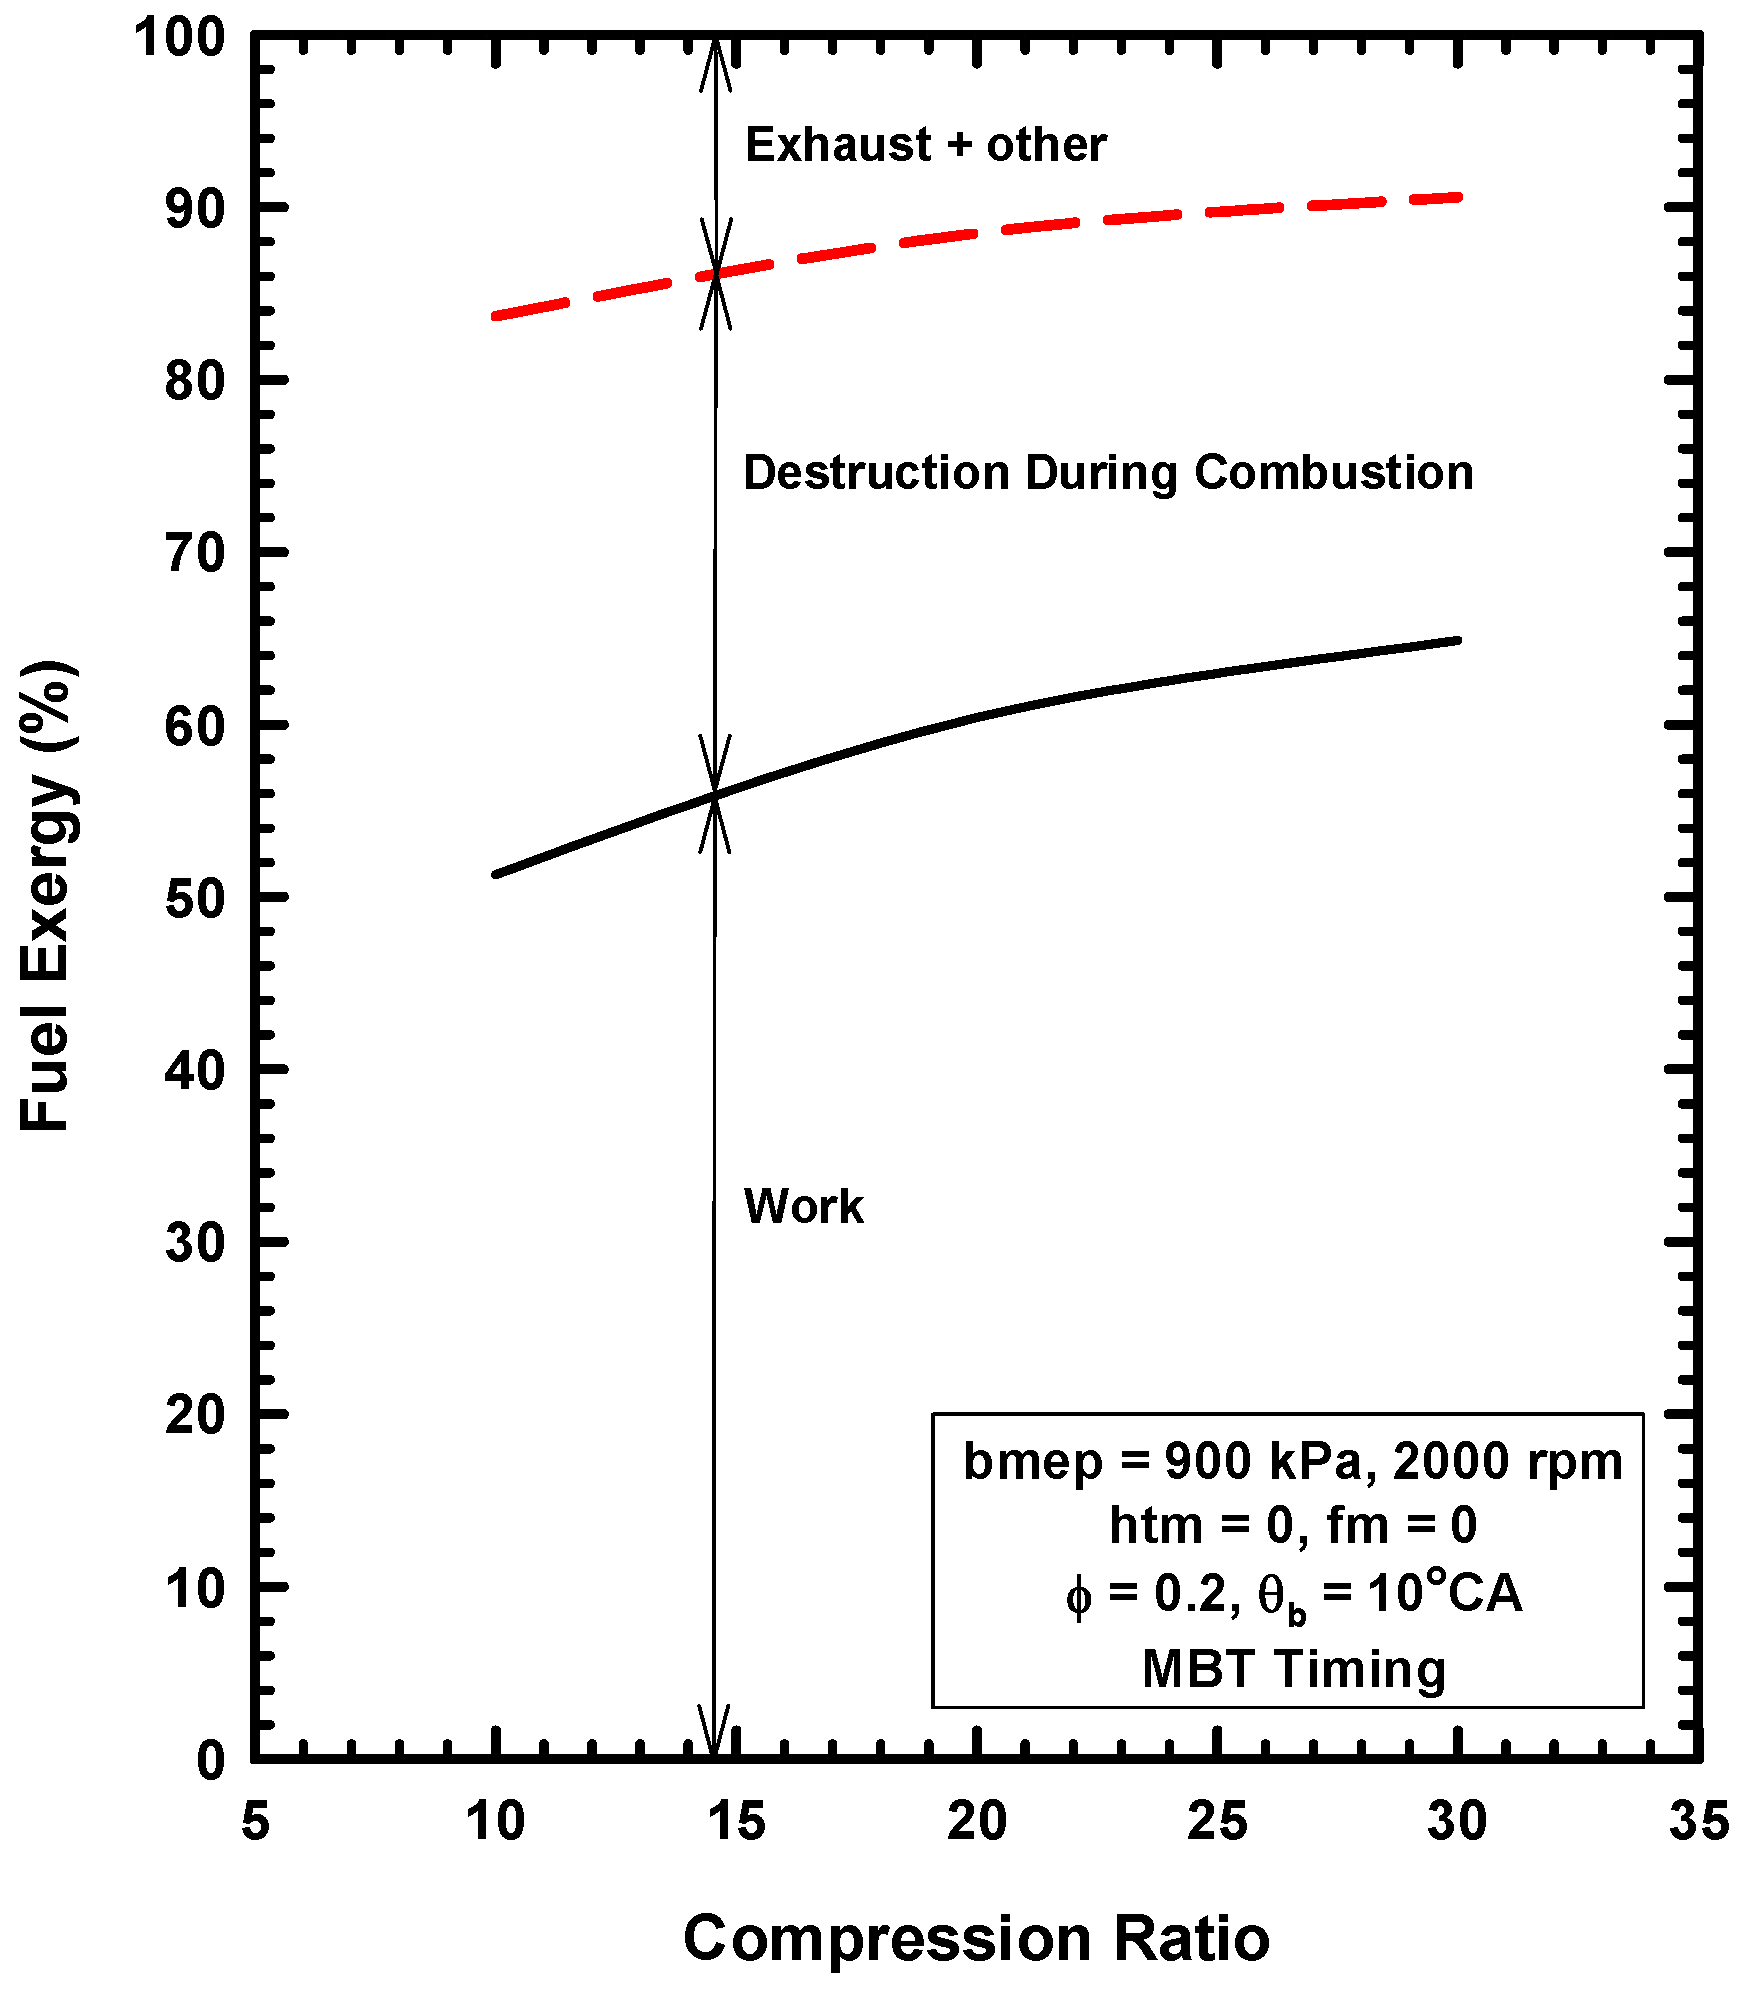
6. Example Three: Thermodynamics of the Otto Cycle

6.1. Basics of the Ideal Otto Cycle

In this subsection, the Otto cycle and its applicability to IC engines will be described. In particular, the features of the Otto cycle that are consistent and not consistent with IC engines will be identified. The Otto cycle is one of several ideal (air standard) models that have been used since at least the early 1900s. The Otto cycle is based on constant volume (typically at TDC) heat addition. These ideal models consist of a number of simplifying assumptions and approximations. One of the most common sets of these assumptions and approximations is
  • The working fluid is air;
  • The compression and expansion processes are adiabatic and reversible (isentropic);
  • The combustion process is replaced with a heat addition process under prescribed conditions;
  • The exhaust blow-down process is replaced by a constant volume heat rejection at BDC;
  • Inlet and exhaust strokes are not included.
These assumptions and approximations allow a solution for the thermal efficiency to be obtained [1]. For constant volume heat addition and constant properties,
η O t t o = 1 C R 1 γ
in which CR is the compression ratio and γ is the ratio of the specific heats. The resulting values of the thermal efficiency are not in agreement with actual IC engines for a number of reasons. These reasons are explained in this subsection.
Figure 24 shows the thermal efficiency for the Otto cycle using constant properties (Equation (8)) as functions of the ratio of specific heats for compression ratios of 8 and 16. The thermal efficiency increases with increases of compression ratio and increases of the ratio of specific heats. Of particular importance is the high sensitivity of the thermal efficiency on the value of the ratio of specific heats. For a change of the ratio of specific heats from 1.2 to 1.3, the thermal efficiency increases by about 13% (absolute). The importance of the ratio of the specific heats is described in the following.
Traditionally, the Otto cycle analysis has been used to model IC engines. This is inappropriate for a number of reasons. The fact that several features of the Otto cycle are consistent with IC engines has obscured the fact that the Otto cycle is fundamentally incorrect as a model of the IC engine. First, those features of the Otto cycle that are consistent with the IC engine are described. This is followed by a discussion of those features of the Otto cycle that are not consistent with IC engines. This subsection ends with a quantitative description of the importance of the ratio of specific heats relative to thermal efficiencies.

6.2. Features Consistent with IC Engines

At least some of the appropriate thermodynamics (relative to IC engines) are included in the following portions of the Otto cycle:
  • The compression and expansion processes.
  • Temperature (and pressure) increases due to thermal energy addition
  • The mechanical conversion of pressure increases to work.
As described below, certain characteristics of IC engines can be explored using the Otto cycle based on these features that are consistent with IC engines. Basically, due to these features, the two items that are often considered are the effects of the ratio of specific heats and compression ratio on the thermal efficiencies. These are examined below.

6.3. Features Inconsistent with IC Engines

The major weakness of the Otto cycle as a model for IC engines is that it represents a heat engine and not a chemical conversion device. The fact that the Otto cycle uses heat addition to simulate combustion is fundamentally incorrect. This means that the Otto cycle does not include the combustion irreversibilities that are a significant reason for the less than 100% thermal efficiencies. In fact, the Otto cycle is based completely on ideal processes and has no irreversibilities. Appendix A is a description of the combustion irreversibilities and their impact on efficiency.
Other deficiencies of the Otto cycle are well known (e.g., [1]) and are summarized next:
  • Heat transfer in actual engines is significant, particularly during combustion and expansion.
  • Actual combustion processes require a finite time (of order 50 °CA), and do not occur instantaneously at TDC.
  • Flow processes in actual engines may limit the charge mass, and may compromise the network of the cycle due to valve timings (e.g., exhaust valve opening before BDC).
  • Other real effects that are not part of the Otto cycle include blow-by, incomplete combustion, chemical dissociation, and mechanical and fluid friction.

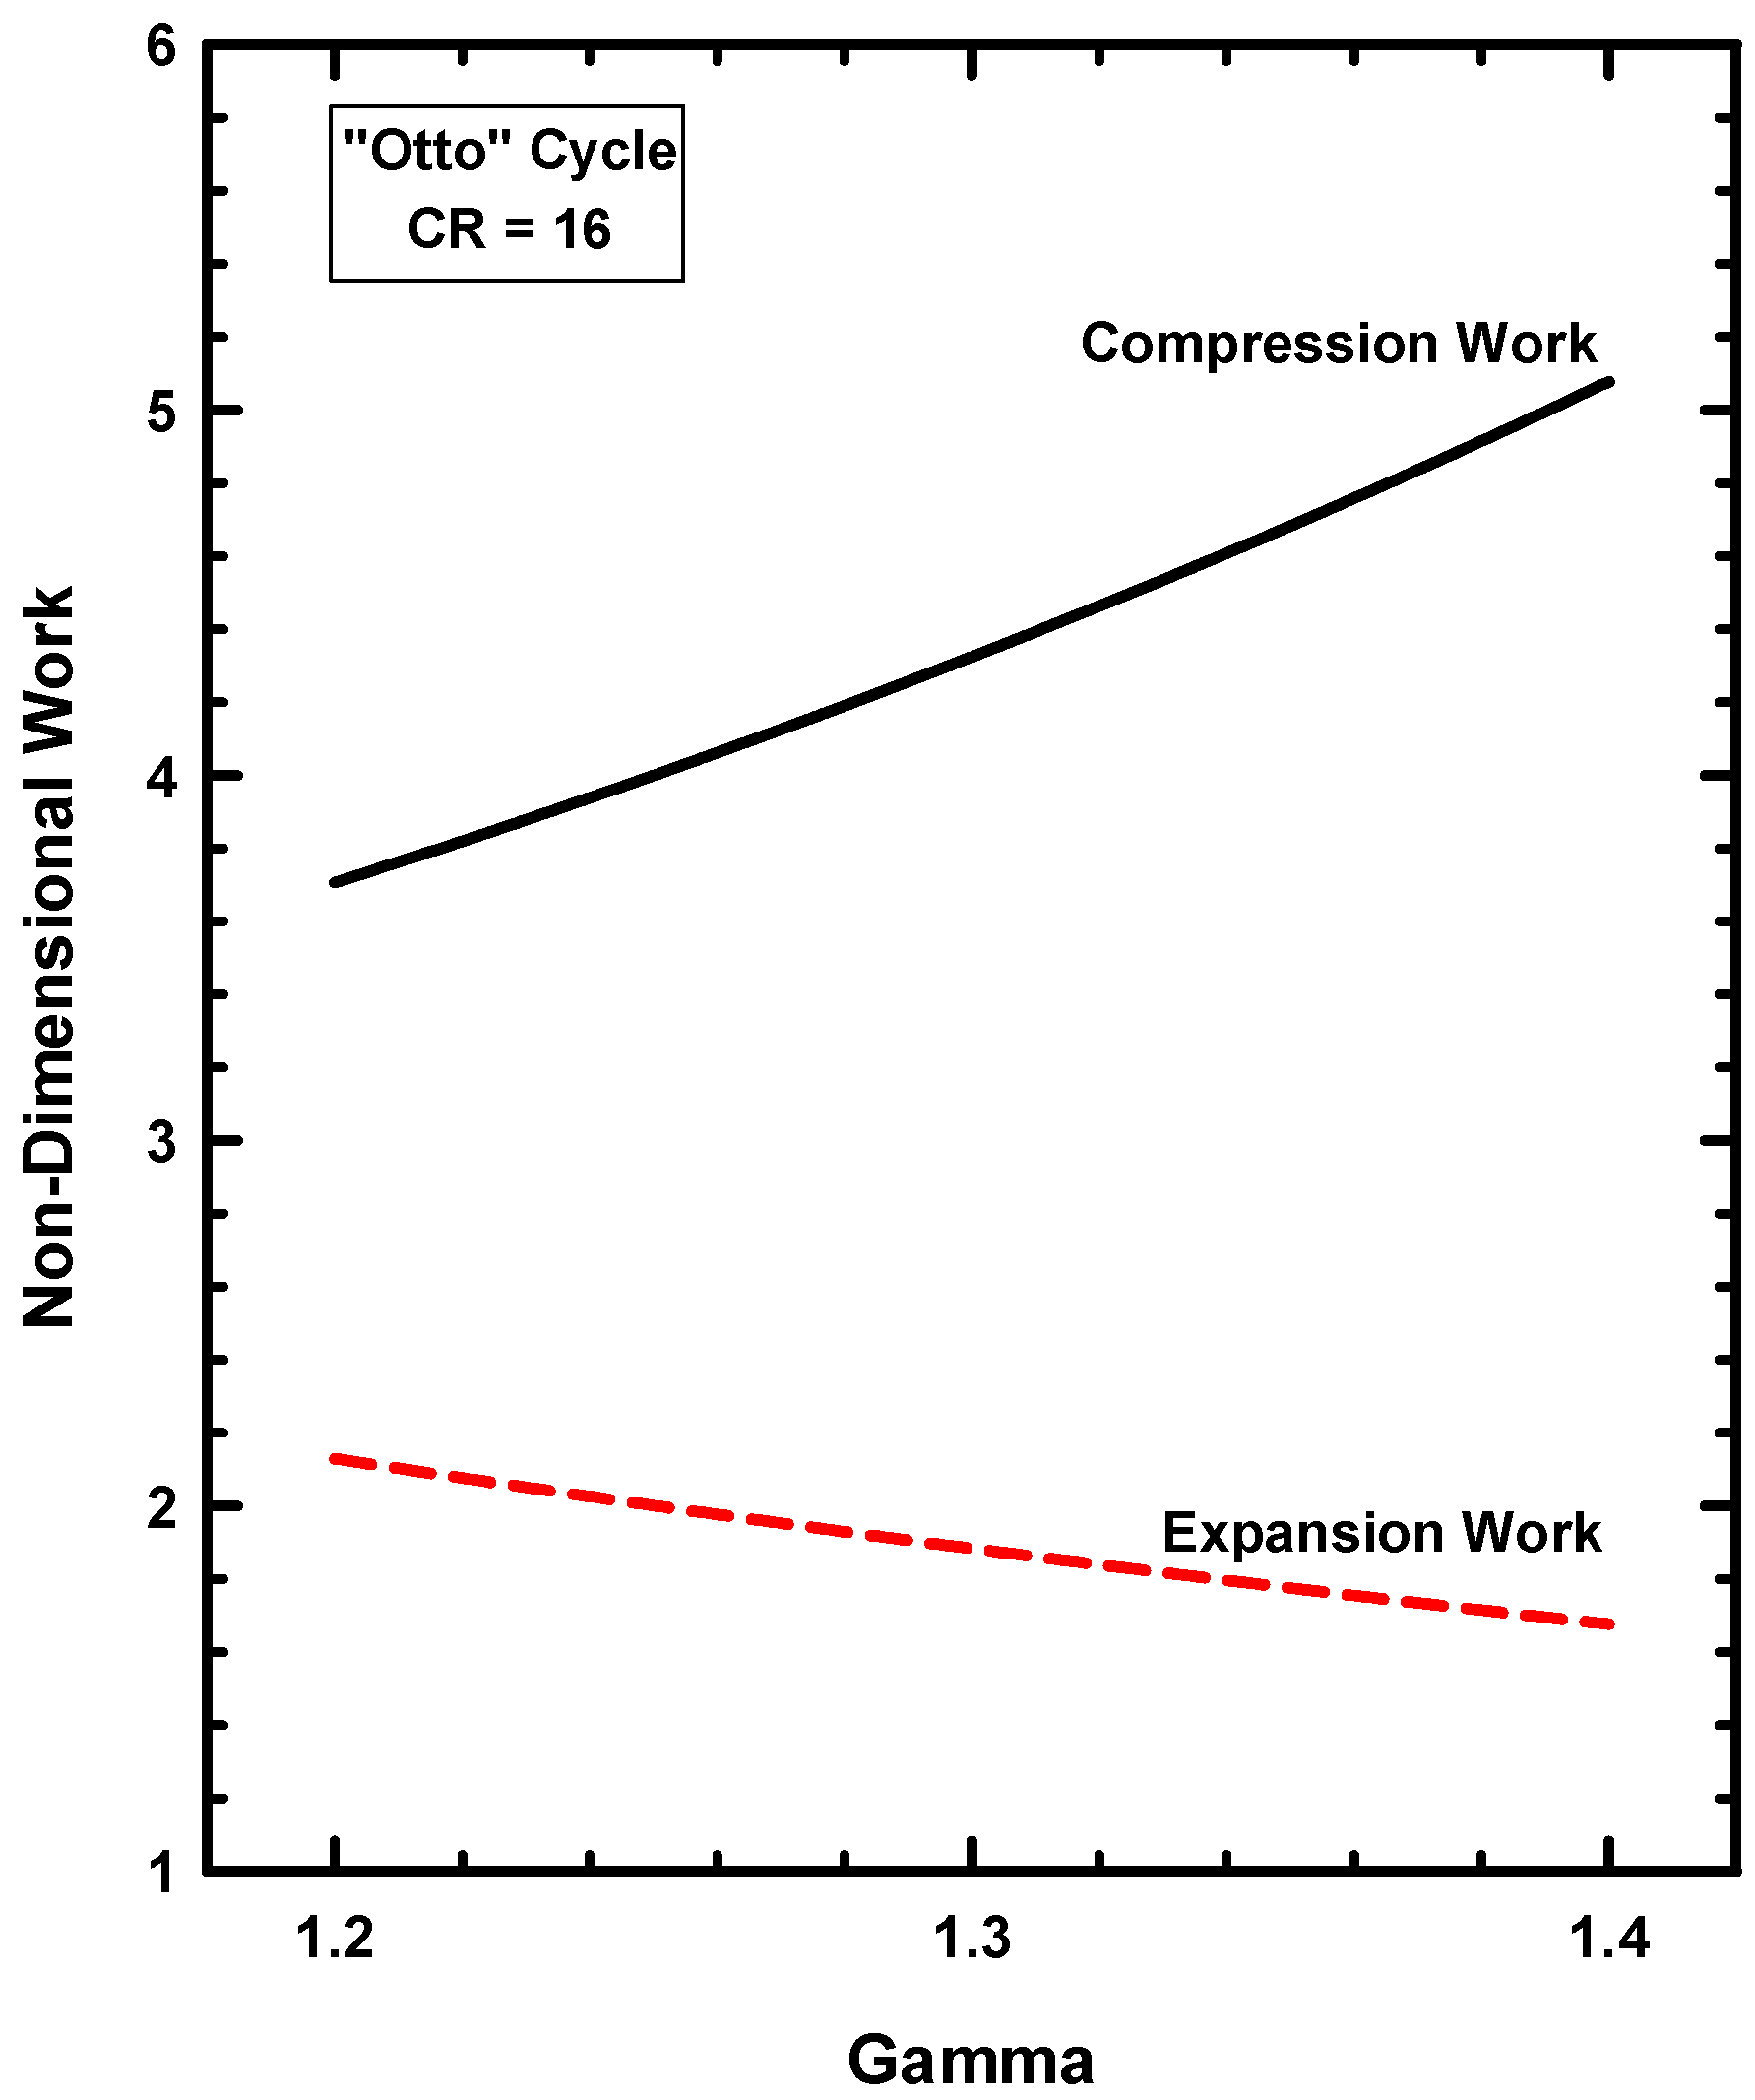
6.4. Thermodynamics of the Otto Cycle

As mentioned above, two items of the Otto cycle that are relevant to actual IC engines are the ratio of specific heats and compression ratio. The following is a brief summary of the role of the ratio of specific heats on engine performance and thermal efficiency. Complete details may be found elsewhere [9,10].
The ratio of specific heats is often given the symbol gamma (γ). For simplicity, the expression “ratio of specific heats” will be replaced with “gamma” in the following. Although gamma is the property used throughout this discussion, the specific heats are the primary properties of importance. Gamma and the specific heats are related:
gamma = γ = C p C v C p = C v + R γ = 1 + R C v
Note that gamma increases when the specific heats decrease.
Figure 25 shows the cylinder pressure as a function of the cylinder volume for the Otto cycle. Isentropic compression is from 1 to 2; constant volume heat addition is from 2 to 3; isentropic expansion is from 3 to 4; and constant volume heat rejection is from 4 to 1. In the following discussion, the state points (1, 2, 3, and 4), as denoted in the figure, will be used.
Using the simple Otto cycle, the effects of gamma can be demonstrated for the compression, heat addition, and expansion processes. The isentropic compression work is given by
W c o m p m R T 1 = ( C R γ 1 1 ) γ 1
This result means that the compression work increases as gamma increases. This is a slight negative effect regarding the thermal efficiency. Figure 26 shows the increase of this non-dimensional work as a function of gamma for a compression ratio of 16.
The heat addition results in temperature and pressure increases, and these are given by
Δ T = Q i n C v ( Δ p ) v = m R V Δ T = m R V Q i n C v
As the specific heats decrease (gamma increases), the temperature and pressures after the heat addition increase. These higher pressures are the source of the increased expansion work for increases of gamma. This is the major effect of gamma on engine thermal efficiency, and is representative of actual engines [10].
For the isentropic expansion process,
W exp m R T 3 = ( 1 1 C R γ 1 ) γ 1
As gamma increases, the expansion work decreases. This is a slight negative effect regarding the thermal efficiency. Figure 26 shows the decrease of this non-dimensional work as a function of gamma for a compression ratio of 16.
In summary, for increases of gamma, the compression work increases, the expansion work decreases, and the heat addition results in increases of cylinder pressure. The net effect of increases of gamma is increases of the thermal efficiency (Figure 24).
For a paper on the thermodynamics of IC engines, a discussion of the Otto cycle is needed, since the Otto cycle is often cited as a model of IC engines. As pointed out here, the Otto cycle is an incorrect model, since it represents a heat engine and not a chemical conversion device. This means that the Otto cycle contains no information on the combustion process, and in particular, on the irreversibilities of the combustion process. In spite of this major weakness, the Otto cycle does represent the effects of specific heats and compression ratio in an approximately correct fashion. In fact, the Otto cycle allows the effects of the specific heats on thermal efficiency to be demonstrated. The full simulation of IC engines includes these same effects, but it is much more difficult to separate the individual effects of specific heats [9,10].

7. Summary and Conclusions

7.1. Summary

This paper provided examples that demonstrate the importance of thermodynamics relative to internal combustion engines. An engine cycle simulation was used for the majority of the work, and employed both the first and second laws of thermodynamics. The major focus of this work was related to increasing the thermal efficiencies. Some of the results reinforced well known ideas about achieving higher efficiencies. Other portions of this work revealed deeper insights about the important approaches for attaining higher efficiencies. Some of the major conclusions and findings are summarized next.
Throughout these examples, the importance of the ratio of specific heats (gamma) was demonstrated. In particular, for engine operation or designs that result in lower combustion temperatures, gamma increases, and this results in higher levels of conversion of thermal energy to work. More details on the importance of gamma may be found elsewhere [10].

7.2. Thermodynamics of LHR Engines

  • A low heat rejection engine concept was examined by increasing the cylinder wall temperatures. As the cylinder wall temperature increased, the heat losses decreased, and the thermal energy of the cylinder gases increased.
  • Even for the extreme conditions examined (a cylinder wall temperature of 1500 K), very little of the retained thermal energy could be realized as addition work. This is consistent with the majority of the experimental results.
  • The paper outlined a series of reasons for the difficulty of converting the reduction of heat losses into work.
  • The retention of thermal energy (even if no addition work is produced) could be advantageous, since the exhaust gas energy may be useful for turbo-charging or other applications.

7.3. Thermodynamics of Exhaust Gas Dilution

  • Both external and internal exhaust gas dilution were examined.
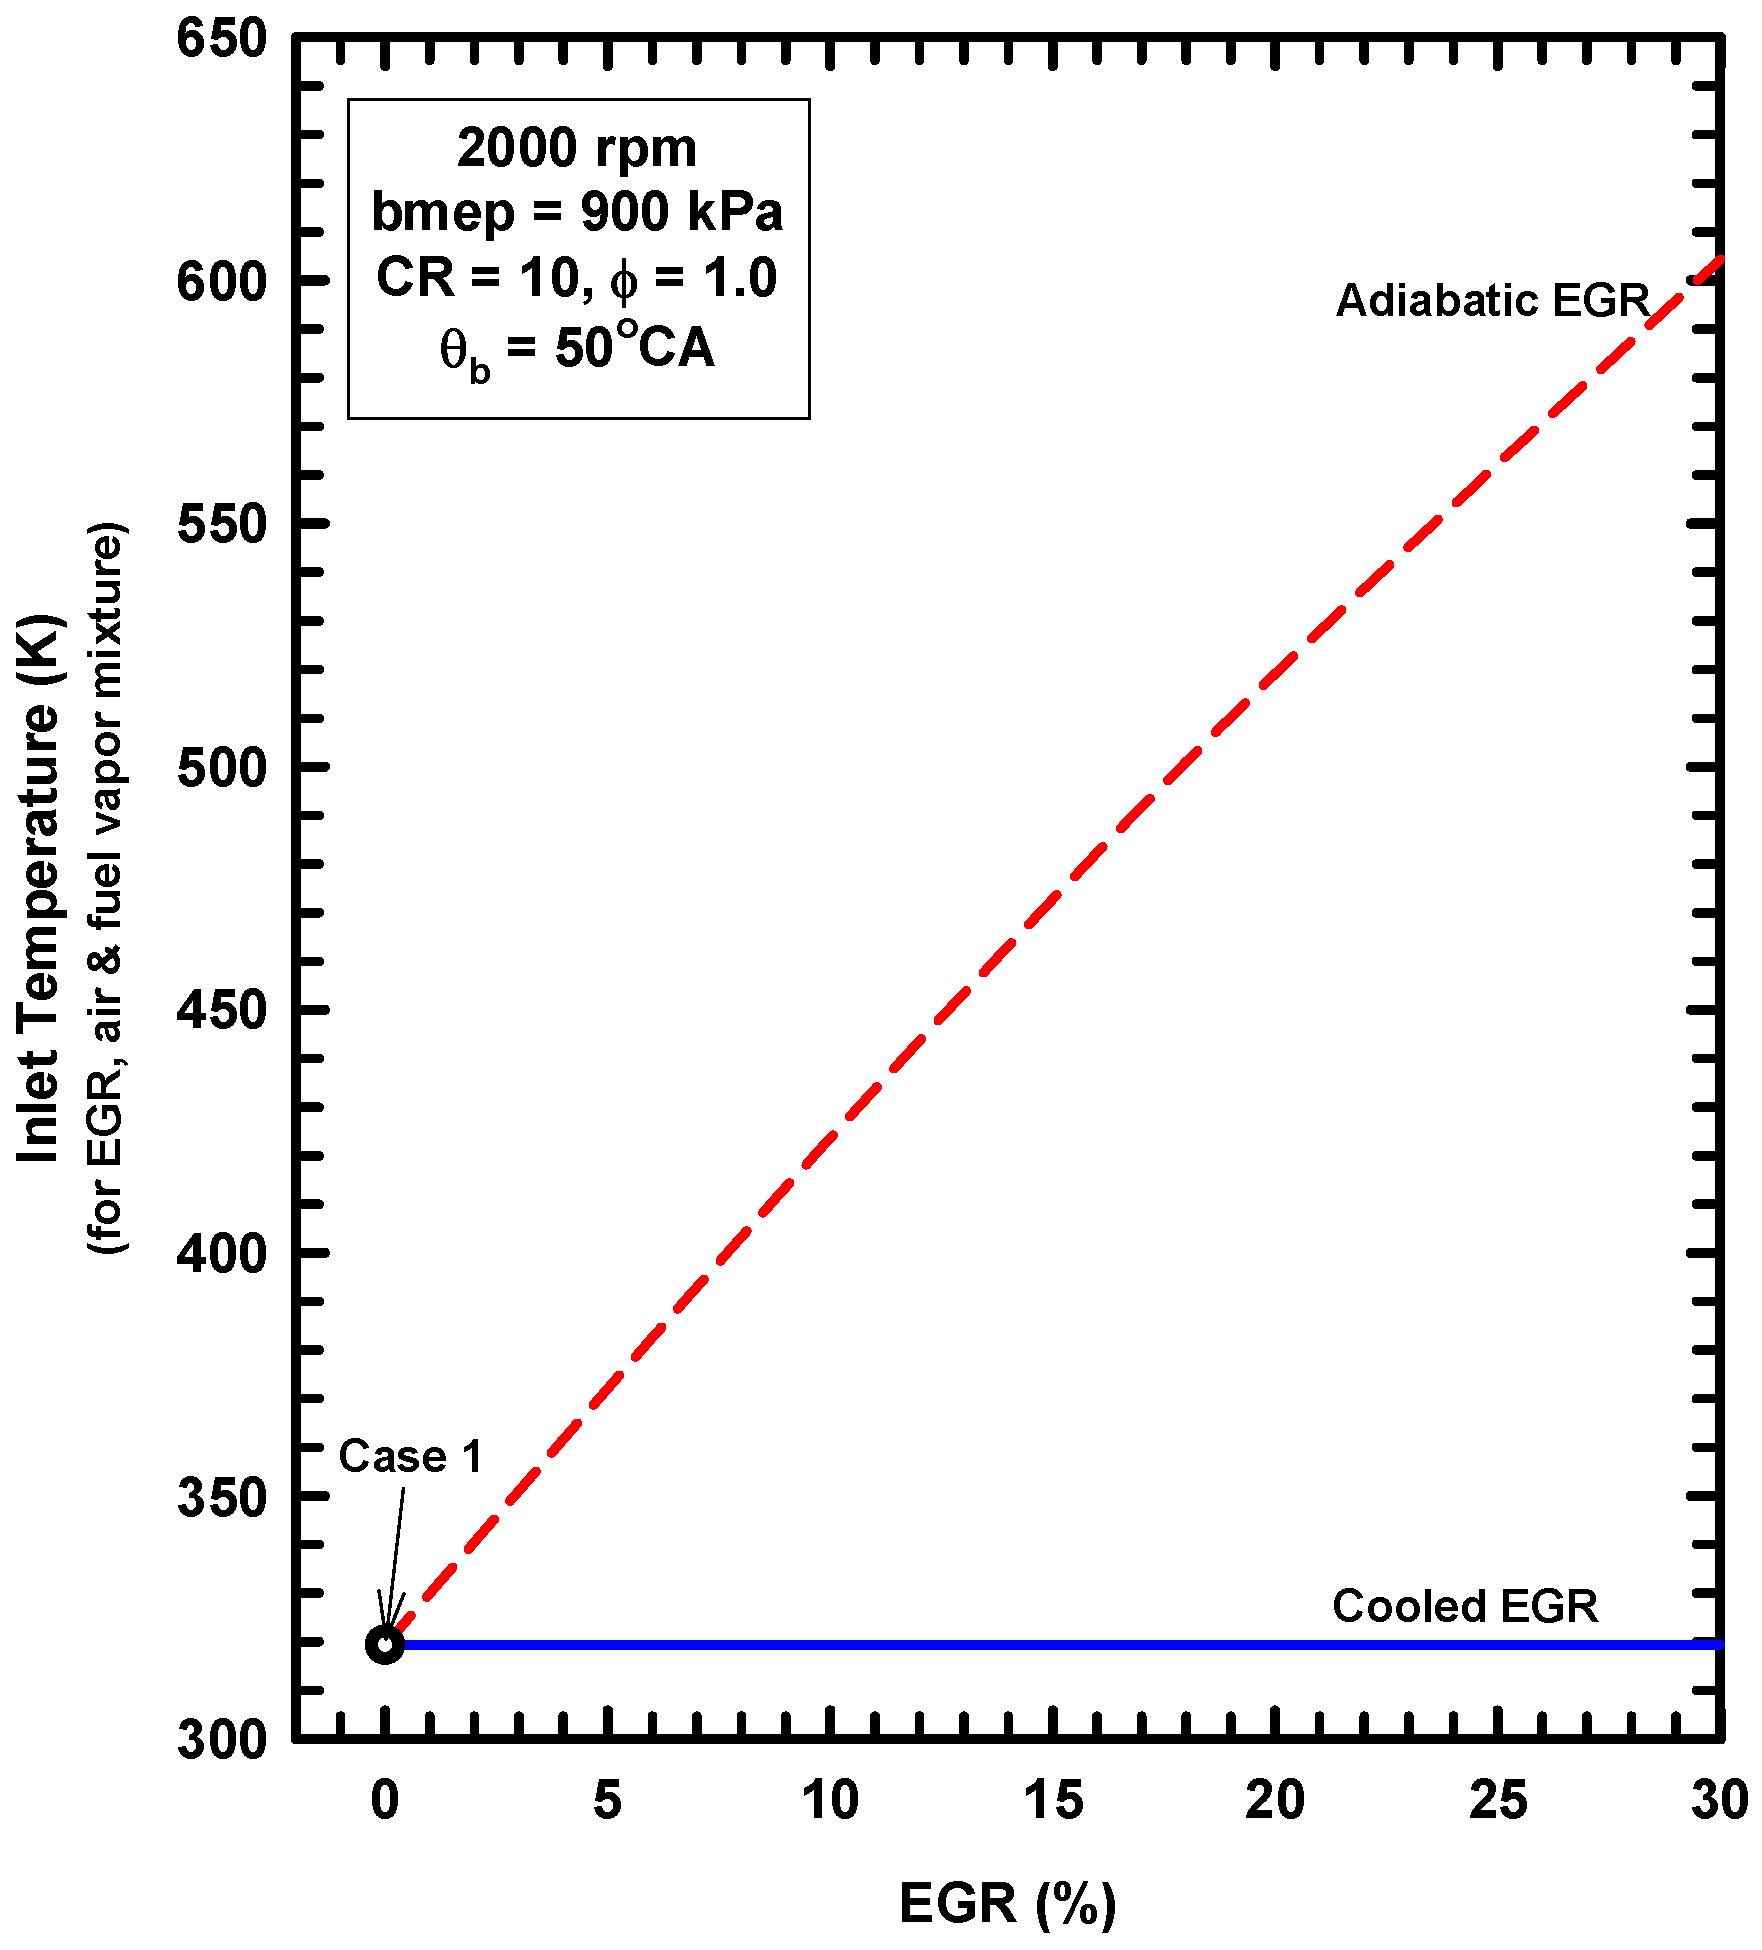
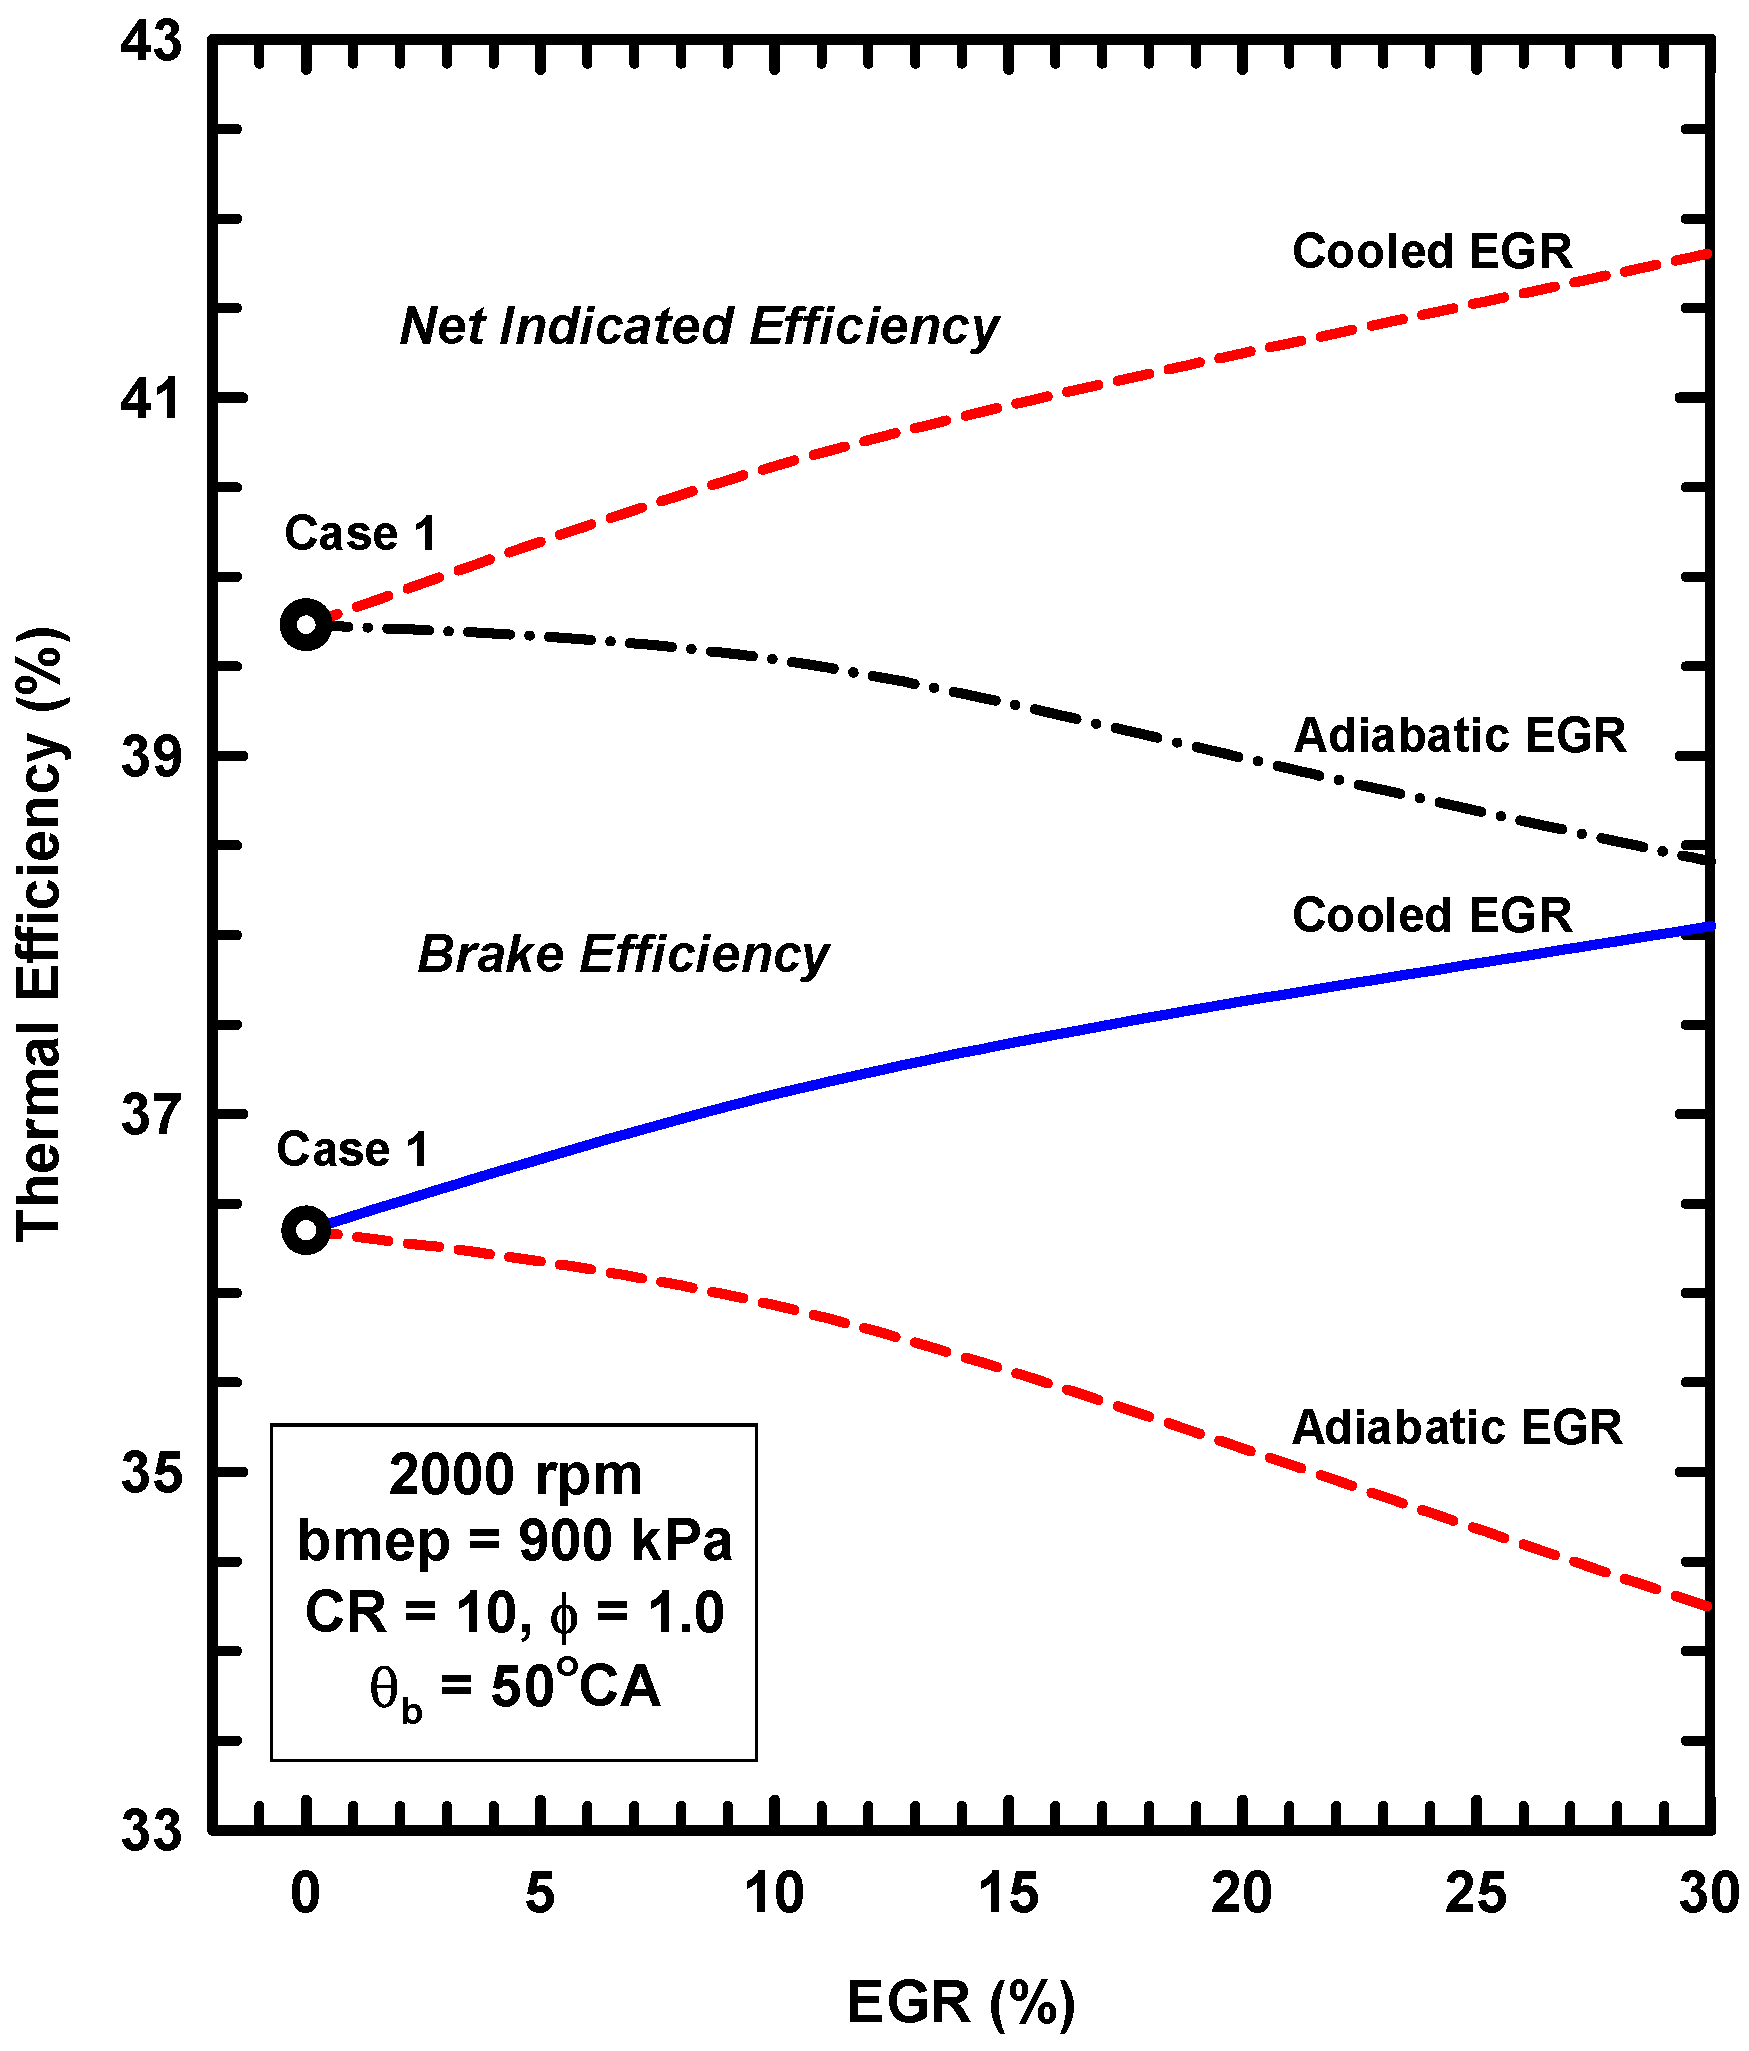
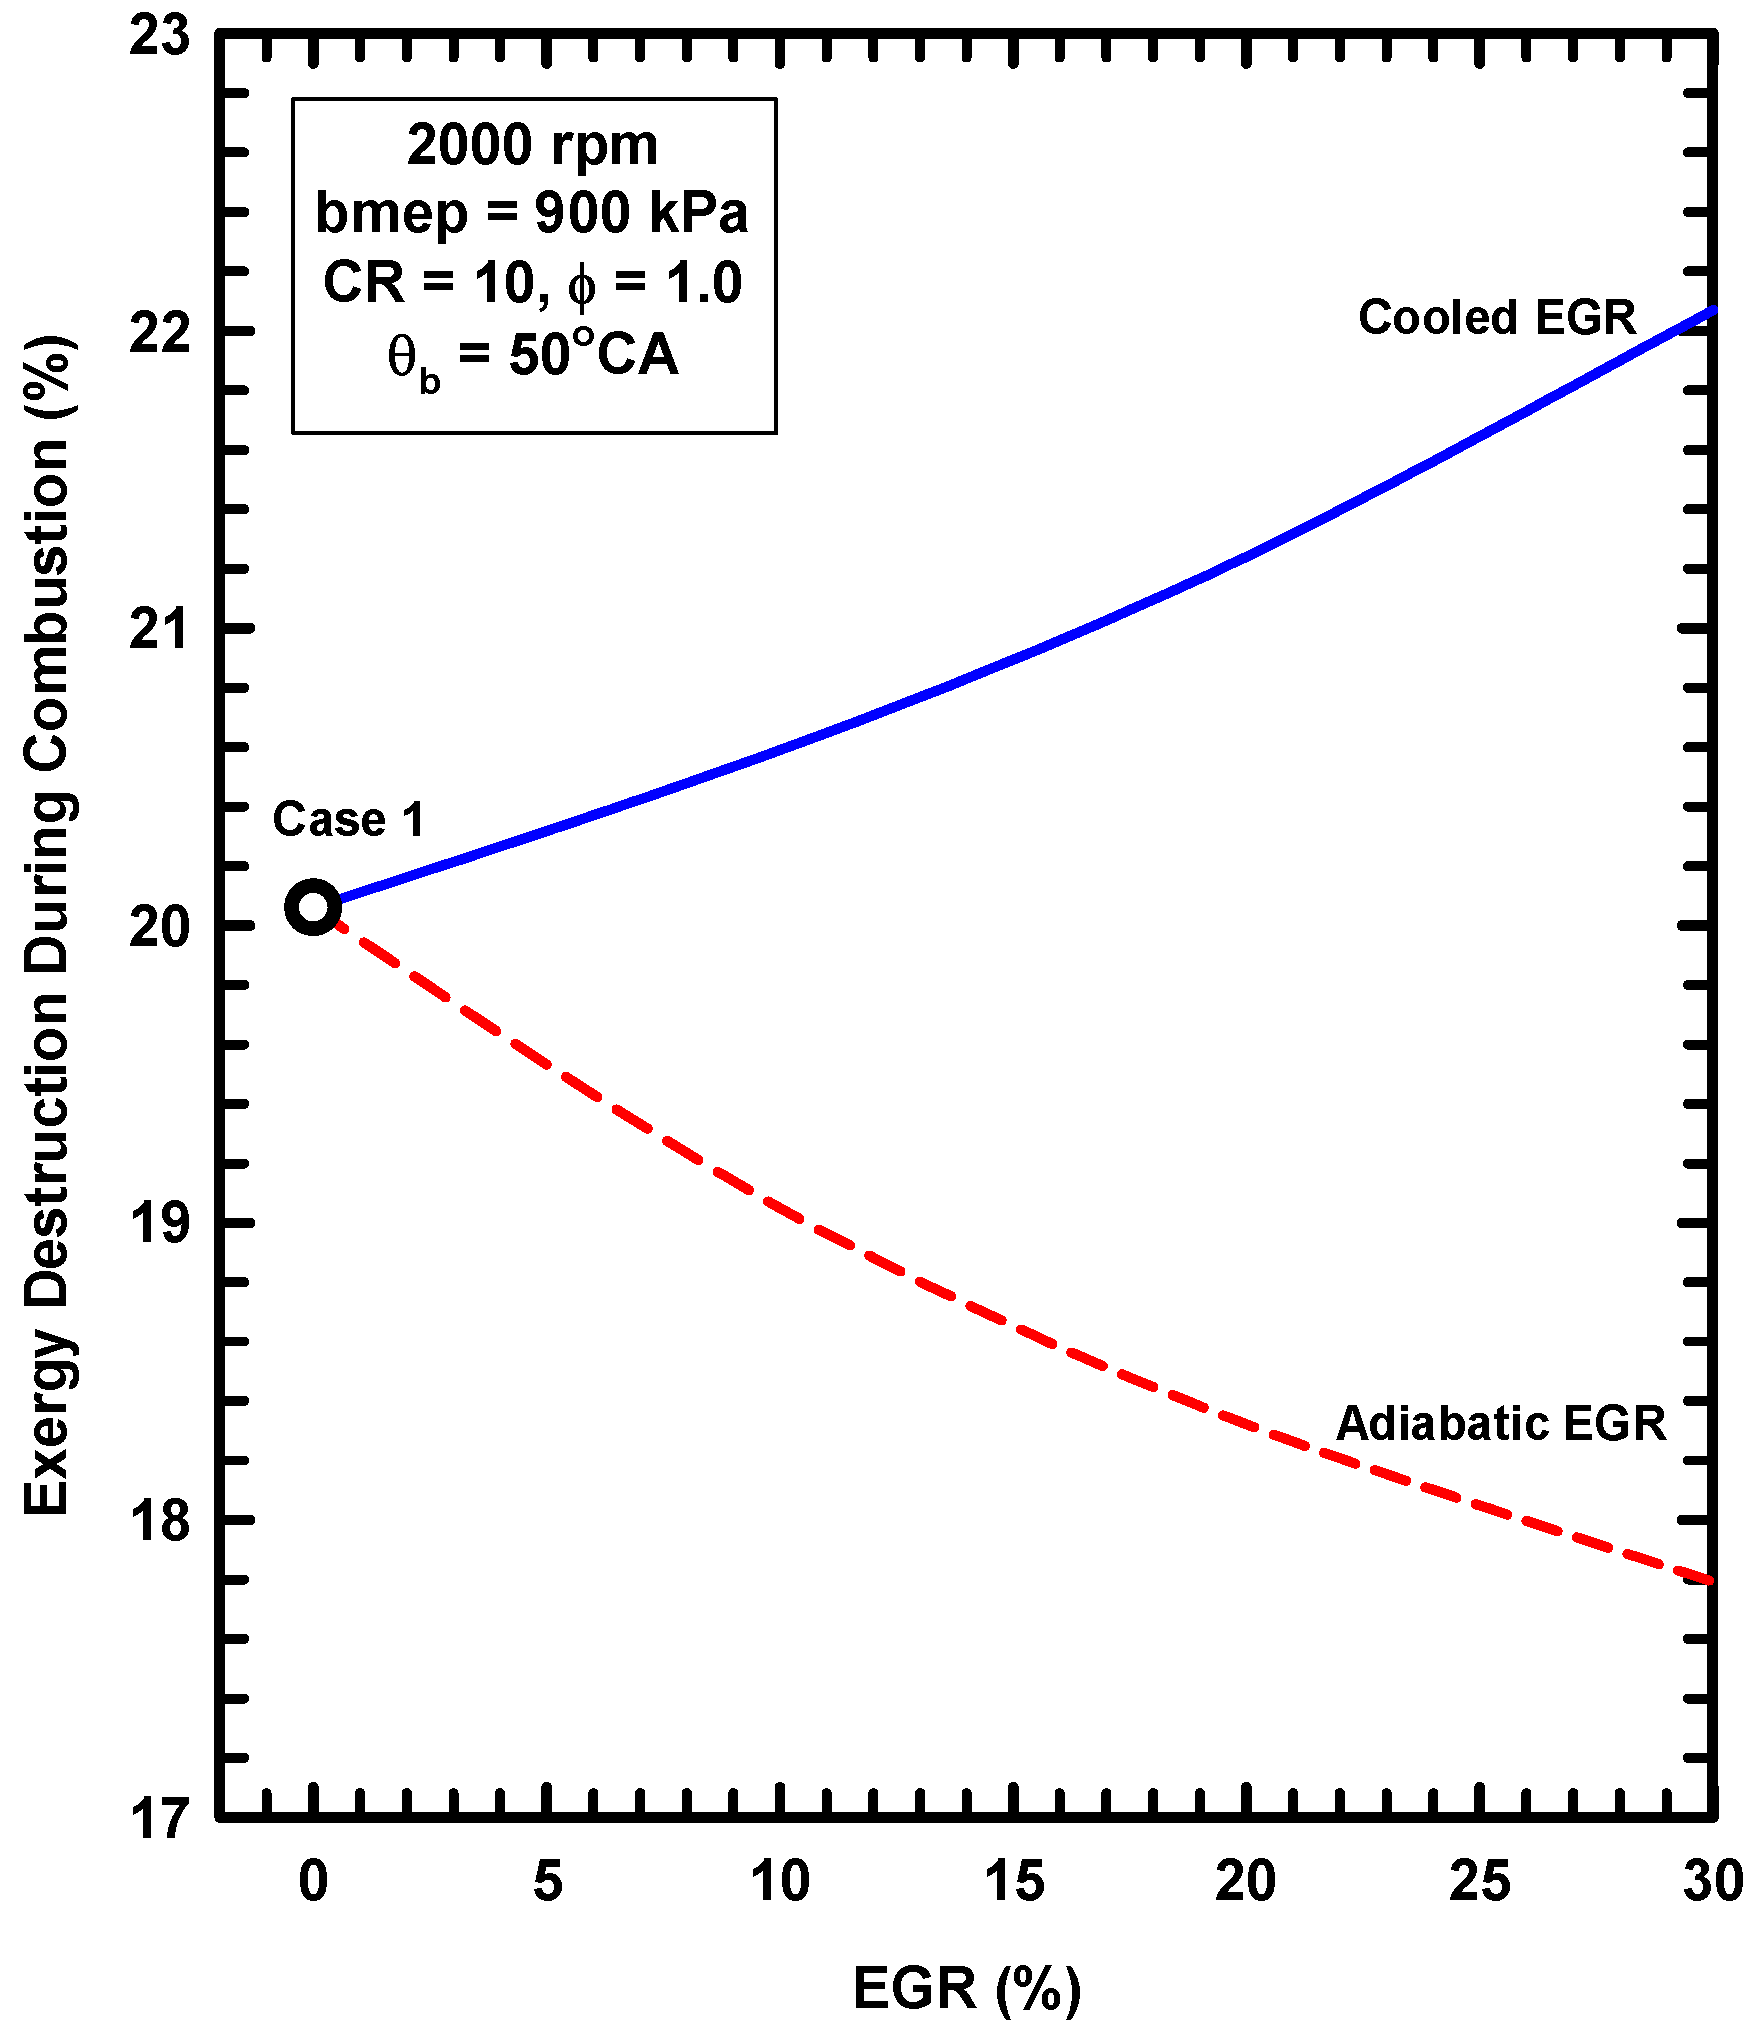
  • External exhaust gas dilution can use some level of cooling. This work examined an adiabatic EGR configuration and a cooled EGR configuration.
  • The cooled EGR configuration provides significant efficiency benefits due to decreased heat losses and increases of the ratio of specific heats in spite of modest increases of exergy destruction during combustion.
  • The adiabatic EGR configuration resulted in lower efficiencies due to increases of the heat losses in spite of modest reductions of exergy destruction during combustion.
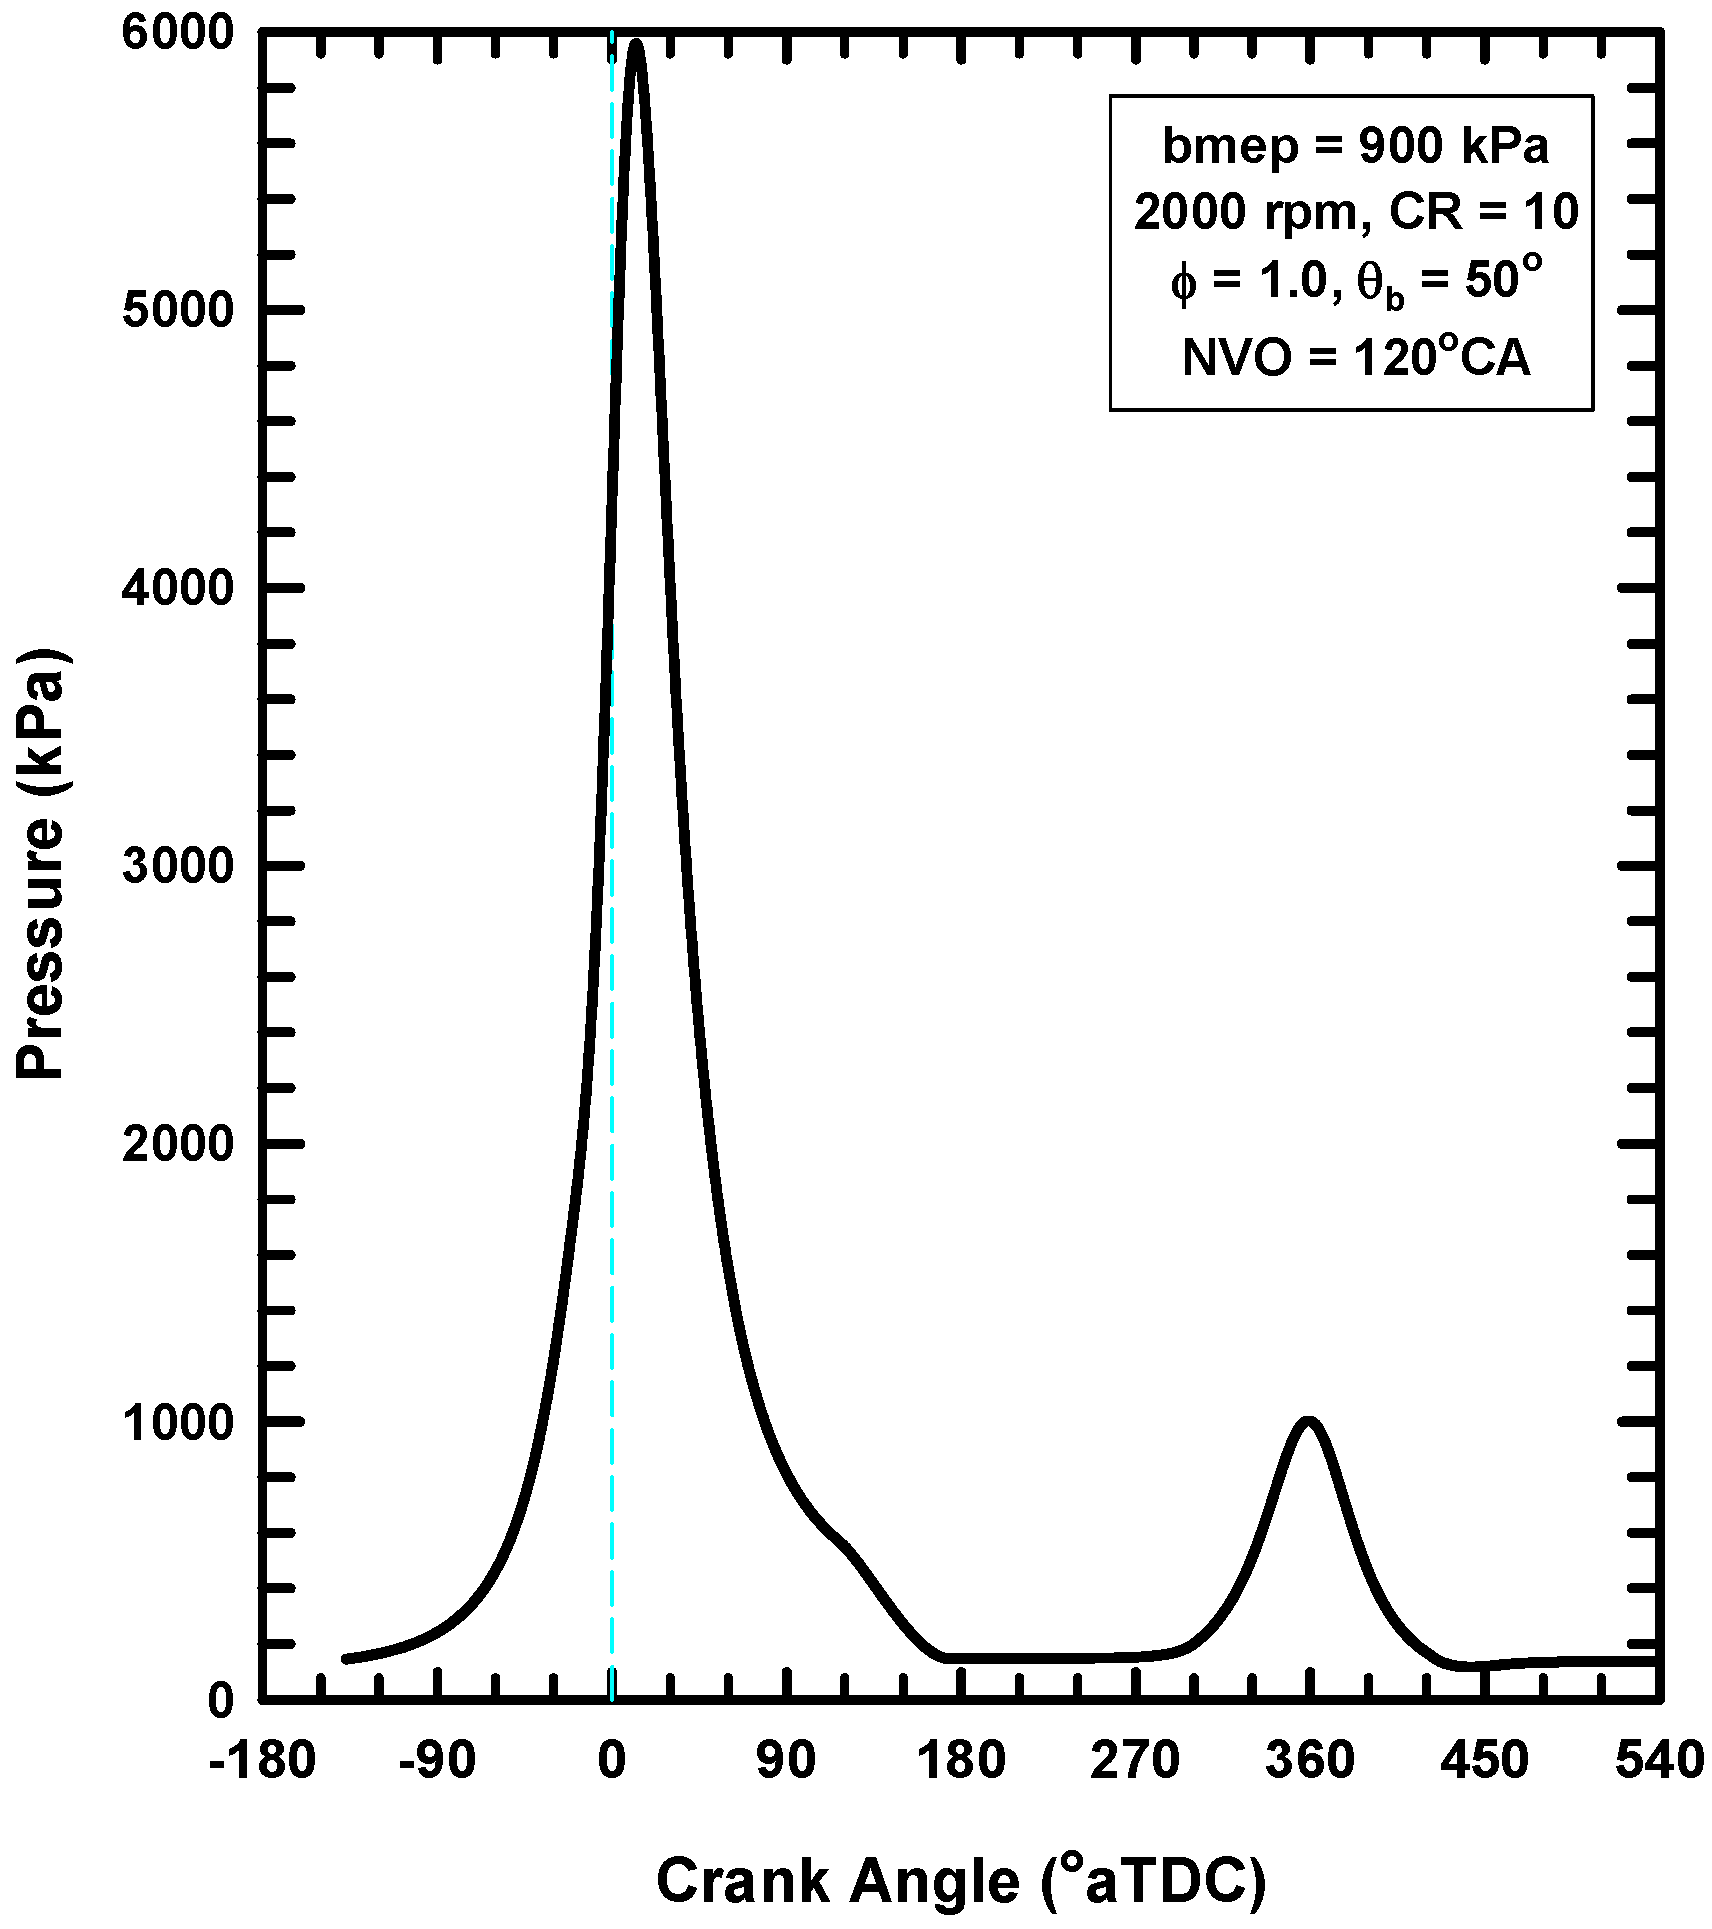
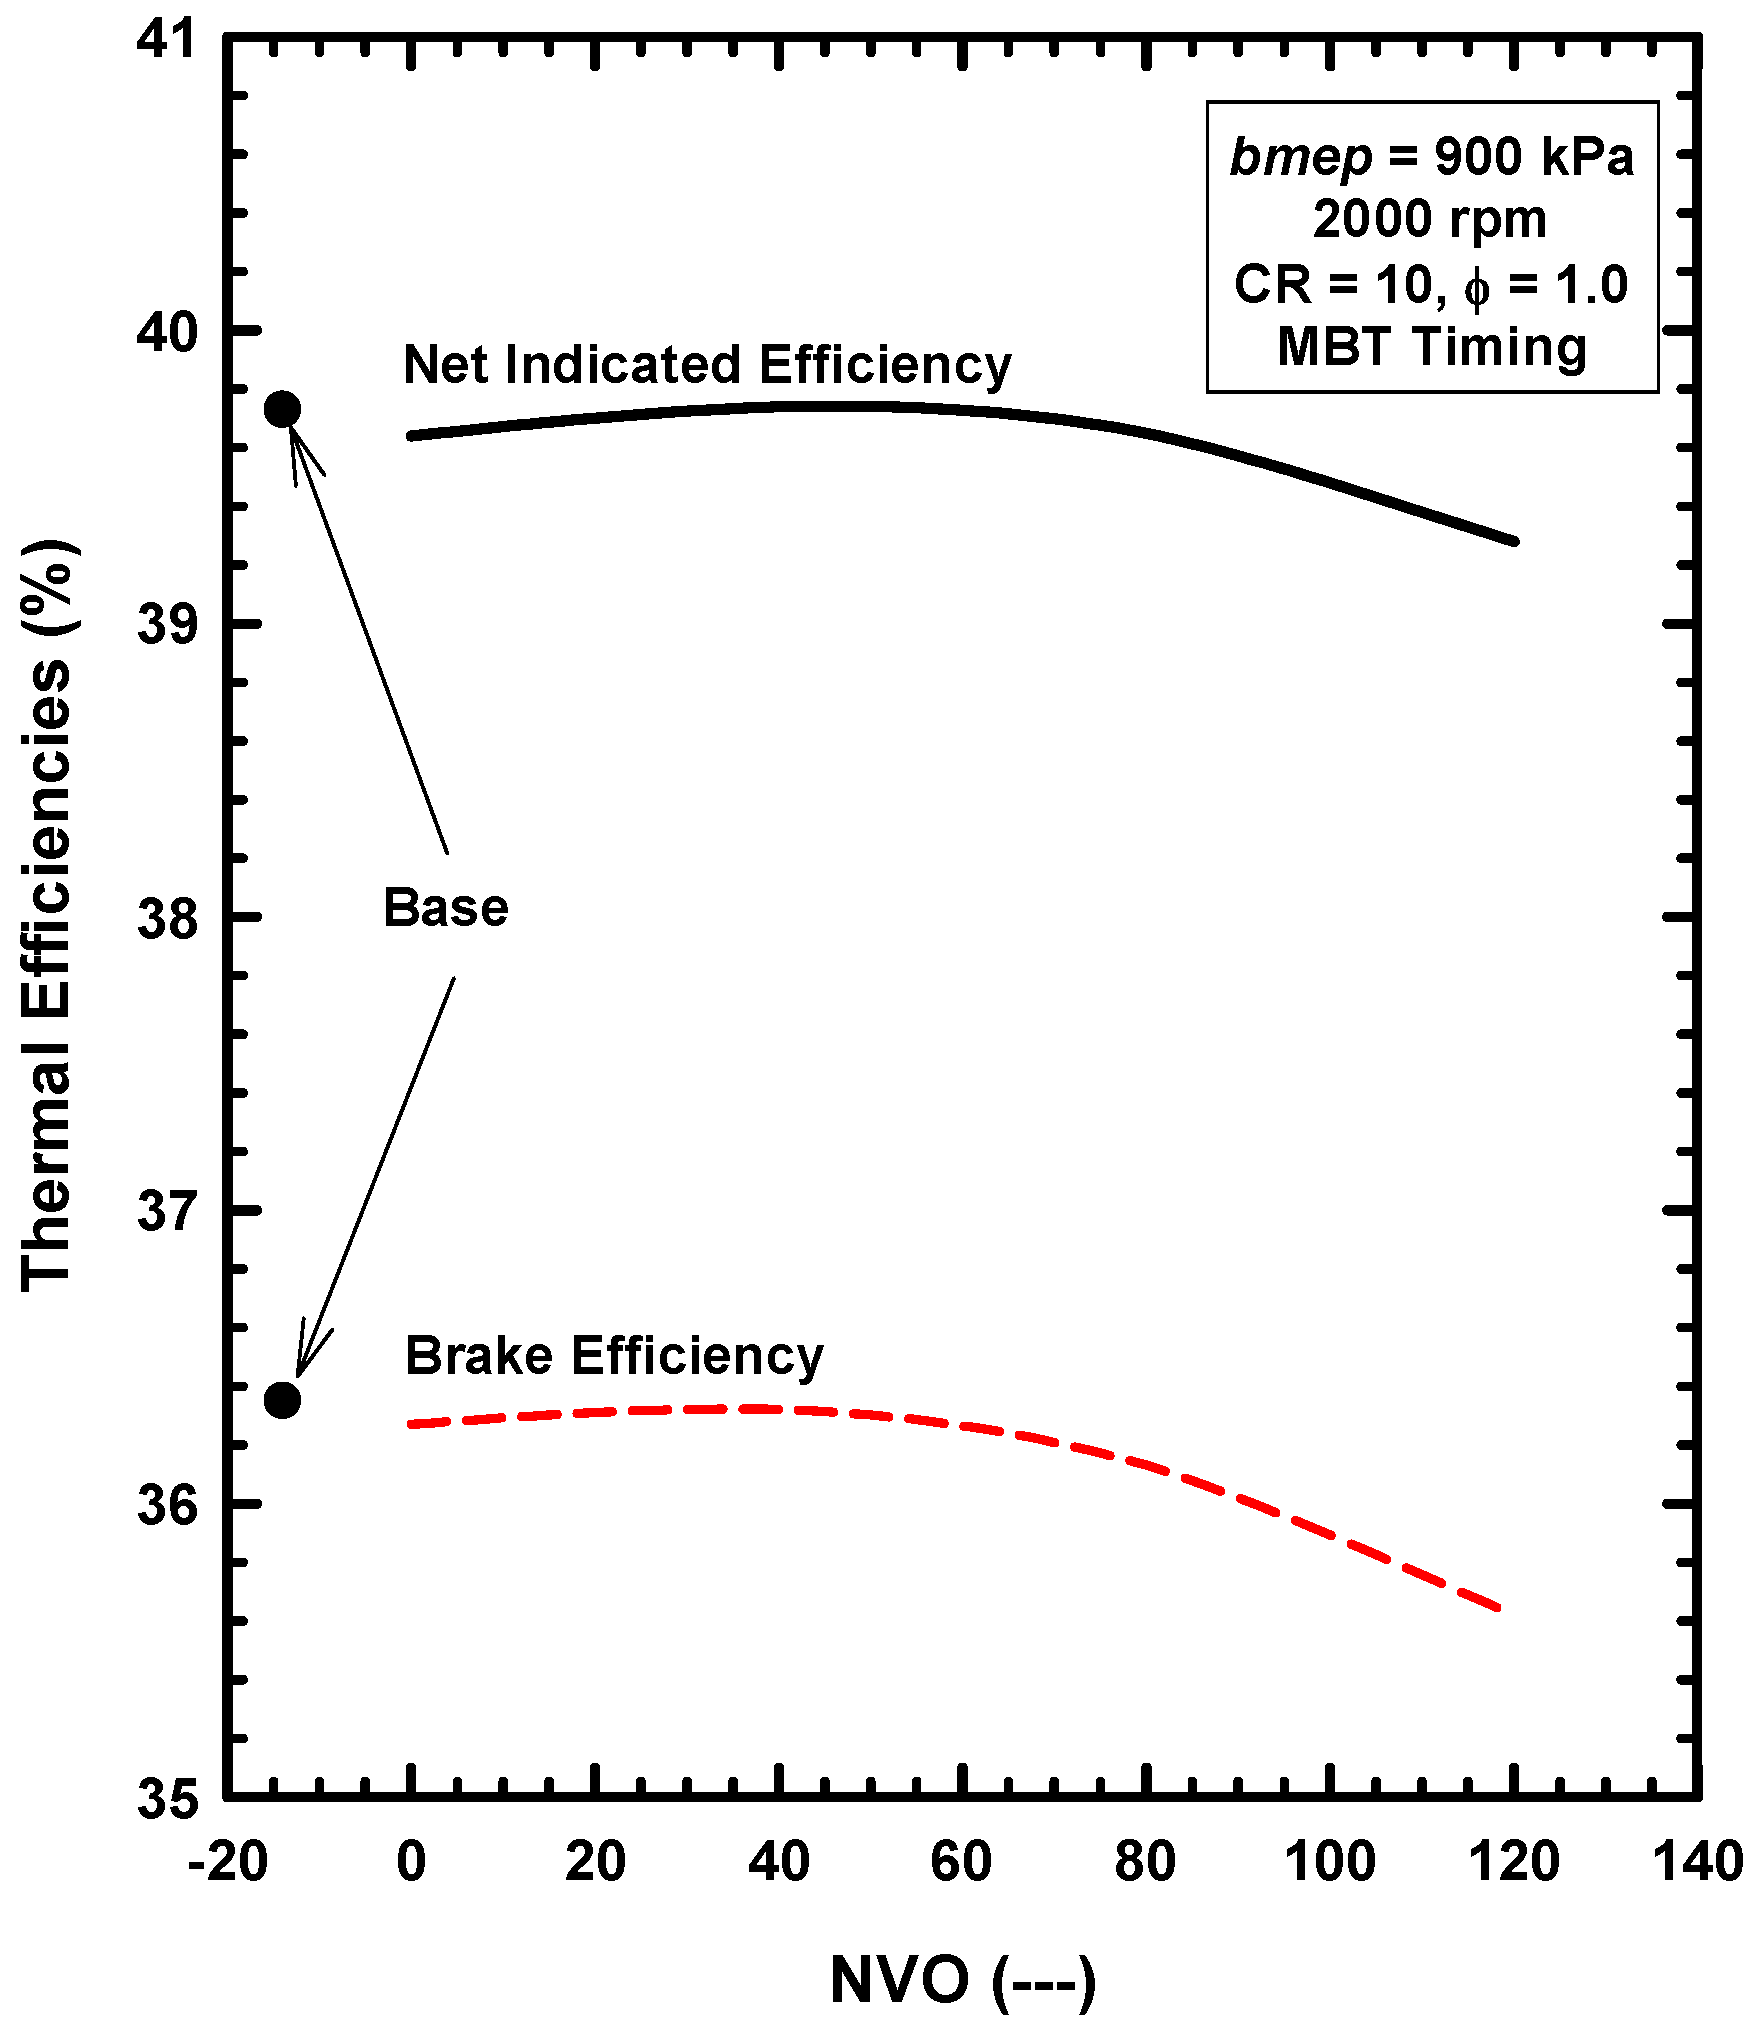
  • The use of negative valve overlap results in increased retention of combustion gases. This approach provided results that were similar to the use of the adiabatic EGR configuration.

7.4. Concerning the Otto Cycle

  • The classical Otto cycle was reviewed, and identified as an analysis for heat engines and not chemical conversion devices such as IC engines.
  • The Otto cycle does, however, possess three thermodynamic characteristics that are consistent with IC engines. These are (1) the mechanical advantage of increasing compression ratio, (2) the conversion of thermal energy to work, and (3) the compression and expansion processes.
  • The Otto cycle, however, is inconsistent with IC engines for several reasons. Perhaps the most important of these is that the Otto cycle does not include a combustion process, and therefore completely neglects the combustion irreversibilities.
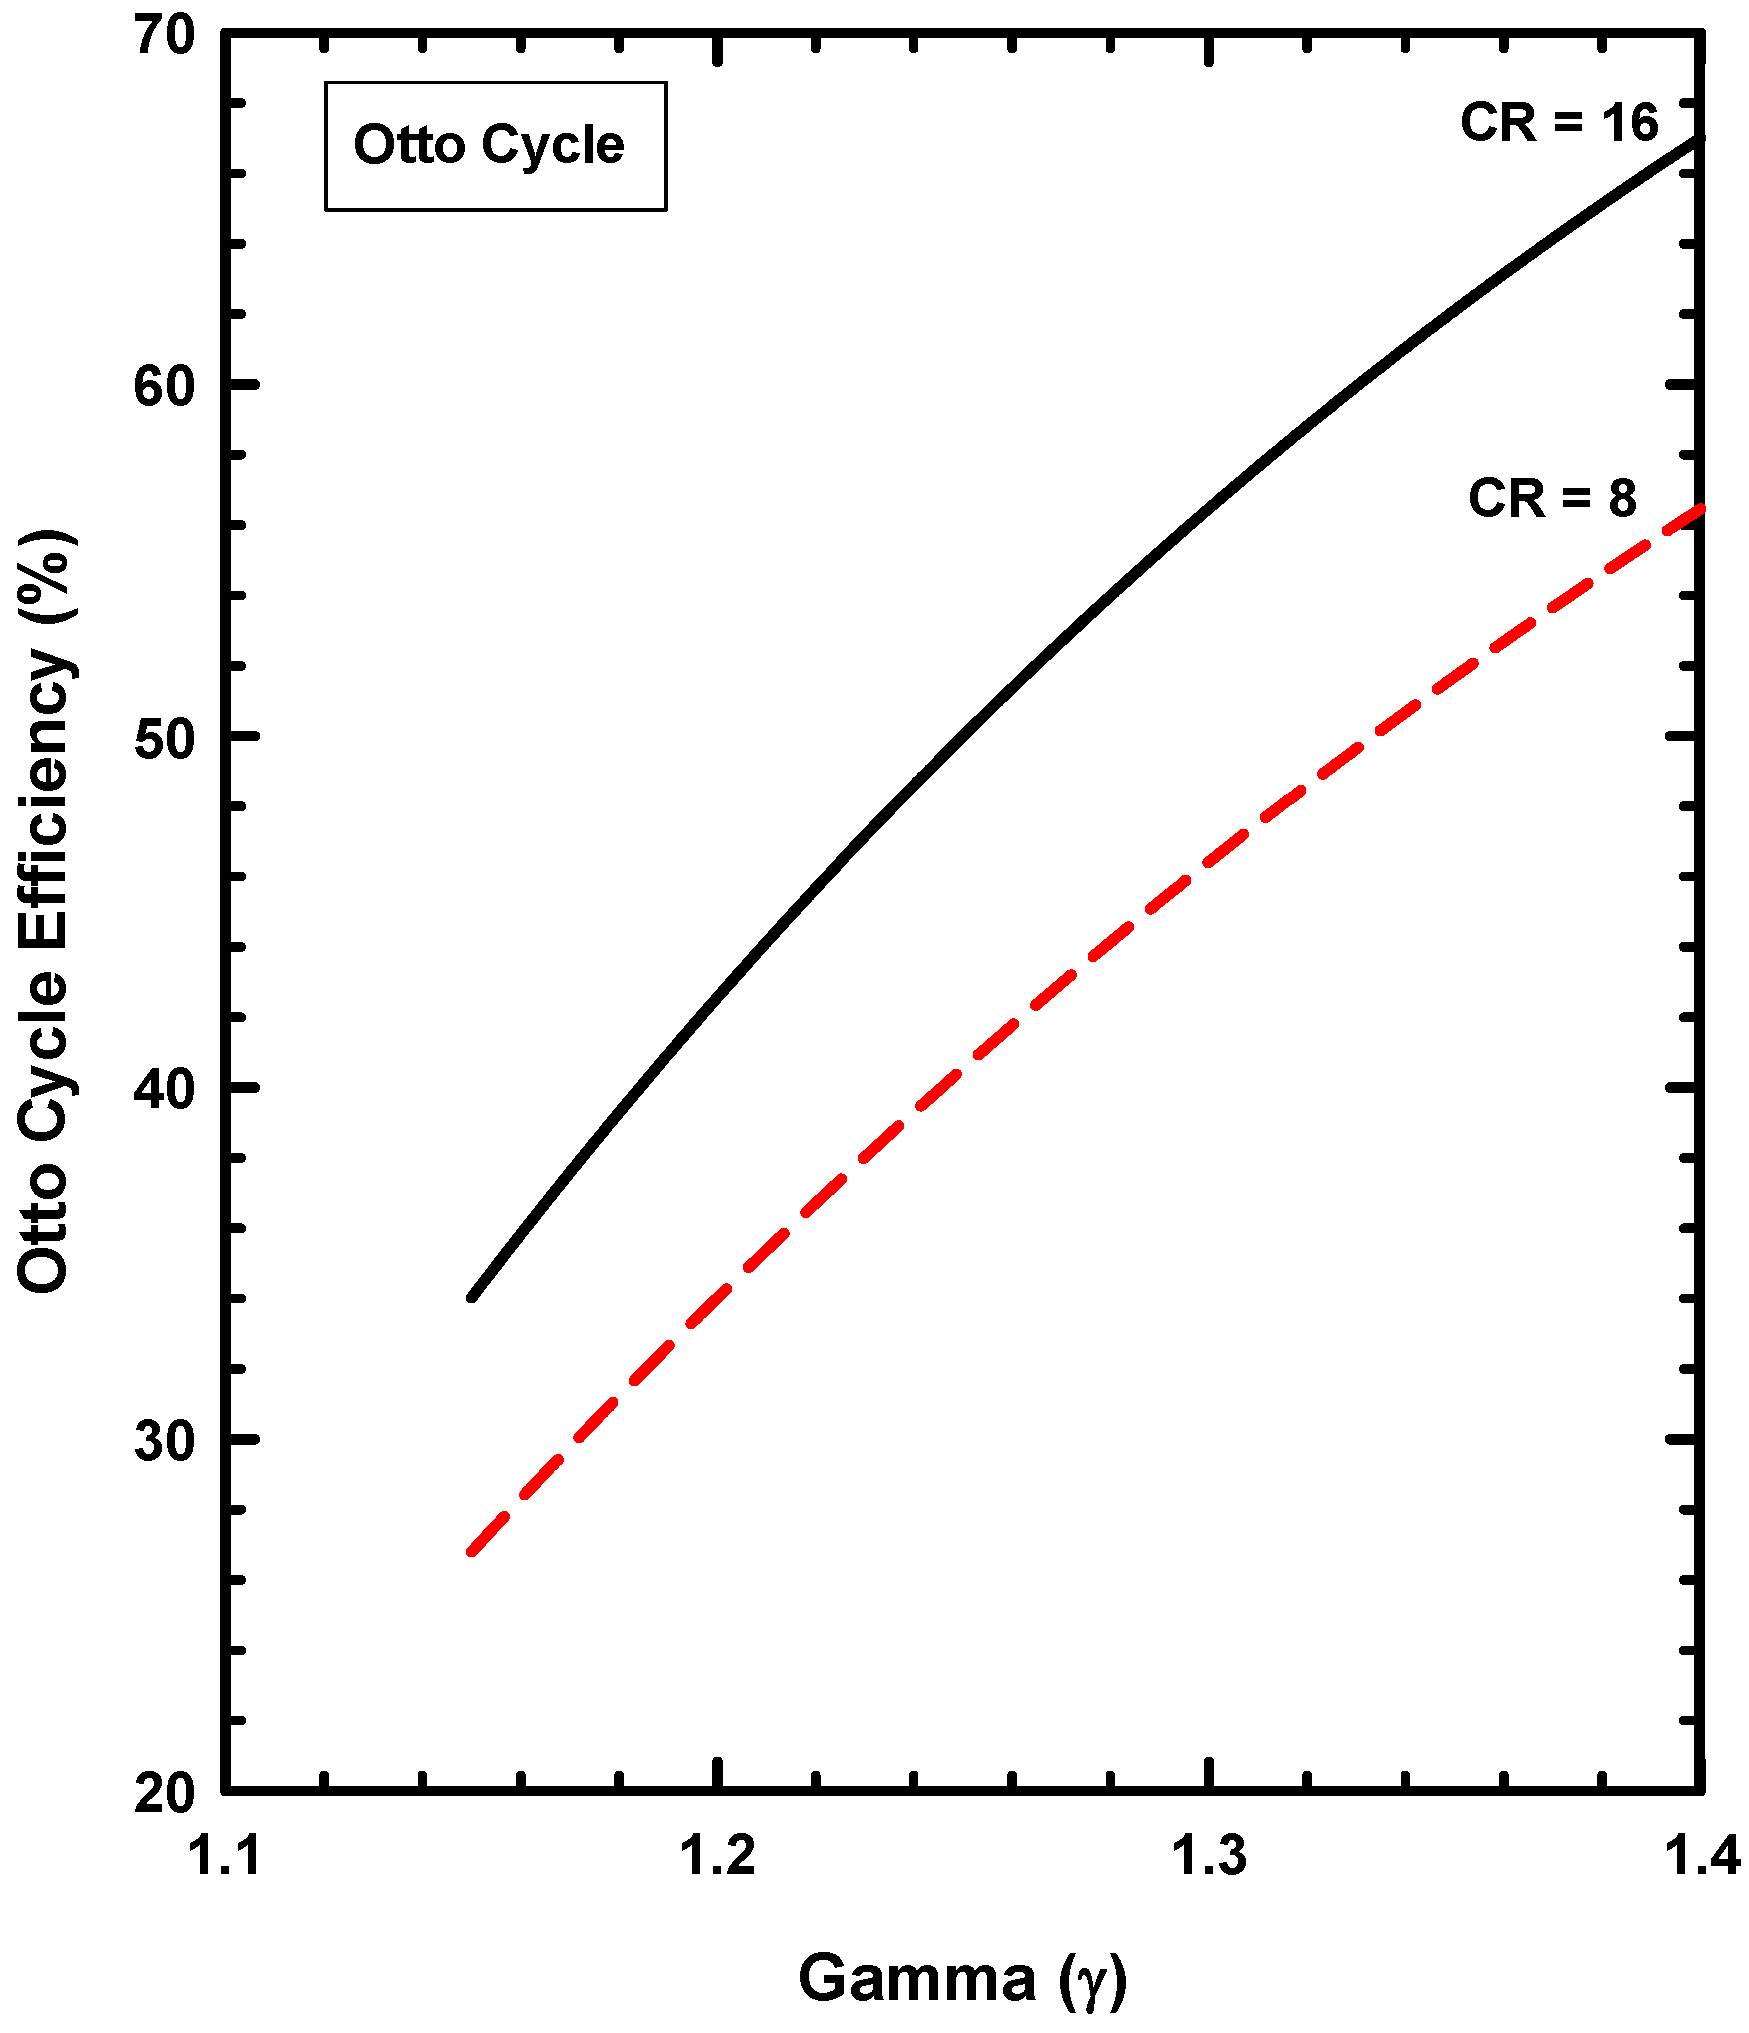
  • The Otto cycle does, however, allow the importance of the ratio of specific heats and compression ratio to be demonstrated.

Acknowledgments

No funding was received related to this work, and no funding was available for publication costs.

Conflicts of Interest

The author declares no conflict of interest.

Appendix A. Brief Review of Combustion Irreversibilities for IC Engines

In this appendix, the combustion irreversibilities associated with IC engines are briefly reviewed. In particular, the results presented here are designed to be contrasted with results from the Otto cycle. These results are intended to emphasize the fact that since the Otto cycle does not include combustion, these irreversibilities are absent. The engine cycle simulation described in the main part of this paper was used to obtain the following results. The same engine operating at 2000 rpm with a bmep of 900 kPa was used for this evaluation.
The conditions for these computations were selected to approach an ideal cycle: no heat transfer (htm = 0), no friction (fm = 0), short burn duration θb = 10 °CA), and lean mixture (φ = 0.2). In this way, these results represent the maximum possible efficiencies for an essentially ideal engine. Figure A1 shows the partition of the fuel energy among work, exhaust, and unburned fuel as a function of compression ratio. This curve represents the thermal efficiency. Since the IC engine is a chemical conversion device, for these ideal conditions, the thermal efficiency could be close to 100%. These results (largely from the first law of thermodynamics) do not provide insight about the real limitations. This is shown next.
Figure A2 shows the partitions of the fuel exergy among work, destruction during combustion, exhaust, and other items. These other items include a small exergy destruction due to the mixing of the incoming charge with the residual gases (~1%) and unburned fuel (0.7%). The percentage of the fuel exergy (Figure A2) and the percentage of the fuel energy (Figure A1) assigned to work are almost identical. The work value in “kJ” is the same, but because the fuel energy (LHV) and the fuel exergy are about 3% different (for isooctane), the percentages are slightly different.
Figure A1. Partition of the fuel energy among work, exhaust, and unburned fuel as a function of compression ratio for the ideal conditions.
Inventions 03 00033 g0a1
Figure A2. Partition of the fuel exergy among work, destruction, exhaust, and other items as a function of compression ratio for the ideal conditions.
Inventions 03 00033 g0a2
The next item in Figure A2 is the percentage of the fuel exergy destroyed during combustion. For these conditions, this ranges from 26% to 32%. This, then, is the important insight from the second law of thermodynamics (and is not part of the results using only the first law). The importance of this information is that the exergy destroyed during combustion is significant, and is a large part of the reason for the less than 100% efficiency even for these ideal conditions. The remaining fuel exergy is contained in the exhaust and the unburned fuel component. The exergy in the exhaust is due to the less-than-perfect conversion of thermal energy to work. In theory, as the compression ratio increases, this percentage approaches zero.
Since the Otto cycle is a model of a heat engine (and has no combustion process), the irreversibility of combustion is absent. So, in general, the Otto cycle is an incorrect model of the IC engine and does not include the important aspect of combustion.

References

  1. Heywood, J.B. Internal Combustion Engine Fundamentals; McGraw-Hill Book Company: New York, NY, USA, 1988. [Google Scholar]
  2. Ferguson, C.R.; Kirkpatrick, A.T. Internal Combustion Engines—Applied Thermosciences, 3rd ed.; John Wiley & Sons, Inc.: Chichester, UK, 2016. [Google Scholar]
  3. Tracinski, R. Don’t Count Out the Internal Combustion Engine, RealClearFuture, 29 August 2016. Available online: http://www.realclearfuture.com/articles/2016/08/29/dont_count_out_the_internal_combustion_engine_111937.html (accessed on 14 April 2018).
  4. Topping, N. The Death of the Internal Combustion Engine, Huffpost, 9 December 2016. Available online: http://www.huffingtonpost.com/we-mean-business/the-death-of-the-internal_b_13533290.html (accessed on 14 April 2018).
  5. Howell, J.R.; Buckius, R.O. Fundamentals of Engineering Thermodynamics, 2nd ed.; McGraw-Hill, Inc.: New York, NY, USA, 1992. [Google Scholar]
  6. Moran, M.J.; Shapiro, H.N.; Boettner, D.D.; Bailey, M.B. Fundamentals of Engineering Thermodynamics, 8th ed.; John Wiley & Sons, Inc.: New York, NY, USA, 2014. [Google Scholar]
  7. Stone, R. Introduction to Internal Combustion Engines, 4th ed.; Palgrave Macmillan: London, UK, 2012. [Google Scholar]
  8. Carnot, N.L.S. Reflections on the Motive Power of Fire; Dover Publications: Paris, France, 1824. [Google Scholar]
  9. Caton, J.A. An Introduction to Thermodynamic Cycle Simulations for Internal Combustion Engines; John Wiley & Sons, Ltd.: Chichester, UK, 2016. [Google Scholar]
  10. Caton, J.A. On the importance of specific heats as regards efficiency increases for highly dilute IC engines. Energy Convers. Manag. 2014, 79, 146–160. [Google Scholar] [CrossRef]
  11. Caton, J.A. A multiple-zone cycle simulation for spark-ignition engines: Thermodynamic details. In Large-Bore Engines, Fuel Effects, Homogeneous Charge Compression Ignition, Engine Performance and Simulation, Vol. 2, ICEVol. 37–2, Proceedings of the 2001 Fall Technical Conference, Argonne, IL, USA, 23–26 September 2001; Paper No. 2001-ICE-412; Wong, V.W., Ed.; The ASME Internal Combustion Engine Division, American Society of Mechanical Engineers: New York, NY, USA; pp. 41–58.
  12. Caton, J.A. A Cycle simulation including the second law of thermodynamics for a spark-ignition engine: Implications of the use of multiple-zones for combustion. Trans. Soc. Autom. Eng. J. Engines 2003, 111–113, 281–299. [Google Scholar]
  13. Caton, J.A. An assessment of the thermodynamics associated with high efficiency engines. In Proceedings of the ASME 2010 Internal Combustion Engine Division Fall Technical Conference, San Antonio, TX, USA, 12–15 September 2010. [Google Scholar]
  14. Wiebe, J.J. Brennverlauf und Kreisprozess von Ver-Brennungsmotoren; VEB-Verlag Technik: Berlin, Germany, 1970. [Google Scholar]
  15. Caton, J.A. Comparisons of global heat transfer correlations for conventional and high efficiency reciprocating engines. In Proceedings of the ASME Internal Combustion Engine Division 2011 Fall Technical Conference, Morgantown, WV, USA, 2–5 October 2011. [Google Scholar]
  16. Hohenberg, G.F. Advanced Approaches for Heat Transfer Calculations; SAE Paper No. 790825; Society of Automotive Engineers: Warrendale, PN, USA, 1979. [Google Scholar]
  17. Sandoval, D.; Heywood, J.B. An Improved Friction Model for Spark-Ignition Engines; SAE Paper No. 2003-01-0725; Society of Automotive Engineers: Warrendale, PN, USA, 2003. [Google Scholar]
  18. Caton, J.A. Correlations of exergy destruction during combustion for internal combustion engines. Int. J. Exergy 2015, 16, 183–213. [Google Scholar] [CrossRef]
  19. Zucchetto, J.; Myers, P.; Johnson, J.; Miller, D. An assessment of the performance and requirements for “adiabatic” engines. Science 1988, 240, 1157–1162. [Google Scholar] [CrossRef] [PubMed]
  20. Siegla, D.C.; Alkidas, A.C. Evaluation of the Potential of a Low-Heat-Rejection Diesel Engine to Meet Future EPA Heavy-Duty Emission Standards; SAE Paper No. 890291; Society of Automotive Engineers: Warrendale, PN, USA, 1989. [Google Scholar]
  21. Reddy, C.S.; Domingo, N.; Graves, R.L. Low Heat Rejection Engine Research Status: Where Do We Go from Here? SAE Paper No. 900620; Society of Automotive Engineers: Warrendale, PN, USA, 1990. [Google Scholar]
  22. Jaichandar, S.; Tamilporai, P. Low Heat Rejection Engines—An Overview; SAE Paper No. 2003-01-0405; Society of Automotive Engineers: Warrendale, PN, USA, 2003. [Google Scholar]
  23. Berger, L.B.; Elliot, M.A.; Holts, T.C.; Schrenk, H.H. Diesel Engines Underground—II. Effect of Adding Exhaust Gas to Intake Air; U.S. Department of Interior, Bureau of Mines: Washington, DC, USA, 1940.
  24. Miller, A.E.; Sullis, S. Recycling Exhaust Gas for Suppressing of Knock in ICE; American Petroleum Institute: Washington, DC, USA, 1953; Section 111; p. 151. [Google Scholar]
  25. Kopa, R.D.; Kimura, H. Exhaust gas recirculation as a method of nitrogen oxides control in an internal combustion engine. In Proceedings of the APCA 53rd Annual Meeting, Cincinnati, OH, USA, 22–26 May 1960. [Google Scholar]
  26. Kopa, R.D.; Jewell, R.; Spangler, R.V. Effect of Exhaust Gas Recirculation on Automotive Ring Wear; SAE Paper No. S321; Society of Automotive Engineers, Southern California Section: Los Angeles, CA, USA, 1962. [Google Scholar]
  27. Onishi, S.; Jo, S.H.; Shoda, K.; Jo, P.D.; Kato, S. Active Thermo-Atmosphere Combustion (ATAC)—A New Combustion Process for Internal Combustion Engines; SAE Paper No. 790501; Society of Automotive Engineers: Warrendale, PN, USA, 1979. [Google Scholar]
  28. Noguchi, M.; Tanaka, Y.; Tanaka, T.; Takeuchi, Y. A Study on Gasoline Engine Combustion by Observation of Intermediate Reactive Products during Combustion; SAE Paper No. 790840; Society of Automotive Engineers: Warrendale, PN, USA, 1979. [Google Scholar]
  29. Caton, J.A. A thermodynamic comparison of external and internal exhaust gas dilution for high-efficiency internal combustion engines. Int. J. Engine Res. 2015, 16, 935–955. [Google Scholar] [CrossRef]
Figure 1. Schematic of the three-zone configuration of the cycle simulation. dashed lines represent control volumes and arrows denote energy transfers and designate two of the zones.
Inventions 03 00033 g001
Figure 2. Partition of energy and exergy for case 1.
Inventions 03 00033 g002
Figure 3. Relative heat transfer as a function of cylinder wall temperature for case 1.
Inventions 03 00033 g003
Figure 4. Instantaneous heat transfer as functions of crank angle for cylinder wall temperatures of 450 and 1500 K.
Inventions 03 00033 g004
Figure 5. Average, one-zone cylinder gas temperatures as functions of crank angle with cylinder wall temperatures of 450 and 1500 K.
Inventions 03 00033 g005
Figure 6. Cylinder pressures as functions of crank angle with cylinder wall temperatures of 450 and 1500 K.
Inventions 03 00033 g006
Figure 7. Brake and net indicated thermal efficiencies as functions of cylinder wall temperature.
Inventions 03 00033 g007
Figure 8. Average gamma during combustion as functions of cylinder wall temperature.
Inventions 03 00033 g008
Figure 9. The fuel energy distribution for three cylinder wall temperatures.
Inventions 03 00033 g009
Figure 10. The fuel exergy distribution for three cylinder wall temperatures.
Inventions 03 00033 g010
Figure 11. The inlet mixture temperature as functions of the EGR level for the two EGR configurations.
Inventions 03 00033 g011
Figure 12. Nitric oxide concentrations as functions of the EGR percentage for the two EGR configurations.
Inventions 03 00033 g012
Figure 13. Net indicated and brake efficiencies as functions of the EGR percentage for the two EGR configurations.
Inventions 03 00033 g013
Figure 14. Relative heat transfer as functions of the EGR percentage for the two EGR configurations.
Inventions 03 00033 g014
Figure 15. The average, one-zone gas temperature during combustion as functions of the EGR percentage for the two EGR configurations.
Inventions 03 00033 g015
Figure 16. The ratio of the average heat transfer coefficient and the average heat transfer coefficient for case 1 as functions of the EGR percentage for the two EGR configurations.
Inventions 03 00033 g016
Figure 17. The average ratio of specific heats during combustion as functions of the EGR percentage for the two EGR configurations.
Inventions 03 00033 g017
Figure 18. The exergy destruction during combustion as functions of the EGR percentage for the two EGR configurations.
Inventions 03 00033 g018
Figure 19. The partition of the fuel exergy for three cases: 0% EGR, 30% EGR adiabatic, and 30% EGR cooled.
Inventions 03 00033 g019
Figure 20. Exhaust and intake mass flow rates as functions of crank angle for a NVO of 120 °CA for case 1.
Inventions 03 00033 g020
Figure 21. Cylinder pressure as a function of crank angle for a NVO of 120 °CA for case 1.
Inventions 03 00033 g021
Figure 22. Net indicated and brake thermal efficiencies as functions of the negative valve overlap.
Inventions 03 00033 g022
Figure 23. Net indicated and brake thermal efficiencies as functions of the burned gas percentage for both the NVO and the adiabatic EGR strategies.
Inventions 03 00033 g023
Figure 24. The thermal efficiency for the Otto cycle as a function of gamma for compression ratios of 8 and 16.
Inventions 03 00033 g024
Figure 25. The cylinder pressure (relative to the initial pressure) as a function of the cylinder volume (relative to the minimum volume) for the Otto cycle.
Inventions 03 00033 g025
Figure 26. The non-dimensional work for the compression and expansion strokes as functions of gamma for a compression ratio of 16 for the Otto cycle.
Inventions 03 00033 g026
Table 1. Engine Specifications.
ItemValue
Engine Speed (rpm)2000
Bore (mm)101.6
Stroke (mm)88.4
Crank Rad/Con Rod Ratio0.3
Inlet Valves
 Diameter (mm)50.8
 Max Lift (mm)10.0
 Open (°CA aTDC)357
 Close (°CA aTDC)−136
Exhaust Valves
 Diameter (mm)39.6
 Max Lift (mm)10.0
 Open (°CA aTDC)116
 Close (°CA aTDC)371
Valve Overlap (degrees)14°
A/V (m−1) at TDC469
Table 2. Common Engine and Fuel Input Parameters.
ItemValue UsedHow Obtained
FuelIsooctaneinput
AFstoich15.13for isooctane [1]
Inlet (air-fuel) Temperature319.3 KInput
Compression Ratiovariesinput
Equivalence RatiovariesInput
Inlet pressure (kPa)variesInput
Exhaust Pressure (kPa)pin + 10computed
Fuel LHV (kJ/kg)44,400for isooctane [1]
Fuel Exergy (kJ/kg)45,670for isooctane [1]
Wiebe constant “m2.0[1]
Wiebe constant “a5.0[1]
Heat Transfer correlationHohenbergInput [16]
Table 3. Description of Case 1.
ItemValue
bmep900
rpm2000
CR10.0
φ1.0
θb (°CA)50
Twall (K)450
Table 4. Some of the Inputs and Outputs for Two Wall Temperatures.
Item/Case11a
Twall (K)4501500
bmep (kPa)900.9899.7
ηindicated39.7341.23
ηbrake36.3537.62
θo (°aTDC)–21.0–21.5
pin (kPa)86.6100.7
pmax (MPa)5.215.51
MPRR * (MPa/CA)0.2110.208
RHT (%)16.360.29
Q (kJ)0.2910.005
havg (J/s·m2·K)351363
γcomb (---)1.22521.2056
CD ** (%)20.0617.57
Tcomb (K)19292171
Texh (K)13101597
Fueling (kJ)1.7761.714
* MPRR is the maximum pressure rise rate; ** CD is the percentage of the fuel exergy destroyed during the combustion process.
Table 5. Alternative Valve Timings for Internal Exhaust Gas Dilution.
Conventional Valve Timings—Positive Valve Overlap (PVO) Inventions 03 00033 i001
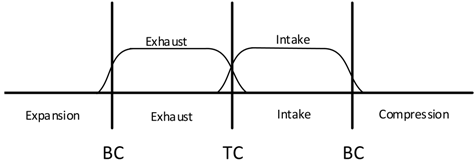
“Recompression”—Negative Valve Overlap (NVO)
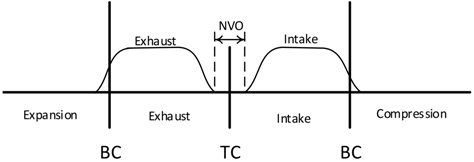
 Inventions 03 00033 i002

