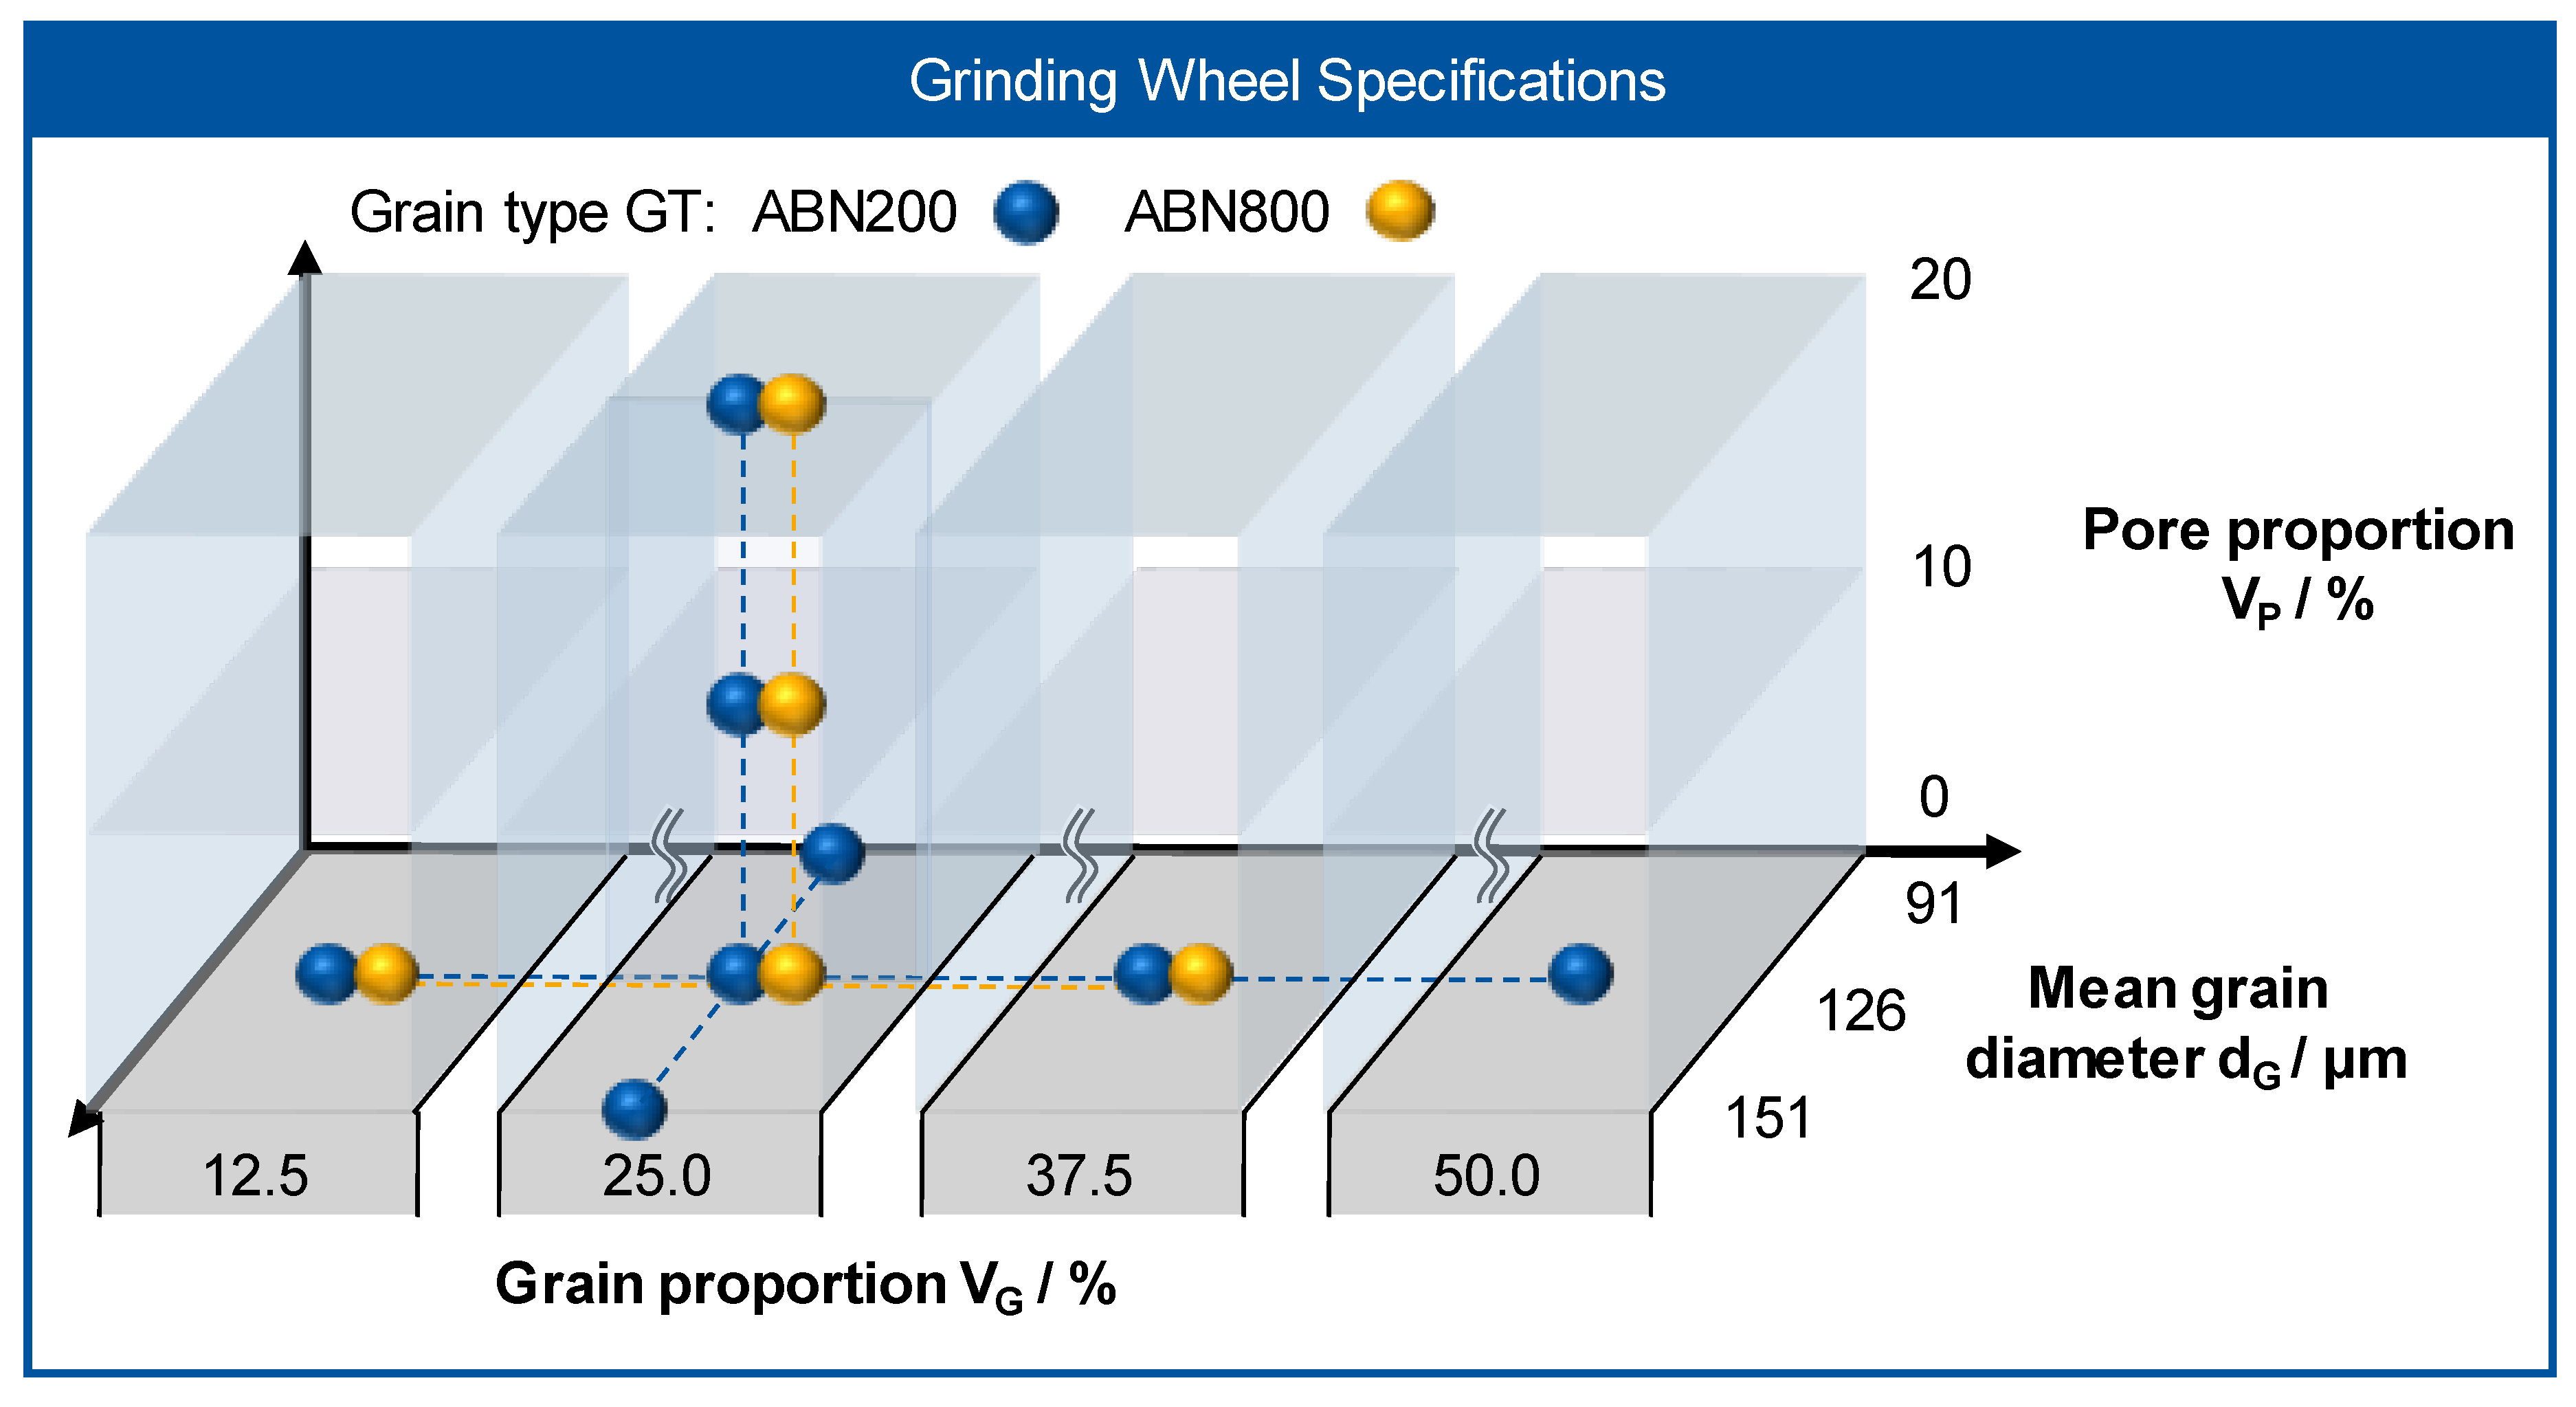
The aim of the research was to investigate the influence of the grinding wheel topography on the thermo-mechanical stress collective. Therefore, first the influence of the listed topography parameters on the grinding force and the grinding temperature was analyzed. Parameters with an influence on the thermo-mechanical stress collective were subsequently tested for correlations with each other and were then grouped. Subsequently, the influence of a change of the relevant topography parameters on the process results was examined in detail. The high number of experiments and investigated parameters did not permit any direct analysis and interpretation of all the results. Therefore, first investigations that are presented in this paper were carried out with a constant specific material removal rate of Q’w = 2.5 mm³/mms, a constant dressing overlap ratio Ud = 1 and with grinding wheels with a grain proportion of VK = 25% and mean grain size of dG = 126 µm.
3.2. Correlations between the Topography Parameters
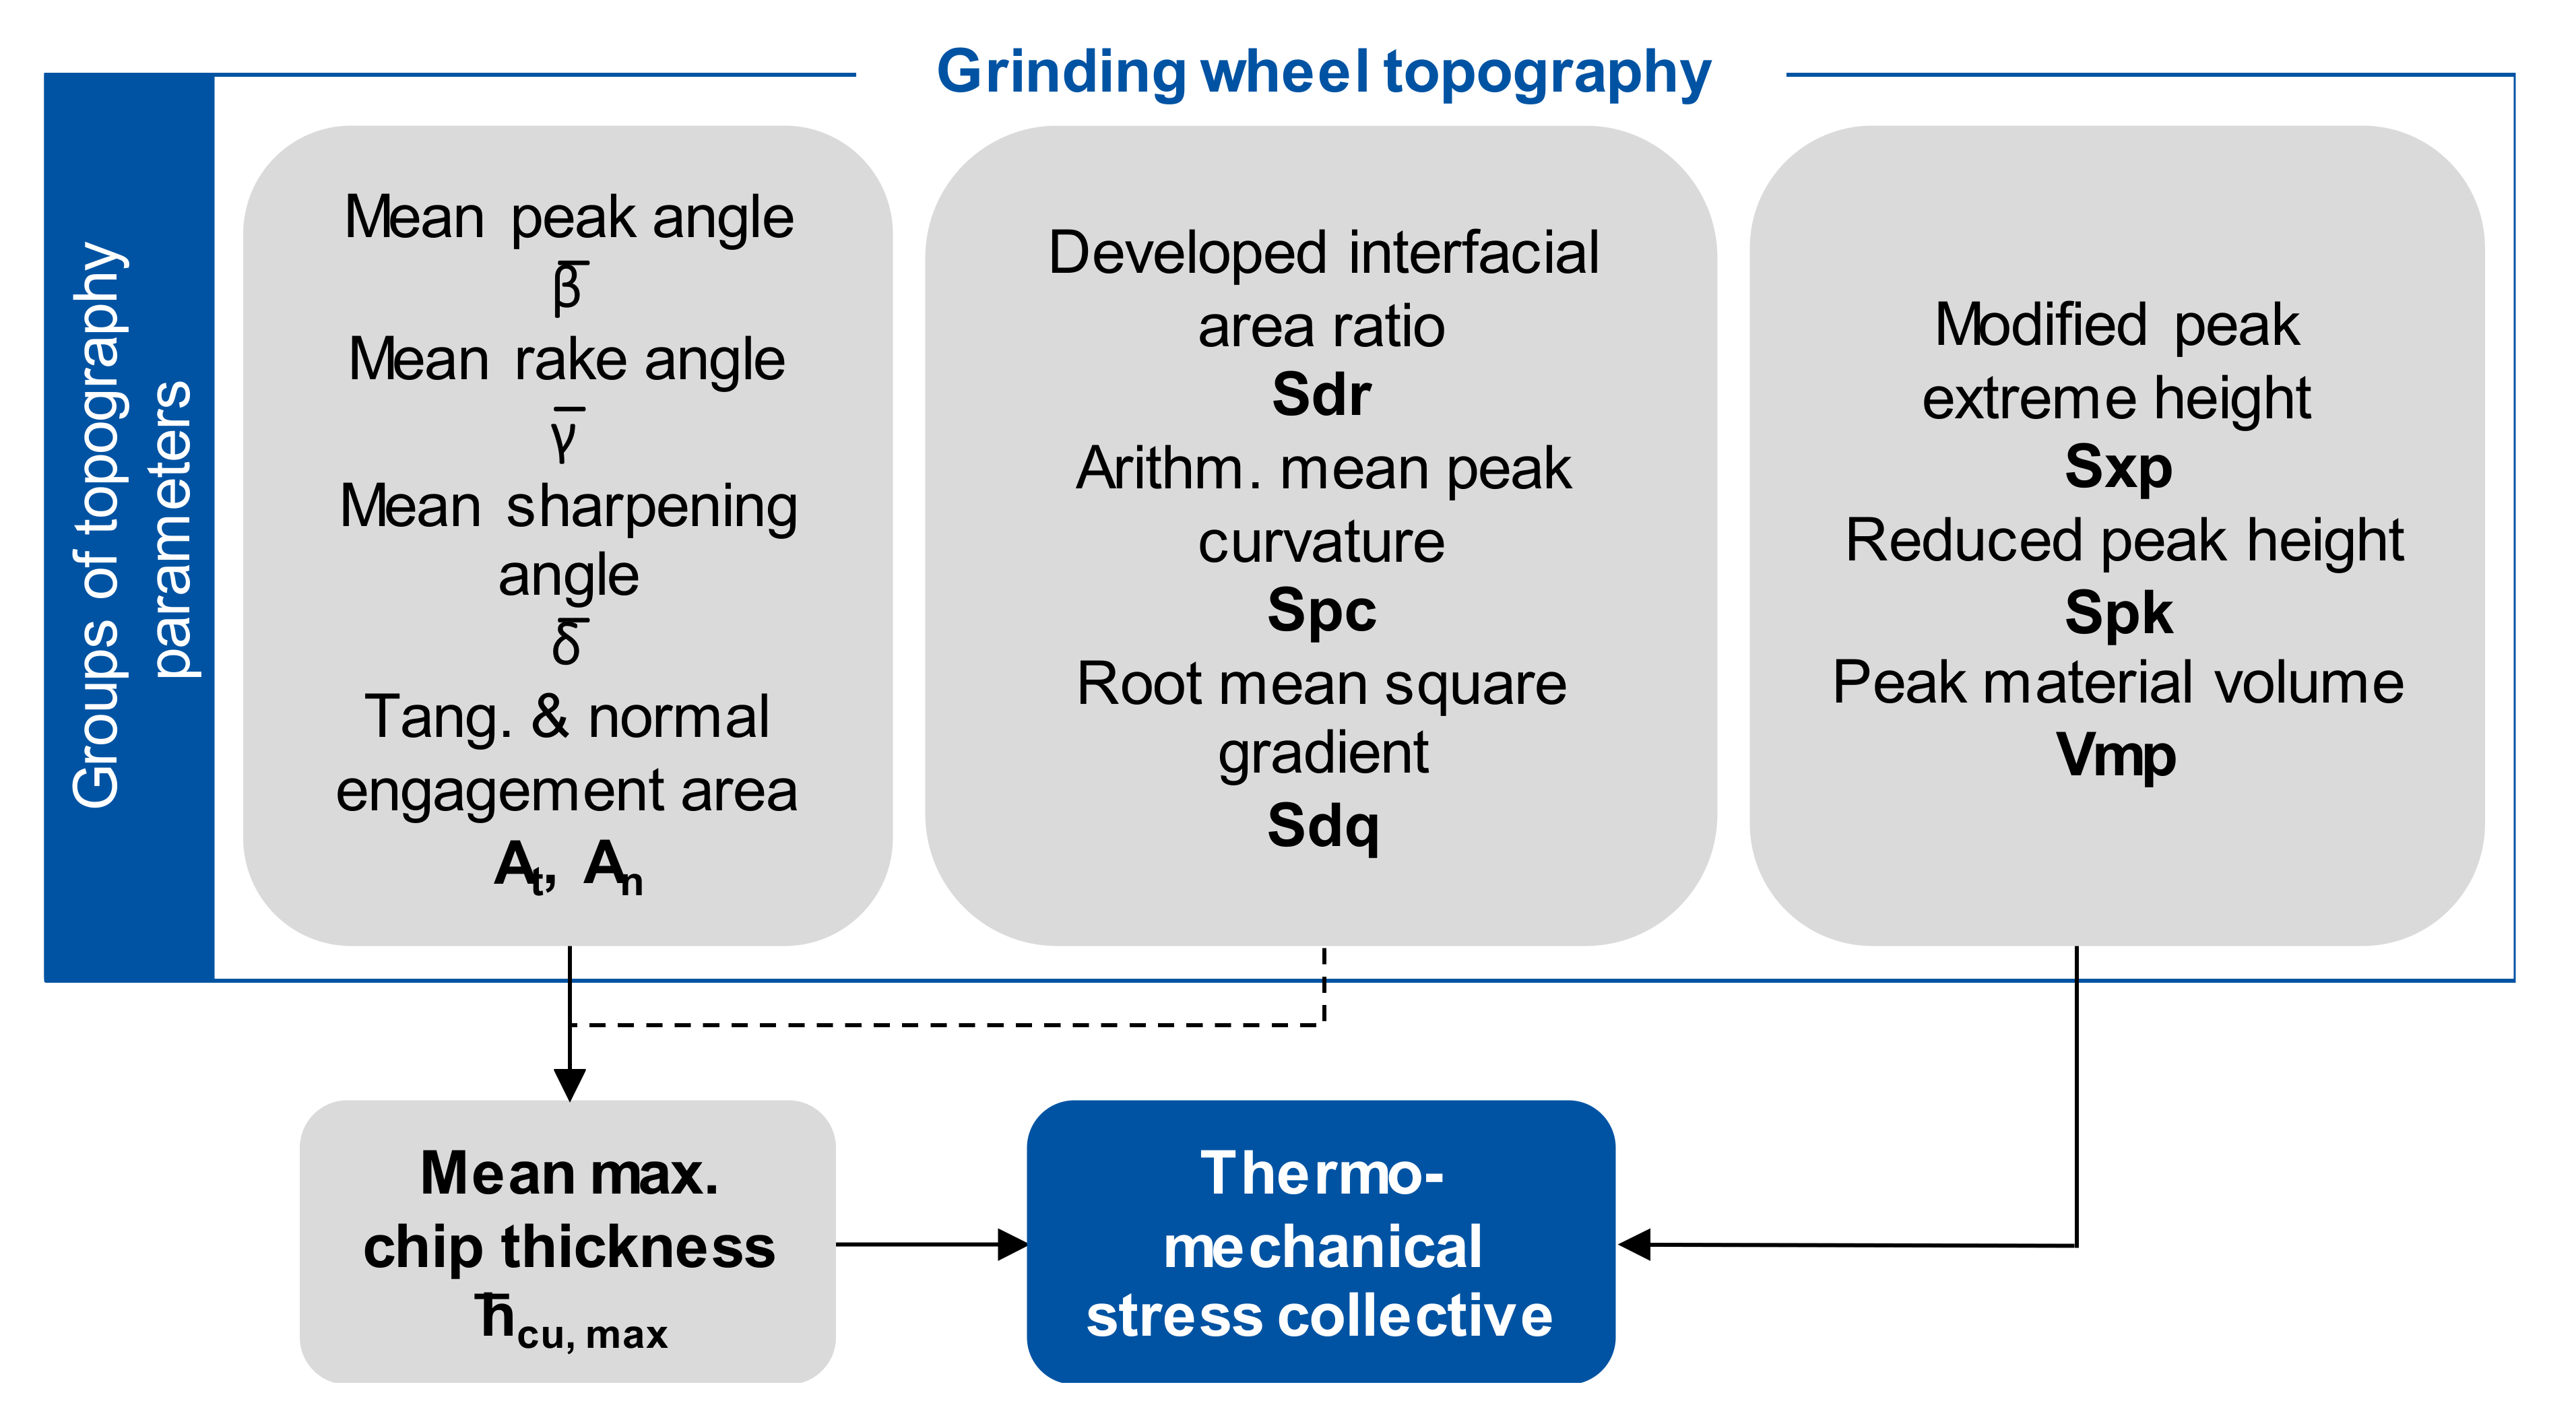
In the following, the characteristic topography parameters, which had a similar influence on the thermo-mechanical stress collective were investigated and grouped. Three parameter groups were identified by the analysis, so that a reduction of the total of 33 investigated topography parameters to three parameter groups could be realized for describing the influence of the grinding wheel topography on the thermo-mechanical stress collective.
The results did show no correlation between the height parameters Sa, Sz, Sq, Ssk, Sku, Sp, and Sv among each other and the process results maximum temperature Tmax and the process force components Fn and Ft. The process results also showed no significant dependencies on the height parameters Str, Sal, and Std. Therefore, height parameters are not suitable for describing the influence of the grinding wheel topography on the thermo-mechanical stress collective.
The volume parameter texture aspect ratio of the surface Str, autocorrelation length of the texture Sal, and the texture direction Std, describe the spatial structure patterns of the topography. Significant dependencies of the process variables were not found in the investigations, so that the volume parameters do not seem to be suitable for the quantitative description of the influence of the topography on the grinding process behavior.
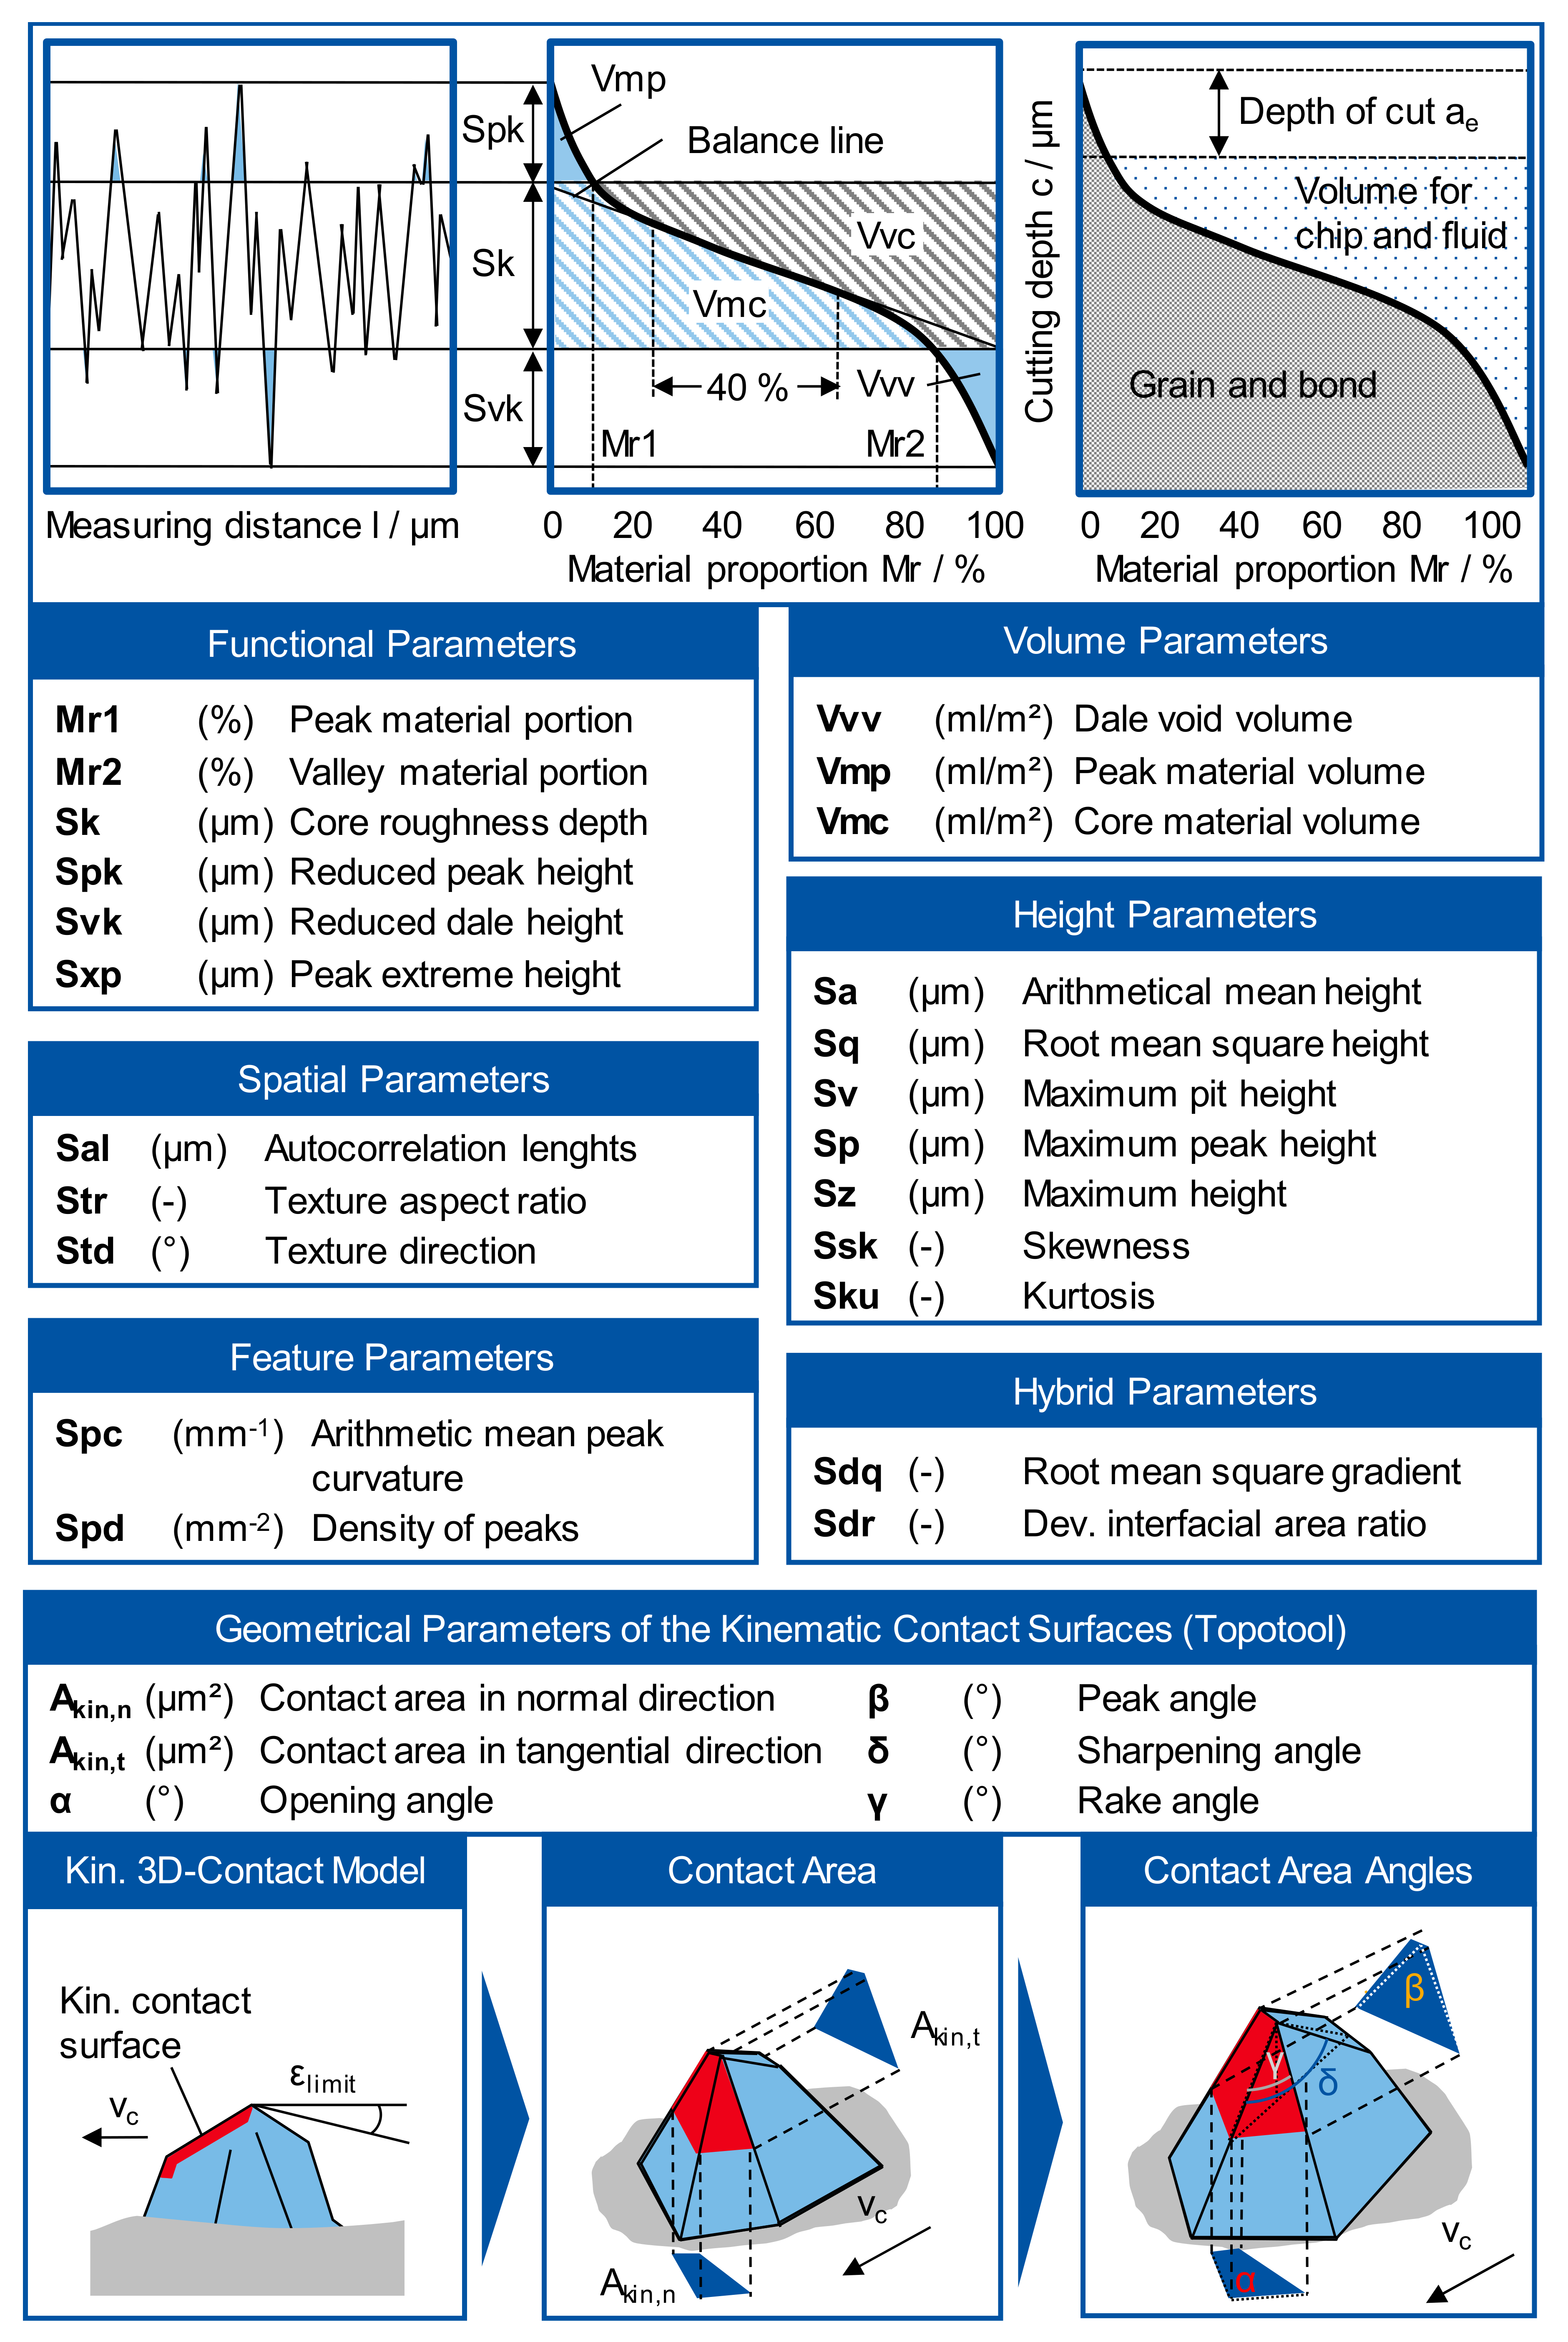
In mechanical engineering, hybrid parameters are used in various applications to describe wear and tribological behavior. They combine spatial and vertical parameters. The developed interfacial area ratio Sdr indicates the ratio between the true surface of the topography and the projected base area in the
X–
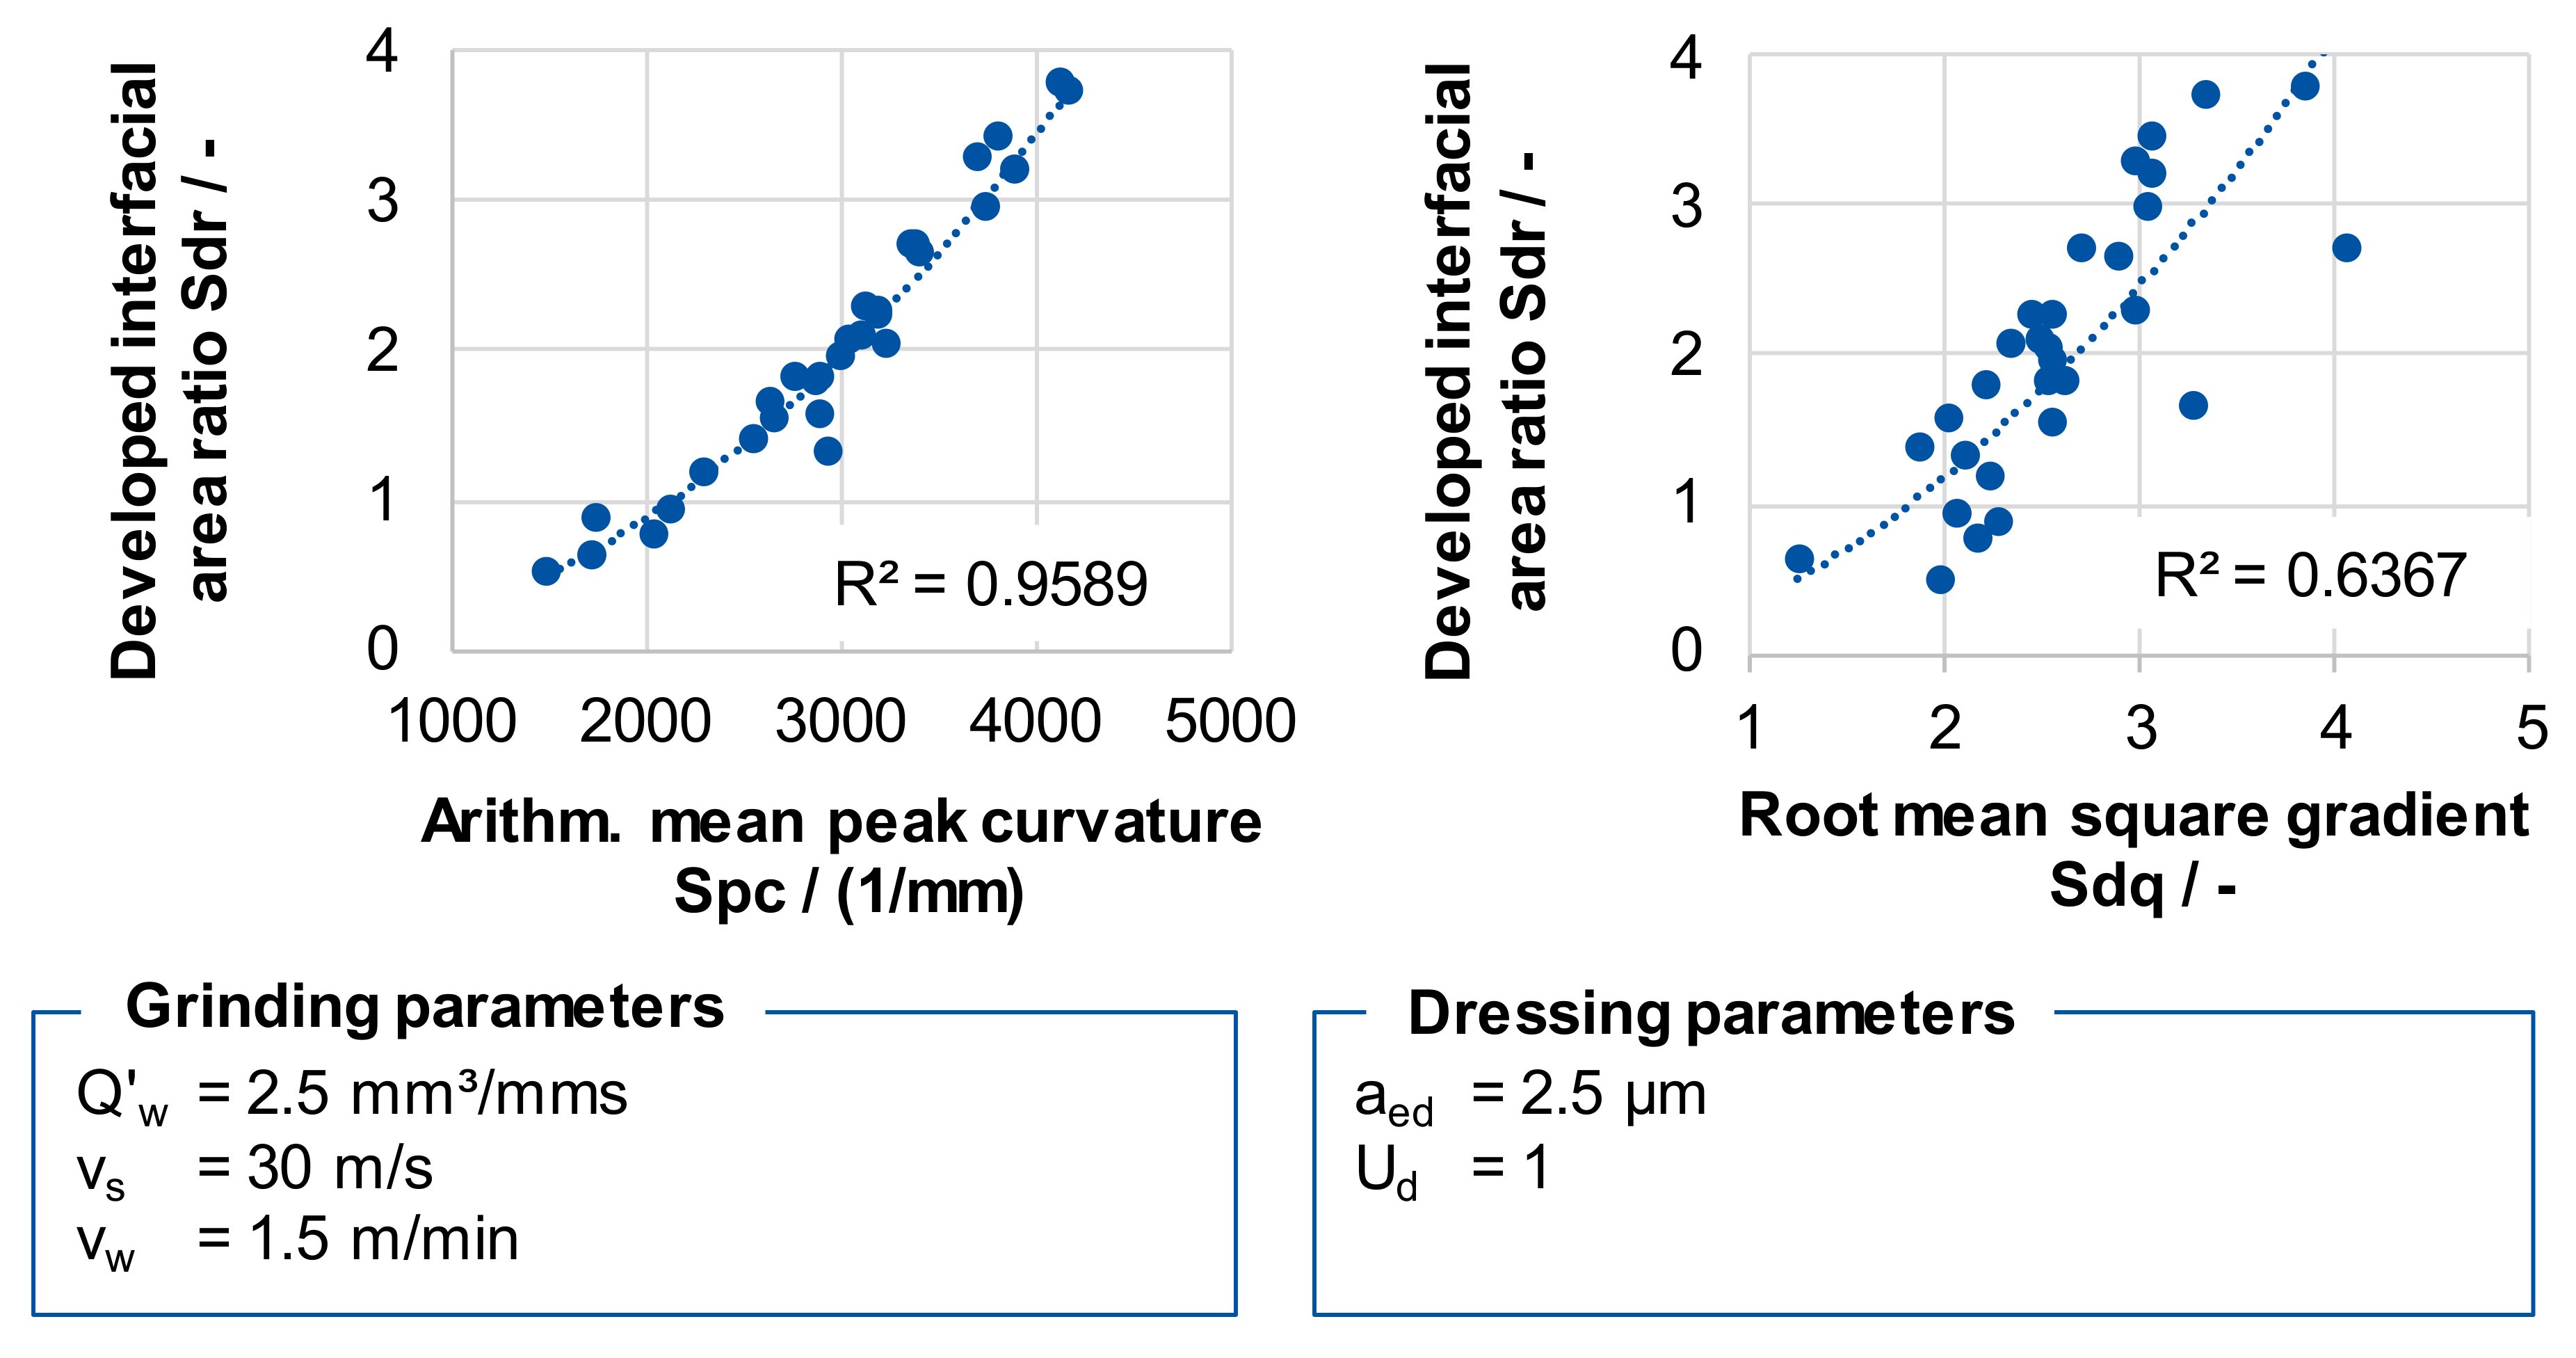
Z plane. Thus, it is a measure of the three-dimensional roughness of the analyzed surface. A perfectly planar surface has a value of Sdq = 0. The arithmetic mean value of the peak curvature Spc, the developed interfacial area ratio Sdr, and the root mean square gradient Sdq showed a particularly strong correlation. The correlation between the arithmetical mean value of the peak curvature Spc and the developed interface area ratio Sdr was best describable by a quadratic function with a coefficient of determination of R² = 0.9589, which corresponds to an excellent correlation (see
Figure 5). The correlations between the above-mentioned parameters and the process variables were investigated and they showed identical trends. For the further procedure, the three parameters were grouped and the influence of the arithmetical mean value of the peak curvature Spc was analyzed as representative for the parameter cluster.
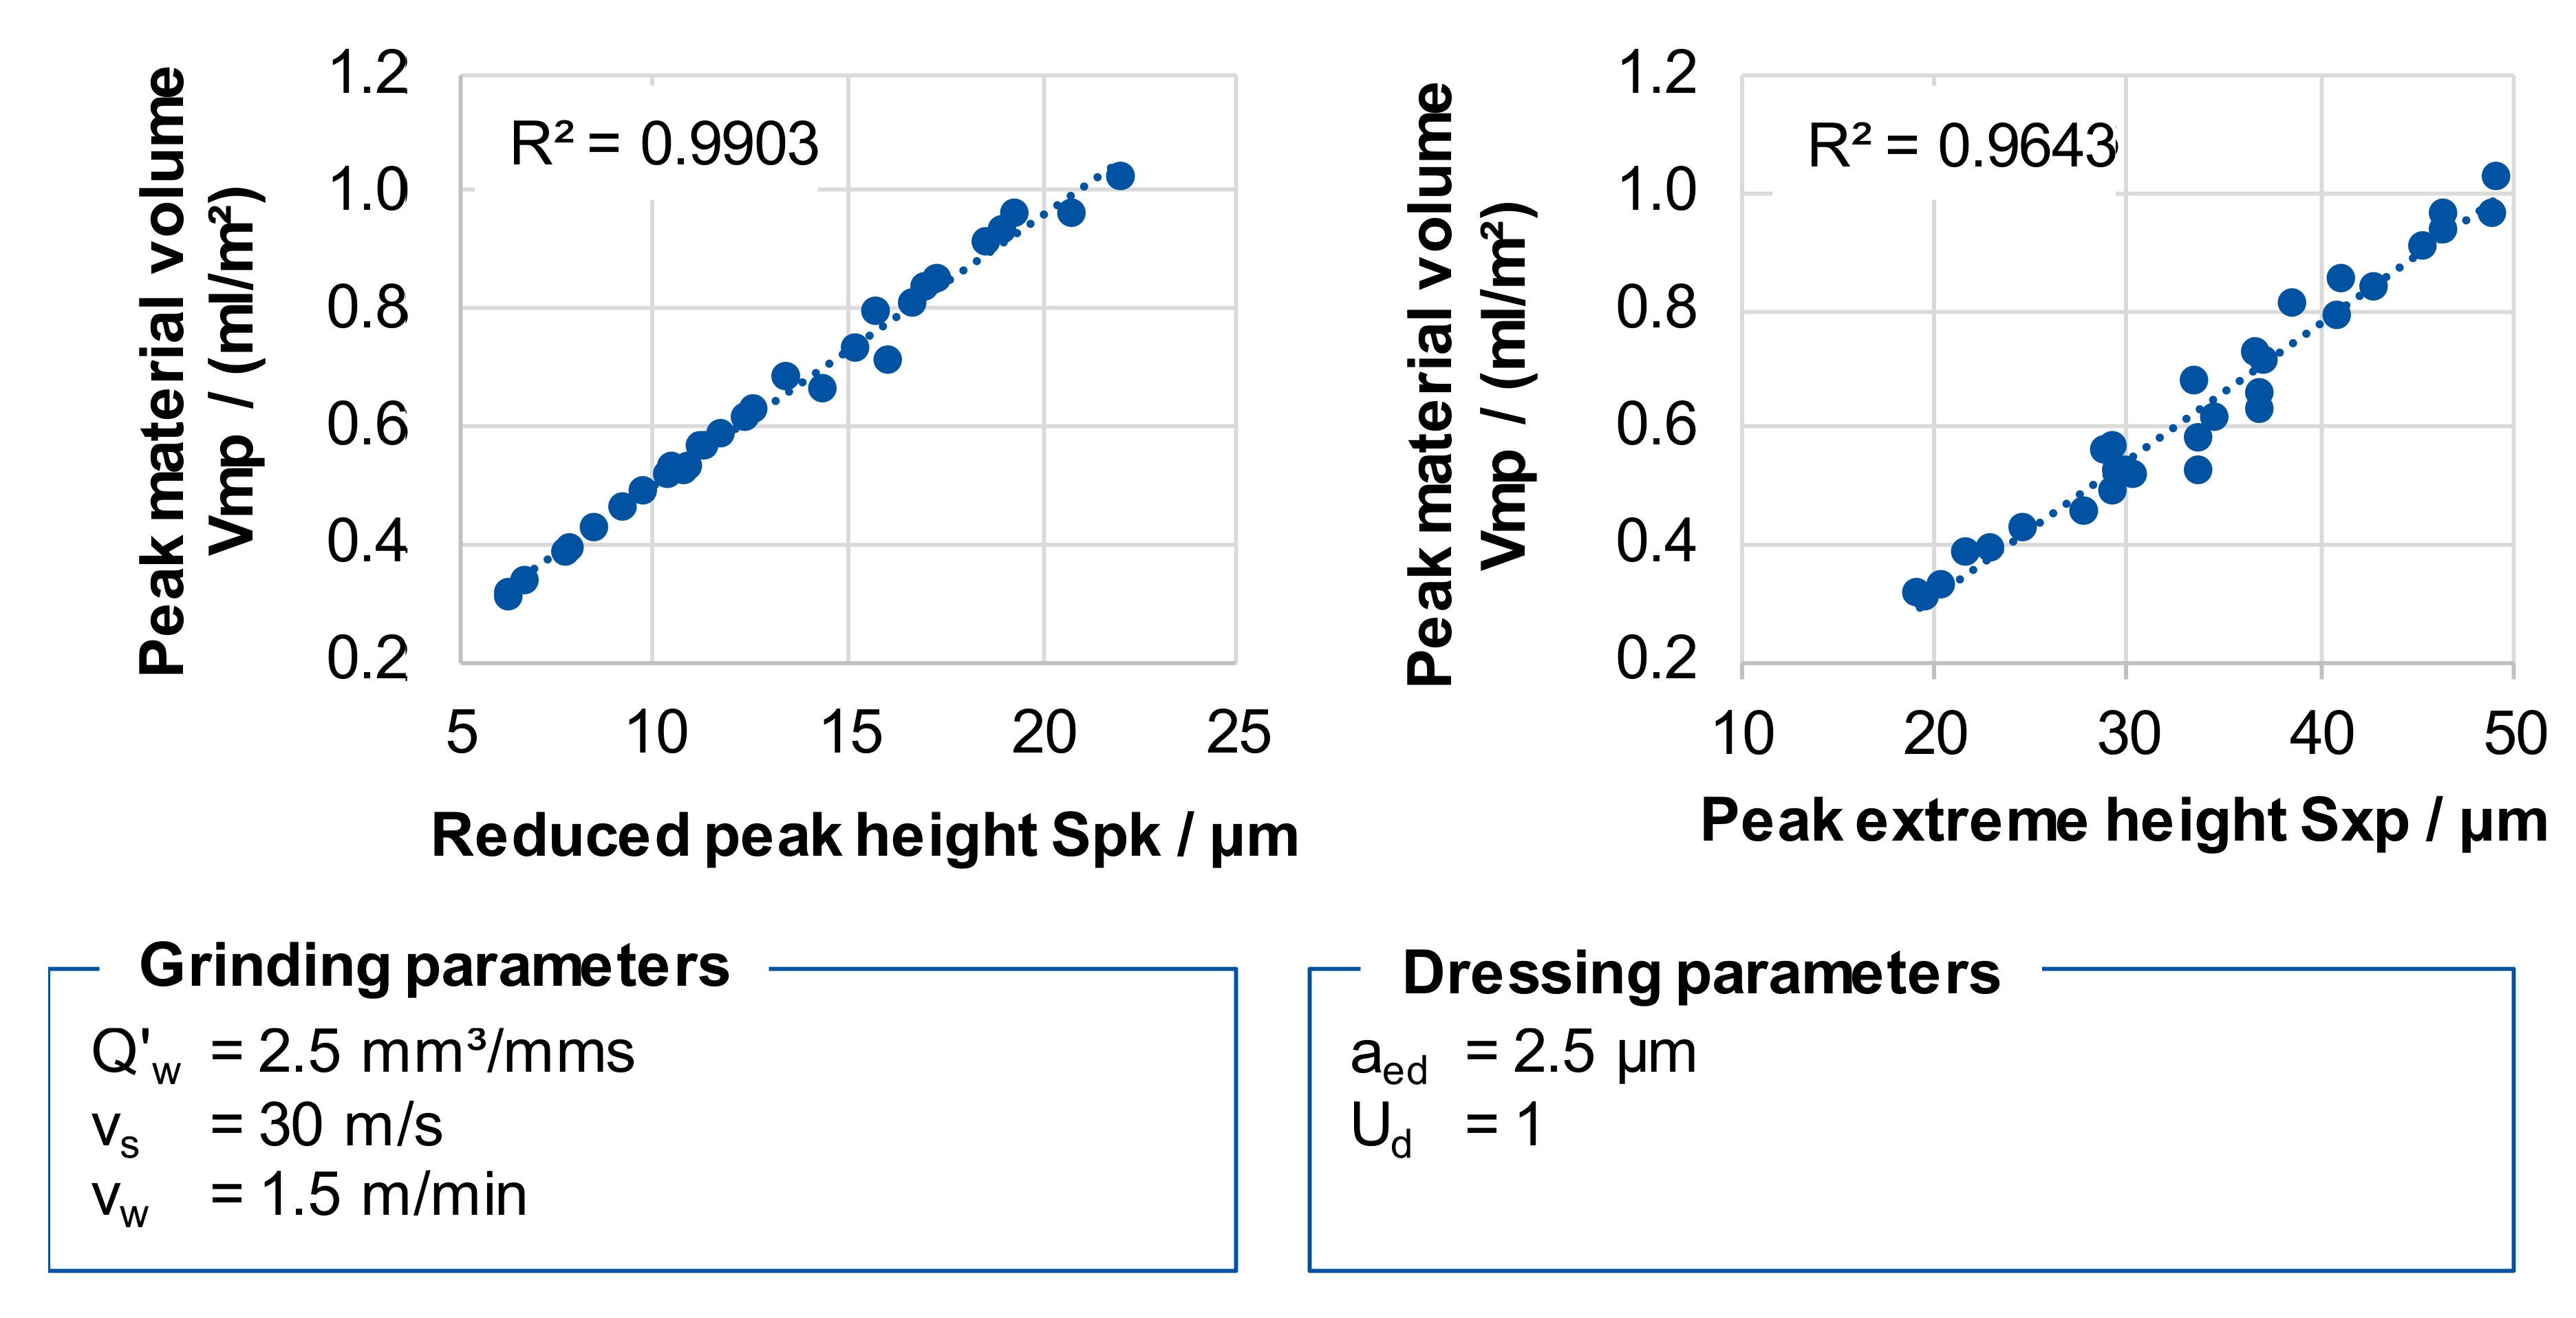
Similarly, there were strong correlations between the functional parameters describing the upper part of the Abbott curve, see
Figure 6. Since the correlation coefficients between the reduced peak height Spk, the peak extrem heigt Sxp, and the peak material volume Vmp assume approximately a coefficient of determination of nearly R² = 1, an almost perfect linear relationship exists between the topography characteristics. Here, the formation of a cluster is obvious, since all the parameters also had the same relation to the process variables.
The angles of the kinematic cutting edges, which were identified by the Topo-Tool, also correlated strongly.
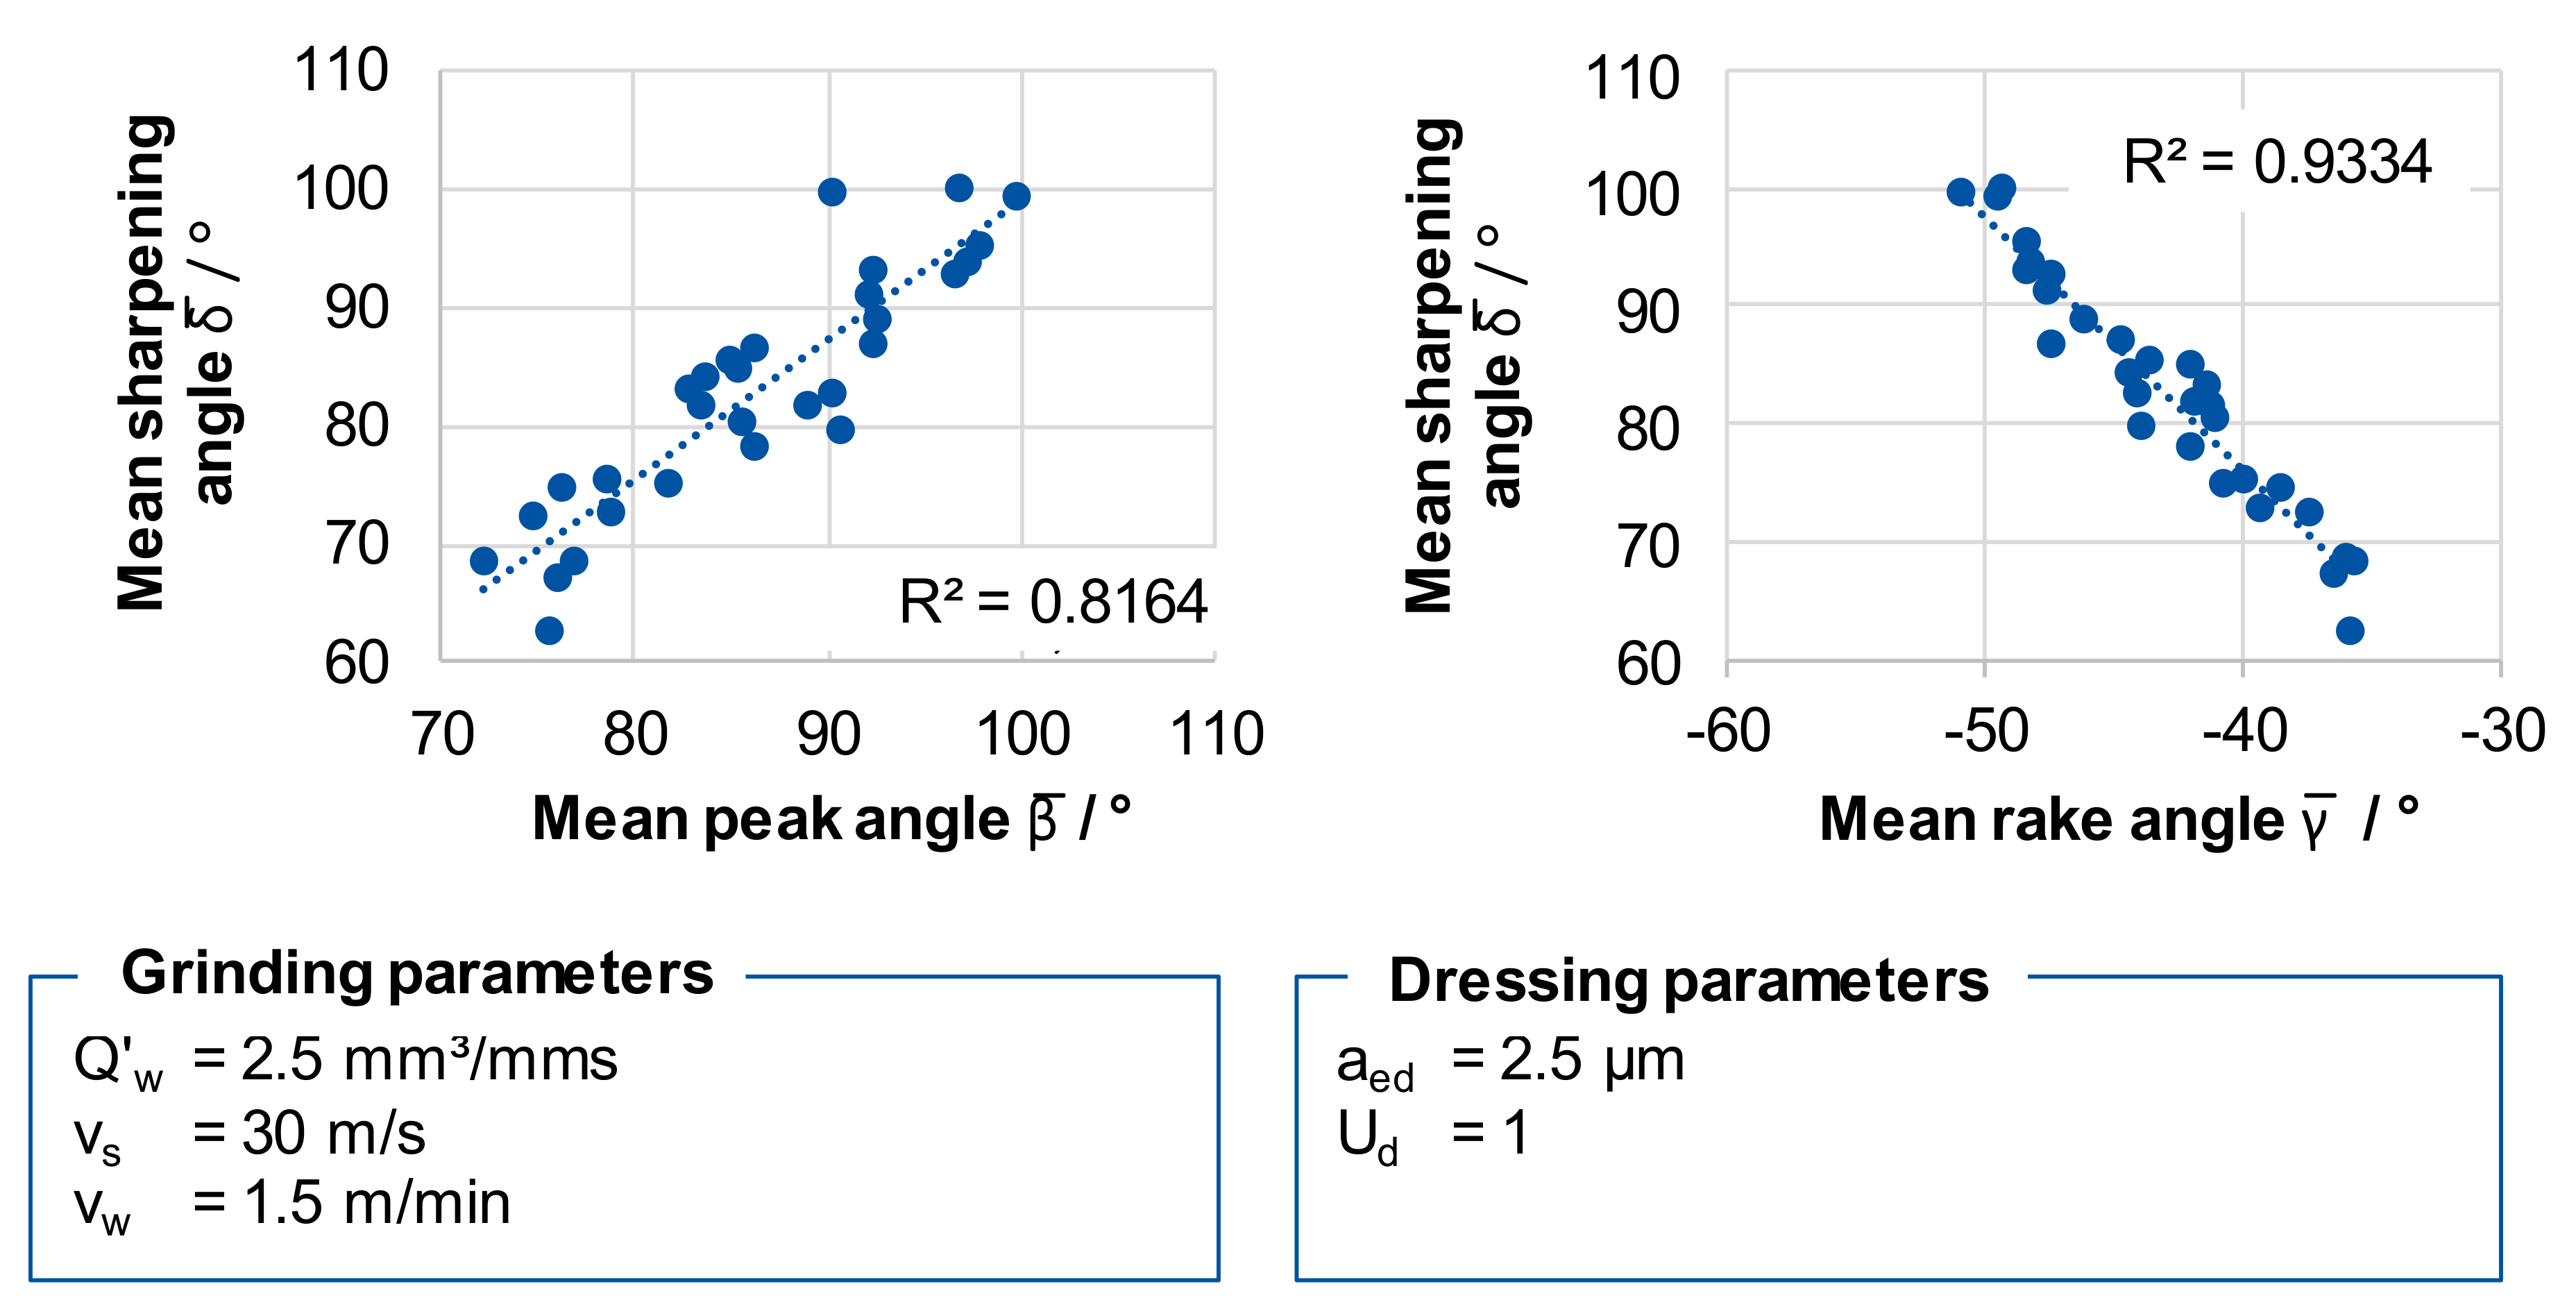
Figure 7 shows approximately linear relationships between the angles of the kinematic cutting edge areas. When the mean peak angle
β or the mean sharpening angle
δ increase, the mean rake angle
γ decreases. Here, too, a grouping of these parameters was appropriate, in order to reduce complexity for the analysis of the influence of the grinding wheel topography on the thermo-mechanical stress collective.
3.3. Influence of the Topography Parameters on the Chip Thickness and Process Result Parameters
Based on the rapid identification of correlations between the topography parameters and the process parameters, a detailed analysis of the influence of the relevant topography parameters on the thermo-mechanical stress collective was carried out.
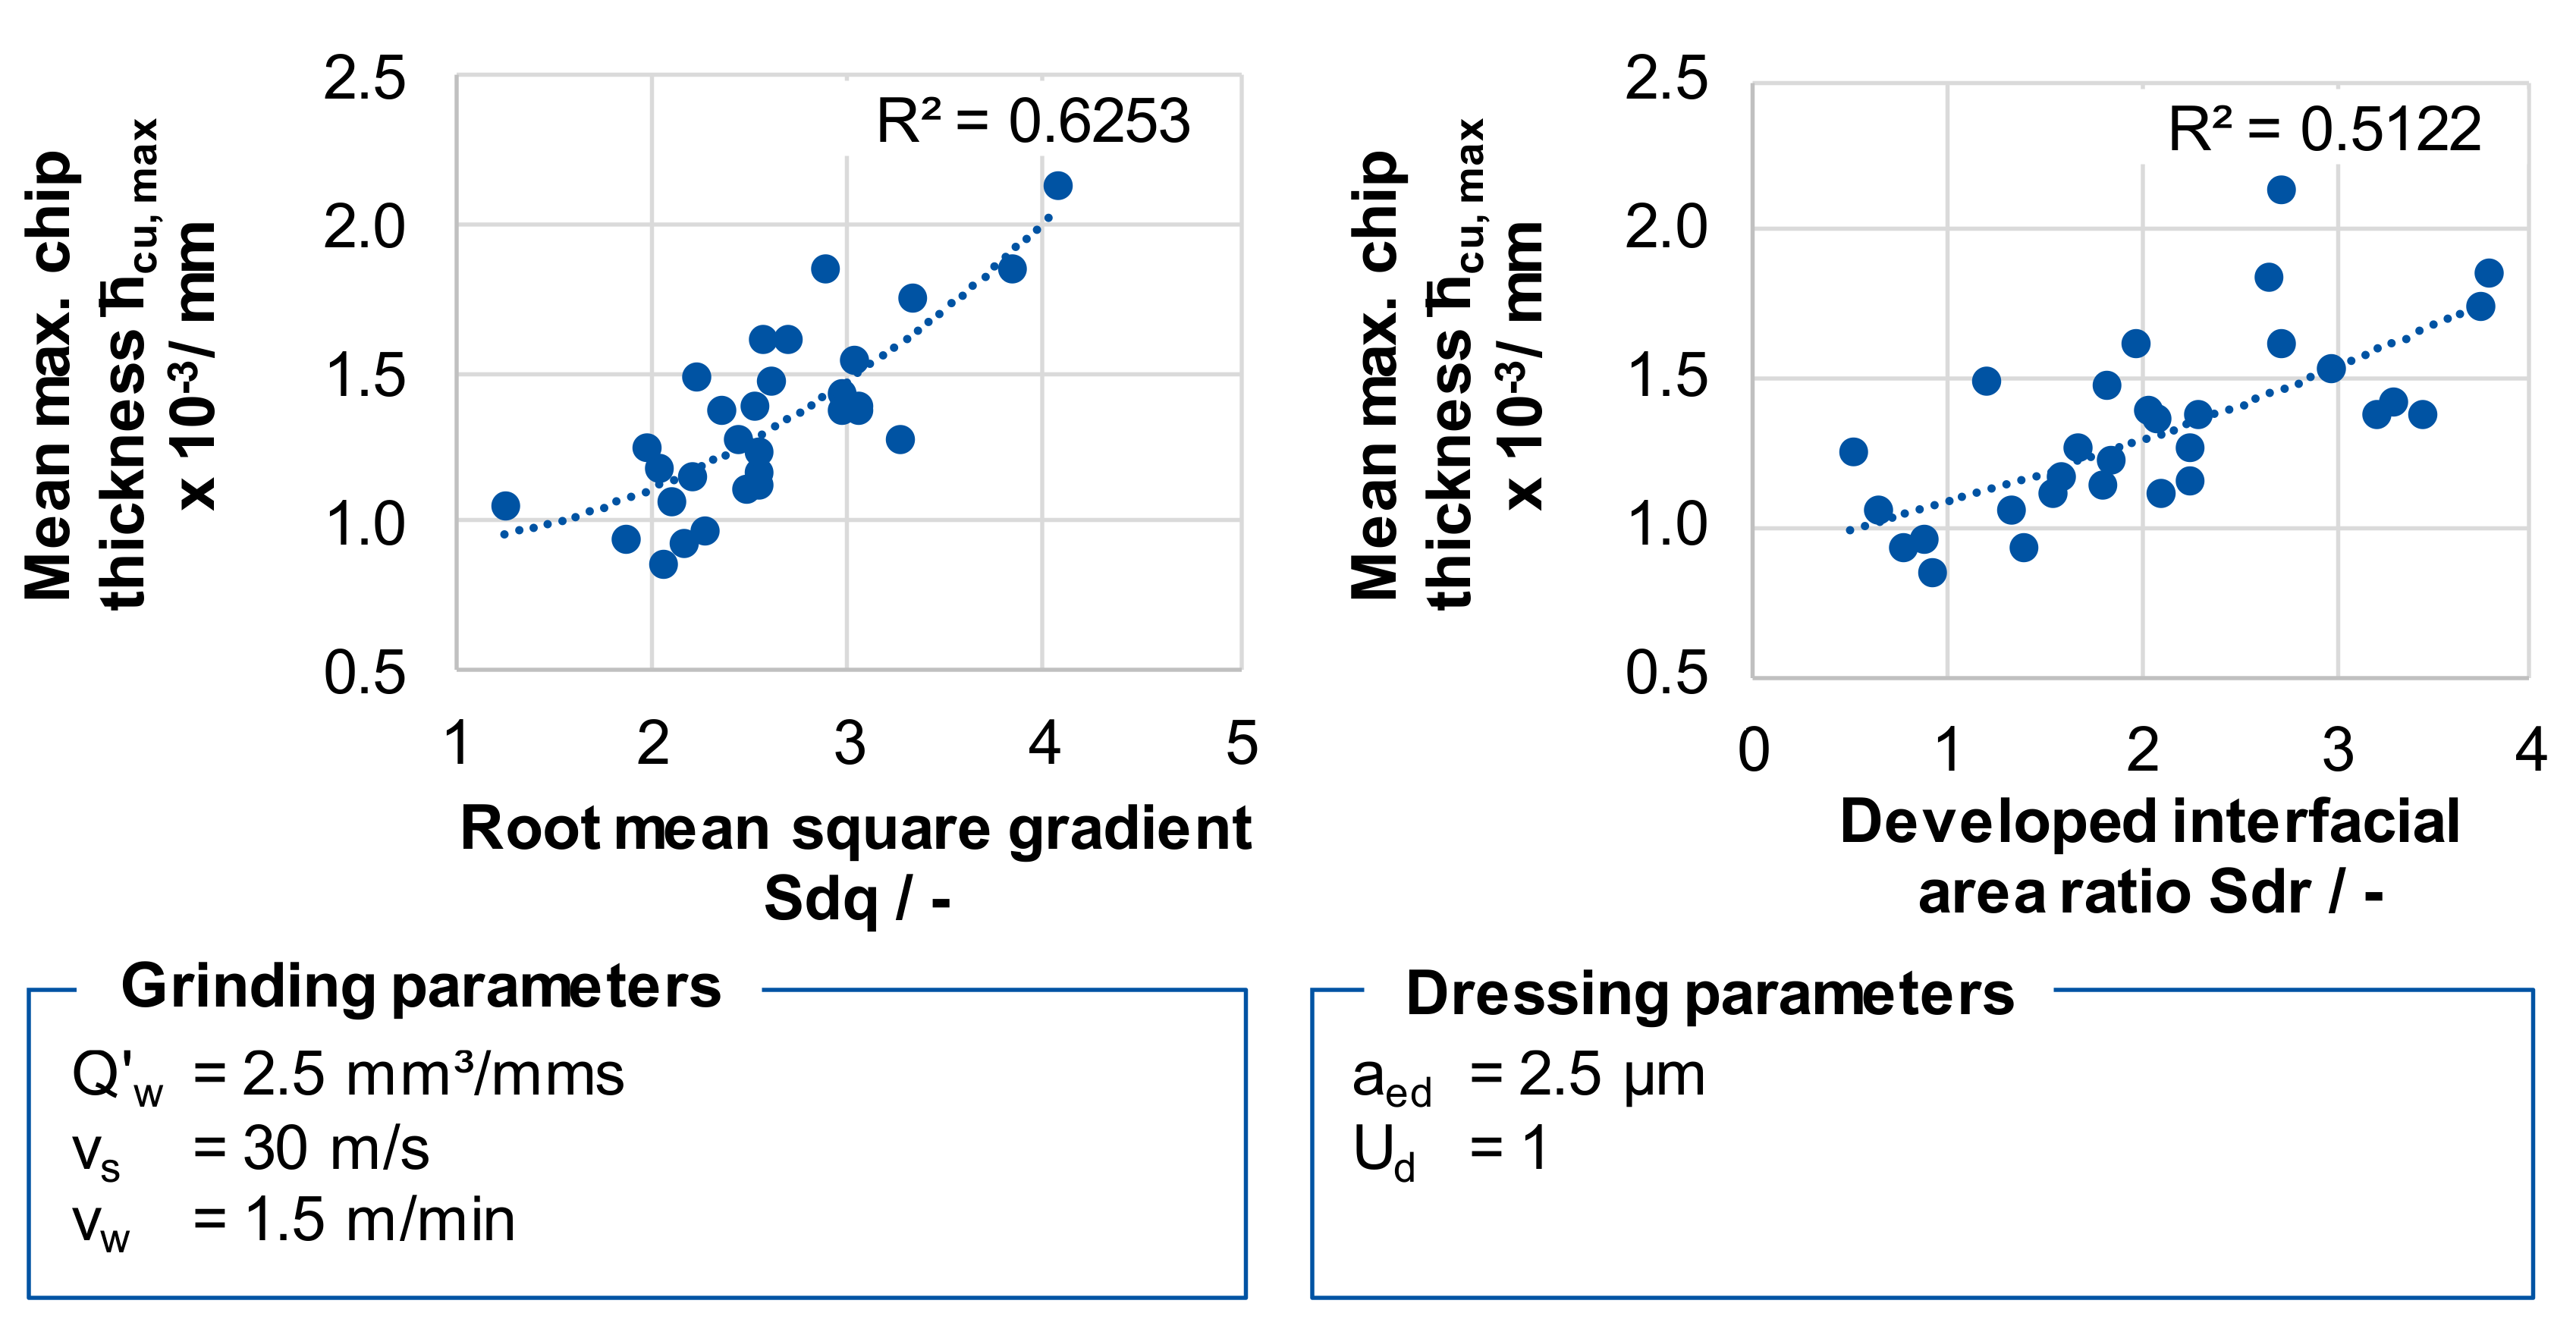
Figure 8 shows the correlations between the hybrid parameters and the process parameter mean maximum chip thickness
hcu, max. The maximum chip thickness was investigated by means of the Topo-Tool, which measures the biggest vertical distance between the lowest and the highest points of the tangential kinematic engagement area, as described in Figure. Between the developed interface ratio Sdr and the process parameters F
n, F
t, and T
max, only weak correlations were identified. An influence of these surface parameters on the process behavior is physically close, but due to the coefficient of determination of only R² = 0.62, a low suitability of these topography characteristics is assumed to describe the influence of the topography on the thermo-mechanical stress collective solely.
The further investigated functional parameters are derived from the Abbott curve, which characterizes the vertical material distribution of a surface structure. The Abbott curve is created by applying the material portion above the profile height. Functional parameters, such as the reduced dale height Svk, or the core material volume Vmc, which describe the geometry and structure of the grooves on a surface, did not influence the force or temperature in the grinding process. In particular, the reduced dale height Svk, which evaluates surfaces with regard to their ability to absorb and to serve fluid to adjust the lubricating properties in tribosystems, did not show any correlation with force and temperature, contrary to expectations.
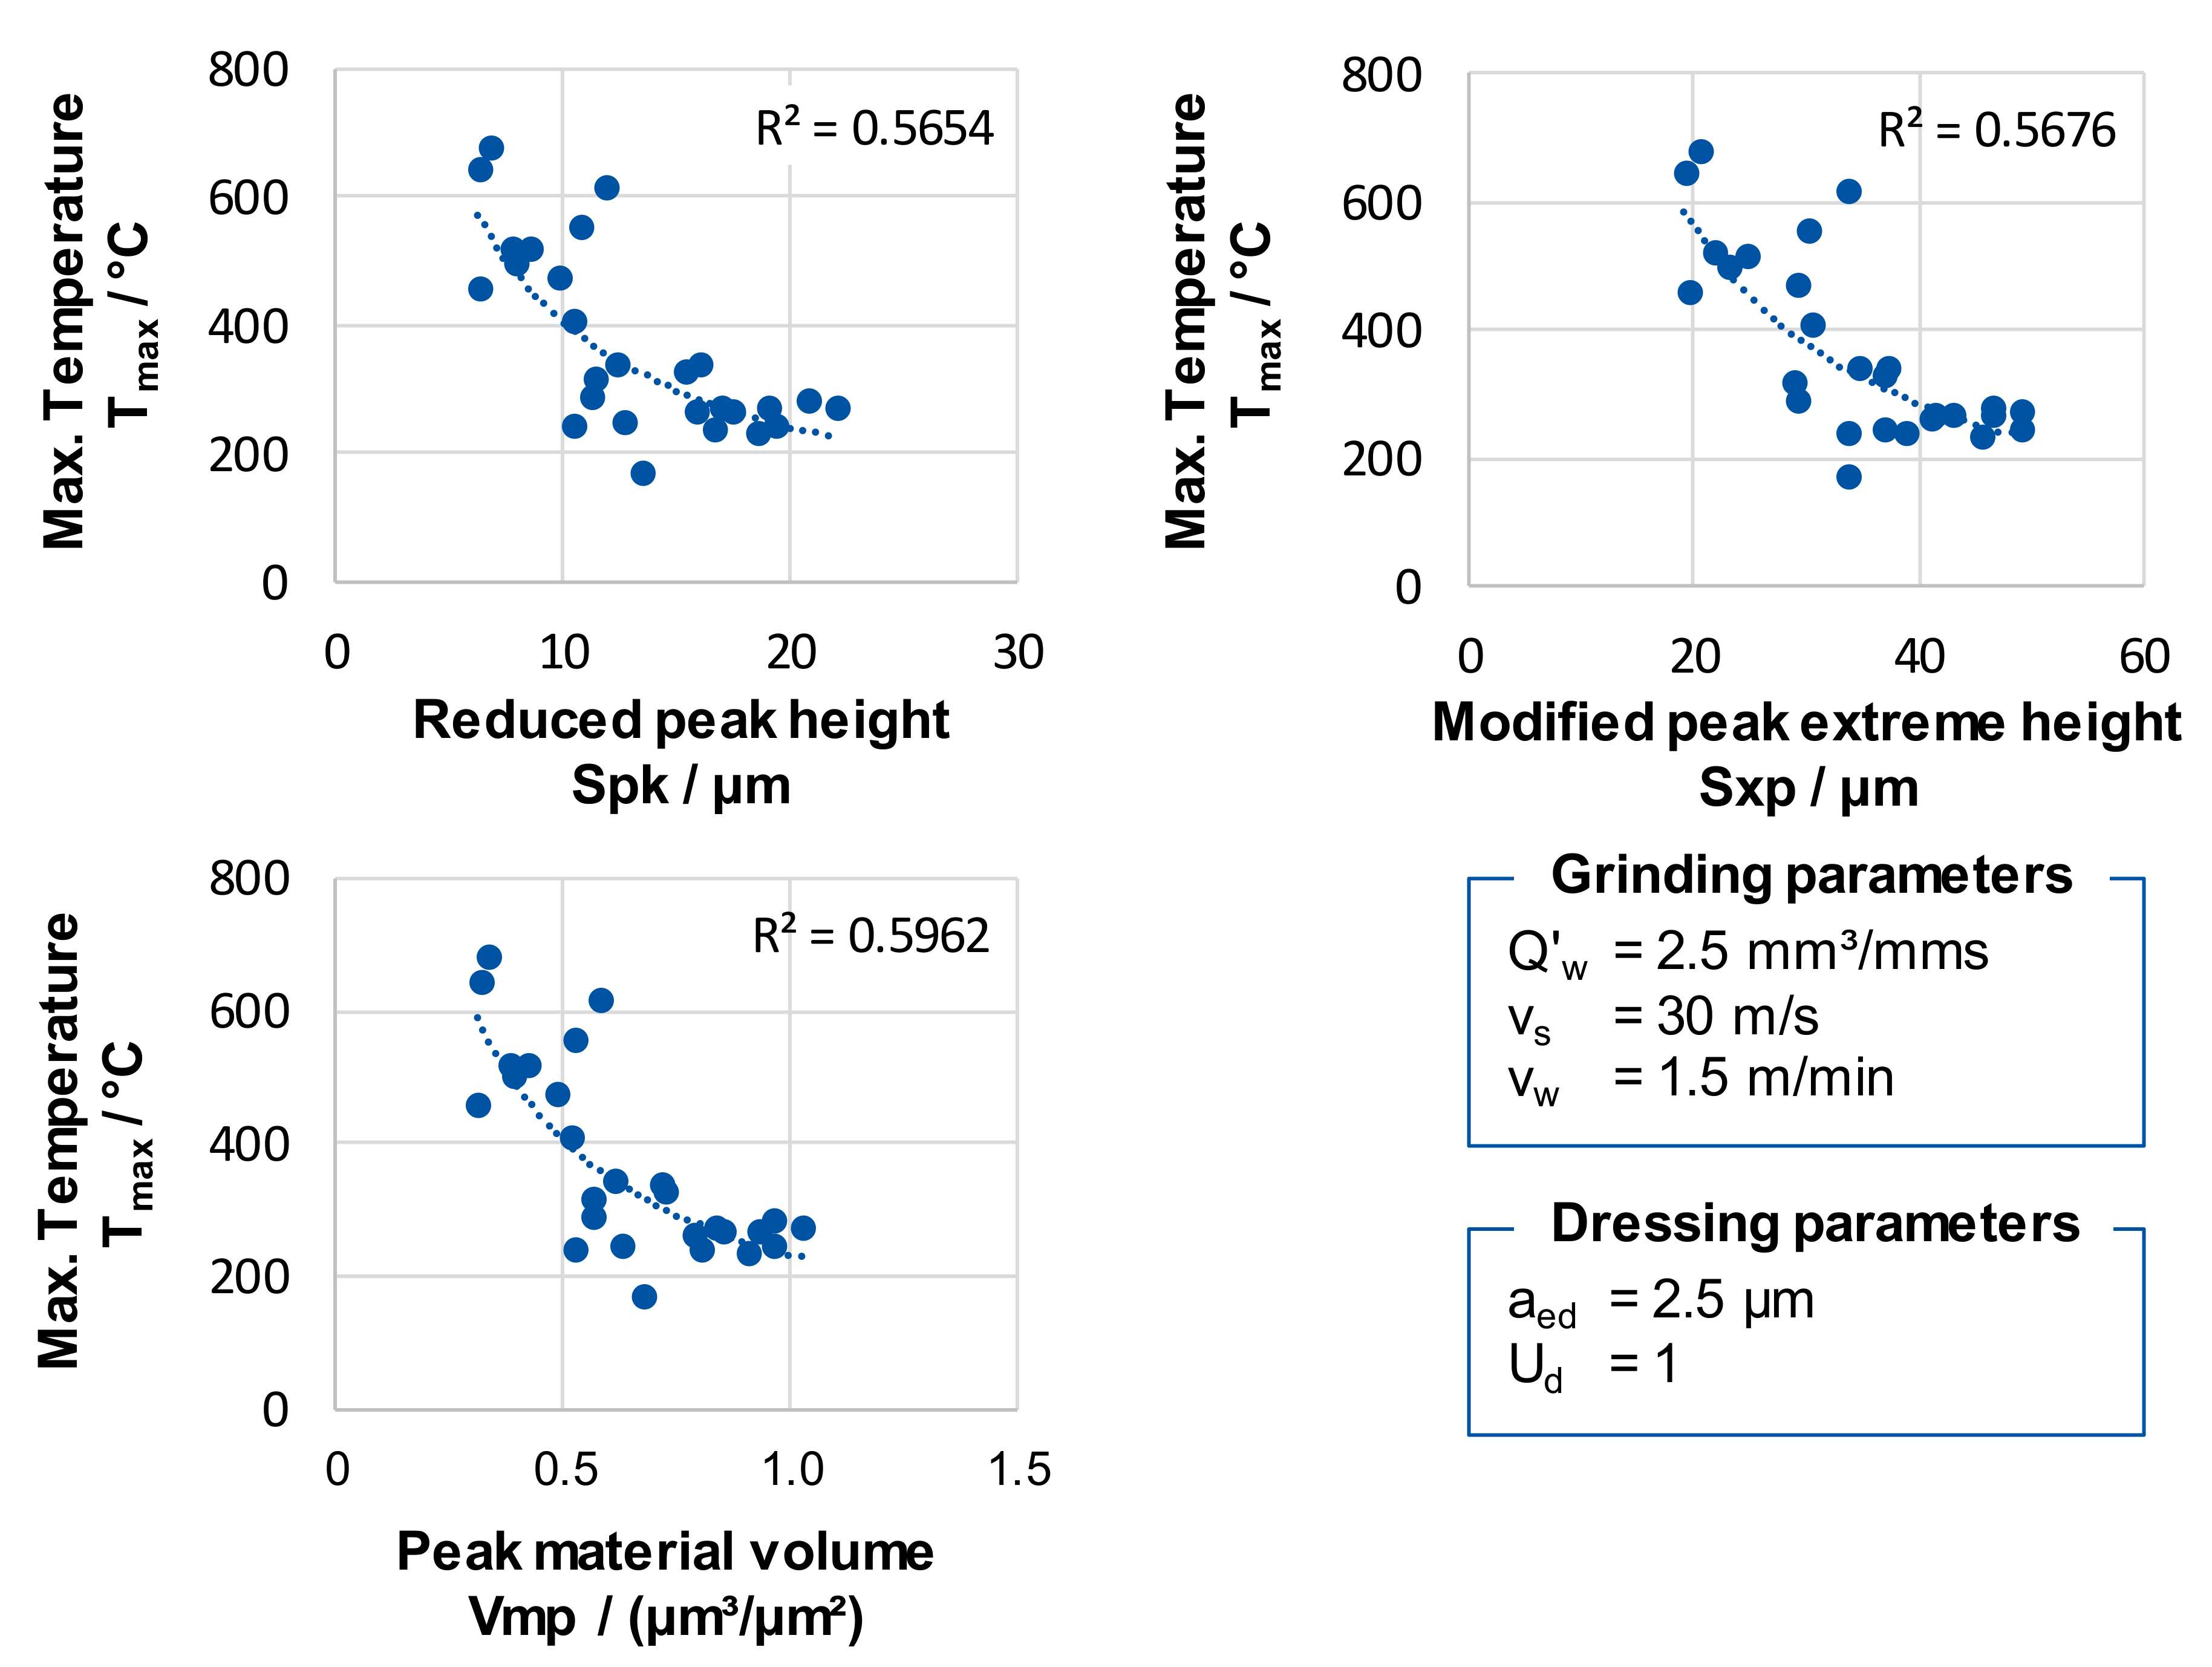
However, topography parameters that describe the characteristics of the peaks of a topography showed correlations with the thermo-mechanical stress collective. The peak extreme height Sxp is the difference of heights at the areal material ratio values p = 0% and q = 50%. The corresponding material portions p and q correlated strongly with the grain protrusion. Influences on the maximum temperature Tmax and the occurring grinding forces Ft and Fn were measured. As the grain protrusion increased and the value of Sxp raised, the grinding force and the temperature dropped. The same applied to the relationship between the reduced peak height Spk, which corresponds to the reduced height of the peaks above the core surface, and the grinding forces in the normal and tangential directions.
The peak material volume Vmp describes the material volume for an areal material ratio value of 10%. It corresponds to the volume, which is occupied by the tips of the topography. The larger the volume of the tips, the higher is the protrusion of the grains, or the amount of grains out of the core volume of the topography. If the peak material volume Vmp is small, then the core volume Vmc is correspondingly larger. This is the case if grinding wheels are smooth with a small grain protrusion. In the case of a small grain protrusion, only a small quantity of grinding fluid can enter the contact zone, which influences the contact conditions. As the peak material volume Vmp increased, the tangential grinding force F
t, as well as the maximum temperature T
max, dropped significantly, as presented in
Figure 9. The coefficient of determination is in the range of R² = 0.5–0.6. The relatively small R² indicates that the parameters Sxp, Vmp, and Spk influence the thermo-mechanical stress collective, but are likewise not suitable for describing the influence of the grinding wheel topography on the thermo-mechanical stress collective solely.
The feature parameters include the peak density of the surface Spd and the arithmetic mean peak curvature Spc. The peak density Spd indicates the number of roughness peaks of a topography relative to the considered area [
10]. This parameter ignores that a large part of the identified tips does not come into engagement because of shading effects during the grinding process. Accordingly, the meaningfulness of this parameter is very low. With regard to the process results, Spc showed a correlation with the maximum grinding force in normal and tangential direction F
n and F
t, as well as to the maximum temperature T
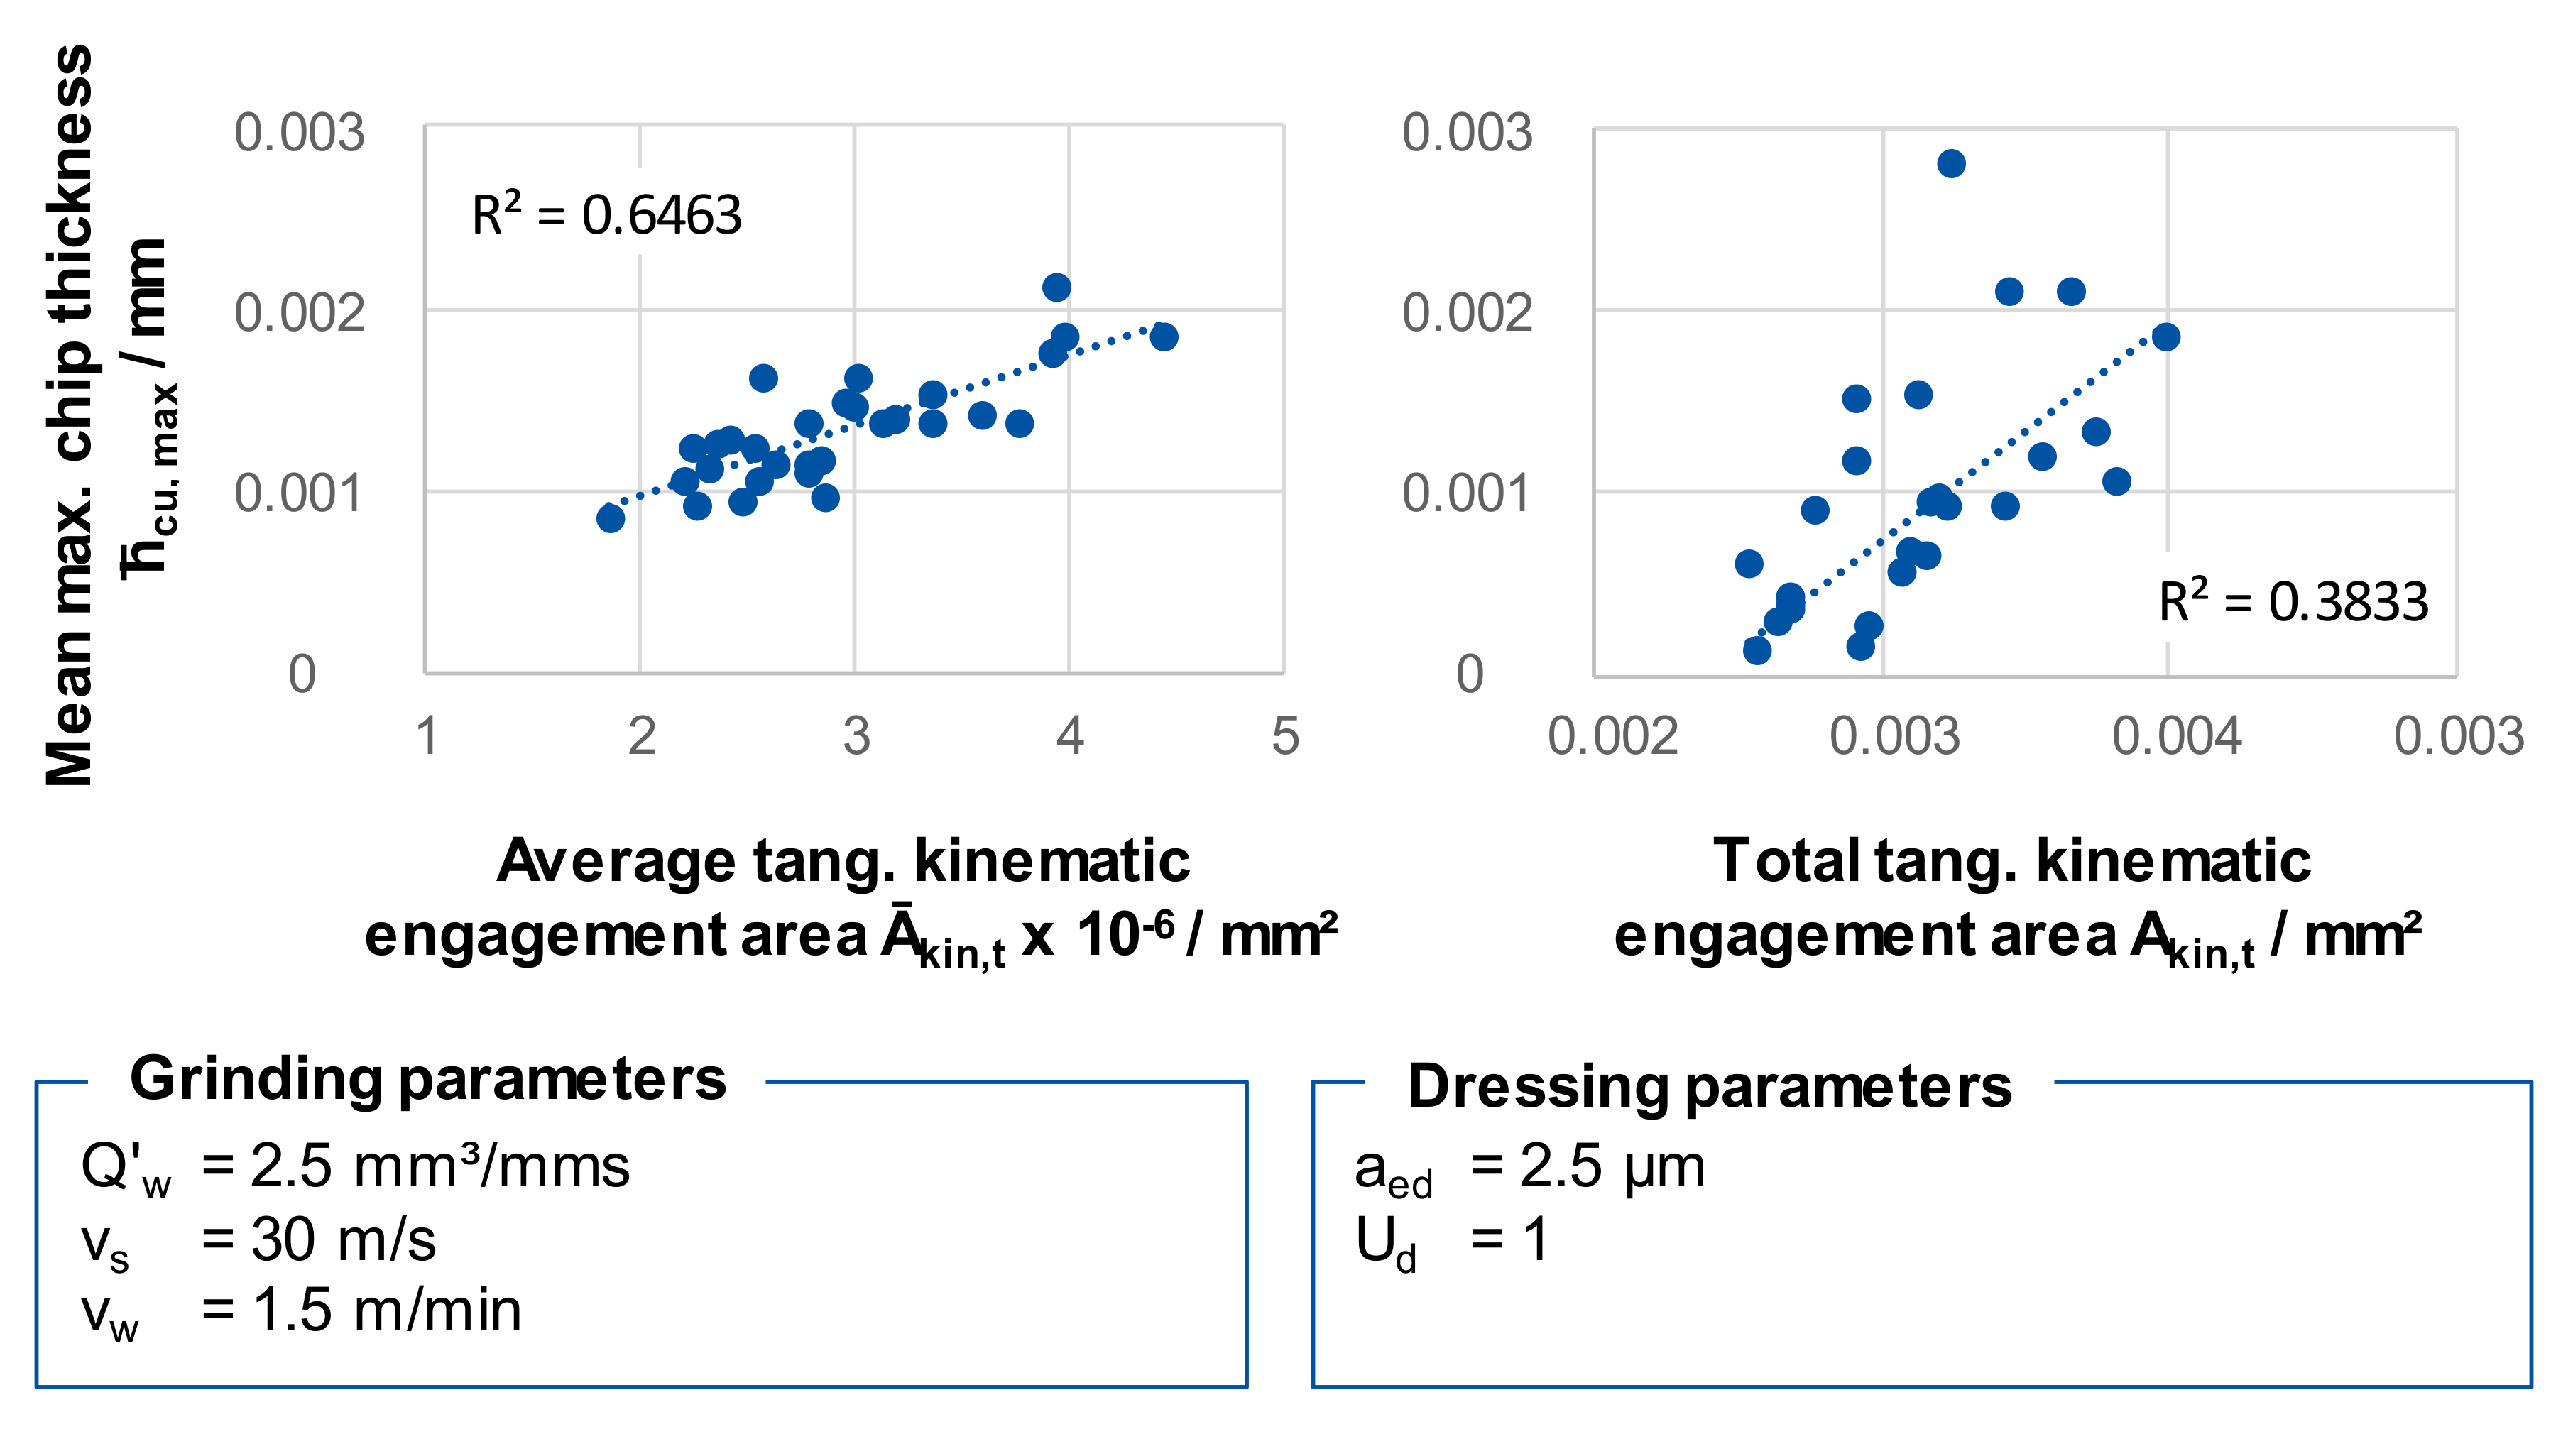
max. The results showed distinctive trends, but the coefficients of determination R² were low. So the feature parameters were not taken into account for detailed investigations. The test results showed a linear correlation between the mean tangential kinematic engagement area Ā
kin,t, and the mean maximum chip thickness
hcu, max. This correlation becomes already clear from geometrical considerations. A similar, but lower effect showed an increase of the total tangential kinematic engagement area A
kin,t. The relationship between the average tangential kinematic engagement area Ā
kin,t and the averaged maximum chip thickness
hcu, max is described by a linear mathematical function, with a coefficient of determination of R² = 0.6463 (see
Figure 10).
The mean peak angle
β, the mean rake angle
γ and the mean sharpening angle
δ showed a strong influence on the averaged maximum chip thickness
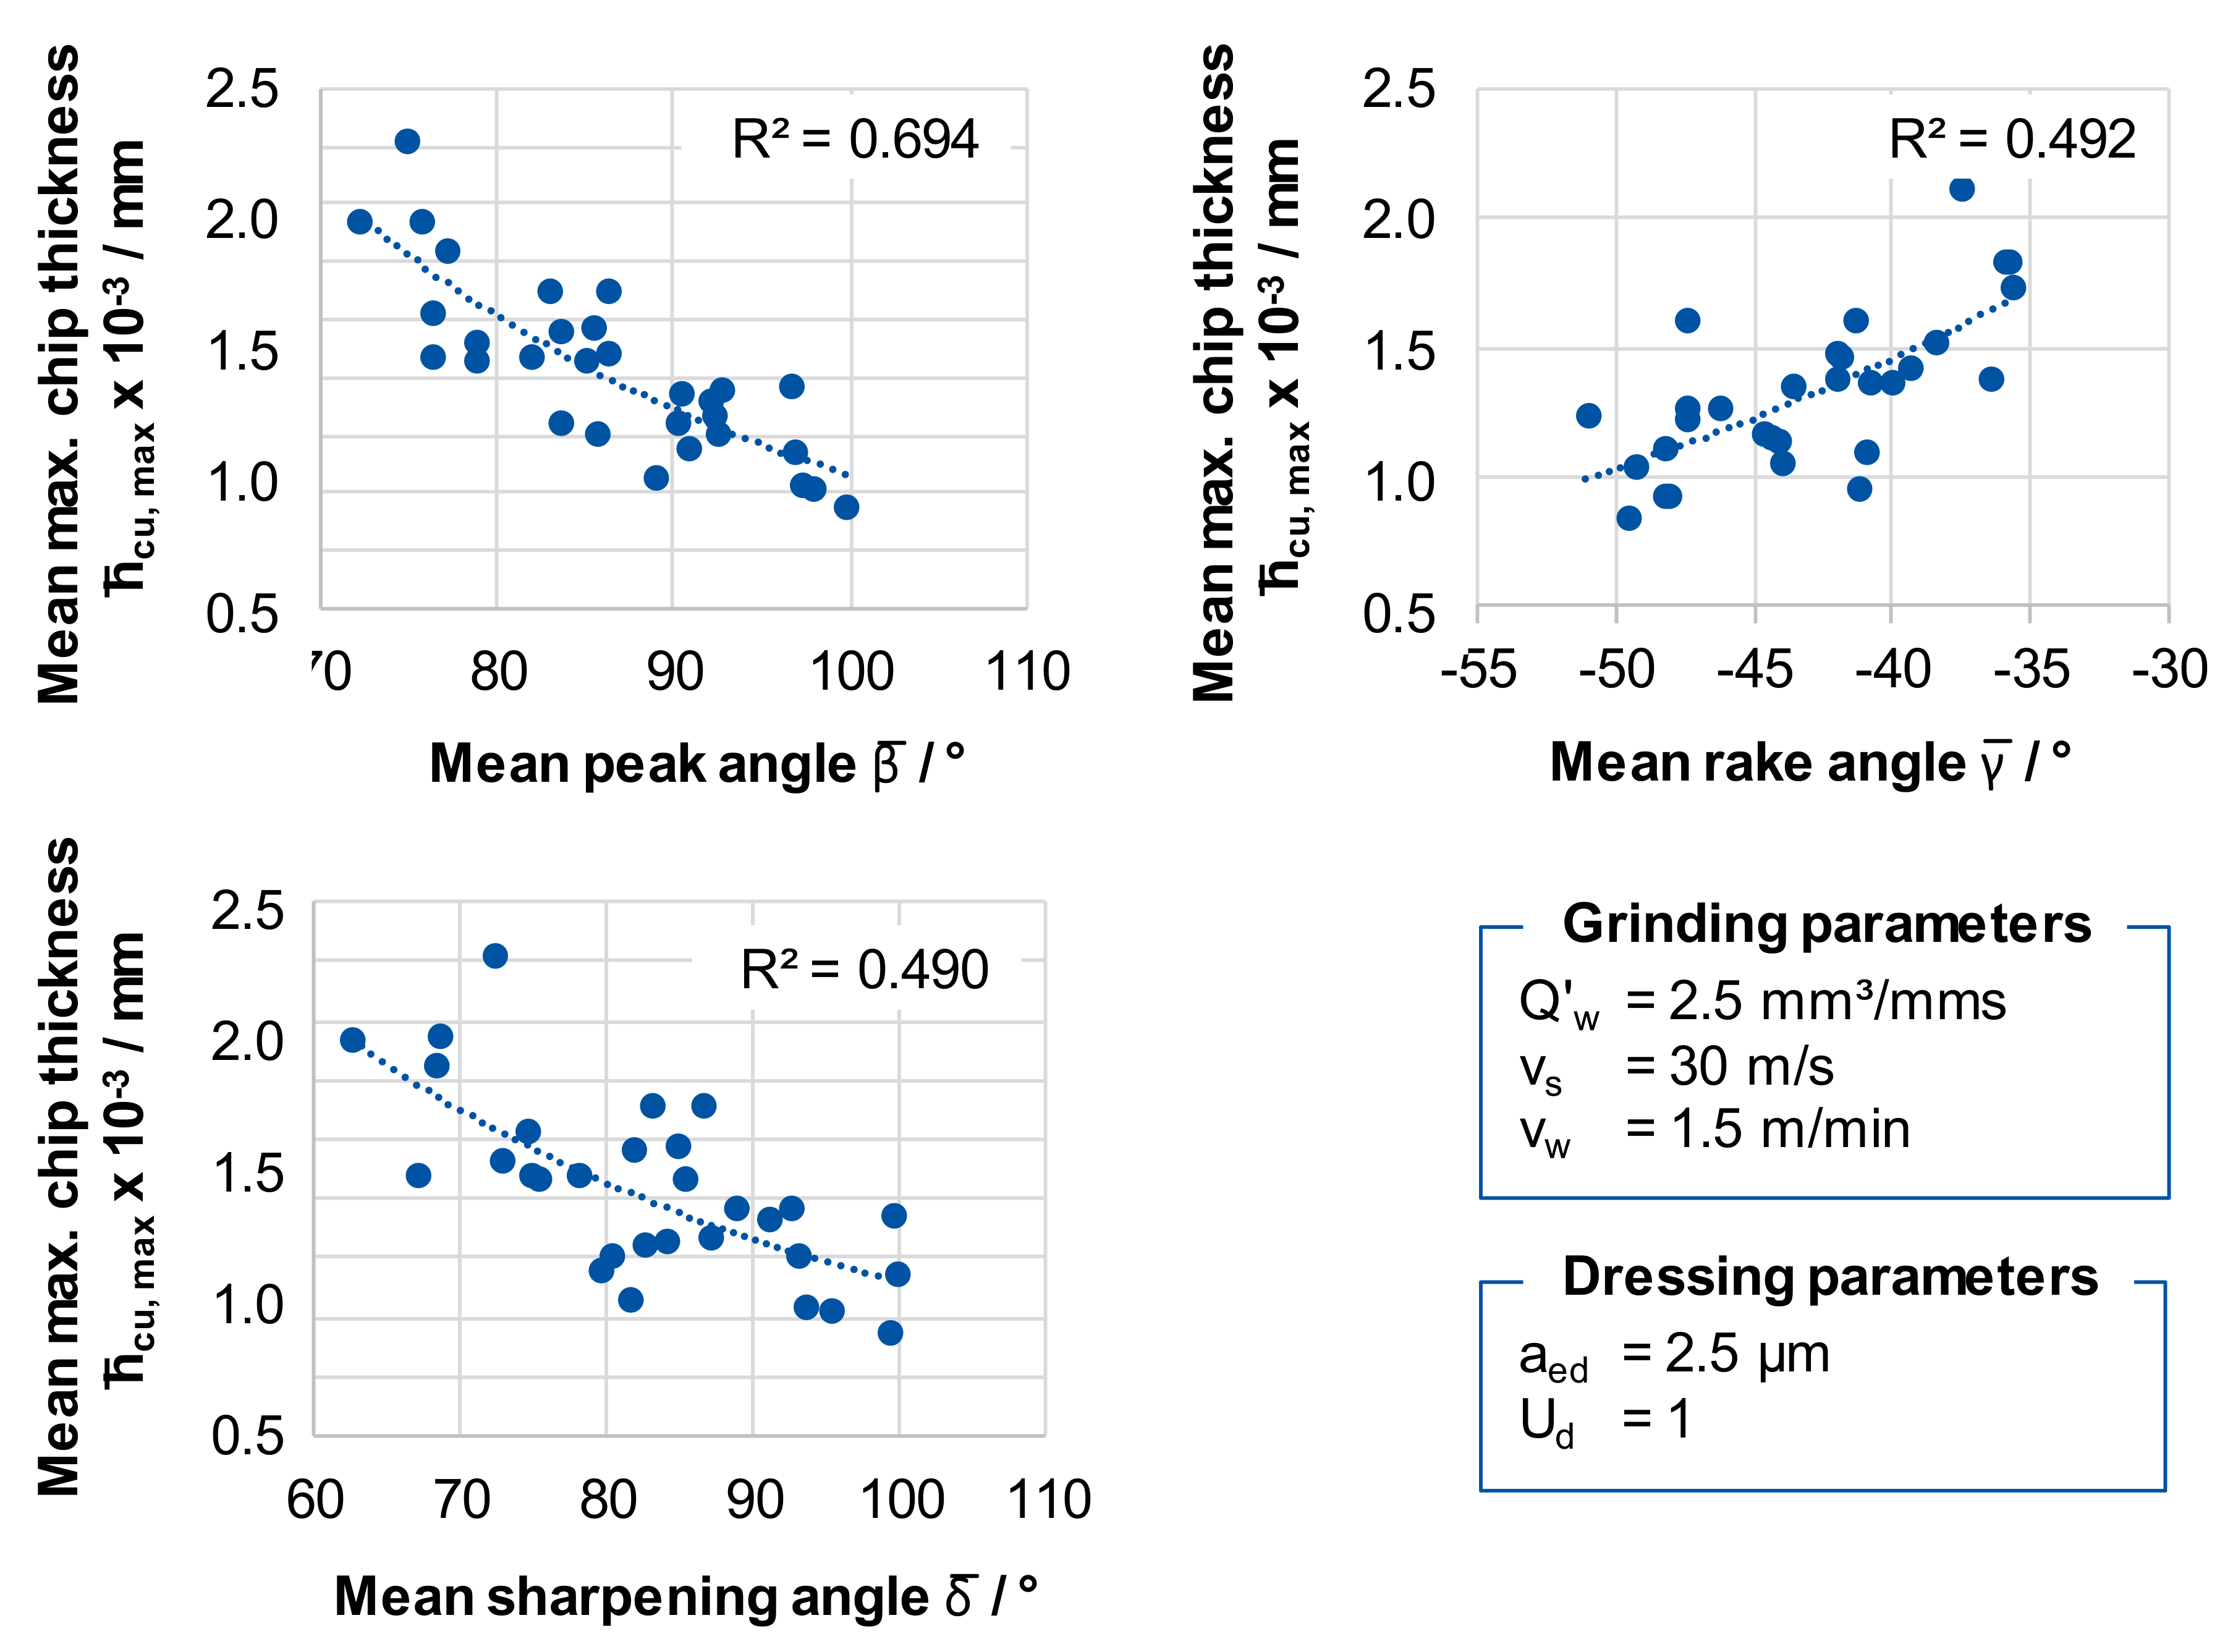
hcu, max. The coefficient of determination for a linear relationship between
β and
hcu, max was about R² = 0.69, which corresponds to a good regression (see
Figure 11). Direct connections between the averaged maximum chip thickness
hcu, max and the grinding force, as well as the temperature were not detectable. One possible reason is that the calculation of
hcu, max solely does not take the different grain protrusions during the investigations into account.
In
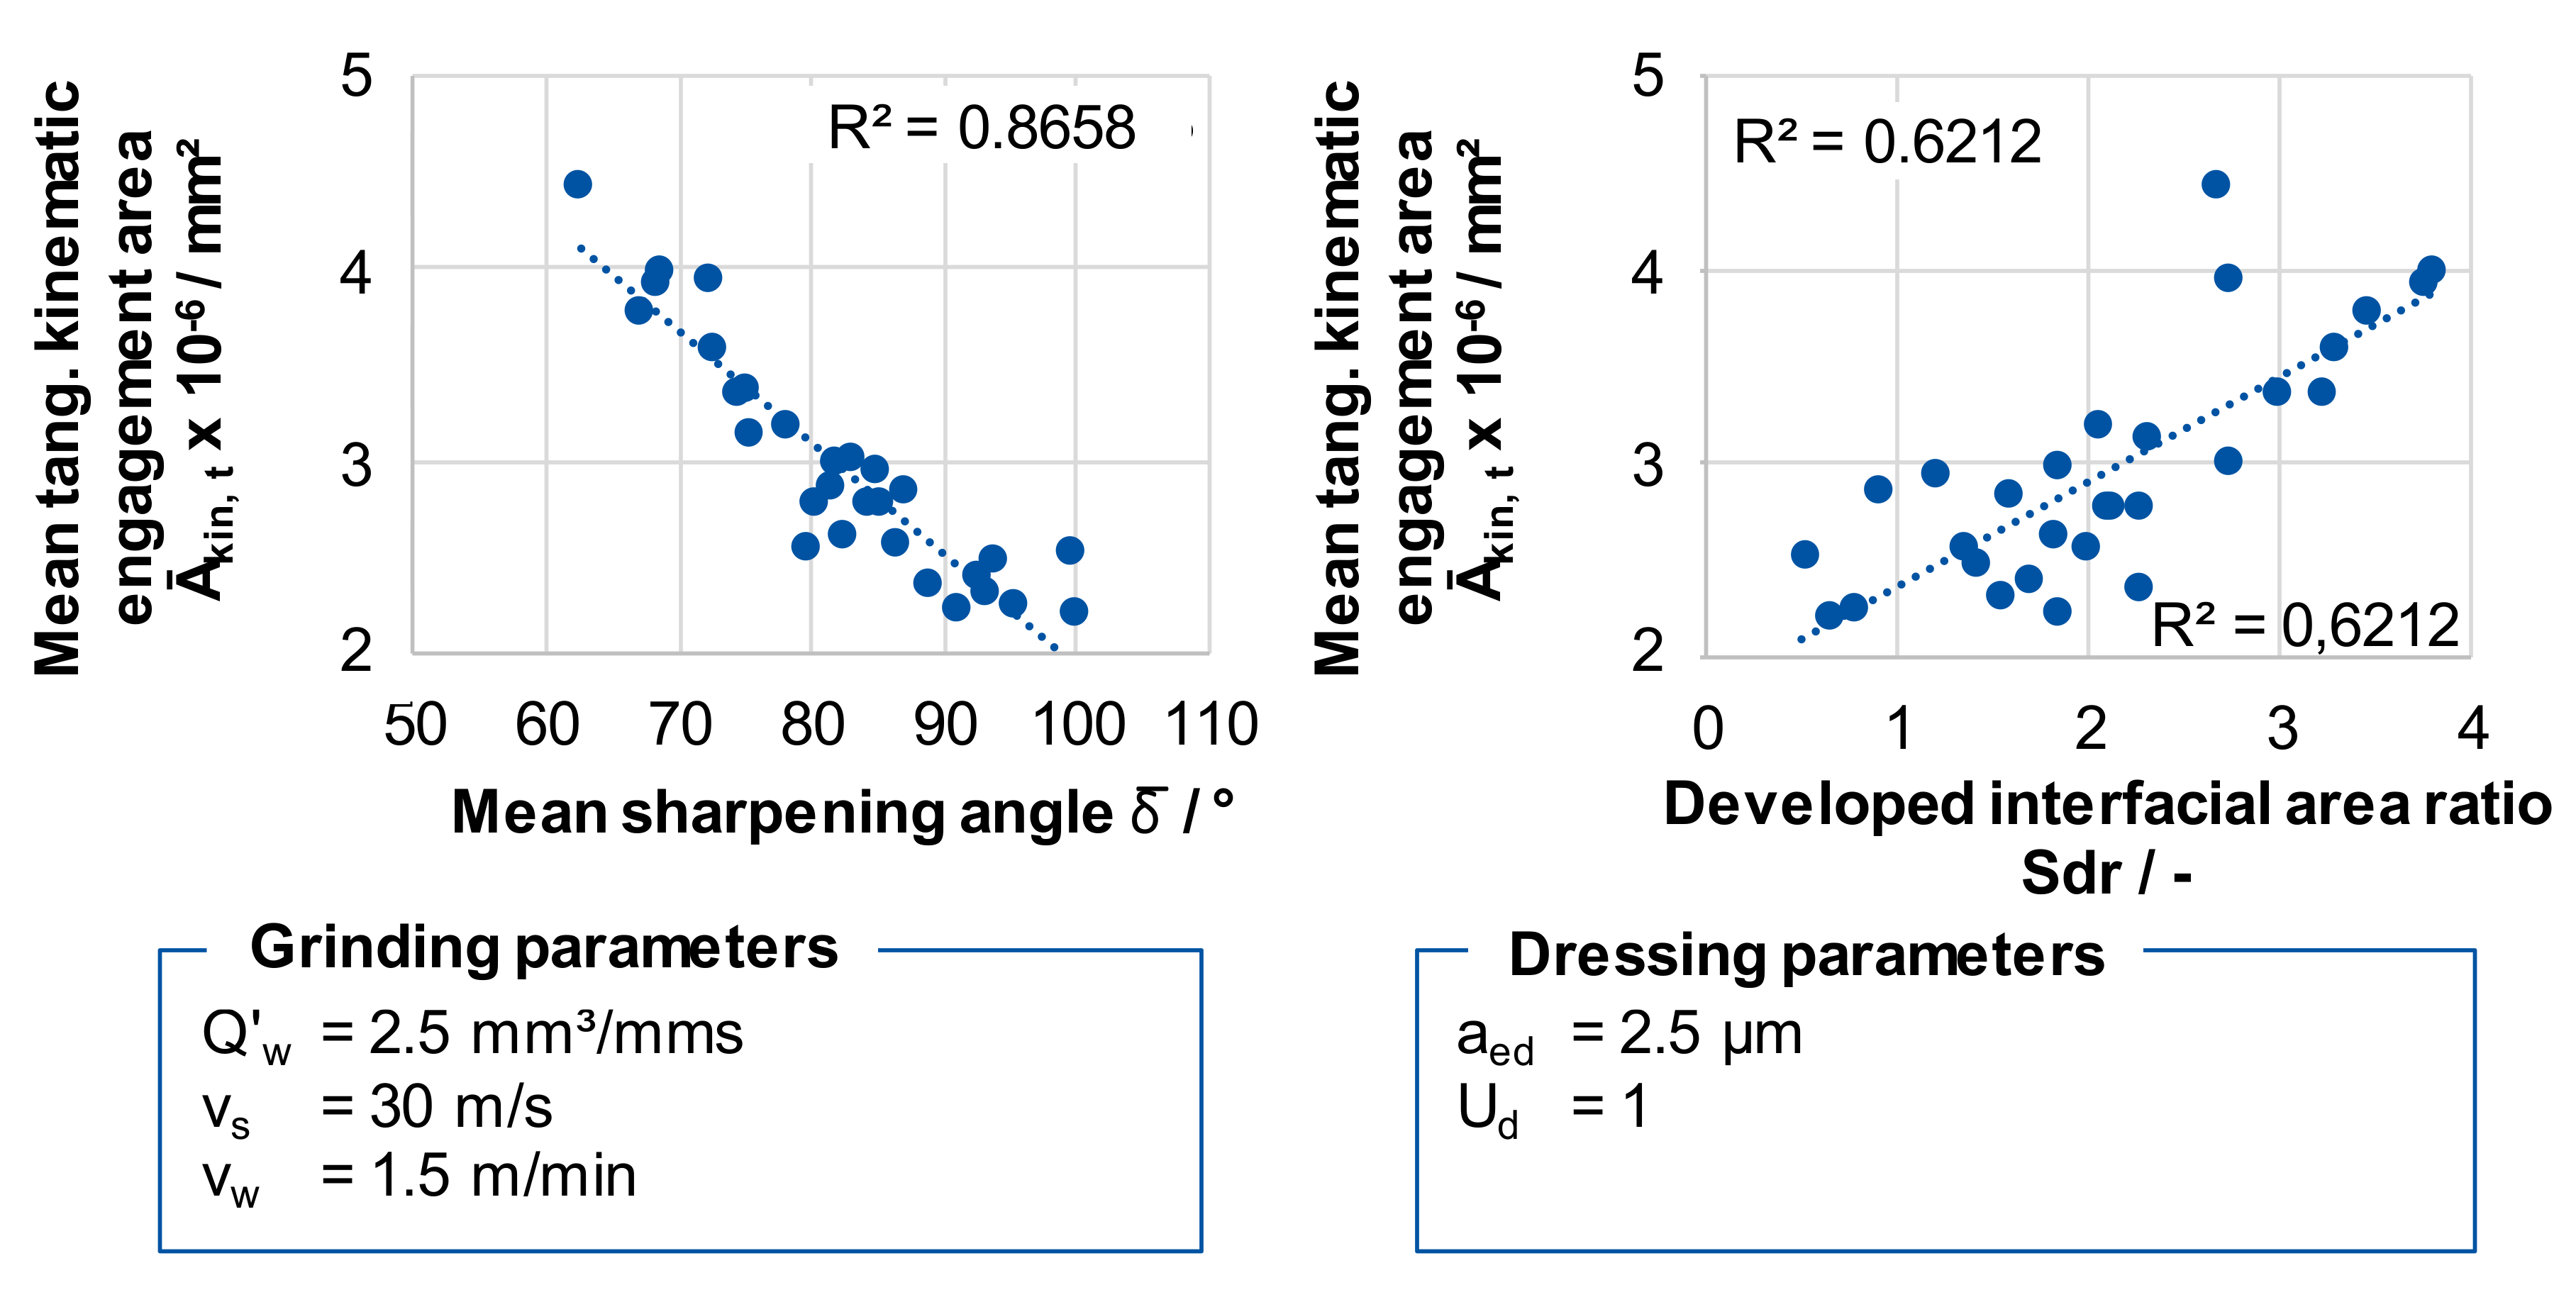
Figure 12 the relationship between the mean rake angle
γ, the developed interfacial area ratio Sdr, and the mean tangential kinematic engagement area Ā
kin,t is shown. A strong correlation prevails between the mean sharpening angle
δ and the mean tangential kinematic engagement area Ā
kin,t. An increase in the developed interfacial area ratio Sdr is associated with a rising mean tangential kinematic engagement area Ā
kin,t. Based on these correlations, this means that the mean grain surface contact angle
β,
γ, and
δ as a group, and the topography characteristics Spc, Sdr, and Sdq as a group correlate as well.
The results of the empirical investigations showed that a change of each identified topography parameter group had an influence on the formation of the thermo-mechanical stress collective. However, the results of the investigation also allowed for the conclusion that the thermo-mechanical load in the grinding process is caused by a superposition of the influences of these identified topography parameters. Therefore, the identified topography parameters were investigated in combination.
In this context,
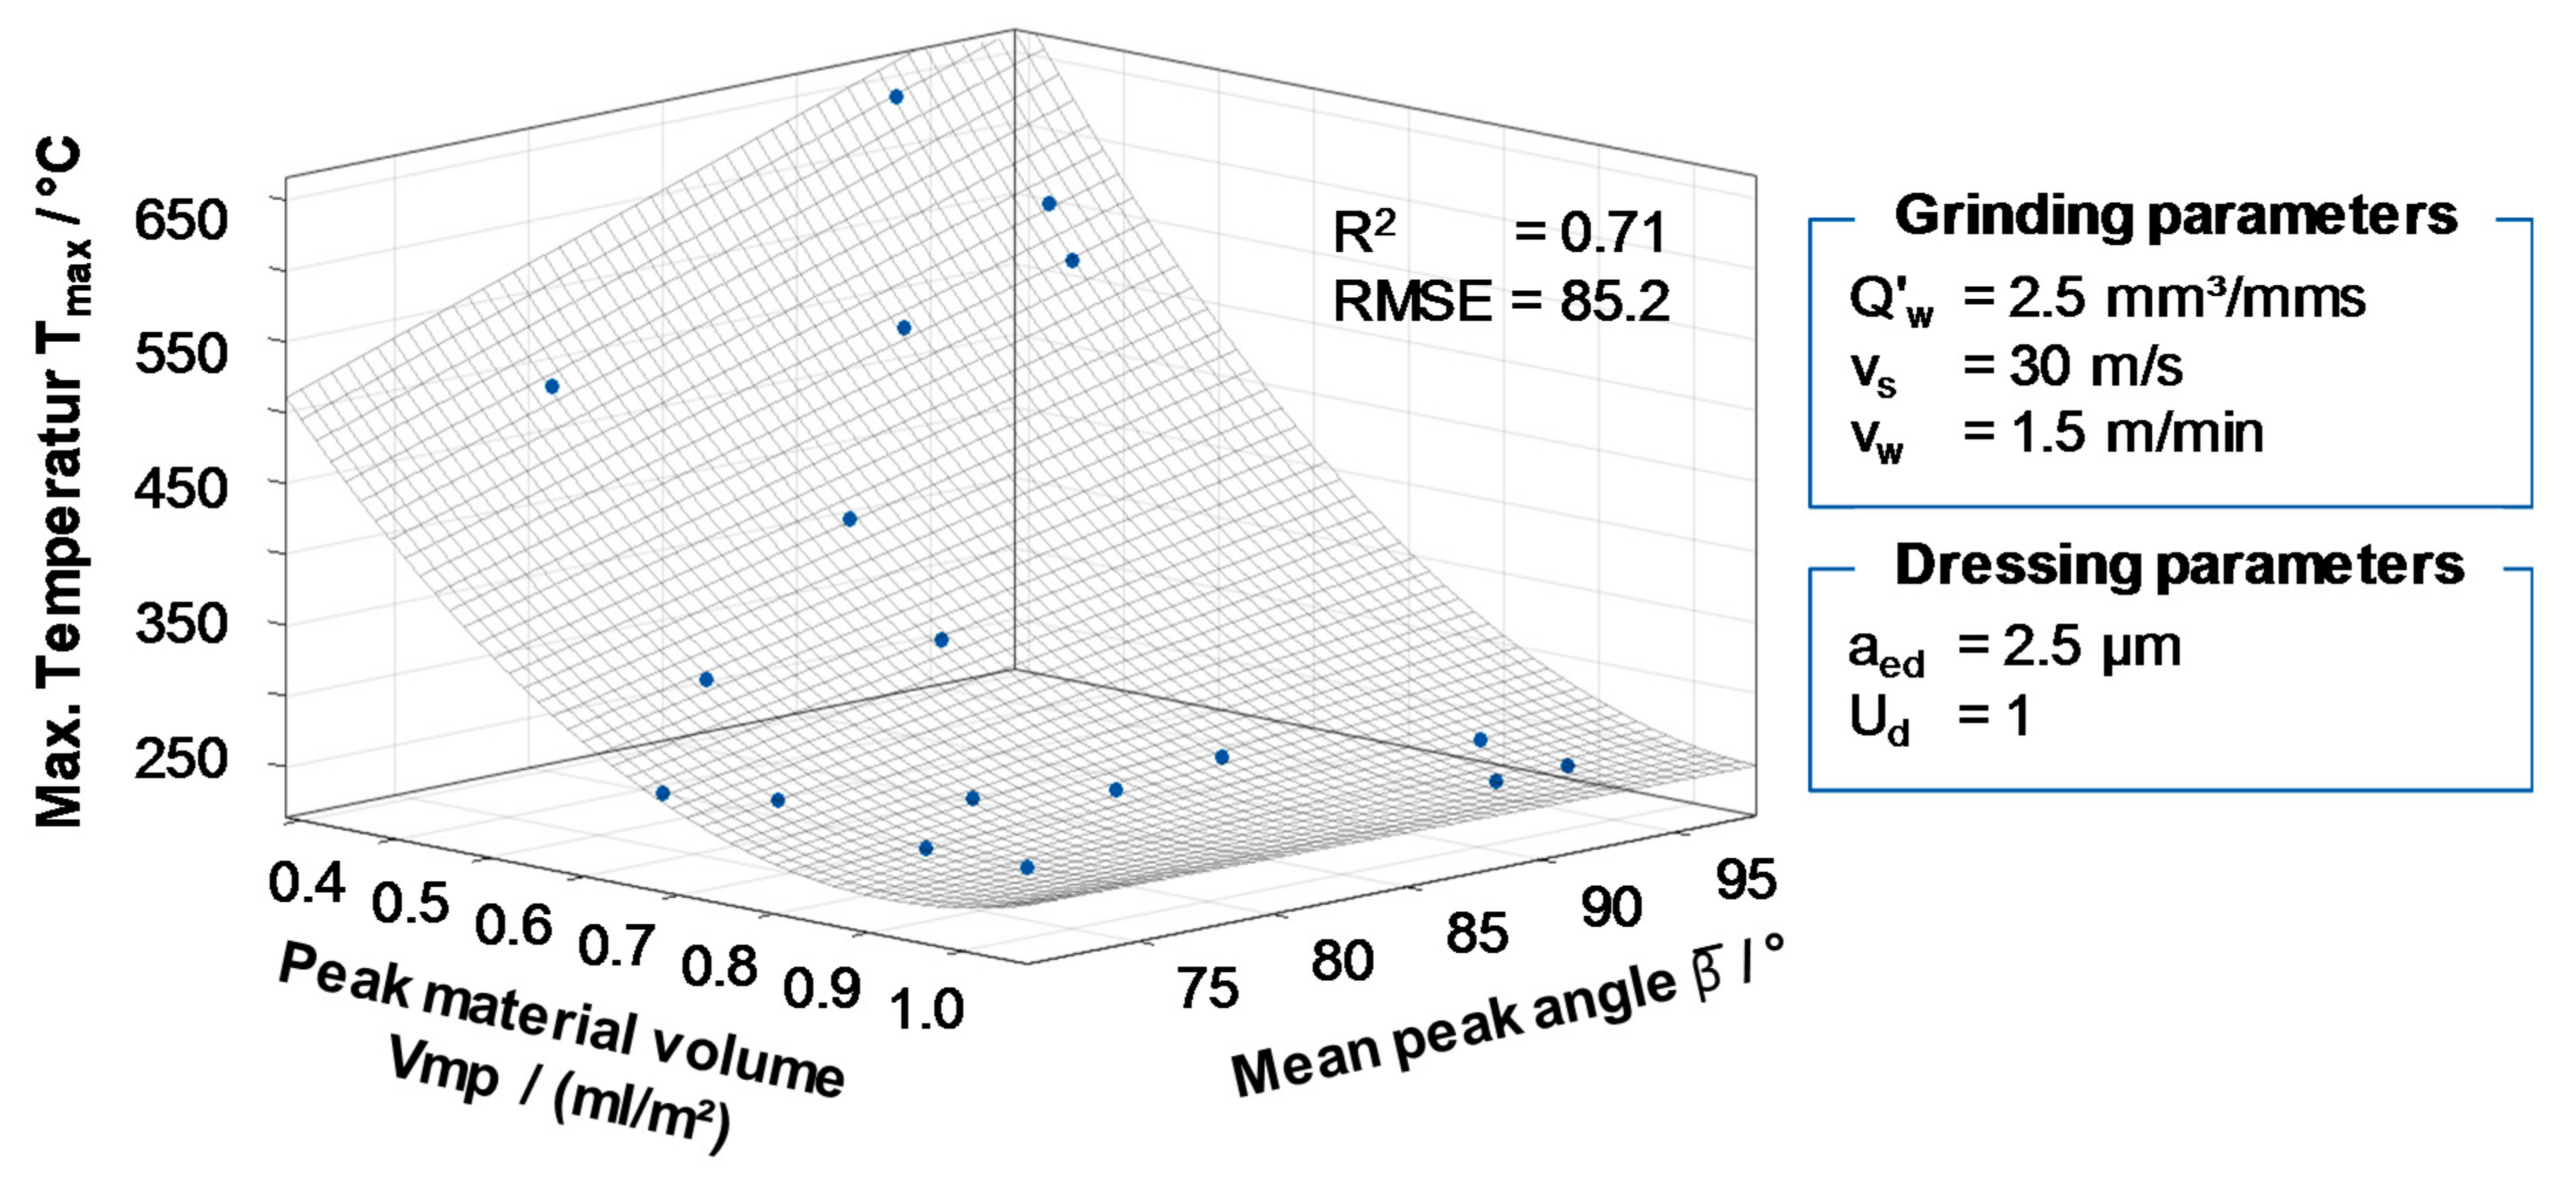
Figure 13 shows the measured maximum grinding temperature T
max depending on the peak material volume Vmp and the mean peak angle
β. The results showed that the maximum grinding temperature T
max decreased strongly with an increasing mean peak material volume Vmp. However, the results show that topographies with a similar peak material volume Vmp did not necessarily lead to a similar maximum grinding temperature T
max. By a combined examination of the mean peak material volume Vmp and the mean peak angle
β in
Figure 13, it can be seen that the fluctuating maximum grinding temperatures at almost constant Vmp can be attributed to the geometry of the kinematic peak angles. If, for example, the mean peak angle
β increased, the maximum grinding temperature T
max increased significantly with a constant peak material volume Vmp. This was especially noticeable at low values of the mean peak material volume Vmp. An increase of the mean peak angle from
β = 75° to
β = 95° at a constant mean peak material volume of Vmp = 0.4 led to an rising maximum grinding temperature T
max from nearly 500 °C to more than 650 °C. With increasing Vmp, the influence of the angle decreased. It can be assumed that the influence of the mean peak angle
β decreased with increasing Vmp, since additional chip space allowed for an increased dissipation of the process heat. The dependence of the grinding temperature on the grinding wheel topography could be approximated with the help of the two parameters with a coefficient of determination of R² = 0.71 and a root mean square error of 85.2, which corresponds to a good accuracy.
