


Abstract
Against the backdrop of China’s dual-carbon goals and the development of new power systems, the large-scale integration of renewable energy has intensified system regulation requirements and imposed higher demands on the low-carbon performance and flexibility of electricity market clearing mechanisms. To address the inability of conventional static carbon emission factors to accurately reflect the actual emission levels of coal-fired units, this paper proposes a joint energy and frequency regulation ancillary service clearing model incorporating dynamic carbon emission factors. First, a Transformer-based dynamic carbon emission factor model is developed using features such as unit output, load rate, start-up and shutdown status, and unit type to characterize the dynamic variation in the carbon emission intensity of coal-fired units. Second, a coordinated day-ahead and intraday market clearing model is established to jointly optimize unit commitment, generation scheduling, frequency regulation capacity allocation, energy storage operation, and renewable energy accommodation, thereby achieving coordinated improvements in economic efficiency, low-carbon performance, and operational flexibility. Case studies based on actual data from a provincial power grid in southern China demonstrate that the proposed model increases the renewable energy accommodation rate by 2.01%, reduces the total system cost by 1.51%, lowers total carbon emissions by 3.52%, and decreases carbon emission intensity by 5.15%. The results confirm that incorporating dynamic carbon emission factors into joint market clearing can effectively improve both the economic performance and emission reduction capability of the power system.
1. Introduction
Against the backdrop of China’s dual-carbon goals of achieving carbon peaking and carbon neutrality and the development of a new-type power system, the installed capacity of clean energy sources, such as wind and photovoltaic (PV) power, has continued to increase. Consequently, the generation mix is rapidly transitioning from one dominated by conventional generating units to one characterized by a high penetration of renewable energy. However, renewable energy generation is inherently stochastic, volatile, and uncertain. During periods of low electricity demand or high renewable output, insufficient system flexibility may lead to wind and solar curtailment, thereby constraining further improvements in clean energy accommodation. With the continuous development of electricity market mechanisms, spot markets can facilitate the temporal and spatial coordination of generation and demand through time-varying price signals. Meanwhile, frequency regulation ancillary service markets explicitly price flexibility attributes, including regulation capacity and performance, thereby incentivizing thermal power units, energy storage systems, and demand-side resources to participate in system power balancing. The coordinated operation of spot and frequency regulation markets can reshape the operating patterns and revenue structures of different generating resources, further unlock system flexibility, and provide market-based support for the accommodation of high shares of clean energy [1]. China’s electricity market reform has established an institutional foundation for the development of spot and ancillary service markets. The “Opinions on Further Deepening the Reform of the Electric Power System”, issued in 2015, proposed improving electricity pricing mechanisms, strengthening market-based trading arrangements, establishing relatively independent power trading institutions, and advancing retail-side reform in an orderly manner [2]. Subsequently, the “Basic Rules for the Electricity Spot Market (Trial)” further specified the organizational, trading, clearing, and settlement mechanisms of the spot market, providing a policy basis for the coordinated optimization of energy and ancillary service resources and the green and low-carbon operation of power systems [3].
Existing research on electricity spot market operation has primarily focused on unit bidding strategies, market pricing, coordinated trading, and renewable energy participation. Regarding the bidding behavior of conventional generating units, previous studies have examined the effects of the lifetime operating age of coal-fired units and changes in ambient temperature under extreme weather conditions on bidding decisions in the spot market [4,5]. Scarcity pricing mechanisms incorporating forced outage probabilities and ambient temperature conditions have also been developed to improve the ability of market prices to reflect the tightness of system supply and demand [6]. In terms of market-clearing mechanisms, improvements to the block-order processing module of the EUPHEMIA algorithm have been used to evaluate the energy mix, wholesale electricity prices, and the economic performance of market participants while determining zonal clearing prices based on social welfare maximization [7]. As renewable energy resources have increasingly participated in market-based transactions, joint bidding and coordinated trading among wind power, PV generation, hydropower, and energy storage have attracted growing research attention [8]. For example, wind–PV–storage coalitions based on Nash bargaining theory have been developed to coordinate internal benefit allocation and improve the overall profitability of complementary multi-energy resources [9,10]. From a price-taker perspective, joint bidding models for hydropower and wind power in the spot market have also been established to exploit the flexible regulation capability of hydropower and mitigate the market risks arising from wind power uncertainty [11]. In addition, bilevel trading decision models have been proposed to optimize the bidding strategies of wind–PV–storage aggregations subject to renewable portfolio standard constraints [12]. By further incorporating carbon trading mechanisms, the effects of carbon costs on the dispatch decisions of wind power, PV generation, and energy storage can be characterized, enabling the development of plant-level bidding and coordinated control strategies that balance economic benefits and low-carbon operation.
In addition to energy trading, the frequency regulation ancillary service market is an important mechanism for maintaining system frequency stability and guiding the efficient allocation of flexible resources. The simultaneous clearing of energy and frequency regulation services can avoid resource allocation biases caused by sequential clearing and enables the formation of a uniform regulation capacity price based on marginal pricing principles [13]. For both generation-side and demand-side resources, frequency response reserve bidding and trading mechanisms can be introduced to broaden the range of market participants providing frequency regulation services [14]. After accounting for differences in response speed and regulation performance among resources, frequency regulation performance indices can be used to quantify the relative contributions of generating units and flexible loads, thereby enabling the refined allocation of upward and downward frequency reserve resources [15]. When fast-response resources such as energy storage participate in the frequency regulation market, their operational decisions are jointly affected by performance assessment requirements and equipment degradation costs. By incorporating battery degradation costs into the revenue model, energy storage control and bidding strategies can be jointly optimized while satisfying market performance requirements [16]. Furthermore, considering the discrete–continuous-time stochastic characteristics of automatic generation control (AGC) signals, look-ahead economic dispatch models that simultaneously account for energy balance and frequency regulation requirements can more accurately represent the dynamic responses of regulation resources and enhance the real-time balancing capability of the system [17].
Building on separate studies of spot and frequency regulation markets, some researchers have further incorporated energy and regulation services into a unified framework, in which energy output, reserve capacity, and frequency regulation resources are coordinated through joint market clearing. For energy storage systems, bilevel joint optimization models have been developed for participation in both the energy market and the primary frequency regulation market, thereby coordinating revenues across different markets [18]. Under joint settlement mechanisms for energy and ancillary services, the interactions between market participant decisions and system operational objectives can be investigated by separately modeling the profit-oriented behavior of individual generating companies and the coordinated optimization behavior of the system [19]. When market-based bidding by wind power is considered, bilevel bidding models for integrated energy and frequency regulation markets can coordinate the operating revenue of wind power producers with system frequency regulation requirements [20]. Moreover, incorporating wind power, PV generation, independent energy storage, and conventional thermal power into a unified co-clearing framework enables the integrated optimization of energy transactions and frequency regulation service allocation among multiple types of resources [21]. Subsequent studies on joint clearing have gradually extended from static capacity allocation to dynamic security-constrained operation. By embedding dynamic frequency constraints into security-constrained unit commitment models, primary and secondary frequency regulation resources can be jointly optimized, thereby improving the system frequency response following disturbances [22]. When the inertia requirements and uncertainty of renewable generating units are considered, chance-constrained stochastic unit commitment models can coordinately optimize energy production, reserve capacity, and inertia procurement, reducing operating costs while ensuring system frequency security [23]. These studies provide an important theoretical foundation for the joint allocation of energy and frequency regulation resources.
Despite the extensive progress achieved in market mechanism design, generating-unit bidding, and joint clearing models, several limitations remain. First, most existing joint clearing models primarily aim to minimize system operating costs or maximize social welfare. Insufficient attention has been paid to the profit-maximizing behavior of multiple resource types, such as thermal power units and energy storage systems, when they operate as independent market participants. Consequently, these models may not fully capture the actual decisions of heterogeneous market participants in response to price signals or the interactions among their decisions. Second, existing research has mainly emphasized the security and economic efficiency of market operation, whereas the effects of coordinated spot and frequency regulation market operation on clean energy accommodation and carbon emission reduction have not been systematically investigated. The internal transmission pathways through which market mechanisms affect generation schedules, system-wide carbon emissions, and renewable energy accommodation therefore remain unclear. Third, most existing studies still calculate carbon emissions using static emission factors expressed as regional averages or fixed parameters [24]. Such approaches cannot adequately reflect the dynamic effects of operating characteristics—including unit loading levels, start-up and shutdown states, ramping processes, and frequency regulation actions—on carbon emissions per unit of electricity generated. As a result, the calculated carbon emissions and carbon costs may deviate from the actual operating conditions of generating units, making these methods inadequate for refined electricity–carbon coordination analyses [25].
To address these limitations, this paper proposes a joint clearing framework for spot and frequency regulation markets involving multiple types of generating resources. First, a market mechanism is established for thermal power units, renewable energy resources, and energy storage systems participating in energy and frequency regulation ancillary service transactions. The operational constraints, revenue components, and market responses of different resources in both the energy and regulation dimensions are explicitly characterized. Second, a day-ahead–intraday joint clearing model oriented toward promoting clean energy accommodation is developed. Dynamic carbon emission factors are introduced to represent the differences in carbon emissions from thermal power units under different loading levels, start-up and shutdown states, and regulation conditions. In the day-ahead stage, reliability-constrained unit commitment is performed to determine the commitment status, scheduled energy output, and reserved frequency regulation capacity of each type of generating resource. In the intraday stage, security-constrained economic dispatch is conducted to adjust actual unit outputs and the deployment of frequency regulation services while determining locational marginal prices and frequency regulation service prices. On this basis, the operating power of each resource is coordinately determined by jointly considering system operating costs, the revenues of market participants, clean energy accommodation, and carbon emissions. Finally, multiple market scenarios are established using actual operational data from a province in southern China. Case studies are conducted to verify the effectiveness of the proposed model and to quantitatively evaluate the comprehensive effects of coordinated spot and frequency regulation market operation on system operating efficiency, market participant revenues, clean energy accommodation, and carbon emission reduction.
2. Materials and Methods
2.1. Multi-Unit Joint Clearing Transaction Mechanism Framework
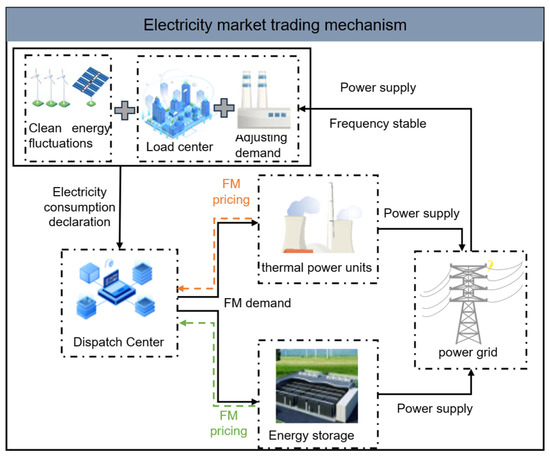
The multi-unit joint market-clearing mechanism comprises four main stages: market bidding, joint optimization and clearing, dispatch implementation, and market settlement. The overall transaction framework is illustrated in Figure 1:
Figure 1.
Flowchart of Multi-Unit Joint Clearing and Trading Mechanism.
During the market-bidding stage, different market participants submit their energy offer prices, upward and downward frequency regulation capacity prices, and regulation mileage prices according to their respective technical characteristics and operating costs.
During the joint optimization and clearing stage, the system operator simultaneously determines the energy outputs of thermal and clean energy generating units, the frequency regulation capacities and regulation mileage awarded to different resources, and the charging and discharging states of energy storage systems within a unified optimization model. The clearing process comprehensively considers load forecasts, renewable generation forecasts, unit offers, network parameters, and system frequency regulation requirements. Compared with sequential clearing, joint clearing can avoid inefficient resource allocation caused by the separate clearing of energy and frequency regulation services. It also incorporates the opportunity costs incurred when different resources reserve capacity for frequency regulation into the market-clearing results [26].
During the dispatch implementation stage, the system operator generates automatic generation control (AGC) commands according to the deviations of actual load and renewable generation from their scheduled values. Regulation mileage is then allocated to the awarded resources based on their cleared regulation capacities and regulation performance. The coordinated dispatch of heterogeneous resources combines the sustained regulation capability of thermal power units with the fast-response capability of energy storage systems, thereby improving the ability of the power system to accommodate load variations and renewable generation fluctuations [27].
During the market settlement stage, energy transactions are settled according to locational marginal prices or a uniform market-clearing price. Compensation for frequency regulation services is determined by considering the awarded regulation capacity, actual regulation mileage, and response performance. Regulation capacity payments compensate resources for the opportunity costs associated with reserving generation, charging, or discharging capability. Regulation mileage payments reflect the actual amount of regulation work performed in tracking AGC commands. A performance coefficient is further introduced to account for differences among resources in response speed, tracking accuracy, and consistency with the required regulation direction.
2.2. Operating Characteristics of Different Types of Market Participants
Under the joint market-clearing framework, different types of generating and storage resources exhibit substantial differences in cost structures, regulation performance, and market functions. These differences determine their respective roles in the energy and frequency regulation markets. This section compares the operating characteristics of thermal power units, energy storage stations, and clean energy generating units from the perspectives of cost characteristics, regulation capabilities, and market roles.
2.2.1. Operating Characteristics of Thermal Power Units
As the principal conventional regulation resources in power systems, thermal power units participate in electricity markets primarily based on their marginal generation costs. These costs generally include fuel consumption costs, operation and maintenance costs, start-up and shutdown costs, and dynamic carbon emission costs [28].
In terms of cost characteristics, the fuel consumption cost of a thermal power unit typically follows a quadratic function, with its marginal cost increasing as power output rises. Dynamic carbon emission costs can significantly affect the bidding strategies of thermal power units. In particular, the carbon emission intensity of a thermal power unit operating at a low loading level is generally much higher than that under rated operating conditions. By incorporating variable carbon emission intensity into the unit cost coefficients, the external costs associated with carbon emissions can be internalized in market bidding and clearing. Fluctuations in carbon market prices are directly transmitted to the marginal costs of thermal power units, thereby changing their merit order in the energy market [29].
2.2.2. Operating Characteristics of Energy Storage Stations
Energy storage stations possess distinct advantages in market clearing because of their rapid response capability and bidirectional regulation flexibility. Their marginal operating costs are relatively low because they consume no fuel. Their primary operating cost arises from battery degradation caused by charging and discharging cycles.
Compared with conventional generating units, energy storage systems can adopt more strategic bidding behavior. In the frequency regulation market, regulation capacity and mileage prices can be formulated by jointly considering charging and discharging opportunity costs, cycle degradation costs, and the current state of charge (SOC) [30]. In the energy market, energy storage stations independently determine their charging and discharging periods according to expected electricity price variations, thereby realizing price arbitrage between peak and off-peak periods.
2.2.3. Operating Characteristics of Clean Energy Generating Units
Clean energy generating units, including wind and photovoltaic power units, generally participate in the energy market at zero or near-zero marginal cost. Their outputs are constrained by natural resource conditions and are therefore characterized by intermittency and uncertainty [31].
Because their marginal generation costs are extremely low, clean energy generating units are typically cleared with priority through low-price offers in the energy market. Their submitted generation quantities are generally bounded by short-term power forecasts. Deviations between actual and forecast renewable generation are balanced by the frequency regulation resources available within the system.
2.3. Market Joint Clearing Model Under the Coordinated Operation of Multi-Ple Types of Generating Units Under the Influence of Carbon Factor
2.3.1. Electricity Market Joint Clearing Framework
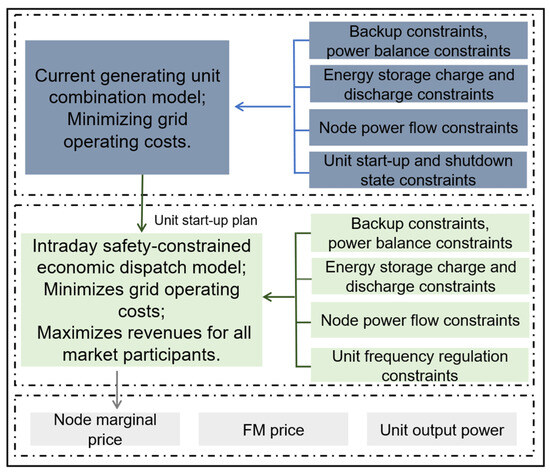
In the context of coordinated participation of multiple types of generating units in the energy and frequency regulation ancillary service markets, this paper develops a coordinated day-ahead and intraday market-clearing model that incorporates the dynamic carbon emission characteristics of coal-fired units. In the day-ahead stage, a unit commitment model is formulated based on unit operating parameters, load and renewable generation forecasts, frequency regulation requirements, and carbon emission parameters. The model minimizes the total system operating cost and determines unit commitment statuses, day-ahead generation schedules, and frequency regulation capacity reserves. In the intraday stage, a security-constrained economic dispatch model is established based on the day-ahead decisions and updated information on load, renewable generation, grid operating conditions, and frequency regulation requirements. The model performs rolling adjustments to unit outputs, energy storage charging and discharging, renewable energy accommodation, and frequency regulation service deployment while deriving energy and frequency regulation ancillary service prices. By maximizing the revenues of individual market participants, the proposed framework promotes mutually beneficial coordination between the market operator and market participants. The overall framework is illustrated in Figure 2:
Figure 2.
Market clearing model with the coordinated participation of multiple types of generating units.
2.3.2. Upper-Level Day-Ahead Unit Combination Model
The power grid dispatch center optimizes the unit start-up schedule with the goal of minimizing the operating costs of all generating units in the system. The total operating cost of the dispatch center includes:
where represent the electricity market cost, carbon emission cost, curtailment cost, power shortage cost, and unit start-up and shutdown cost at time t, respectively. represents the set of generating units; represents the system node number; represents the declared electricity price of unit i at time t; represents the declared output of unit i at time t; represents the trading price corresponding to a unit of carbon emissions, namely, the closing price of the Chinese carbon market on 30 June 2025, which was 75.02 yuan/ton; represents the dynamic carbon emission factor of unit ; represents the cost corresponding to a unit of curtailed electricity, usually determined by the renewable energy on-grid price; represents the curtailed electricity at time t of node i; represents the cost of a unit of power shortage, usually related to the GDP generated per unit of load in a region; represents the power shortage at time t of node i; represents the start-up and shutdown status of unit at time t; represents unit startup; represents unit shutdown; and represents the start-up and shutdown costs per unit capacity of conventional units, respectively.
The dynamic carbon emission calculation method is as follows:
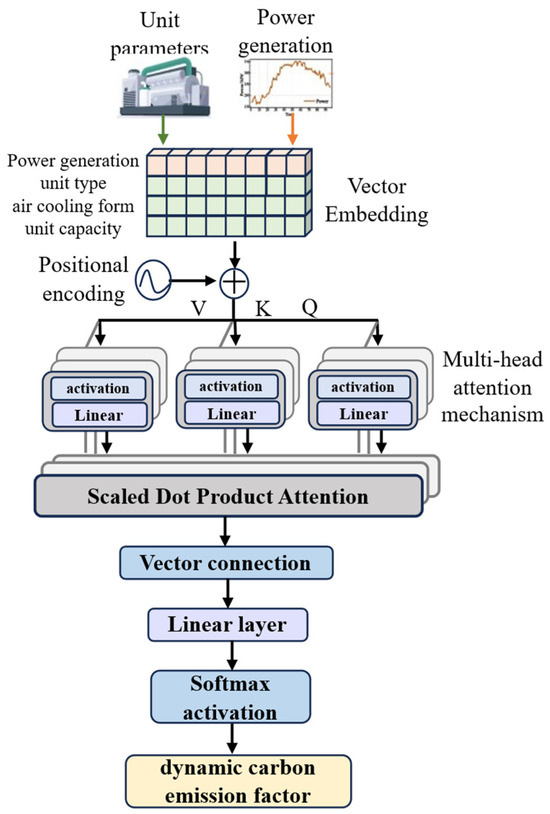
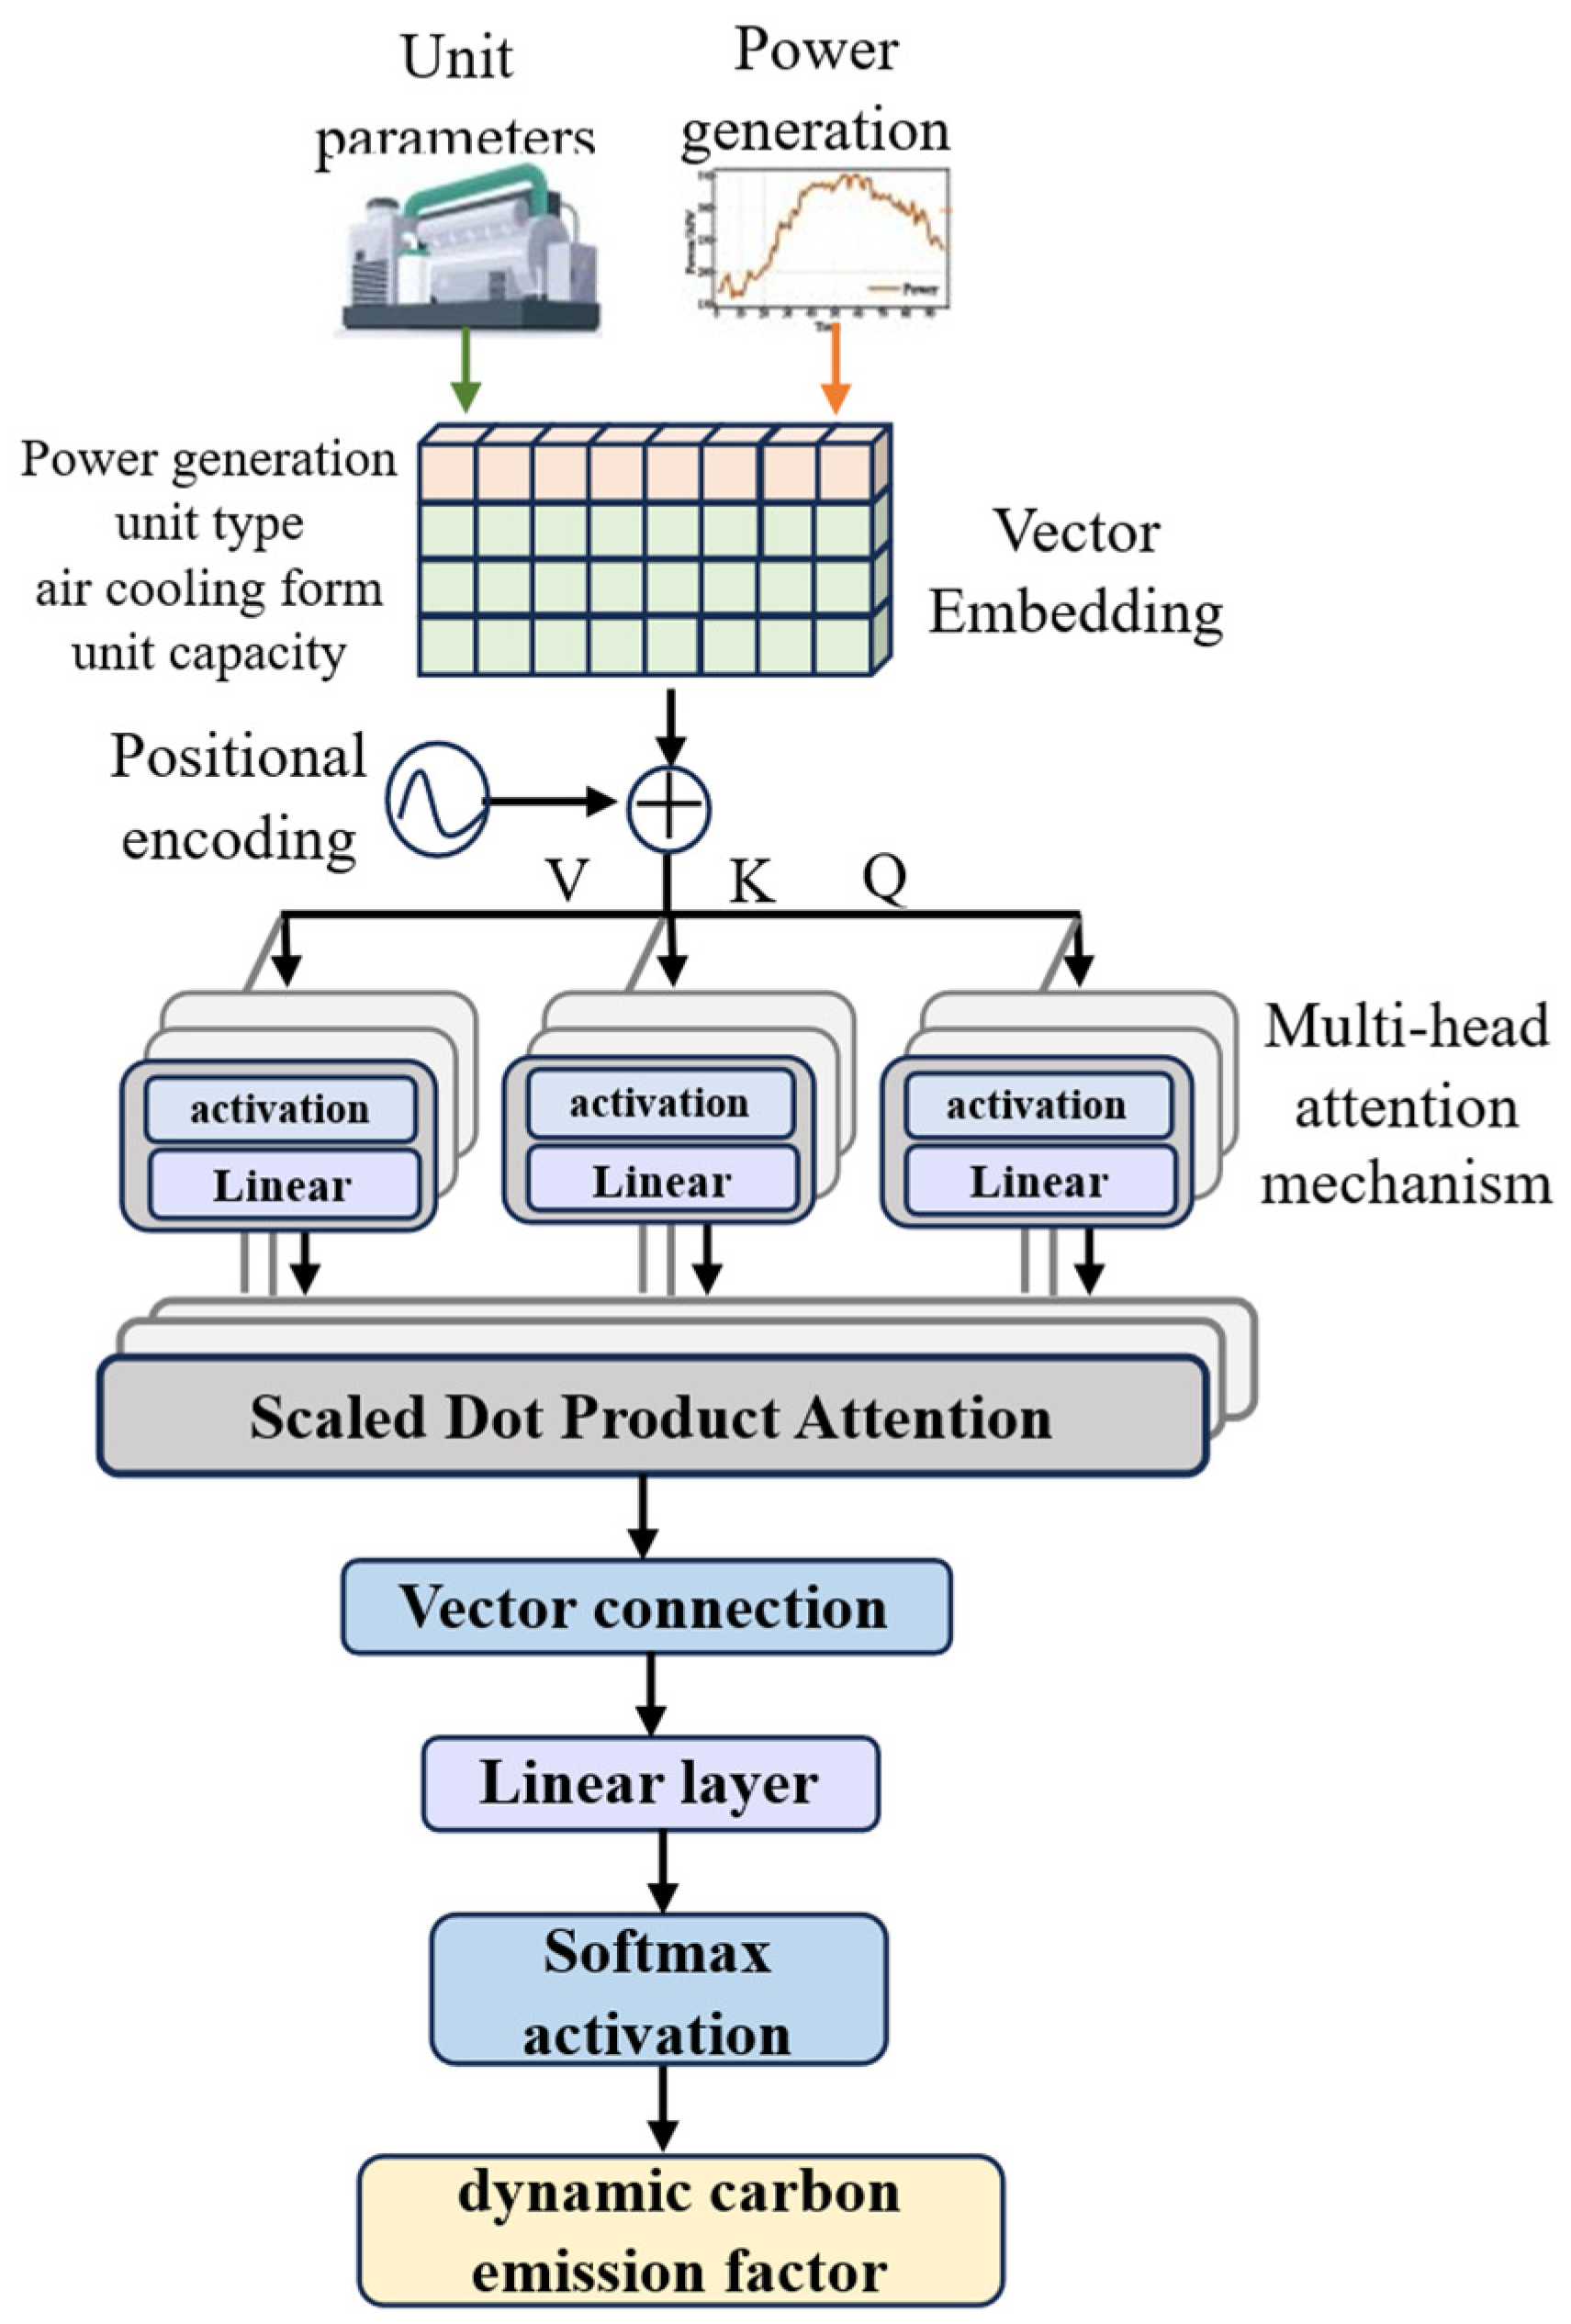
Because the existing regional average carbon emission factor method for low-carbon operation simulations cannot reflect the actual carbon emissions of thermal power units under different operating conditions, it affects the accuracy of power system carbon emission accounting. This paper constructs a Transformer-based dynamic carbon emission factor fitting model based on multi-dimensional characteristics such as unit output, heat rate, fuel type, load change rate, start-up and shutdown status, and ambient temperature. The detailed model architecture is illustrated in Figure 3.
Figure 3.
Transformer-based dynamic carbon emission calculation model.
The input data mainly consists of a combination of static and dynamic features of the generating units. Static features include unit type parameter , air-cooling type parameter , and unit capacity parameter . A neural network is used to mine the coupling relationships between static feature factors and fit physical boundaries. Since the temporal variation of load directly affects fuel efficiency, start–stop frequency, and load rate fluctuations, thus determining the carbon emission level per unit of electricity and its dynamic patterns, the specific load data corresponding to the historical power generation duration is selected as the input for the dynamic carbon emission features. The high-dimensional time-series input data for thermal power units is as follows:
The vector embedding method is adopted to concatenate static features and dynamic features at each time step into an embedding sequence in the time dimension. Then, it is transformed by a shared nonlinear embedding module and used as the input of the Transformer encoder. Then, a multi-head self-attention mechanism is used to deeply model the temporal load-parameter embedding to capture the long-range dependence and local changes in the dynamic evolution of carbon emission factors.
where are the learnable parameter matrices corresponding to each attention head. Subsequently, the correlation between time steps is calculated using Scaled Dot-Product Attention:
Here, represents the dimension of the key vector in each attention head, and dividing the result of by mainly serves to mitigate and stabilize the gradient. Finally, the outputs of all attention heads are concatenated, linearly mapped, and activated by the softmax function to obtain the dynamic carbon emission factor for coal-fired power plants:
where represents the learnable parameter matrix. This module captures the interaction between multi-scale nonlinear load evolution and static parameters in different subspaces, enhancing the model’s ability to model the time-series response of load-driven carbon emission factors, and is particularly suitable for units with complex start-up and shutdown, high-frequency fluctuations, or unsteady-state operation. Multi-head attention enables hierarchical modeling of dynamic carbon emission drivers, providing a deep, structured time-series feature representation for carbon emission factor construction.
The constraints during the operation of the unit combination model are as follows:
Power Balance Constraints
DC Power Flow Constraint
Upper and Lower Limits of Unit Output Constraints
Unit Ramp-Up Constraints
Unit Start-Up and Shutdown Constraints
Energy Storage Charging and Discharging Constraints
The energy storage device cannot simultaneously charge and over-discharge, and the charging and discharging power at any given time does not exceed its power limit.
where and represent the charging or discharging state of energy storage g at node I at time t, respectively, with 1 for charging/discharging and 0 otherwise; and represent the charging and discharging power of energy storage g at node I at time t, respectively; represents the maximum charging and discharging power of energy storage; and represents energy storage frequency regulation capacity.
Energy Storage State of Charge Constraints
2.3.3. Lower-Level Security-Constrained Economic Scheduling Model
The lower-level intraday real-time clearing model uses the generator start-up and shutdown states determined by the day-ahead reliability unit combination model as boundary inputs. It calculates the operating states of each unit, nodal marginal prices, and frequency regulation marginal prices with the objective of minimizing grid operating costs and maximizing market participant profits. The objective function is as follows:
where represents the cost calculation according to the upper-level reliability unit combination model; and represent the frequency regulation cost of the unit and energy storage at time t; , , , and represent the frequency regulation revenue of energy storage, the frequency regulation revenue of thermal power, the spot market revenue of energy storage, and the spot market revenue of thermal power, respectively; represents the set of generating units; and represent the frequency regulation capacity price and frequency regulation mileage price of the unit, respectively; represents the frequency regulation capacity of unit g at node i at time t, and represents the frequency regulation mileage of unit g at node i at time t; represents the set of energy storage units; and represent the frequency regulation capacity price and frequency regulation mileage price of energy storage, respectively; represents the frequency regulation capacity of energy storage g at node i at time t; and represents the frequency regulation mileage of energy storage g at node i at time t.
Since the upper-level day-ahead reliability unit combination model has determined the unit operating status, the main constraints of the lower-level real-time clearing economic dispatch model include Equations (11)–(14) and (17)–(22). In addition, the system frequency regulation constraints are as follows:
Unit Frequency Regulation Constraints
Upper Limit Constraint of Frequency Modulation Ancillary Services
In the formula, and represent the frequency regulation capacity of energy storage g and generator g at node i at time t; and represent the frequency regulation capacity requirement and frequency regulation mileage requirement of the system at time t, respectively; and represent the frequency regulation mileage multipliers of energy storage power station g and generator g at node i, respectively; is the frequency regulation mileage of the energy storage station; and is the frequency regulation mileage of the generator.
2.3.4. Model Solving
This paper implements two-stage hierarchical scheduling using the Gurobi solver in the Python environment: first, solve the unit combination problem with safety constraints (SCUC) to obtain the unit start-up and shutdown status; then input the start-up and shutdown status into the safety-constrained economic scheduling model (SCED) to obtain the node marginal price, frequency regulation price and system operating power with the goal of minimizing operating costs and maximizing market entity benefits. To improve the solution efficiency, the following improvement strategies are adopted: (1) decompose the integer programming and continuous optimization subproblems of the SCUC model based on the Benders decomposition algorithm [32]; (2) simplify the new energy output scenario set through the clustering algorithm to reduce the uncertainty modeling dimension [33]; and (3) use the warm-start strategy to initialize the solver to shorten the iteration convergence time. This process does not require up/down iteration, and in the engineering implementation, numpy/pandas is used to process the data, and gurobi is used to complete the modeling and solving, ensuring computational efficiency and reproducibility.
3. Results and Discussion
3.1. Simulation Environment
All simulation programs were developed in Python 3.10.13. The optimization models were implemented using the Gurobipy interface version 10.0.1 and solved with the Gurobi Optimizer version 10.0.1, while the dynamic carbon emission factor model was developed based on the PyTorch framework version 2.1.0.
3.2. Example Background
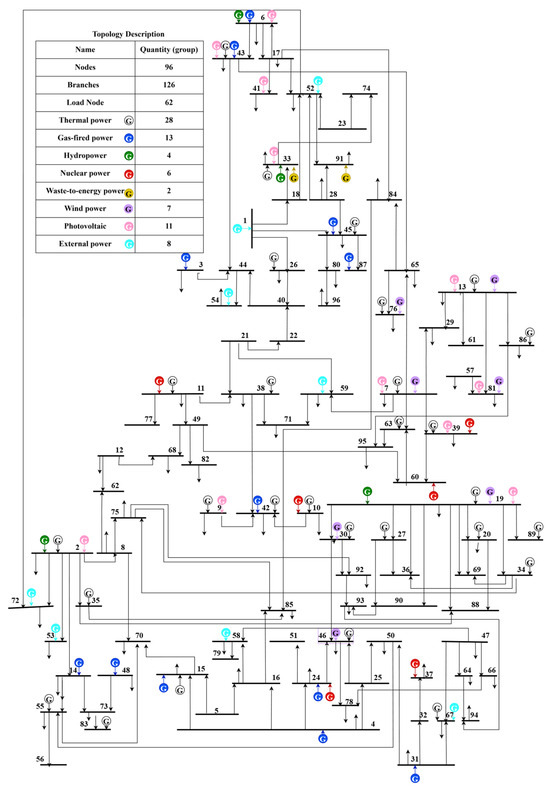
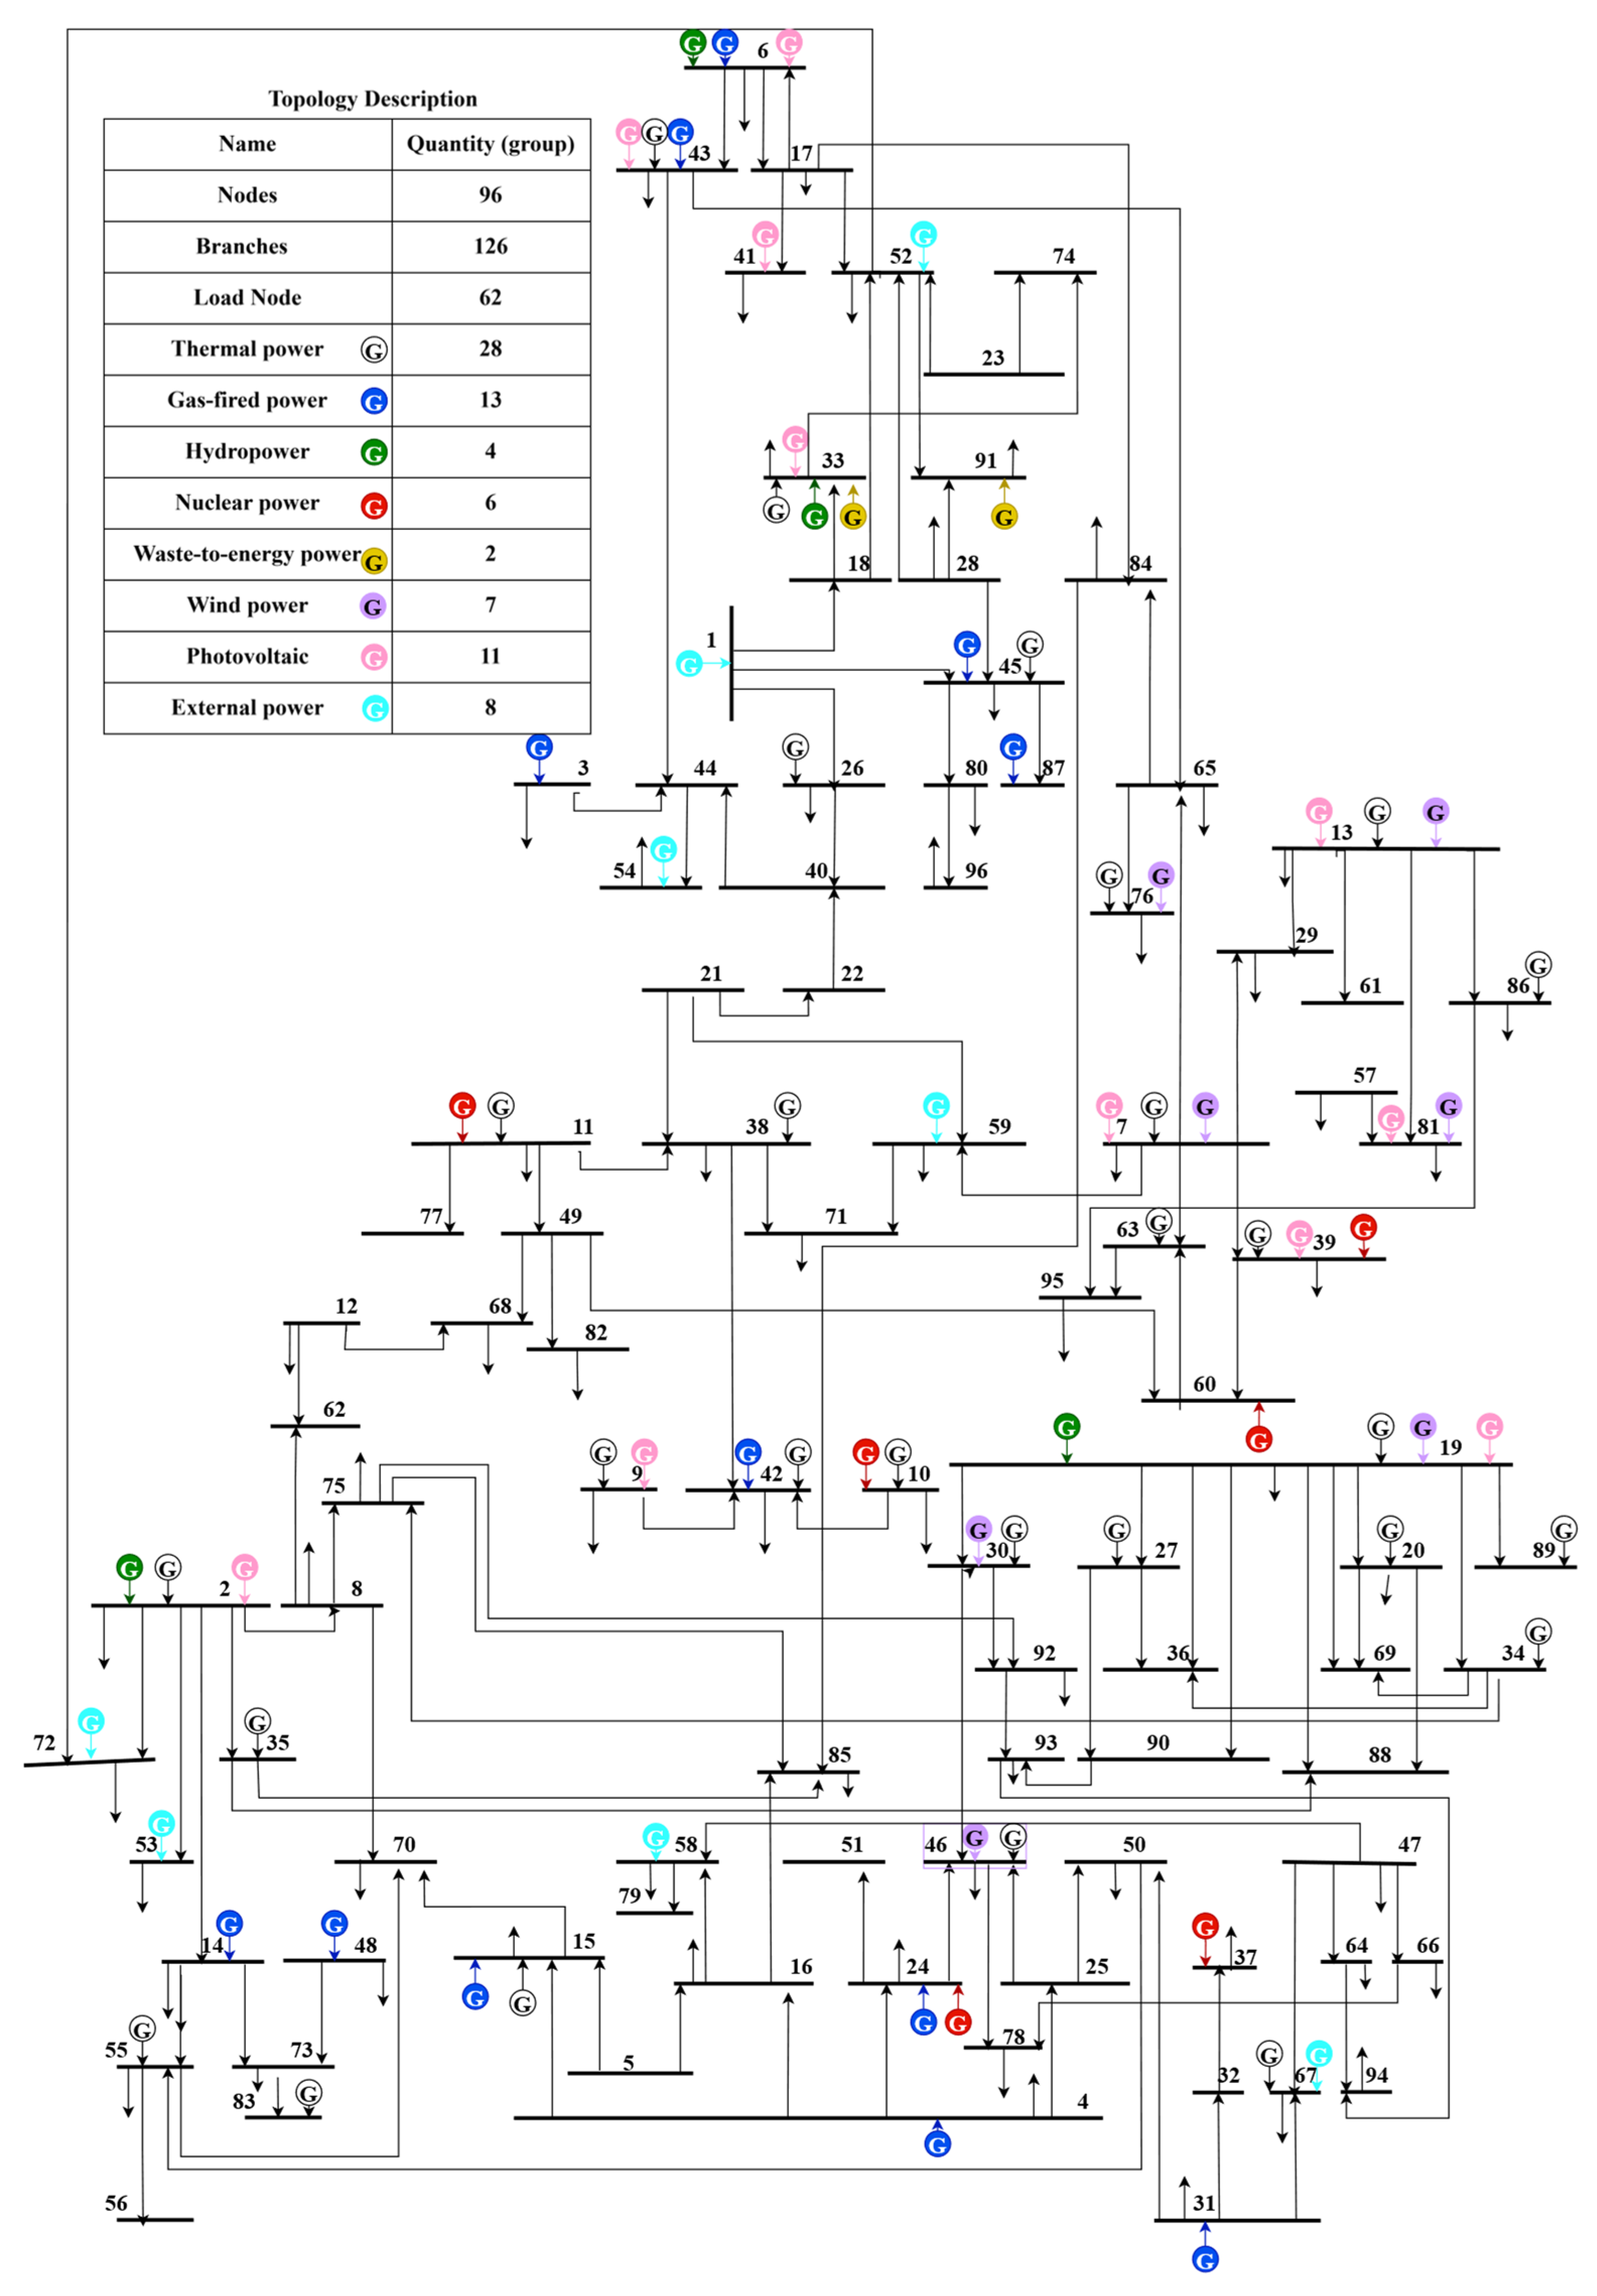
This paper uses the grid structure, power source, and load data from a province in southern China as the boundary of the example. The province’s large power grid is abstracted into 96 regional nodes representing the output and load of the province’s distribution network. Each node contains multiple power generation devices and load information of seven types: coal-fired power, gas-fired power, hydropower, nuclear power, waste-to-energy power, wind power, and photovoltaic power. Based on the nodes and branches, redundant branches are removed to simplify the graph structure, resulting in a clear provincial power system topology diagram, as shown in Figure 4.
Figure 4.
Topology diagram of a provincial power system in southern China.
The operating parameters of various types of generator sets are shown in Table 1 below, the operating parameters of energy storage power stations are shown in Table 2 below, and the relevant calculation parameters of the dynamic carbon emission factor are shown in Table 3 below.
Table 1.
Generator set operating parameters.
Table 2.
Energy storage operating parameters.
Table 3.
Dynamic carbon emission factor model hyperparameter settings.
3.3. Model Validity Analysis
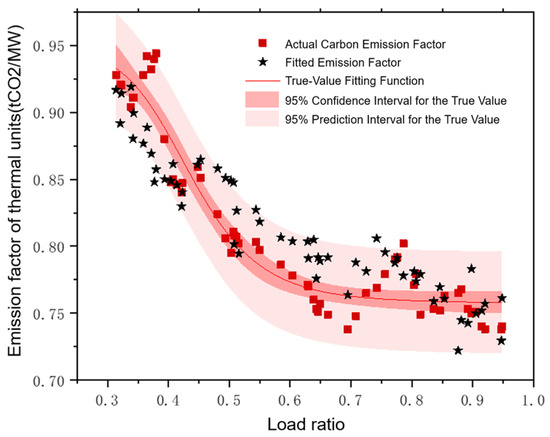
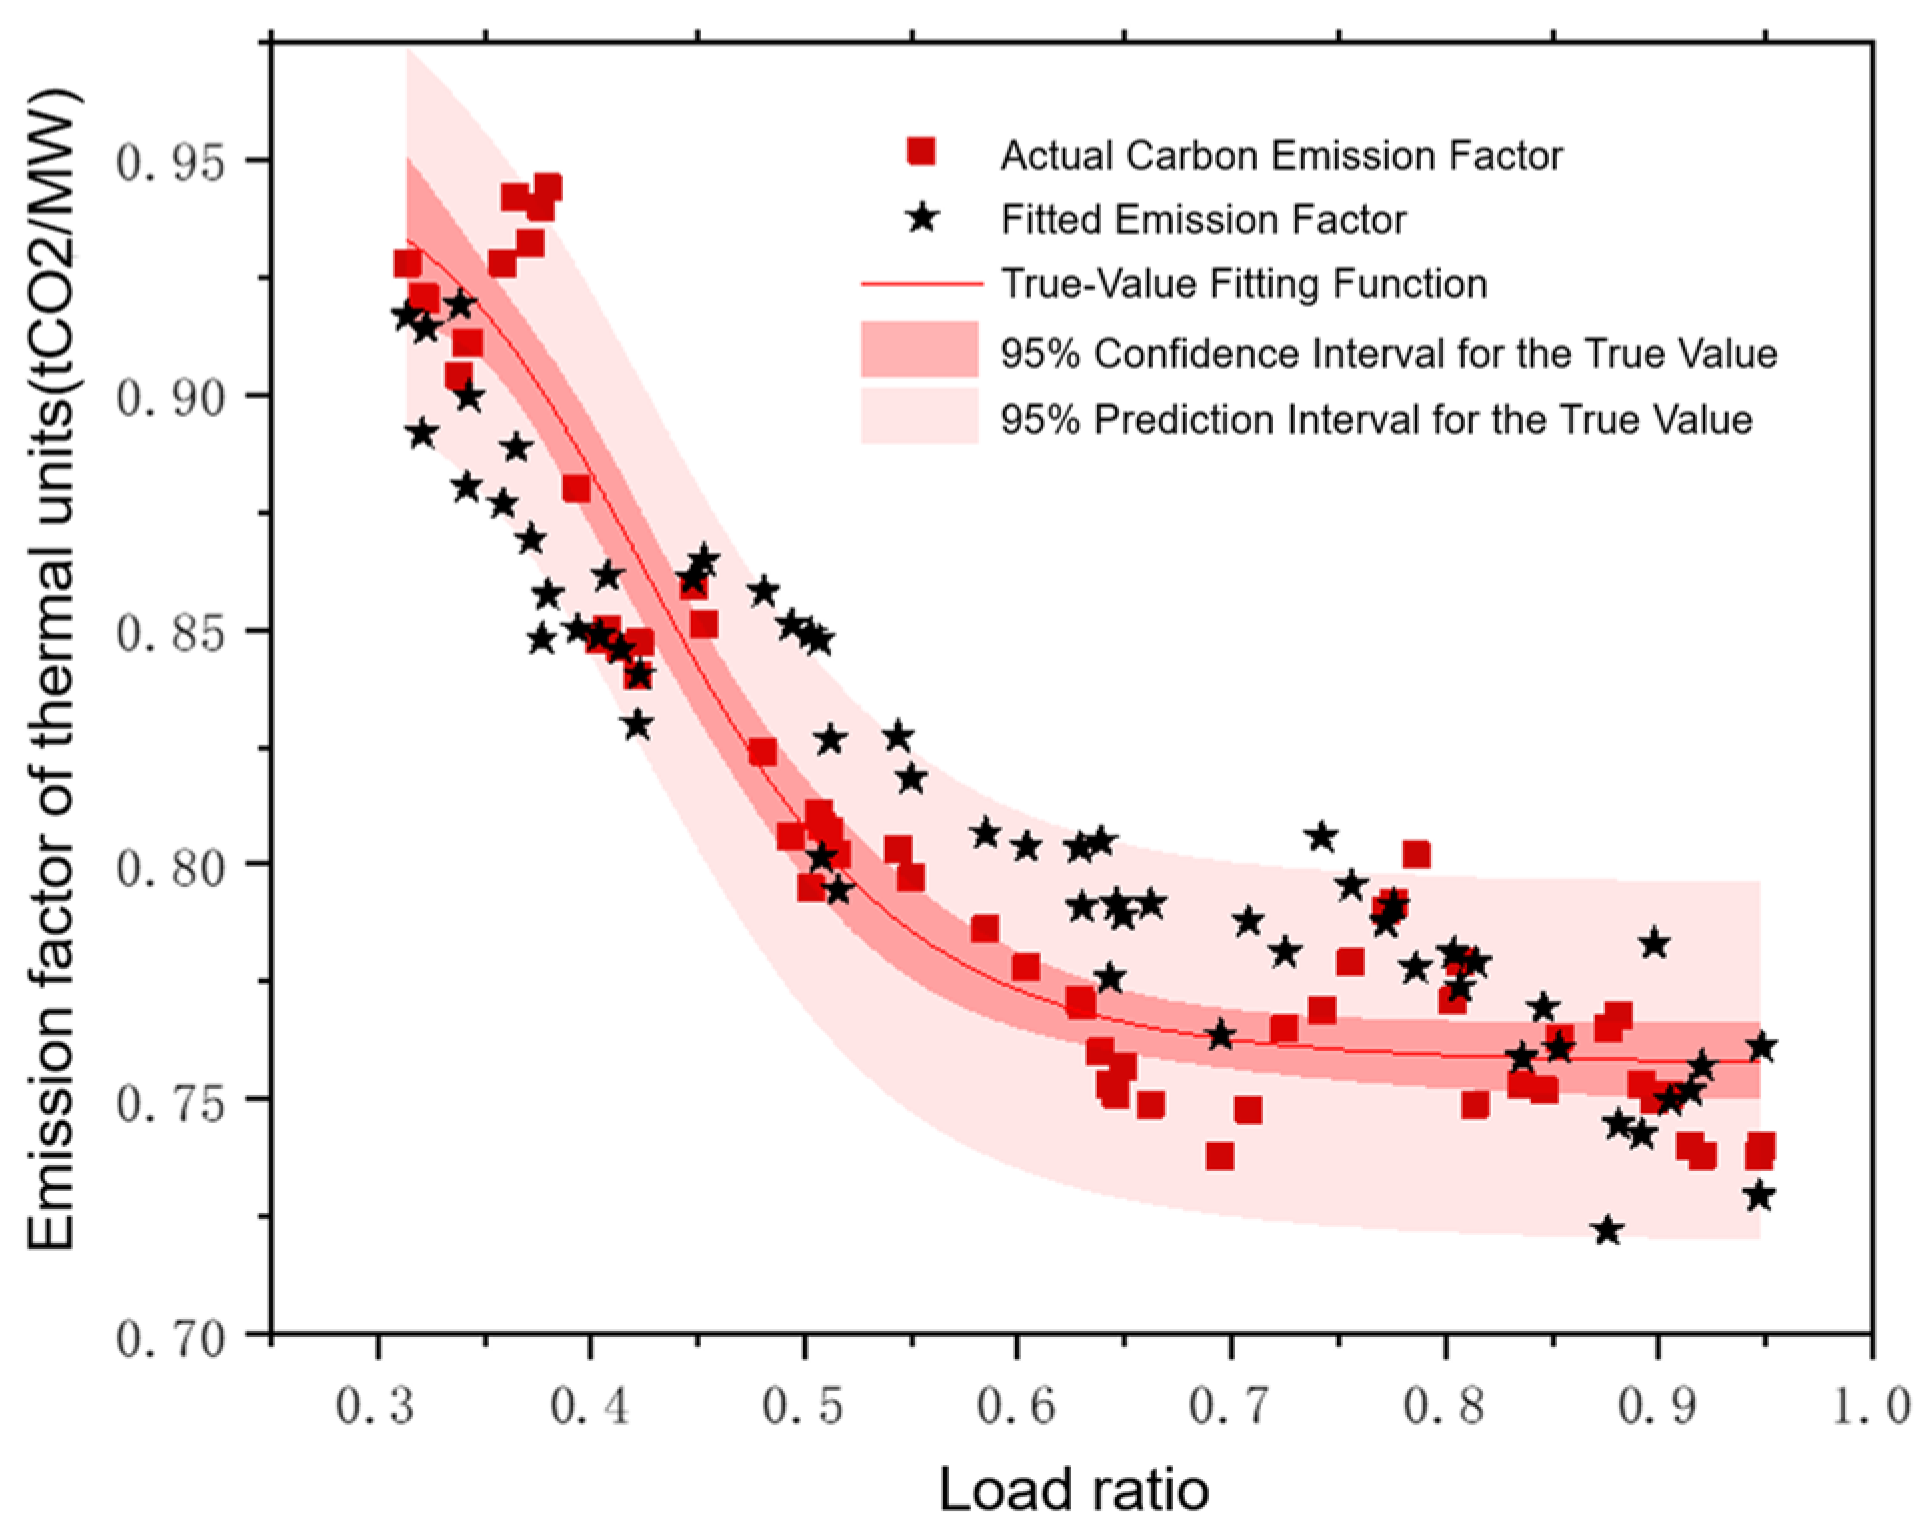
The effectiveness of the dynamic carbon emission factor model was first evaluated on the test set. Figure 5 compares the observed carbon emission factors with the corresponding model estimates. As shown, most of the estimated values fall within the 95% confidence intervals of the observed values, indicating that the proposed model can accurately capture variations in dynamic carbon emission factors. To further demonstrate its superiority, the proposed model was compared with several benchmark methods, including conventional machine-learning models and basic neural-network models. The comparative results are presented in Table 4. The proposed method significantly improves the accuracy of dynamic carbon emission factor estimation, achieving a root mean square error (RMSE) of 0.04 between the estimated and observed values. Moreover, it outperforms all benchmark models across the other evaluation metrics, thereby validating the accuracy and effectiveness of the proposed carbon emission factor estimation model for coal-fired power plants.
Figure 5.
Fitting results and actual carbon emission factor distribution map.
Table 4.
Comparison of the proposed dynamic carbon emission factor calculation model with other models.
Subsequently, to evaluate the effectiveness and rationality of the proposed market-clearing model for the coordinated operation of multiple types of generation units incorporating dynamic carbon emission factors, the following four scenarios were analyzed:
Scenario 1: Considering only the electricity market (using static carbon emission factors);
Scenario 2: Considering both the electricity market and the spot market (using static carbon emission factors);
Scenario 3: Considering both the electricity market and the frequency regulation ancillary service market (using dynamic carbon emission factors);
Scenario 4: Considering the electricity market, the spot market, and the frequency regulation ancillary service market simultaneously (using dynamic carbon emission factors).
Table 5 shows the system operation results under different scenarios. Scenario 1’s system dispatching results are significantly lower in terms of economic efficiency than other scenarios. This is because dispatching without considering the electricity market prioritizes safety and stable operation, resulting in insufficient utilization of flexible resources and significant power curtailment. In Scenario 2, with the introduction of the electricity market, energy storage actively responds to peak–valley pricing, improving renewable energy utilization through frequent charging and discharging. Scenario 3, considering the frequency regulation ancillary service market, aims for frequency stability and rapid response. New energy sources and energy storage further generate revenue by providing down-regulation capacity and regulation mileage. The introduction of dynamic carbon emission factors makes carbon cost accounting more accurate, guiding high-carbon units to optimize their output structure.
Table 5.
Comparison of typical daily operation results in various scenarios.
In Scenario 4, considering both the spot market and frequency regulation ancillary services, the system achieves the highest clean energy absorption rate while ensuring frequency stability. This represents a 2.01% increase in the typical daily absorption rate compared to the original Scenario 1 while also reducing the number of start-ups and shutdowns of thermal power units, lowering carbon emissions, and lowering the total cost by 1.51%. Scenario 2, compared to Scenario 3, shows a higher renewable energy absorption rate and higher total cost. This indicates that the spot market drives the energy storage charging and discharging process to absorb renewable energy from the system through price signals, while the frequency regulation market helps reduce system operating costs and improve system economics. Furthermore, the spot market provides intraday price signals, driving units and energy storage to optimize energy allocation over time, while frequency regulation services provide rapid adjustment capabilities down to the second to minute level, ensuring system stability under dynamic disturbances. When both operate in tandem, the system’s adjustment capabilities are guaranteed while improving energy-side operating efficiency, resulting in a smoother unit output and fuller utilization of the energy storage value, ultimately achieving optimal system safety and economic efficiency. The introduction of dynamic carbon emission factors makes the carbon emission calculations in scenarios 3 and 4 more realistic, avoids the underestimation of carbon costs of low-load units by static carbon emission factors, and guides the system to prioritize the use of low-carbon flexible resources.
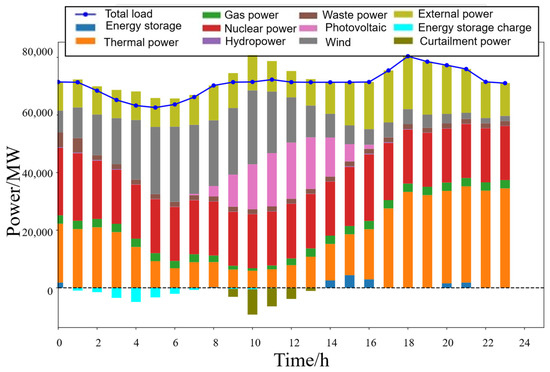
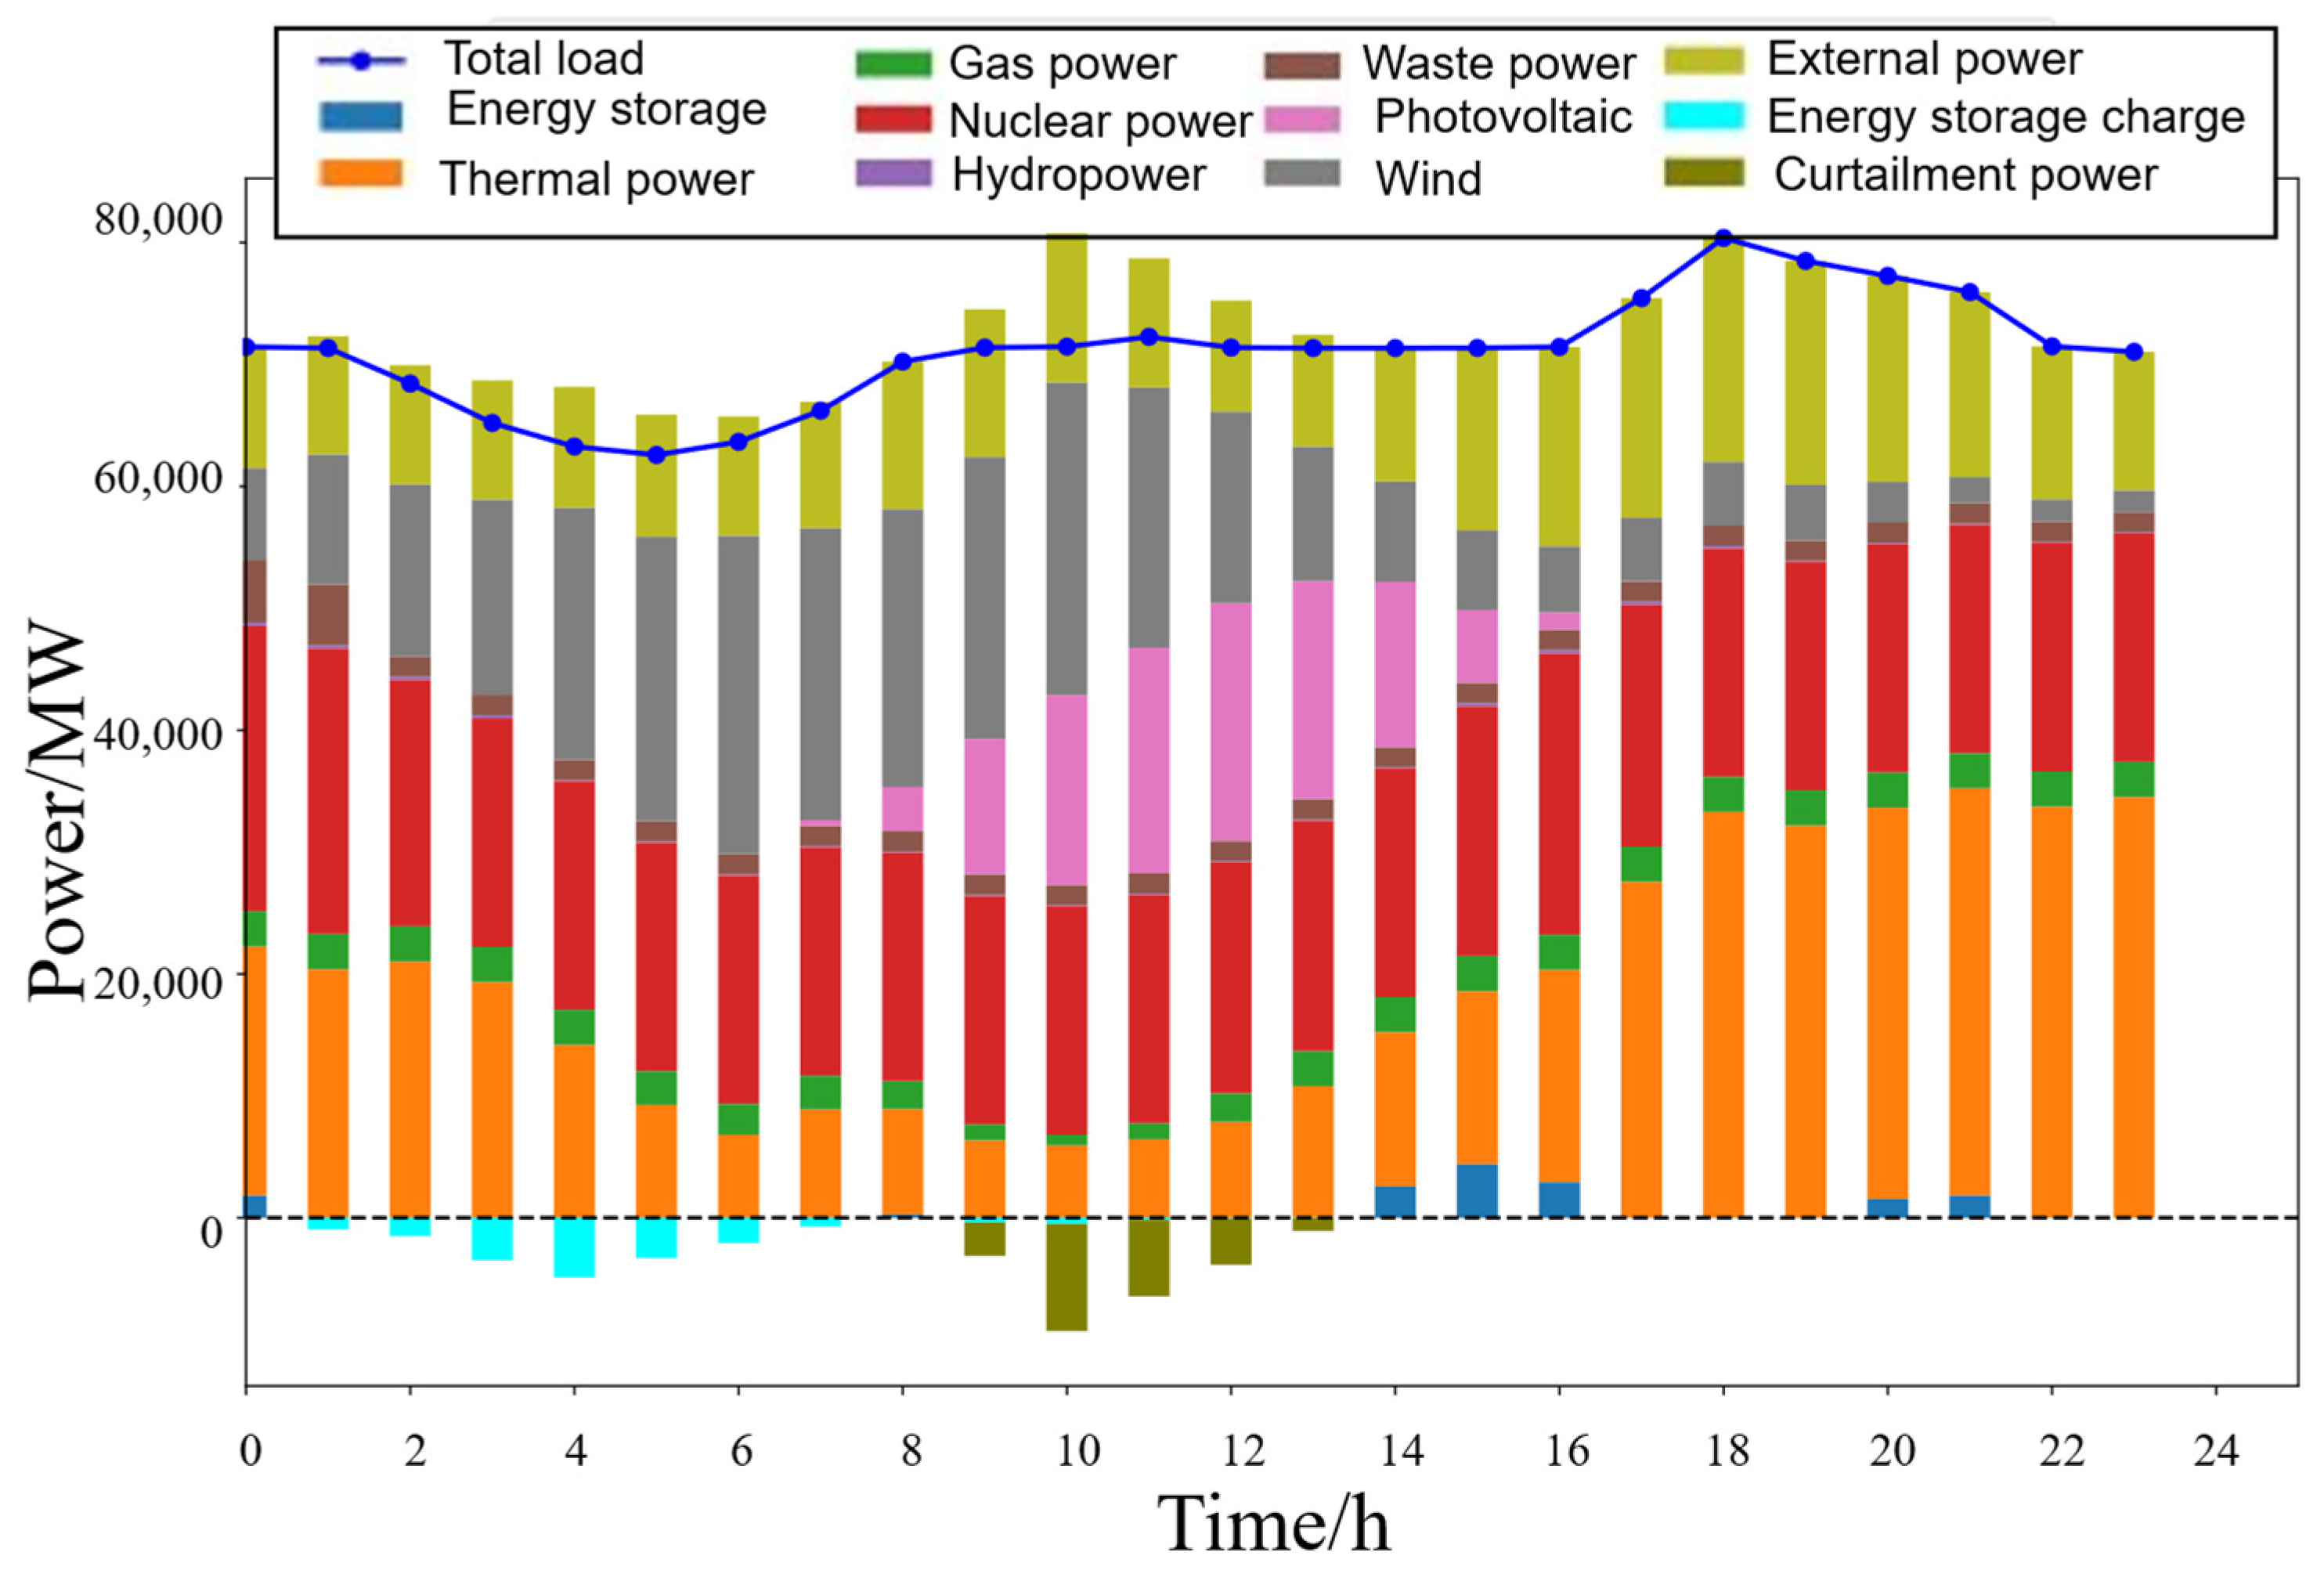
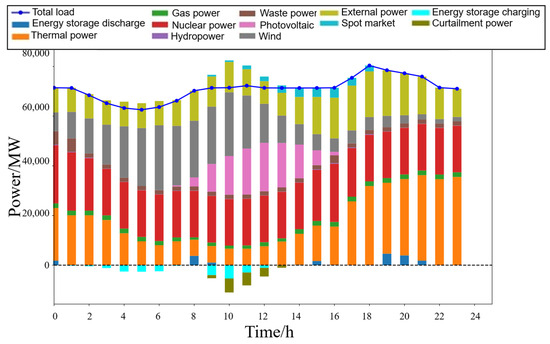
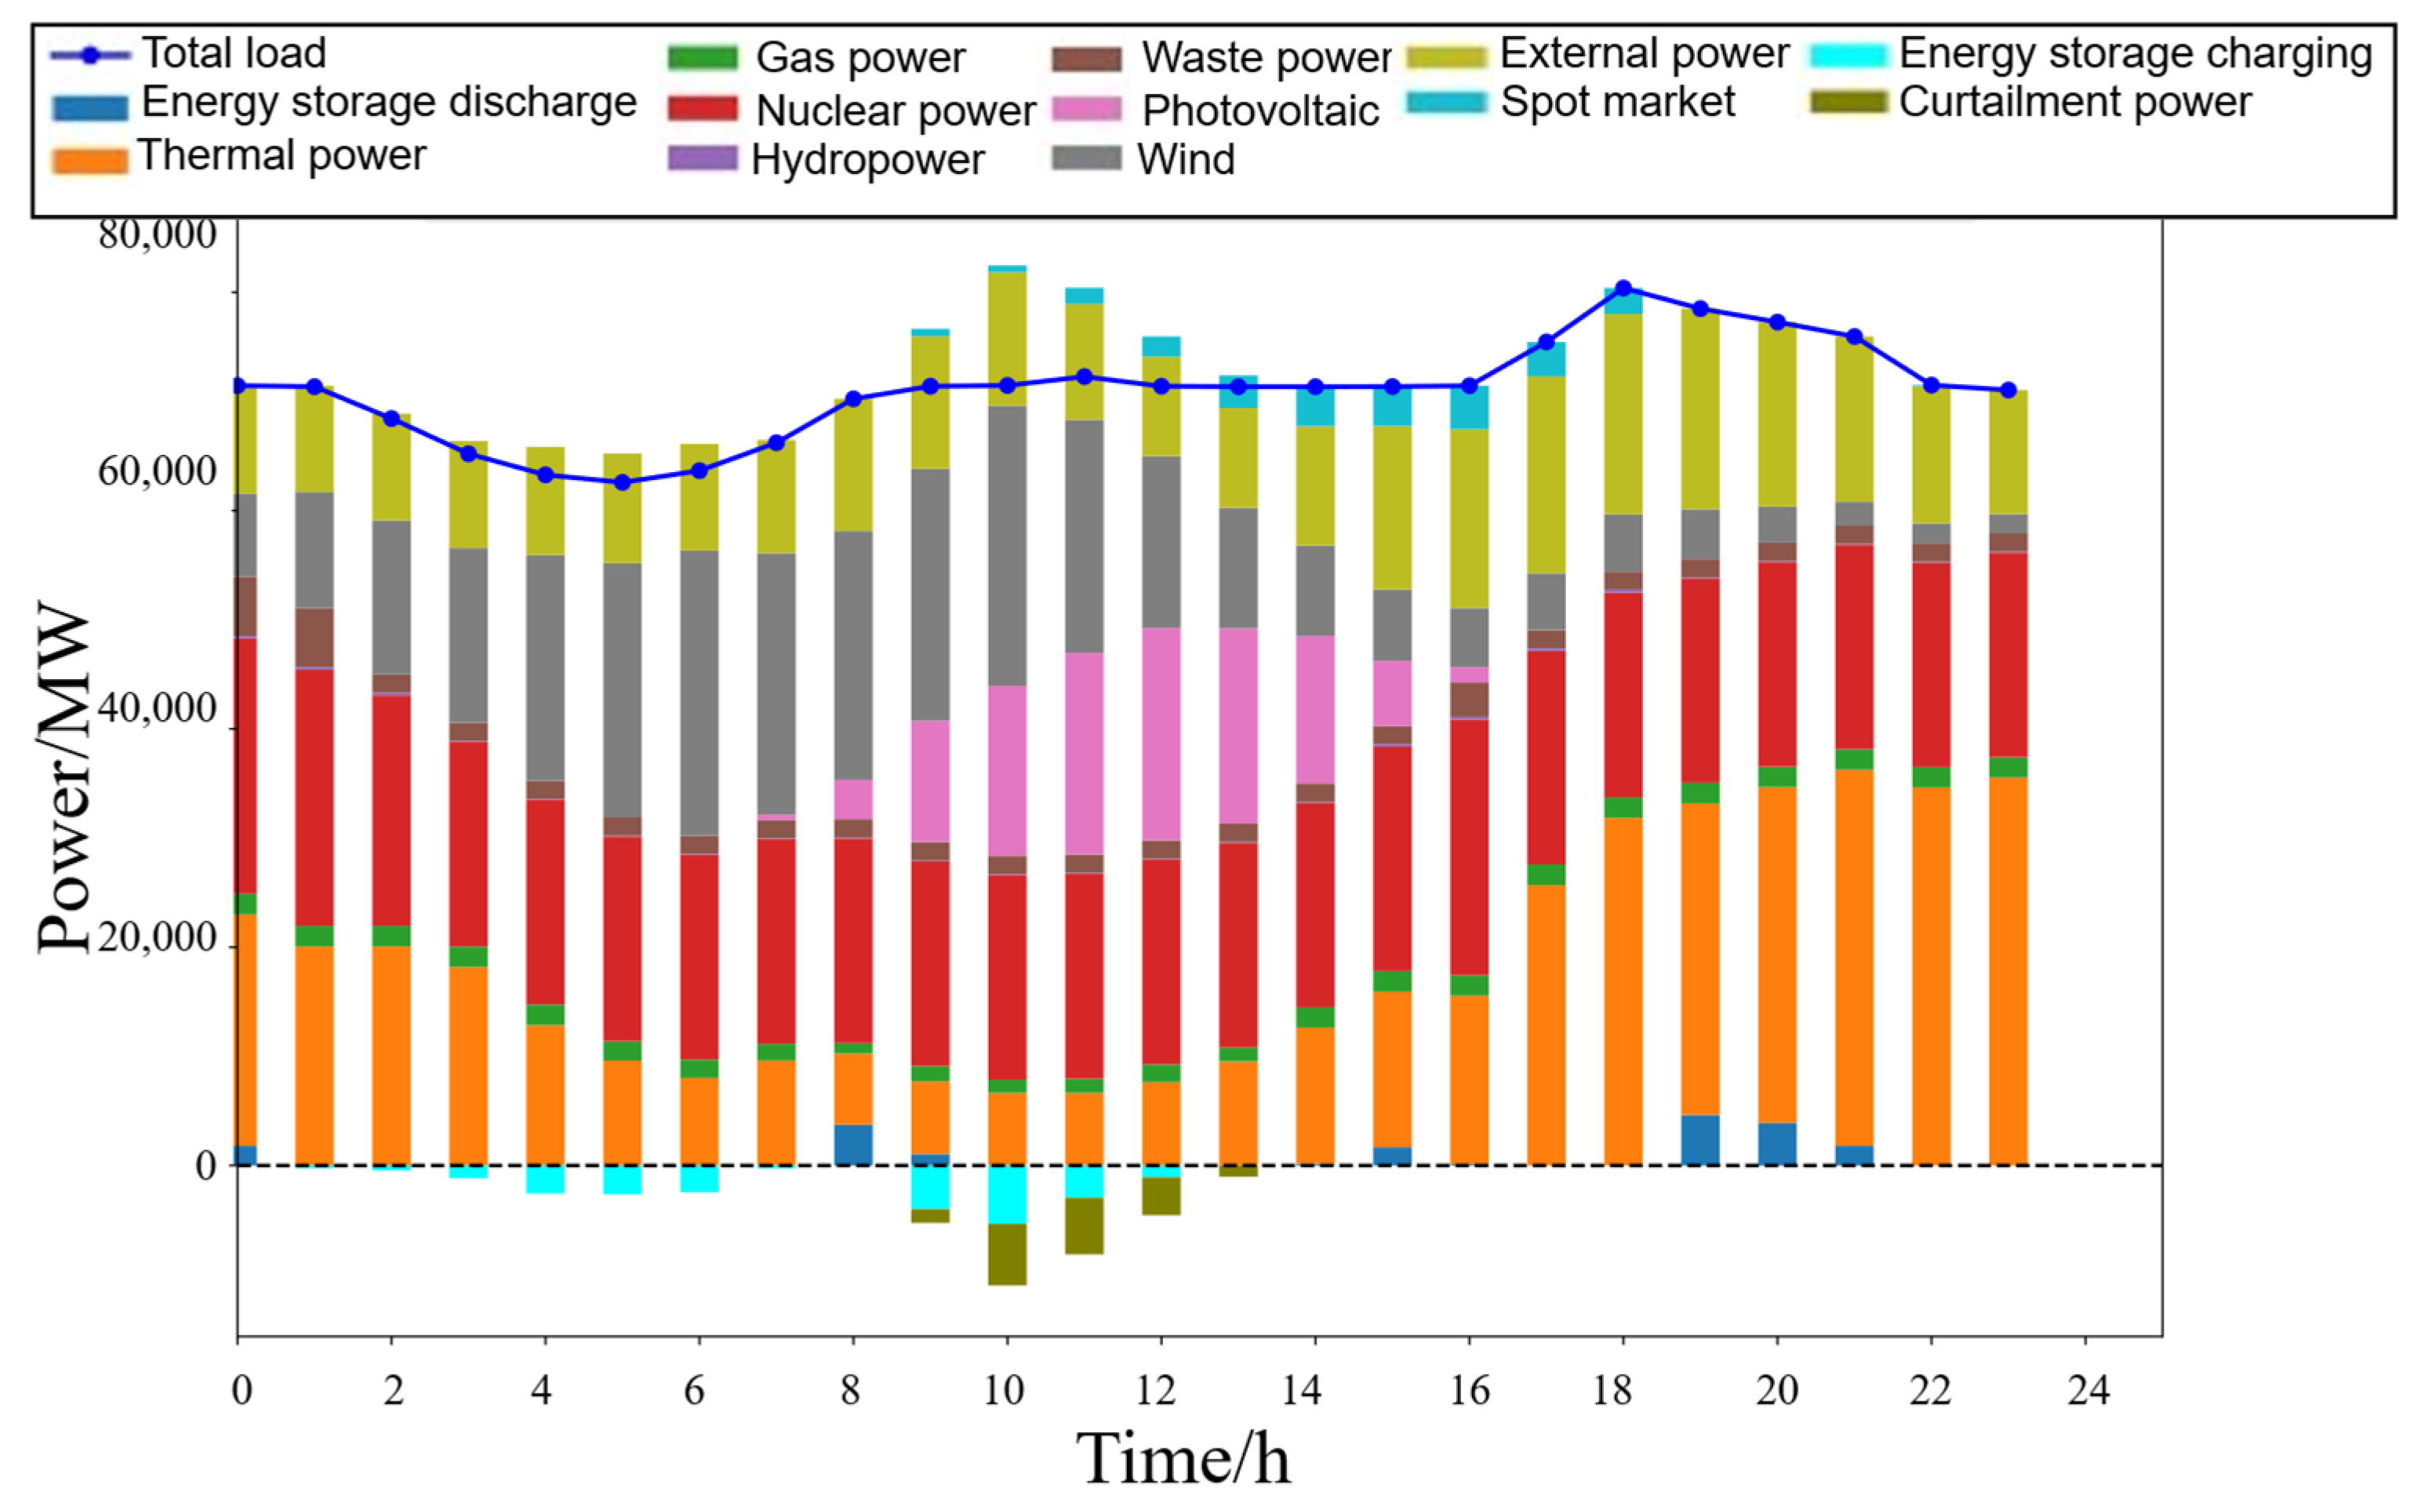
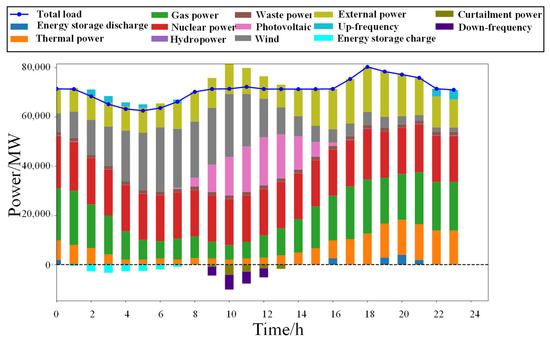
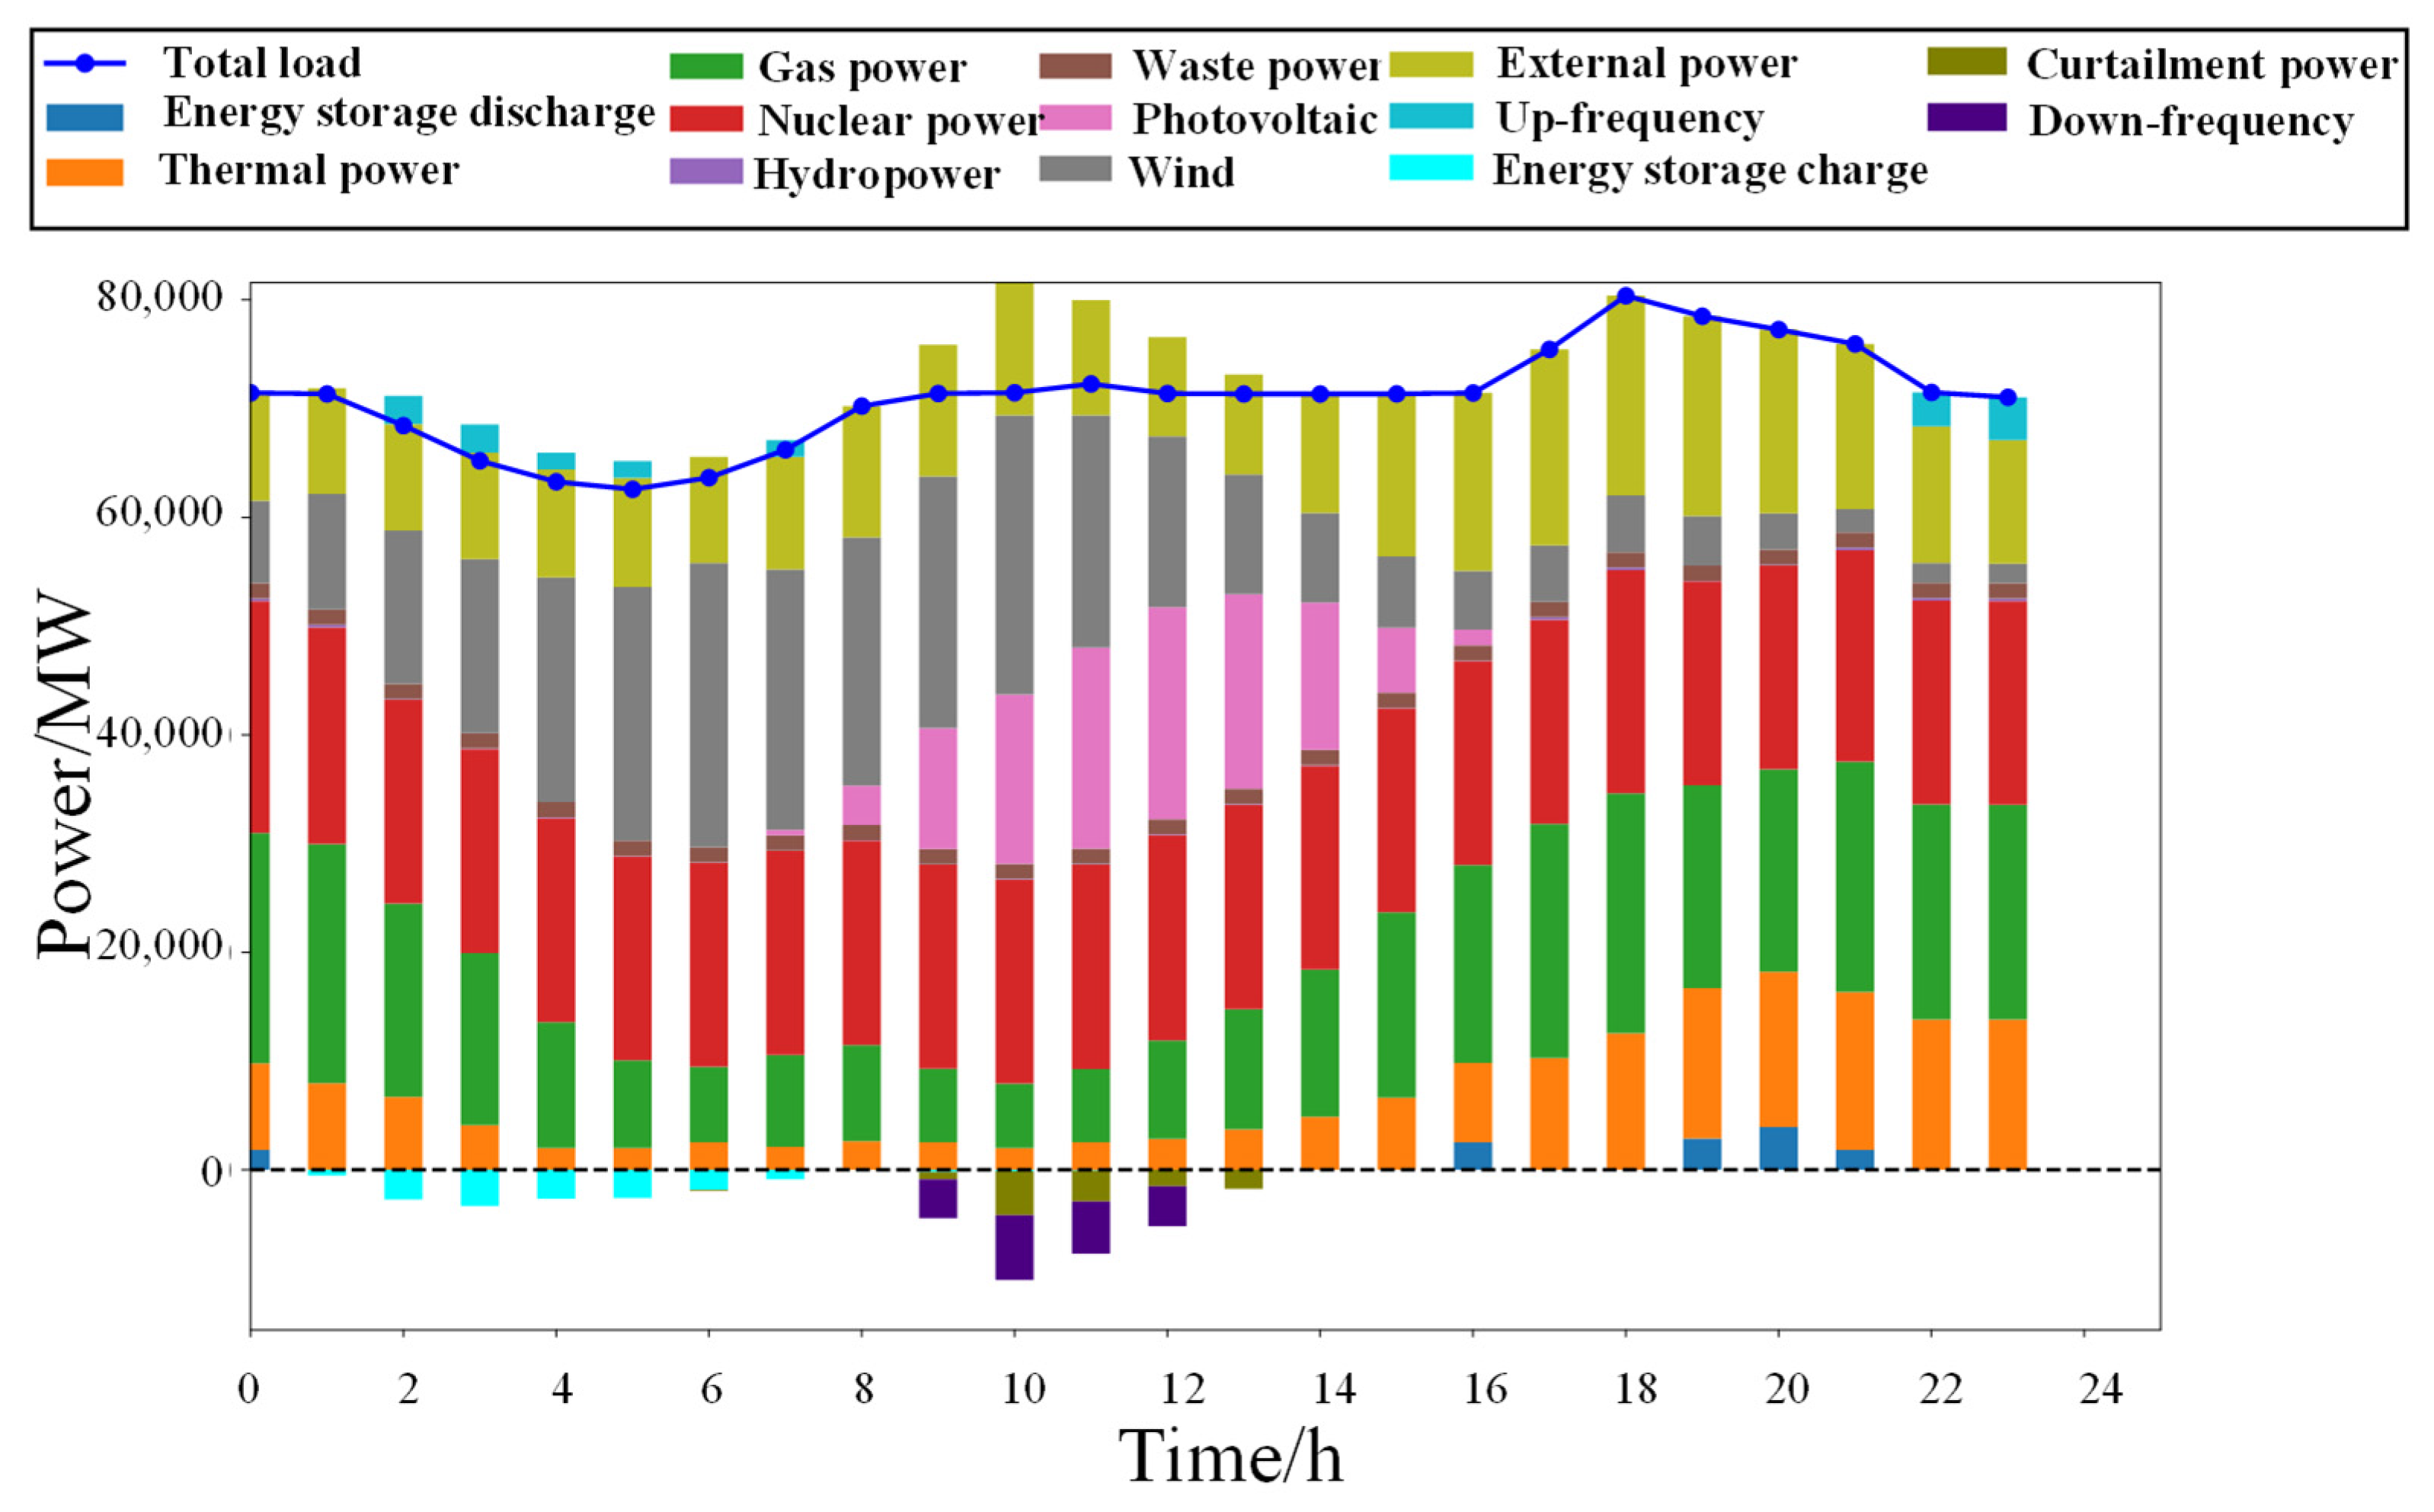
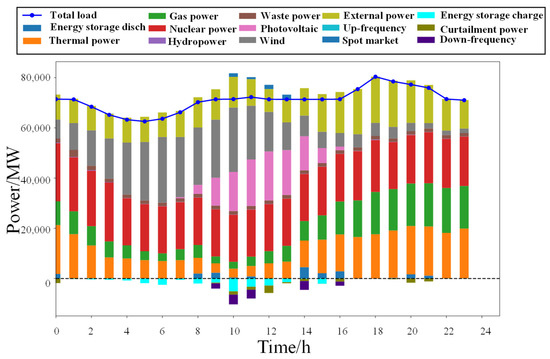
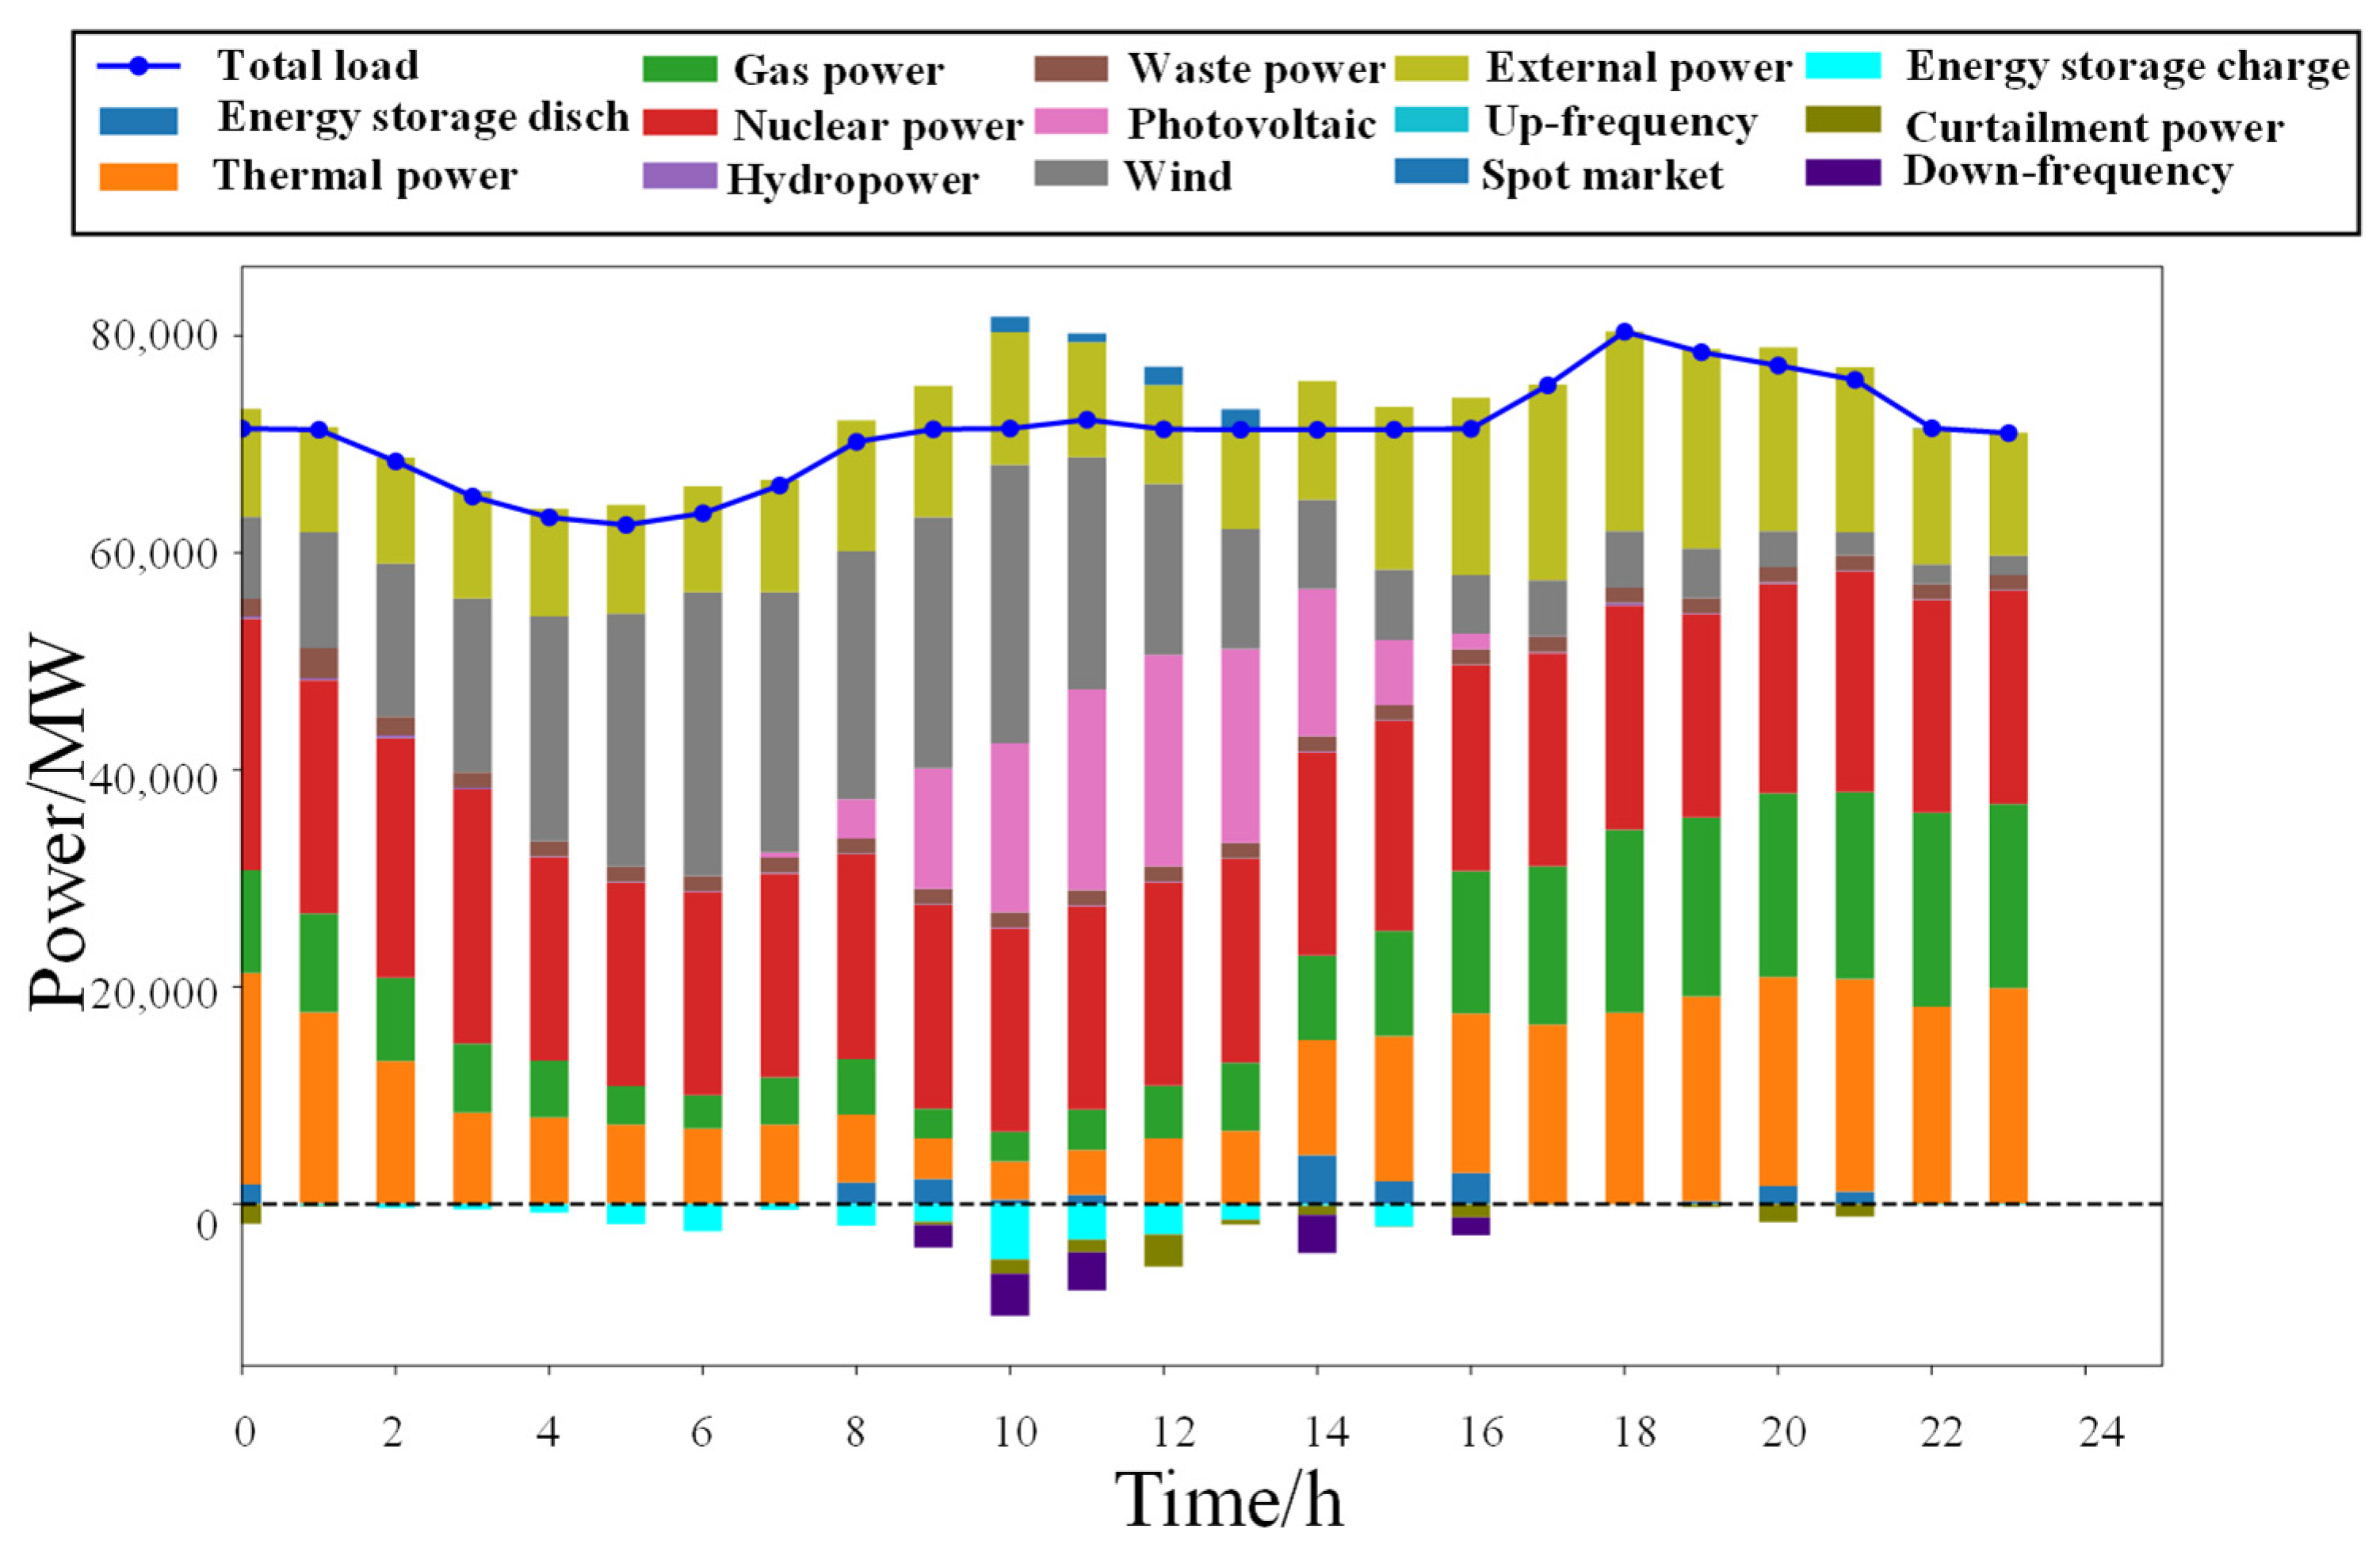
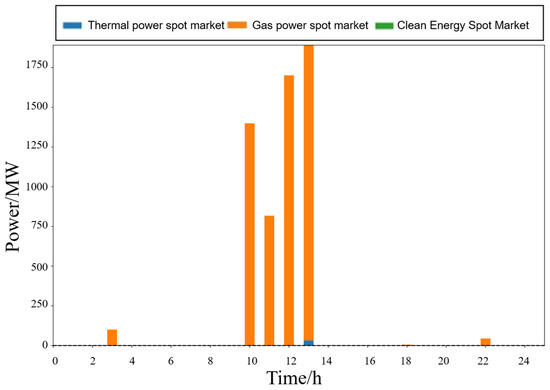
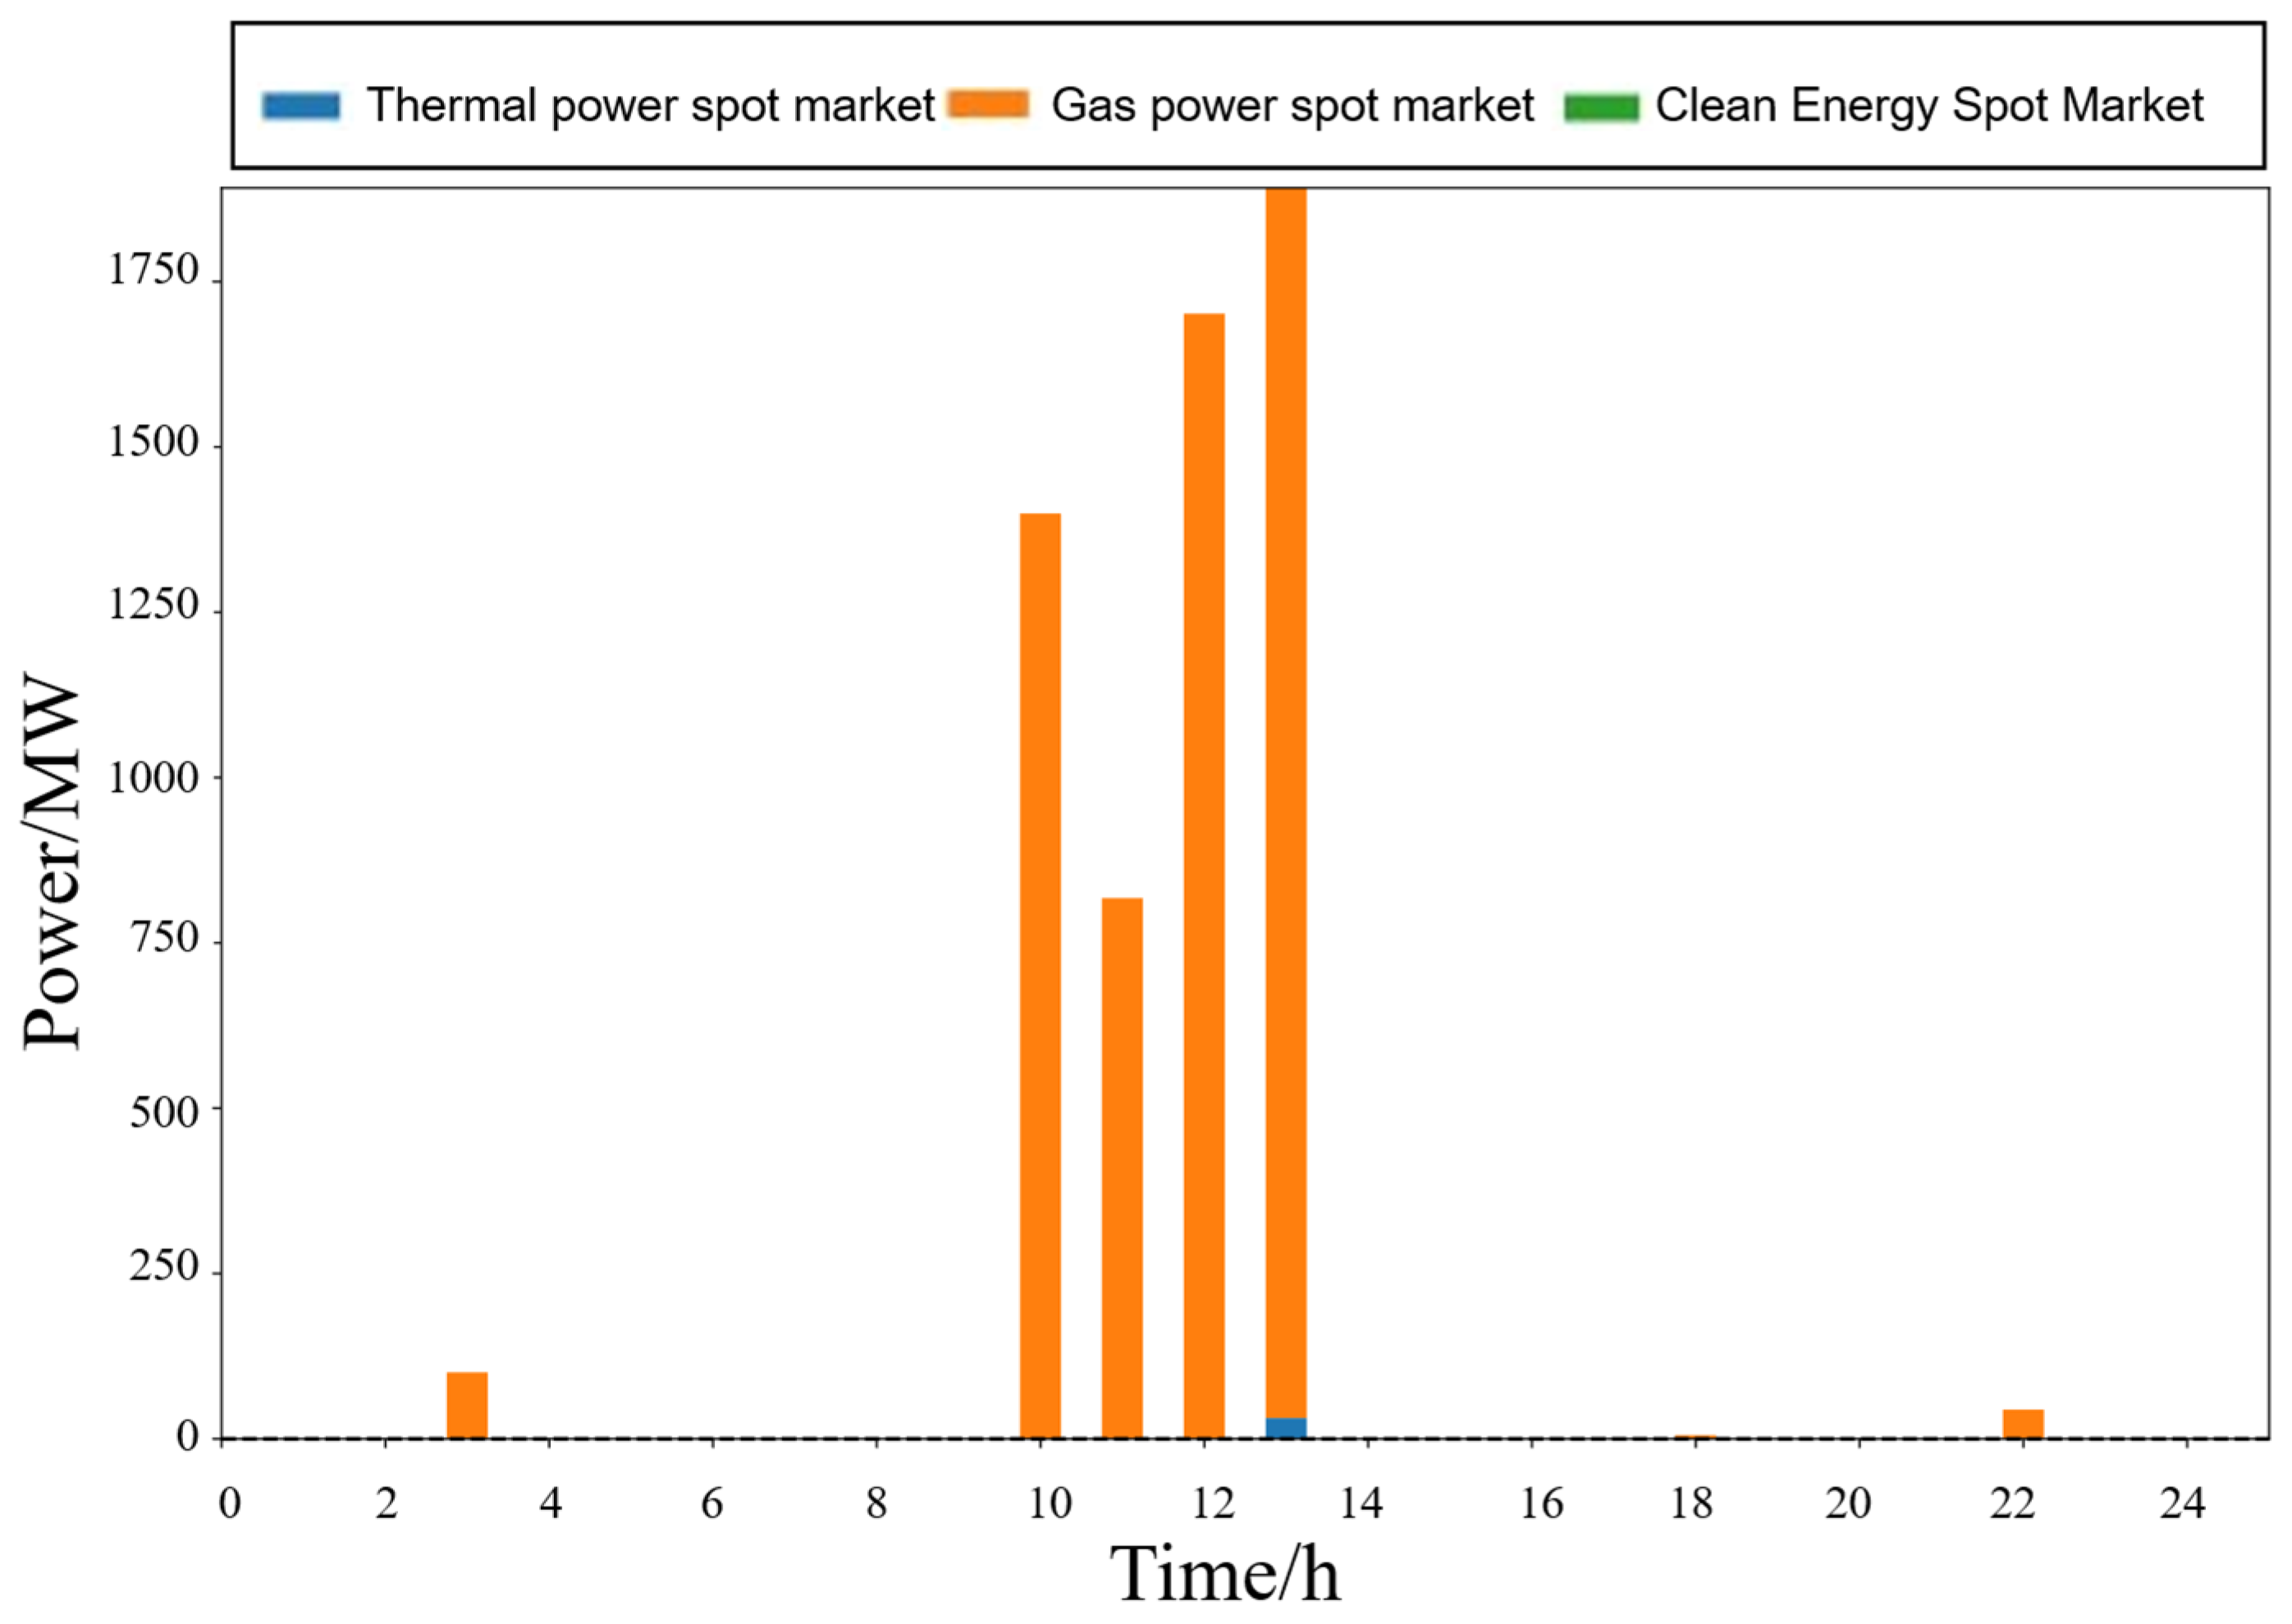
Figure 6, Figure 7, Figure 8 and Figure 9 show the system power balance under different scenarios. In Scenario 1, since no market influence is considered, coal-fired units achieve system power balance through frequent start–stop operations due to their lowest operating costs. Simultaneously, some energy storage is charged during the early morning when electricity prices are low and discharged during the high-price period, increasing energy storage revenue, but the impact on the system’s renewable energy absorption rate is relatively low. In Scenario 2, after the introduction of the spot market, coal-fired units, due to their higher proportion, partially participate in the spot market. Meanwhile, renewable energy units also participate in the spot market from 6 a.m. to 12 p.m., leading to a decrease in nodal electricity prices, further affecting the charging and discharging time of energy storage. It can be observed that in Scenario 2, energy storage charges during the high renewable energy curtailment period from 10 a.m. to 12 p.m. and discharges during the high renewable energy curtailment period from 5 p.m. to 9 p.m., improving the system absorption rate and energy storage revenue. In Scenario 3, considering only the frequency regulation market, coal-fired units have a slow frequency regulation response and low ramp-up rates, while gas-fired units start quickly, adjust flexibly, and respond rapidly to frequency fluctuations. Therefore, the system increases the starting power of gas-fired units and reduces system curtailment by down-regulating the frequency during periods of high curtailment. Scenario 4 introduces two types of markets simultaneously. The power of the corresponding spot market and frequency regulation ancillary service market is shown in Figure 10 and Figure 11. Under the dual constraints of operating costs and renewable energy absorption rate, coal-fired and gas-fired units maintain large-scale power generation and participate in frequency regulation. Energy storage optimizes the response under the dual signals of price and frequency regulation. The dynamic carbon emission factor guides high-carbon coal-fired power units to avoid low-load operation so that the system achieves overall optimization between cost and absorption.
Figure 6.
Scenario 1 System Power Balance Diagram.
Figure 7.
Scenario 2 System Power Balance Diagram.
Figure 8.
Scenario 3 System Power Balance Diagram.
Figure 9.
Scenario 4 System Power Balance Diagram.
Figure 10.
Scenario 4 Typical Daily Spot Market Power Chart.
Figure 11.
Scenario 4 Typical Daily FM Power Diagram.
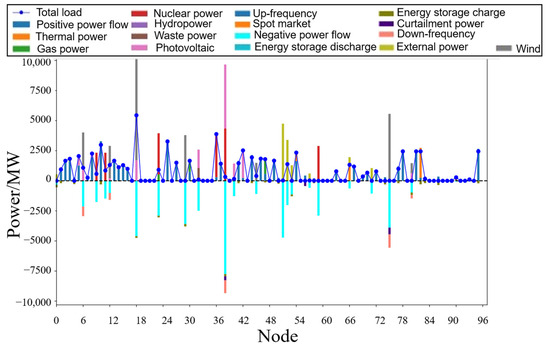
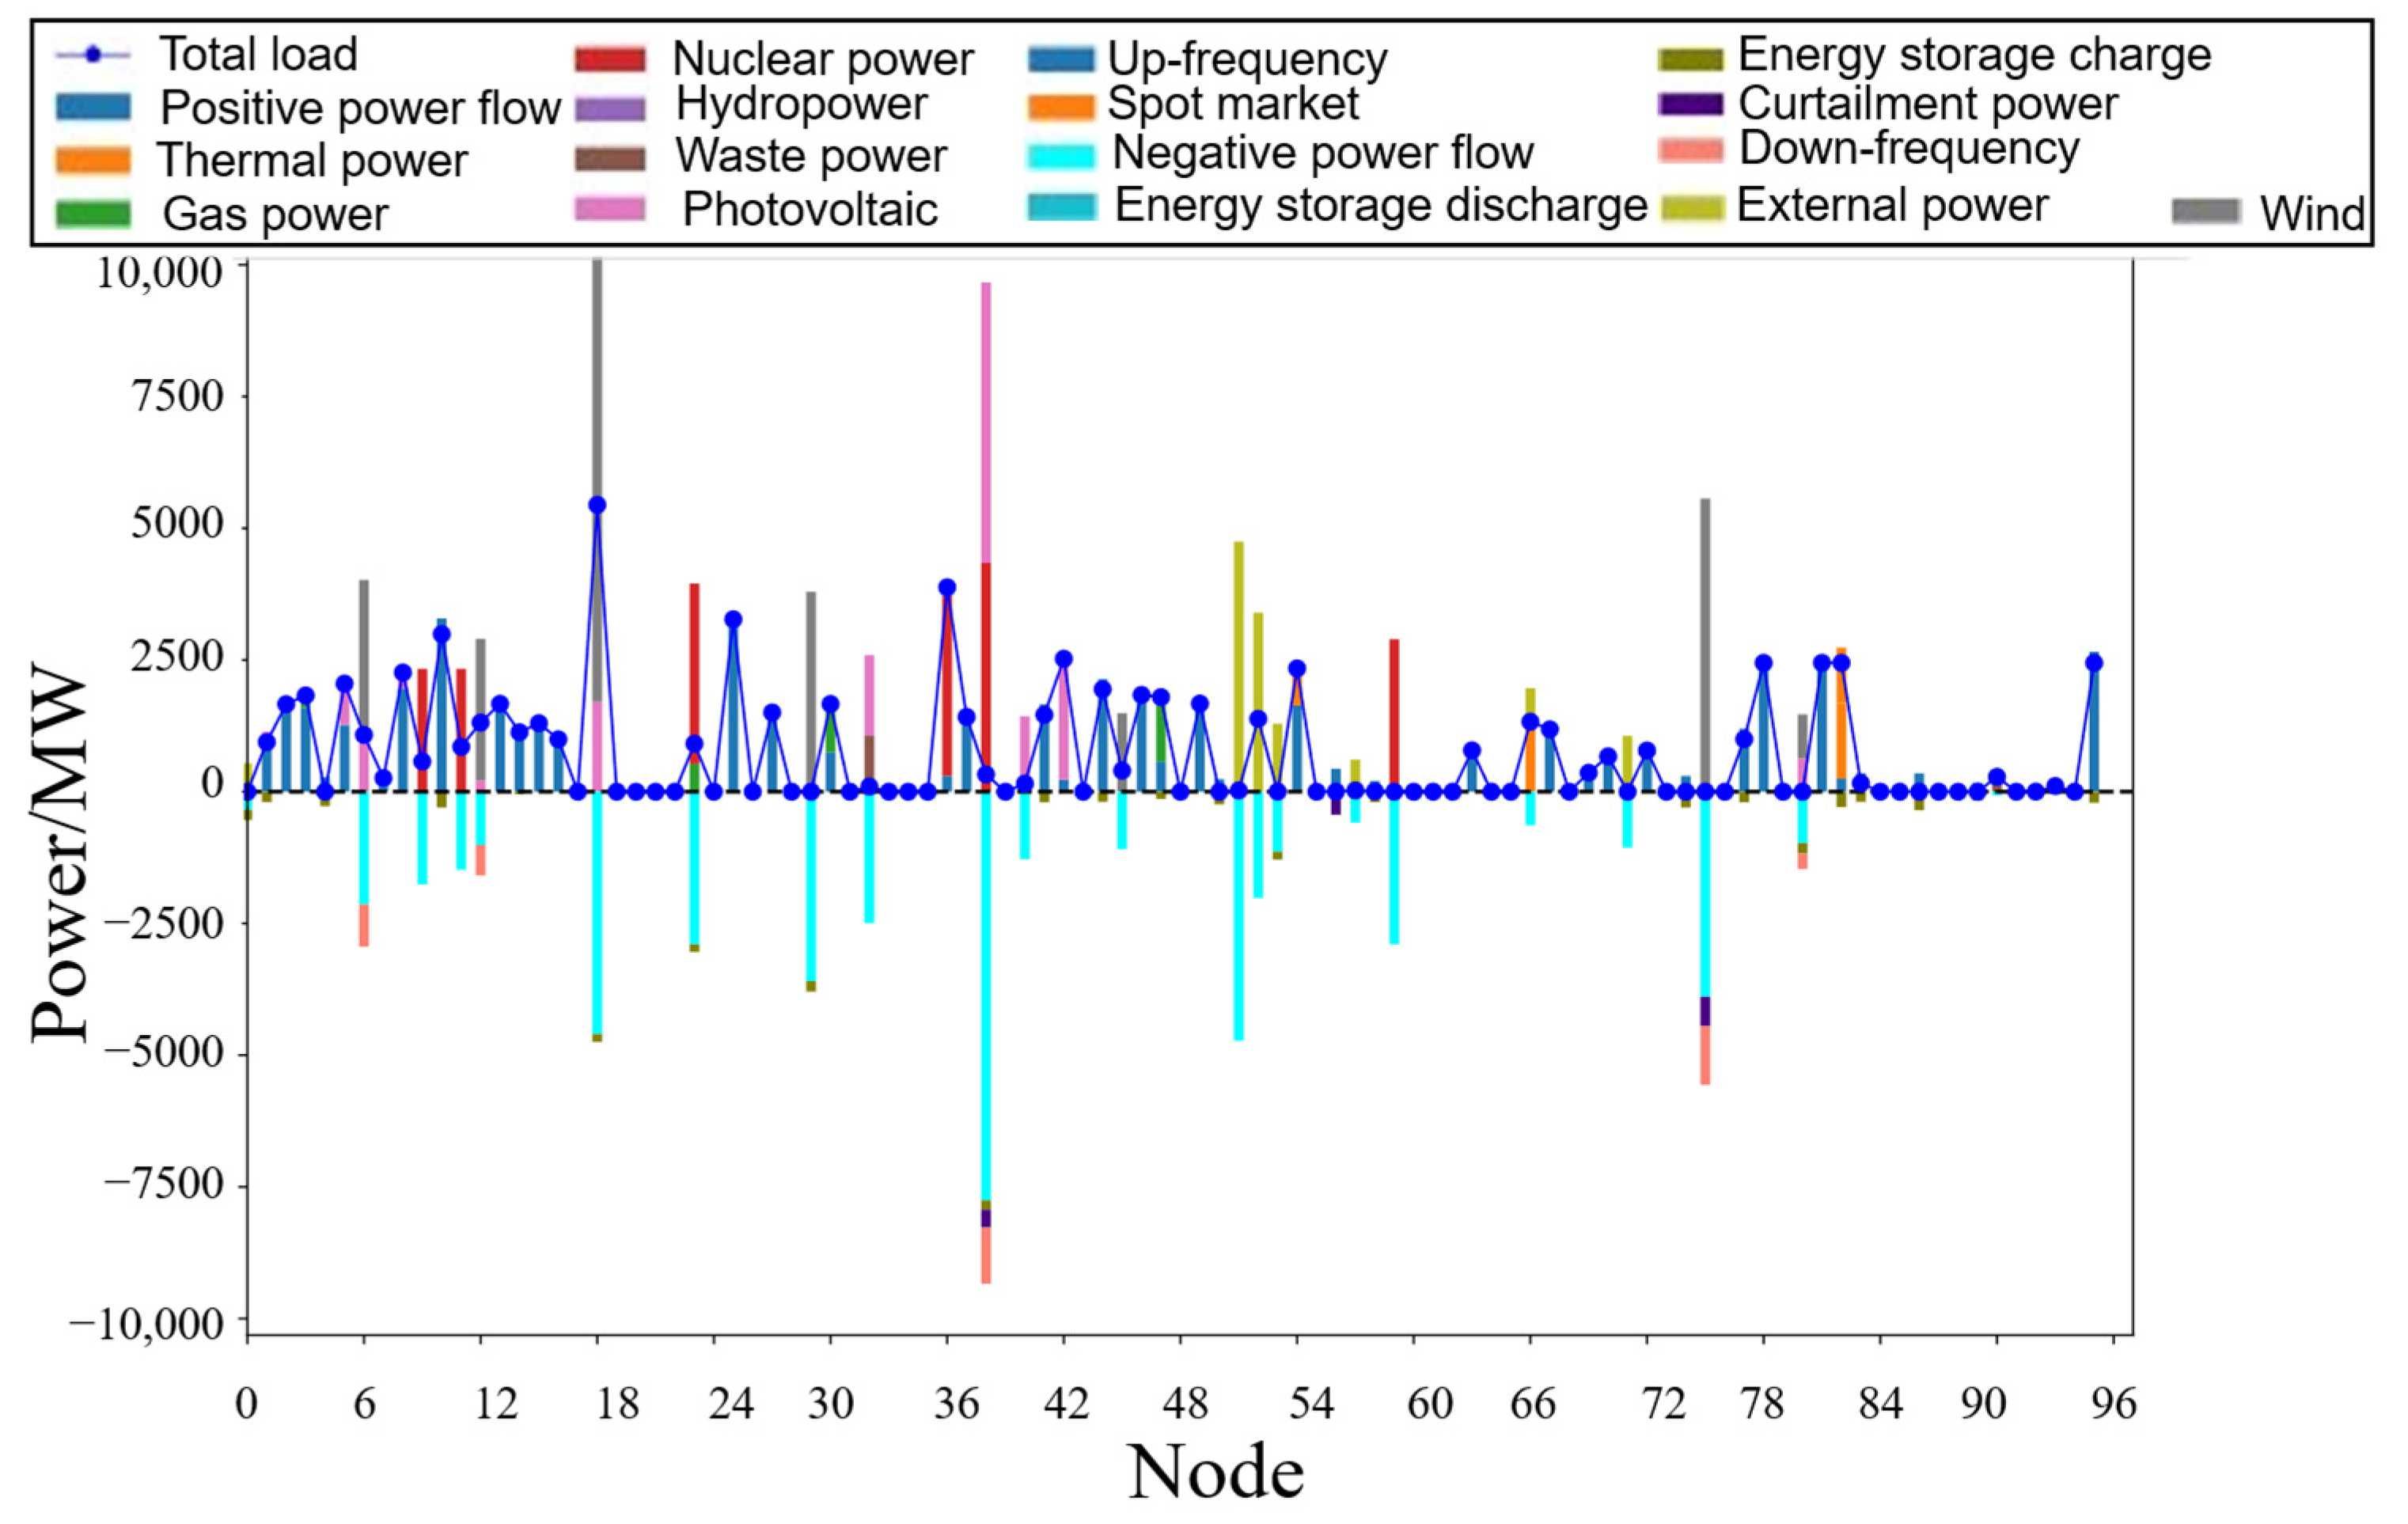
In Scenario 4, both the spot market and the ancillary services market participated at 11:00 a.m. The specific node power balance is shown in Figure 12. It can be seen that while some nodes are adjusting their frequencies due to the large generation of clean energy, some nodes are also conducting spot trading. However, the relevant markets are mostly composed of clean energy units. The dynamic carbon emission factor guides the priority clearing of low-carbon power sources, and the output of high-carbon node units is suppressed.
Figure 12.
Power balance diagram at 11:00 on a typical day in Scenario 4.
3.4. Analysis of the Impact of Market Clearing Strategies on Spatiotemporal Carbon Emission Factor
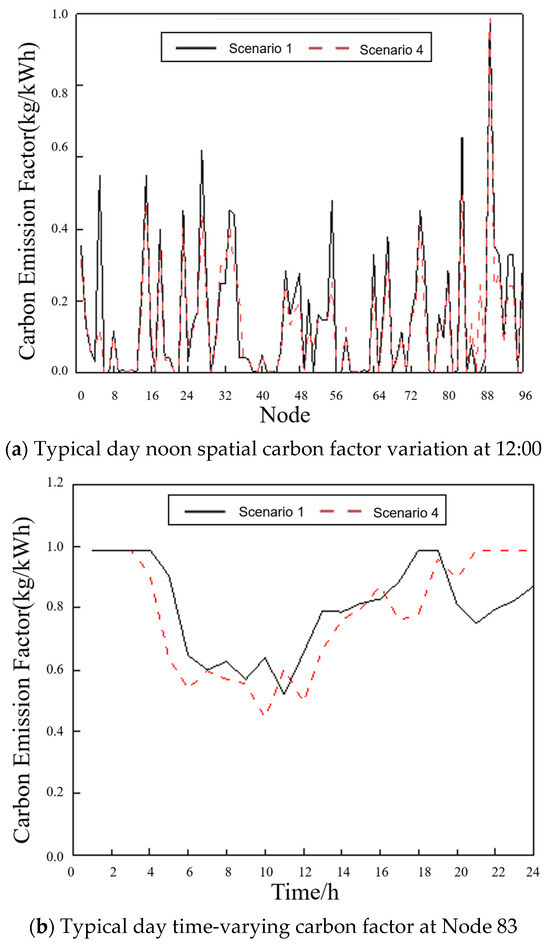
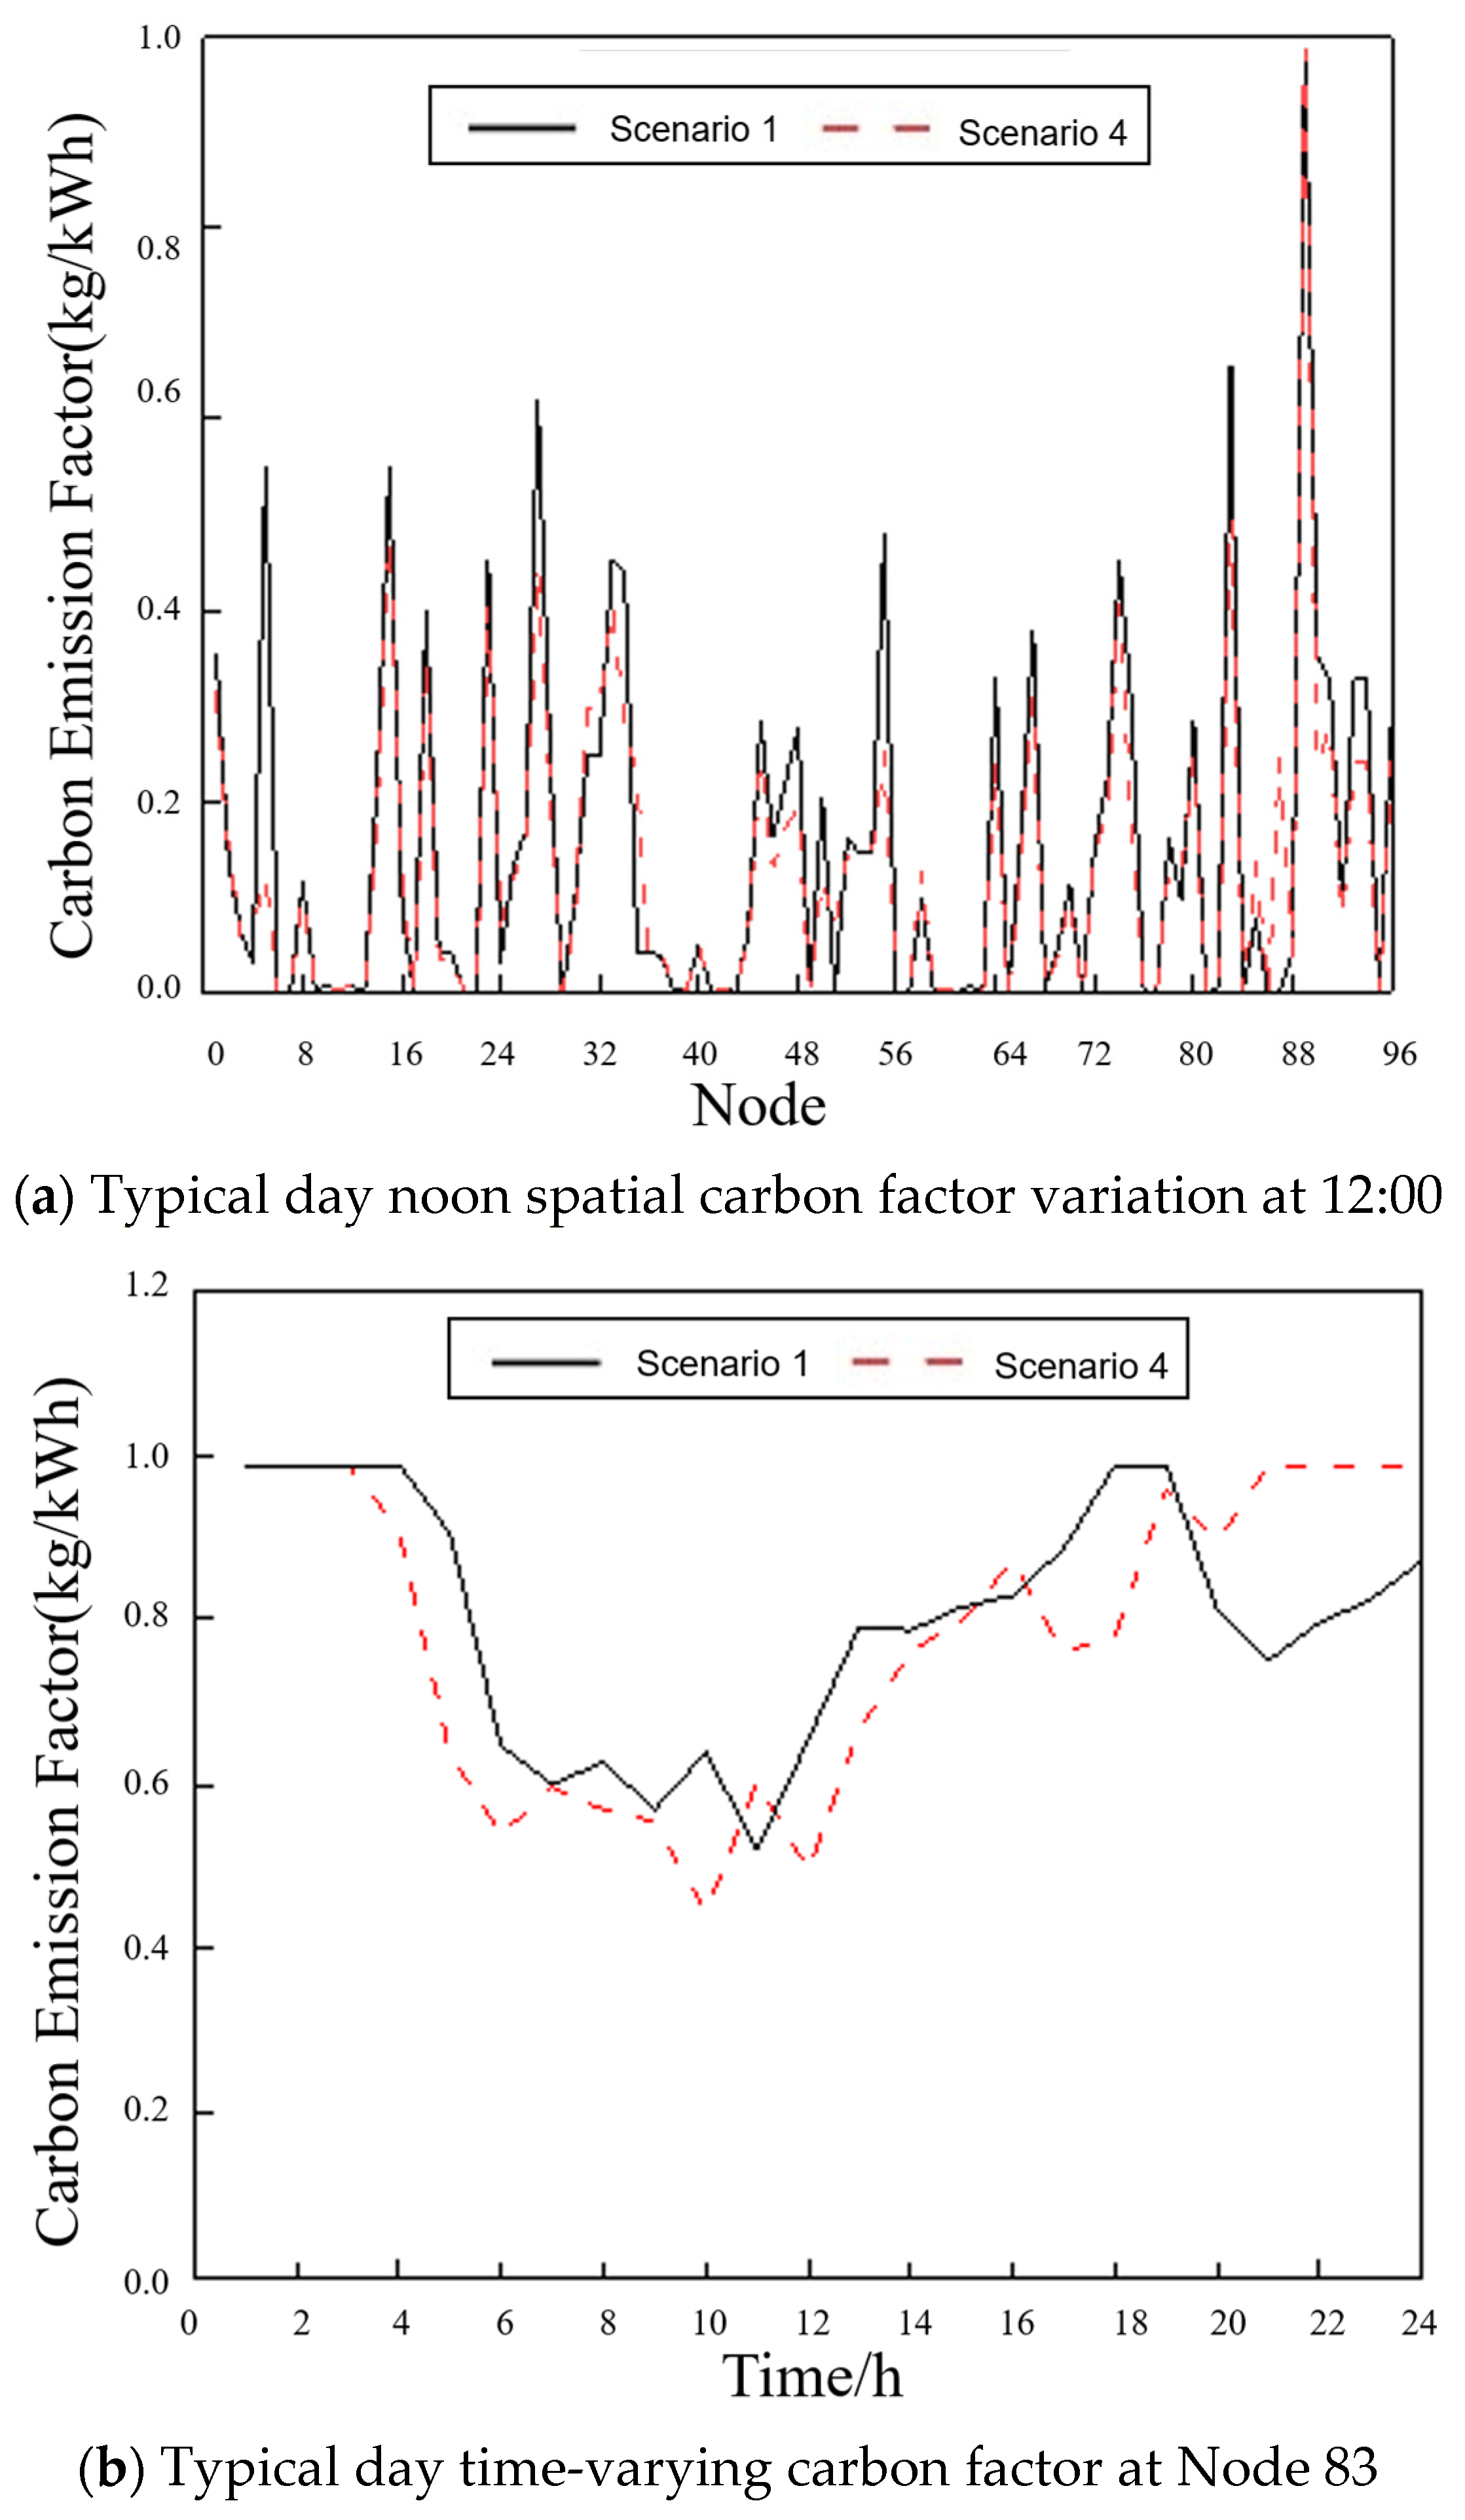
To quantitatively assess the impact of the market clearing strategy on the system’s carbon emission factor, nodes at 12:00 noon and Node 83, with the highest emission levels, were selected as typical representatives to characterize the changes in the carbon emission factor under different scenarios from both spatial and temporal dimensions. Comparative line graphs are shown in Figure 13.
Figure 13.
The impact of typical daily market clearing strategies on spatiotemporal electrocarbon factor.
Figure 13a shows the spatial carbon emission factor changes of the system. As can be seen in the figure, the carbon emission factor in Scenario 4 is significantly lower than that in Scenario 1, indicating that the spatial carbon emission intensity of the system is effectively suppressed after the introduction of the market clearing mechanism. Especially at high-emission nodes, market clearing optimizes the output structure of various types of units, guiding low-carbon power sources to prioritize grid connection, resulting in the most significant decrease in the carbon emission factor, with a maximum decrease of 18.3%. Overall, the carbon emission factor in Scenario 1 is consistently higher than that in Scenario 4 at all nodes, reflecting that the system operation is more dependent on high-carbon units when market clearing constraints are lacking.
Figure 13b shows the trend of the carbon emission factor at Node 83 at different times on a typical day. As can be seen, the carbon factor for electricity in Scenario 4 remains lower than that in Scenario 1 for most periods, indicating that market clearing also has an emission reduction effect on a time scale.
In summary, the market clearing strategy significantly reduces the system’s carbon factor overall, with its emission reduction effect being more pronounced in the spatial dimension. However, in the temporal dimension, short-term fluctuations in the carbon factor are significantly affected by the timing characteristics of new energy output, and there are still instances of localized carbon emission rebounds. This suggests that future research should further integrate new energy forecasting with flexible resource allocation to enhance the low-carbon stability of the market clearing mechanism in the temporal dimension.
3.5. Frequency Modulation Result Analysis
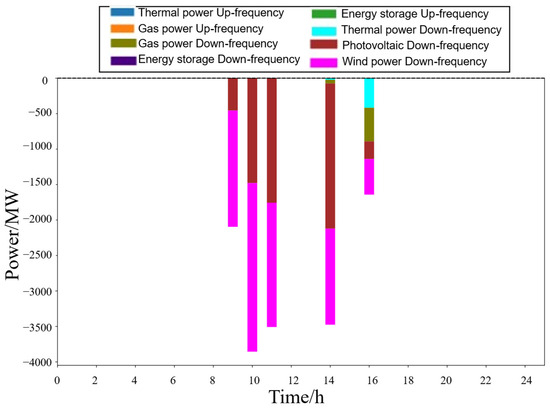
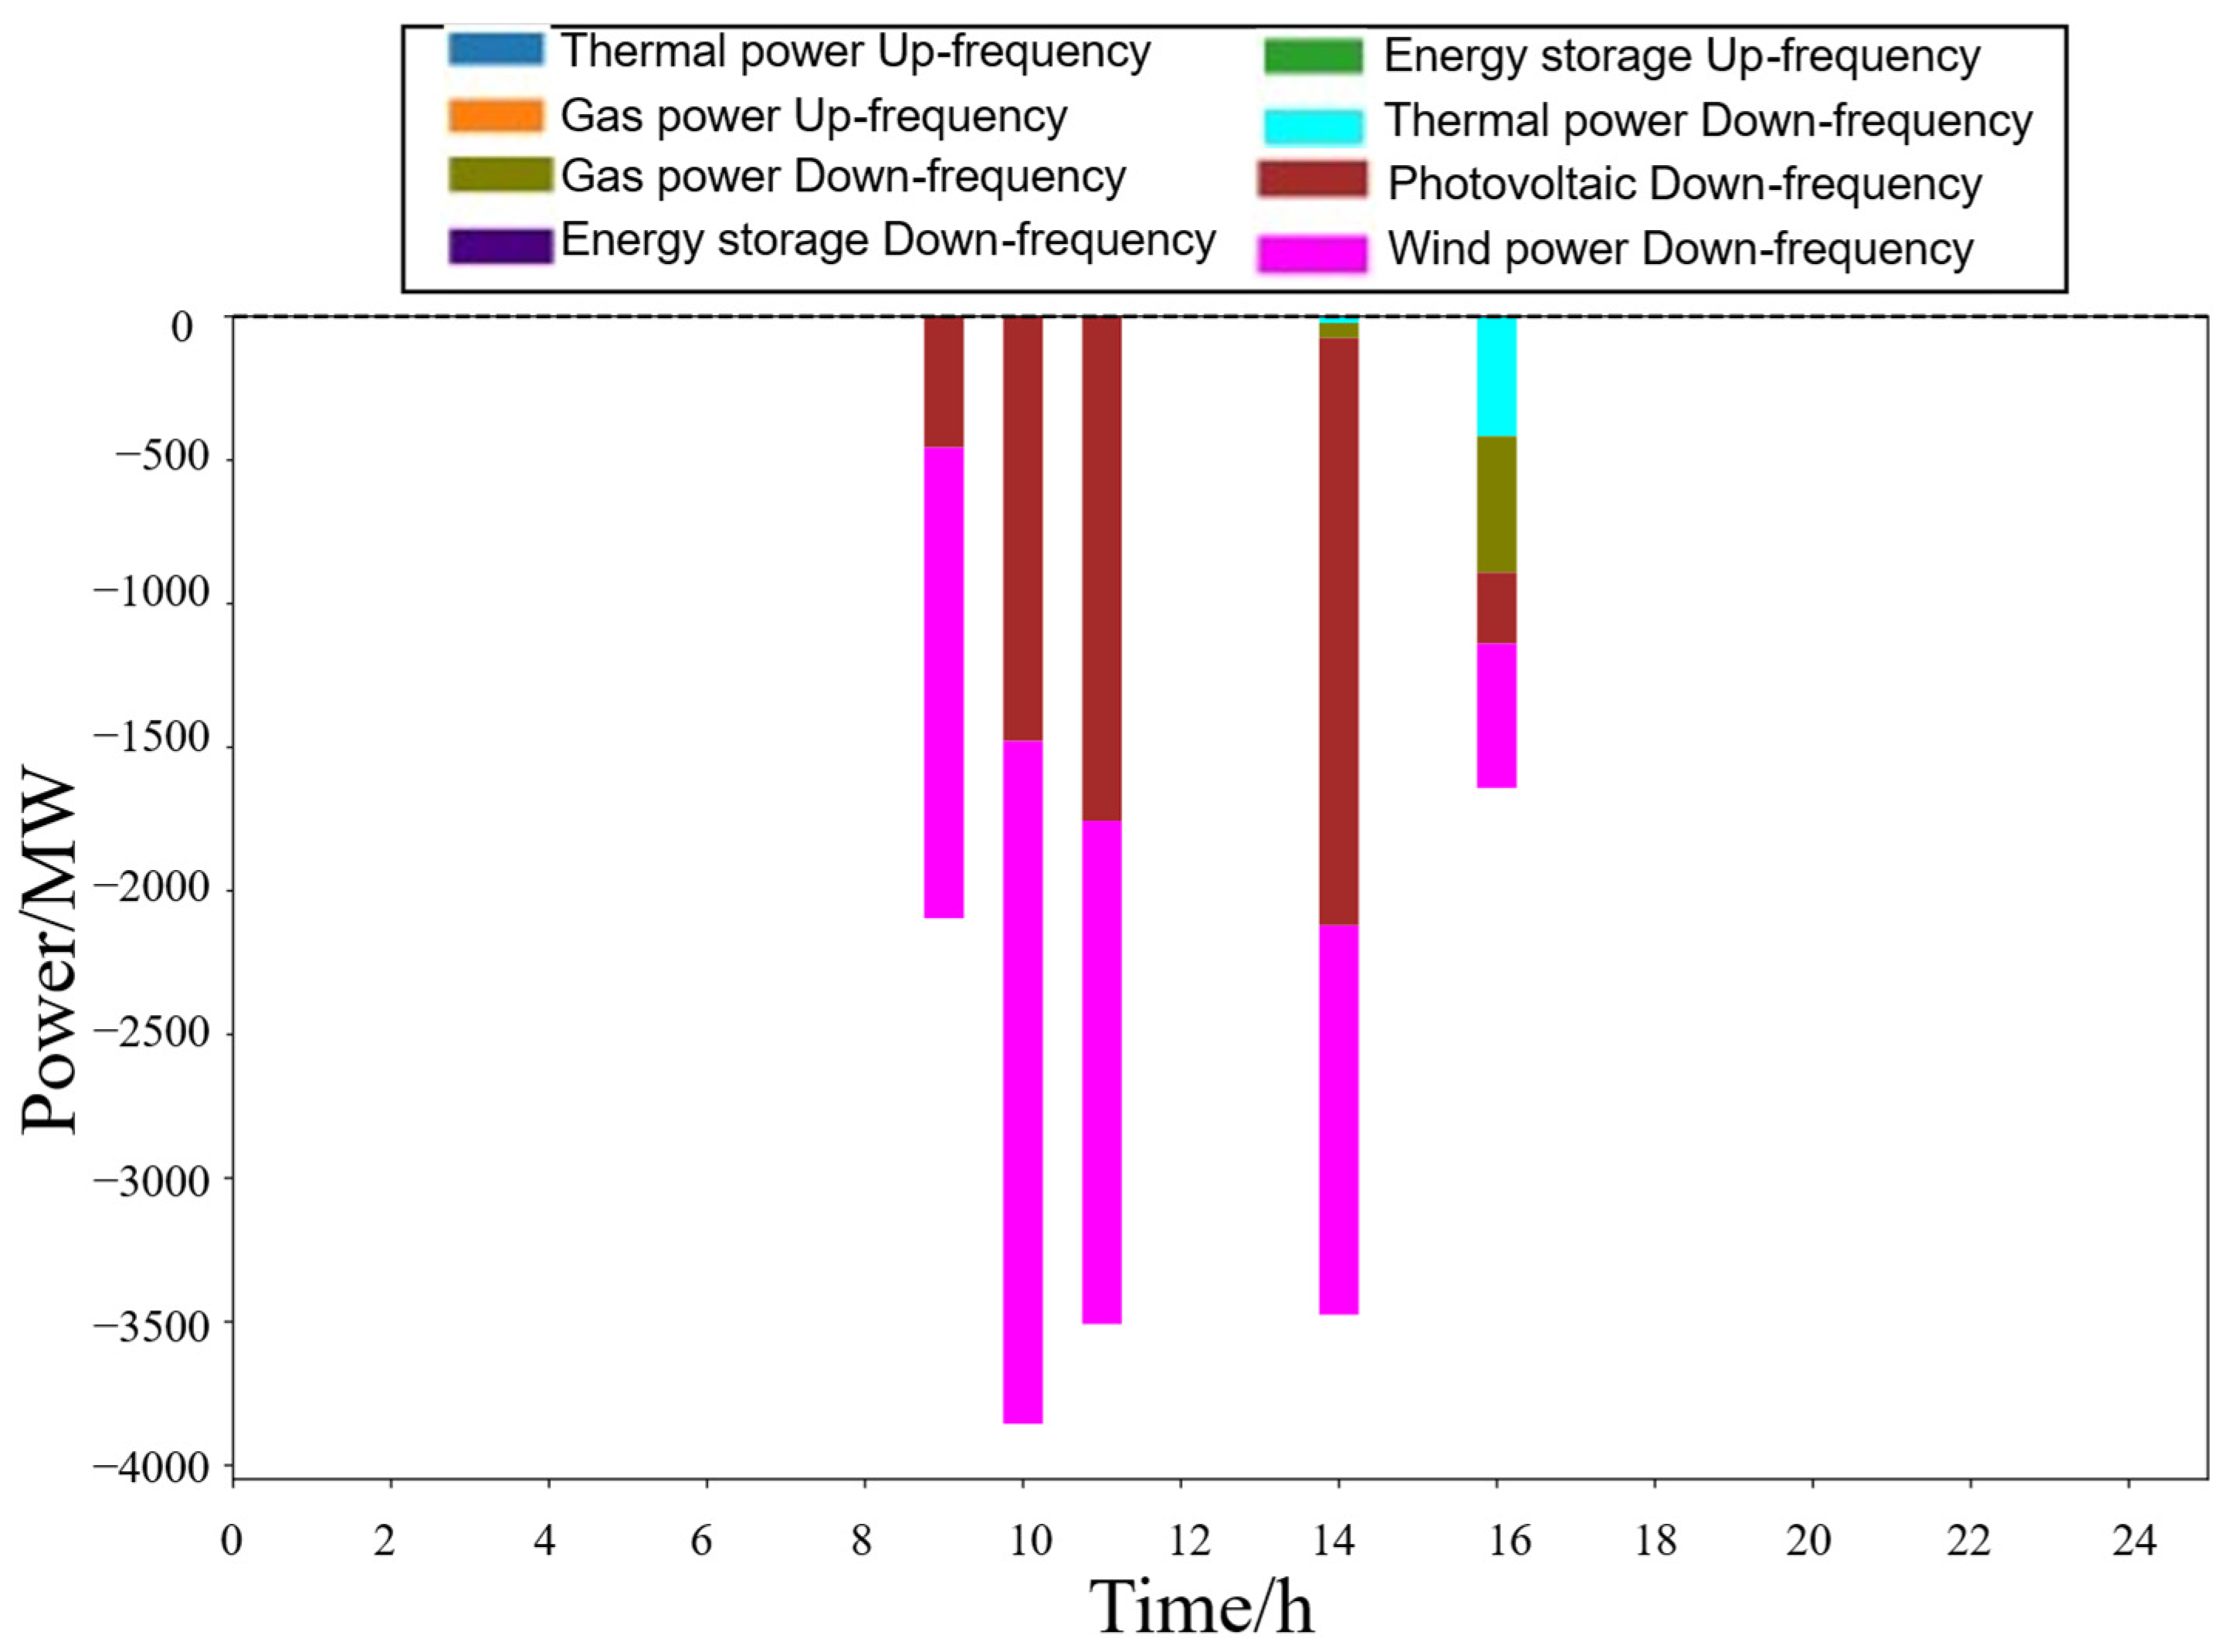
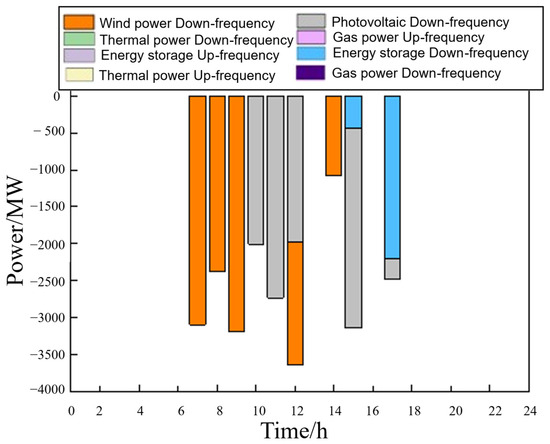
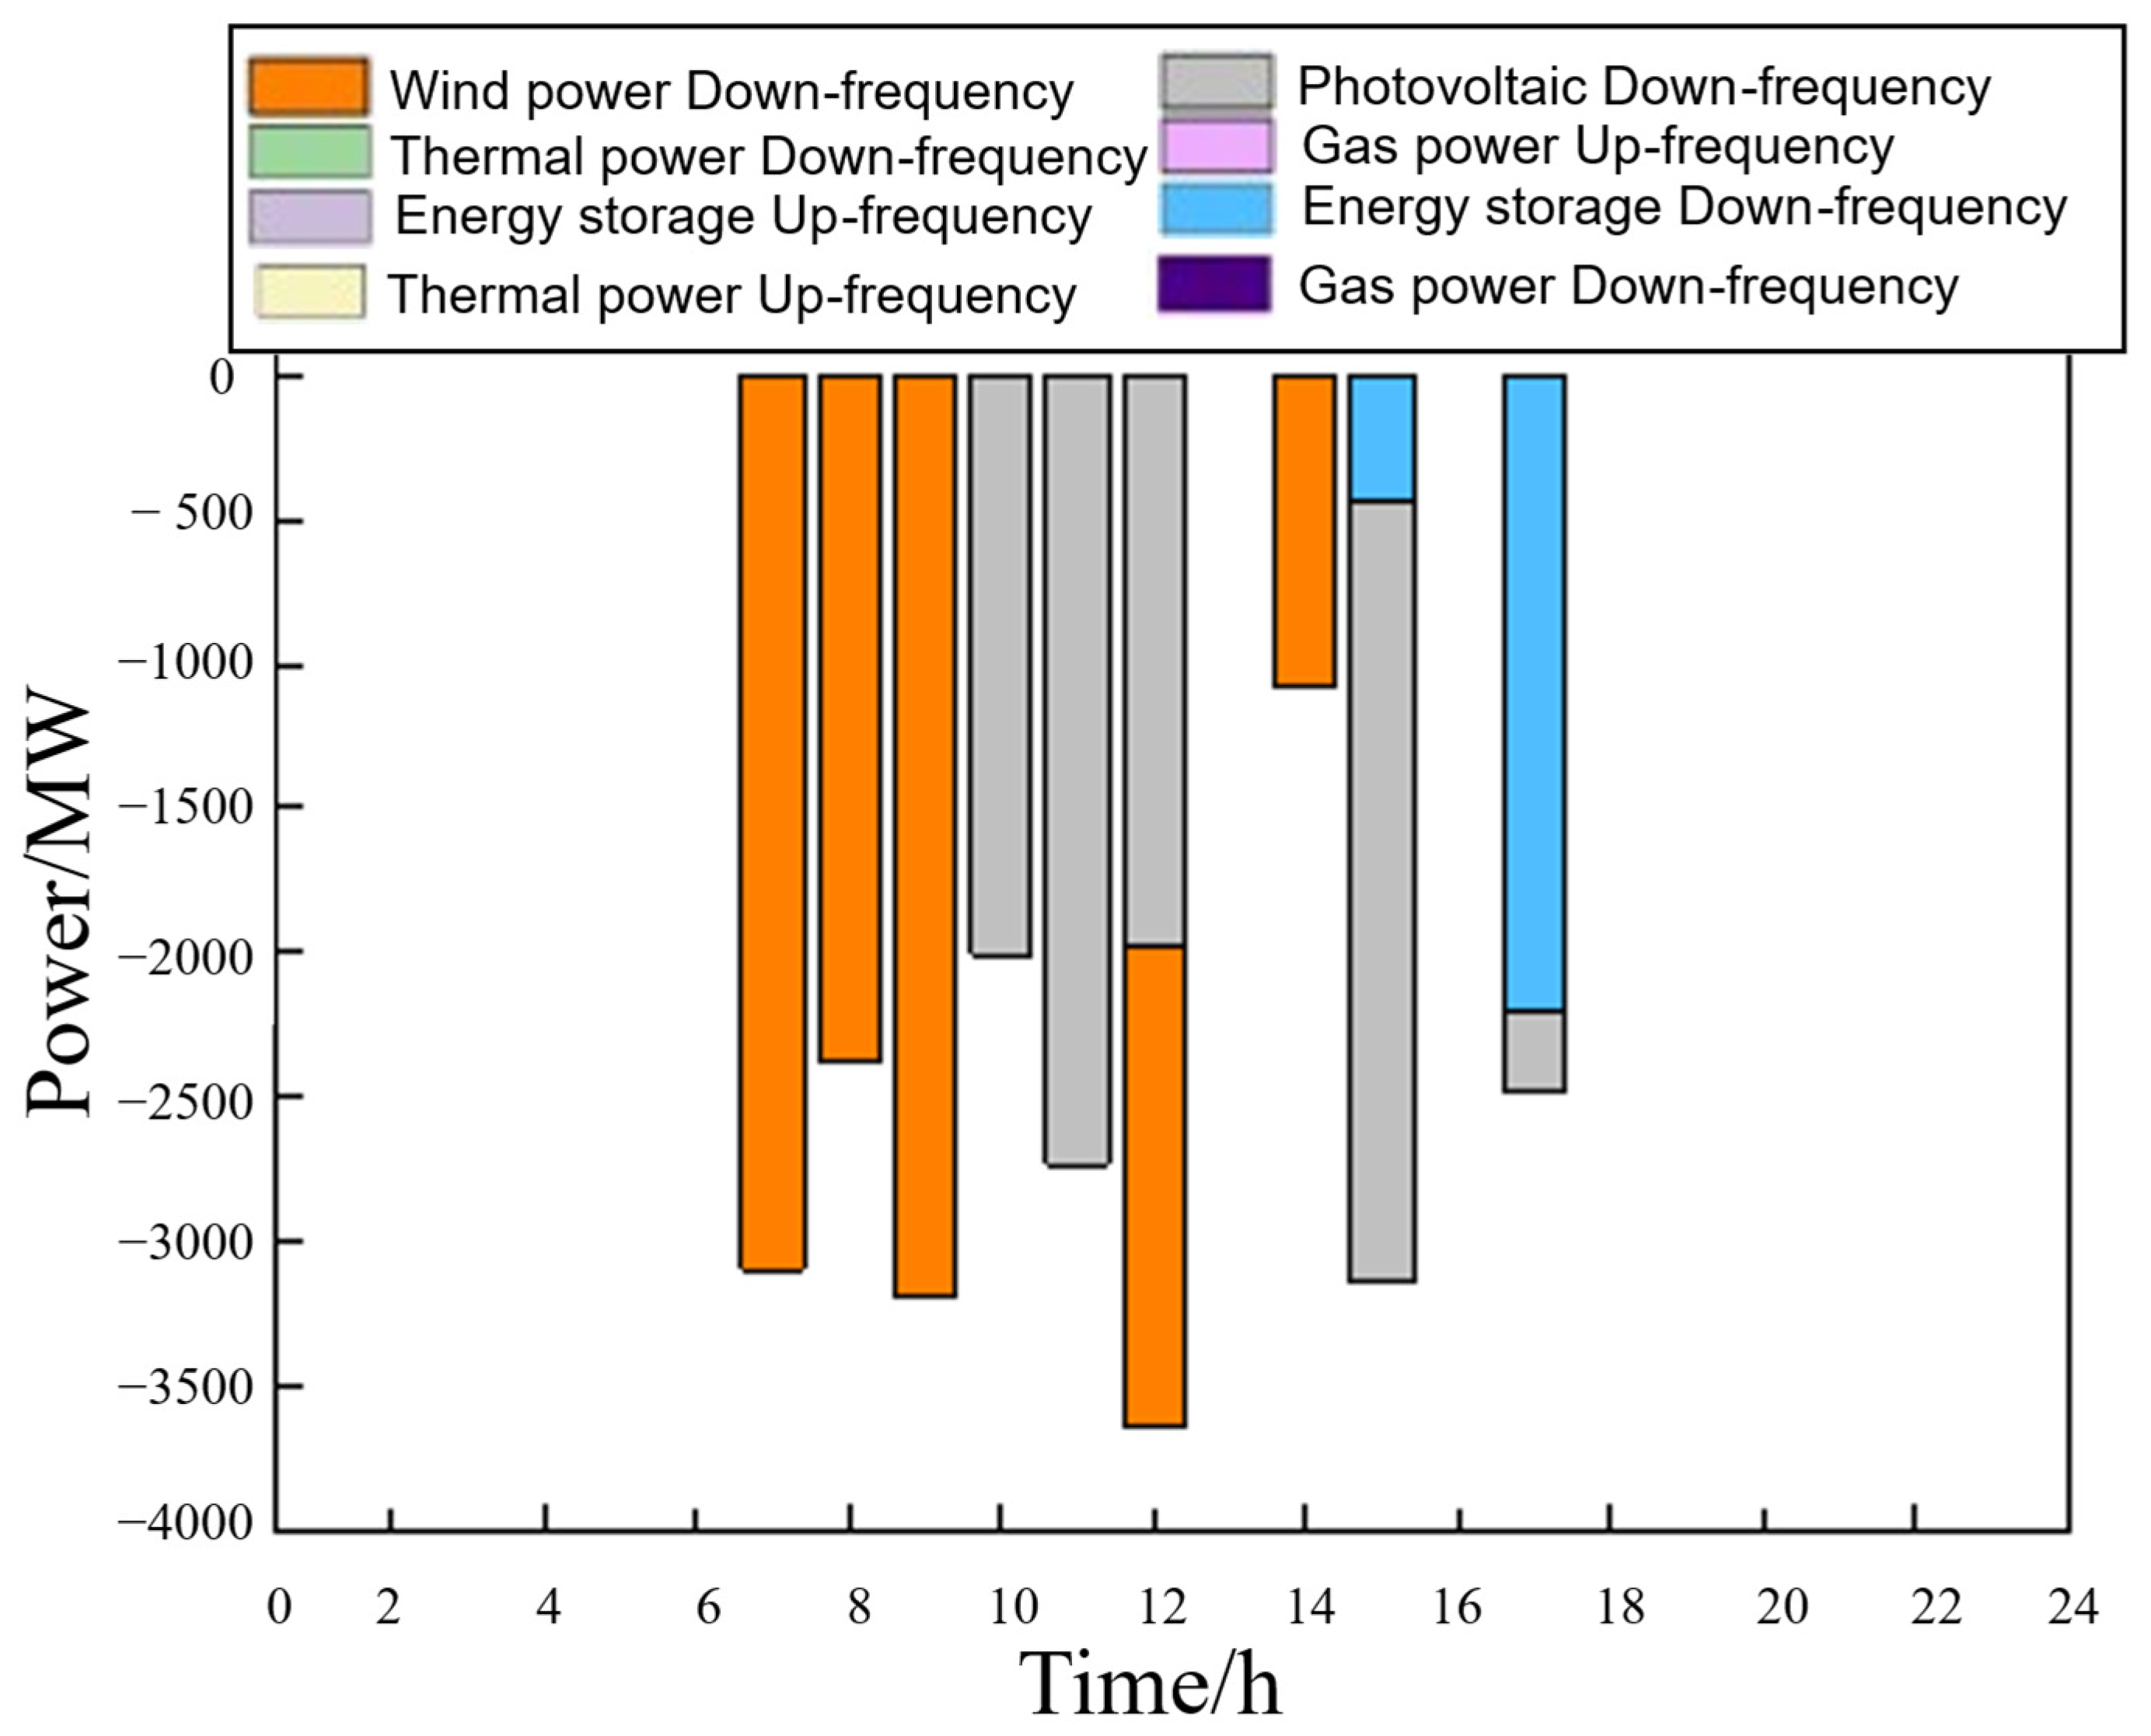
To further demonstrate the market participant revenue after the proposed multi-type unit collaborative market clearing model is implemented, this section compares the winning bids for frequency regulation capacity in Scenario 4, as shown in Figure 14. The results show that in the studied scenario, the system frequency regulation capacity is mainly provided by wind power, photovoltaics, and energy storage, with overall frequency regulation primarily driven by renewable energy sources. Specifically, during the period from 7:00 to 14:00, the system frequency regulation capacity is almost entirely provided by wind power and photovoltaics, with frequency regulation becoming the main adjustment direction. This phenomenon stems from the high output of renewable energy sources during this period, resulting in significant power surplus in the system. Renewable energy sources can provide considerable frequency regulation capacity by reducing their output, effectively mitigating the risk of power curtailment while meeting power balance and frequency control requirements. In contrast, energy storage is mostly in a charging or standby state during this period, and its frequency regulation potential has not yet been triggered. By 3:00 p.m., as photovoltaic output declined and system down-regulation redundancy gradually decreased, energy storage began to participate in the down-regulation market, supplementing the insufficient regulation capacity of renewable energy sources. This demonstrated its crucial supporting role in system flexibility during periods of transition in renewable energy output. Overall, the distribution of regulation capacity exhibited significant time-varying characteristics: renewable energy sources dominated down-regulation supply during peak output periods, while energy storage intervened for coordinated regulation when renewable energy regulation space weakened. These results indicate that the proposed market clearing mechanism can adaptively guide the division of labor and cooperation of regulation resources based on the characteristics of renewable energy output at different times, fully tapping the potential of renewable energy down-regulation, and playing a supplementary regulatory role in key periods, thereby improving the overall system frequency regulation capacity and renewable energy absorption level.
Figure 14.
Bidding amount of frequency regulation capacity of different generating units.
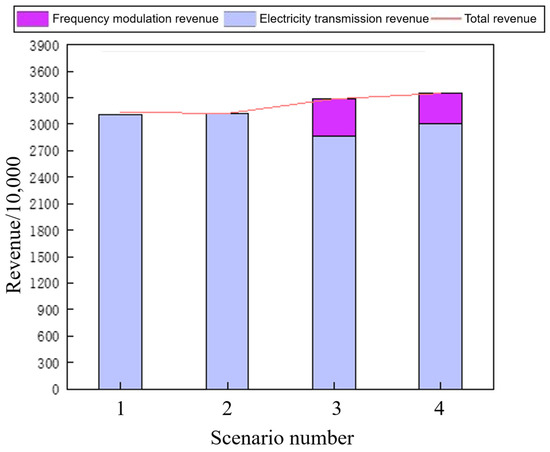
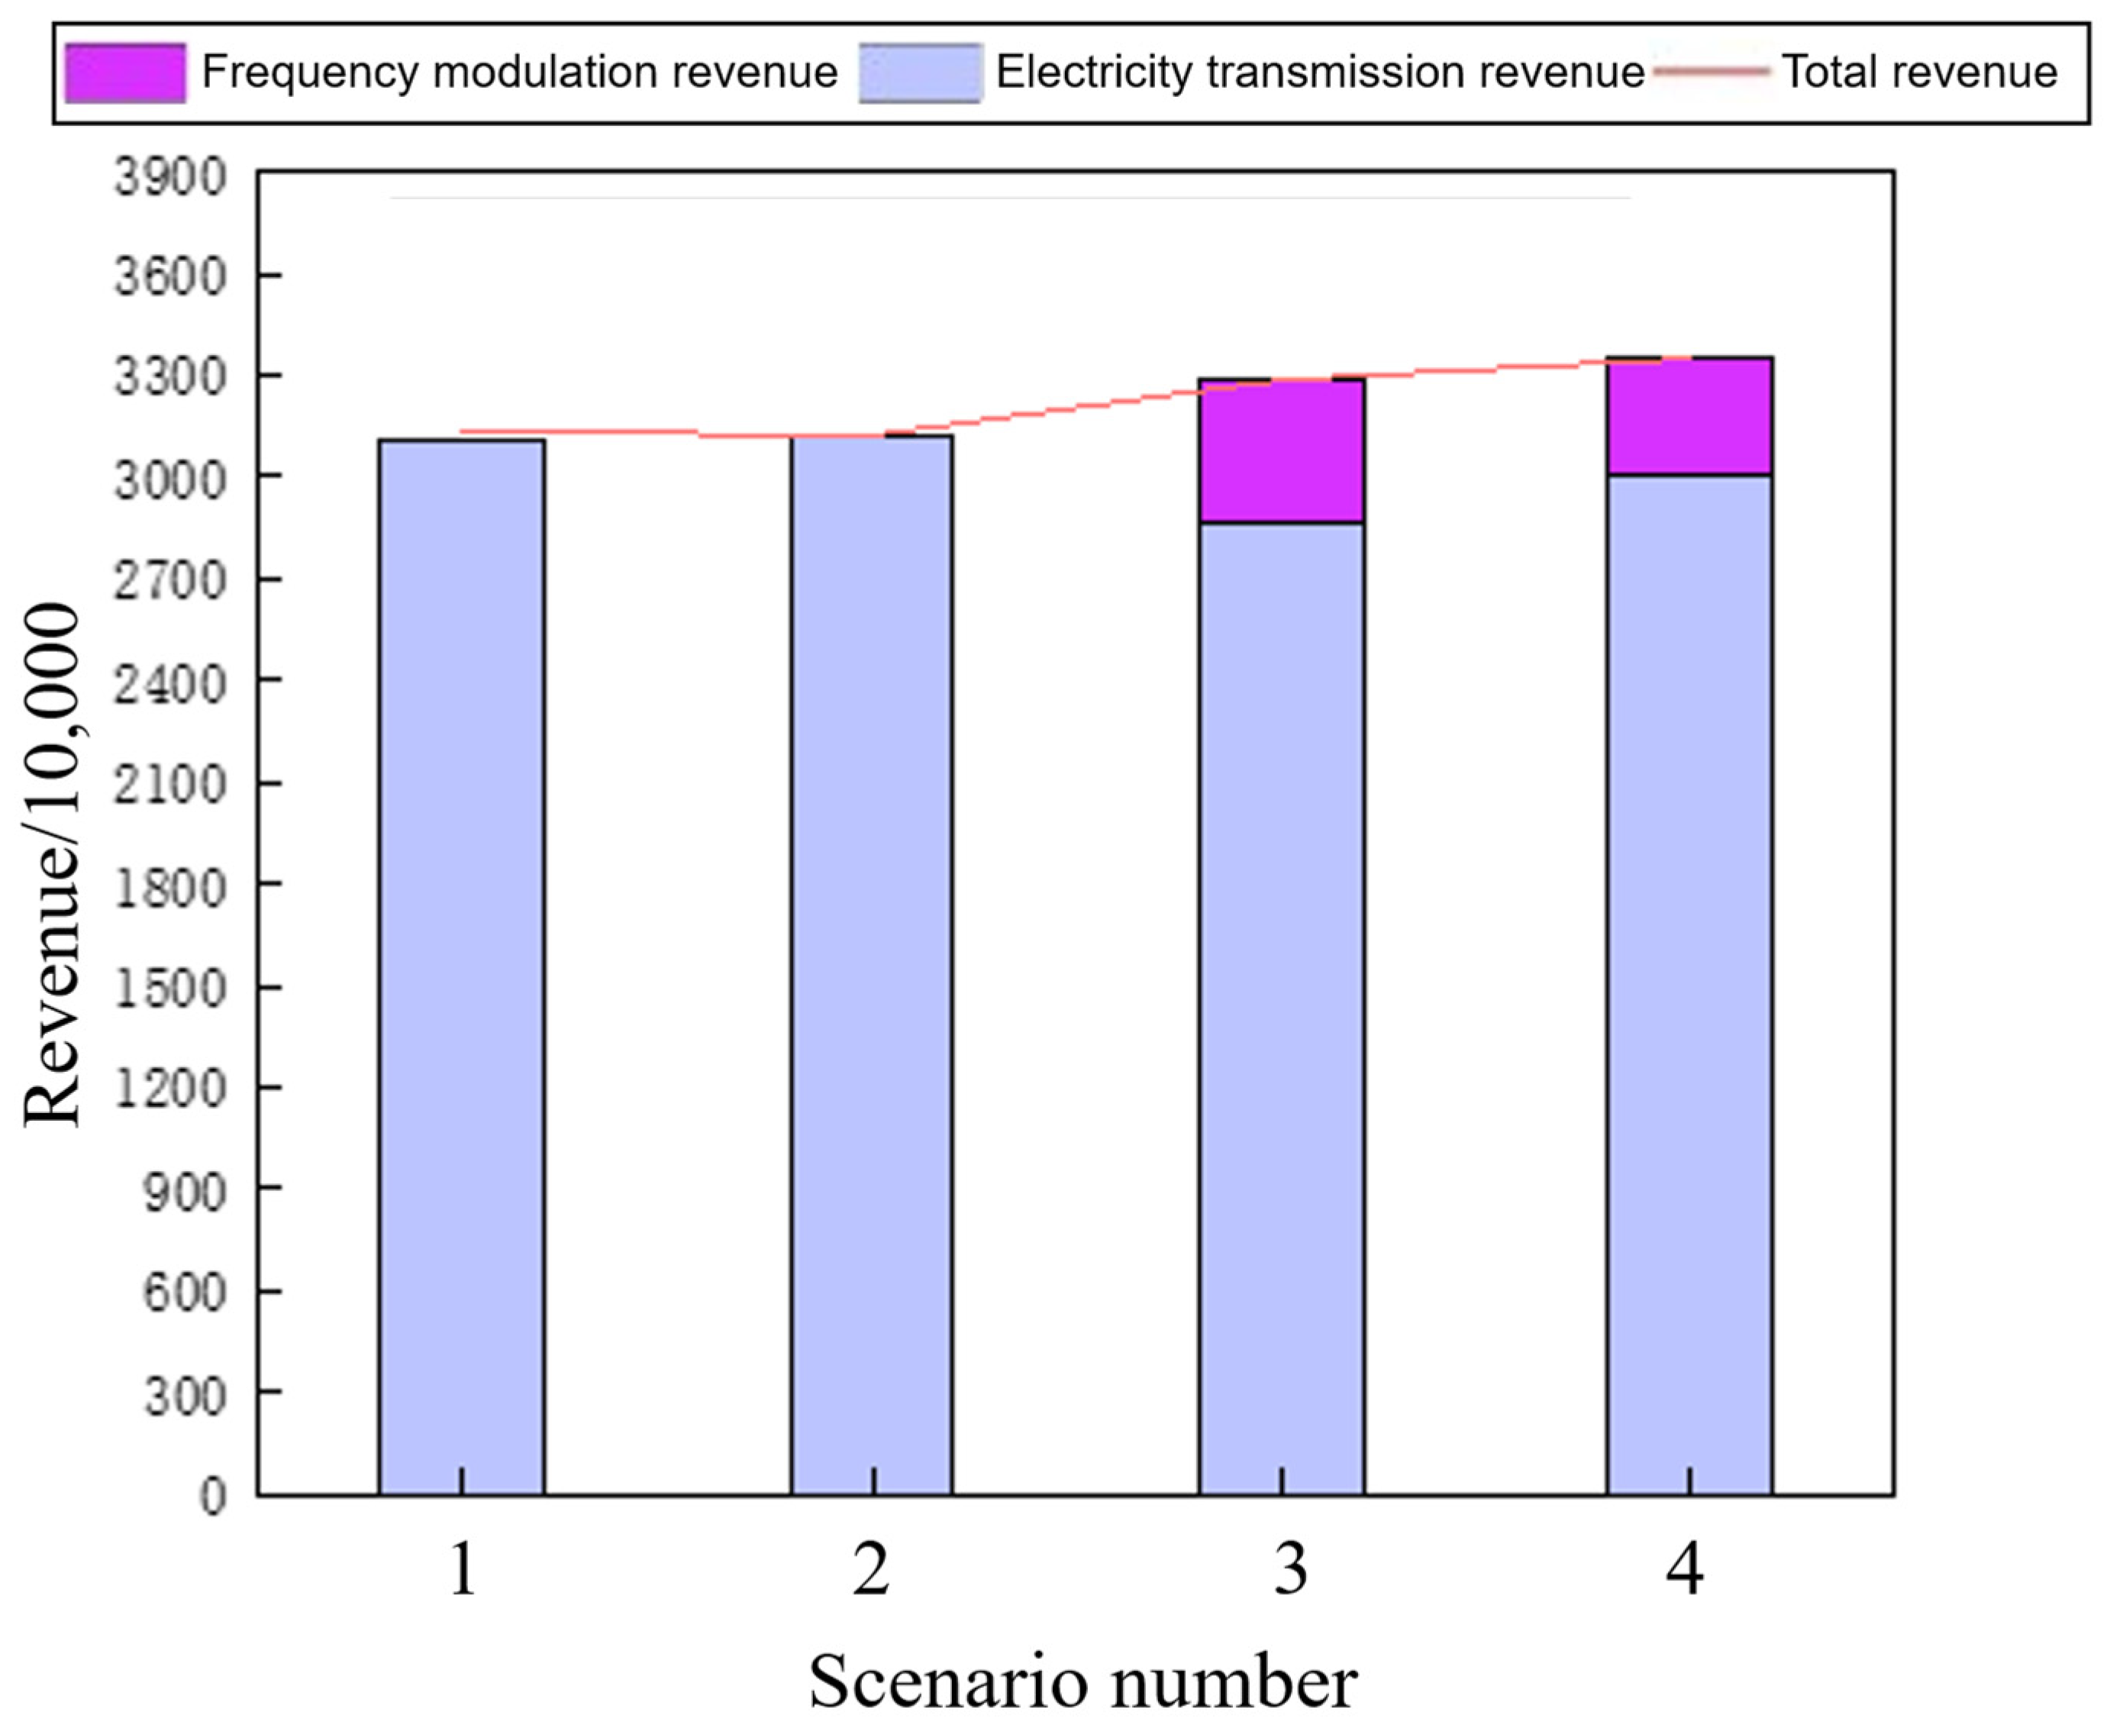
Figure 15 illustrates the revenue of market participants under different scenarios. It can be seen that Scenario 1, which does not consider the electricity market, has the lowest total revenue, at only 31.348 million yuan. Scenario 2 and Scenario 3, considering the spot market and frequency regulation market, respectively, have total revenues of 31.2259 million yuan and 32.8694 million yuan. Scenario 4, considering both markets, has a revenue of 33.4967 million yuan, increasing the unit’s rate of return by 6.85%. Under the combined effect of the spot market and the frequency regulation ancillary service market, the revenue structure and operational behavior of system resources have fundamentally changed compared to the baseline scenario without participation in the electricity market. The market mechanism, through the combination of electricity price and frequency regulation capacity and mileage price, establishes multi-dimensional revenue channels for flexible resources, enabling them to obtain energy-side revenue not only through real-time electricity prices but also through rapid response capabilities to obtain regulation-side value. Compared to the scenario where resources operate only according to plan and regulation capabilities cannot be monetized without considering the market, the linkage between the spot market and frequency regulation significantly improves the marginal revenue of flexible resources, allowing them to obtain additional returns without increasing power generation, thereby reshaping the economic dispatch pattern of the system. As a result, the system exhibits greater flexibility and incentives, a more rational distribution of unit output, and better economic performance in a market environment—effects that would be difficult to achieve without a market mechanism.
Figure 15.
Total revenue of the unit under different scenarios.
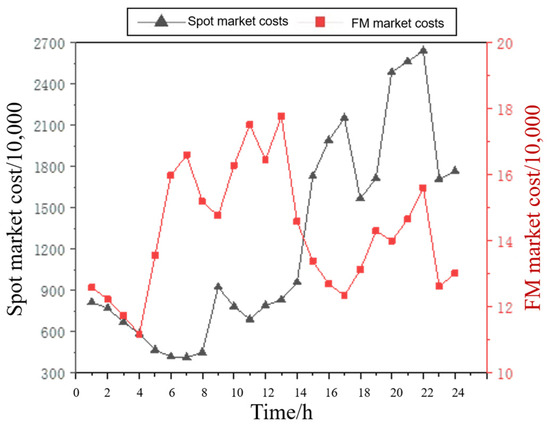
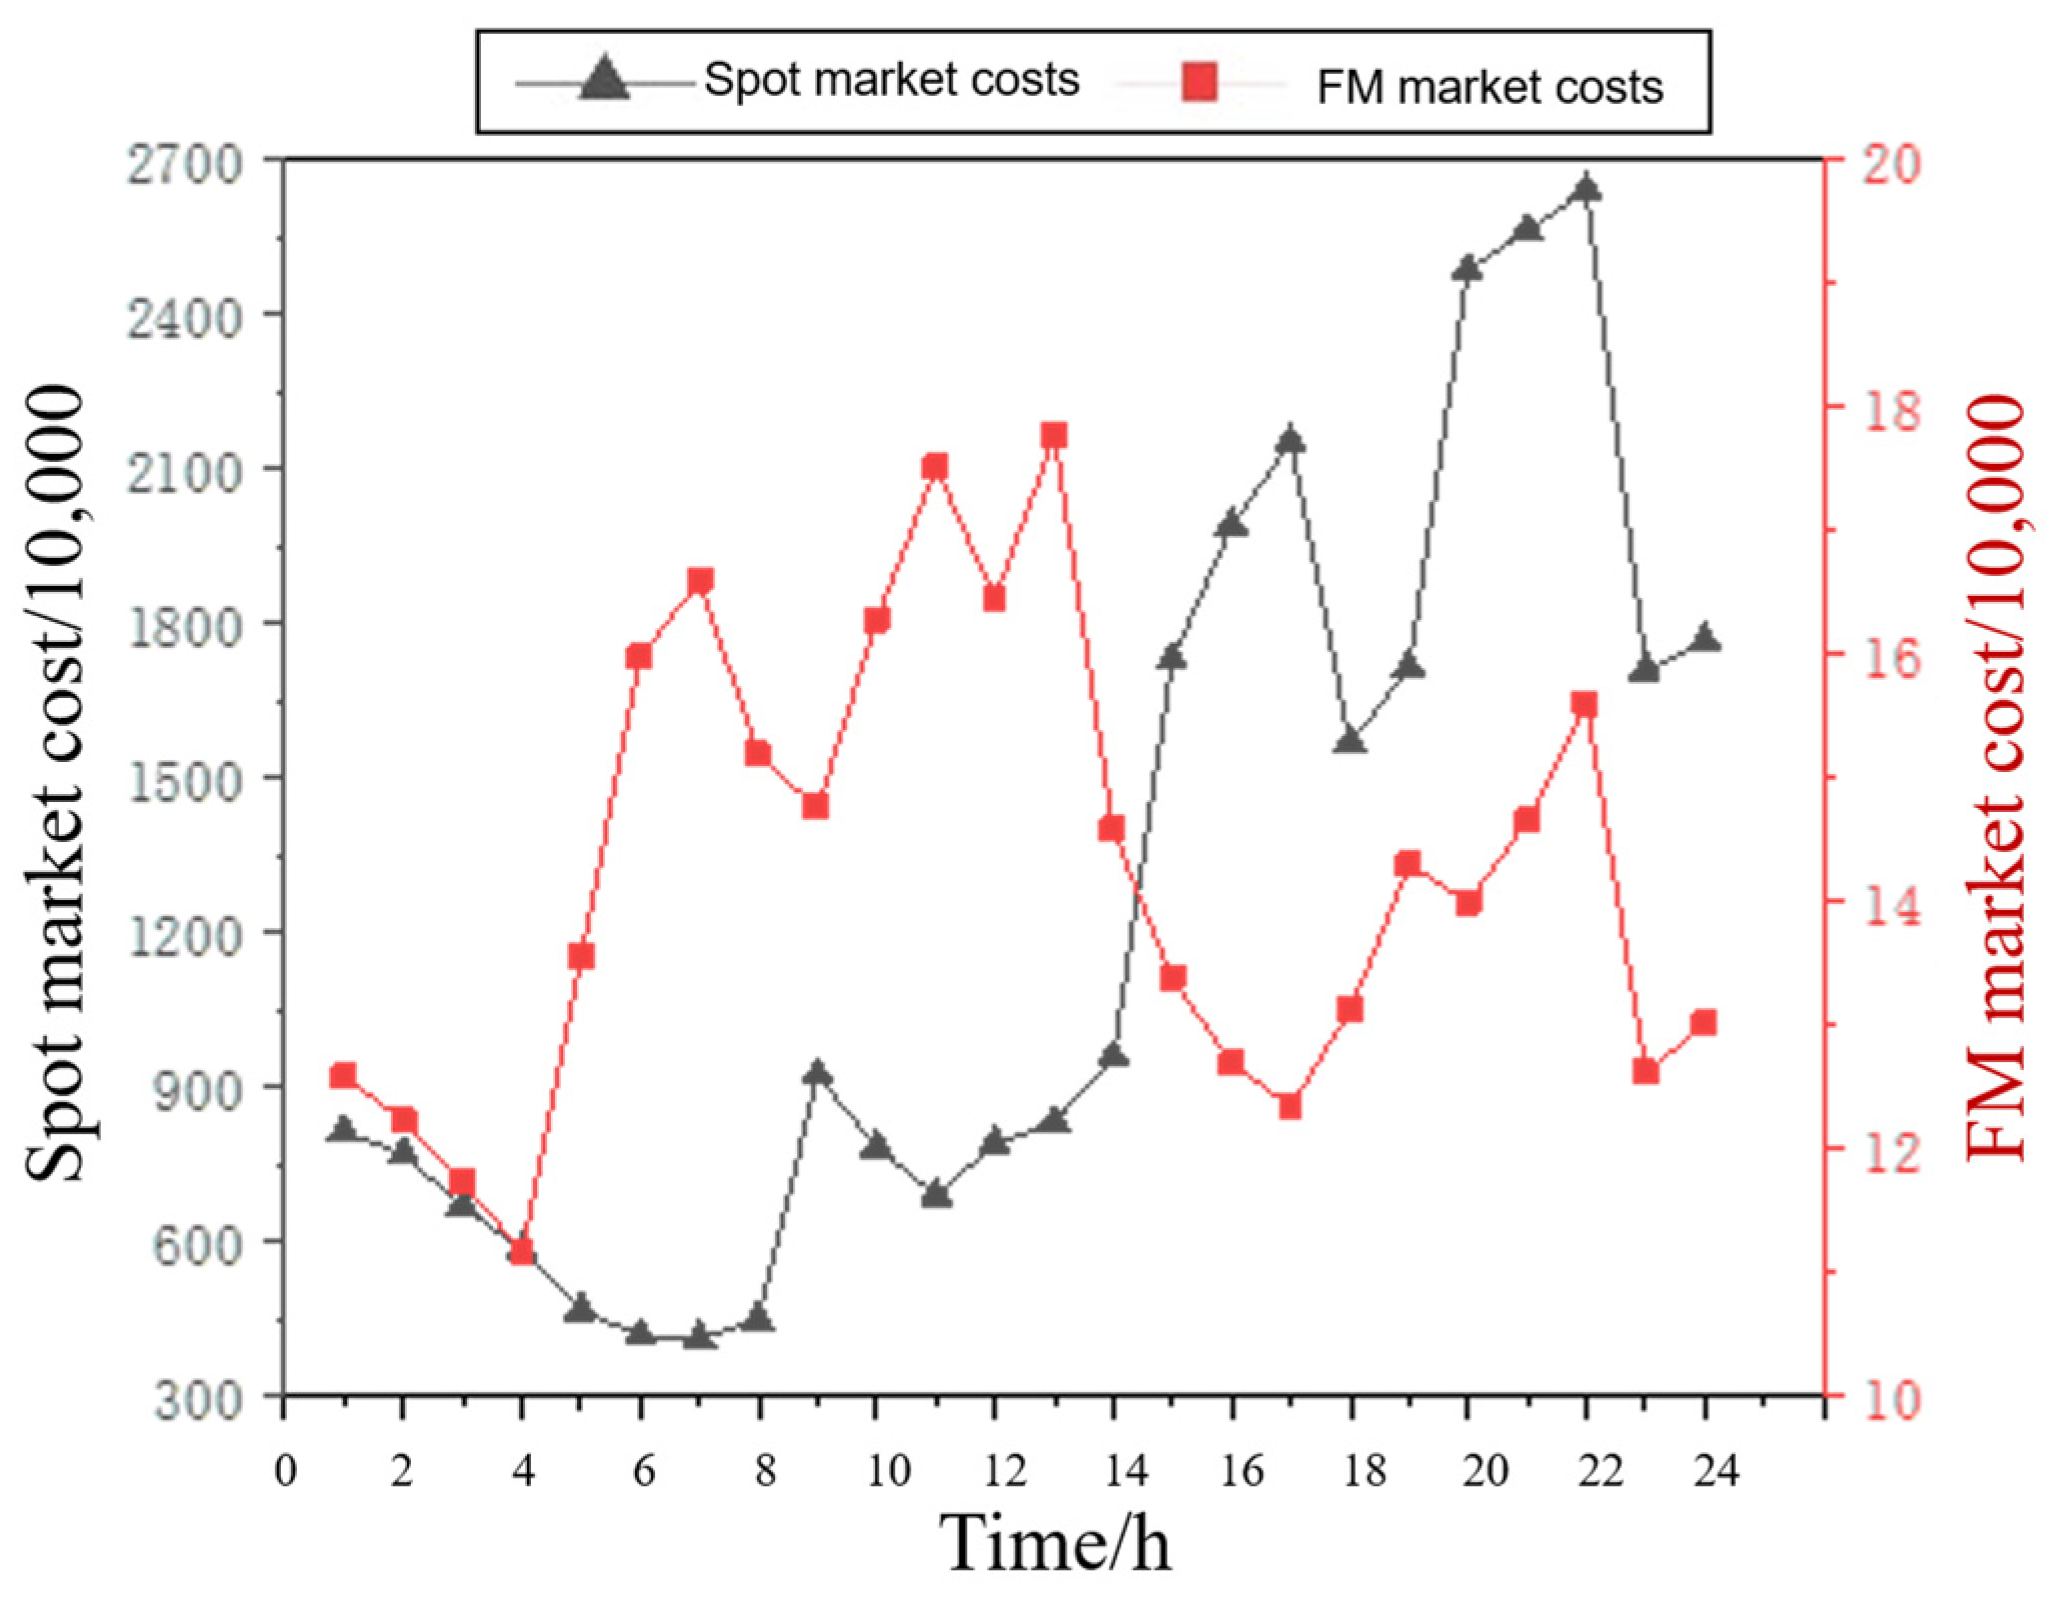
Figure 16 illustrates the operating costs of the power grid dispatch center in the spot market and the frequency regulation market, respectively. It can be seen that the cost in the spot market is significantly higher than that in the frequency regulation market, due to the much larger transaction scale and scope of the spot market. The cost curve in the spot market closely mirrors the load trend, exhibiting a low-at-night and high-during-day pattern, while the operating cost in the frequency regulation market shows a negative correlation with load demand. Under high-load conditions, although the system faces significant demand for downward frequency regulation, the flexibility resources available for downward frequency regulation are generally limited by output limits, ramp-up constraints, and safe operating ranges, resulting in a relatively limited adjustment space. Since most conventional generating units are already operating at high output, their downward regulation mainly manifests as a small, short-term power drop, with lower marginal adjustment costs. In contrast, upward frequency regulation often requires the use of reserve capacity, rapid start-up and shutdown, or high-cost flexibility resources, which are more constrained and have higher marginal costs. Consequently, during high-load periods, although the demand for downward frequency regulation services increases, its unit adjustment cost is actually lower than that of upward frequency regulation, suppressing the overall clearing price level of the frequency regulation market. Conversely, during low-load periods, generating units operate near minimum output, limiting or even eliminating down-regulation space. This significantly increases the system’s reliance on up-regulation and rapid response resources, raising the scarcity and marginal value of frequency regulation services and consequently driving up operating costs in the frequency regulation market. This asymmetry between up- and down-regulation costs and constraints is one of the key underlying reasons for the negative correlation between operating costs and load demand in the frequency regulation market.
Figure 16.
Spot market and frequency regulation market power grid operating costs.
4. Conclusions
This paper develops a joint market-clearing model for the coordinated operation of multiple types of generating units while accounting for dynamic carbon emission factors. First, a joint market-clearing mechanism involving multiple types of generating units is proposed, and the operating characteristics of thermal power units and energy storage systems under electricity market signals are analyzed. Subsequently, a dynamic-carbon-emission-factor-driven joint market-clearing model is established to coordinate the operation of heterogeneous generation resources. The day-ahead reliability-constrained unit commitment model determines the operating states of multiple generating units subject to dynamic carbon emission constraints, whereas the intraday real-time economic dispatch model optimizes system operation by minimizing total operating costs while maximizing the market revenues of generating units. Finally, a case study based on actual data from a southern province is conducted to validate the effectiveness of the proposed model and assess its economic and carbon-reduction benefits under electricity market participation. The main conclusions are as follows:
The coordinated operation of the spot electricity market and the frequency regulation ancillary service market significantly reshapes the marginal revenue structure of generating units. Incorporating dynamic carbon emission factors internalizes the external costs associated with carbon emissions, enabling flexible resources to obtain revenues from energy prices, frequency regulation capacity prices, and regulation mileage prices. Compared with the scenario without electricity market participation, the proposed mechanism significantly reduces the total system operating cost and results in a more rational allocation of generation output.
The coordinated clearing of the two markets enhances the complementary operational advantages of energy storage systems and thermal power units. Energy storage systems provide rapid bidirectional regulation, thereby improving the dynamic regulation capability of the power system. Meanwhile, thermal power units maintain stable generation and provide supplementary regulation services in response to market price signals. Dynamic carbon emission factors further encourage thermal power units to avoid operating conditions associated with high carbon emissions, thereby facilitating greater renewable energy accommodation in power systems with a high penetration of renewable generation.
Electricity market participation reduces the duration of low-load and high-carbon-emission operation and improves the operating conditions of thermal power units. Combined with a priority-clearing mechanism for low-carbon generation resources, the proposed model reduces total system carbon emissions by 3.52% and carbon emission intensity by 5.15%. It also promotes a more balanced spatial and temporal distribution of carbon emissions across the power grid, thereby achieving coordinated improvements in economic efficiency and low-carbon performance.
Future research may be extended in the following directions. First, the coupling and interaction mechanisms between the carbon market and the electricity market should be incorporated to quantify the effects of carbon price fluctuations on market-clearing outcomes. Second, demand-side response resources should be introduced into the joint clearing process to establish a multi-entity collaborative market framework integrating generation, grid, load, and energy storage resources. Third, machine-learning-based methods may be further developed to improve the real-time prediction accuracy of dynamic carbon emission factors, thereby enhancing the adaptability of the proposed model under highly volatile operating conditions.
Author Contributions
Conceptualization, G.L. and K.J.; methodology, X.H.; software, X.H. and G.L.; validation, M.Z., H.Y. and H.L.; formal analysis, G.L.; investigation, G.L.; resources, X.H., M.Z. and H.Y.; data curation, G.L. and B.L.; writing—original draft preparation, X.H. and G.L.; writing—review and editing, K.J.; visualization, G.L. and B.L.; funding acquisition, X.H., M.Z. and H.Y. All authors have read and agreed to the published version of the manuscript.
Funding
This work was supported by the Science and Technology Project of China Southern Power Grid Co., Ltd., titled “Research on Spatiotemporal Dynamic Electricity-Carbon Factor Assessment and Optimization Technology for New-Type Power Systems” (Grant No. GDKJXM20231207).
Data Availability Statement
The data in this article comes from a provincial power grid of China Southern Power Grid. The original data on which the conclusions of this article are based will be provided by the author upon request.
Conflicts of Interest
Authors Xin Huang, Minjia Zheng, and Hao Yu were employed by the company Power Grid Planning and Research Center, Guangdong Power Grid Co., Ltd. The remaining authors declare that the research was conducted in the absence of any commercial or financial relationships that could be construed as a potential conflict of interest. The funders had no role in the design of the study; in the collection, analyses, or interpretation of data; in the writing of the manuscript, or in the decision to publish the results.
References
- Gerini, F.; Zuo, Y.; Gupta, R.; Zecchino, A.; Yuan, Z.; Vagnoni, E.; Cherkaoui, R.; Paolone, M. Optimal grid-forming control of battery energy storage systems providing multiple services: Modeling and experimental validation. Electr. Power Syst. Res. 2022, 212, 108567. [Google Scholar] [CrossRef] [Scilit]
- Central Committee of the Communist Party of China; State Council of the People’s Republic of China. Several Opinions on Further Deepening the Reform of the Electric Power System (Zhongfa [2015] No. 9) [EB/OL]. 2015-03-15. Available online: https://www.yjx.gov.cn/contentImg/uploadfile/document_20140902/20150401090452829.pdf (accessed on 30 April 2026).
- National Development and Reform Commission; National Energy Administration. Basic Rules for Electricity Spot Market (Trial) [EB/OL]. 2023-09-07. Available online: https://www.ndrc.gov.cn/xxgk/zcfb/ghxwj/202309/P020230915357678894853.pdf (accessed on 15 April 2026).
- Fleten, S.E.; Fram, B.P.; Ullrich, C.J. The reliability pricing model and coal-fired generators in PJM. Energy Econ. 2024, 134, 107543. [Google Scholar] [CrossRef] [Scilit]
- Wachs, E.; Engel, B. Reliability versus renewables: Modeling costs and revenue in CAISO and PJM. Electr. J. 2020, 33, 106860. [Google Scholar] [CrossRef] [Scilit]
- Lavin, L.; Murphy, S.; Sergi, B.; Apt, J. Dynamic operating reserve procurement improves scarcity pricing in PJM. Energy Policy 2020, 147, 111857. [Google Scholar] [CrossRef] [Scilit]
- Koltsaklis, N.E.; Zenginis, I.; Dagoumas, A.S. Assessing new block order options of the EUPHEMIA algorithm: An optimization model for the economic dispatch problem in power exchanges. Energy Rep. 2020, 6, 3119–3140. [Google Scholar] [CrossRef] [Scilit]
- Wang, K.; Yan, X.; Jiang, K.; Liu, N. Bidding Strategy and Regulation Method for Wind-Photovoltaic-Storage Power Stations Participating in Electricity Spot Markets Considering Carbon Trading. Proc. CSEE 2023, 43, 7091–7103. [Google Scholar]
- Zhang, Y.; Ma, C.; Yang, Y.; Pang, X.; Lian, J.; Wang, X. Capacity configuration and economic evaluation of a power system integrating hydropower, solar, and wind. Energy 2022, 259, 125012. [Google Scholar] [CrossRef] [Scilit]
- Liu, R.; Wang, L.; Sun, G.; Zhao, Z.; Lin, S. Bidding model for wind-photovoltaic-storage cooperative alliance participating in combined energy and ancillary service market considering demand response and uncertainties. Power Syst. Prot. Control 2023, 51, 96–107. [Google Scholar]
- Bai, Q.; Zhao, Z.; Jin, X.; Chen, C.; Deng, Z.; Jia, Z. Bidding Strategy for Hydro-wind Alliance in Spot Market Considering Uncertainties of Wind Power Output and Electricity Price. Autom. Electr. Power Syst. 2024, 48, 122–133. [Google Scholar]
- Wu, Q.; Zhu, X. Trading Decisions of Combined Wind-photovoltaic-storage Participating in Spot Market under Renewable Portfolio Standard. Electr. Power 2024, 57, 77–88. [Google Scholar]
- Galiana, F.D.; Bouffard, F.; Arroyo, J.M.; Restrepo, J. Scheduling and pricing of coupled energy and primary, secondary, and tertiary reserves. Proc. IEEE 2005, 93, 1970–1983. [Google Scholar] [CrossRef] [Scilit]
- Li, W.; Du, P.; Lu, N. Design of a new primary frequency control market for hosting frequency response reserve offers from both generators and loads. IEEE Trans. Smart Grid 2017, 9, 4883–4892. [Google Scholar] [CrossRef] [Scilit]
- Yang, Y.; Peng, J.C.H.; Ye, Z.S. A market clearing mechanism considering primary frequency response rate. IEEE Trans. Power Syst. 2021, 36, 5952–5955. [Google Scholar] [CrossRef] [Scilit]
- Xu, B.; Shi, Y.; Kirschen, D.S.; Zhang, B. Optimal battery participation in frequency regulation markets. IEEE Trans. Power Syst. 2018, 33, 6715–6725. [Google Scholar] [CrossRef] [Scilit]
- Tian, Y.; Li, Z.; Wu, W. Discrete-Continuous Time Stochastic Look-Ahead Economic Dispatch Considering Dynamic Characteristics of AGC Regulation Resources. Proc. CSEE 2024, 44, 2578–2590. [Google Scholar]
- Wang, X.; Ying, L.; Wen, K.; Lu, S. Bi-level non-convex joint optimization model of energy storage in energy and primary frequency regulation markets. Int. J. Electr. Power Energy Syst. 2022, 134, 107408. [Google Scholar]
- Lan, L.; Zhang, X.; Zhang, Y. Low carbon and efficiency oriented day-ahead joint electrical energy and ancillary services market clearing model for generation-side in China. Energy Econ. 2023, 121, 106686. [Google Scholar]
- Li, X.; Hu, C.; Zhang, Y.; Li, X.; Li, F. Bidding Strategy for Wind Power Leasing Energy Storage to Participate in Energy and Frequency Regulation Markets. Power Syst. Technol. 2024, 48, 1992–2002. [Google Scholar]
- Wang, A.; Zhao, S.; Song, J.; Li, Z. Joint Market Clearing Model Considering Renewable Energy and Energy Storage Participation in Frequency Regulation. Acta Energiae Solaris Sin. 2024, 45, 367–376. [Google Scholar]
- Wang, X.; Ying, L.; Lu, S. Joint Optimization Model for Primary and Secondary Frequency Regulation Considering Dynamic Frequency Constraints. Power Syst. Technol. 2020, 44, 2858–2867. [Google Scholar]
- Liang, Z.; Mieth, R.; Dvorkin, Y. Inertia pricing in stochastic electricity markets. IEEE Trans. Power Syst. 2022, 38, 2071–2084. [Google Scholar] [CrossRef] [Scilit]
- Li, Y.; Zhang, N.; Du, E.; Liu, Y.; Cai, X.; He, D. Research and benefit analysis of a low-carbon demand response mechanism for power systems based on carbon emission flow. Proc. CSEE 2022, 42, 2830–2842. [Google Scholar]
- Su, J.; Chen, Z.; Tang, C.; Liu, Z. Dynamic carbon emission model of distribution network considering mix distributed generation. Energy Rep. 2025, 14, 320–331. [Google Scholar] [CrossRef] [Scilit]
- Al-Swaiti, M.S.; Al-Awami, A.T.; Khalid, M.W. Co-optimized trading of wind-thermal-pumped storage system in energy and regulation markets. Energy 2017, 138, 991–1005. [Google Scholar]
- Khaloie, H.; Abdollahi, A.; Shafie-Khah, M.; Anvari-Moghaddam, A.; Nojavan, S.; Siano, P.; Catalão, J.F.S. Coordinated wind-thermal-energy storage offering strategy in energy and spinning reserve markets using a multi-stage model. Appl. Energy 2020, 259, 114168. [Google Scholar]
- Yuan, J.; Zhang, W.; Shen, Q.; Zhang, L.; Zhou, Y.; Zhao, C.; Yang, J.; Zhang, J. The impact of electricity-carbon market coupling on system marginal clearing price and power supply cost. Environ. Sci. Pollut. Res. 2023, 30, 84725–84741. [Google Scholar] [CrossRef] [Scilit]
- Wu, J.; Shen, Y.; Yang, R.; Fan, H.; Duan, Y. Electric-carbon market coupling and price transmission mechanism in China: An empirical analysis and development barriers study. J. Clean. Prod. 2026, 544, 147692. [Google Scholar] [CrossRef] [Scilit]
- Gong, J.; Xiong, Y.; Wu, H.; Chen, H.; Chen, J.; Xiao, D. Operation strategy and profitability analysis of independent energy storage participating in electricity market: A provincial case study in China. Front. Energy Res. 2022, 10, 1044503. [Google Scholar] [CrossRef] [Scilit]
- Wang, C.; Jiang, Y.; Guo, H.; Bai, K.; Zhang, X.; Wang, A. A joint clearing model for the participation of renewable energy and energy storage in the frequency modulation ancillary service market considering performance differences. Front. Energy Res. 2023, 11, 1332041. [Google Scholar] [CrossRef] [Scilit]
- Sun, H.B.; Guo, Q.L.; Wu, W.C. Benders decomposition method for optimal dispatch of power systems and its application. Proc. CSEE 2020, 40, 7841–7853. [Google Scholar]
- Chen, H.Y.; Li, Y.; Zhang, N. Scenario clustering-based stochastic dispatch for renewable energy power systems. Power Syst. Technol. 2022, 46, 2512–2520. [Google Scholar]

Disclaimer/Publisher’s Note: The statements, opinions and data contained in all publications are solely those of the individual author(s) and contributor(s) and not of MDPI and/or the editor(s). MDPI and/or the editor(s) disclaim responsibility for any injury to people or property resulting from any ideas, methods, instructions or products referred to in the content. |
© 2026 by the authors. Licensee MDPI, Basel, Switzerland. This article is an open access article distributed under the terms and conditions of the Creative Commons Attribution (CC BY) license.