Article

Open-Access Crystal Plasticity Finite Element Implementation in ANSYS for Dislocation-Induced Nanoindentation in Magnesium

by
Syed Taha Khursheed
,
Moein Imani Foumani
,
Yunhua Luo
* and
Guo-zhen Zhu
*
Department of Mechanical Engineering and Manitoba Institute for Materials, University of Manitoba, Winnipeg, MB R3T 5V6, Canada
*
Authors to whom correspondence should be addressed.
Inventions 2025, 10(5), 77; https://doi.org/10.3390/inventions10050077
Submission received: 22 July 2025 / Revised: 19 August 2025 / Accepted: 26 August 2025 / Published: 28 August 2025

Abstract

This study focuses on developing and implementing crystal plasticity finite element modeling (CPFEM) codes on the ANSYS platform. The code incorporates a plasticity constitutive law that describes the behaviors of basal, prismatic, and pyramidal slips in magnesium, and is validated against plane-strain compression experiments and simulations using established codes on the ABAQUS CAE platform. The validated CPFEM code is applied to simulate the dislocation-induced nanoindentation response of pure magnesium across different crystallographic orientations, allowing visualization of strain distributions associated with different slips. Consistent with experimental observations, basal slip is identified as the primary active slip, whereas prismatic and pyramidal slips show varying activities with respect to the direction of the indentation. Novelty arises from an ANSYS–native CPFEM implementation that is cross-validated against published ABAQUS simulations and an experiment under a single, consistent constitutive set. This framework enables orientation-resolved mapping of slip system activity and subsurface strain fields under spherical nanoindentation, providing analysis capability seldom available in prior ANSYS–based studies.

1. Introduction

Crystal plasticity finite element modeling (CPFEM) has emerged as a powerful computational tool for predicting mesoscale mechanical behaviors in engineering design by integrating finite element discretization with crystallographic-dependent constitutive laws that describe deformation mechanisms, such as dislocation slips, twinning, and grain boundary interactions [1]. This approach enables simulation of both intra-granular and inter-granular strain evolution under various loading conditions, providing accurate predictions in scenarios where grain orientation and morphology significantly influence mechanical responses. CPFEM has been implemented in the ABAQUS CAE platform, providing valuable insights into the deformation heterogeneity of various engineering polycrystals, including cubic metals (e.g., steel [2], copper [3], and aluminum [4]) as well as hexagonal metals (e.g., titanium [5], magnesium [6], zirconium [7], and zinc [8]). Within individual grains, pronounced deformation heterogeneity can also develop under complex triaxial stress conditions induced by testing methods such as scratch testing and nanoindentation.
Nanoindentation is particularly valuable for probing local mechanical properties, such as hardness and elastic modulus, within nanoscale to microscale volumes [9]. However, extracting detailed plastic deformation characteristics, such as activated slips and twinning, from the recorded load displacement curves remains challenging. CPFEM provides a bridge between experimental measurements and mechanistic interpretation by incorporating prior microstructure-informed constitutive models [10,11]. For example, Casals and Forest [12] use CPFEM to assess slip-induced plastic zone morphology in copper and zinc single crystals subjected to spherical indentation. Casals et al. [13] further apply three-dimensional CPFEM to simulate load displacement behavior and surface morphologies (pile-up and sink-in) in copper, achieving close agreement with experimental observations. Extending beyond slip-dominated responses, Selvarajou et al. [14] extend CPFEM to model both dislocation slips and deformation twinning, successfully replicating the twinning patterns observed in two differently oriented magnesium (Mg). Kweon et al. [15] examine twinning patterns across multiple Mg grain orientations. Sanchez-Martin et al. [16] further explore the size effect on twinning by analyzing a wide range of indentation depths, concluding the necessity of achieving a sufficiently high-stressed volume to activate twinning.
Limited to smaller high-stressed volumes during nanoindentation, slip-dominated responses are often initiated by dislocation nucleation in nearly ideal crystals, typically manifested as “pop-ins” in load displacement curves [17]. Recent advances have enabled CPFEM to capture such events by incorporating evolution laws that describe the nucleation event involving dislocation loops, either informed from molecular dynamics simulations [18] or calibrated against experimental data [19], using ion-irradiated tungsten as a model system. Beyond these “pop-ins”, which arise from diverse nucleation mechanisms governed by different constitutive laws in Mg [20], the subsequent slip-dominated response is predominantely governed by the coordinated activities of multiple slips, e.g., basal, prismatic, and pyramidal slips [1]. Hui et al. [11] recently apply CPFEM to obtain activities of different slips across a few Mg grains. Such information will enhance our understanding of slip-dominated deformation both within individual grains and across polycrystals, and in turn, offer valuable insights into missing or oversimplified physics in existing constitutive models.
In addition, while ABAQUS has strong nonlinear analysis capabilities and highly sophisticated materials models, ANSYS is a more comprehensive finite element (FE) platform with strong multi-physics capabilities and flexible scripting, and thus has broad adoption across industries. In this work, we developed a set of Fortran subroutines to incorporate slip-based crystal plasticity constitutive laws and implemented in ANSYS codes under different loading conditions. Our codes, fully released in [21], are validated with experimental data and previous CPFEM simulation in ABAQUS with the same crystallographic-dependent constitutive laws. The developed CPFEM framework was also applied to simulate slip-dominated nanoindentation responses in Mg, with particular emphasis on the relative activity of multiple slip systems across different grain orientations. It should be noted that twinning is likely suppressed when using a sub-micron indenter, and is, therefore, not considered in the current model.

2. Materials and Methods

2.1. The Development of User-Defined Code

Figure 1 illustrates a CPFEM framework that has been developed during this research. This code incorporates anisotropic elastic deformation, plastic deformation due to propagation of the dislocations, evolution of slip systems, and effects of strain hardening. The code reads the materials’ parameters in one single Fortran file (Usermat, like the user material subroutines available in ABAQUS), which comprises the elastic constants, slip systems, self and latent hardening moduli coefficients, and the initial crystallographic orientations of the materials. The simulation continues in small increments and updates and stores the stress, strain, and slip systems of individual elements under the strain increment defined by the boundary conditions [15,22,23,24]. At each load increment, the code evaluates the material responses of individual elements using constitutive laws [3], calculates the stresses and strains, and updates the crystal status as shown in Figure 1.
The user material subroutine calculates the elastic stiffness matrix for the given elastic constants and orientations [25]. This matrix controls the elastic response of the material based on generalized Hooke’s law [26,27]. The slip systems, represented in the local crystal coordinate system, are then initialized along with their respective critical resolved shear stress (CRSS) and the shear rate of the slip system ( γ ) , where slip direction vectors ( s * ) and slip plane normal ( m * ) are transformed from their coordinates in the crystal frame to the global coordinate system [10]. The Schmid factor ( μ ), quantifying the ease of the slip systems, and spin factor ( ω ), characterizing the increments of lattice rotation, are also incorporated.
At every load increment, the resolved shear stress ( τ ( α ) ) on the slip system α is computed as a function of the present state of stress and the parameters of the pre-set configuration of slip systems. The crystal plasticity flow rule is utilized for deciding whether the plastic slip occurs by checking the condition τ ( α )   τ c α , where τ c α represents the CRSS. If this condition is satisfied, the increment of shear strain Δ γ ( α ) and the total shear strain γ ( α ) in the active slip systems are updated [28]. The strain-hardening matrix is used to calculate the increment of the CRSS τ c α = h Δ γ . The hardening modulus h is also updated with Δ γ according to the model described in [29], with the initial values h 0 and τ c listed in Table 1. As the process goes on, τ c α increases until it reaches a saturation stress τ s , after which there is no increase in it. The Voce exponential strain-hardening model is used for the prismatic and the pyramidal <c + a> slips, whereas the linear model is used for the basal slips. The self- and latent-hardening matrix, where the diagonal components represent the self-hardening coefficients, and off-diagonal components corresponding to the latent-hardening coefficients, ranging between 0.5 and 1.0 [30], are constructed to describe the strain-hardening behavior. The applied hardening matrix coefficients are listed in Table 2. The increment in the slip system normal ( Δ m * ) and directions ( Δ s * ) is calculated to account for the changing crystal orientation owing to elastic-plastic deformation. The stresses are successively updated Δ σ via the elastic stiffness matrix, and the plastic strains in the slip systems. It is also necessary to calculate the material Jacobian matrix Δ σ / Δ ε to maintain stability of the system at each iteration.
This user subroutine is designed to be functional with solid tetrahedral and hexahedral elements generated for FE mesh using MESH200, SOLID185, TARGE170, and CONTA174 elements in the ANSYS (2023R2, Ansys, Inc., Canonsburg, PA, USA) platform. The single hexahedral element is applied for simulating plane-strain compression tests. Tetrahedral elements are more efficient in simulating geometries with curvatures, and, therefore, are chosen for simulating the current cylindrical sample and spherical indenter [31]. Once the mesh is created, the ANSYS program passes an increment of strain to the user subroutine to start its calculation. This increment is calculated by the solver on the basis of the prescribed loading condition.
All parameters, as listed in Table 1 and Table 2, are adopted directly from Graff et al. [30] for Mg single crystals; no re-identification or fitting to the compression data is performed. With this constitutive set held fixed—only numerical solver controls (e.g., time-step and convergence tolerances) adjusted for stability—our ANSYS implementation reproduces the orientation-dependent stress–strain responses reported in the Kelley–Hosford compression experiments and the published ABAQUS CPFEM results of Graff et al. [30].

2.2. The Validation of the User-Defined Code

To evaluate the accuracy of this code in describing the deformation of Mg single crystals, the CPEFM code is firstly validated using experimental data from plane-strain compression tests conducted by Kelley and Hosford [32], as well as CPFEM simulations by Graff et al. [30] under plane-strain die channel conditions as shown in Figure 2. The same parameters as listed in Table 1 and Table 2 are used in both the current simulation and Graff et al.’s simulation using the ABAQUS platform. Three different load conditions are considered, with the load applied parallel, perpendicular, and at 45° to the c-axis (i.e., <0001>Mg).
  • As shown in Figure 2a, when the load is applied parallel to the c-axis, the CPFEM code predicts the onset of plasticity at 104 MPa, closely matching the value (100 MPa) reported by Graff et al. [30]. The stress–strain curve plateaus around 292 MPa, aligning with the scattered Kelley–Hosford experimental results (290–330 MPa) and exhibiting a percentage error of 7.2% compared to Graff’s results. The predicted activities of involved slip systems are consistent with prior studies, showing dominant pyramidal <c + a> slip, with prismatic slips activating at higher strains, as shown in Figure 2b.
  • When the load is applied perpendicular to the c-axis, the stress–strain curve plateaus at approximately 184.2 MPa, agreeing well with the reported 195–200 MPa (Kelley–Hosford experiments) and 205 MPa (Graff et al.), as shown in Figure 2c. It should be noted that prismatic slips are the only activated system as shown in Figure 2d.
  • Figure 2e,f show comparisons when the load is applied at 45° to the c-axis. The simulated stress–strain results closely matched both studies, with basal slip dominating plastic flow at approximately 3.4 MPa. The simulated maximum stress (6.55 MPa) shows a percentage error of 3.8% compared to 6.3 MPa (Graff et al.) and 12% compared to 5.7 MPa (Kelley–Hosford experiments). The discrepancies between simulations with the Kelley–Hosford experiments are likely attributed to the limited data points.
The close coherence between the simulated results of the current code and reported experimental and simulated results demonstrate the accuracy of the current code in capturing slip-dominated deformation behaviors in Mg single crystals while varying load conditions with respect to the crystallographic orientations. Variance in the relative slip system activities, particularly in Figure 2b, is likely influenced by factors such as optimization in the integration schemes, inclusion of friction, or any solver-related parameters. Similar discrepancies in relative slip system activities are reported while simulating the formation behaviors of Mg using other CPFEM–based codes despite using identical conditions and parameters [15,22,33,34].

2.3. Applications of ANSYS Code for Nanoindentation

2.3.1. The Finite Element Mesh

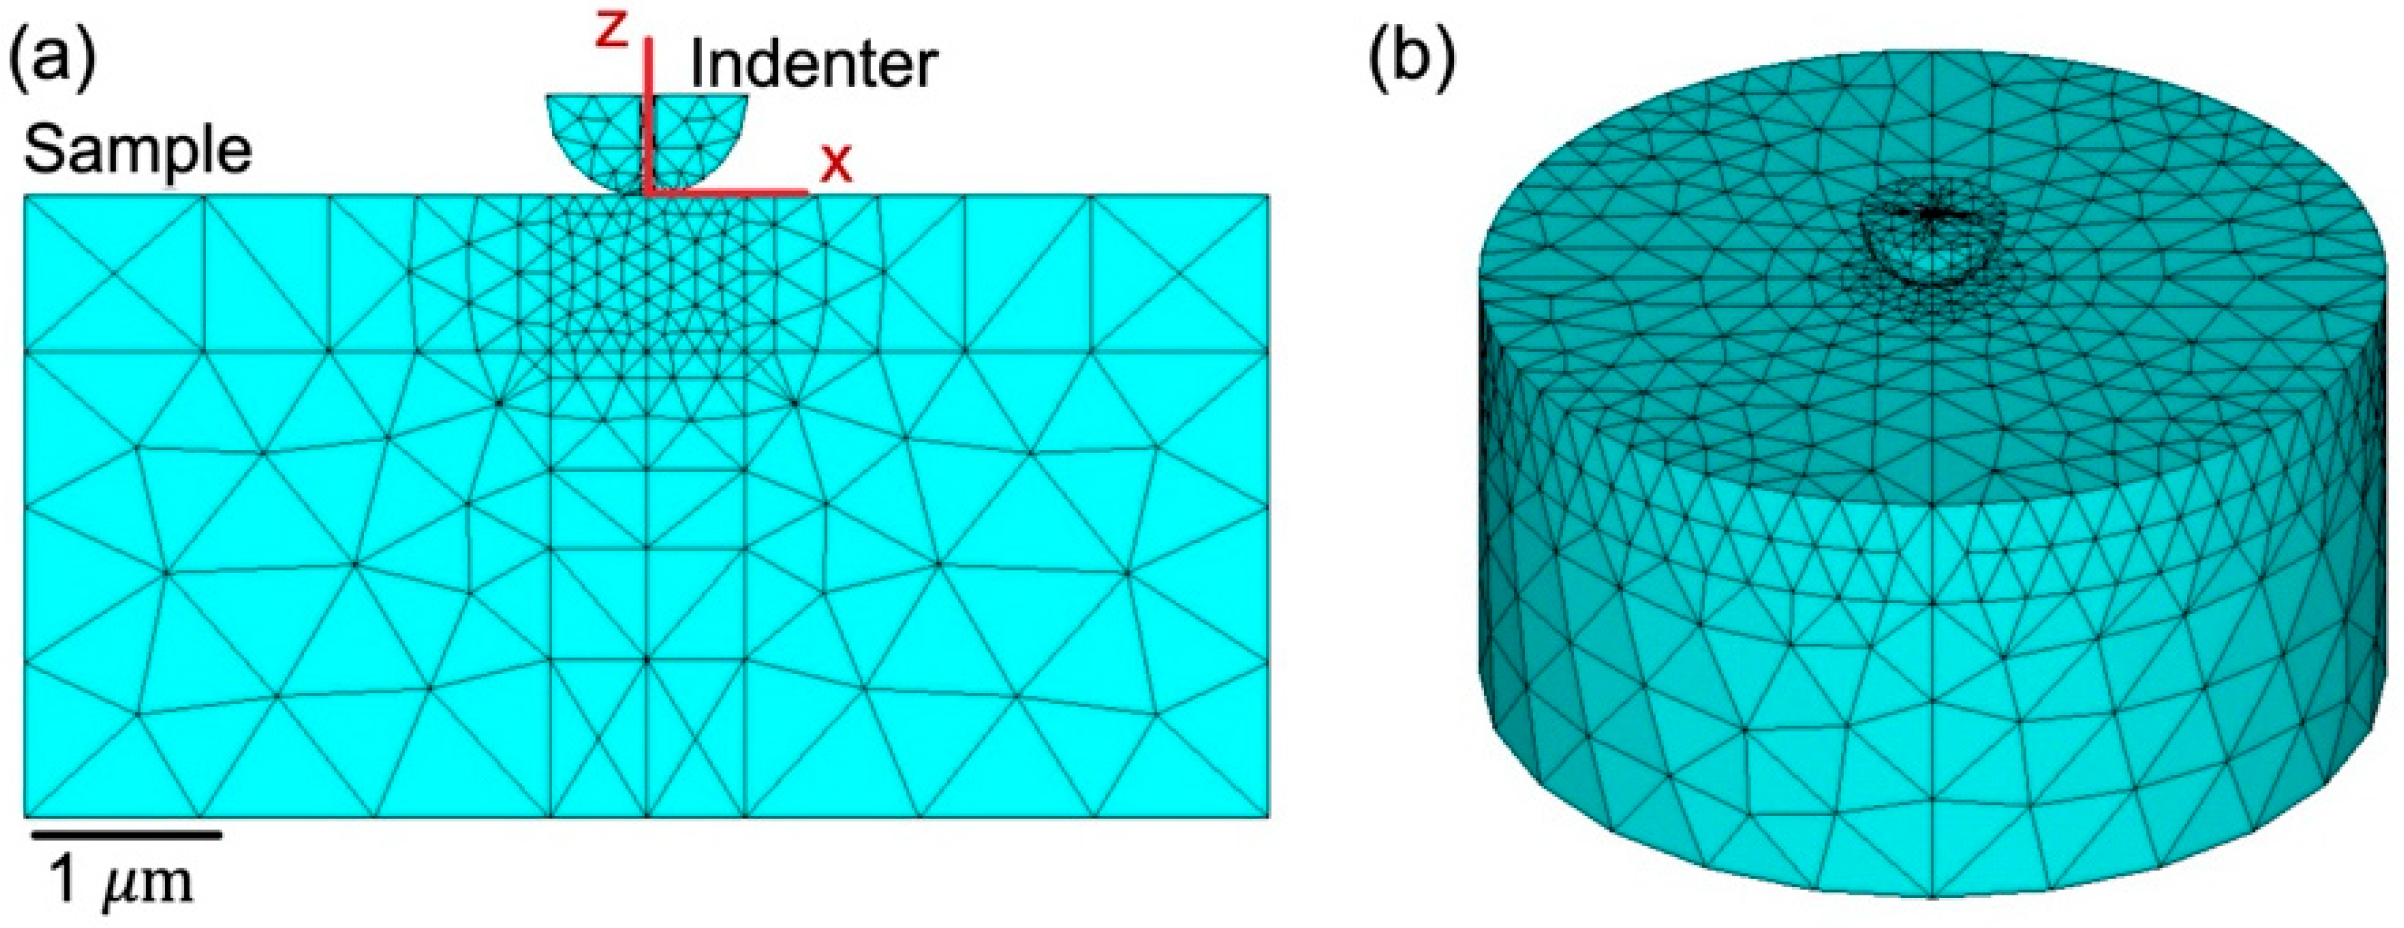
The previously calibrated ANSYS code is applied to simulate nanoindentation behaviors of Mg single crystals with different crystallographic orientations. The same material parameters that were used in the calibration of the subroutine are utilized for the nanoindentation simulation as well. As shown in Figure 3, the geometrical model consists of a spherical indenter and a cylindrical sample. To replicate the experimental conditions in our lab, the indenter, with a radius of 0.65 μm, is modeled as a diamond, which has a Young’s modulus of 1100 GPa and a Poisson’s ratio of 0.3. The tip of this indenter is blunted by 0.1 μm to aid convergence and mimic realistic testing conditions. The sample is modeled as a cylinder with a radius and height of 4 μm, large enough to encompass the indentation stresses and avoid boundary effects. The indentation is simulated to a depth of 10 nm. The simulated grain orientations are taken from experimental measurements as listed in [20].
The model comprises 12,464 tetrahedral elements: 8624 for the sample, and 3840 for the indenter. The size of tetrahedral elements is finer towards the indent region and coarser towards the boundaries. This mesh size is deemed adequate as it was noted that in our mesh convergence studies that greater than 8000 elements for the sample did not cause a significant change in the simulation results for our indentation depth. This agrees with a previous CPFEM study on the nanoindentation of Mg using the ABAQUS platform, suggesting 6000 tetrahedral elements for the sample are sufficient for the simulation results to be independent of the mesh size [16].

2.3.2. Mesh Refinement

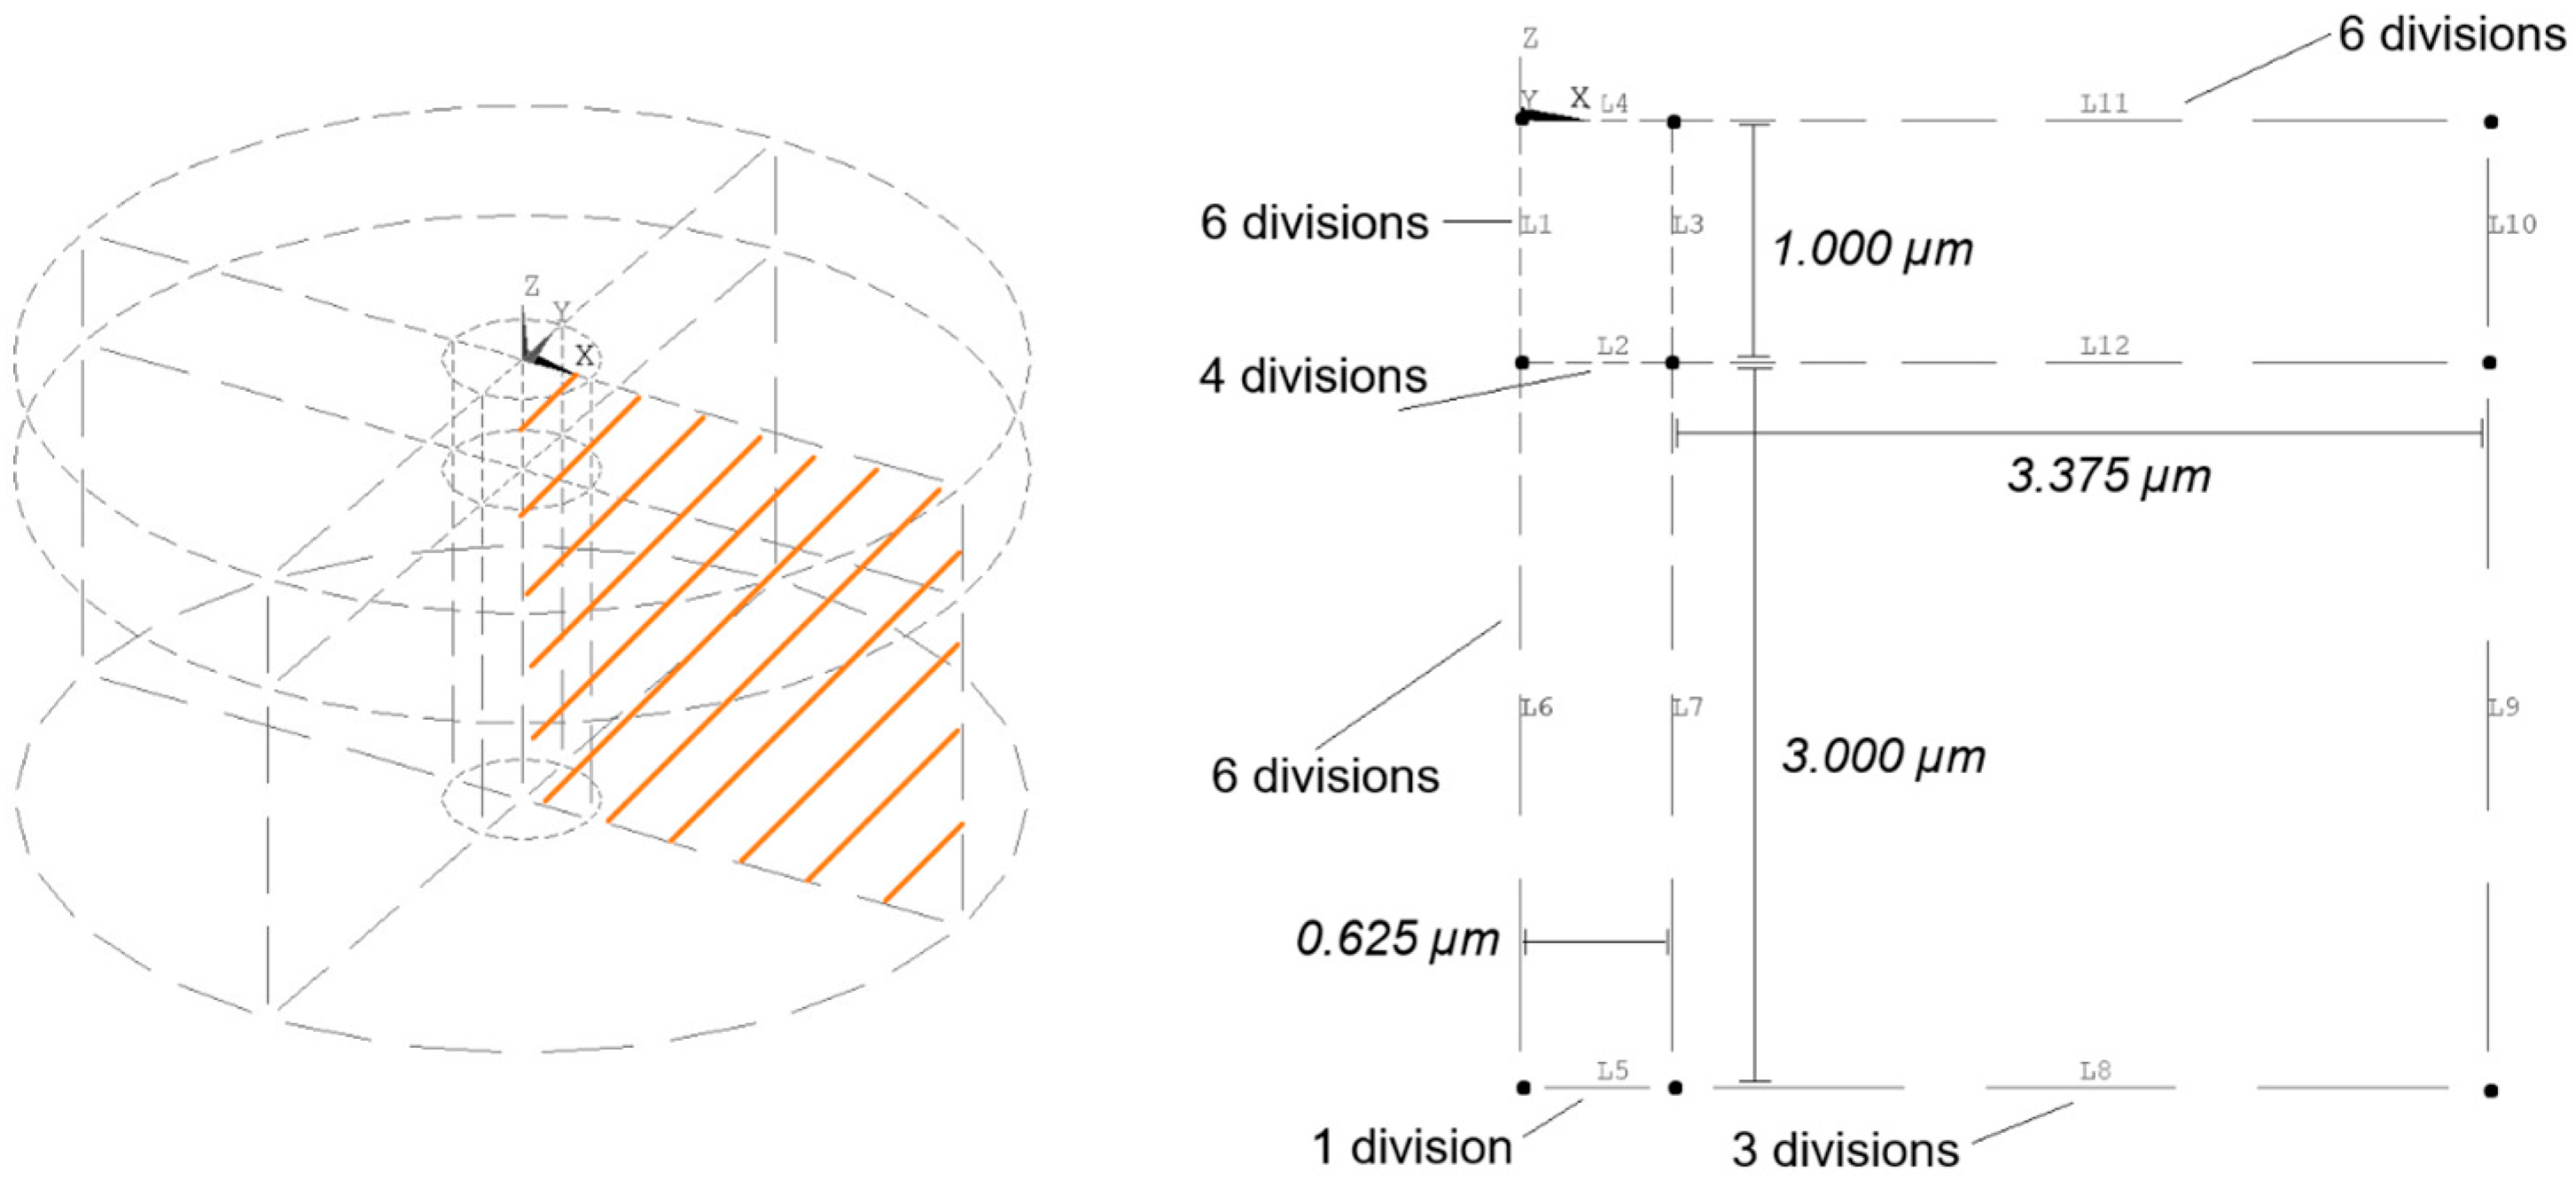
It was expected for the stress concentrations and material deformation to be highest beneath the indenter tip than in other regions. The mesh was designed in such a way that it captures this complex state of stress effectively by having smaller elements near the indent zone and larger in regions away from it. To obtain this mesh, first a two-dimensional sketch was made having 4 segments, each segment having the line divisions as shown in Figure 4. These divisions ensure a smooth transition from one region to another and act as a guide for the mesh tool feature in ANSYS in determining element sizes.

2.3.3. Contact Pair

A surface-to-surface contact model is chosen due to its efficiency in forming contact elements for indentation. CONTA172 elements are created on the curved surface of the indenter while TARGE169 elements are created on the surface undergoing the indentation. The other regions of the sample and the indenter develop stress due to the force applied by the contact surface to the sample surface.
The contact algorithm chosen for this research is the Augmented Lagrangian method. The contact algorithm establishes contact in the form of a virtual spring with a specific stiffness, which is updated with each iteration. This method sets the initial value of the stiffness as 1 and updates it with the iterations, and ensures that it is in coherence with the global stiffness matrix and material behavior [31]. This approach improves the accuracy of the simulation and prevents ill-defined contacts, which may lead to non-convergence. The penetration tolerance is set to 2% in order to have minimal overlapping of the elements. Lastly, the contact mode is frictionless as it has negligible effects on the indentation results.

2.3.4. Boundary Conditions

The nodes at the top flat surfaces of the indenter have all their degrees of freedom (DOF) fixed and are not allowed to move or rotate in the x-, y-, or z-directions. The nodes at the bottom surface of the sample have their DOF constrained in the x- and y-directions and are applied to move in the z-direction.

2.3.5. Load Steps

The simulation consists of 2300 load steps. The indenter gets displaced to a depth of 10 nanometers into the material in the first 2000 steps and is then partially unloaded in the remaining 300 steps. Each load step consists of 500 sub-steps. The choice for such a large number of load steps is made to have a high resolution of the process and capture the response at every state as accurately as possible, and to make sure the onset of plasticity and slip system hardening occurs gradually as the low CRSS of basal slip (1.4 MPa) can cause very large plastic strains when using a relatively larger load step, leading to non-convergence. This entire process of determining the load step is performed using a trial-and-error method in the simulation where the criteria are convergence, accuracy, and an appropriate computational time. The result sets are then used in the post-processing stage to gather data regarding the forces on the sample, and the displacement of the indenter.

2.3.6. Time Stepping

As the constitutive law comprises equations in their rate forms, it makes the time step a key factor in ensuring convergent results. The time step is 0.01 ms. The automatic time-stepping feature is turned off as it repeatedly led to unconvergent results and large inaccuracies in the results. It is noteworthy that an appropriate time-step value is crucial for the solver’s convergence and integration; however, the rate equation itself for Mg is not affected by the value as much due to its sensitivity exponent (m = 50).

2.3.7. Post-Processing

The equivalent plastic strain, load displacement data, and shear strain in each slip system are extracted to analyze the detailed deformation. The plastic strains are viewed for the 2000th load step, where the indentation depth is at maximum, and compared with the available experimental morphology using the PLESOL function. The slip system activities, represented by induced shear strains of this slip system ( γ ( α ) ), for each element are visualized by generating contour plots using the ETABLE and PLETAB functions on the top of the indented sample, as well as the mid cross-sections to get an insight into the plastic zones on the indented surface as well as regions beneath it.

3. Results and Discussion

3.1. Nanoindentation Behavior While Indented Along C-Axis

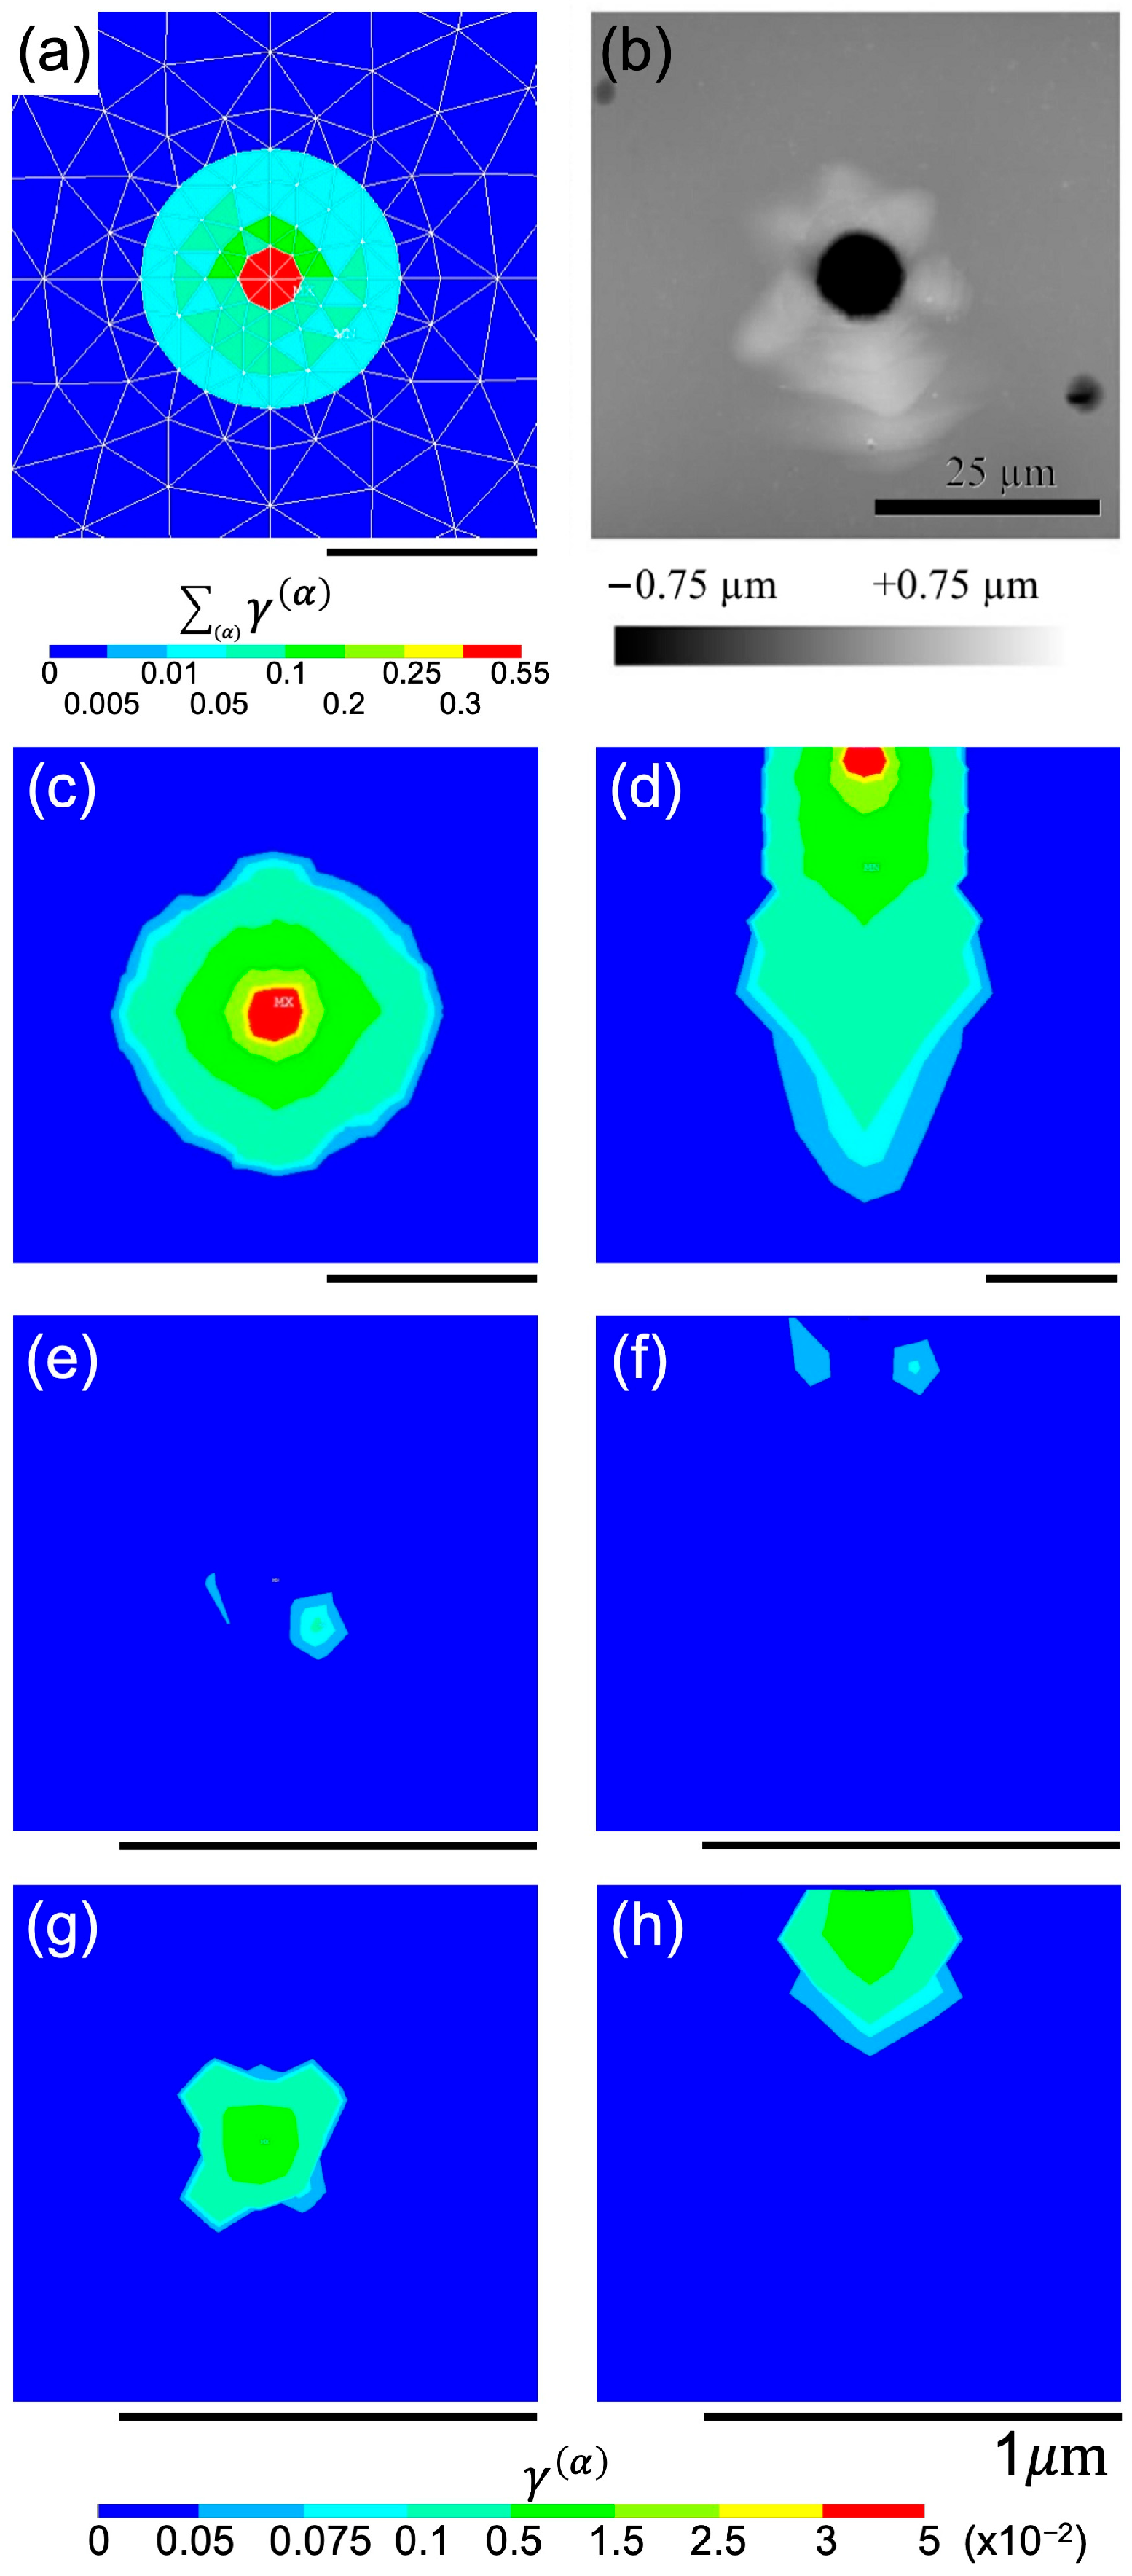
The plastic strains induced by slip system activation are non-recoverable as shown in Figure 5a. The simulated plastic strain distribution closely matches the nearly six-fold symmetric surface pattern observed in an Mg grain with a 6.9° inclination between the loading axis and the c-axis [18] as illustrated in Figure 5b. It is important to note that twinning, which is not included in the current code, may significantly contribute to the experimental pattern while also preserving a similar six-fold symmetry under c-axis indentation. The simulated plastic strain field extends radially, closely resembling the observed experimental pattern. Despite significant differences in indentation depths between the simulation and experiment (demonstrated as the difference in the scale bars in Figure 5a,b), the shape and distribution of plastic flow remain consistent at all depths.
Figure 5c–h demonstrate that basal slips exhibit the highest activity, while prismatic and pyramidal <c + a> slips are much less active. This aligns with the experimental characterization of slip system activation at the early stages of indentation reported by Catoor et al. [17], where basal slips are found to dominate in <c>-axis indentations. Although the indentation Schmid factor (ISF = 0.205) for basal slips, indicating the ease of slip activation, is low for <c>-axis indentation, the low CRSS of basal slips, of 1.4 MPa, facilitates its activation. Pyramidal <c + a> slip exhibits noticeable activity, particularly in regions directly beneath the indenter and near the c-axis, with a maximum activity of 0.011, approximately 20% of the basal slip activity. While the pyramidal slip is favorable for <c>-axis indentation, with a high ISF of 0.315, its overall activity remains limited due to the high CRSS of 20 MPa [14,17]. Prismatic slip has the lowest activity, contributing a maximum activity of 0.0011, due to its low ISF of 0.040 and high CRSS of 40 MPa. Furthermore, slip-induced strains gradually extend into regions away from the <c>-axis, consistent with observations by Catoor et al. [17].

3.2. Nanoindentation Behavior While Indented Along A-Axis

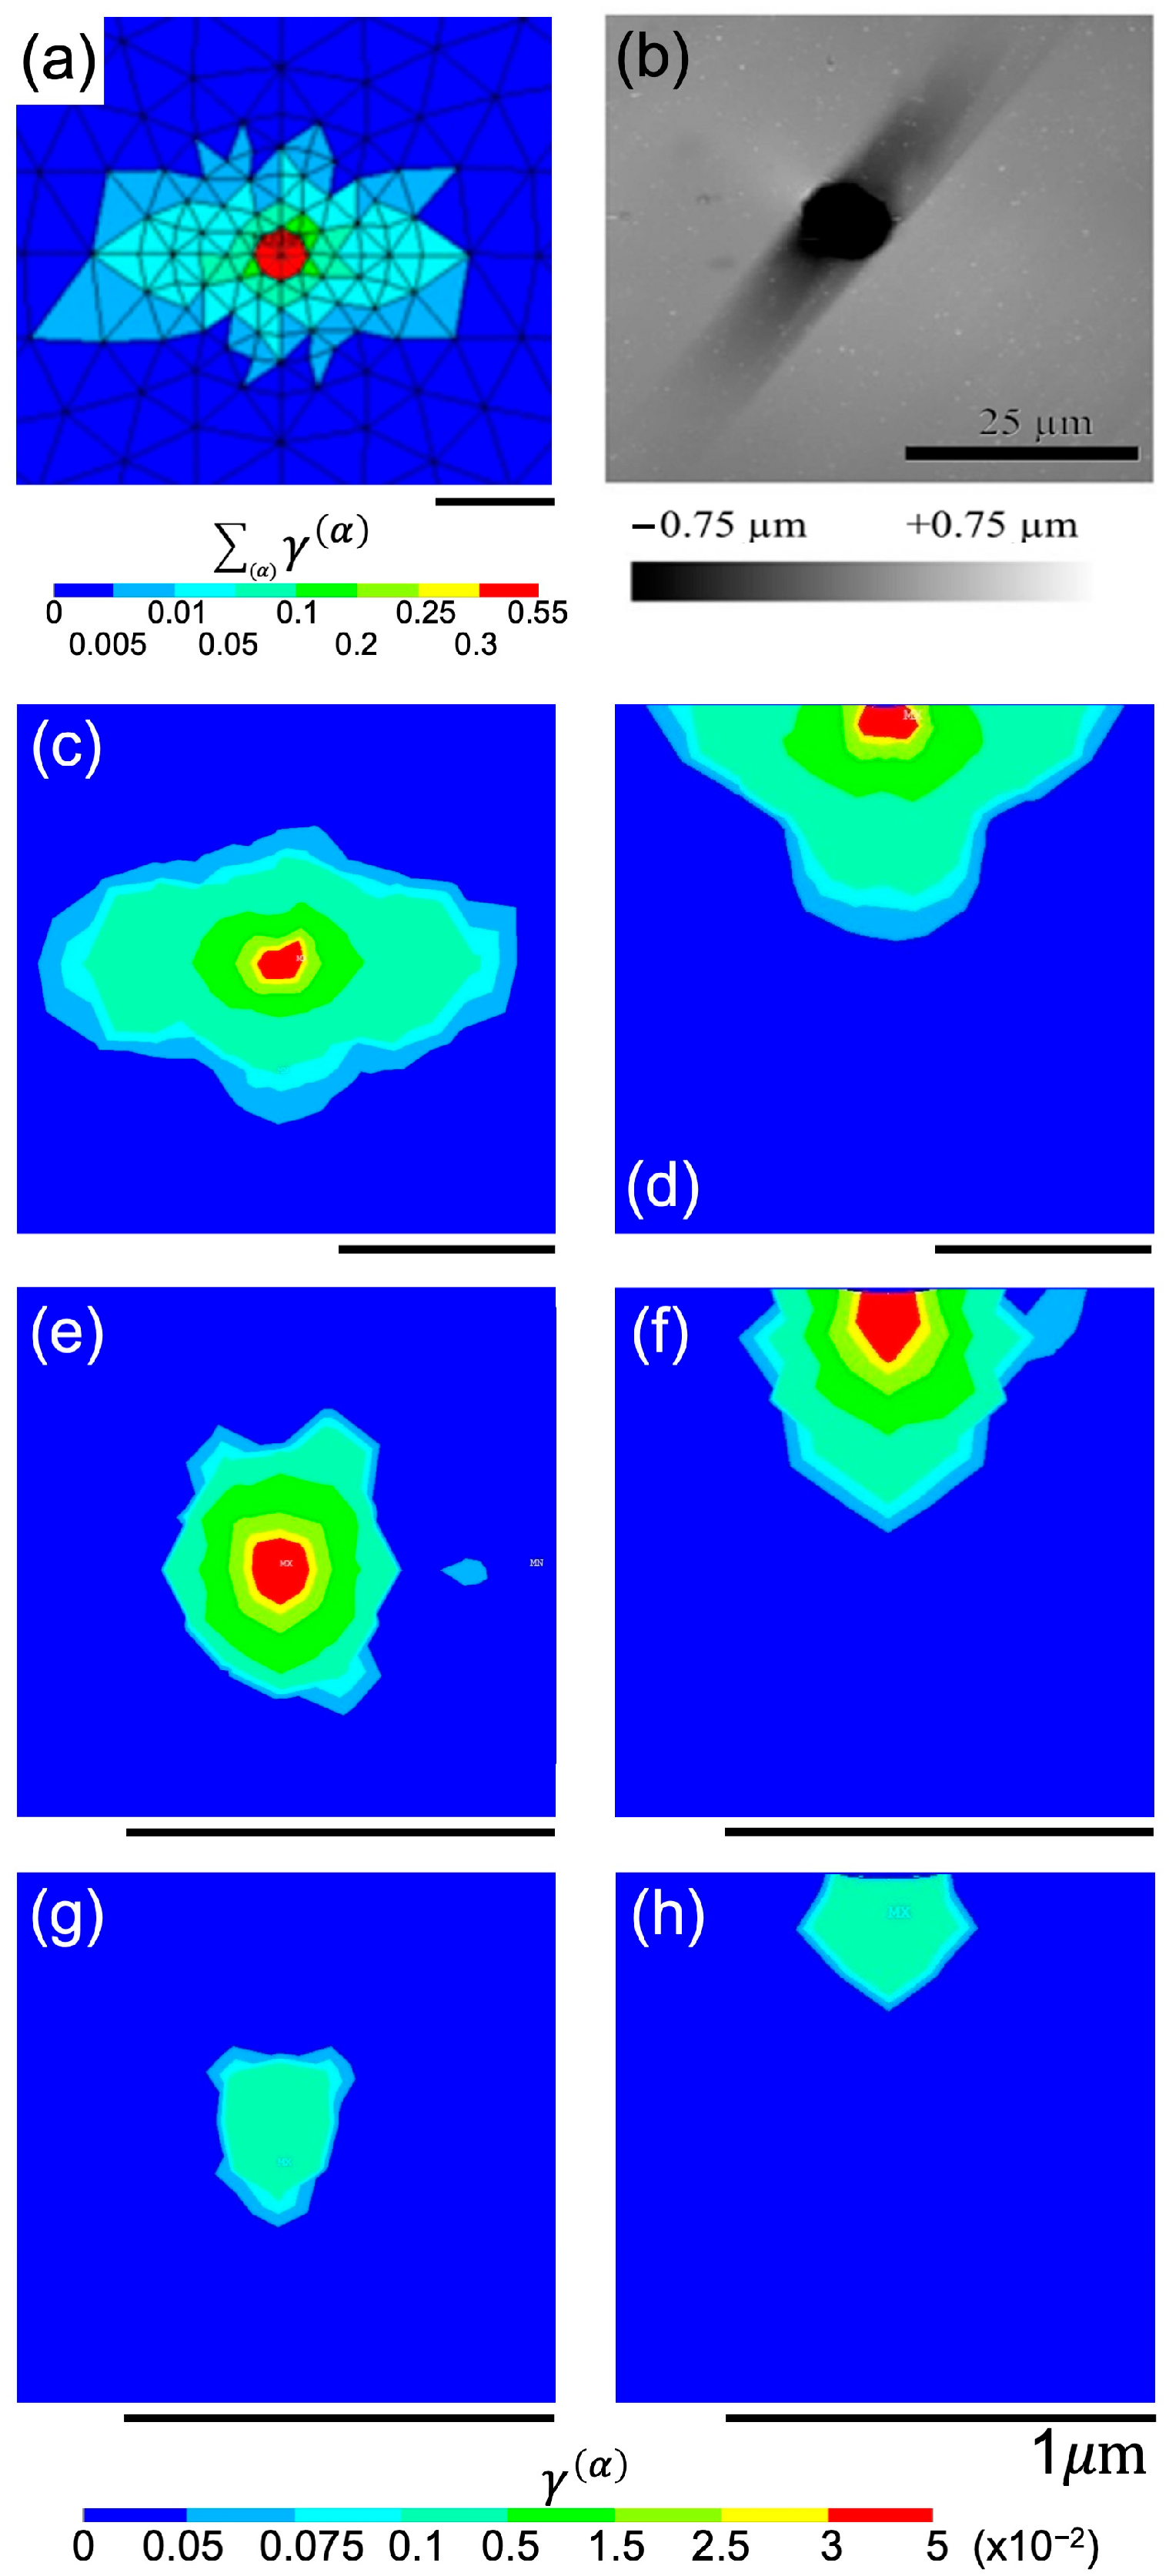
Figure 6a,b compare the simulated results with the experimental pattern of a grain with an inclination angle of 82°, close to the <a>-axis. The deformation is concentrated at the center and extends outwards in a straight manner in contrast to the radial behavior observed in 4.1. It is worth noting that similar patterns are experimentally observed up to 300 °C, with twinning proposed as one of the main contributors for these patterns. The simulated slip-dominated strain distribution exhibits a similar pattern, spreading outward in the same straight manner, indicating qualitative agreement with the experimental observations in Figure 6b.
Basal slip system activity for <a>-axis nanoindentation is shown in Figure 6c,d. Basal slip activity is highest near the indent axis, reaching approximately 0.046, and spread along one direction, i.e., the y-axis. Prismatic slip shows higher activity compared to the previous case in 3.2, with a peak value of ~0.047 as shown in Figure 6e,f. Unlike basal slips, which are more elongated along the y-axis, prismatic slips are distributed in a relatively uniform circular pattern. As shown in Figure 6g,h, the pyramidal <c + a> slip shows significantly lower activity than the other two, with a maximum value of approximate 0.0042 near the indenter tip, about 9% of the corresponding activities of basal and prismatic slips. It should be noted that the ISFs for basal, prismatic, and pyramidal <c + a> slips are 0.180, 0.295, and 0.262, respectively. Although ISFs are defined as the shear stress applied to specific slip systems relative to the applied stress, ISFs cannot directly represent slip activities due to the complex local stress stresses underneath the indenter, making the FE simulation necessary.

3.3. Slip System Activities Across Different Grains

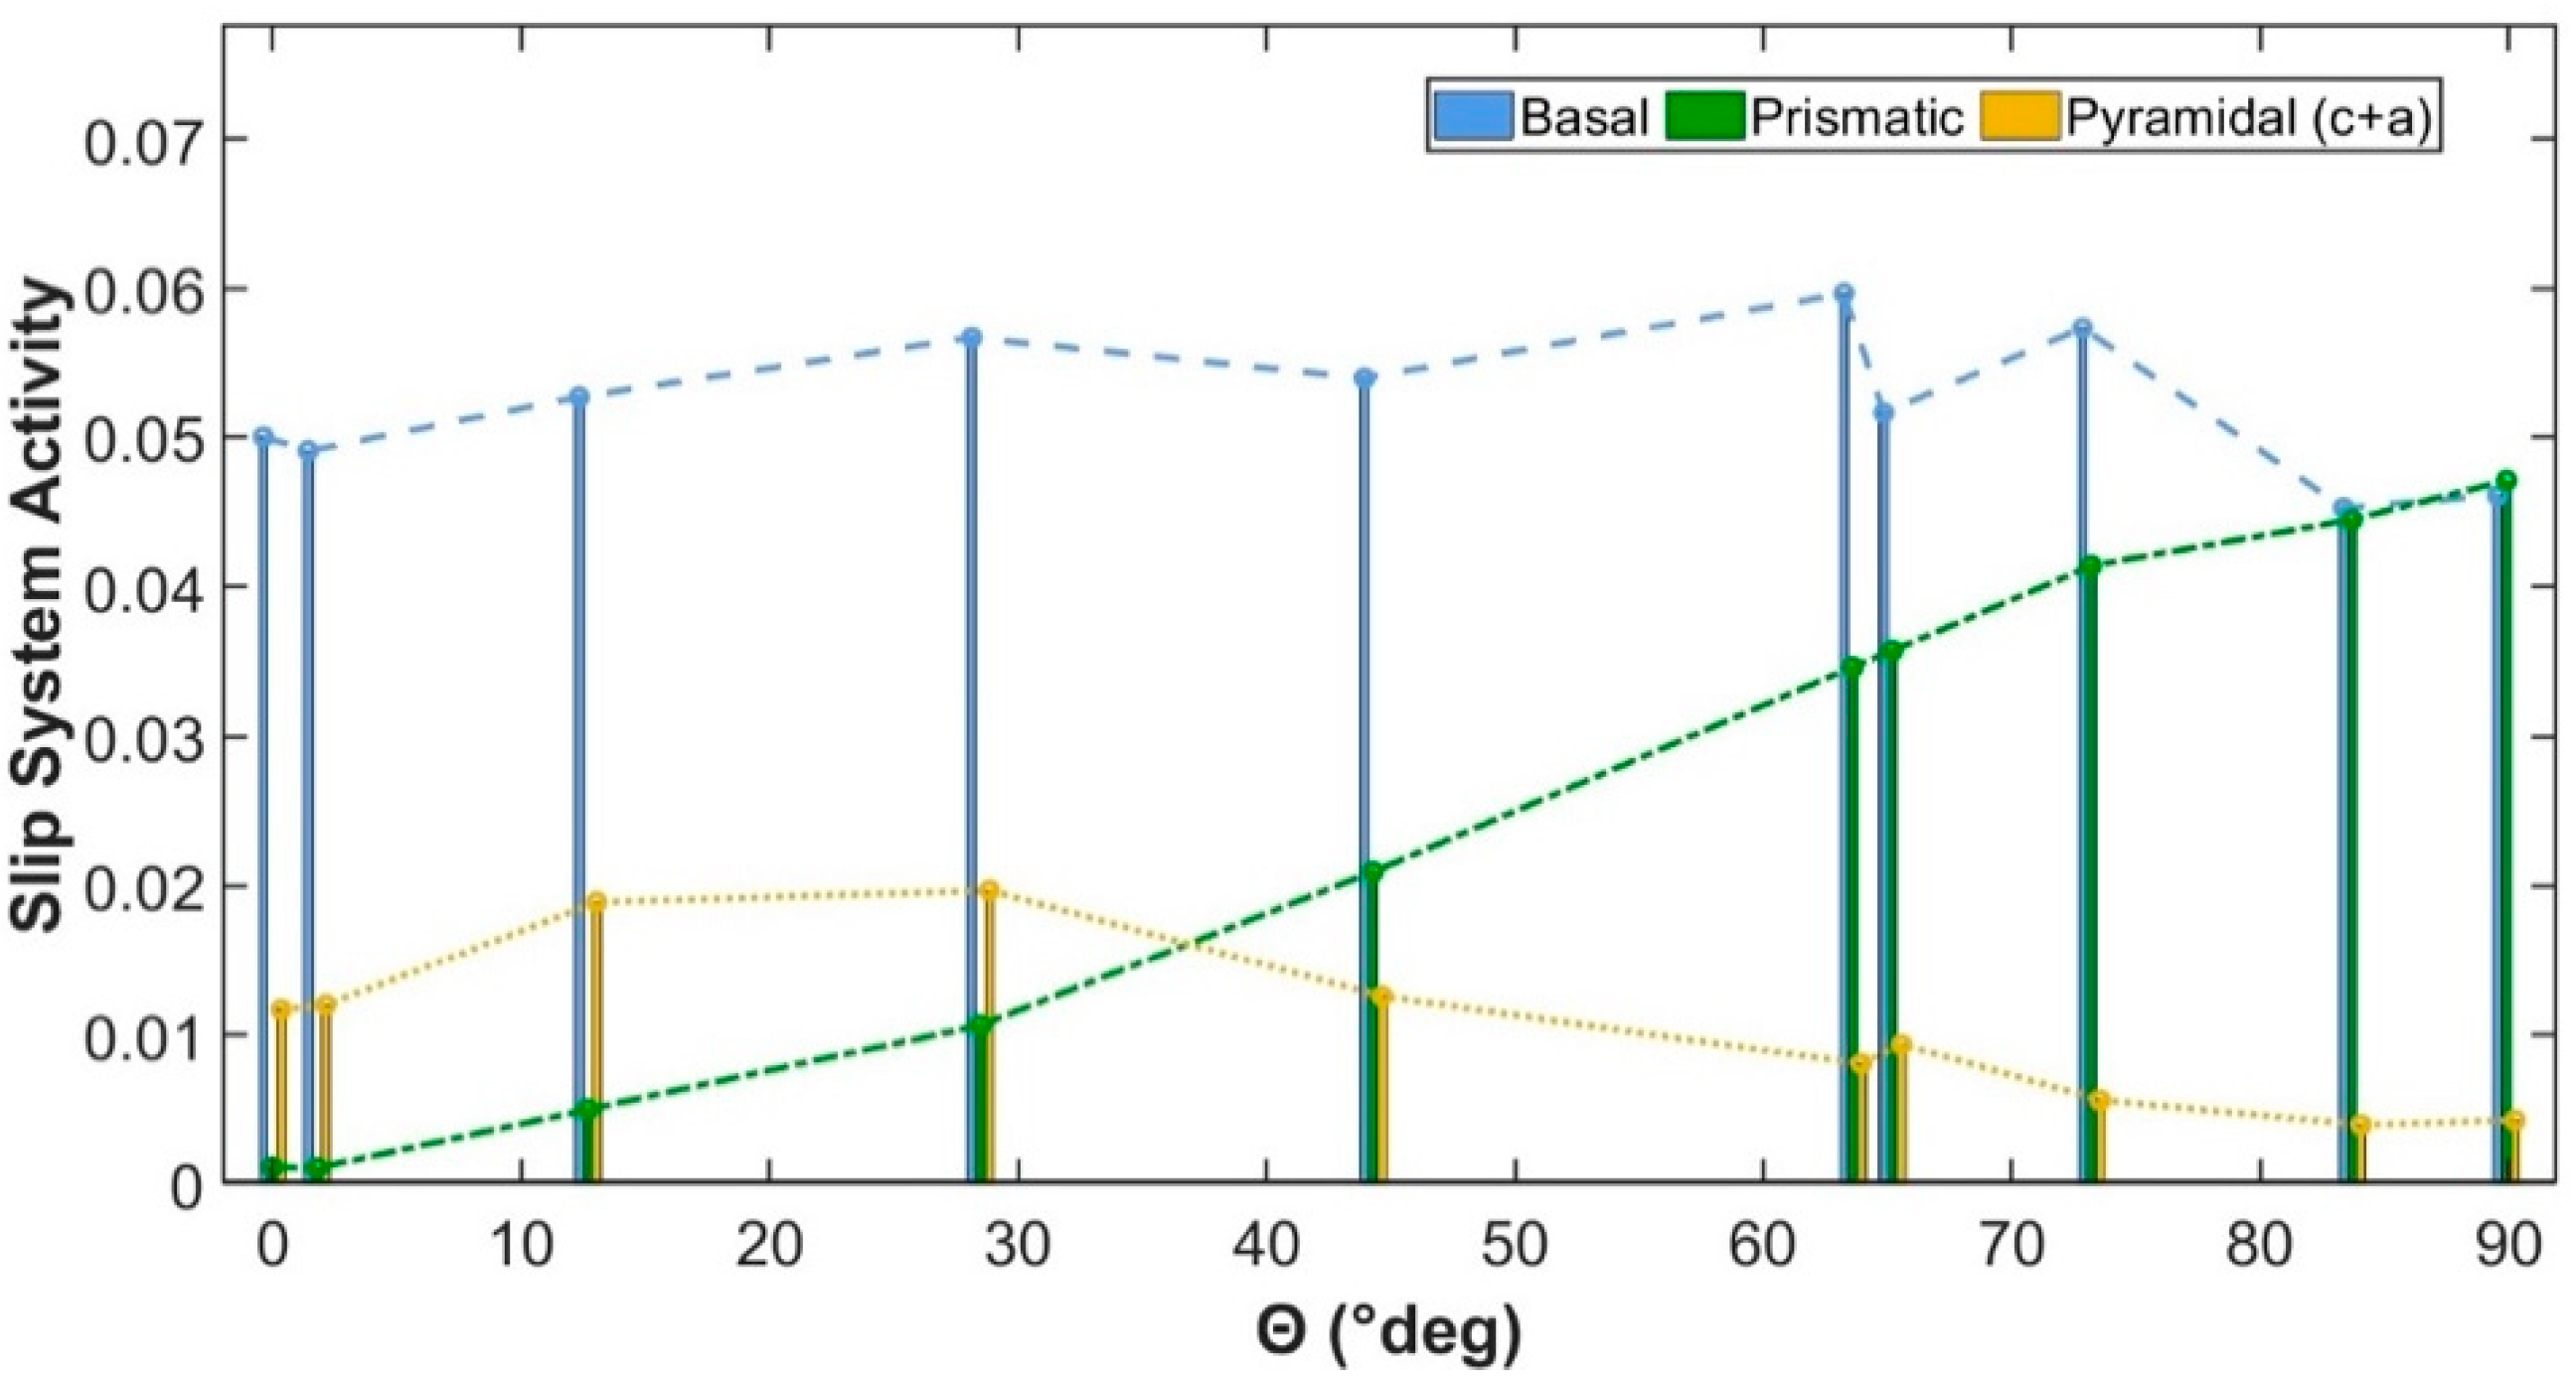
Figure 7 compares slip system activities across several simulated grain orientations. The activities of different slips, including basal, prismatic, and pyramidal, are presented with respect to the inclination angle of the c-axis, which is defined as θ and controlled overall behavior [17].
Basal slip activities remain consistently high across all orientations, with θ ranging from 0° to 90°. The maximum cumulative shear strain induced by basal slips is lowest when θ is close to 90° (0.046) and highest at an inclination angle of 63.6° in grain G9 (0.06). These variations indicate the orientation dependence of basal slips under complex multi-axial local stress states. The simulated trend of significant basal slips across all grains shows a fair agreement with a recent report [11], which employes CPFEM codes in the ABAQUS platform for nanoindentation under a Berkovich indenter. Since much closer CRSS values of different slips (e.g., 40 MPa for basal, 65 MPa for prismatic, and 90 MPa for pyramidal <a + c> slips) are applied in the report, basal slips have more pronounced decreasing trends with increasing θ .
A prominent trend is observed in the activities of the prismatic <a> and pyramidal <c + a> slips. The prismatic slip shows the lowest activity near 0° (~0.003) and highest activity near 90° (0.0471). In contrast, the pyramidal <c + a> slips have relatively lower activity compared to the prismatic and basal slips across all orientations, suggesting much less contribution to the plastic flow. Its activities are highest at ~30° (~0.019) and lowest near 90°.

4. Conclusions

In this work, we develop and validate the CPFEM codes of slip-dominated deformation in Mg on the ANSYS platform. The codes accurately reproduce the mechanical behaviors for Mg as demonstrated by comparisons with experimental compression tests. Using the codes, orientation-dependent nanoindentation responses accurately reproduced the experimental pattern. Basal slips dominate across all orientations while prismatic and pyramidal <c + a> slip activities vary with the inclination angle of the c-axis. In detail, prismatic slips increase with the inclination angle, whereas pyramidal slips decrease. These findings provide quantitative insight into the anisotropic plasticity in Mg at small scales, offering predictive capability for tailoring mechanical performance. It should be noted that twinning is not considered in the presented simulation. Our codes are released in a recent thesis and are available upon request.

Author Contributions

Conceptualization, Y.L. and G.-z.Z.; Investigation, S.T.K.; Formal analysis, S.T.K. and M.I.F.; Writing—original draft preparation, S.T.K.; Writing—review and editing, Y.L. and G.-z.Z.; All authors have read and agreed to the published version of the manuscript.

Funding

We gratefully acknowledge the financial support of NSERC Discovery Grant (RGPIN-2019-05882) and Canada Research Chair program (CRC-2021-00512).

Conflicts of Interest

The authors declare no conflict of interest.

References

  1. Roters, F.; Eisenlohr, P.; Hantcherli, L.; Tjahjanto, D.D.; Bieler, T.R.; Raabe, D. Overview of constitutive laws, kinematics, homogenization and multiscale methods in crystal plasticity finite-element modeling: Theory, experiments, applications. Acta Mater. 2010, 1152, 58–1211. [Google Scholar] [CrossRef]
  2. Tasan, C.C.; Hoefnagels, J.M.; Diehl, M.; Yan, D.; Roters, F.; Raabe, D. Strain localization and damage in dual phase steels investigated by coupled in-situ deformation experiments and crystal plasticity simulations. Int. J. Plast. 2014, 63, 198–210. [Google Scholar] [CrossRef]
  3. Huang, Y. A User-Material Subroutine Incroporating Single Crystal Plasticity in the ABAQUS Finite Element Program; Harvard University: Cambridge, UK, 1991. [Google Scholar]
  4. Wu, Y.; Shen, Y.; Chen, K.; Yu, Y.; He, G. Multi-scale crystal plasticity finite element method (CPFEM) simulations for shear band development in aluminum alloys. J. Alloys Compd. 2017, 711, 495–505. [Google Scholar] [CrossRef]
  5. Asim, U.B.; Siddiq, M.A.; Kartal, M.E. A CPFEM based study to understand the void growth in high strength dual-phase titanium alloy (Ti-10V-2Fe-3Al). Int. J. Plast. 2019, 122, 188–211. [Google Scholar] [CrossRef]
  6. Iftikhar, C.M.A.; Li, Y.L.; Kohar, C.; Inal, K.; Khan, A.S. Evolution of subsequent yield surfaces with plastic deformation along proportional and non-proportional loading paths on annealed AA6061 alloy: Experiments and crystal plasticity finite element modeling. Int. J. Plast. 2021, 1029, 14356. [Google Scholar] [CrossRef]
  7. Patra, A.; Chaudhary, S.; Pai, N.; Ramgopal, T.; Khandelwal, S.; Rao, A.; McDowell, D.L. ρ-CP: Open source dislocation density based crystal plasticity framework for simulating temperature-and strain rate-dependent deformation. Comput. Mater. Sci. 2023, 224, 112182. [Google Scholar] [CrossRef]
  8. Nguyen, T.N.; Abbès, F.; Lecomte, J.-S.; Schuman, C.; Abbès, B. Inverse identification of single-crystal plasticity parameters of HCP zinc from nanoindentation curves and residual topographies. Nanomaterials 2022, 12, 300. [Google Scholar] [CrossRef]
  9. Kainer, K.U. Magnesium—Alloys and Technologies; WILEY-VCH GmbH & Co. KGaA: Weinheim, Germany, 2003. [Google Scholar]
  10. Liu, M.; Lu, C.; Tieu, K.A.; Zhou, K. Crystal plasticity FEM study of nanoindentation behaviors of Cu bicrystals and Cu–Al bicrystals. J. Mater. Res. 2015, 2485, 30–2499. [Google Scholar] [CrossRef]
  11. Su, H.; Wang, J.; Liu, C.; Yan, C.; Tian, G.; Yang, Z.; Xue, C.; Yang, X.; Li, Q.; Li, X.; et al. Orientation dependence of intracrystalline and grain boundary deformation behavior in Mg-2Y using nanoindentation and CPFEM. J. Alloys Compd. 2024, 994, 174688. [Google Scholar] [CrossRef]
  12. Casals, O.; Forest, S. Finite element crystal plasticity analysis of spherical indentation in bulk single crystals and coatings. Comput. Mater. Sci. 2009, 45, 774–782. [Google Scholar] [CrossRef]
  13. Casals, O.; Očenášek, J.; Alcala, J. Crystal plasticity finite element simulations of pyramidal indentation in copper single crystals. Acta Mater. 2007, 55, 55–68. [Google Scholar] [CrossRef]
  14. Selvarajou, B.; Shin, J.; Ha, T.; Choi, I.; Joshi, S.; Han, H. Orientation-dependent indentation response of magnesium single crystals: Modeling and experiments. Acta Mater. 2014, 81, 358–376. [Google Scholar] [CrossRef]
  15. Kweon, S.; Raja, D.S. A study on the mechanical response of magnesium using an anisotropic elasticity twinning CP FEM. Arch. Appl. Mech. 2021, 4239, 91–4261. [Google Scholar] [CrossRef]
  16. Martin, R.S. Micromechanics of Magnesium and Its Alloys Studied by Nanoindentation. Ph.D. Thesis, Universidad Carlos III de Madrid, Madrid, Spain, 2016. [Google Scholar]
  17. Catoor, D.; Gao, Y.; Geng, J.; Prasad, M.; Herbert, E.; Kumar, K.; Pharr, G.; George, E. Incipient plasticity and deformation mechanisms in single-crystal Mg during spherical nanoindentation. Acta Mater. 2013, 61, 2953–2965. [Google Scholar] [CrossRef]
  18. Lin, P.-D.; Nie, J.-F.; Lu, Y.-P.; Shi, C.-X.; Cui, S.-G.; Cui, W.-D.; He, L. Atomic irradiation defects induced hardening model in irradiated tungsten based on molecular dynamics and CPFEM. Int. J. Plast. 2024, 174, 103895. [Google Scholar] [CrossRef]
  19. Xiao, X.; Li, S.; Yu, L. Effect of irradiation damage and indenter radius on pop-in and indentation stress-strain relations: Crystal plasticity finite element simulation. Int. J. Mech. Sci. 2021, 199, 106430. [Google Scholar] [CrossRef]
  20. Foumani, M.I.; Khursheed, S.T.; Liu, Y.; Zhu, G. Orientation-dependence of Incipient Plasticity in a Coarse-grained Mg Revealed by Nanoindentation Pop-ins. J. Magnes. Alloy 2025, 13, 2554–2564. [Google Scholar] [CrossRef]
  21. Khursheed, S.T. Simulation of the Nanoindentation Response in Single-Crystal Magnesium Using Crystal-Plasticity Finite Element Methods. Master’s Thesis, University of Manitoba, Winnipeg, MB, Canada, 2024. [Google Scholar]
  22. Xi, B.; Fang, G. Crystal plasticity behavior of single-crystal pure magnesium under plane-strain compression. Rare Met. 2017, 36, 541–549. [Google Scholar] [CrossRef]
  23. Zhang, J.; Du, S.; Ding, S. Crystal plasticity finite element modeling of twin band formation and evolution together with the macroscale mechanical responses of hexagonal metals. Mater. Sci. Eng. A 2022, 855, 143856. [Google Scholar] [CrossRef]
  24. Taylor, G.I. Plastic strain in metals. J. Inst. Met. 1938, 62, 307–324. [Google Scholar]
  25. Long, T.R.; Smith, C.S. Single-crystal elastic constants of magnesium and magnesium alloys. Acta Metall. 1957, 5, 200–207. [Google Scholar] [CrossRef]
  26. Hooke, R. Lectures de Potentia Restitutiva, or of Spring Explaining the Power of Springing Bodies; John Martyn: Thomastown, Ireland, 2016. [Google Scholar]
  27. Itin, Y. Cauchy relations in linear elasticity: Algebraic and physics aspects. J. Elast. 2023, 156, 39–77. [Google Scholar] [CrossRef]
  28. Hill, R. Generalized constitutive relations for incremental deformation of metal crystals by multislip. J. Mech. Phys. Solids 1966, 14, 95–102. [Google Scholar] [CrossRef]
  29. Agnew, S.R.; Yoo, M.H.; Tomé, C. Application of Texture Simulation to Understanding Mechanical Behavior of Mg and Solid Solution Alloys Containing Li or Y. Acta Mater. 2001, 49, 4277–4289. [Google Scholar] [CrossRef]
  30. Graff, S.; Brocks, W.; Steglich, D. Yielding of magnesium: From single crystal to polycrystalline aggregates. Int. J. Plast. 2007, 23, 1957–1978. [Google Scholar] [CrossRef]
  31. Ansys® Mechanical APDL, Release 2023 R2, Help System. In Element Reference; Ansys, Inc.: Canonsburg, PA, USA, 2023.
  32. Kelley, E.W.; Hosford, W. Plane-strain compression of magnesium and magnesium alloy crystals. Trans. Met. Soc. AIME 1968, 242, 5–13. [Google Scholar]
  33. Zhang, J.; Joshi, S. Phenomenological crystal plasticity modeling and detailed micromechanical investigations of pure magnesium. J. Mech. Phys. Solids 2012, 60, 945–972. [Google Scholar] [CrossRef]
  34. Gan, Y.; Song, W.; Ning, J.; Tang, H.; Mao, X. An elastic–viscoplastic crystal plasticity modeling and strain hardening for plane strain deformation of pure magnesium. Mech. Mater. 2016, 92, 185–197. [Google Scholar] [CrossRef]
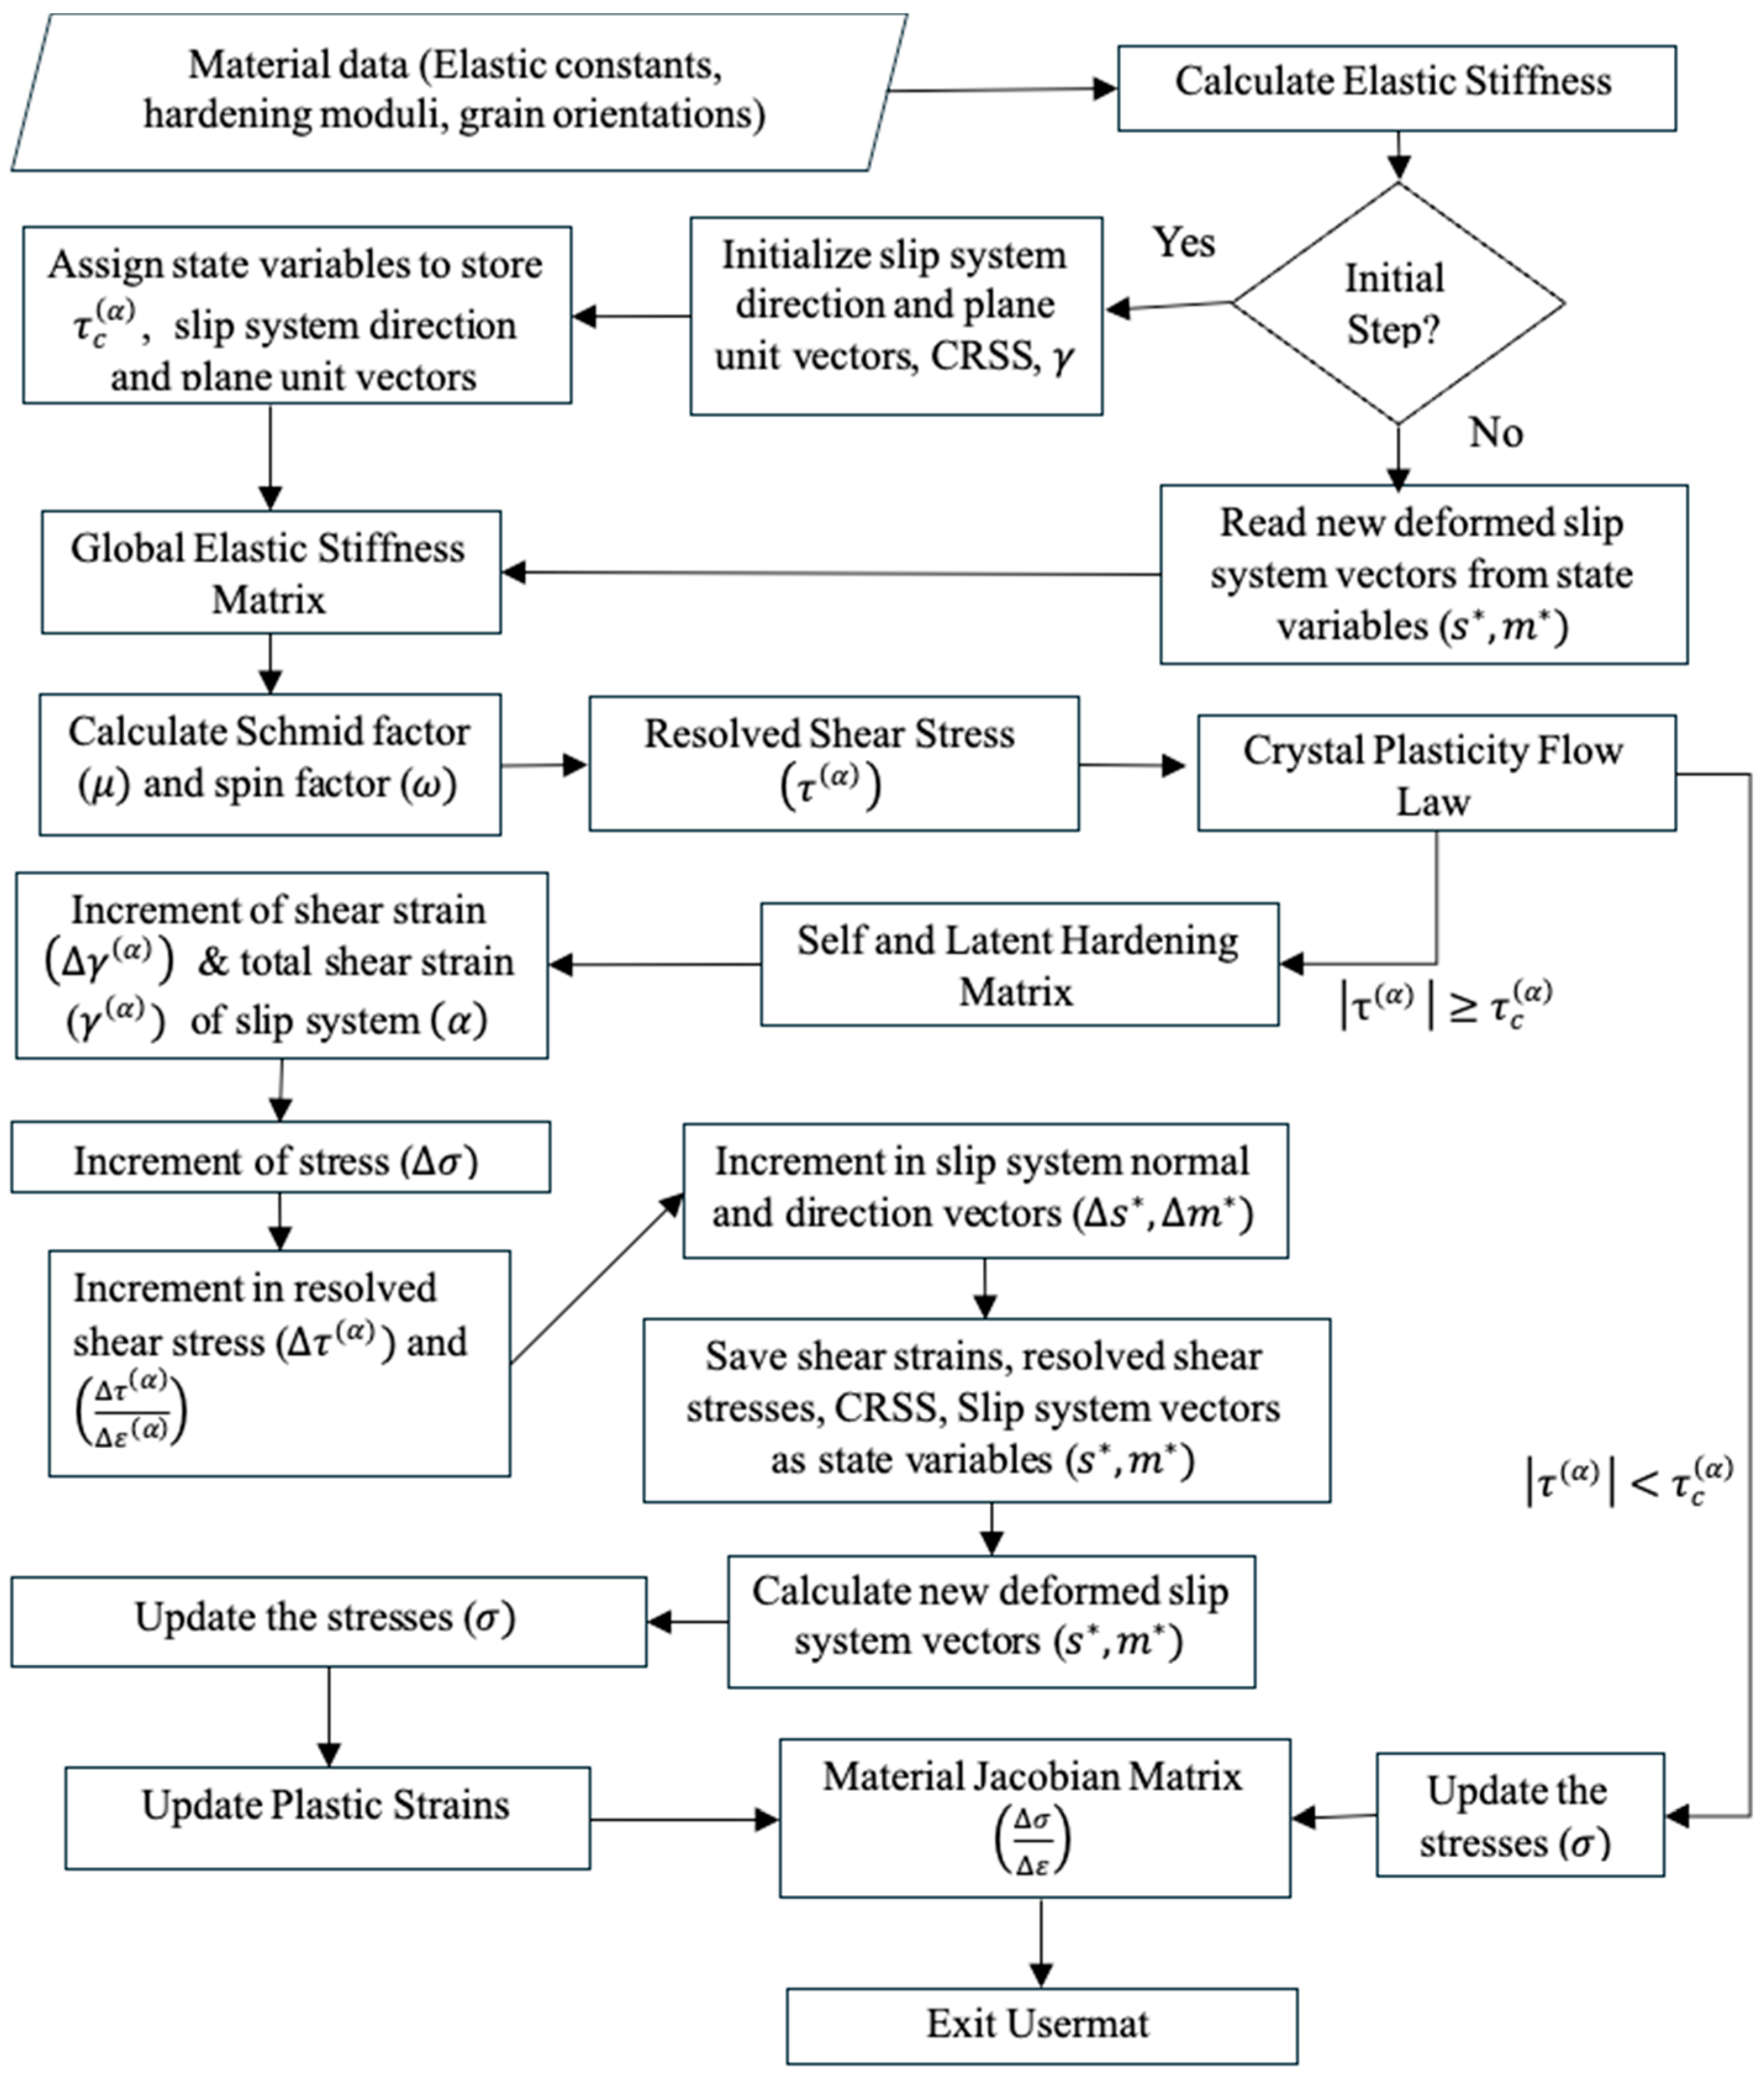
Figure 1. Flowchart of the CPFEM model. Starting by taking inputs from the user regarding the material data, calculating the elastic response using Hooke’s law, checking for plastic flow using the crystal plasticity constitutive law, and calculating the stresses.
Inventions 10 00077 g001
Figure 2. Stress–strain responses of plane-strain compression tests when the load is applied (a,b) parallel, (c,d) perpendicular, and (e,f) at 45° to the c-axis (i.e., <0001>Mg). In (a,c,e), the simulated responses from the current CPFEM (in blue) are compared with the Kelley–Hosford (K-H) experiment (purple), and Graff et. al’s simulation [30] (red). The loading directions are indicated with respect to the Mg lattice, where the solid blue circles represent Mg atoms. Under each load condition, the activities of corresponding slip systems are also compared with Graff et al.’s work [30] as shown in (b,d,f).
Inventions 10 00077 g002
Figure 3. Schematic of the meshed nanoindentation model consisting of a hemispherical indenter and cylindrical sample; 12,464 elements. (a,b) are the cross-sectional view (along y-axis) and isometric view, respectively.
Inventions 10 00077 g003
Figure 4. (left) A 3D map of the element size divisions throughout the sample. (right) A 2D sketch of the highlighted segment showing line divisions in the area rotated to create the cylindrical sample.
Inventions 10 00077 g004
Figure 5. Response of c-axis indentation. (a) The plastic strains observed on the indented sample surface (x–y plane), with the color bar representing the magnitude of plastic strains. (b) Top view of the experimental pattern of the indented sample close to c-axis indentation [16]; (c,d) are the top view (x–y plane) and cross-section view (x–z plane) of the basal slip activity, respectively. (e,f) are the top view (x–y plane) and cross-section view (x–z plane) of the prismatic slip activity, respectively. (g,h) are the top view (x–y plane) and cross-section view (x–z plane) of the pyramidal <c + a> slip activity, respectively. Except for (b), the scale bars are 1 micron for (a,ch). The color bar at the bottom represents the magnitude of slip system activity in (ch).
Inventions 10 00077 g005
Figure 6. Response of a-axis indentation. (a) The plastic strains observed on the indented sample surface (x–y plane), with the color bar representing the magnitude of plastic strains. (b) Top view of the experimental pattern of the indented sample close to <a>-axis indentation [16]; (c,d) are the top view (x–y plane) and cross-section view (x–z plane) of the basal slip activity, respectively. (e,f) are the top view (x–y plane) and cross-section view (x–z plane) of the prismatic slip activity, respectively. (g,h) are the top view (x–y plane) and cross-section view (x–z plane) of the pyramidal <c + a> slip activity, respectively. Except for (b), the scale bars are 1 micron for (a,ch). The color bar at the bottom represents the magnitude of slip system activity in (ch).
Inventions 10 00077 g006
Figure 7. Slip system activity trend across orientations.
Inventions 10 00077 g007
Table 1. Key parameters used in Mg for selected slip systems.
QuantityBasal (0001)<2 1 ¯ 1 ¯ 0>Prismatic  {01 1 ¯ 0}<2 1 ¯ 1 ¯ 0>Pyramidal <c + a> { 2 ¯ 112}<2 1 ¯ 1 ¯ 3>
h 0 (MPa)1075007500
τ s (MPa)-150260
τ c (MPa)1.42040
Table 2. Self- (diagonal) and latent (off-diagonal)-hardening parameters used for selected slip systems.
Basal (0001)<2 1 ¯ 1 ¯ 0>Prismatic  {01 1 ¯ 0}<2 1 ¯ 1 ¯ 0>Pyramidal <c + a> { 2 ¯ 112}<2 1 ¯ 1 ¯ 3>
Basal (0001)<2 1 ¯ 1 ¯ 0>1.01.01.0
Prismatic {01 1 ¯ 0}<2 1 ¯ 1 ¯ 0>0.50.50.5
Pyramidal <c + a> { 2 ¯ 112}<2 1 ¯ 1 ¯ 3>1.01.00.2
Disclaimer/Publisher’s Note: The statements, opinions and data contained in all publications are solely those of the individual author(s) and contributor(s) and not of MDPI and/or the editor(s). MDPI and/or the editor(s) disclaim responsibility for any injury to people or property resulting from any ideas, methods, instructions or products referred to in the content.