1. Introduction
The DISA Type 55D41 is a compact calibration wind tunnel specifically developed to generate a well-characterized, low-turbulence airflow for the calibration of hot-wire and hot-film anemometry probes. Believed to have been introduced in the 1960s [
1], this installation was part of a broader initiative by DISA’s Electronics Department to advance precise flow measurement instrumentation—an effort that would later continue under the Dantec Dynamics© brand [
2].
The 55D41 system comprises a streamlined duct featuring a converging nozzle, a constant-diameter test section, and an airflow controlled by an electric fan (typically paired with the 55D42 motor control module). Static pressure ports located upstream and at the throat of the nozzle enable accurate velocity estimation via differential pressure measurements, interpreted using Bernoulli’s principle under subsonic, steady-state conditions.
Owing to its mechanical simplicity, high flow stability, and adaptability, the 55D41 became a widely adopted laboratory tool for the calibration and validation of both directional and non-directional flow probes. Its modular design also supports modifications, making it a versatile platform for small-scale flow diagnostics.
Numerous research papers from the 1970s onward document the use of Constant Temperature Anemometry (CTA) HW (hot-wire) probes calibrated with the DYSA/DISA facility. For instance, Sen [
3] investigated the air-jet bulking process of filament yarns, initially employing DISA 55A25 miniature hot-wire probes. Due to their fragility and frequent breakage, these were replaced with hot-film (HF) probes. The study was ultimately completed using a DISA 55A83 probe, which offered enhanced mechanical durability and improved protection of the sensing element. Interestingly, although a calibration facility was available, Sen’s paper describes a custom calibration procedure tailored to the specific HW and HF probes employed.
Hardwick [
4] provides another example, presenting a study on free convection wakes above an isothermal vertical plate. This work combined DISA hot-wire probes with laser holographic interferometry to acquire detailed velocity and temperature profiles in the wake region.
A further study referencing the DISA calibration system, while adapting it to investigate low-velocity flow behavior, is that of Christman and Podzimek [
5]. In their work, the response of HW probes was examined at airspeeds below 0.1 m/s. To achieve such low and controlled velocities, airflow was generated by draining water at a controlled rate from an airtight tank connected to the calibration nozzle housing the HW probe. Through vertical flow measurements, the authors quantified the effect of natural convection on the probe signal. Moreover, their analysis of the calibration curve enabled the indirect determination of the temperature jump distance, offering insights into probe behavior in thermally stratified environments.
With various adaptations, the DISA 55D41 has proven effective for ultra-low-speed applications. This capability was reaffirmed by Aydin and Leutheusser [
6] in 1980 and Tsanis [
7] in 1987, who explored very low-velocity calibration techniques and the application of hot-wires. In this context, a Couette flow configuration was used to calibrate a hot-film probe at velocities between 0.1 and 0.5 m/s.
These case study reports form part of a broader series issued by DISA—and later by Dantec—that continue to be cited in contemporary research. For example, Özkan (2016) [
8], in his study of boundary layer transition over rotating disks, refers to these earlier reports as exemplars of commercially available low-speed flow calibration systems. Rona and Soueid (2010) [
9] explicitly state that their velocity calibration curve was obtained using a DISA Type 55D41 system (serial #136) to validate boundary-layer trips in a low-Reynolds environment, while Albertyn (2018) [
10] presents a more recent study on exhaust-gas flow-meter calibration, utilizing the DISA Type 55D41 installation to calibrate a venturi tube, demonstrating its applicability beyond traditional hot-wire use.
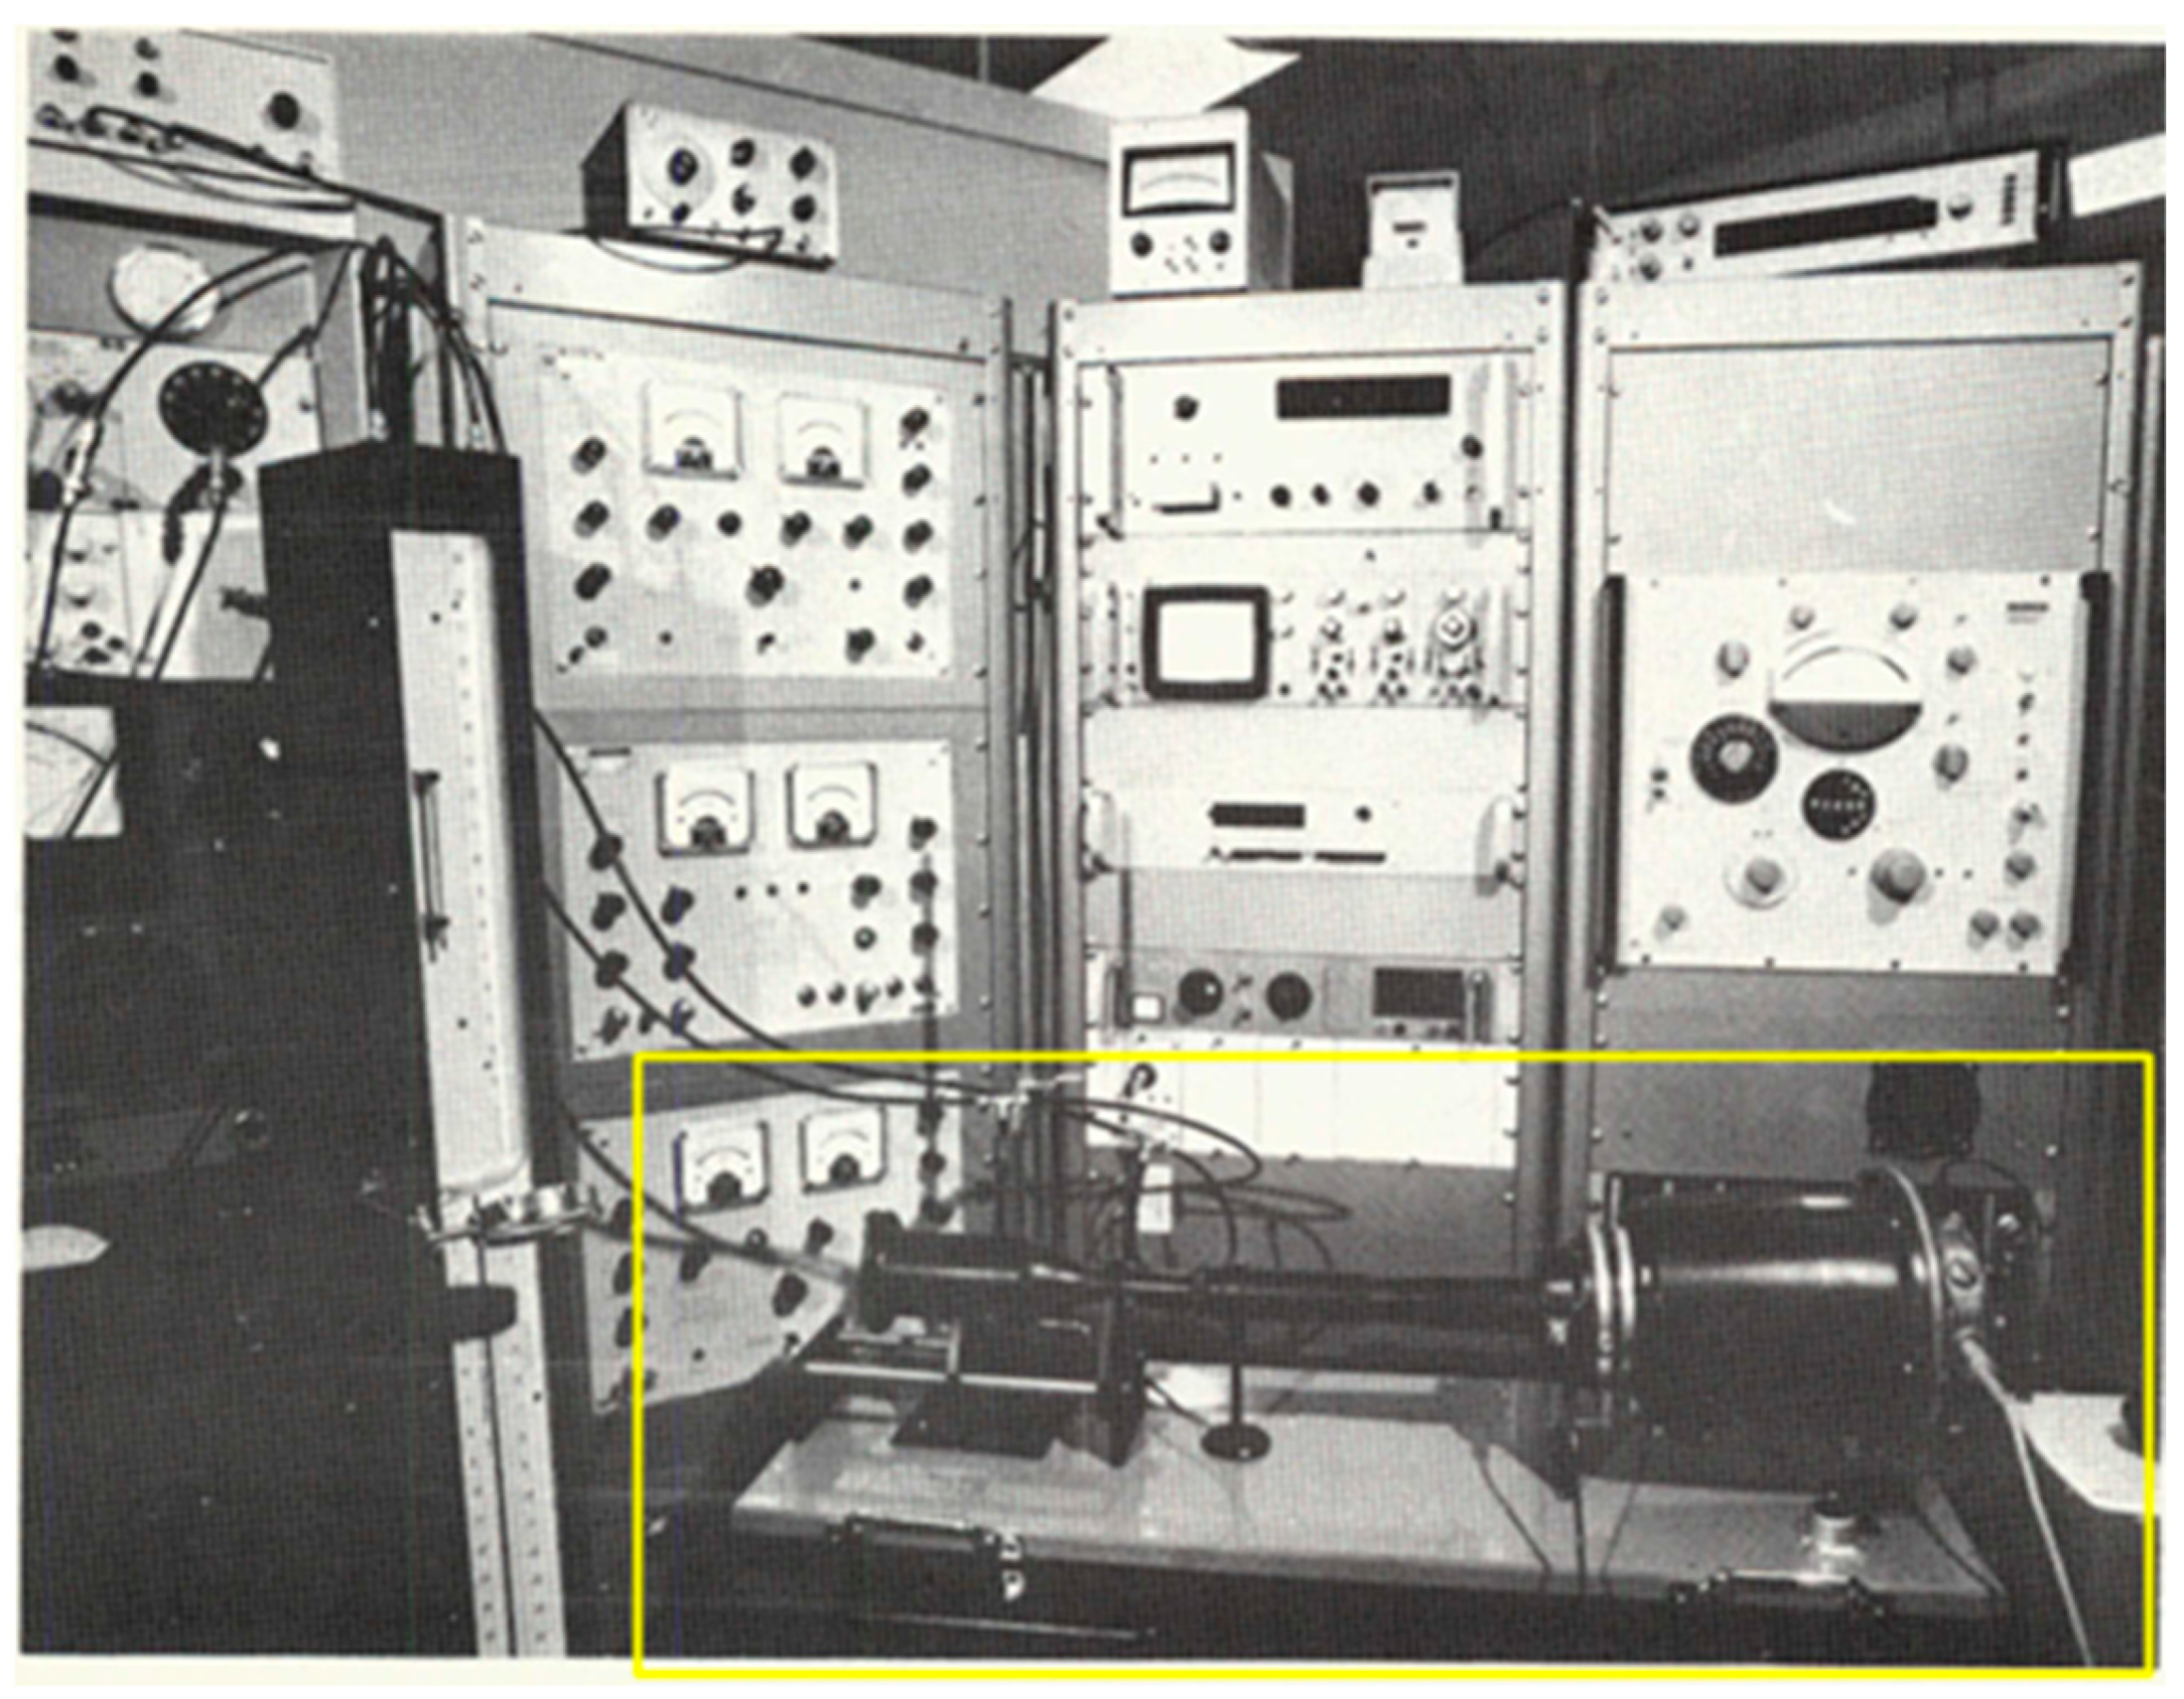
The first image of the system was presented by [
11] and is depicted in
Figure 1, to the best knowledge of the authors, referencing the aerodynamic tunnel as the calibration installation for the hot-wires used for analyzing the open-loop amplification of a Reynolds number dependent process through wave distortion. The paper presents an image of the installation, illustrated below.
Despite the frequent citations of the installation and its accompanying user manual, the original technical documentation of the DISA 55D41 unit appears to be lost or otherwise inaccessible, as confirmed by the present authors. Consequently, the primary reference used during the reconversion and analysis of the unit was the printed calibration graph affixed to the system itself, which served as a vital guide during the restoration process.
2. Technical Background
The DISA Type 55D41 is an open-circuit, suction-type, low-speed calibration wind tunnel specifically engineered for high-precision flow metrology. Its aerodynamic design and operating principle are optimized for the steady, subsonic calibration of point velocity probes, such as hot-wire and hot-film anemometers.
The blow-down (suction-driven), open-return wind tunnel has air drawn through the test section by a downstream fan and expelled into the room. This configuration presents multiple advantages for small-scale, table-top experiments, allowing for natural convection to be minimized. The airflow is controlled manually, through a switch, which changes the speed of the electric fan, operated via the DISA 55D42 control unit (an electric motor power supply). The present configuration has two different speed stages and offers the possibility of opening a discharge cover, located in front of the fan.
The initial configuration can be observed in
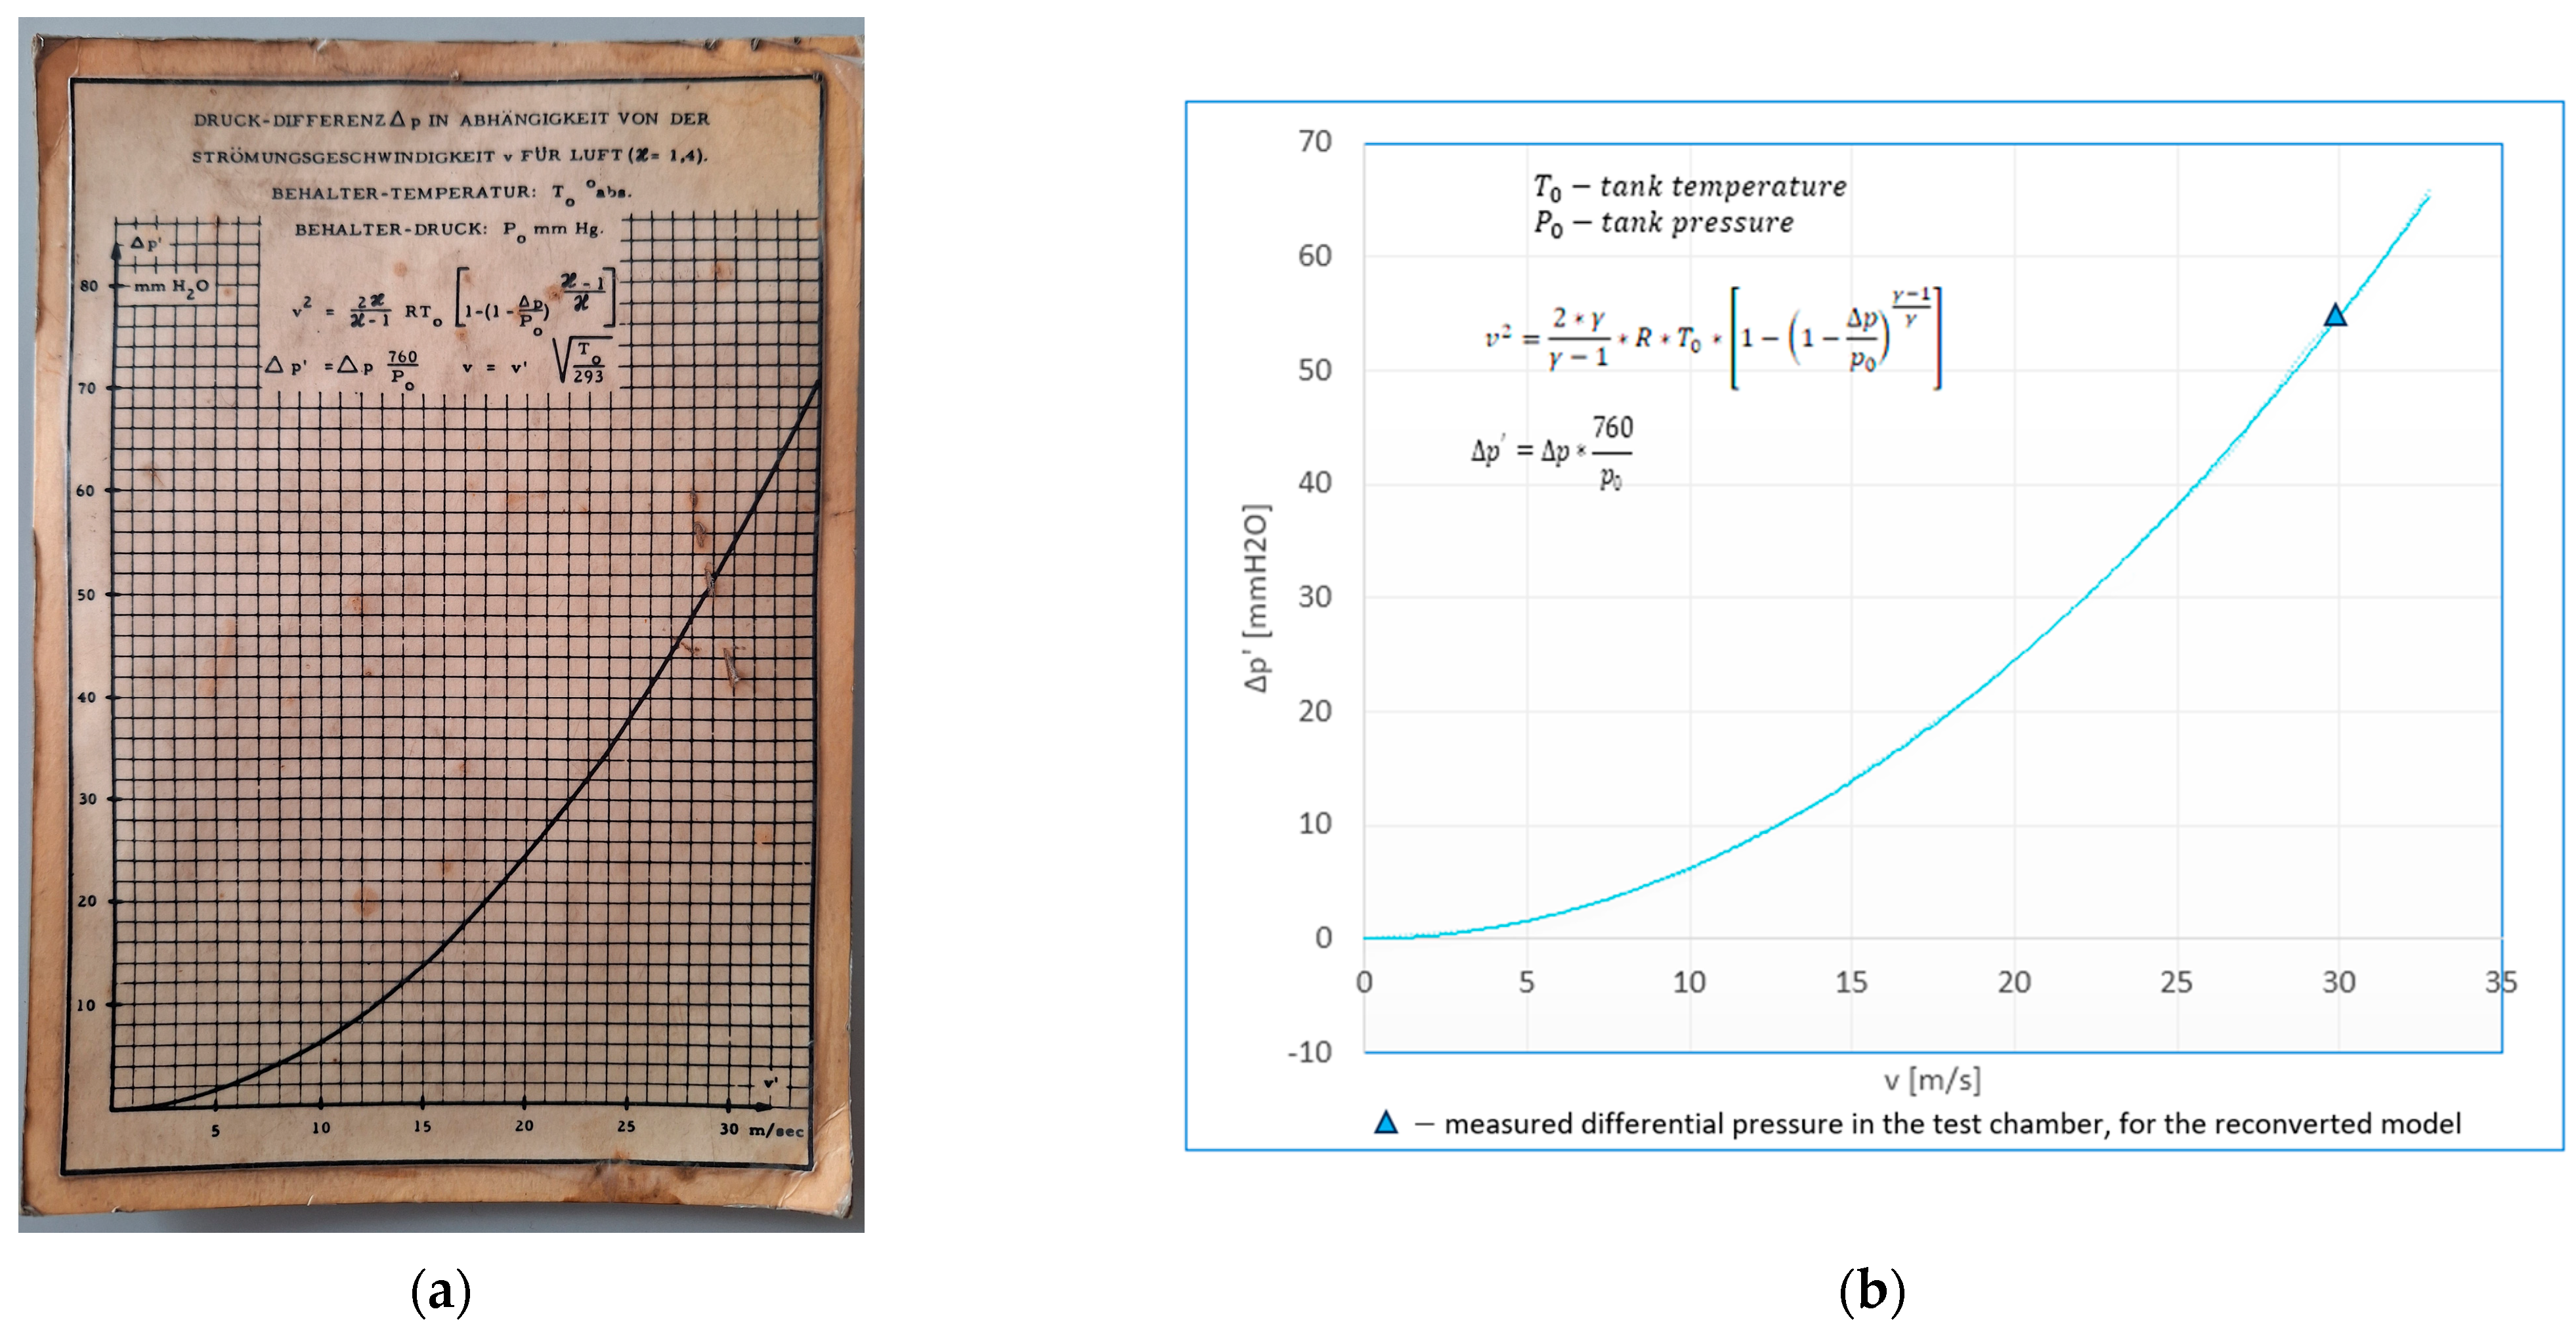
Figure 2, and the original graph representing the static pressure–air velocity curve is found in
Figure 3a. In
Figure 3b, the reconstruction of the graph in a digital manner can be observed.
Based on the variation graph, it is evident that the maximum achievable air velocity in the calibration section reaches approximately 38 m/s. However, the corresponding differential pressure is very low, necessitating its representation on the graph in millimeters of water column (mmH2O). Experimental testing has linked the highest-functioning regime of the motor to a velocity of 30 m/s. As specified before, this installation is used either for its ability to provide a low-velocity, low-turbulence flow or with certain modifications adjusting the flow velocity, accordingly.
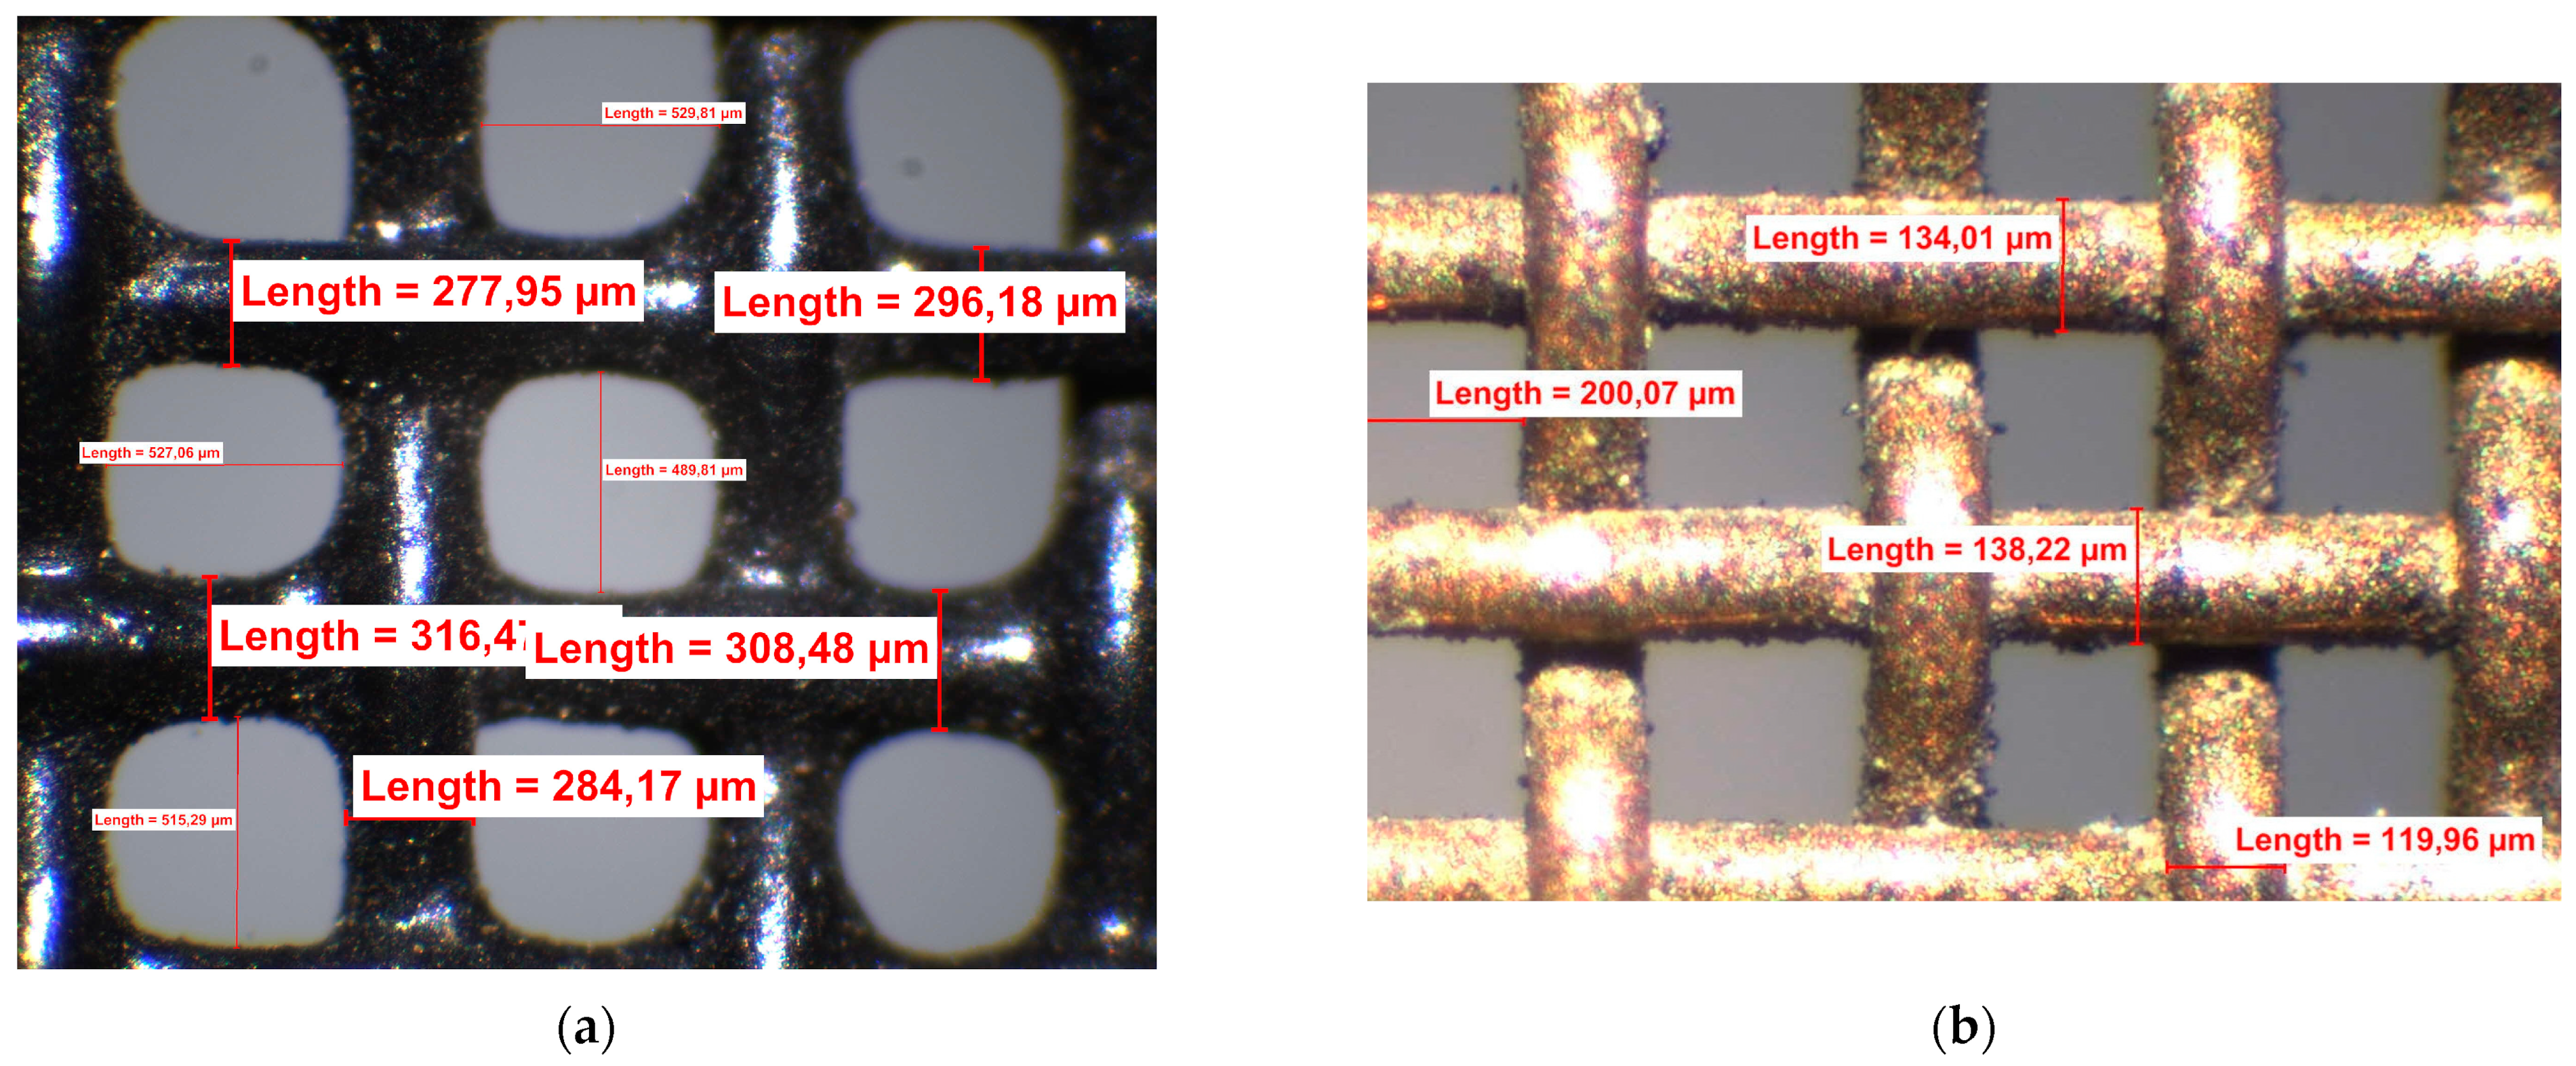
The inlet features six mesh screens (depicted in
Figure 4a) with different thickness levels, starting from the least dense (1) and ending with a finer mesh (6). These screens straighten and homogenize the inflow, reducing turbulence intensity. The exact position of the screens is inside of the convergent nozzle, as depicted in
Figure 4b.
The flow then passes through a converging nozzle designed to accelerate the air and produce a low-turbulent (near-laminar) flow profile.
The test section represented by a cylinder with a diameter of 14 mm and a length of 40 mm when mounted allows for static pressure measurements in the same area where the HW probe was introduced. This small area is intended to ensure high uniformity and predictable velocity fields.
Downstream of the test section, a diffuser section expands the flow and directs it toward the suction fan, minimizing pressure losses. However, before the diffuser, inside of the widening section, a Pitot tube is placed. This can be used for validating the calculated velocities from static ports to assess total pressure losses and confirm the quality of the flow before deceleration.
The tunnel includes static pressure taps grouped in two main areas: one upstream of the nozzle and another at the throat section. This setup enables precise determination of the flow velocity using the Venturi principle [
12], which relies on differential pressure and known air density.
This installation is essentially a low-turbulence calibration facility optimized for reproducing rather than simulating complex aerodynamic phenomena like separation or weak turbulence. Its compact and modular nature makes it ideal for bench-scale calibration tasks for academic and metrology labs.
3. Purpose of the Reconfiguration: Test Channel Analysis
In its original configuration, the aerodynamic tunnel functions as a highly effective instrument for the calibration of hot-wire (HW) and hot-film (HF) probes.
One of the disadvantages of this installation lies in the fact that it represents an outdated technology no longer capable of meeting current requirements, with most defective components being impossible to replace with similar ones. Another major drawback is its low calibration accuracy, caused by the wear of internal components, such as the total pressure sensor (Δp) located downstream, which, over time, can accumulate fine dust particles, leading to calibration errors. It can also be damaged during improper storage. Because the sensor is integrated into the nozzle downstream of the settling chamber, it cannot be replaced independently. Furthermore, the test section consists of a cube containing a cylindrical flow channel, which offers sufficient transparency to assist in mounting a hot-wire probe (typically 5 μm tungsten) but insufficient optical clarity for applying external flow visualization techniques. The material is believed to be acrylic (PMMA) or polycarbonate.
The objective of the reconfiguration is to transform it into a versatile aerodynamic testing facility equipped with transparent quartz windows, enabling advanced optical diagnostics, such as Particle Tracking Velocimetry (PTV) [
13] and Particle Image Velocimetry (PIV) [
14]. The upgraded setup will support detailed investigations into the influence of the flow incidence angle on the performance of specific static pressure probes, such as L-type configurations [
15]. These studies will not only assess the impact of the incidence angle (resulting from probe positioning) but also examine the effects of hole placement in the probe geometry, hole diameter and shape, as well as stem interference on measurement accuracy. Furthermore, the experiments will aid in selecting the optimal probe tip geometry, such as ogive, conical, or spherical profiles, to minimize flow disturbance and ensure consistent performance. The verification process will thus serve not only to characterize the probe’s accuracy but also to validate its aerodynamic compatibility with the surrounding flow, ensuring that the casing or external geometry does not introduce significant perturbations or measurement bias.
Static pressure probes of this type are widely employed in a range of applications, including wind tunnel testing of airfoils [
16], boundary layer profiling [
17], and internal flow diagnostics in ducts [
18] or propulsion systems [
19]. In aerospace contexts, they are found in pitot-static systems [
20], turbine instrumentation [
21], and engine inlet or nozzle measurements [
22]. Notably, such probes play an essential role in the characterization and monitoring of flow conditions within micro gas engines, where space constraints and the need for high spatial resolution require miniaturized, accurate sensors. In this context, precise pressure measurements are critical for performance mapping, combustion stability assessment, and thermal load evaluation. The low-velocity calibration capability of the reconfigured aerodynamic tunnel aligns particularly well with the operational conditions found in early-stage testing or idle modes of micro gas engines, ensuring that the probes used in these compact systems have been checked under realistic, low-speed flow conditions.
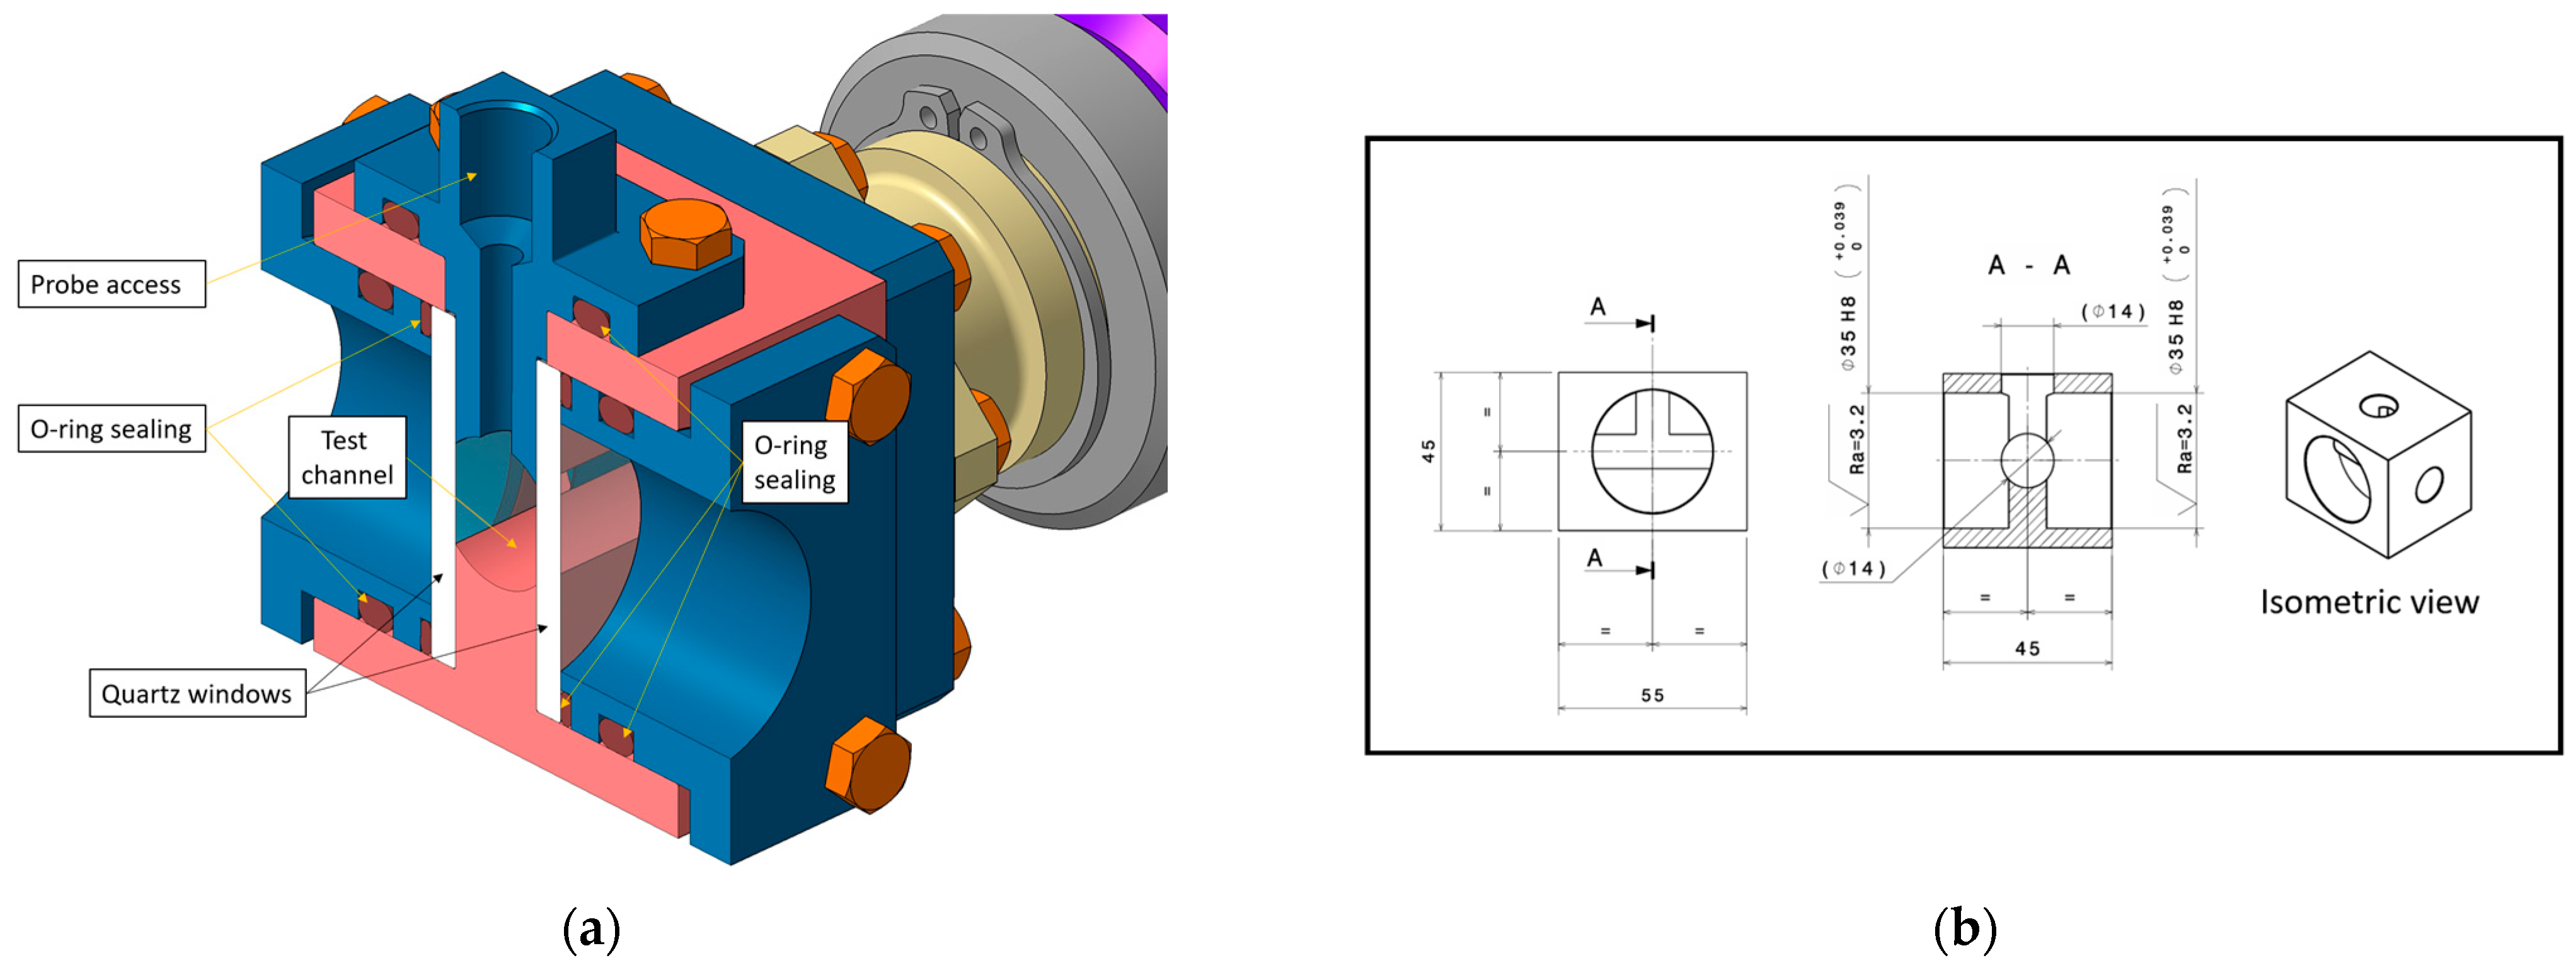
The test chamber was designed and analyzed to preserve the original flow conditions of the aerodynamic tunnel while integrating parallel transparent quartz windows to enable optical access. The use of flat, optically clear quartz surfaces ensures minimal distortion of light paths, thereby allowing accurate flow visualization techniques, such as schlieren imaging, without introducing significant optical aberrations. Consequently, the chamber was configured with two parallel planar quartz windows mounted on either side of the test section, as presented in
Figure 5.
The installation of quartz windows within the test channel resulted in a slight reduction of its effective width, deviating from the original intention to match the cross-sectional area of the convergent nozzle’s throat. To identify any significant deviations from the intended flow behavior, a brief CFD analysis was performed without the mesh screens. This preliminary investigation focused on assessing potential disruptions to the velocity profile and turbulence characteristics within the modified test section caused by the geometric alteration.
Numerical simulations were carried out using the commercial CFD software ANSYS CFX (version 2022 R2). The analysis was conducted under steady-state conditions employing the Reynolds-Averaged Navier–Stokes (RANS) approach with the Shear Stress Transport (SST) k-ω turbulence model. This turbulence model was chosen due to its robustness in predicting flow separation and accurately capturing near-wall effects [
23]. Air under ideal gas conditions was selected as the working fluid
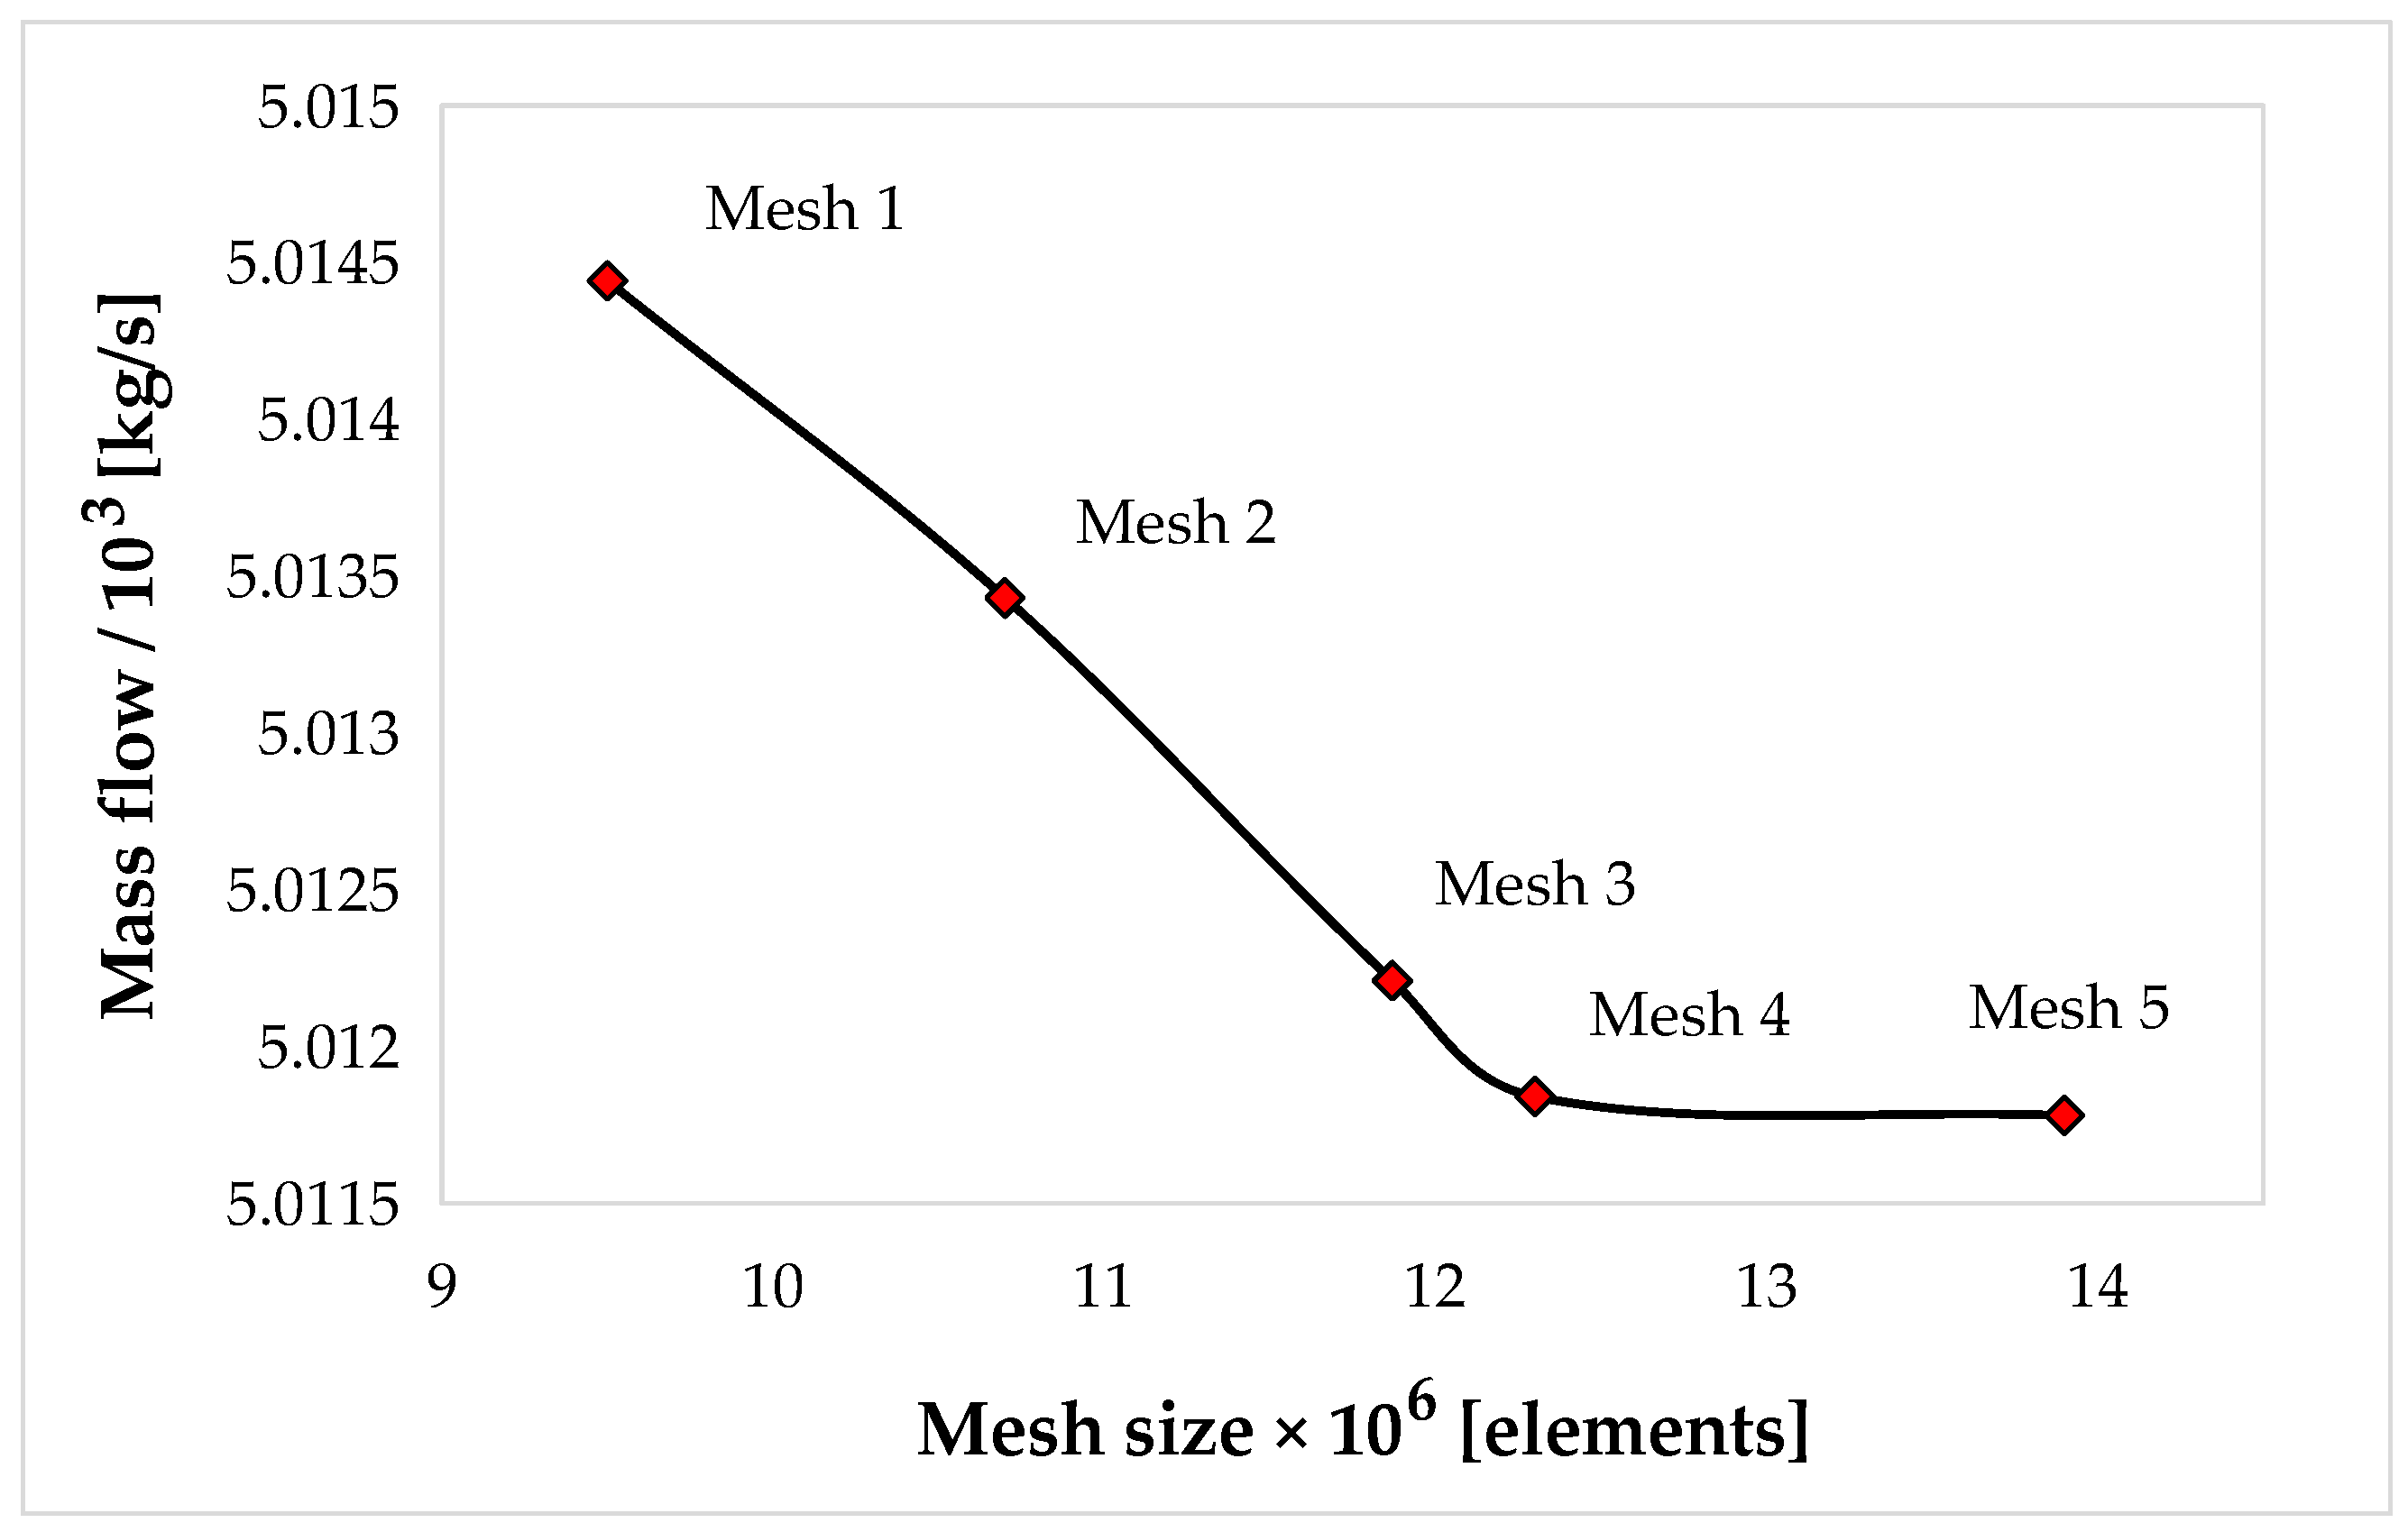
The computational domain was discretized using ANSYS2022R2 Meshing, with particular emphasis on mesh refinement in the test region to accurately capture flow features associated with boundary layer development and potential separation. To ensure that the mesh was sufficiently fine to resolve the relevant flow phenomena, a grid independence study was conducted using five mesh sizes, starting from a coarse mesh of 8.8 million elements and progressing to a finer mesh of 14 million elements.
In all cases, a structured inflation layer was applied near solid boundaries to ensure proper resolution of the boundary layer. The number of inflation layers, the height of the first layer, and the local mesh density in the test region were systematically adjusted for each mesh size. The mass flow rate through the wind tunnel was chosen as the primary indicator for grid convergence, with its variation across different mesh densities shown in
Figure 6. As illustrated, the mass flow rate exhibits a decreasing trend with increasing mesh density and eventually stabilizes, indicating that the solution has reached a grid-independent state. Considering the balance between numerical accuracy and computational resources, the final mesh used for the simulations contained 12.3 million elements, Mesh 4, with a minimum grid size of 5 × 10
−6 m at the near-wall regions. This mesh was considered sufficient to ensure reliable numerical predictions.
Figure 7 shows the grid resolution within the test area on a central cut plane, illustrating the mesh transition from the testing region to the surrounding domain.
Figure 8 illustrates the computational domain, including the inlet and outlet boundaries. To validate the new wind tunnel configuration, multiple numerical simulations were conducted, focusing on achieving the target velocity within the testing area. Accordingly, the following boundary conditions were applied: a total pressure of 101,325 Pa and a total temperature of 298 K at the inlet and a specified velocity at the outlet, depending on the test case. The flow was assumed to be normal to the inlet boundary. All other surfaces were treated as no-slip walls. Convergence was considered achieved when residuals fell below 10
−5, mass flow and pressure ratio values stabilized, and the mass imbalance criterion was satisfied.
This paper presents the results corresponding to a target velocity of 30 m/s.
Figure 9a shows the streamlines within the testing area, indicating stable flow with no signs of separation or other phenomena that could lead to pressure losses. The turbulent kinetic energy distribution (
Figure 9b) remains nearly constant and close to zero in the central region, with a slight increase near the walls. This increase is due to the change in diameter between the testing section and adjacent components of the wind tunnel. However, this variation has a negligible effect on the performance of the testing area, with the total pressure loss between its inlet and outlet being approximately 0.03%.
Figure 9 demonstrates that the flow within the test channel is well-stabilized, exhibiting very low turbulence levels and velocity streamlines that closely resemble laminar behavior. These favorable flow characteristics were achieved despite the exclusion of mesh screens from the CFD model, representing a simplification that significantly reduced computational effort due to the micro-scale size of the screens (the first and sixth (last) mesh screens presented in
Figure 10). The CFD analysis revealed turbulence kinetic energy levels below 0.001 m
2/s
2 within the test section, corresponding to turbulence intensities under 0.4%, thus maintaining the low-turbulence characteristics of the original DISA Type 55D41 configuration, historically rated below 1% [
24].
Consequently, the flow within the channel exhibits the uniformity and stability required for reliable measurements, minimizing the likelihood of turbulence-induced errors. These results confirm the suitability of the redesigned test section geometry, thereby supporting its use in future experiments conducted within the modified aerodynamic tunnel.
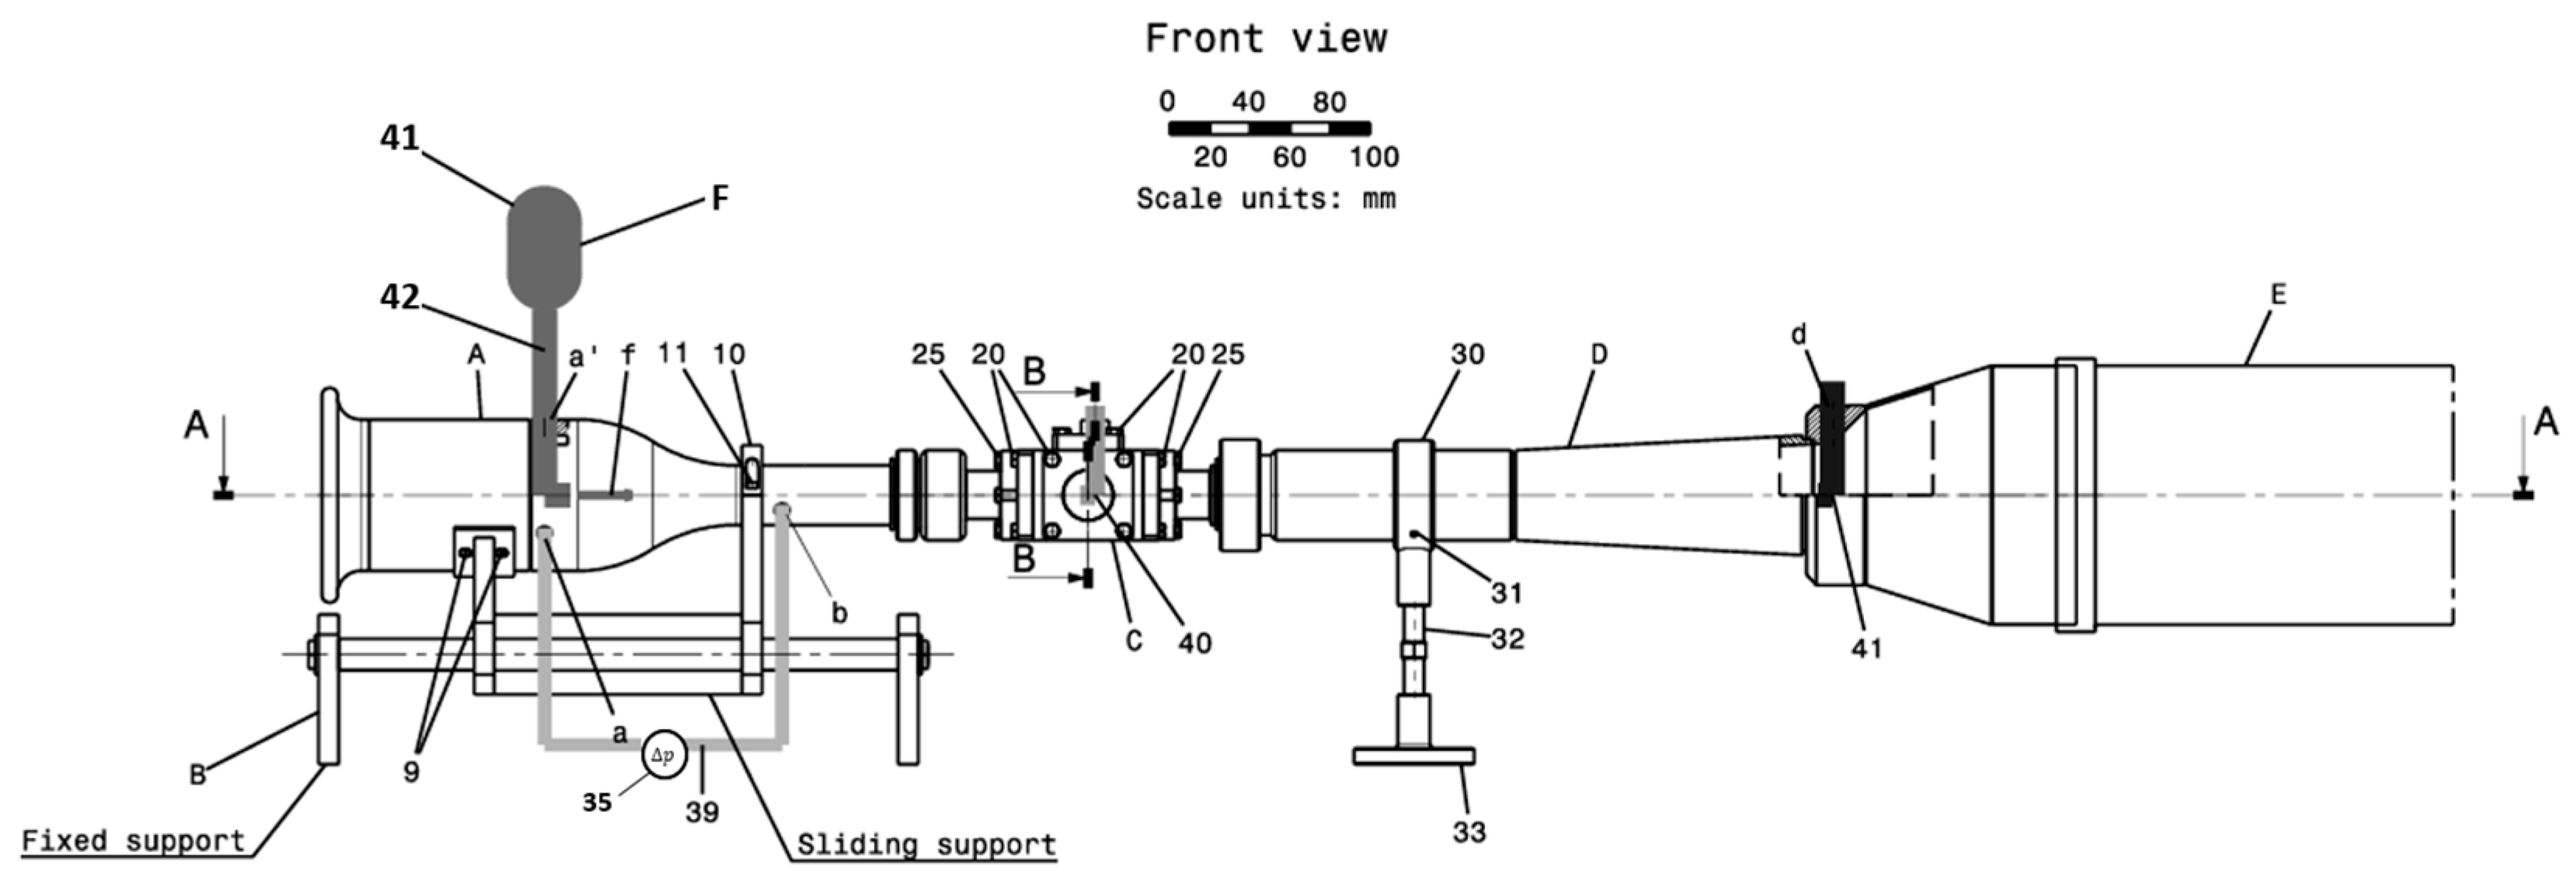
The new aerodynamic tunnel is composed of six subassemblies, from A to F. Subassembly A comprises an intake unit (1), a settling chamber (2) equipped with a coarse mesh (4) and five fine meshes (5) to ensure airflow laminarization (e), and a convergent–divergent section (3) featuring radially positioned static pressure ports (a and b) connected to a differential pressure transducer (35). Additionally, an auxiliary port (a′) is provided for the injection of particles (f).
Subassembly B serves as a sliding support for Subassembly A, enabling precise positioning of the entire calibration setup. It is secured to Subassembly A using screws (9), a semicircular clamp (10), and additional screws (11).
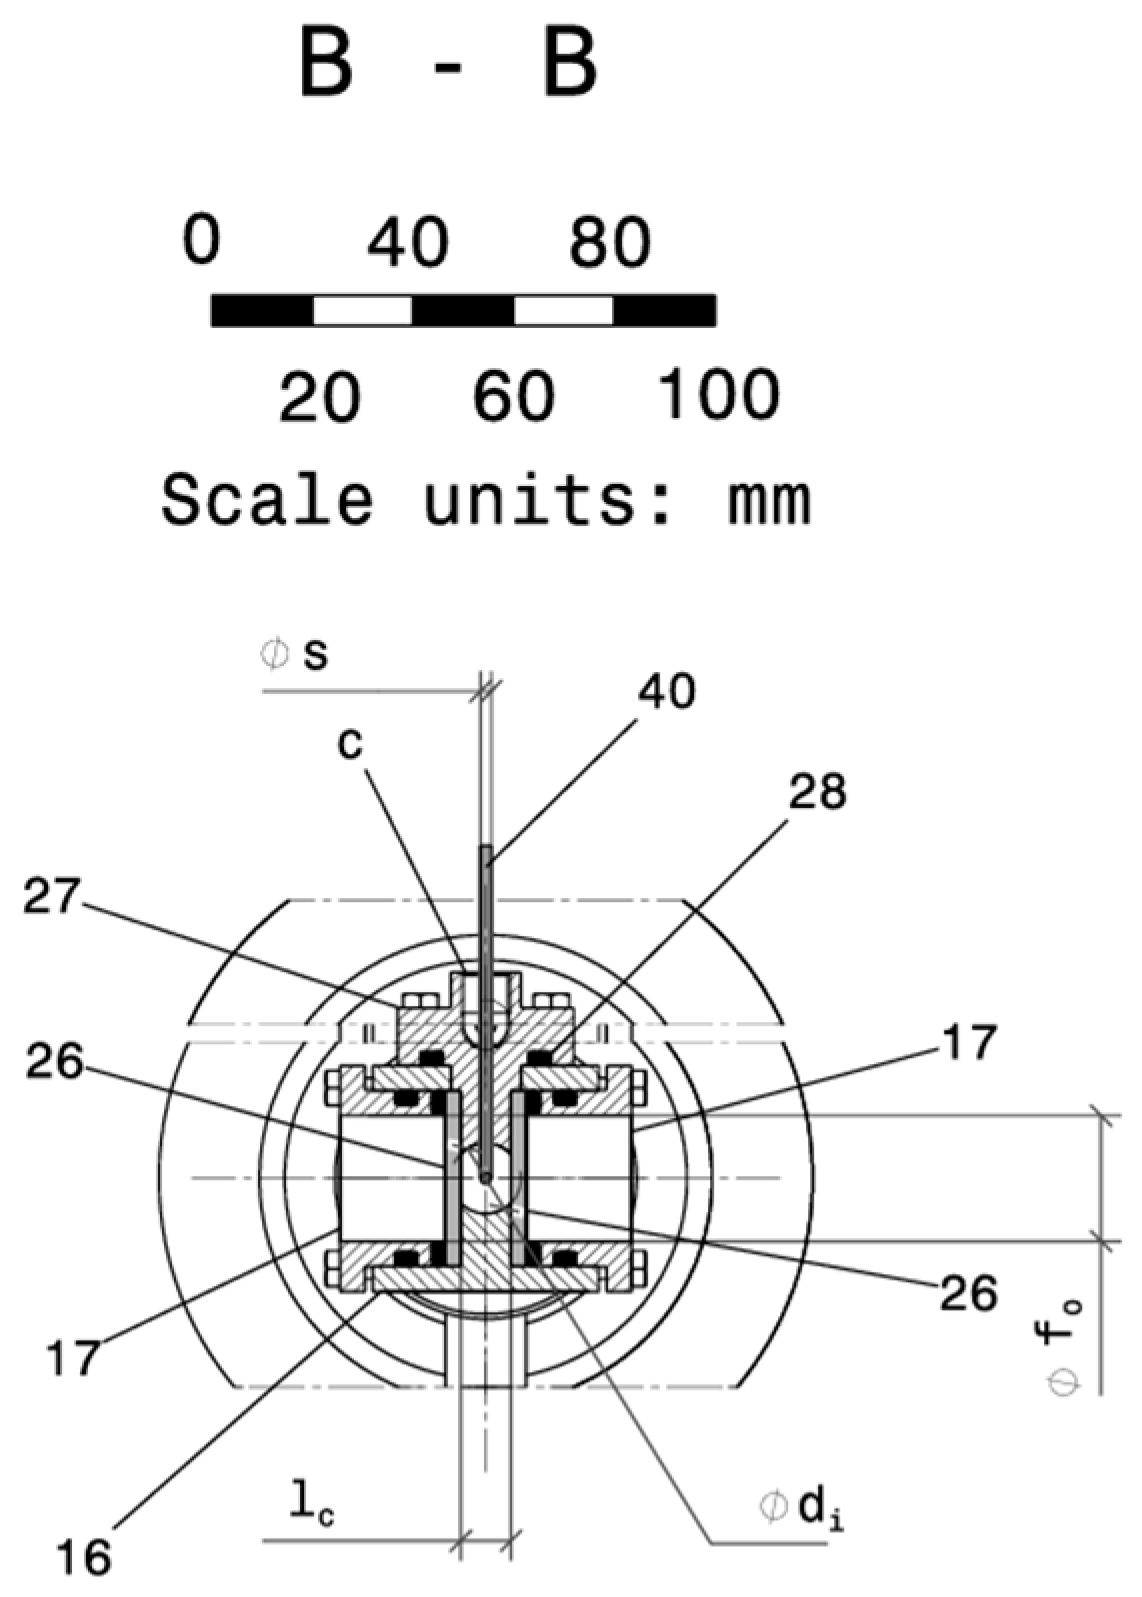
Subassembly C consists primarily of two optical glass windows (26), as shown in section B-B in
Figure 13, which define the flow channel width
of the test chamber (16) and allow for the installation of an optical window opening with diameter
in the viewing caps (17). The test chamber (16) is a rectangular prism onto which two adapter elements (15) are mounted. These adapters transition the flow from a truncated circular channel of diameter
on the horizontal plane to the flat width
of the optical windows (26) and back to a fully circular channel with diameter
. The adapters are fastened to the test chamber (16) with screws (20), which also secure the upstream connector (12). This connector links Subassembly A via a union nut (6), which is attached to Subassembly A using elastic rings (7 and 8). On the downstream side, connector (21) links to Subassembly D using a union nut (22), attached to Subassembly C with elastic rings (23). The two viewing caps (17), which provide the optical window opening
, are also mounted to the test chamber (16) with screws (20), along with the total pressure sensor cap (27), which holds the L-type static pressure probe in place. For sealing the assembly from the external environment, O-rings (13, 14, 18, 19, 24, 28) are used.
Subassembly D consists of the downstream divergent channel (29), fabricated from welded components, which provides a gradual transition from a smaller inlet diameter to a larger outlet diameter . This expansion occurs over a length , defined by the divergence angle , corresponding to a taper ratio to , or an equivalent angle to . The geometric profile is designed to minimize turbulence generation and ensure smooth flow expansion. The nozzle is equipped with a flanged ring (30) fixed to the main body of the nozzle using two threaded dowel pins (31). A dual-threaded adjustment rod (32) is screwed into this ring and connects to a support leg (33), providing structural alignment and mechanical stability to the entire subassembly.
Subassembly E consists of the duct (34) with an internal diameter , which houses the fan (36) responsible for generating the airflow e, at velocities appropriate for the calibration of the probes. The airflow rate produced by the fan is controlled by adjusting the speed of the electric motor (37), which is modulated via a frequency converter (38). The duct (34) is mechanically connected to Subassembly D using a fastening collar (35), ensuring alignment and structural continuity across the downstream airflow path.
Subassembly F, the external unit, introduces a particle-laden jet f from the particle reservoir (41), which is injected into the main airflow e via the injector (42). This process generates the seeded gas mixture g, necessary for flow visualization using visualization techniques, such as PTV and PIV, and, by extension, can lead to a more precise understanding of the flow surrounding the pressure probe (40).
Although the current configuration of the aerodynamic tunnel utilizes the original 55D42 power unit—which is limited to two discrete fan speeds—the installation is designed to accommodate a future upgrade with a variable frequency drive (VFD). This addition will allow for continuous control over the fan’s rotational speed, enabling fine-tuned adjustment of airflow velocity. Such control is essential for micro-scale sensor calibration, where velocity stability within ±0.1 m/s is often required. The VFD will also support real-time feedback integration from pressure or velocity sensors, allowing for closed-loop control to ensure stable and repeatable flow conditions. While the present study focused on validating the tunnel’s geometry and baseline functionality at a single fixed speed, the planned speed control upgrade will significantly enhance the system’s precision and adaptability for advanced aerodynamic testing.
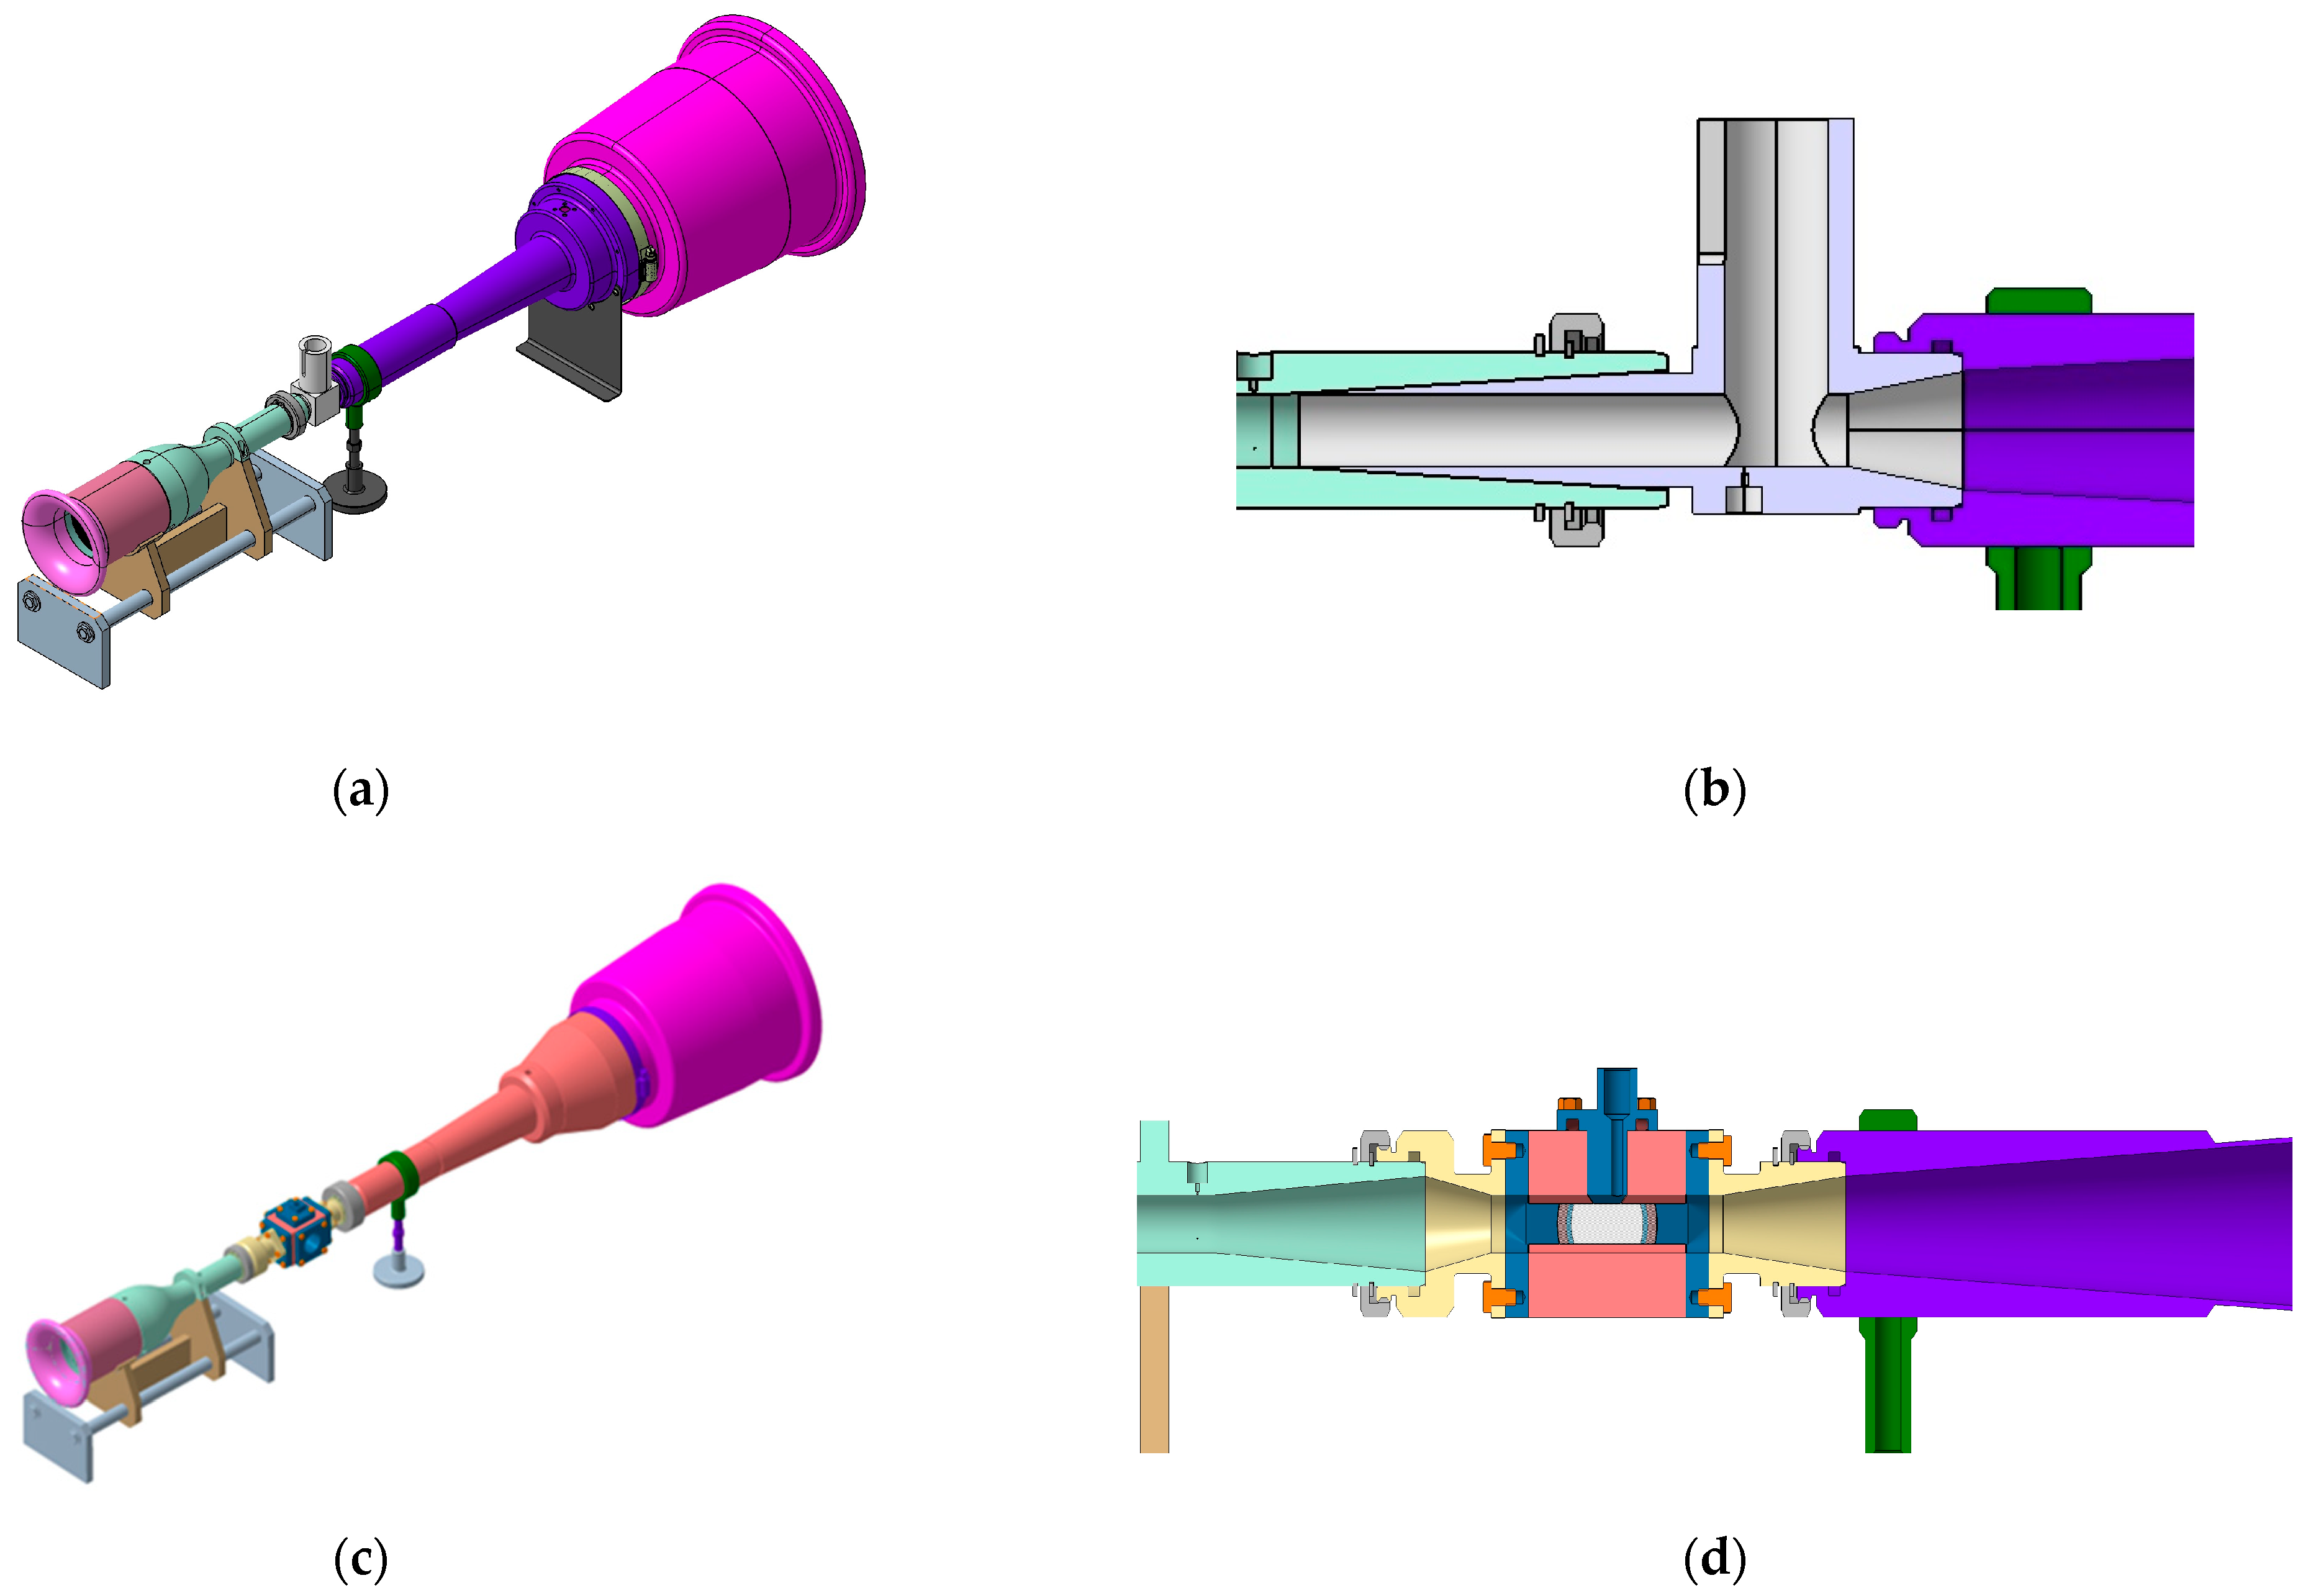
The 3D assembly of the old HW calibration unit can be observed in
Figure 14a, and a section through it is provided in
Figure 14b. The new geometry of the DISA is provided in
Figure 14c without the motor unit 55D42, while an axial section can be observed in
Figure 14d, for a better understanding of the final assembly.
5. Conclusions and Future Work
The reconfiguration of the DISA Type 55D41 calibration wind tunnel has successfully transformed a legacy flow calibration device into a functional and versatile aerodynamic test platform capable of supporting modern experimental techniques, such as PIV (Particle Image Velocimetry), PTV (Particle Tracking Velocimetry), DIC (Direct Image Correlation) [
27], and schlieren imaging [
28].
Preliminary CFD simulations confirmed that the geometric modifications, particularly the inclusion of parallel quartz windows and the resulting narrowing of the test section, do not significantly degrade flow quality. Results showed a uniform, low-turbulence flow field, validating the chamber’s design for accurate aerodynamic measurements. These findings were further supported by experimental validation; pressure measurements in the test channel, obtained via a 2 mm diameter static probe (with a 0.5 mm orifice), closely matched reference values derived from the original calibration curve.
The modular nature of the redesigned test section opens possibilities for a variety of flow diagnostics and probe calibration activities, especially for micro-scale static pressure sensors intended for applications in aerospace, propulsion systems, and micro gas turbines. The tunnel’s adaptability and ability to replicate low-speed, low-turbulence flow conditions make it especially valuable for analyzing probe geometry effects, including tip shape (e.g., conical, ogive), hole placement, and support stem interference.
To validate the performance of the reconstructed aerodynamic tunnel, a 2 mm diameter static pressure probe with a 0.5 mm orifice was positioned along the centerline of the test section. The measured pressure of 55 mmH2O at maximum fan speed closely matched the original DISA calibration curve, confirming the general consistency of the flow. However, this verification was intended as a preliminary check and does not fully capture the behavior of true micro-scale probes (e.g., <0.5 mm diameter). Future work will focus on establishing calibration curves for such miniature sensors, accounting for potential deviations introduced by probe geometry, tip design, and manufacturing tolerances, as well as the influence of positioning within the test channel.
While the current setup of the reconfigured DISA Type 55D41 wind tunnel is limited to dry, ambient air conditions, its modular design offers a promising foundation for future enhancements aimed at simulating marine environments. By integrating upstream humidification systems or saline aerosol injectors, the apparatus could be adapted to replicate salty or humid wind conditions characteristic of coastal or maritime settings. Such improvements would broaden the tunnel’s applicability, particularly for testing environmental sensors, coatings, or probe performance in corrosion-prone conditions, as demonstrated in prior studies on marine environmental simulation [
27].
In conclusion, the reengineered DISA 55D41 installation now provides a reliable, customizable platform for aerodynamic calibration and investigation capable of supporting advanced experimental methodologies and addressing the precision demands of modern sensor applications.
