1. Introduction
Wind energy is essential socially and economically to increase sustainability and development in many countries around the world [
1]. From this perspective, wind energy sources, including floating wind turbines, have become an essential electricity generation source [
2].
To achieve zero carbon emissions, implementing offshore and floating wind energy in deep water areas has become a requirement [
3,
4,
5,
6,
7,
8].
Floating wind energy represents 80% of offshore wind energy resources due to its feasibility in high water depths [
9,
10].
The main two advantages of floating wind energy are the generation of electricity in deep waters, as well as the elimination of the global warming (climate change) threats that are mainly caused due to excessive carbon emissions, according to the Paris Agreement [
11,
12,
13,
14,
15,
16,
17,
18,
19]. This applies especially to countries in Europe, the US, and Japan, which have limited shallow water depth offshore areas. The extensive implementation of floating wind projects in such deep-water areas will necessitate the cost reduction in floating wind levelized cost of energy compared to that of onshore and offshore bottom-fixed counterparts [
20,
21,
22,
23,
24,
25].
Floating wind turbines are mostly implemented in harsh environments, such as high-wave and high-wind-speed areas, which makes their design and maintenance challenging [
26,
27]. Moreover, floating wind fatigue numerical analyses are challenging due to the complexity of wind and ocean environmental conditions [
28]. A solution for this could be real-time monitoring in terms of mooring line fatigue computation, for example [
29].
The increasing floating wind sizes and their corresponding harsh environmental load conditions in deep water made it essential to carry out dynamic analyses for such systems [
30].
A main challenge for implementing floating wind turbines is the instability resulting from their floating support structures and the controllers [
31]. A further difficulty of implementing TLP floating wind turbines, for example, is the necessity of pre-tensioned vertical mooring lines and a reliable anchor design, which makes it difficult to implement such turbines [
32].
Bottom-fixed offshore wind turbines currently have competitive costs as compared to onshore wind turbines in terms of electricity production [
33]. A suggestion for reducing floating wind implementation costs is to implement floating wind farms with shared mooring lines [
34]. This suggestion has the potential to be one of the most effective solutions for reducing the implementation costs of floating wind turbines [
35].
As of 2019, the European offshore wind capacity has been reported to be 22 GW, and it is expected to reach 300 GW in 2030, which will necessitate implementing floating wind turbines in deep water areas [
36,
37].
Knowledge of offshore wind environmental loading conditions is essential in designing such turbines [
38]. The challenge of floating wind turbines is resonant motions, which will influence their costs, performance, and lifespan, and they need to be studied and prevented [
39].
An integrated analysis using aero-hydro-servo-elastic tools is essential for the accurate numerical results of floating wind turbines [
40]. Software for determining the global responses of such turbines implements numerically generated wind using aero-hydro-servo-elastic analyses [
41,
42].
Floating wind turbines have recently become a topic of interest in the fields of naval architecture and renewable energy. Therefore, conducting a dynamic analysis illustrating their response offsets is very important. From this perspective, this paper will cover the six-degree-of-freedom motion amplitudes for each of the eight floating wind turbines considered in the study throughout this paper.
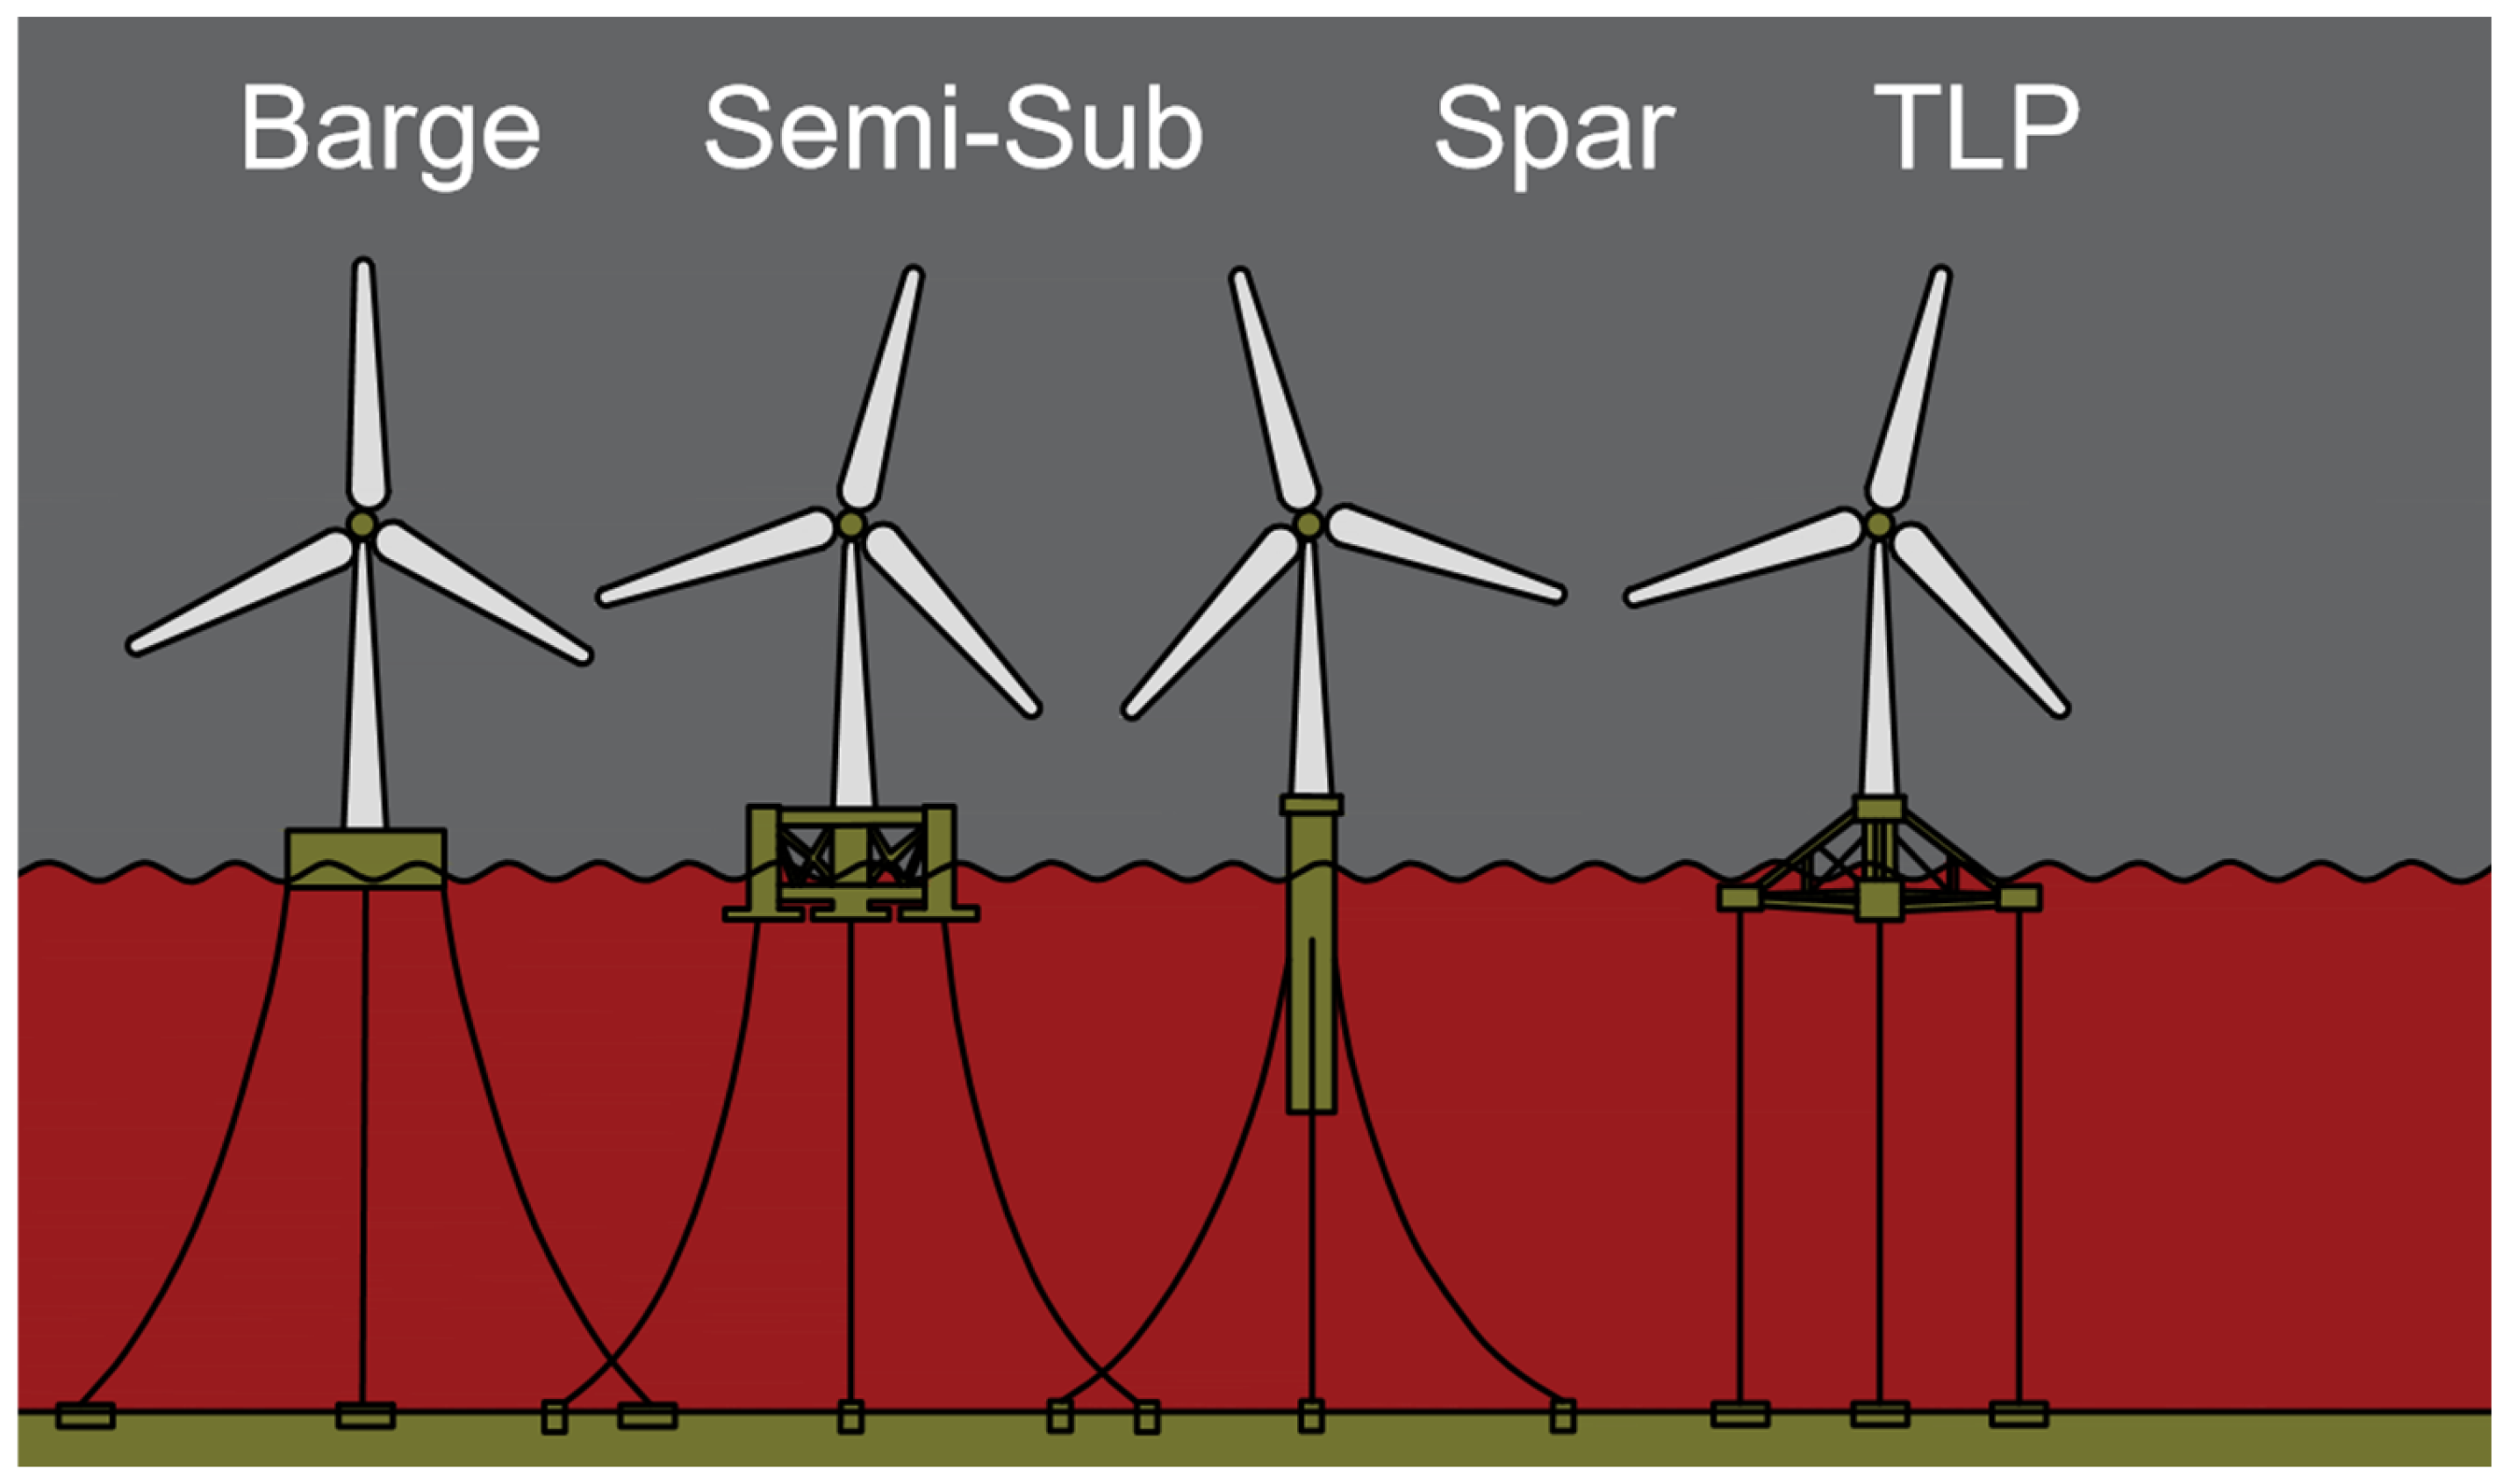
Figure 1 shows the four floating wind turbine types, from which three of them (spar, semi-submersible, and TLP) are analyzed throughout the eight floating wind turbines studied in this paper.
The main objective of this paper is to carry out response analyses of eight floating wind turbines in one paper and compare them together; this is something that is not seen in previous research papers.
The eight floating wind turbines considered in the study were also included in a previously published paper by the authors covering a complete and up-to-date literature review and aspects of relevance to modern floating wind turbines [
43].
Figure A1,
Figure A2,
Figure A3,
Figure A7 and
Figure A8 in
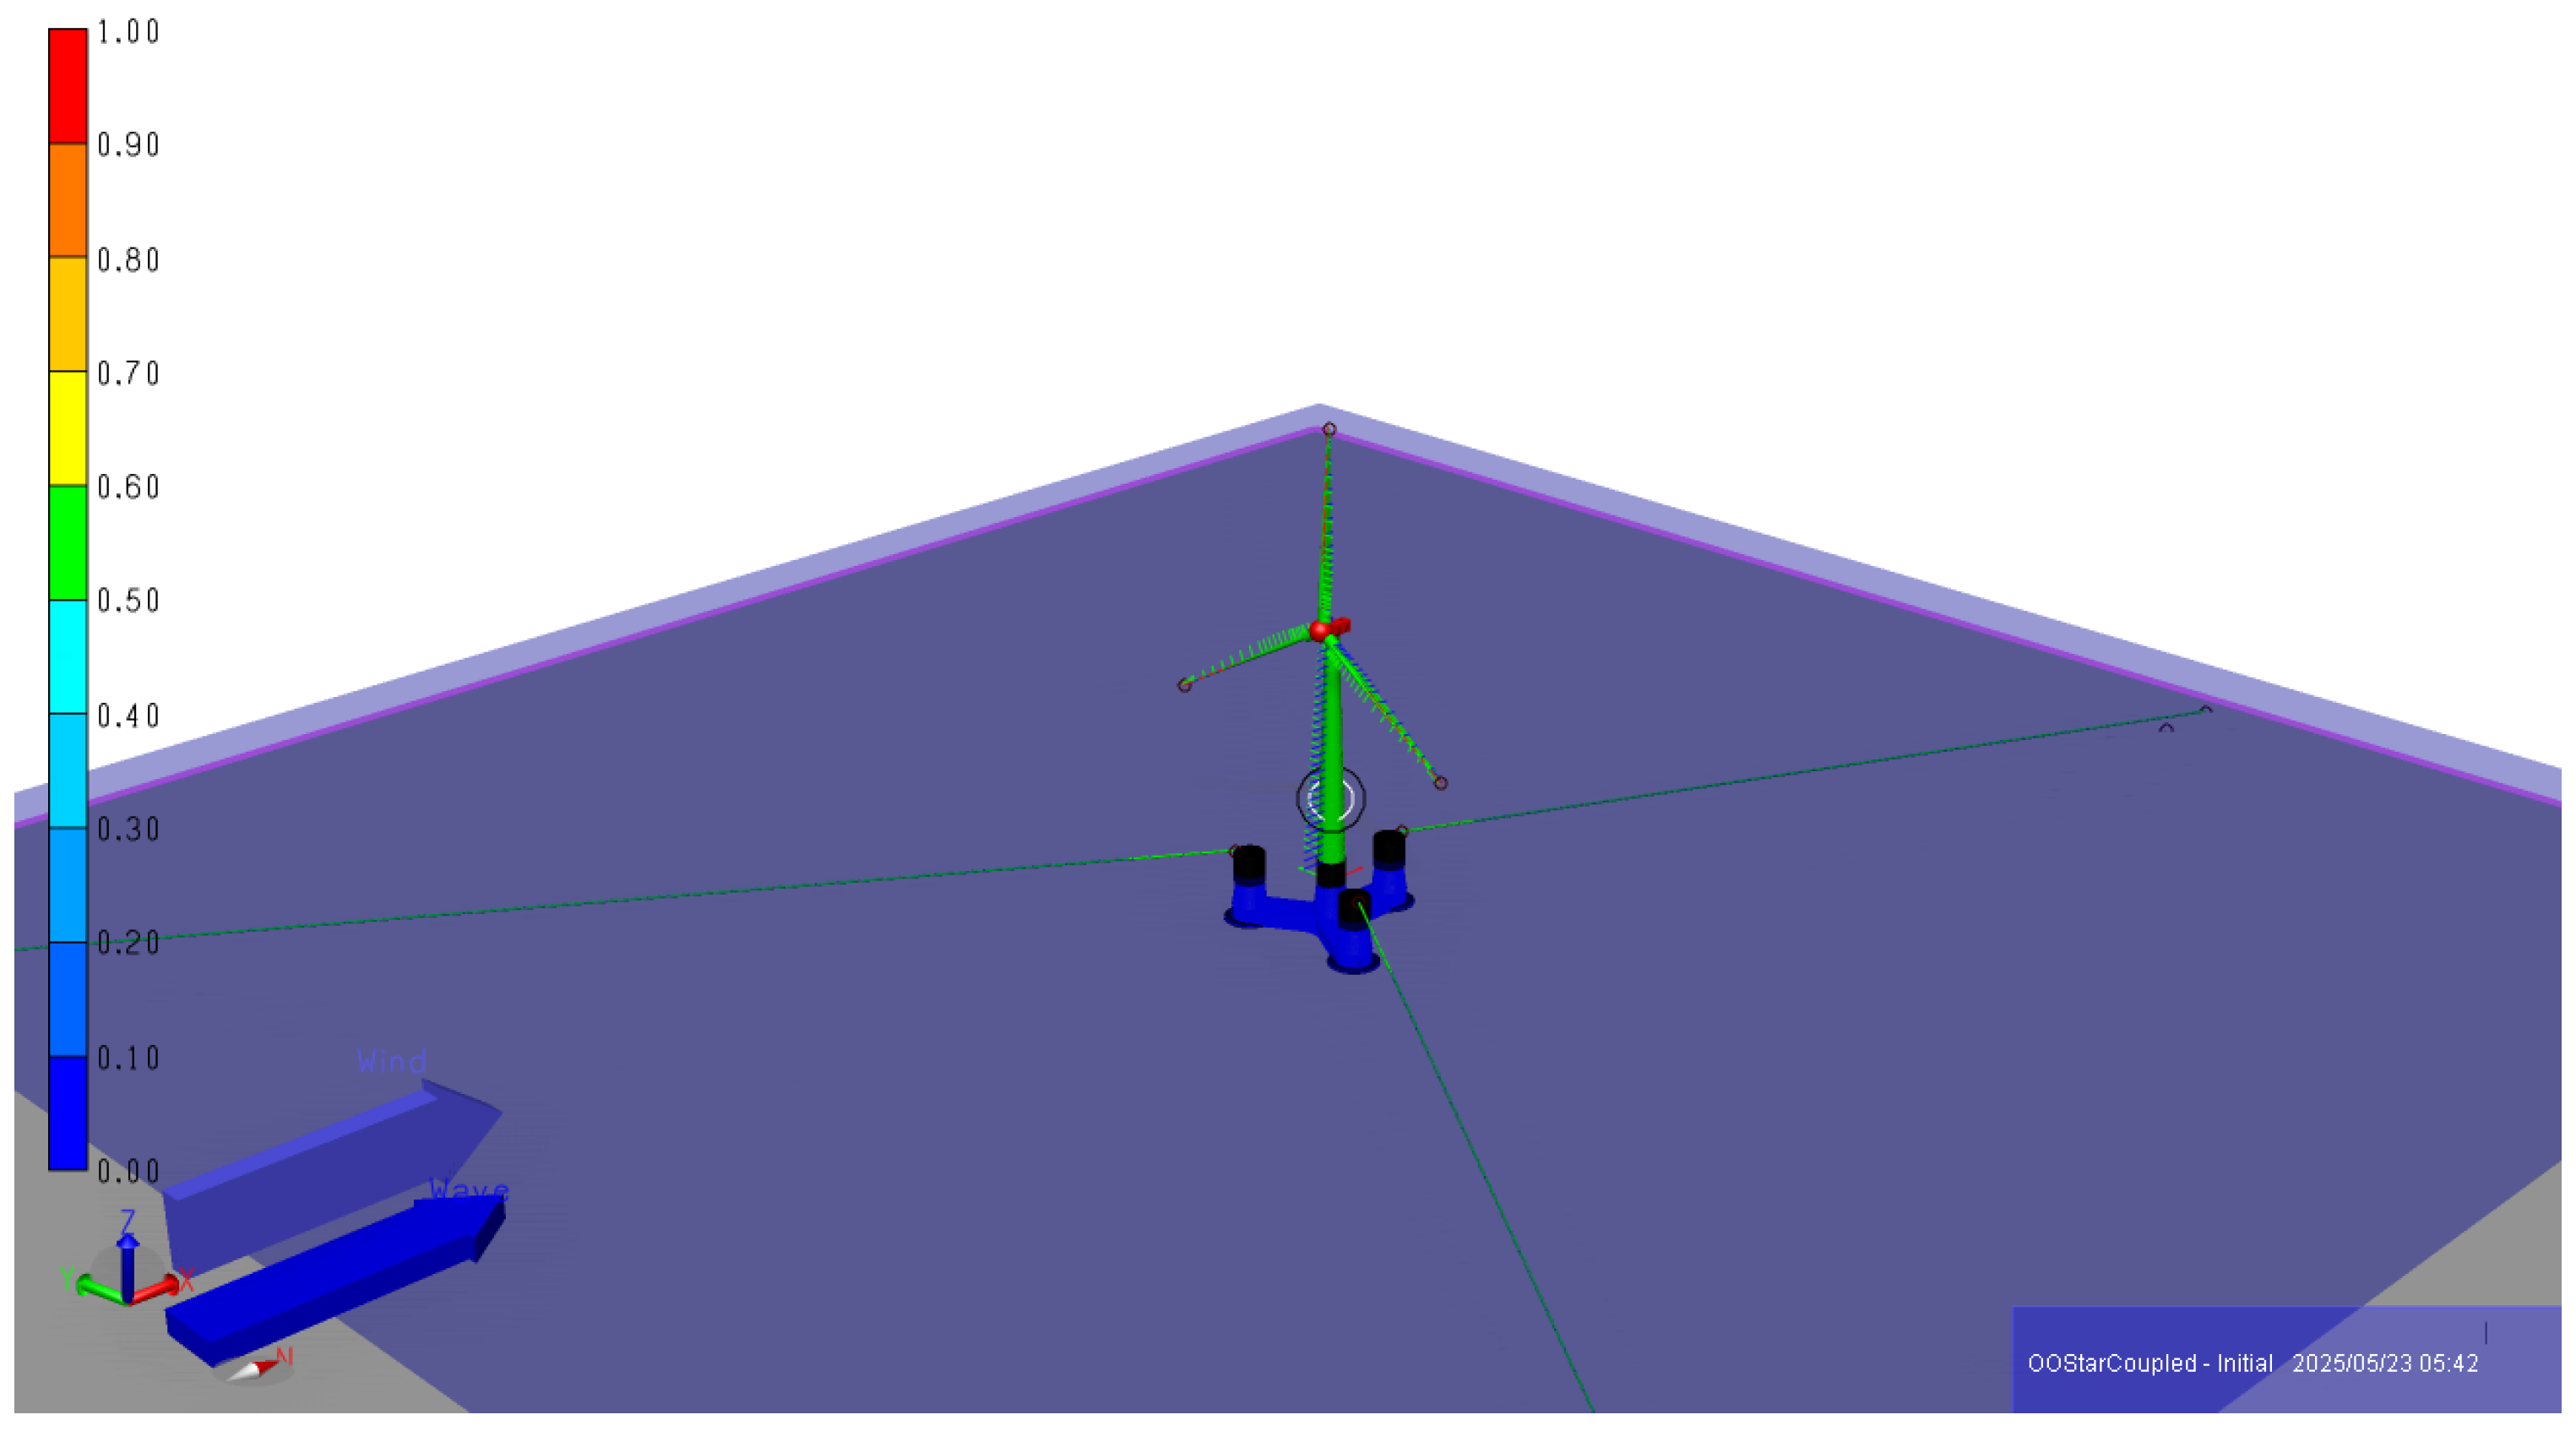
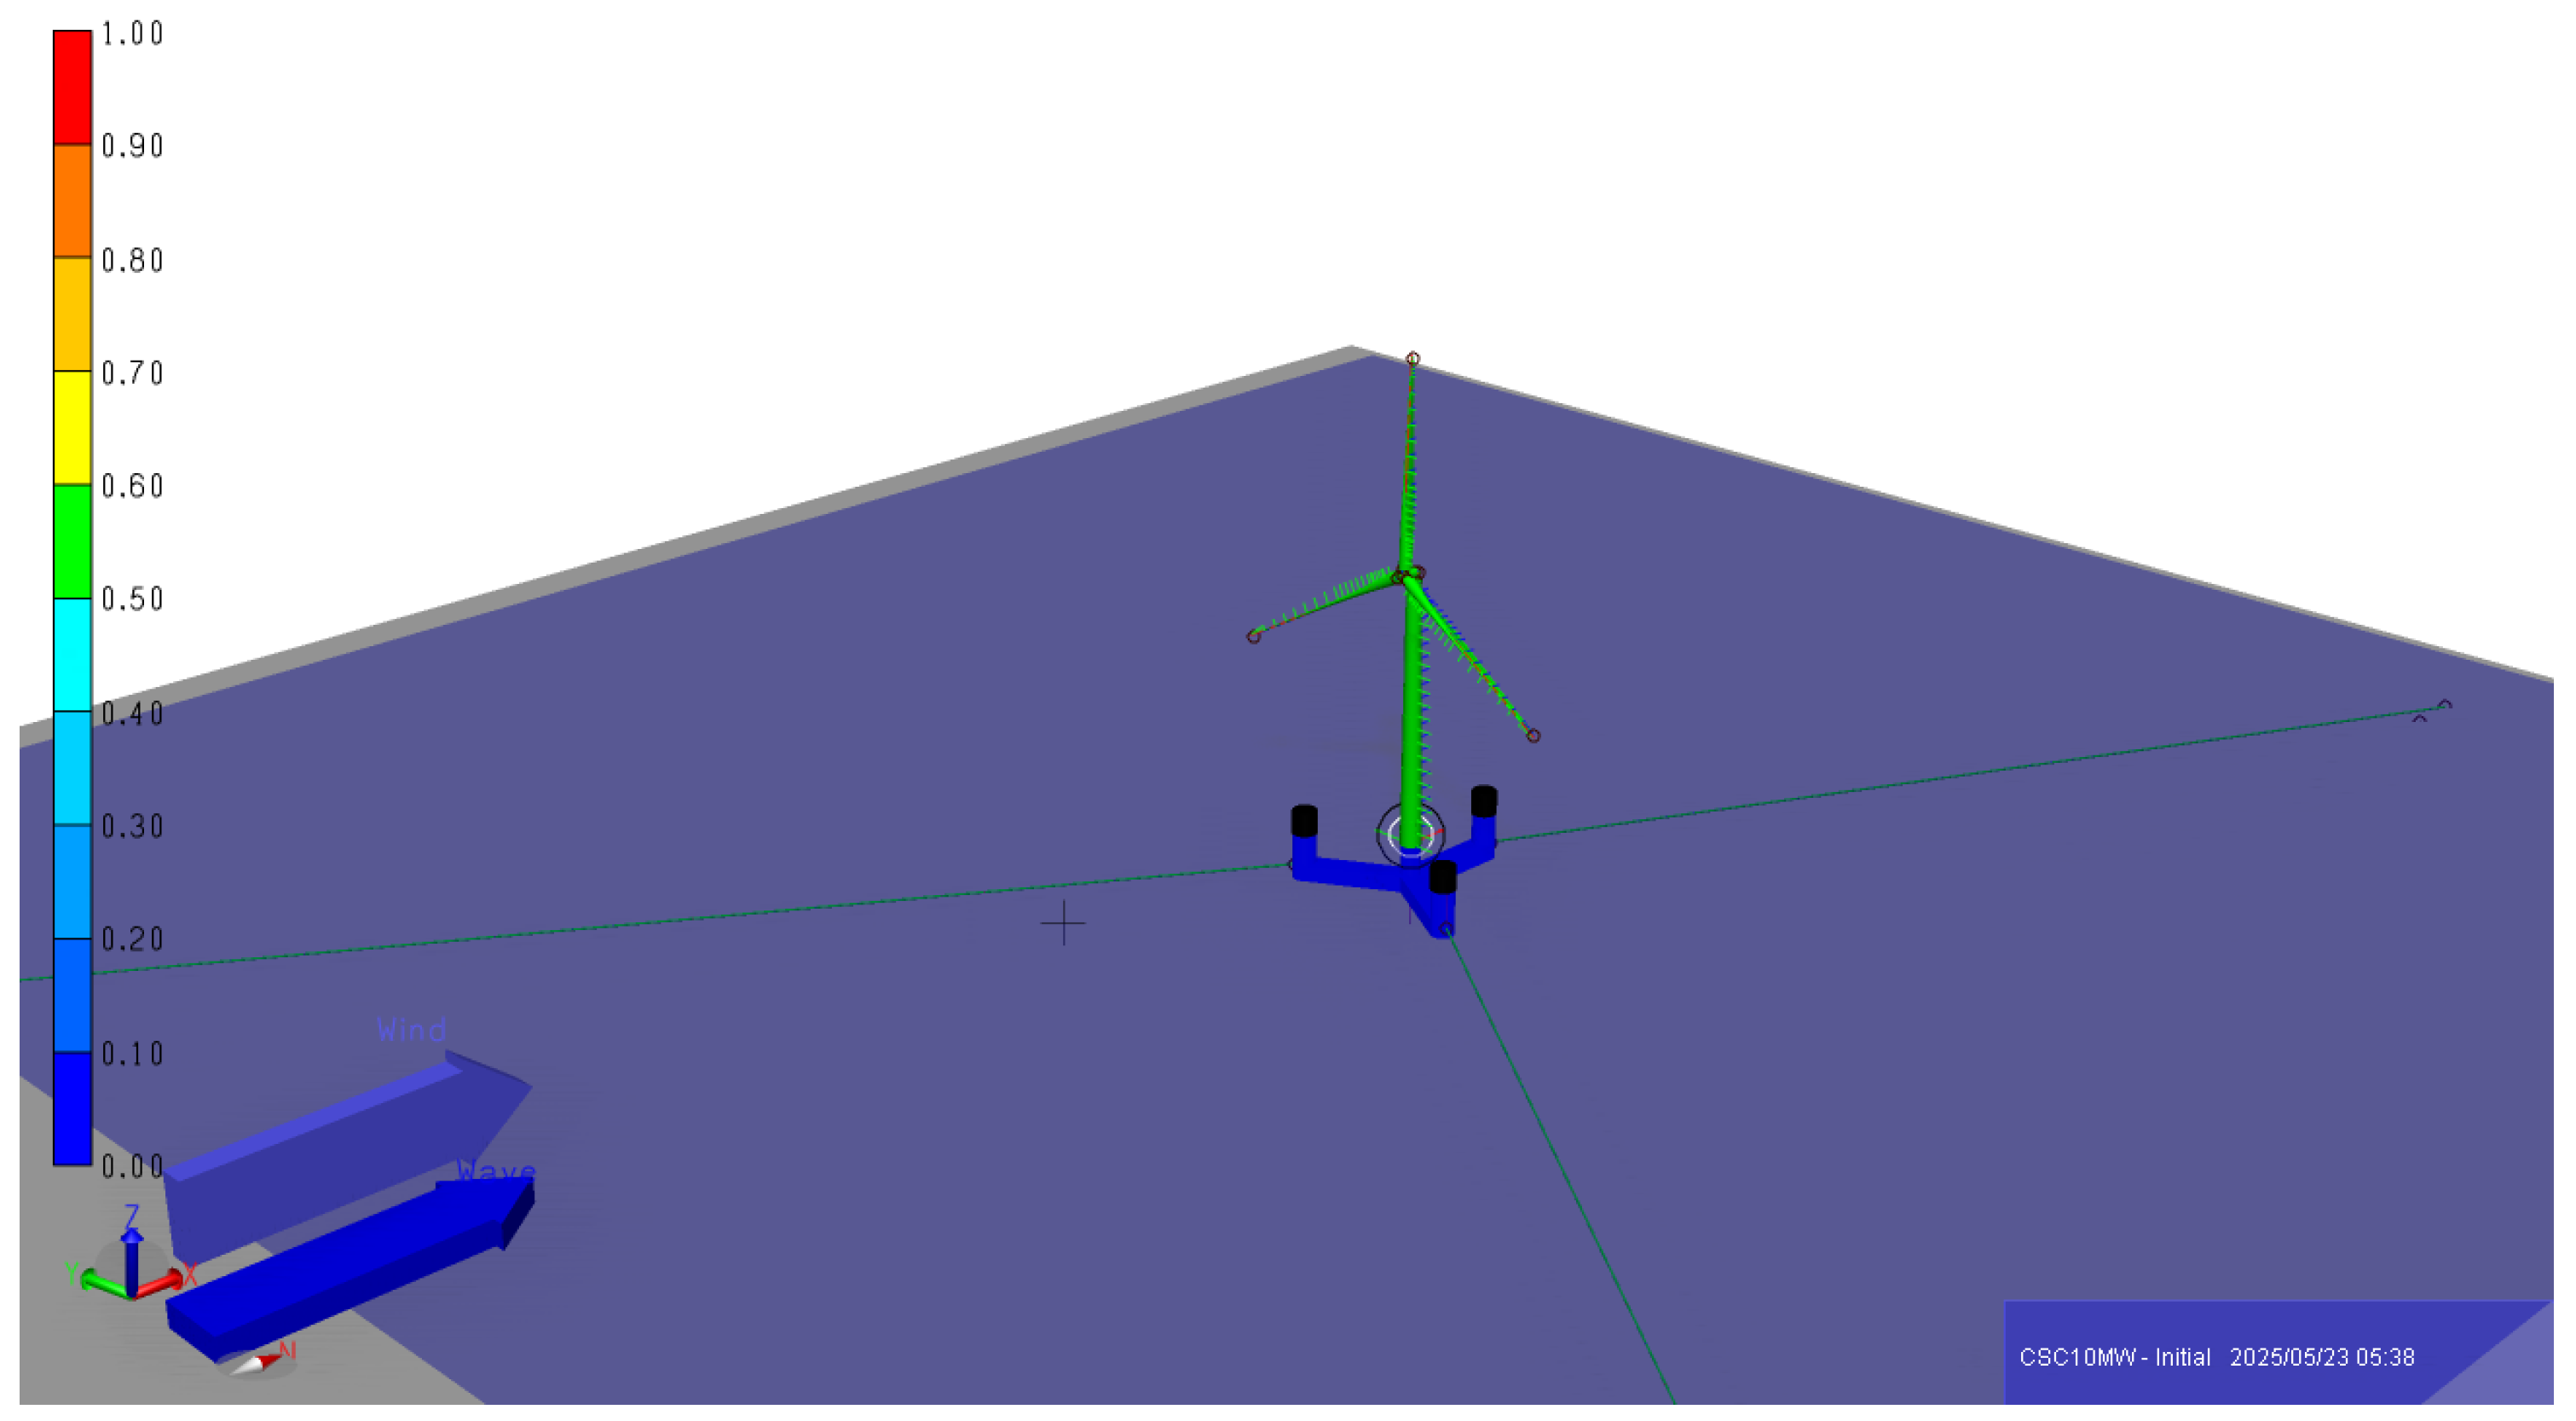
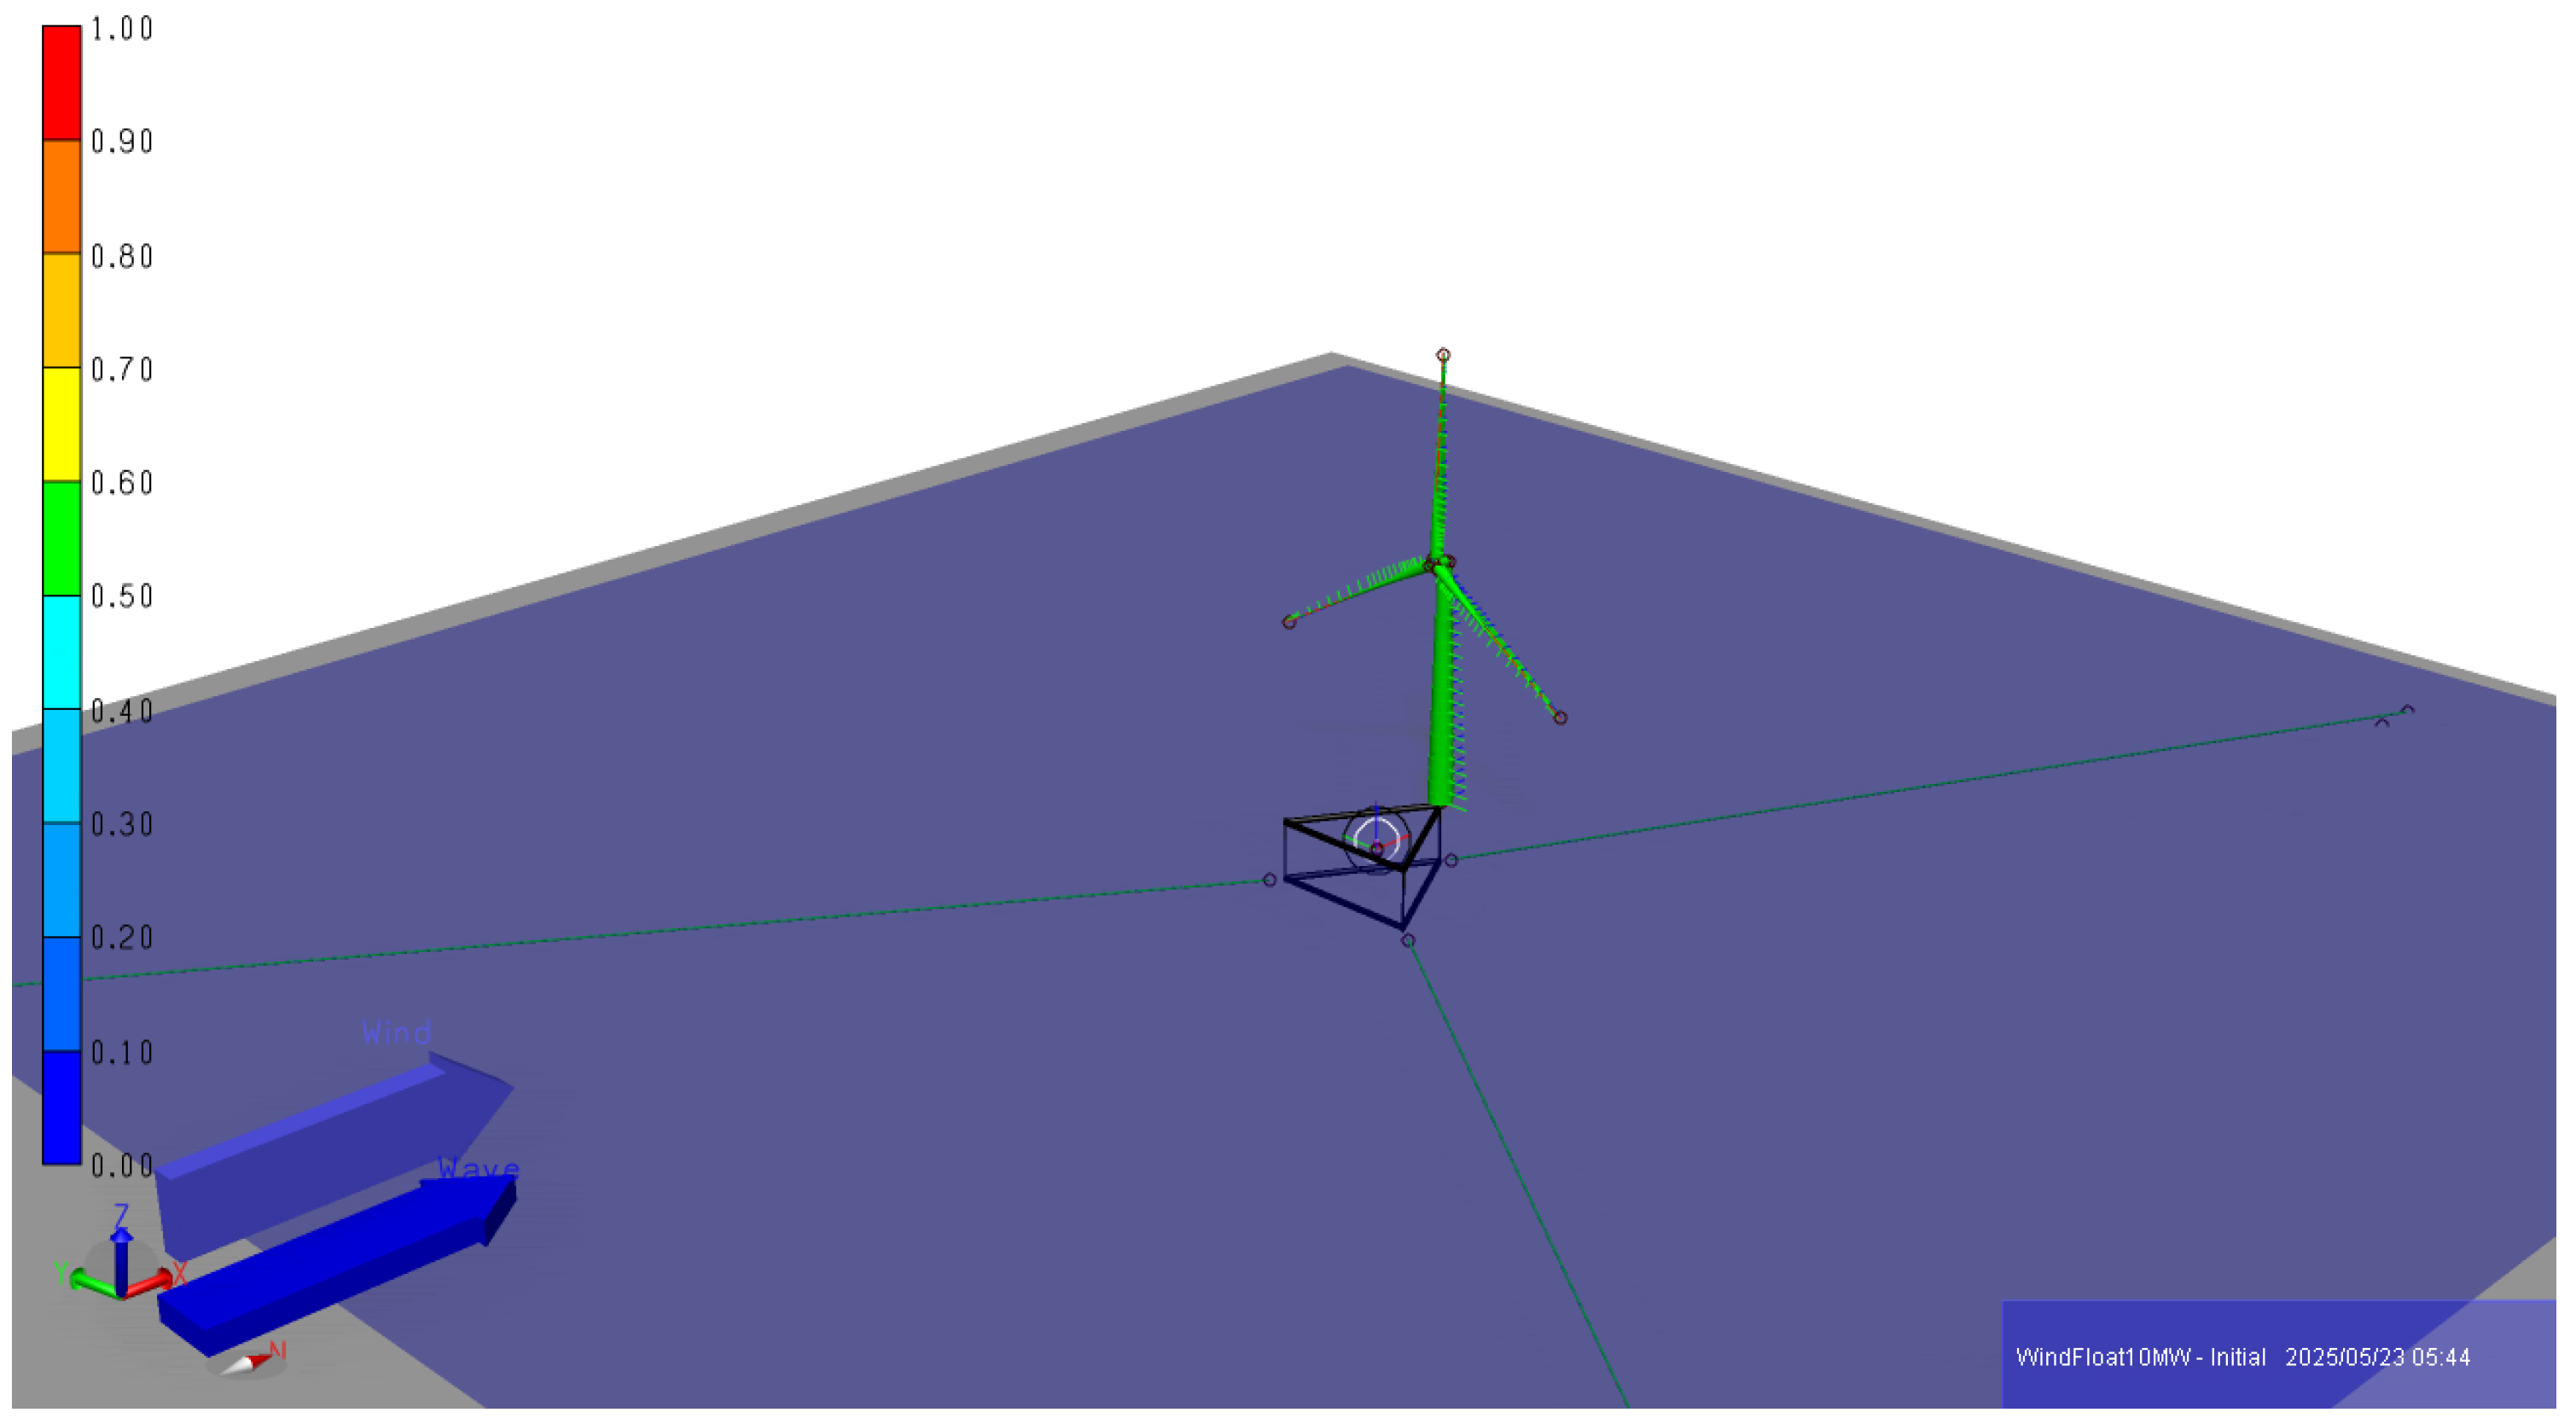
Appendix A show five semi-submersible floating wind turbine concepts (OO-Star, CSC, WindFloat, INO-WINDMOOR, and U-Maine Volturn-US). The first three of these floating wind turbines have a power capacity of 10 MW each. While the latter two have 12 and 15 MW power capacity, respectively. It is to be noted that floating wind turbines with a power capacity of 10 MW throughout this paper have a rated wind speed of 11.4 m/s each. While the other floating wind turbines with 12 and 15 MW, respectively, have a rated wind speed of 10.6 m/s. Rated wind speed refers to the wind speed at which the corresponding floating wind turbines produce maximum power and have maximum response offsets.
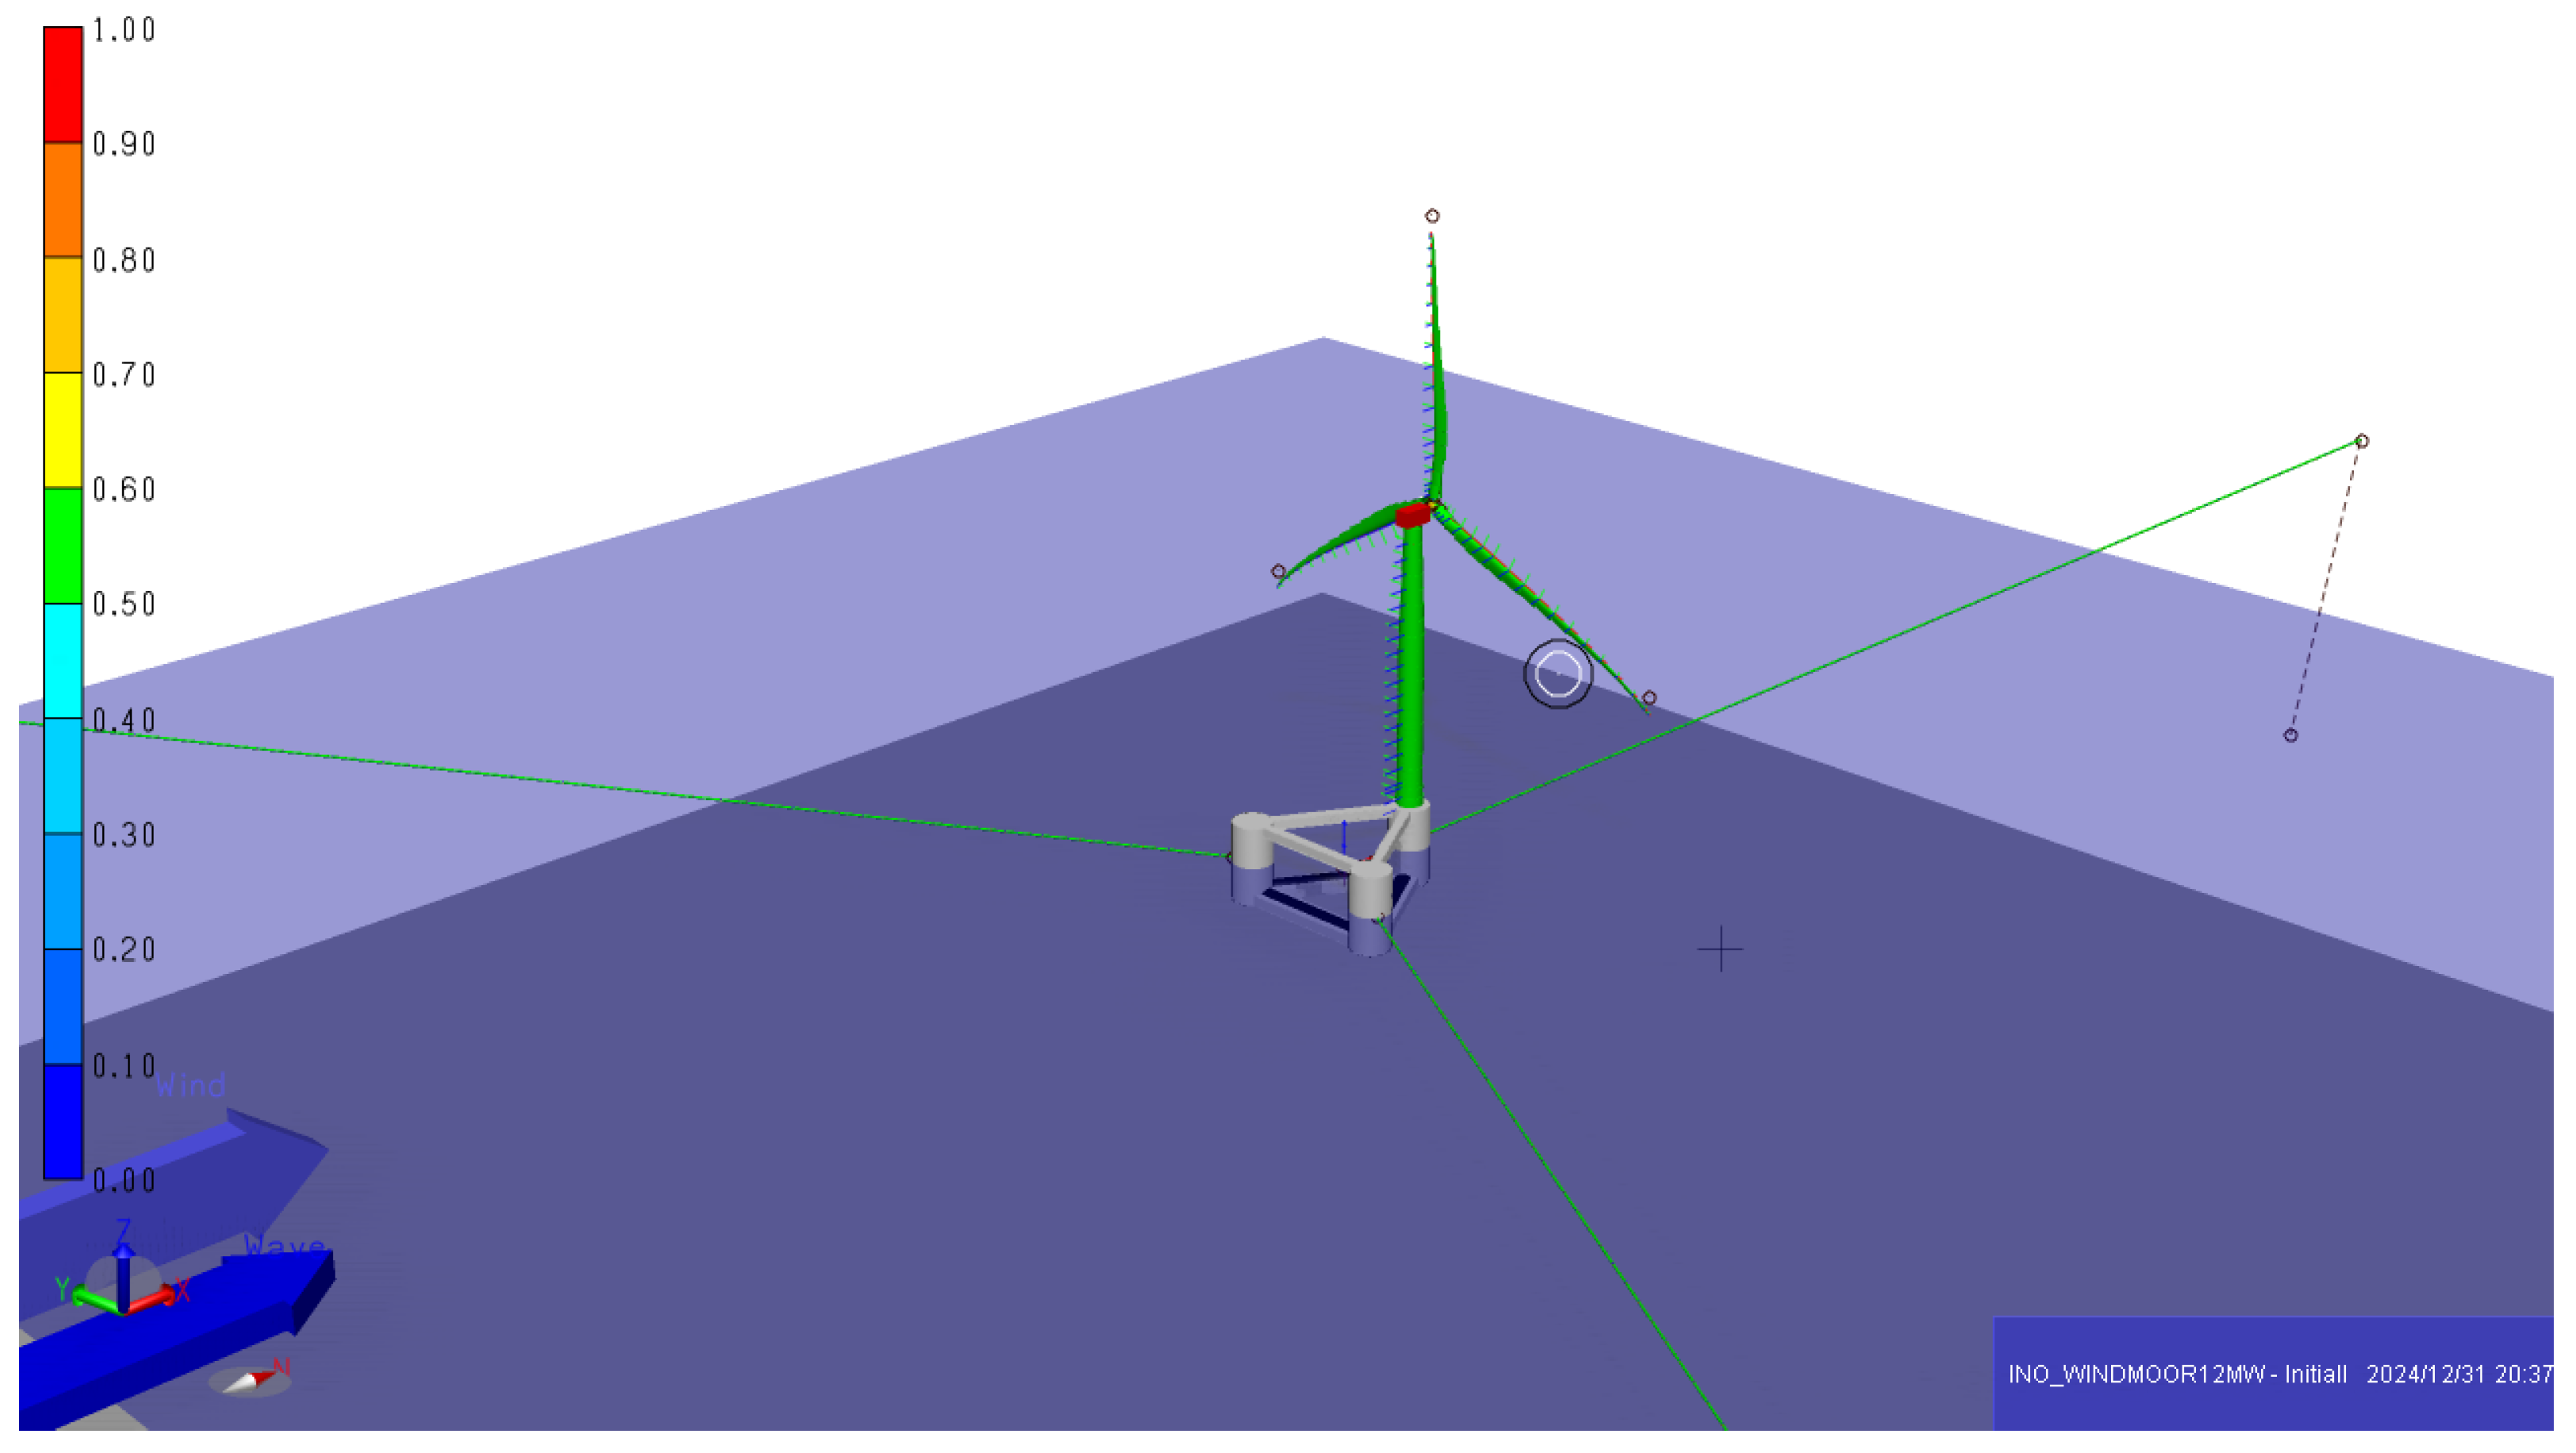
It is also to be noted that all the presented floating wind turbines throughout this study implement upwind turbines, except the INO-WINDMOOR semi-submersible, which implements a downwind turbine. This means that the latter floating wind turbine generates energy by allowing the wind to hit the backside of its blades (see
Figure A7 in
Appendix A, which illustrates the directions of wind and wave by arrows). Also, refer to the floating wind turbine models presented in
Figure A1,
Figure A2,
Figure A3,
Figure A4,
Figure A5,
Figure A6,
Figure A7 and
Figure A8 in the Appendix. These figures also show the wind direction that the eight floating wind turbines are subjected to. Note that the direction of the wave and current is the same as that of the wind for all eight floating wind turbines studied in this paper.
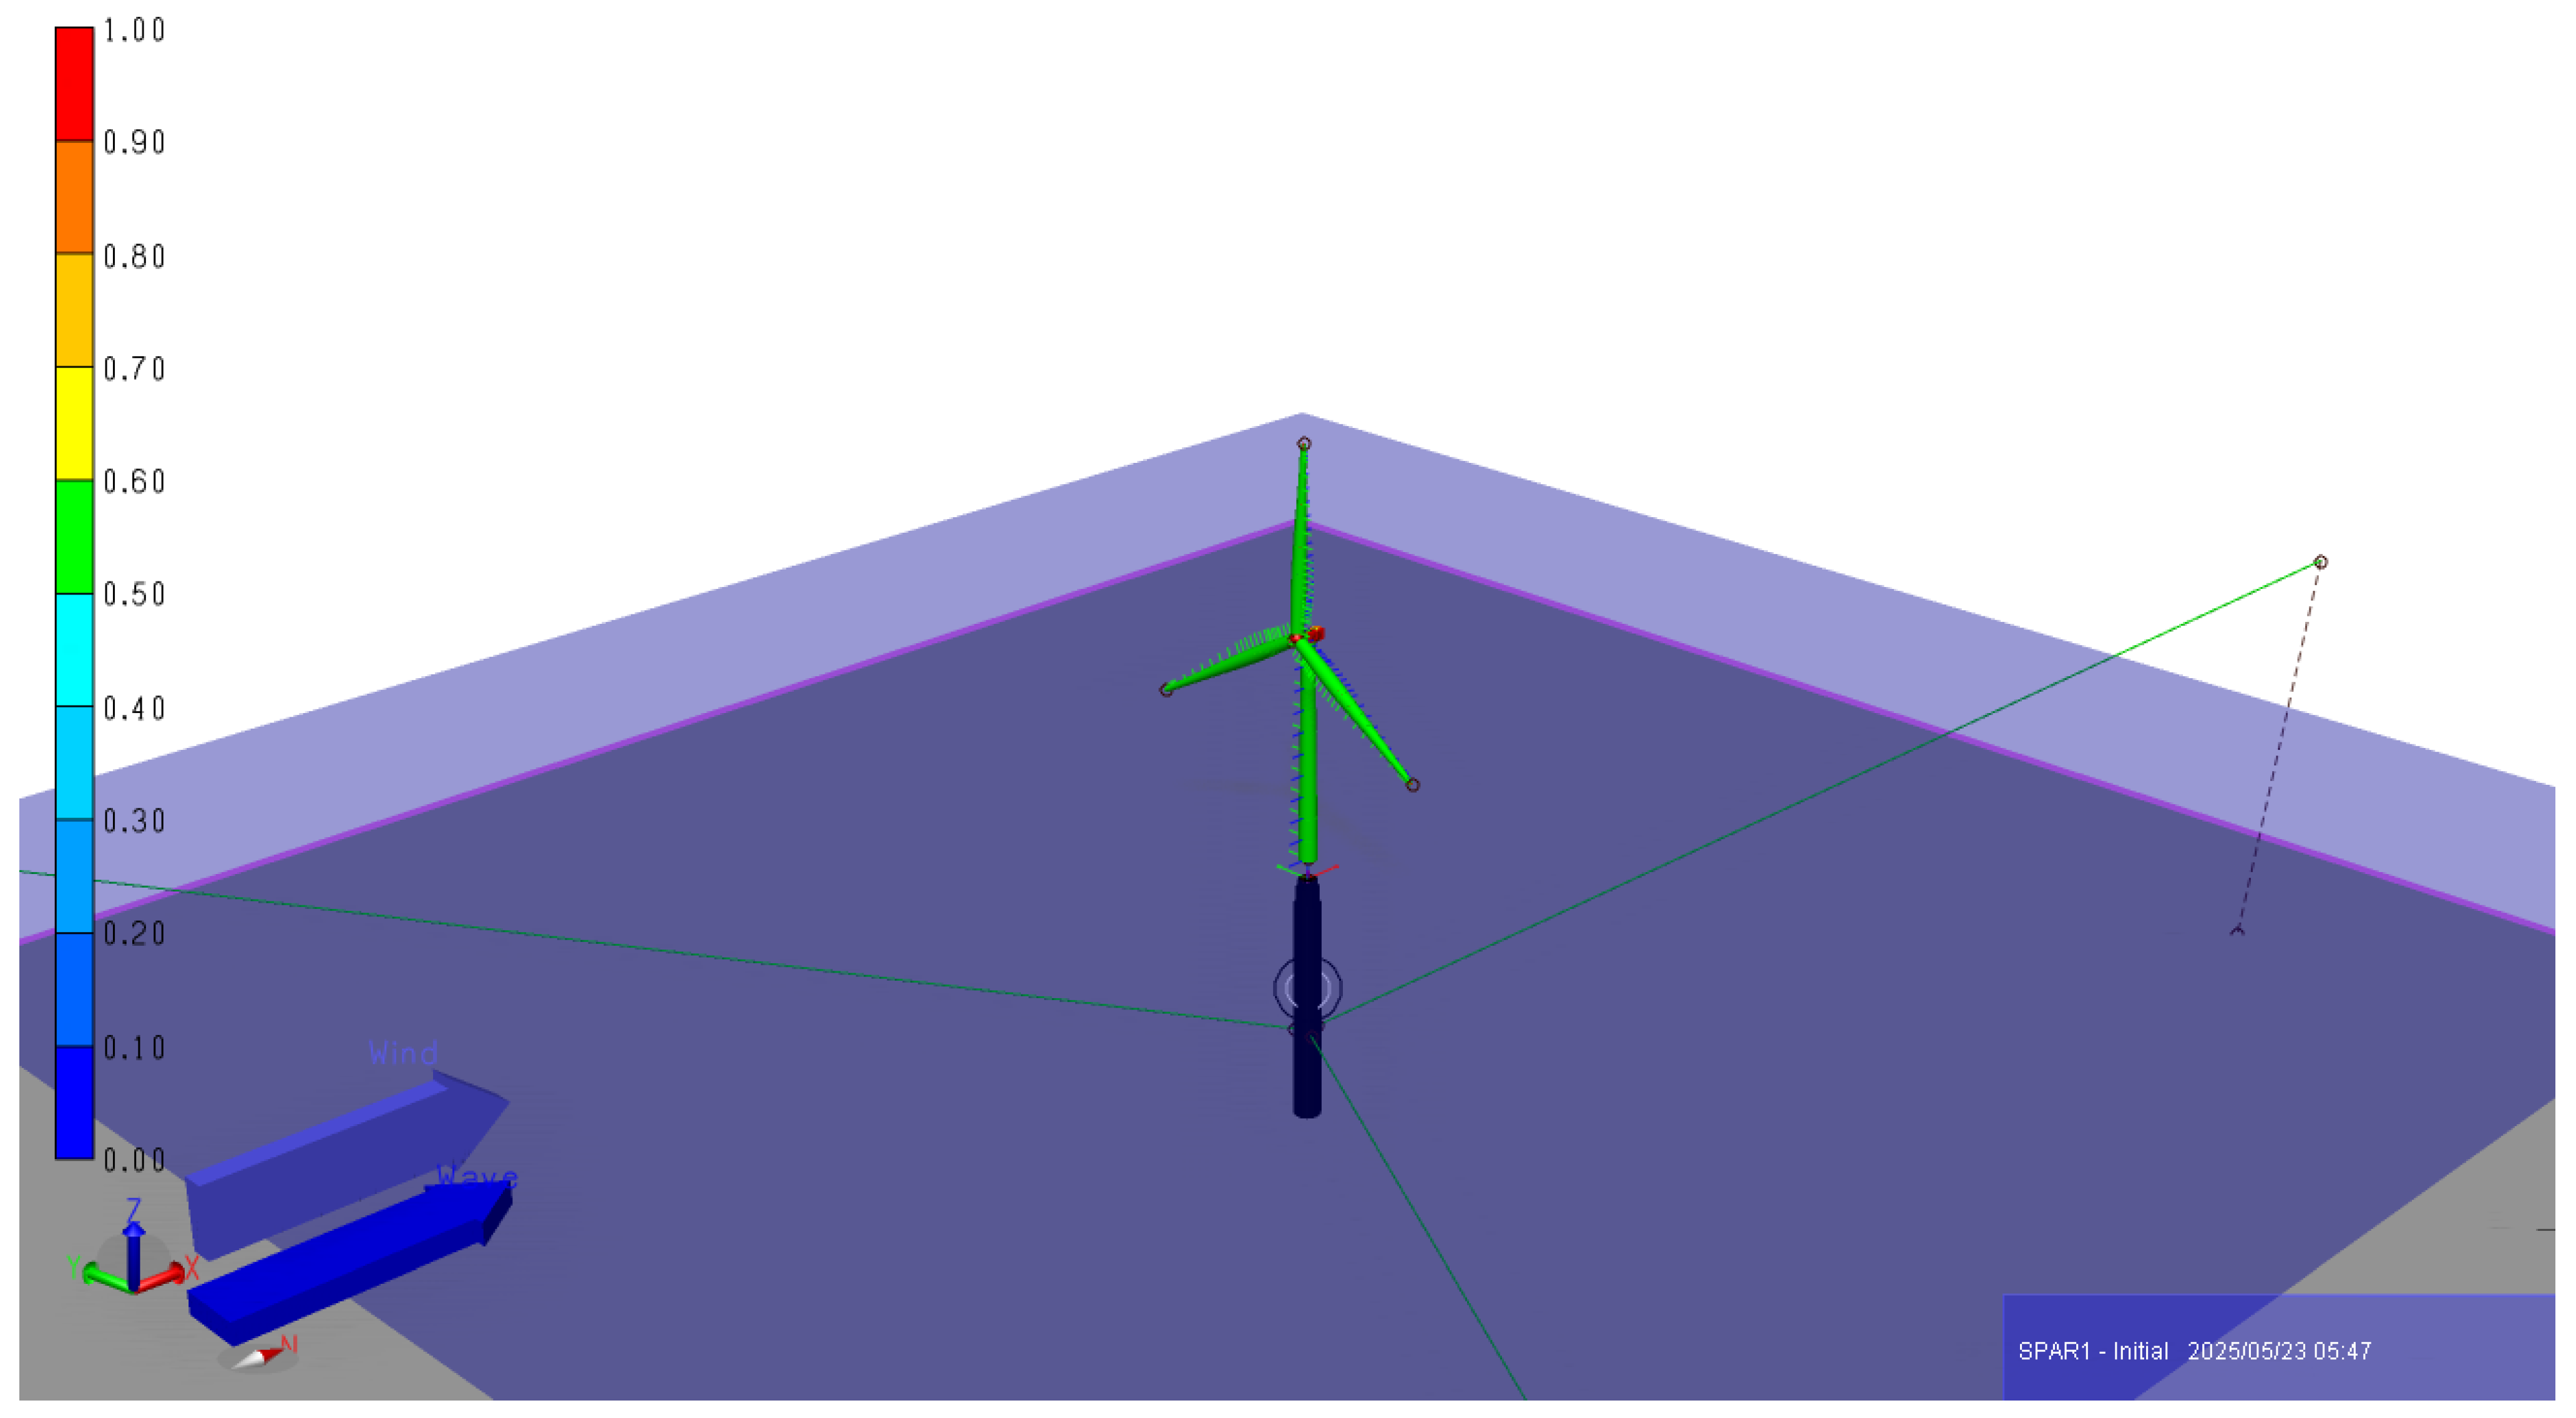
Figure A4 and
Figure A5 in
Appendix A show two floating wind turbines with a spar type (DTU Spar 1 and DTU Spar 2). Both turbines have the same power capacity of 10 MW and share most characteristics, including water depth, with a slight modification in the height of their support structures (see
Figure A4 and
Figure A5 and
Table A4 and
Table A5 in
Appendix A for further details).
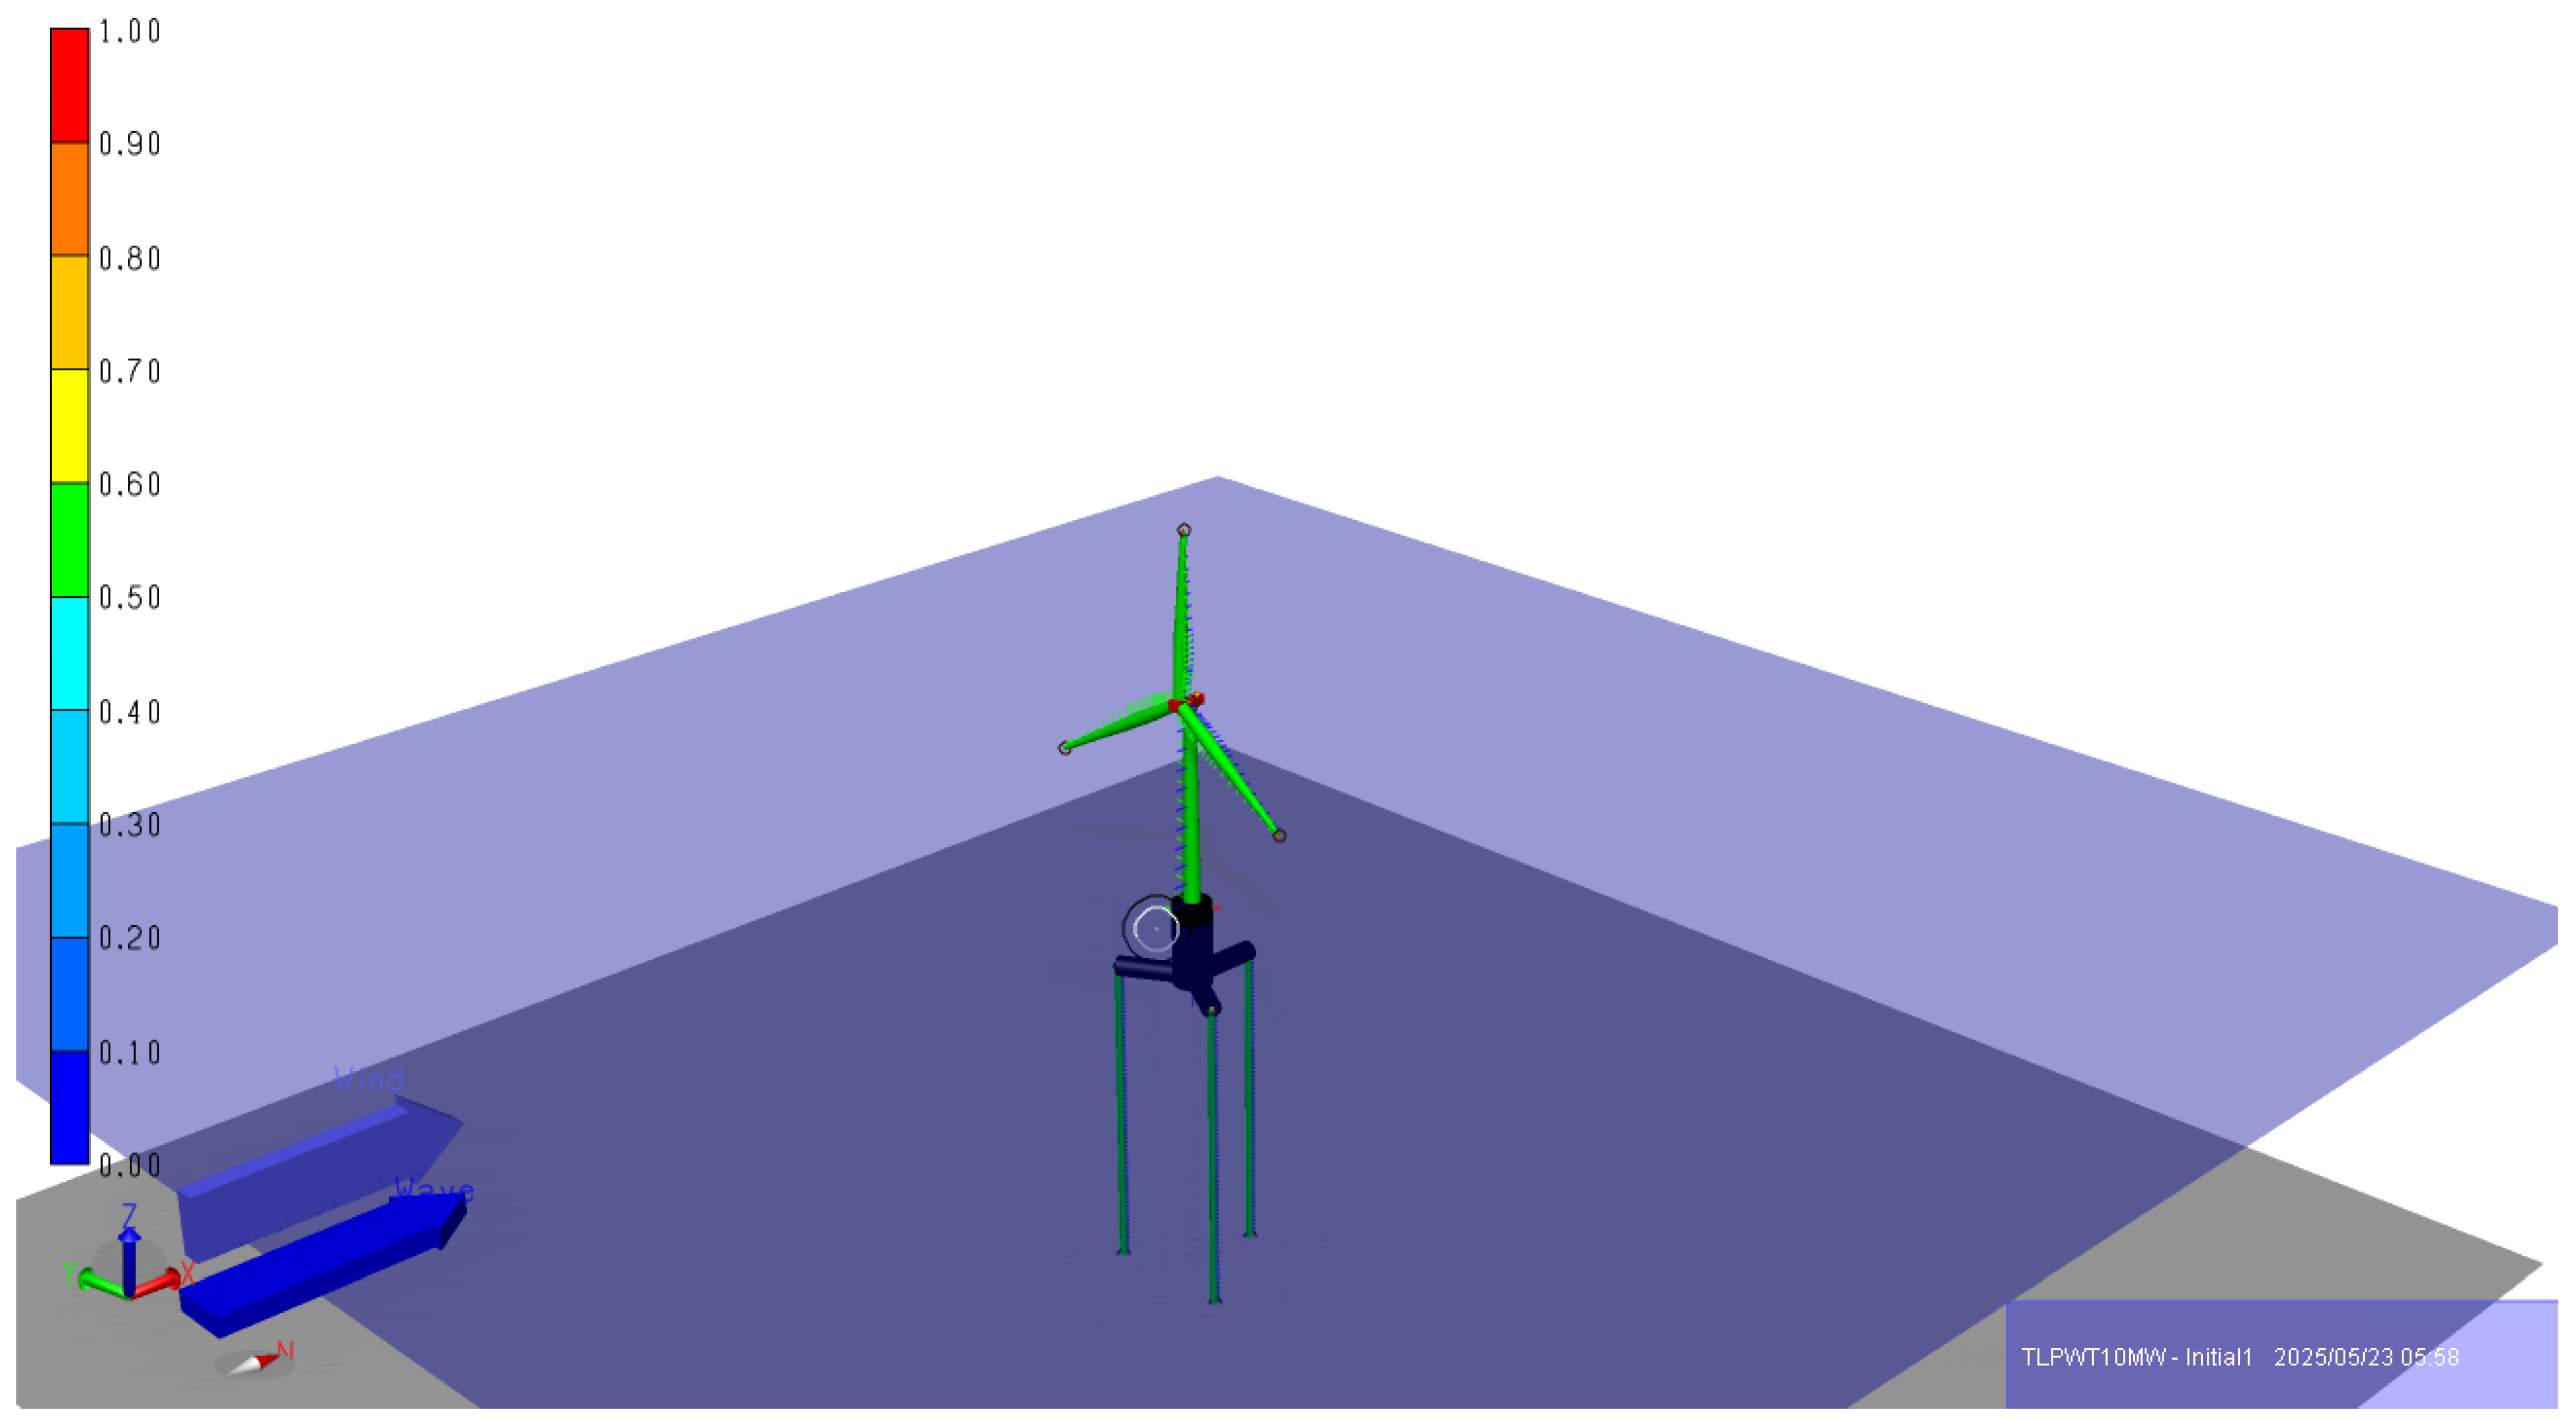
Figure A6 in
Appendix A shows a floating wind turbine with a TLP type. This turbine has a conventional power capacity of 10 MW.
Figure A2 and
Table A2 in
Appendix A illustrate the layout and the characteristics of the CSC floating wind turbine implemented in the Sima software.
Figure A3 and
Table A3 in
Appendix A illustrate the layout and the characteristics of the WindFloat floating wind turbine implemented in the Sima software.
Figure A4 and
Table A4 in
Appendix A illustrate the layout and the characteristics of the DTU Spar 1 floating wind turbine implemented in the Sima software.
Figure A5 and
Table A5 in
Appendix A illustrate the layout and the characteristics of the DTU Spar 2 floating wind turbine implemented in the Sima software.
Figure A6 and
Table A6 in
Appendix A illustrate the layout and the characteristics of the TLPWT floating wind turbine implemented in the Sima software.
Figure A7 and
Table A7 in
Appendix A illustrate the layout and the characteristics of the INO-WINDMOOR floating wind turbine implemented in the Sima software.
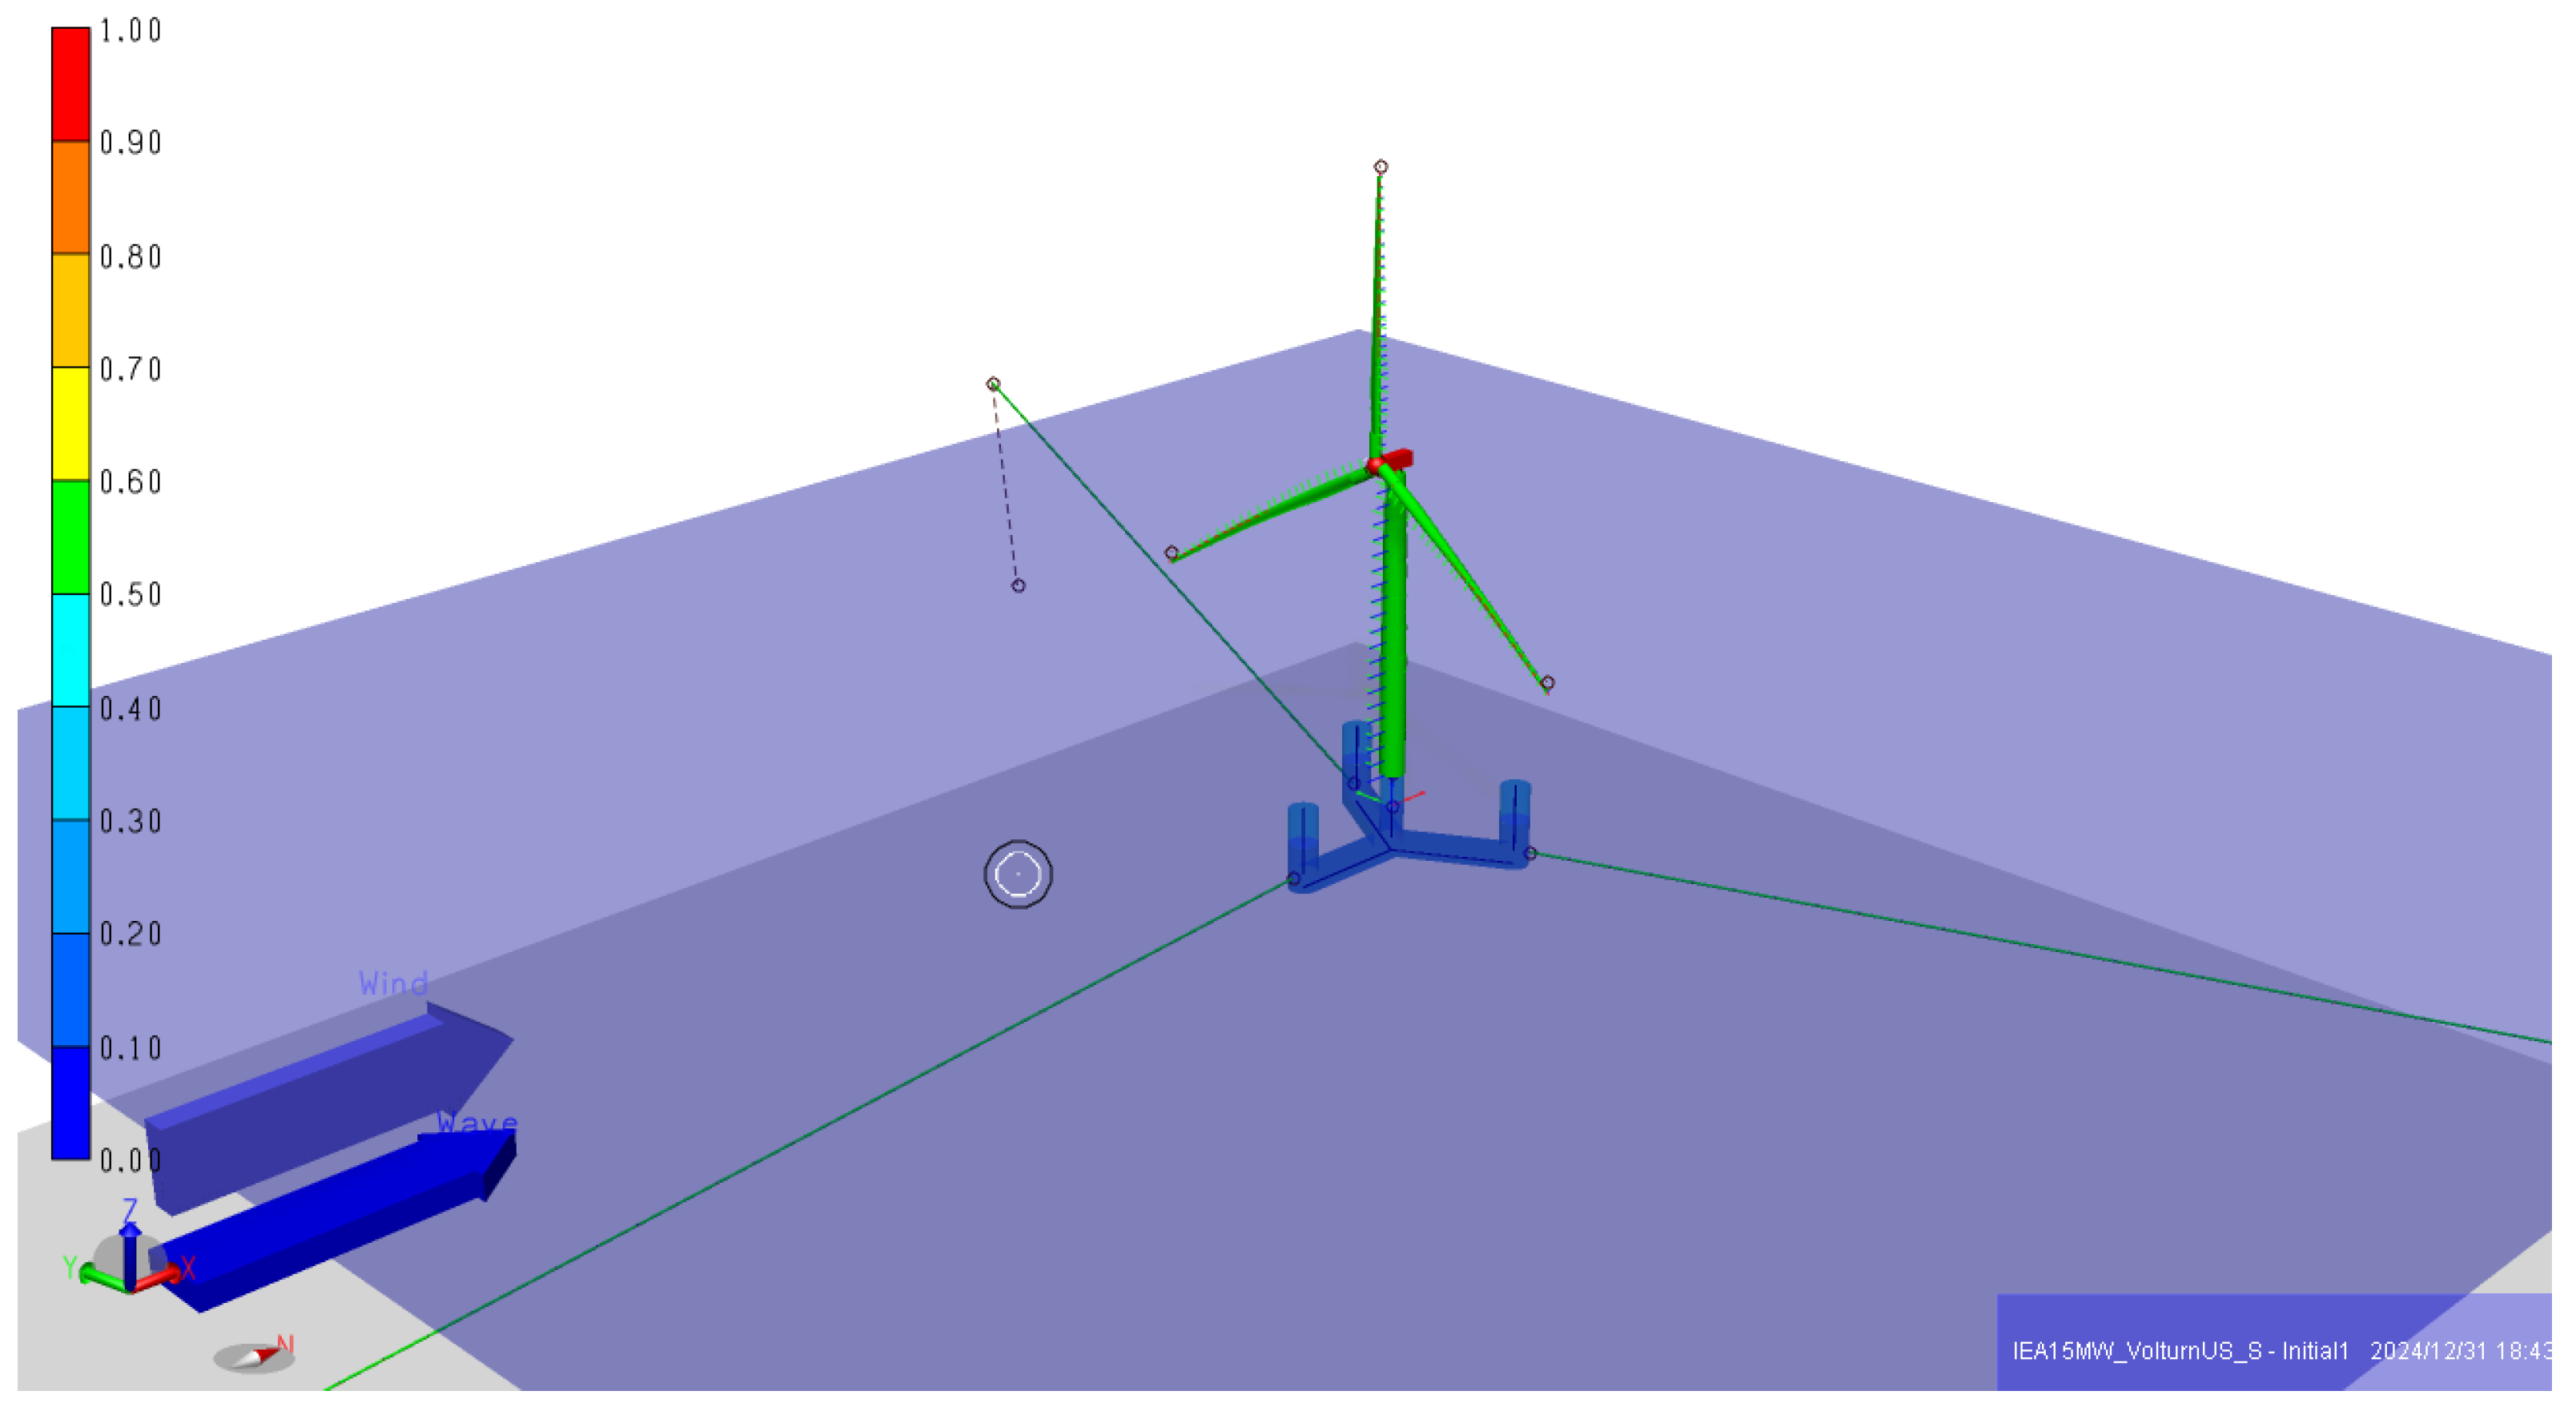
Figure A8 and
Table A8 in
Appendix A illustrate the layout and the characteristics of the VolturnUS-S floating wind turbine implemented in the Sima software [
45].
The models of the analyzed eight floating wind turbines in this paper were taken from [
46]. These Sima 4.6.4 models were used to carry out the constant wind dynamic analyses, and their output data (response offset results) are presented in
Section 3 of this paper.
Further state-of-the-art tools and external references related to floating wind turbines will be given in bullet points as follows:
- -
Innovative aspects of relevance to floating wind turbines’ building and classing standards and dynamic responses [
47,
48,
49].
- -
Innovative aspects related to floating wind inter-array dynamic power cables’ analyses, design, and software [
50,
51,
52,
53,
54,
55,
56].
Innovative aspects relevant to floating wind turbines’ operations and structural design tools [
57,
58,
59].
- -
Floating wind turbine analysis software such as SESAM (including GeniE, HydroD, Sima, etc.), Bladed, OrcaFlex, Riflex, and DeepC [
60,
61,
62,
63,
64,
65,
66,
67].
- -
Bottom-fixed and floating wind turbine failure analyses concerning their components [
68].
- -
Floating wind turbine design aspects, response, and reliability analyses [
69,
70].
- -
Bottom-fixed and floating wind turbines’ response analyses, software, and numerical tools [
71].
- -
Floating wind farms and array-level floating wind turbines’ innovative designs and challenges [
72].
- -
Innovative aspects of relevance to floating wind turbine verification and design tools [
73,
74].
- -
Floating wind turbines’ redundant components, such as blades and drivetrain, including the nacelle, generator, and gearbox, as well as floating wind turbine hydrodynamic challenges relevant to its implementation in shallow water depths [
75,
76].
- -
Floating wind turbine station-keeping mooring system design and anchoring [
77].
- -
Dynamic and fatigue analyses related to the power cables of connected floating wind turbines using the OrcaFlex software, as well as dynamic power cables’ fatigue analyses of relevance to floating wind turbines, and floating wind turbines’ probabilistic fatigue design using the Monte Carlo simulation [
78,
79,
80].
- -
The Norwegian perspective on the European and global wind energy situation, as well as the positive stability effects controllers have on floating wind turbines implemented in high water depths [
81,
82].
- -
The positive effects of relevance to the repositioning of some floating wind turbines to enhance their electricity power output, as well as bottom-fixed and floating wind turbines’ power performance and extreme load analyses, and predictions and challenges relevant to huge floating wind turbines [
83,
84].
- -
Offshore wind certification requirements and standards in different countries worldwide. As well as vortex-induced vibration (VIV) fatigue analyses of floating wind dynamic power cables [
85,
86].
The next section will present the materials and methods of relevance to the different floating wind dynamic analyses carried out in this paper.
2. Materials and Methods
This section will present some aspects of the mathematical background behind the Sima 4.6.4 software that is used to carry out the constant wind dynamic analyses of the eight floating wind turbines studied in this paper.
The Sima software is dedicated to floating wind turbines due to its computational capabilities that allow for fully coupled dynamic analyses based on the aero-hydro-servo-elastic theory. The Sima software has the capability of calculating aerodynamic and hydrodynamic loads. It has the capability of controlling dynamic loads using the control theory, as well as calculating mooring system structural dynamics loads using the elastic theory of relevance to the mooring system.
According to [
87], the Sima software implements SIMO and Riflex models. The SIMO model is used to design the rigid floating support structure. The Riflex model, on the other hand, is used to design the wind turbine that is coupled to the floating wind support structure using a flexible tower. The RIFLEX model is also used to design the mooring lines that are coupled to the floating wind support structure.
The wind turbine is implemented in RIFLEX based on the Blade Element Momentum (BEM) theory. The tower is modeled using tens of beam elements. The mooring lines are designed using bar elements with master supernodes at the support structure’s origin and slave super modes at the fairleads. Further details on the controller and mooring line design can be found in [
88,
89].
The support structure modeled in SIMO is subjected to wave loads, and it is subjected to loads that come from the finite element structures designed in RIFLEX.
According to [
87], the implemented time-domain equation of motion in the Sima software is as follows:
where
m: inertia matrix obtained from platform’s steel and ballast masses;
: added mass of infinite frequency;
: external linear damping matrix;
: restoring hydrostatic matrix;
: retardation matrix;
: vector with external loads, which includes first- and second-order loads, viscous loads (Morison terms), tower loads, and mooring-induced forces.
As was mentioned above, Sima is software that is dedicated to marine operations and floating wind turbines. It is an aero-hydro-servo-elastic software that uses potential flow theory for generating the sea surface.
According to [
90], the Sima software implements potential flow theory that is based on the velocity potential concept, which has the assumptions of incompressible and inviscid fluid and irrotational flow. The velocity potential in the potential flow theory will satisfy the Laplace equation based on the above assumptions mathematically as follows:
The constant wind dynamic analyses of the eight floating wind turbines analyzed in this paper using the Sima software are divided into three types: “Only wind” analyses, “Wind and wave” analyses, and “Wind, wave, and current” analyses. This is to compare the response offsets of the different analysis types.
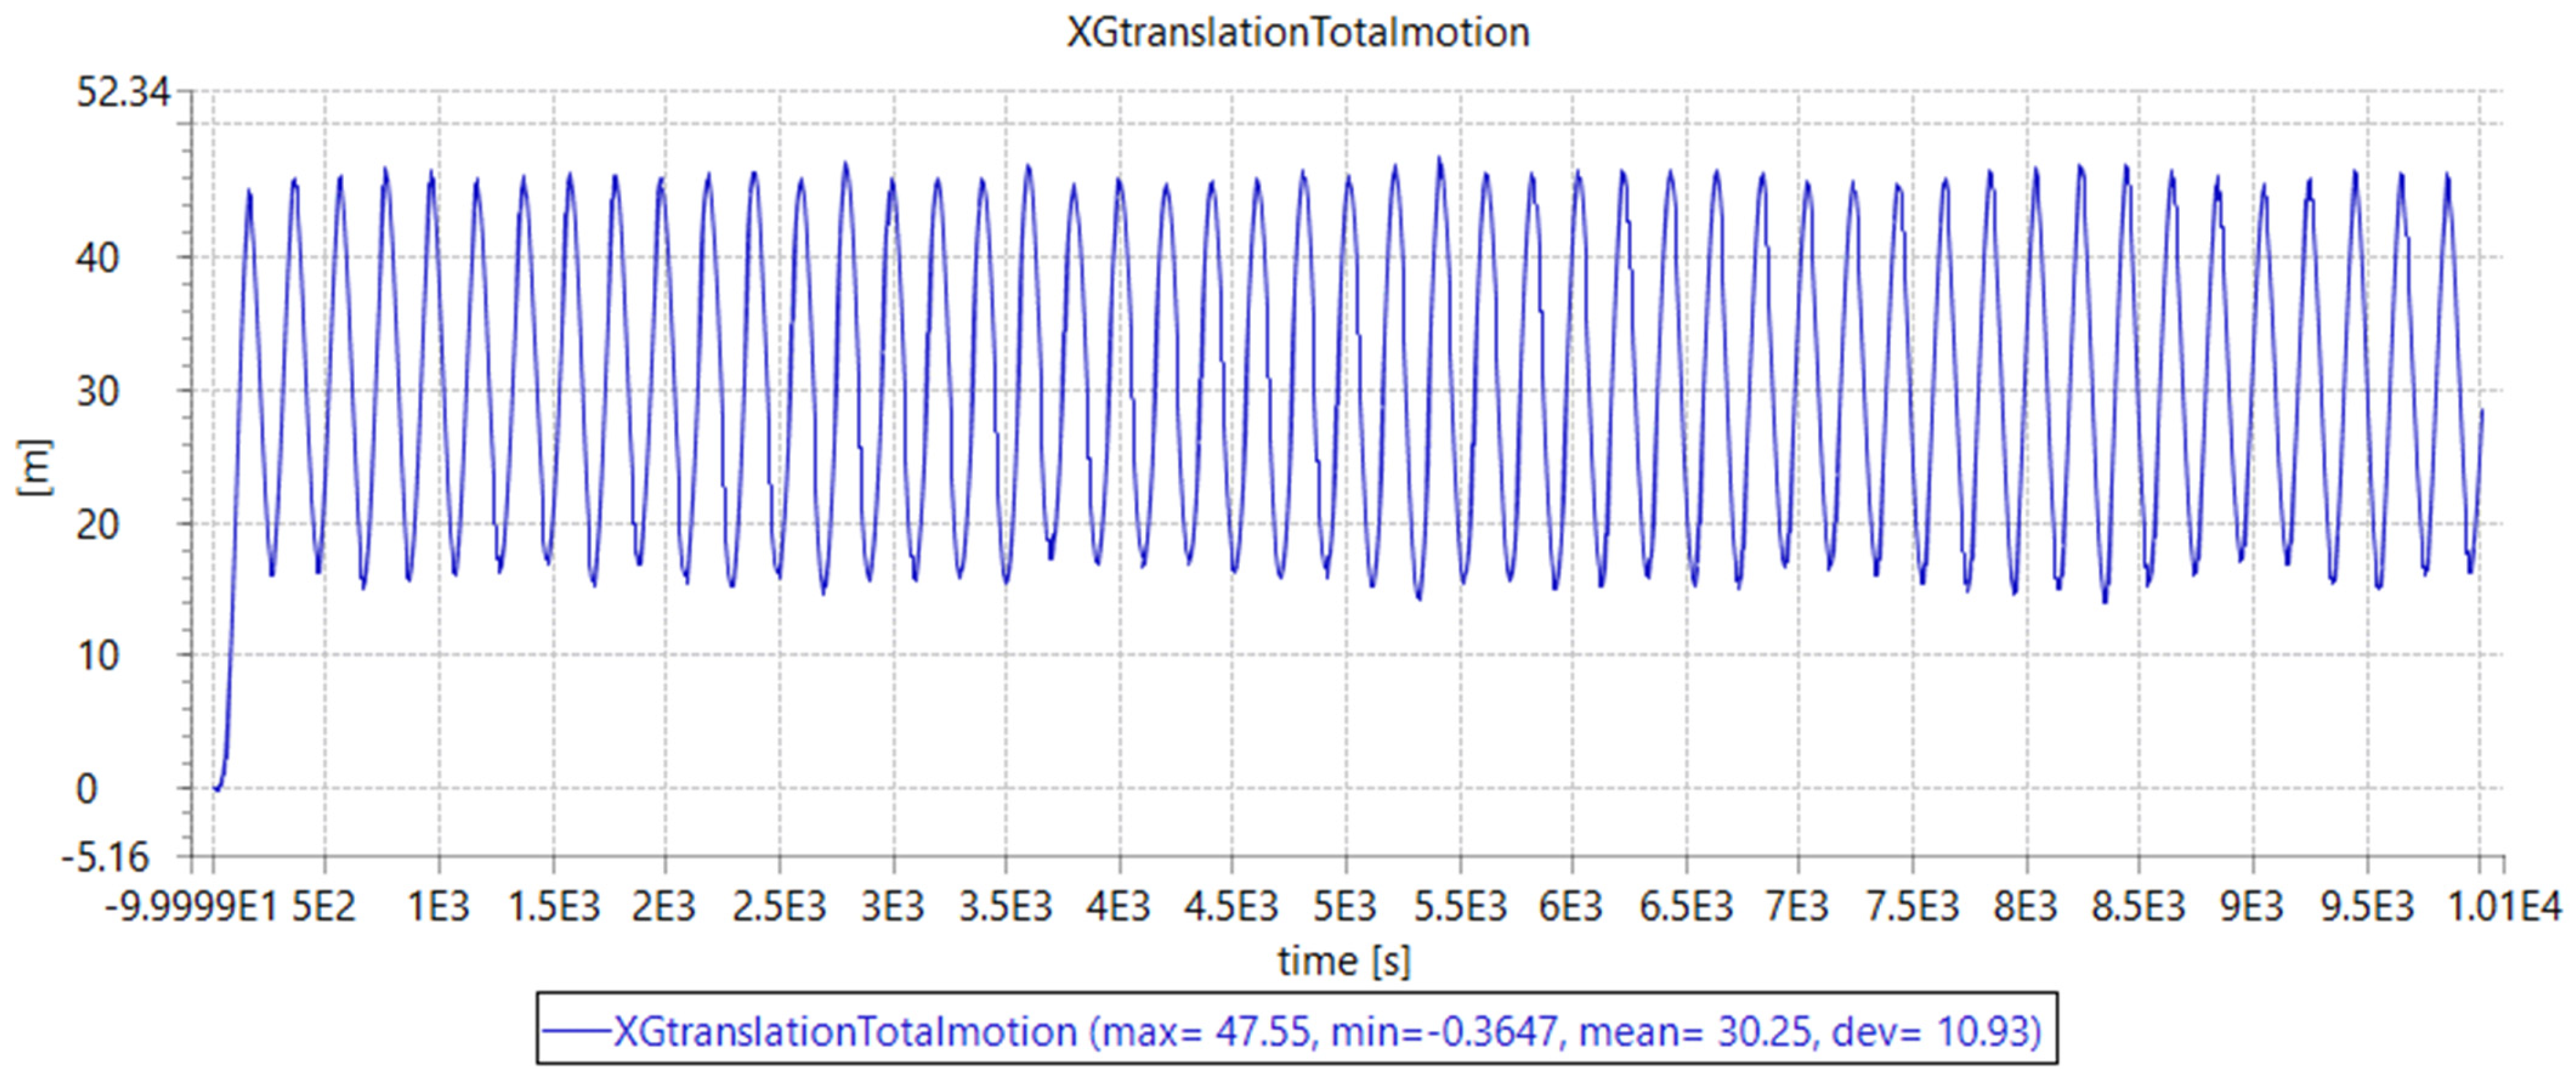
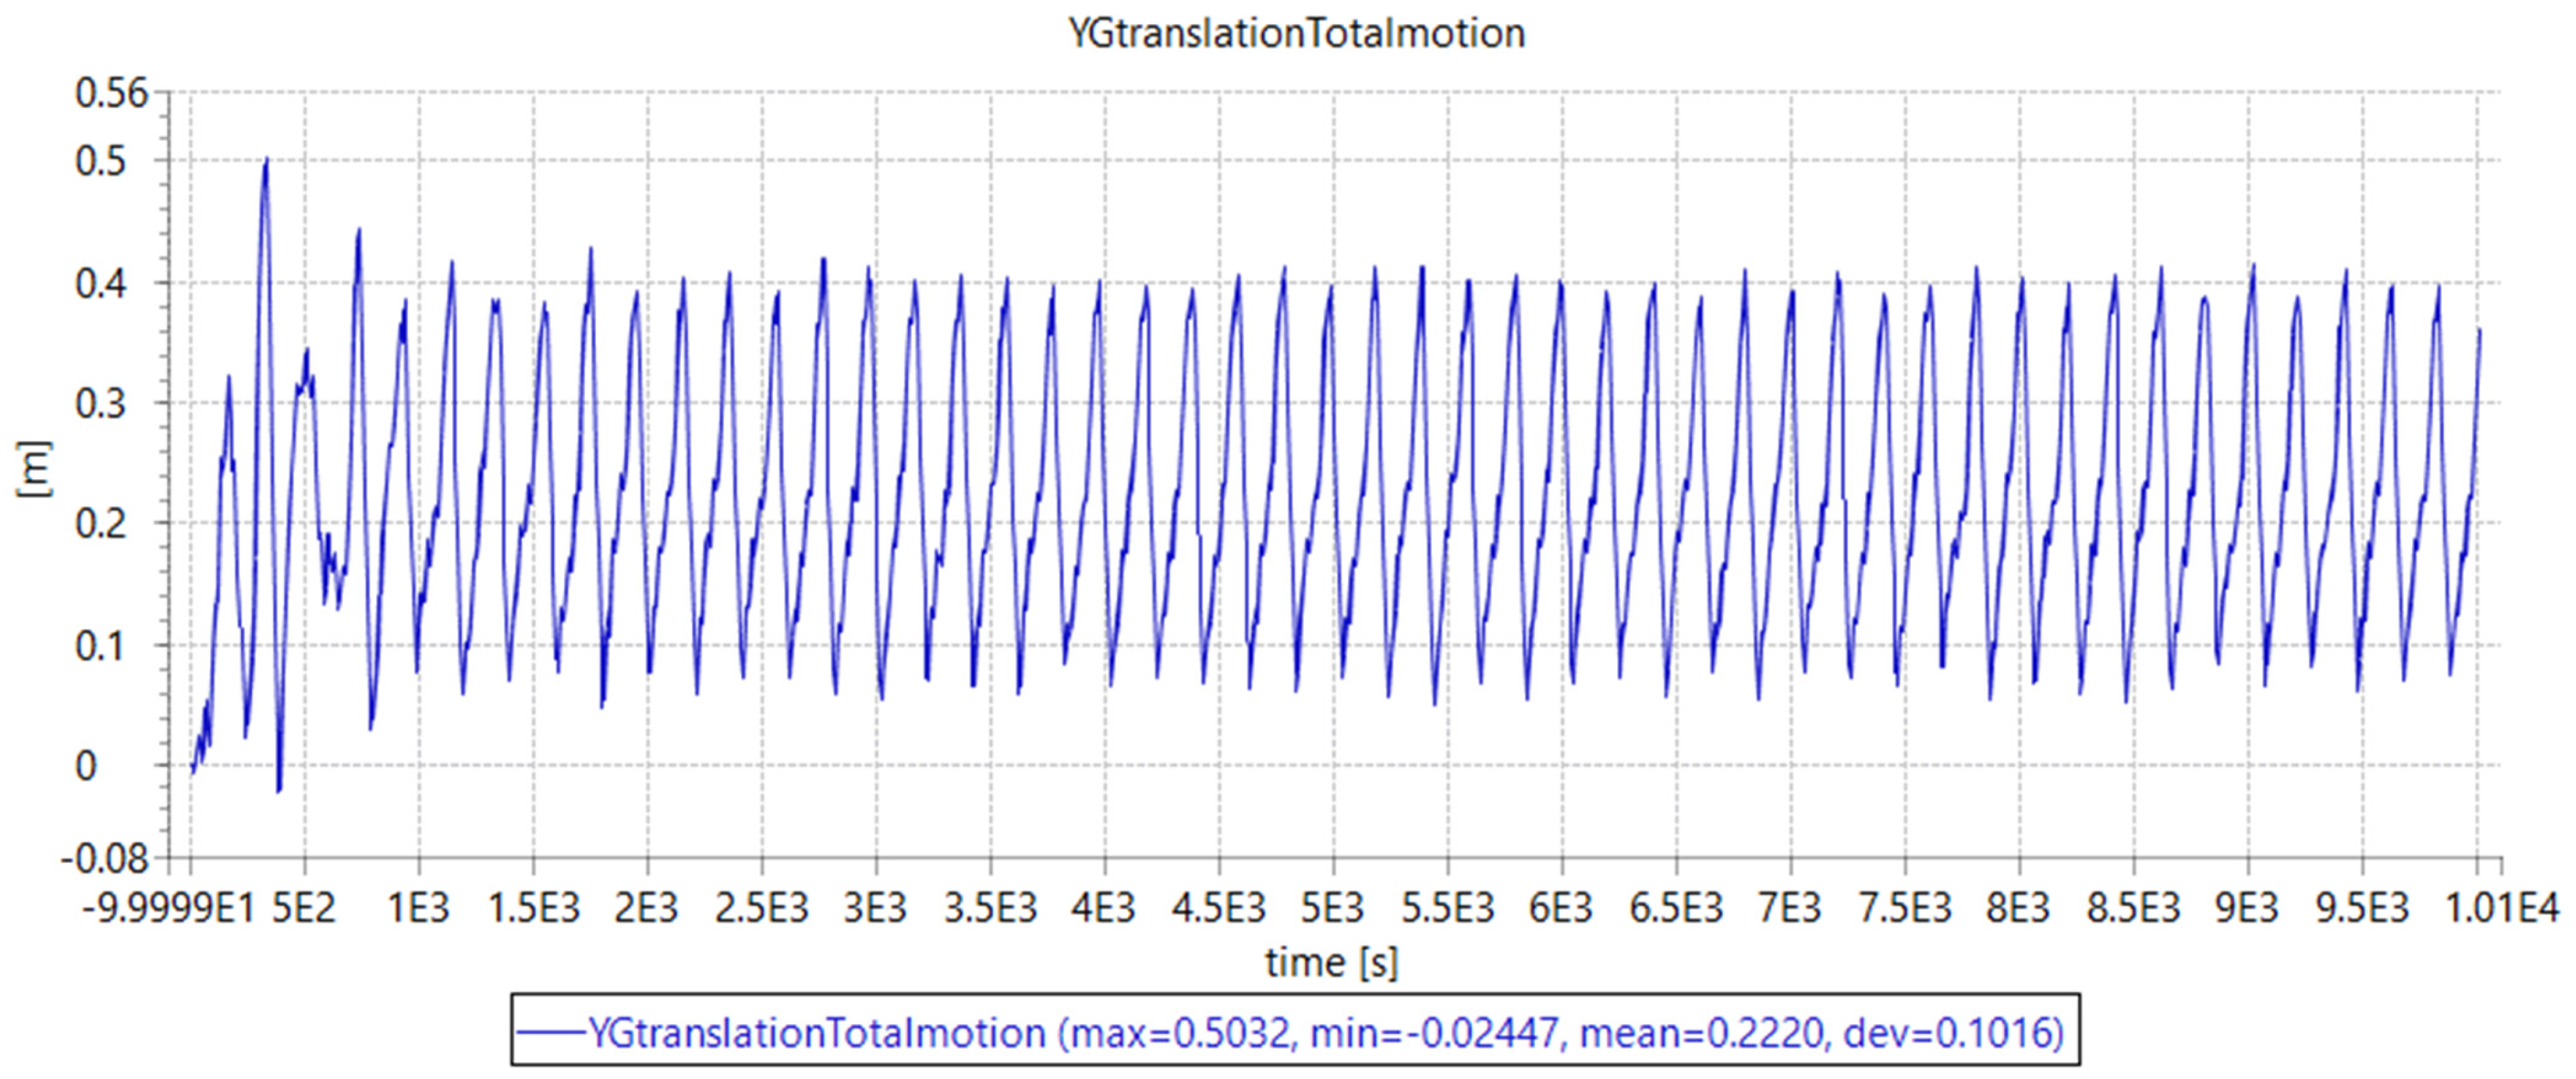
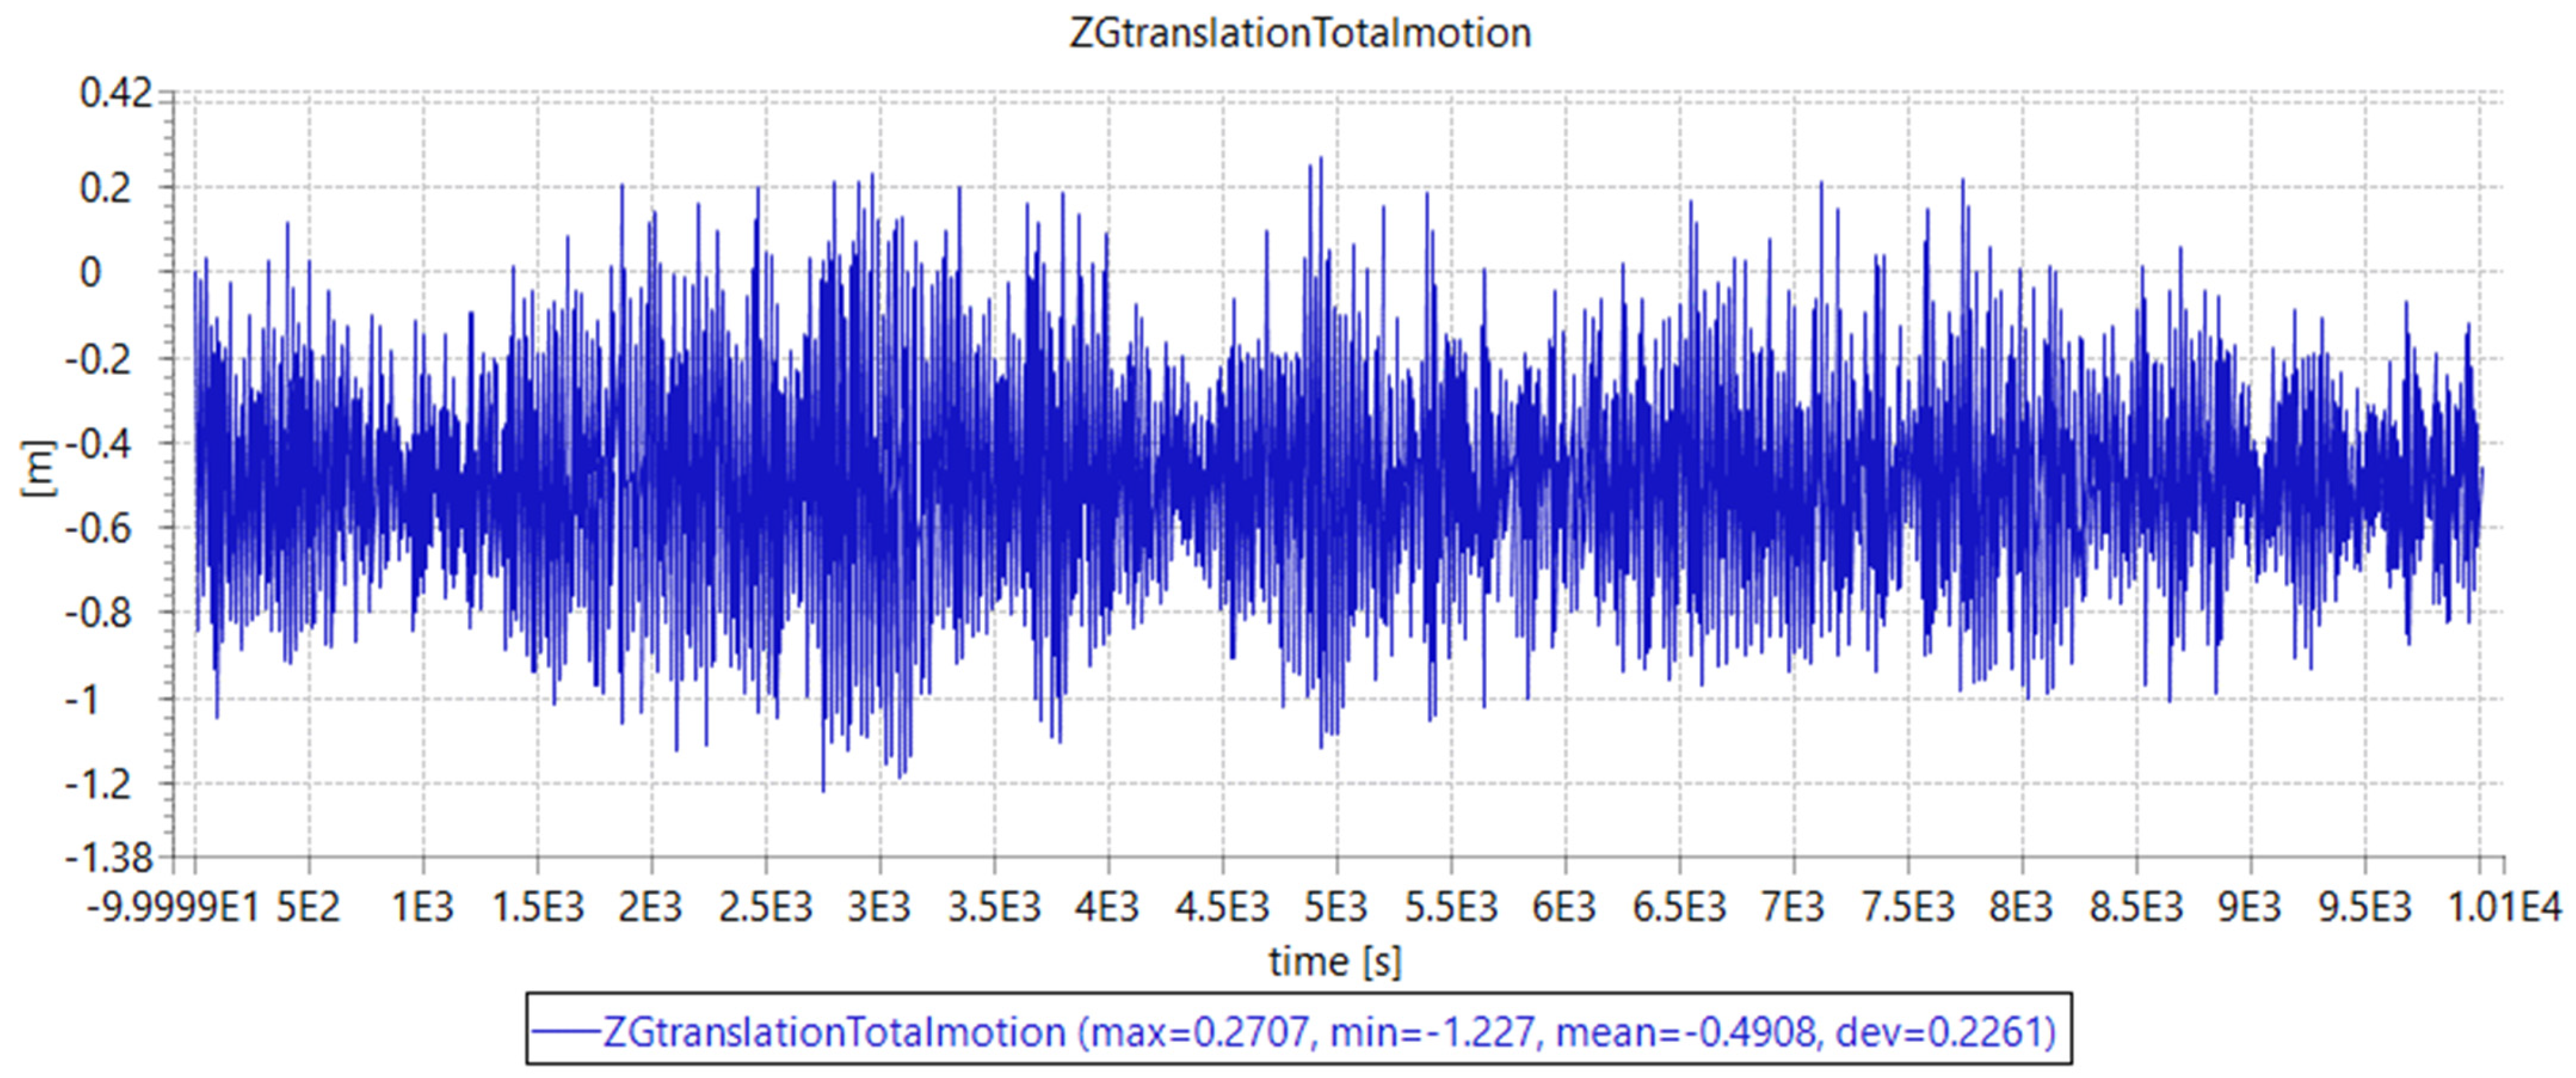
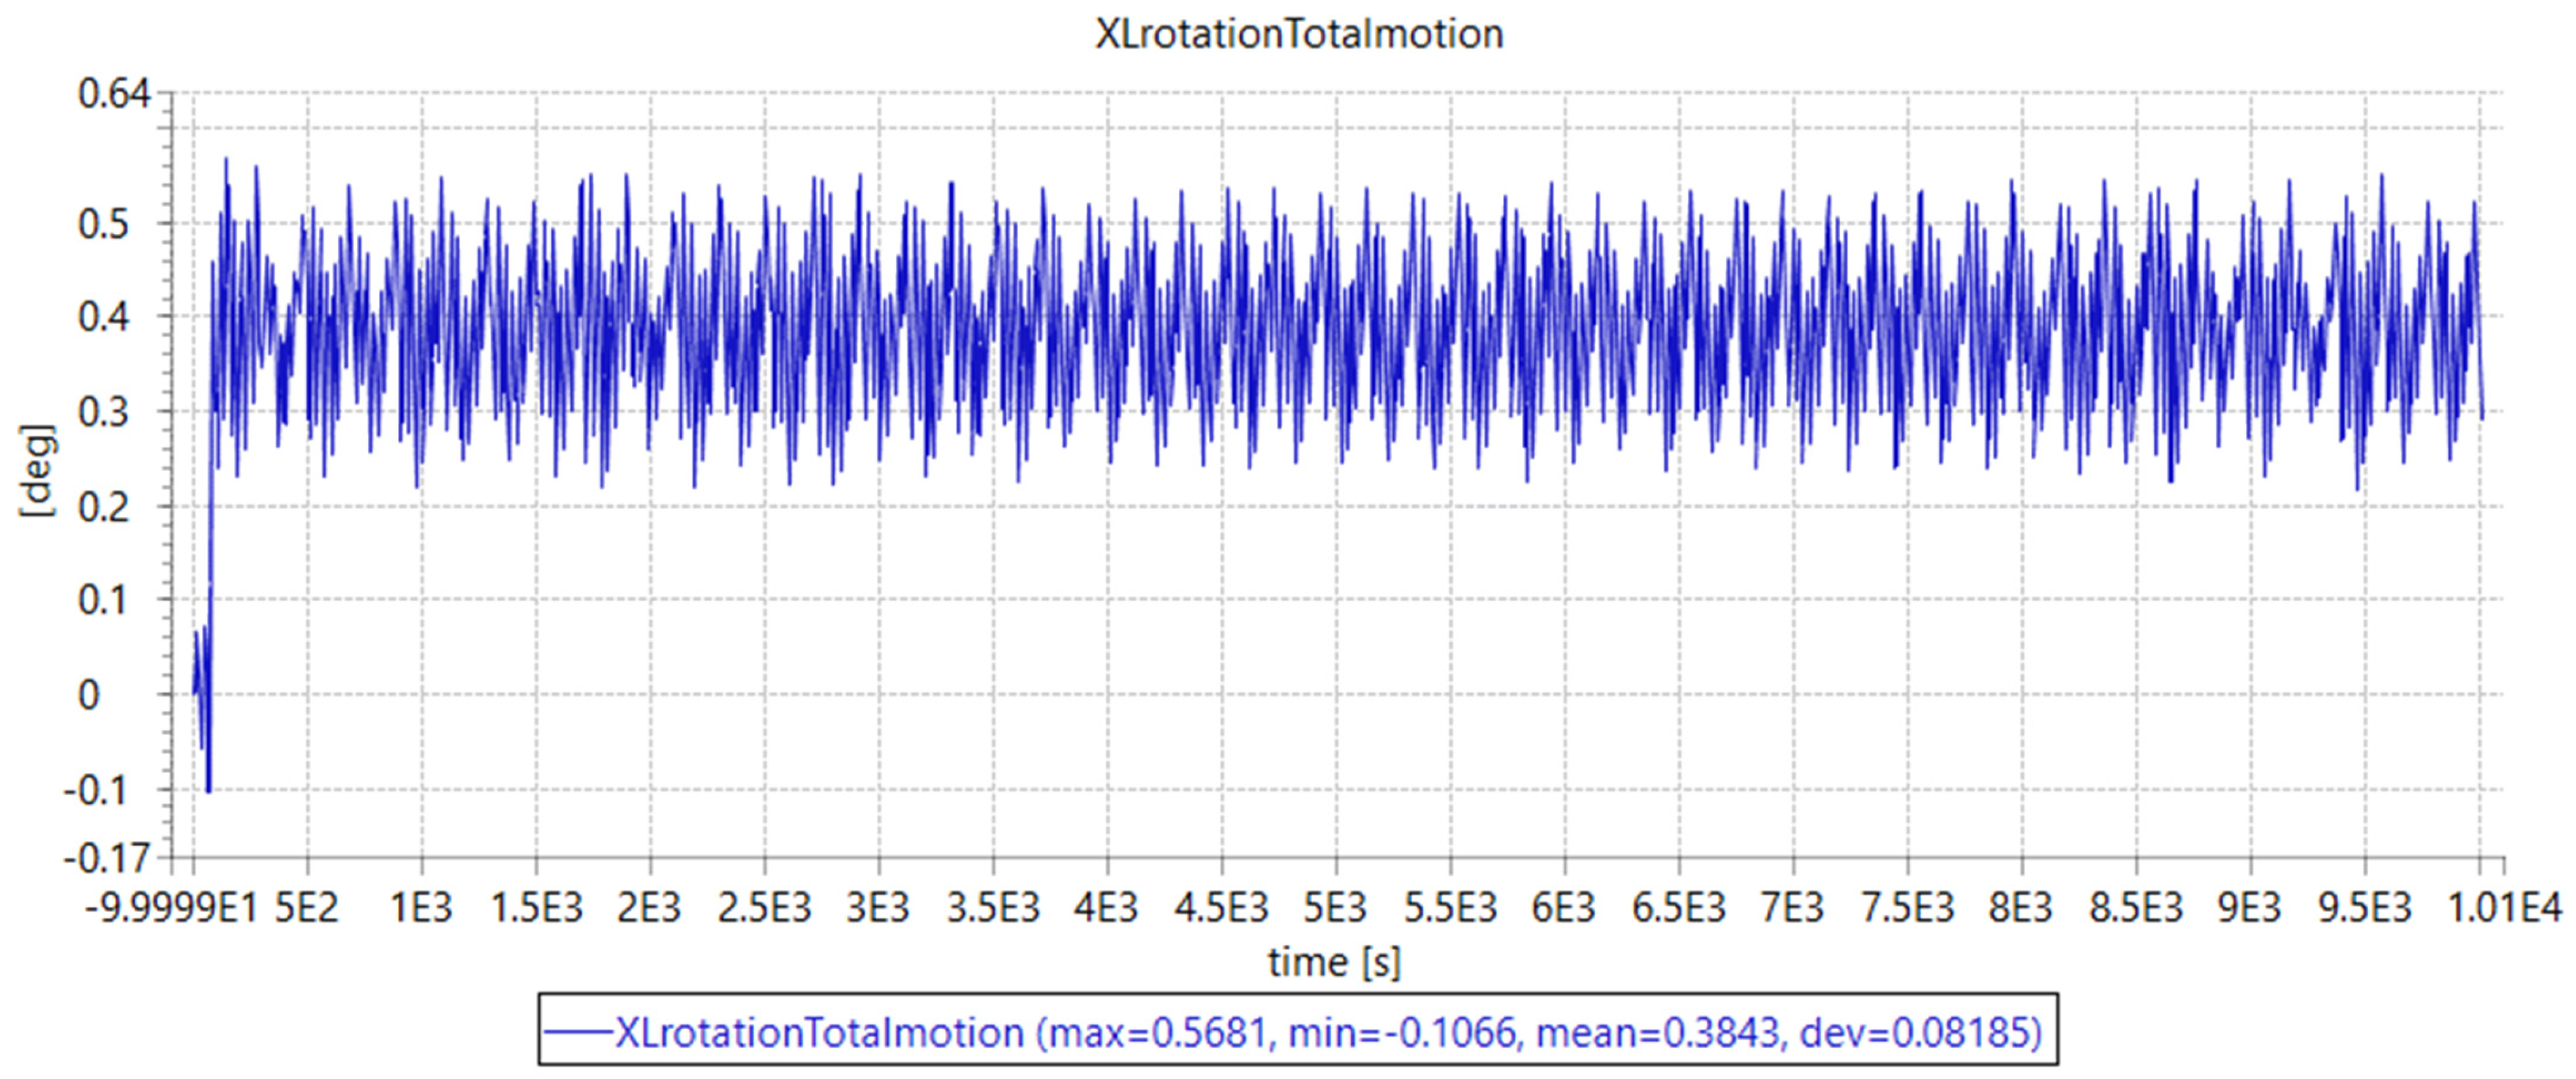
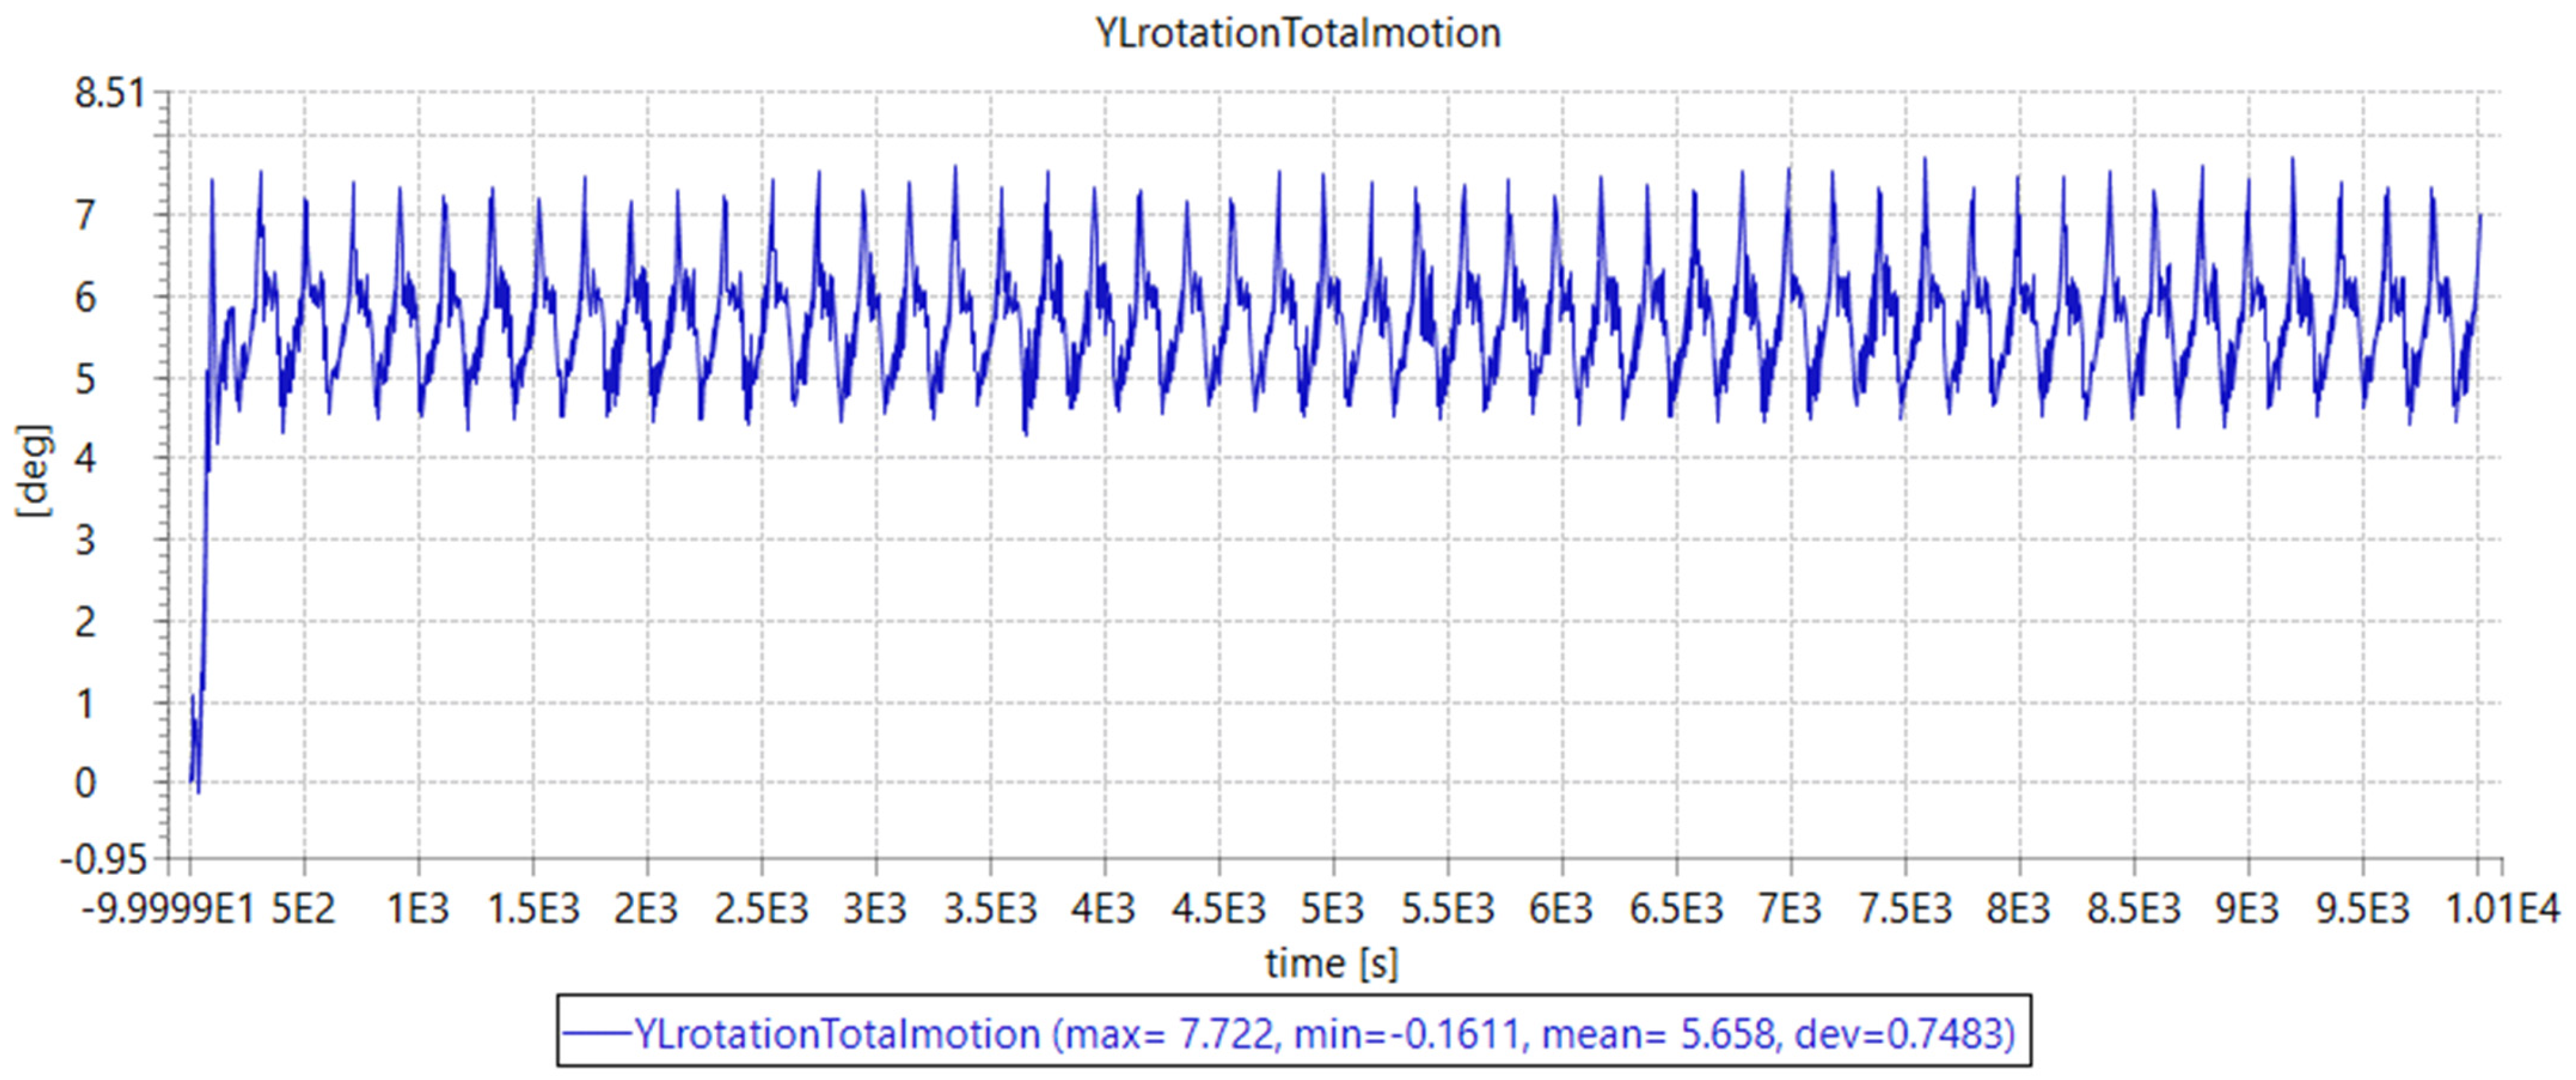
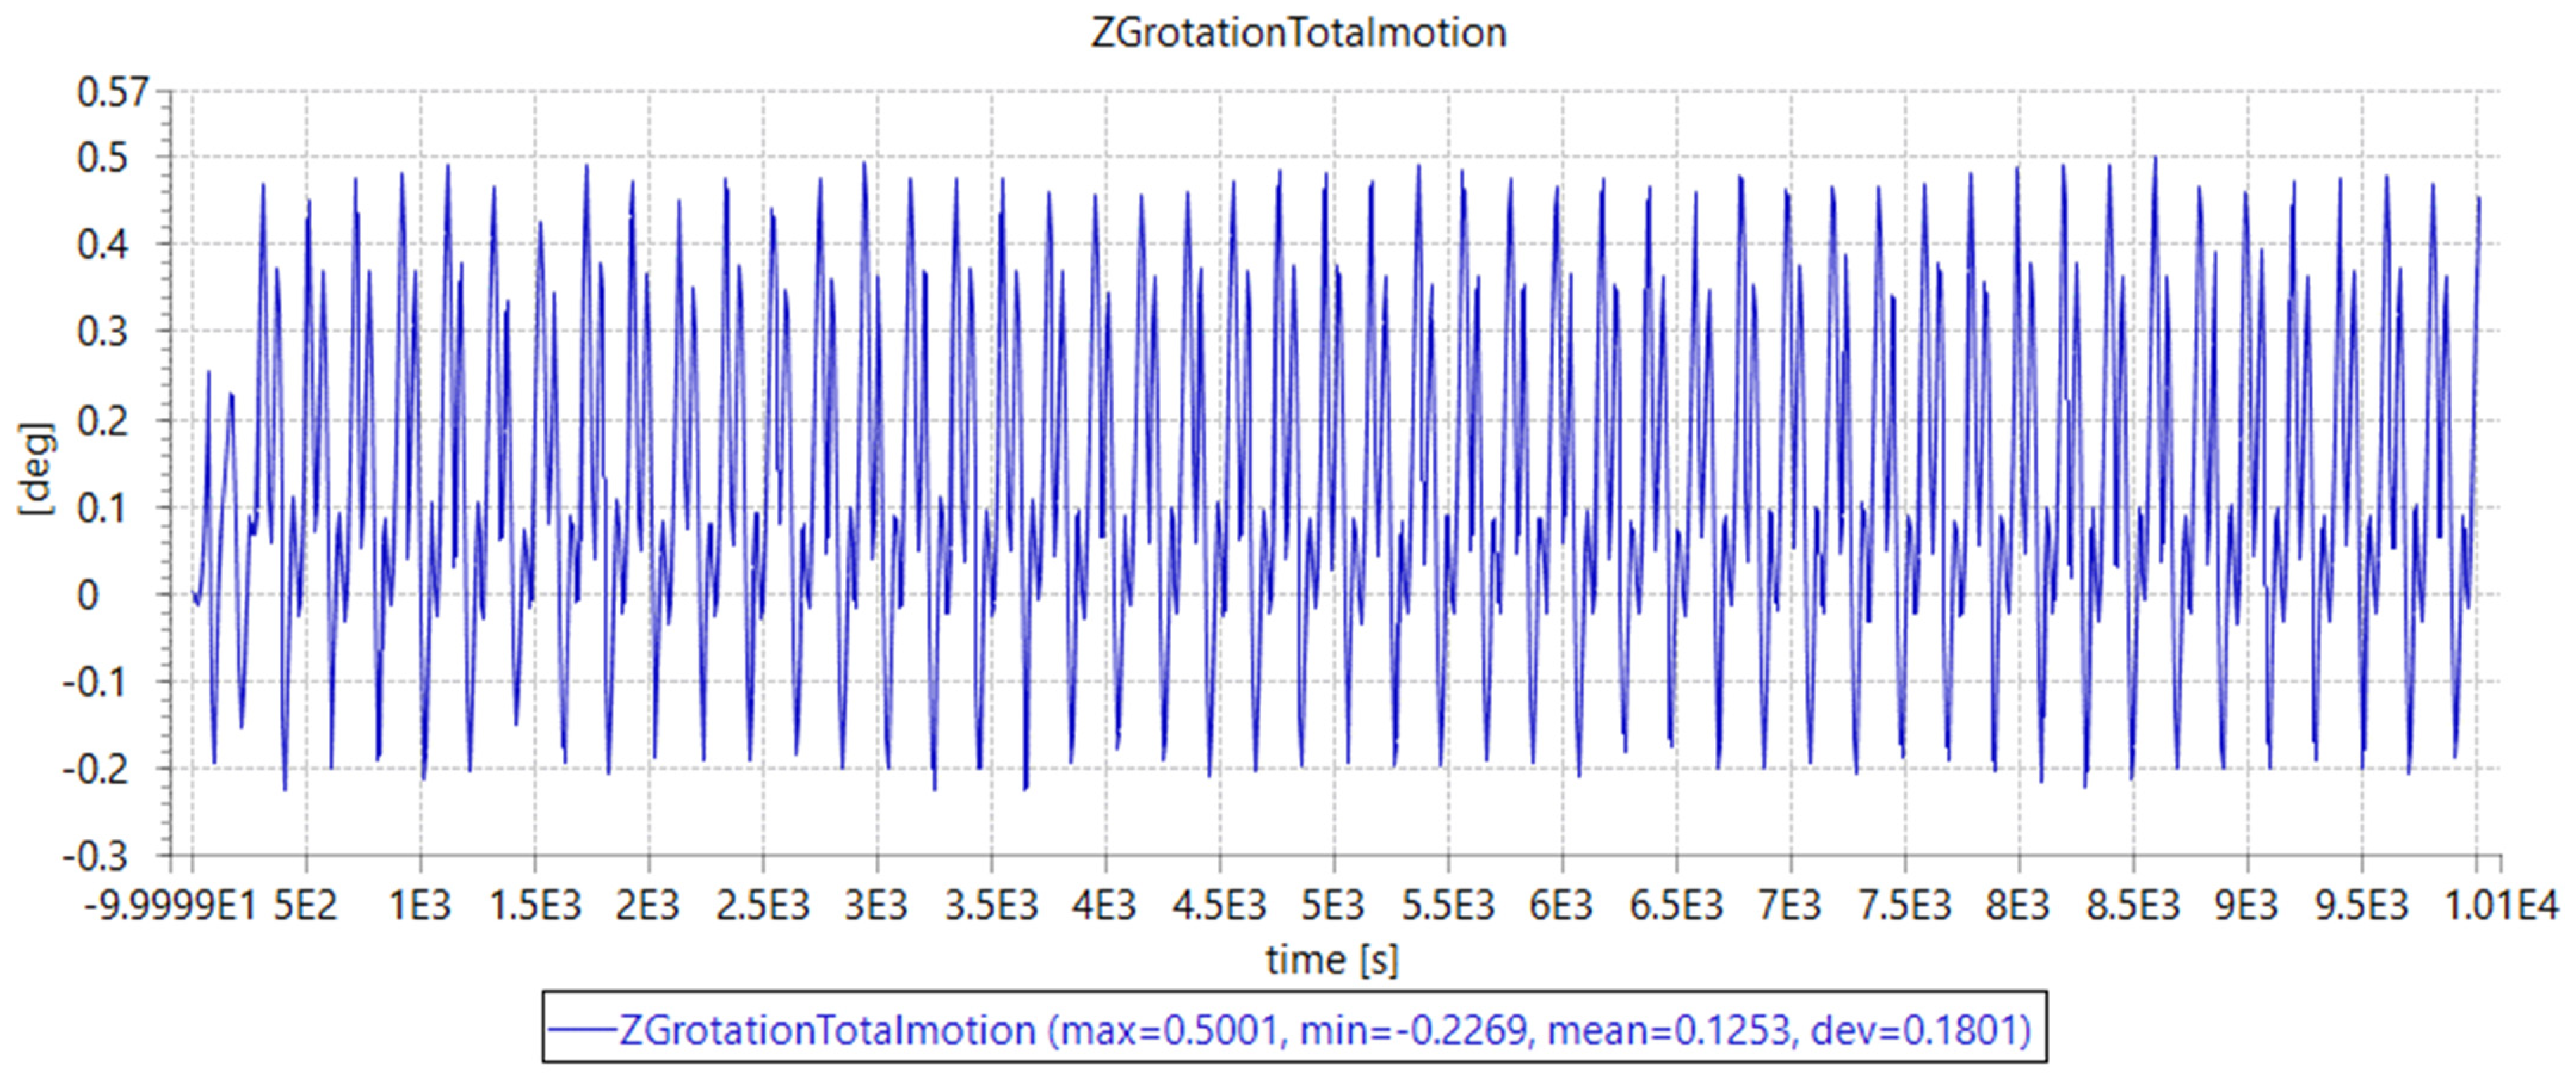
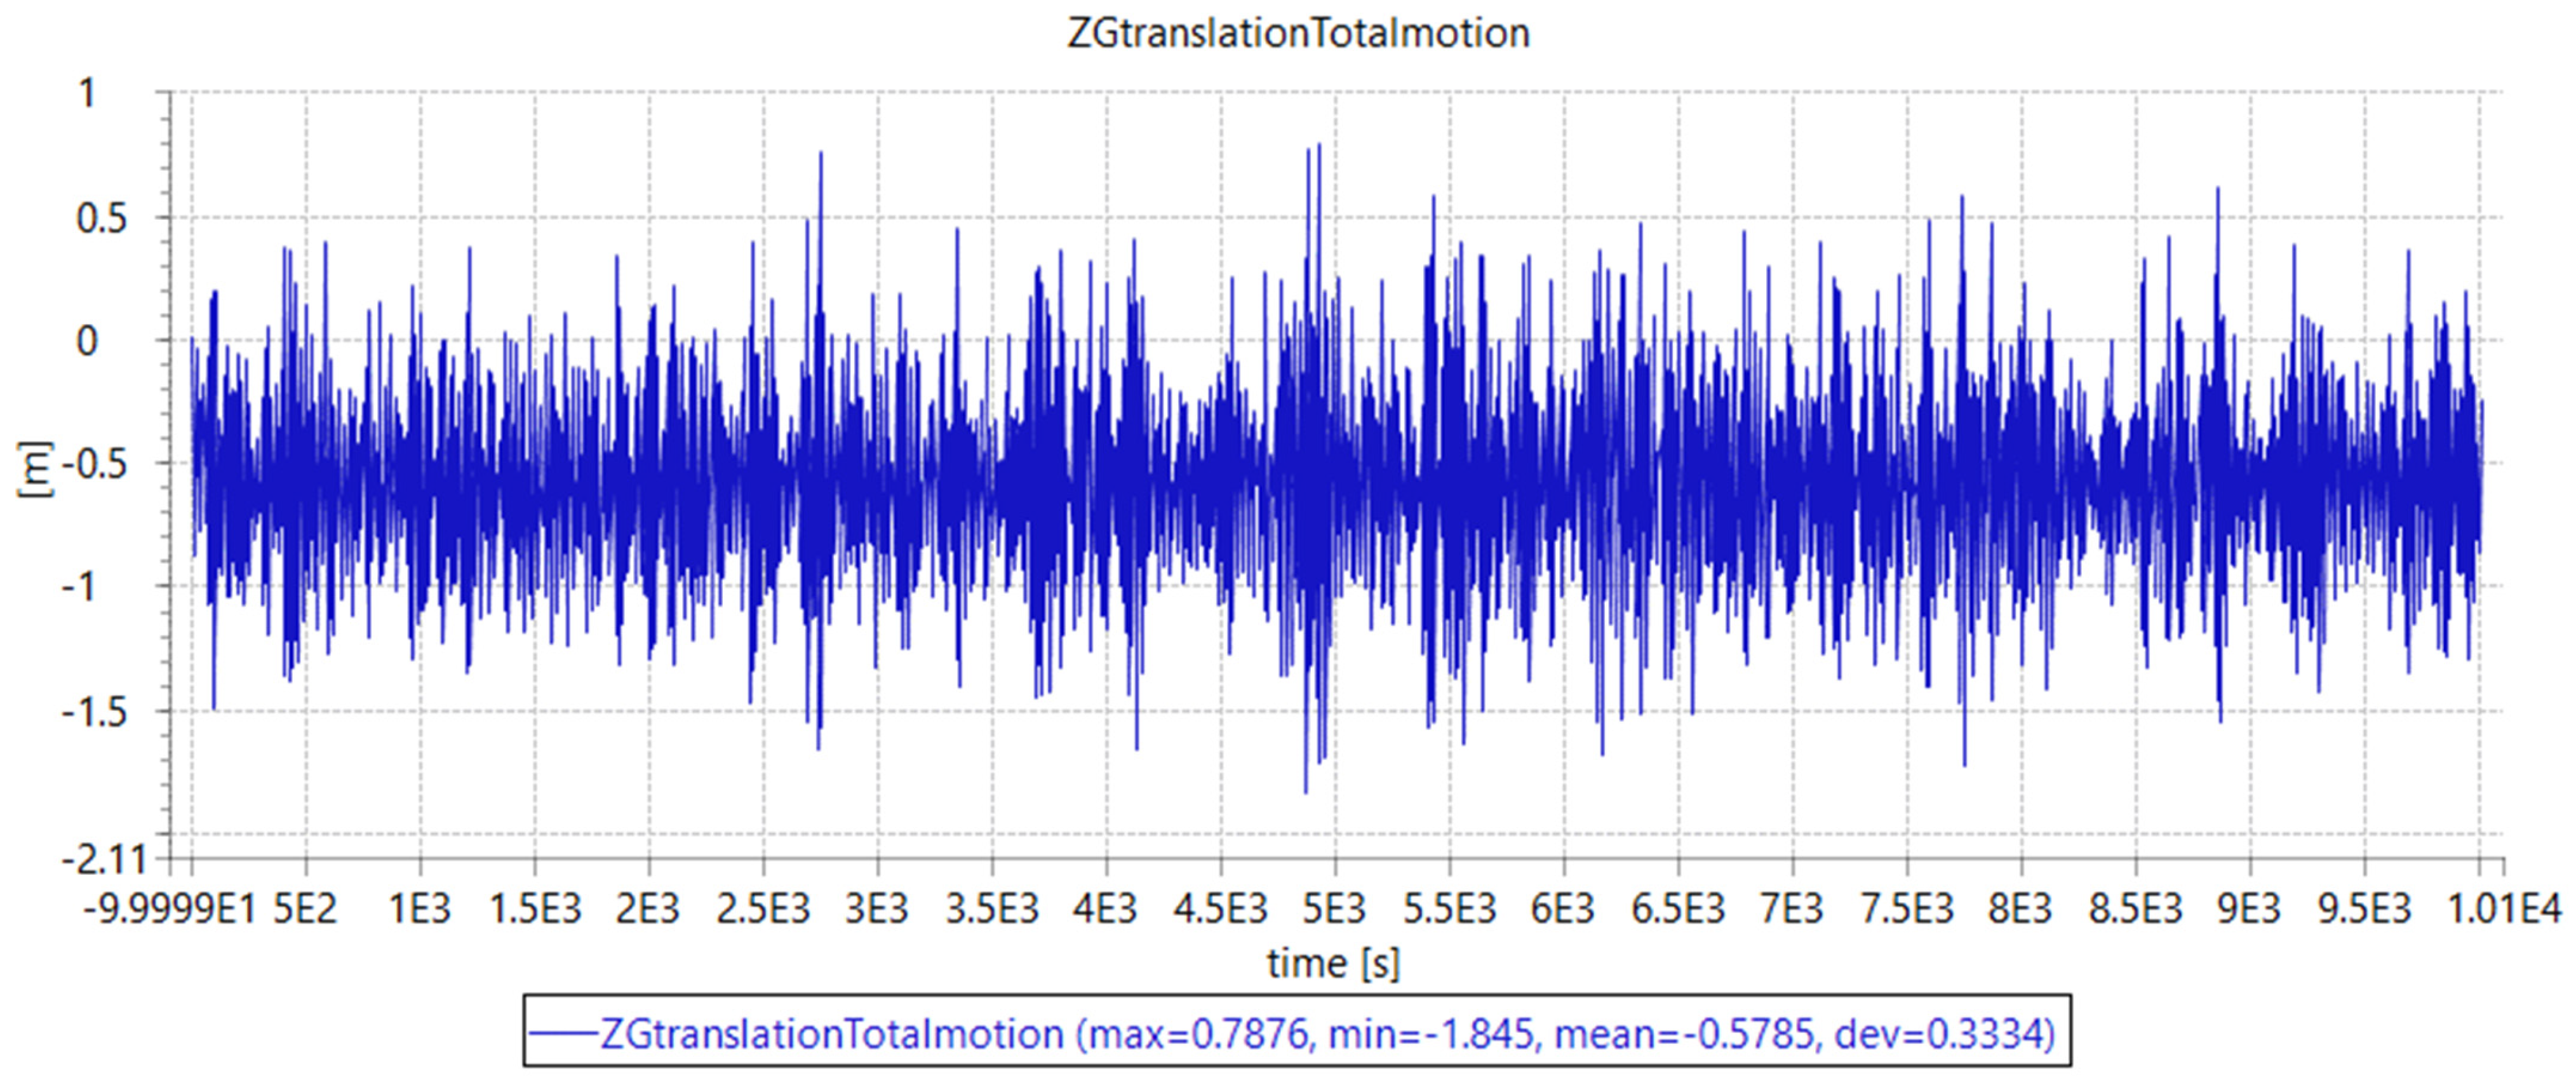
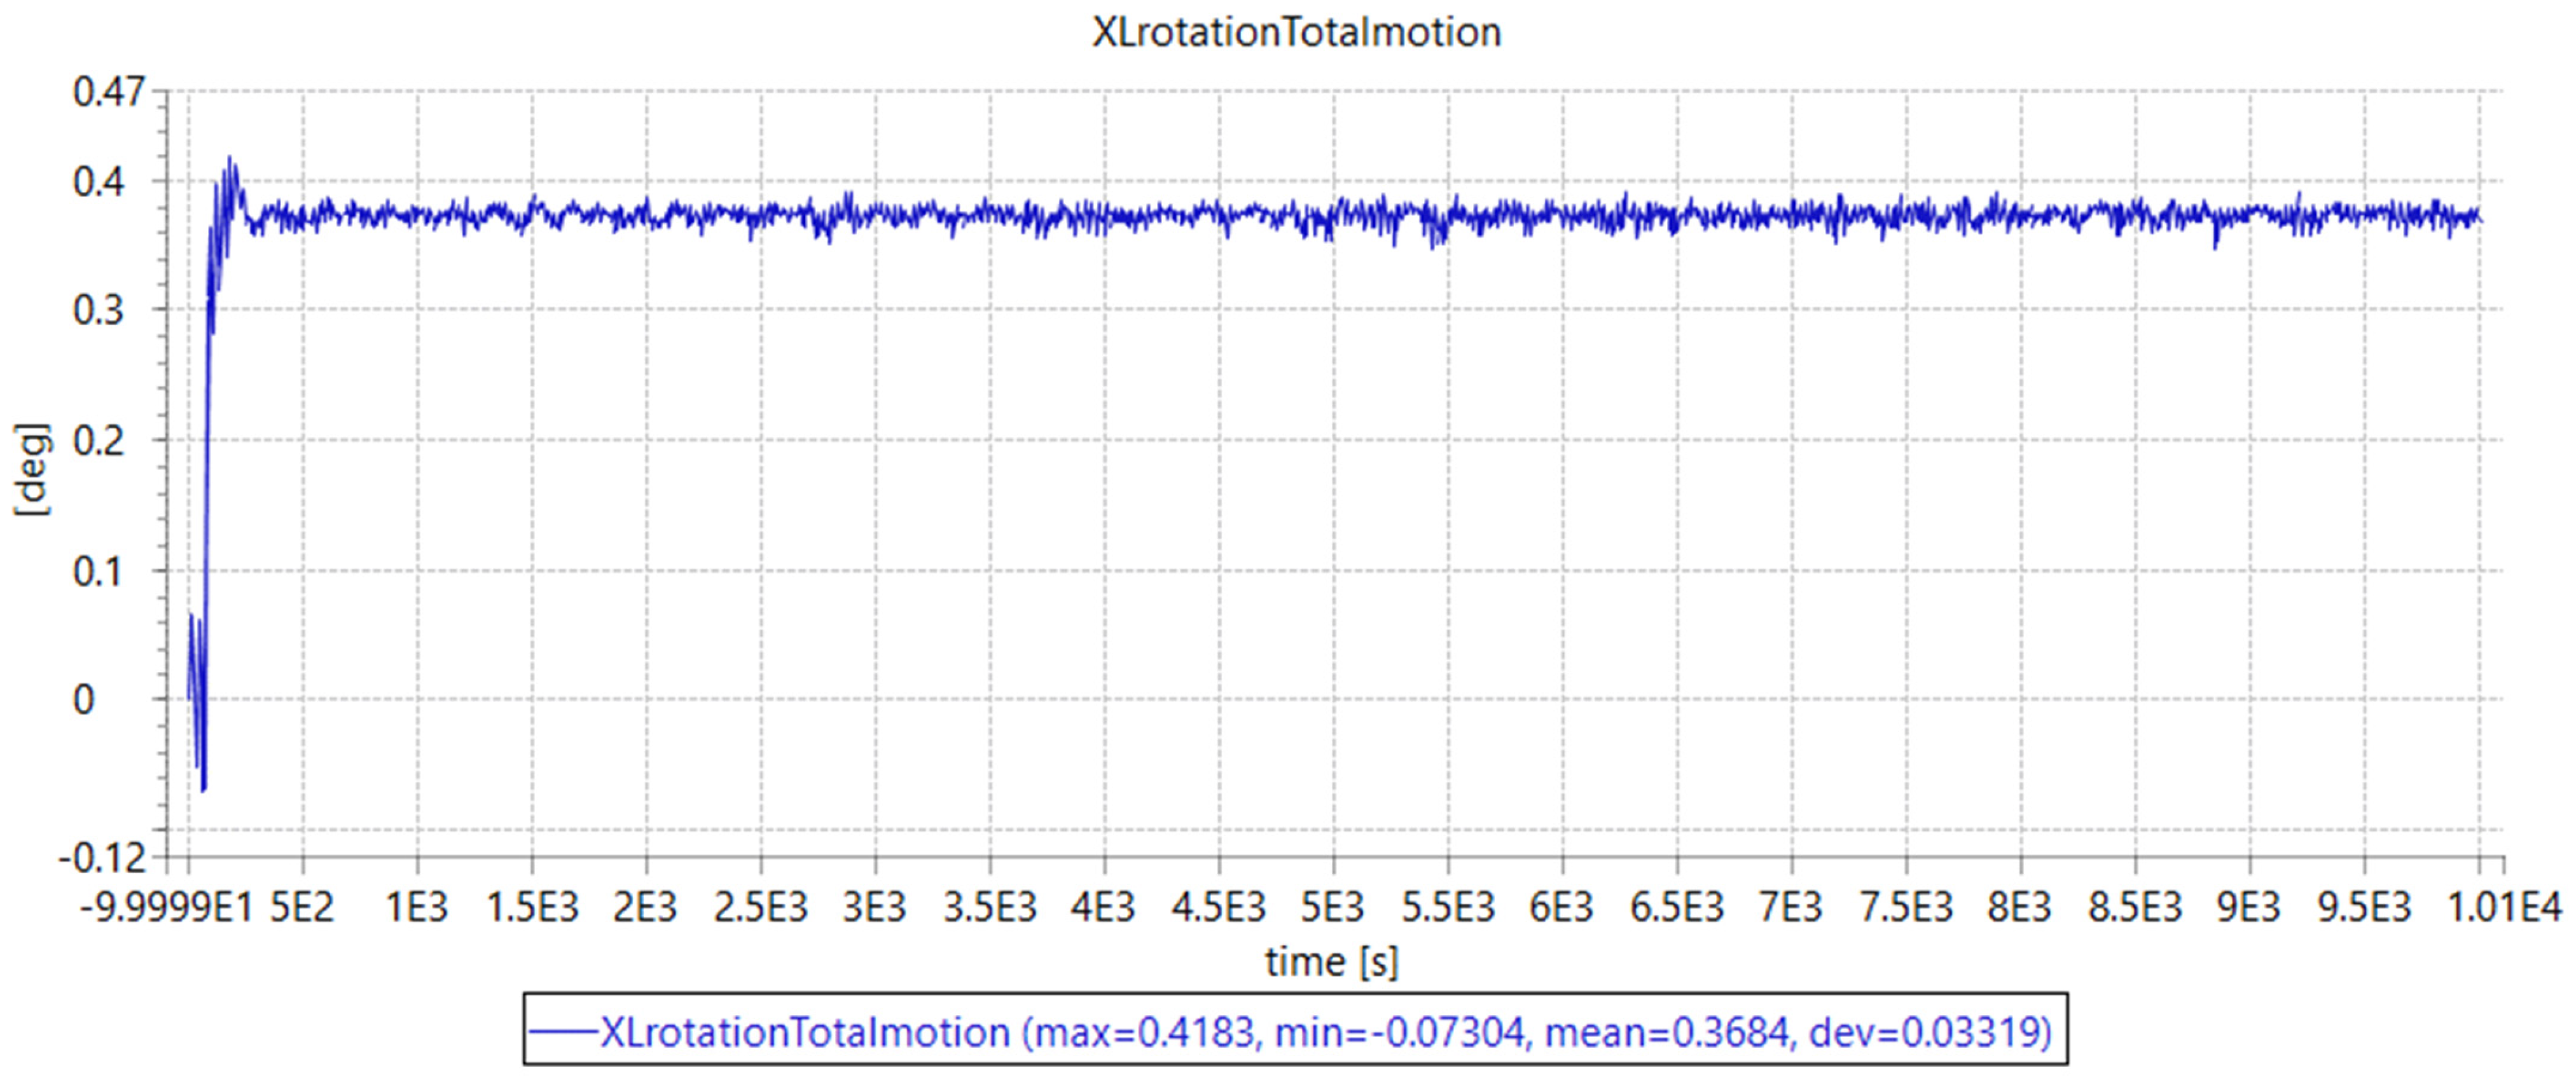
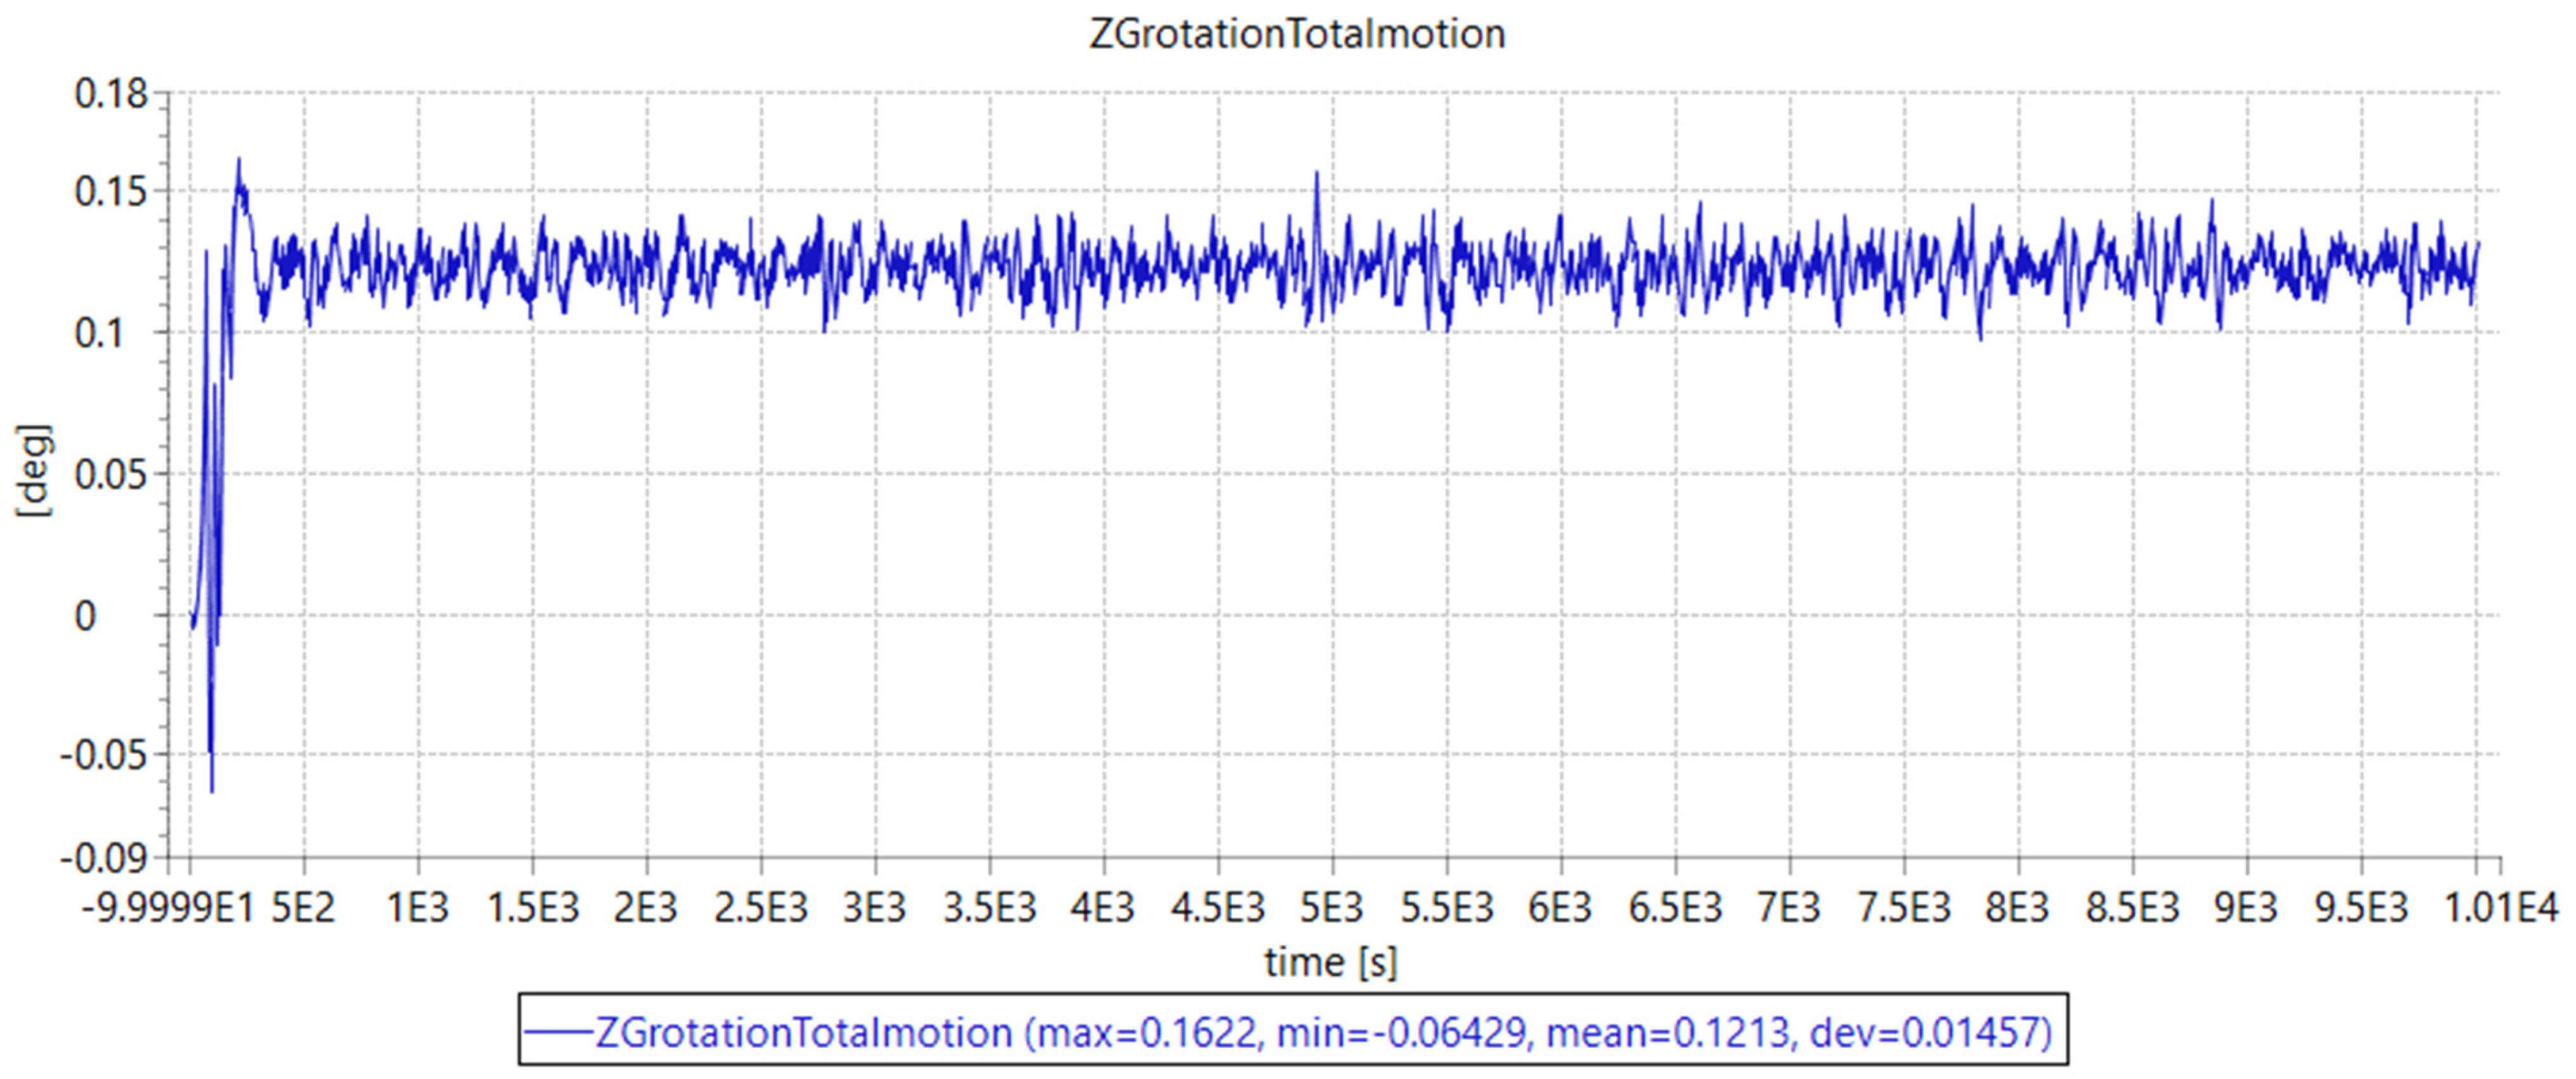
When carrying out the analyses, 10 thousand seconds were allocated to each analysis to ensure convergence (see
Figure A9,
Figure A10,
Figure A11,
Figure A12,
Figure A13,
Figure A14,
Figure A15,
Figure A16,
Figure A17,
Figure A18,
Figure A19 and
Figure A20 in
Appendix A). A time step of 0.005 s was selected to ensure accurate results. The time increment of the wave/body response was set to 0.1 s. The mean values of the time series, excluding the transients, were used to generate the table values presented in
Section 3.
Furthermore, the three-parameter spectra were implemented in the analyses for generating the waves. The stationary uniform (constant) wind type was implemented in the software for generating the wind.
The next section will present the constant wind dynamic analysis response offset results outputted from the Sima software for the 8 floating wind turbines studied in this paper.
3. Results
This section will present the constant wind dynamic analysis response offset results of the eight floating wind turbines studied in this paper. Results from similar studies will also be presented and compared.
As mentioned in
Section 1, the rated wind speed for each of the eight floating wind turbines studied in this paper was used. The rated wind speed is the wind speed at which the floating wind turbines produce the maximum power and have the maximum response offsets.
Table 1,
Table 2,
Table 3,
Table 4,
Table 5,
Table 6,
Table 7 and
Table 8 only present analysis results with two different sea states (i.e., first sea state: Hs = 2.5 m, Tp = 10 s; second sea state: Hs = 4 m, Tp = 12 s). These two sea states are analyzed with and without current effects, as illustrated in the corresponding tables. An additional sea state with only wind (i.e., without wave and current) is presented in the tables and compared for each response offset for the eight floating wind turbines studied in this paper. The implemented current speed in the analyses that consider the current is 2 m/s, and it is only applied at the sea surface (z = 0).
Table 1,
Table 2,
Table 3,
Table 4,
Table 5,
Table 6,
Table 7 and
Table 8 present the response offset data of the constant wind dynamic analysis of the eight floating wind turbines studied in this paper. In the Sima software, the surge motion is given as the displacement in the x-direction, the sway motion is given as the displacement in the y-direction, and the heave motion is given as the displacement in the z-direction. Furthermore, the roll rotation is given as the rotation around the x-axis, the pitch rotation is given as the rotation around the y-axis, and the yaw rotation is given as the rotation around the z-axis.
Note that in
Table 1,
Table 2,
Table 3,
Table 4,
Table 5,
Table 6,
Table 7 and
Table 8, some of the response offsets have negative values, which means that they have response direction against the positive corresponding axis (refer to
Figure A1,
Figure A2,
Figure A3,
Figure A4,
Figure A5,
Figure A6,
Figure A7 and
Figure A8 in
Appendix A to see the positive Cartesian axis for each of the eight floating wind turbines studied in this paper).
In the following, we will present the response offset results of the eight floating wind turbines studied in this paper and compare them with similar results from similar analyses from previous work in the literature. Note that the results from the literature do not necessarily have the same wave and wind environmental conditions and dimensional characteristics as the eight floating wind turbines studied in this paper. This is because the authors could not find similar floating wind response offset results for floating wind turbines with identical environmental conditions and dimensional characteristics as the eight floating wind turbines studied in this paper.
Table 1 reports the OO-Star surge response offset as 29.18–58.3 m.
Paper [
91] analyzed the OO-Star surge motion and concluded that it is 20 m. Note that the input data of both analyses are different.
The OO-Star sway response offset is reported in
Table 1 as 0.1514–0.2253 m.
The OO-Star heave response offset is reported in
Table 1 as 0.47–0.59 m.
Paper [
91] analyzed the OO-Star heave motion and concluded that it is 0.4 m. Note that the input data of both analyses are different.
The OO-Star roll response offset is reported in
Table 1 as 0.3684–0.3853°.
The OO-Star pitch response offset is reported in
Table 1 as 3.6–5.9°.
Paper [
91] analyzed the OO-Star surge offset and concluded that it is 5.9°. Note that the input data of both analyses are different.
The OO-Star yaw response offset is reported in
Table 1 as 0.1213–0.1253°.
Furthermore, Ref. [
92] presents aspects relevant to the OO-Star semi-submersible floating wind turbines, as well as further predictions on the future of 20 MW floating wind turbines.
Table 1.
OO-Star all degrees of freedom at rated wind speed (11.4 m/s).
Table 1.
OO-Star all degrees of freedom at rated wind speed (11.4 m/s).
| OO-Star surge [m] at rated wind speed (11.4 m/s) |
| Only wind sea state (i.e., no waves and current) | 29.18 m |
| First sea state (without current) | 30.25 m |
| First sea state (with current) | 57.81 m |
| Second sea state (without current) | 30.81 m |
| Second sea state (with current) | 58.3 m |
| OO-Star sway [m] at rated wind speed (11.4 m/s) |
| Only wind sea state (i.e., no waves and current) | 0.2253 m |
| First sea state (without current) | 0.222 m |
| First sea state (with current) | 0.1538 m |
| Second sea state (without current) | 0.2193 m |
| Second sea state (with current) | 0.1514 m |
| OO-Star heave [m] at rated wind speed (11.4 m/s) |
| Only wind sea state (i.e., no waves and current) | −0.5035 m |
| First sea state (without current) | −0.4908 m |
| First sea state (with current) | −0.5906 m |
| Second sea state (without current) | −0.4756 m |
| Second sea state (with current) | −0.5785 m |
| OO-Star roll [°] at rated wind speed (11.4 m/s) |
| Only wind sea state (i.e., no waves and current) | 0.3685° |
| First sea state (without current) | 0.3843° |
| First sea state (with current) | 0.3704° |
| Second sea state (without current) | 0.3853° |
| Second sea state (with current) | 0.3684° |
| OO-Star pitch [°] at rated wind speed (11.4 m/s) |
| Only wind sea state (i.e., no waves and current) | 5.9357° |
| First sea state (without current) | 5.658° |
| First sea state (with current) | 3.701° |
| Second sea state (without current) | 5.637° |
| Second sea state (with current) | 3.652° |
| OO-Star yaw [°] at rated wind speed (11.4 m/s) |
| Only wind sea state (i.e., no waves and current) | 0.125° |
| First sea state (without current) | 0.1253° |
| First sea state (with current) | 0.1226° |
| Second sea state (without current) | 0.1229° |
| Second sea state (with current) | 0.1213° |
Table 2 reports the CSC surge response offset as 11.7–39.08 m.
Paper [
35] analyzed the CSC surge motion and concluded that it is 8.5–10 m. Note that the input data of both analyses are different.
The CSC sway response offset is reported in
Table 2 as 0.019–0.1 m.
Paper [
35] analyzed the CSC sway motion and concluded that it is 4.5–9 m. Note that the input data of both analyses are different.
The CSC heave response offset is reported in
Table 2 as 0.17–0.619 m.
Paper [
35] analyzed the CSC heave motion and concluded that it is 3.5–5.5 m. Note that the input data of both analyses are different.
The CSC roll response offset is reported in
Table 2 as 0.301–0.347°.
Paper [
35] analyzed the CSC roll offset and concluded that it is 3°. Note that the input data of both analyses are different.
The CSC pitch response offset is reported in
Table 2 as 4.51–6.76°.
Paper [
35] analyzed the CSC pitch offset and concluded that it is 4.2–6.8°. Note that the input data of both analyses are different.
The CSC yaw response offset is reported in
Table 2 as 0.082–0.105°.
Paper [
35] conducted an analysis of the CSC yaw offset and concluded that it is 1.8–1.9°. Note that the input data of both analyses are different.
Furthermore, refs. [
93,
94] report natural period values for the CSC floating wind turbine as 25.57 s for heave, 35.47 s for roll, and 35.47 s for pitch. Note that the input data of both analyses are different, as well as the turbine’s design using the SESAM software.
Table 2.
CSC all degrees of freedom at rated wind speed (11.4 m/s).
Table 2.
CSC all degrees of freedom at rated wind speed (11.4 m/s).
| CSC surge [m] at rated wind speed (11.4 m/s) |
| Only wind sea state (i.e., no waves and current) | 11.76 m |
| First sea state (without current) | 11.7 m |
| First sea state (with current) | 39 m |
| Second sea state (without current) | 11.79 m |
| Second sea state (with current) | 39.08 m |
| CSC sway [m] at rated wind speed (11.4 m/s) |
| Only wind sea state (i.e., no waves and current) | 0.1018 m |
| First sea state (without current) | 0.09758 m |
| First sea state (with current) | −0.01952 m |
| Second sea state (without current) | 0.1001 m |
| Second sea state (with current) | −0.02102 m |
| CSC heave [m] at rated wind speed (11.4 m/s) |
| Only wind sea state (i.e., no waves and current) | −0.2034 m |
| First sea state (without current) | −0.183 m |
| First sea state (with current) | −0.6194 m |
| Second sea state (without current) | −0.1704 m |
| Second sea state (with current) | −0.6144 m |
| CSC roll [°] at rated wind speed (11.4 m/s) |
| Only wind sea state (i.e., no waves and current) | 0.3419° |
| First sea state (without current) | 0.347° |
| First sea state (with current) | 0.301° |
| Second sea state (without current) | 0.3476° |
| Second sea state (with current) | 0.3013° |
| CSC pitch [°] at rated wind speed (11.4 m/s) |
| Only wind sea state (i.e., no waves and current) | 6.7623° |
| First sea state (without current) | 6.7° |
| First sea state (with current) | 4.569° |
| Second sea state (without current) | 6.739° |
| Second sea state (with current) | 4.513° |
| CSC yaw [°] at rated wind speed (11.4 m/s) |
| Only wind sea state (i.e., no waves and current) | −0.07933° |
| First sea state (without current) | −0.08643° |
| First sea state (with current) | −0.103° |
| Second sea state (without current) | −0.08226° |
| Second sea state (with current) | −0.105° |
Table 3 reports the WindFloat surge response offset as 13.2–34.9 m.
Paper [
95] analyzed the WindFloat surge motion and concluded that it is 15 m. Note that the input data of both analyses are different.
The WindFloat sway response offset is reported in
Table 3 as 0.016–0.15 m.
The WindFloat heave response offset is reported in
Table 3 as 1.37–1.44 m.
Paper [
95] analyzed the WindFloat heave motion and concluded that it is 1.7 m. Note that the input data of both analyses are different.
The WindFloat roll response offset is reported in
Table 3 as 0.255–0.3009°.
The WindFloat pitch response offset is reported in
Table 3 as 11.2–12.4°.
Paper [
95] analyzed the WindFloat pitch offset and concluded that it is 2°. Note that the input data of both analyses are different.
The WindFloat yaw response offset is reported in
Table 3 as 0.02–0.08°.
Table 3.
WindFloat all degrees of freedom at rated wind speed (11.4 m/s).
Table 3.
WindFloat all degrees of freedom at rated wind speed (11.4 m/s).
| WindFloat surge [m] at rated wind speed (11.4 m/s) |
| Only wind sea state (i.e., no waves and current) | 13.4 m |
| First sea state (without current) | 13.26 m |
| First sea state (with current) | 34.8 m |
| Second sea state (without current) | 13.15 m |
| Second sea state (with current) | 34.97 m |
| WindFloat sway [m] at rated wind speed (11.4 m/s) |
| Only wind sea state (i.e., no waves and current) | 0.1576 m |
| First sea state (without current) | 0.1426 m |
| First sea state (with current) | −0.01635 m |
| Second sea state (without current) | 0.1302 m |
| Second sea state (with current) | −0.02374 m |
| WindFloat heave [m] at rated wind speed (11.4 m/s) |
| Only wind sea state (i.e., no waves and current) | −1.424 m |
| First sea state (without current) | −1.399 m |
| First sea state (with current) | −1.44 m |
| Second sea state (without current) | −1.379 m |
| Second sea state (with current) | −1.411 m |
| WindFloat roll [°] at rated wind speed (11.4 m/s) |
| Only wind sea state (i.e., no waves and current) | 0.30039° |
| First sea state (without current) | 0.2995° |
| First sea state (with current) | 0.2557° |
| Second sea state (without current) | 0.3009° |
| Second sea state (with current) | 0.2578° |
| WindFloat pitch [°] at rated wind speed (11.4 m/s) |
| Only wind sea state (i.e., no waves and current) | 12.4044° |
| First sea state (without current) | 12.23° |
| First sea state (with current) | 11.44° |
| Second sea state (without current) | 12.12° |
| Second sea state (with current) | 11.29° |
| WindFloat yaw [°] at rated wind speed (11.4 m/s) |
| Only wind sea state (i.e., no waves and current) | 0.08588° |
| First sea state (without current) | 0.05104° |
| First sea state (with current) | −0.03536° |
| Second sea state (without current) | 0.0223° |
| Second sea state (with current) | −0.05138° |
Table 4 reports the TLPWT surge response offset as 2.2–4.83 m.
The TLPWT sway response offset is reported in
Table 4 as 0.002–0.0075 m.
The TLPWT heave response offset is reported in
Table 4 as 0.068–0.17 m.
The TLPWT roll response offset is reported in
Table 4 as 0.0015–0.002°.
The TLPWT pitch response offset is reported in
Table 4 as 0.0053–0.00576°.
The TLPWT yaw response offset is reported in
Table 4 as 0.0832–0.09512°.
Furthermore, refs. [
96,
97,
98] present a review of multidisciplinary design optimization of relevance to spar, semi-submersible, and TLP floating wind turbines, as well as guidelines relevant to the design of floating wind turbines, and a Tension-Leg-Buoy (TLB) validation using tank tests and coupled aero-hydro-servo-elastic numerical tools.
Table 4.
TLPWT all degrees of freedom at rated wind speed (11.4 m/s).
Table 4.
TLPWT all degrees of freedom at rated wind speed (11.4 m/s).
| TLPWT surge [m] at rated wind speed (11.4 m/s) |
| Only wind sea state (i.e., no waves and current) | 2.2 m |
| First sea state (without current) | 2.648 m |
| First sea state (with current) | 4.834 m |
| Second sea state (without current) | 2.642 m |
| Second sea state (with current) | 4.823 m |
| TLPWT sway [m] at rated wind speed (11.4 m/s) |
| Only wind sea state (i.e., no waves and current) | −0.003639 m |
| First sea state (without current) | −0.003266 m |
| First sea state (with current) | 0.007036 m |
| Second sea state (without current) | −0.002409 m |
| Second sea state (with current) | 0.007561 m |
| TLPWT heave [m] at rated wind speed (11.4 m/s) |
| Only wind sea state (i.e., no waves and current) | −0.175 m |
| First sea state (without current) | −0.1718 m |
| First sea state (with current) | −0.06889 m |
| Second sea state (without current) | −0.1687 m |
| Second sea state (with current) | −0.06962 m |
| TLPWT roll [°] at rated wind speed (11.4 m/s) |
| Only wind sea state (i.e., no waves and current) | 0.001644° |
| First sea state (without current) | 0.001755° |
| First sea state (with current) | −0.002103° |
| Second sea state (without current) | 0.001585° |
| Second sea state (with current) | −0.002142° |
| TLPWT pitch [°] at rated wind speed (11.4 m/s) |
| Only wind sea state (i.e., no waves and current) | 0.005398° |
| First sea state (without current) | 0.005472° |
| First sea state (with current) | 0.005766° |
| Second sea state (without current) | 0.005455° |
| Second sea state (with current) | 0.005739° |
| TLPWT yaw [°] at rated wind speed (11.4 m/s) |
| Only wind sea state (i.e., no waves and current) | −0.09512° |
| First sea state (without current) | −0.09487° |
| First sea state (with current) | −0.08323° |
| Second sea state (without current) | −0.09493° |
| Second sea state (with current) | −0.08369° |
Table 5 reports the VolturnUS-S surge response offset as 15.9–24.29 m.
Paper [
99] has reported the VolturnUS-S surge motion as 8.8 m. Note that the input data of both analyses are different.
The VolturnUS-S sway response offset is reported in
Table 5 as 0.0803–0.1004 m.
The VolturnUS-S heave response offset is reported in
Table 5 as 0.12–0.201 m.
The VolturnUS-S roll response offset is reported in
Table 5 as 0.334–0.397°.
The VolturnUS-S pitch response offset is reported in
Table 5 as 2.607–4.03°.
Paper [
99] has reported the VolturnUS-S pitch offset as 2.7–5.2°. Note that the input data of both analyses are different.
The VolturnUS-S yaw response offset is reported in
Table 5 as 0.241–0.31°.
Furthermore, papers [
89,
100] report frequency-domain analyses for the VolturnUS floating wind turbine. These papers also present structural analyses of relevance to the 15 MW VolturnUS-S semi-submersible floating wind turbine using the Bladed and SESAM software.
Table 5.
UMaine VolturnUS-S 15 MW all degrees of freedom at rated wind speed (10.6 m/s).
Table 5.
UMaine VolturnUS-S 15 MW all degrees of freedom at rated wind speed (10.6 m/s).
| UMaine VolturnUS-S surge [m] at rated wind speed (10.6 m/s) |
| Only wind sea state (i.e., no waves and current) | 15.95 m |
| First sea state (without current) | 19.74 m |
| First sea state (with current) | 24.29 m |
| Second sea state (without current) | 19.71 m |
| Second sea state (with current) | 24.25 m |
| UMaine VolturnUS-S sway [m] at rated wind speed (10.6 m/s) |
| Only wind sea state (i.e., no waves and current) | −0.09578 m |
| First sea state (without current) | −0.08863 m |
| First sea state (with current) | −0.1004 m |
| Second sea state (without current) | −0.08035 m |
| Second sea state (with current) | −0.09051 m |
| UMaine VolturnUS-S heave [m] at rated wind speed (10.6 m/s) |
| Only wind sea state (i.e., no waves and current) | −0.1409 m |
| First sea state (without current) | −0.131 m |
| First sea state (with current) | −0.2013 m |
| Second sea state (without current) | −0.1223 m |
| Second sea state (with current) | −0.1941 m |
| UMaine VolturnUS-S roll [°] at rated wind speed (10.6 m/s) |
| Only wind sea state (i.e., no waves and current) | 0.3343° |
| First sea state (without current) | 0.395° |
| First sea state (with current) | 0.3978° |
| Second sea state (without current) | 0.3941° |
| Second sea state (with current) | 0.3968° |
| UMaine VolturnUS-S pitch [°] at rated wind speed (10.6 m/s) |
| Only wind sea state (i.e., no waves and current) | 2.6074° |
| First sea state (without current) | 4.032° |
| First sea state (with current) | 3.719° |
| Second sea state (without current) | 3.978° |
| Second sea state (with current) | 3.658° |
| UMaine VolturnUS-S yaw [°] at rated wind speed (10.6 m/s) |
| Only wind sea state (i.e., no waves and current) | −0.3184° |
| First sea state (without current) | −0.3112° |
| First sea state (with current) | −0.2486° |
| Second sea state (without current) | −0.3039° |
| Second sea state (with current) | −0.2418° |
Table 6 reports the INO-WINDMOOR surge response offset as 10.3–41.07 m.
The INO-WINDMOOR sway response offset is reported in
Table 6 as 0.031–0.0604 m.
The INO-WINDMOOR heave response offset is reported in
Table 6 as 0.077–0.453 m.
The INO-WINDMOOR roll response offset is reported in
Table 6 as 0.5053–0.5266°.
The INO-WINDMOOR pitch response offset is reported in
Table 6 as 2.362–4.464°.
The INO-WINDMOOR yaw response offset is reported in
Table 6 as 0.051–0.589°.
Furthermore, papers [
39,
101,
102,
103] report the six degrees of freedom of the INO-WINDMOOR floating wind turbine as a function of natural period and not as a function of the response offset, as is the case in our work in this paper. These papers also present the WINDMOOR 12 MW floating wind turbine hydrostatic stability and hydrodynamics analyses using the Sima, SIMO, RFLEX, and WAMIT software, as well as the 15 MW semi-submersible floating wind turbine time-domain stress analyses.
Table 6.
INO-WINDMOOR all degrees of freedom at rated wind speed (10.6 m/s).
Table 6.
INO-WINDMOOR all degrees of freedom at rated wind speed (10.6 m/s).
| INO-WINDMOOR surge [m] at rated wind speed (10.6 m/s) |
| Only wind sea state (i.e., no waves and current) | 10.33 m |
| First sea state (without current) | 10.51 m |
| First sea state (with current) | 40.84 m |
| Second sea state (without current) | 10.55 m |
| Second sea state (with current) | 41.07 m |
| INO-WINDMOOR sway [m] at rated wind speed (10.6 m/s) |
| Only wind sea state (i.e., no waves and current) | 0.01 m |
| First sea state (without current) | 0.03549 m |
| First sea state (with current) | 0.06047 m |
| Second sea state (without current) | 0.03101 m |
| Second sea state (with current) | 0.05433 m |
| INO-WINDMOOR heave [m] at rated wind speed (10.6 m/s) |
| Only wind sea state (i.e., no waves and current) | −0.041 m |
| First sea state (without current) | −0.07974 m |
| First sea state (with current) | −0.4506 m |
| Second sea state (without current) | −0.07713 m |
| Second sea state (with current) | −0.4539 m |
| INO-WINDMOOR roll [°] at rated wind speed (10.6 m/s) |
| Only wind sea state (i.e., no waves and current) | 0.5266° |
| First sea state (without current) | 0.5262° |
| First sea state (with current) | 0.5053° |
| Second sea state (without current) | 0.5265° |
| Second sea state (with current) | 0.5056° |
| INO-WINDMOOR pitch [°] at rated wind speed (10.6 m/s) |
| Only wind sea state (i.e., no waves and current) | 4.46472° |
| First sea state (without current) | 4.45183° |
| First sea state (with current) | 2.362333° |
| Second sea state (without current) | 4.44786° |
| Second sea state (with current) | 2.37938° |
| INO-WINDMOOR yaw [°] at rated wind speed (10.6 m/s) |
| Only wind sea state (i.e., no waves and current) | −0.025° |
| First sea state (without current) | −0.58993° |
| First sea state (with current) | 0.05136° |
| Second sea state (without current) | −0.58756° |
| Second sea state (with current) | 0.0542622° |
Table 7 reports the DTU Spar 1 surge response offset as 37.6–62.18 m.
The DTU Spar 1 sway response offset is reported in
Table 7 as 0.309–0.324 m.
The DTU Spar 1 heave response offset is reported in
Table 7 as 1.34–3.38 m.
The DTU Spar 1 roll response offset is reported in
Table 7 as 0.217–0.224°.
The DTU Spar 1 pitch response offset is reported in
Table 7 as 7.57–8.24°.
Paper [
30] reported a spar pitch offset as 7–14°. Note that the input data of both analyses are different.
The DTU Spar 1 yaw response offset is reported in
Table 7 as 0.31–0.35°.
Furthermore, refs. [
104,
105,
106] present state-of-the-art aspects relevant to the OC3-Hywind spar floating wind turbine aero-hydro-servo-elastic analyses and multidisciplinary design optimization analyses. They also present relevant numerical simulations and experiments.
Refs. [
107,
108,
109,
110,
111,
112,
113,
114] present the designs and dynamic responses of spar floating wind support structures and their hydrodynamic and aerodynamic performances.
Table 7.
DTU Spar 1 all degrees of freedom at rated wind speed (11.4 m/s).
Table 7.
DTU Spar 1 all degrees of freedom at rated wind speed (11.4 m/s).
| DTU Spar 1 surge [m] at rated wind speed (11.4 m/s) |
| Only wind sea state (i.e., no waves and current) | 37.91 m |
| First sea state (without current) | 38 m |
| First sea state (with current) | 62.18 m |
| Second sea state (without current) | 37.67 m |
| Second sea state (with current) | 62.09 m |
| DTU Spar 1 sway [m] at rated wind speed (11.4 m/s) |
| Only wind sea state (i.e., no waves and current) | −0.2953 m |
| First sea state (without current) | −0.309 m |
| First sea state (with current) | −0.3219 m |
| Second sea state (without current) | −0.3186 m |
| Second sea state (with current) | −0.3243 m |
| DTU Spar 1 heave [m] at rated wind speed (11.4 m/s) |
| Only wind sea state (i.e., no waves and current) | −1.384 m |
| First sea state (without current) | −1.365 m |
| First sea state (with current) | −3.384 m |
| Second sea state (without current) | −1.345 m |
| Second sea state (with current) | −3.374 m |
| DTU Spar 1 roll [°] at rated wind speed (11.4 m/s) |
| Only wind sea state (i.e., no waves and current) | 0.2197° |
| First sea state (without current) | 0.2222° |
| First sea state (with current) | 0.2177° |
| Second sea state (without current) | 0.2241° |
| Second sea state (with current) | 0.2181° |
| DTU Spar 1 pitch [°] at rated wind speed (11.4 m/s) |
| Only wind sea state (i.e., no waves and current) | 7.577696° |
| First sea state (without current) | 7.789° |
| First sea state (with current) | 8.243° |
| Second sea state (without current) | 7.708° |
| Second sea state (with current) | 8.201° |
| DTU Spar 1 yaw [°] at rated wind speed (11.4 m/s) |
| Only wind sea state (i.e., no waves and current) | −0.3199° |
| First sea state (without current) | −0.3432° |
| First sea state (with current) | −0.3169° |
| Second sea state (without current) | −0.3598° |
| Second sea state (with current) | −0.3229° |
Table 8 reports the DTU Spar 2 surge response offset as 26.3–50.7 m.
Paper [
114] reports the spar surge motion as 24 m. Note that the input data of both analyses are different.
The DTU Spar 2 sway response offset is reported in
Table 8 as 0.28–0.302 m.
Paper [
114] reports the spar sway motion as 0.5–4 m. Note that the input data of both analyses are different.
The DTU Spar 2 heave response offset is reported in
Table 8 as 1.302–3.34 m.
Paper [
114] reports the spar heave motion as 1.8–6 m. Note that the input data of both analyses are different.
The DTU Spar 2 roll response offset is reported in
Table 8 as 0.313–0.35°.
Paper [
114] reports the spar roll offset as 0.3–3.5°. Note that the input data of both analyses are different.
The DTU Spar 2 pitch response offset is reported in
Table 8 as 10.2–10.9°.
Paper [
114] reports the spar pitch offset as 2.5–8.5°. Note that the input data of both analyses are different.
The DTU Spar 2 yaw response offset is reported in
Table 8 as 0.26–0.31°.
Paper [
114] reports the spar yaw offset as 0.5–5°. Note that the input data of both analyses are different.
Table 8.
DTU Spar 2 all degrees of freedom at rated wind speed (11.4 m/s).
Table 8.
DTU Spar 2 all degrees of freedom at rated wind speed (11.4 m/s).
| DTU Spar 2 surge [m] at rated wind speed (11.4 m/s) |
| Only wind sea state (i.e., no waves and current) | 26.39 m |
| First sea state (without current) | 30.72 m |
| First sea state (with current) | 50.74 m |
| Second sea state (without current) | 30.58 m |
| Second sea state (with current) | 50.57 m |
| DTU Spar 2 sway [m] at rated wind speed (11.4 m/s) |
| Only wind sea state (i.e., no waves and current) | −0.277 m |
| First sea state (without current) | −0.2887 m |
| First sea state (with current) | −0.2988 m |
| Second sea state (without current) | −0.2938 m |
| Second sea state (with current) | −0.302 m |
| DTU Spar 2 heave [m] at rated wind speed (11.4 m/s) |
| Only wind sea state (i.e., no waves and current) | −1.332 m |
| First sea state (without current) | −1.313 m |
| First sea state (with current) | −3.349 m |
| Second sea state (without current) | −1.302 m |
| Second sea state (with current) | −3.326 m |
| DTU Spar 2 roll [°] at rated wind speed (11.4 m/s) |
| Only wind sea state (i.e., no waves and current) | 0.35256° |
| First sea state (without current) | 0.3202° |
| First sea state (with current) | 0.3134° |
| Second sea state (without current) | 0.3225° |
| Second sea state (with current) | 0.3147° |
| DTU Spar 2 pitch [°] at rated wind speed (11.4 m/s) |
| Only wind sea state (i.e., no waves and current) | 10.2703° |
| First sea state (without current) | 10.7° |
| First sea state (with current) | 10.93° |
| Second sea state (without current) | 10.63° |
| Second sea state (with current) | 10.83° |
| DTU Spar 2 yaw [°] at rated wind speed (11.4 m/s) |
| Only wind sea state (i.e., no waves and current) | −0.2681° |
| First sea state (without current) | −0.2969° |
| First sea state (with current) | −0.2651° |
| Second sea state (without current) | −0.3127° |
| Second sea state (with current) | −0.2753° |
Table 9 shows that the maximum surge response offset is 62.18 m and corresponds to the DTU Spar 1 floating wind turbine.
Table 9 shows that the maximum sway response offset is 0.3243 m and corresponds to the DTU Spar 1 floating wind turbine.
Table 9 shows that the maximum heave response offset is 3.384 m and corresponds to the DTU Spar 1 floating wind turbine.
Table 9 shows that the maximum roll response offset is 0.5266° and corresponds to the INO-WINDMOOR floating wind turbine.
Table 9 shows that the maximum pitch response offset is 12.4° and corresponds to the WindFloat floating wind turbine.
Table 9 shows that the maximum yaw response offset is 0.58993° and corresponds to the INO-WINDMOOR floating wind turbine.
| Surge [m] |
| OO-Star | 58.3 m |
| CSC | 39.08 m |
| WindFloat | 34.97 m |
| TLPWT | 4.834 m |
| VolturnUS-S | 24.29 m |
| INO-WINDMOOR | 41.07 m |
| DTU Spar 1 | 62.18 m |
| DTU Spar 2 | 50.74 m |
| Sway [m] |
| OO-Star | 0.225 m |
| CSC | 0.1001 m |
| WindFloat | 0.1576 m |
| TLPWT | 0.007561 m |
| VolturnUS-S | 0.1004 m |
| INO-WINDMOOR | 0.06047 m |
| DTU Spar 1 | 0.3243 m |
| DTU Spar 2 | 0.302 m |
| Heave [m] |
| OO-Star | 0.5906 m |
| CSC | 0.6194 m |
| WindFloat | 1.44 m |
| TLPWT | 0.1718 m |
| VolturnUS-S | 0.2013 m |
| INO-WINDMOOR | 0.4539 m |
| DTU Spar 1 | 3.384 m |
| DTU Spar 2 | 3.349 m |
| Roll [°] |
| OO-Star | 0.3853° |
| CSC | 0.3476° |
| WindFloat | 0.3009° |
| TLPWT | 0.002142° |
| VolturnUS-S | 0.3978° |
| INO-WINDMOOR | 0.5266° |
| DTU Spar 1 | 0.2241° |
| DTU Spar 2 | 0.35256° |
| Pitch [°] |
| OO-Star | 5.9357° |
| CSC | 6.7623° |
| WindFloat | 12.4° |
| TLPWT | 0.005766° |
| VolturnUS-S | 4.032° |
| INO-WINDMOOR | 4.46472° |
| DTU Spar 1 | 8.243° |
| DTU Spar 2 | 10.93° |
| Yaw [°] |
| OO-Star | 0.1253° |
| CSC | 0.105° |
| WindFloat | 0.08588° |
| TLPWT | 0.09512° |
| VolturnUS-S | 0.3112° |
| INO-WINDMOOR | 0.58993° |
| DTU Spar 1 | 0.3598° |
| DTU Spar 2 | 0.3127° |


