Featured Application
A simple and cheap spectrometer in THz range of frequency.
Abstract
We describe a THz spectrometer operating between 1.2 and 10.5 THz, consisting of band pass filters made by metasurfaces. The source is made of a 10 W small black body. The detector is a high sensitivity room temperature pyroelectric sensor. Various techniques that are used to prepare samples are described. The spectra obtained are compared with those measured with a Fourier Transformer Infrared Spectrometer on the same samples. Our instrument, which uses commercial technologies available at the present time, can constitute an economical alternative to very expensive spectrometers. It has already been successfully used, obtaining precise spectroscopic measurements on many inorganic powders.
1. Introduction
Spectroscopy is a common technique that is used to distinguish materials. Perception of colors by mean of human eyes is a natural form of spectroscopy. Three types of cones (retinal cells), sensitive to three different regions of light, perform a trichromatic color vision. The instrument here described applies a similar technique in the Terahertz (THz) region of the electromagnetic spectrum, using band pass filters centered between 1.3 and 10.5 THz. The instrument is the natural evolution of a previous apparatus able to discriminate only among materials [1].
In review papers, THz is often considered the range of frequency between 0.1 and 10 THz [2]. We think that most materials have a completely different behavior between 0.1–1 THz and 1–10 THz. For this reason a region of spectrum, so extended, described with a single name, can be confusing. The main reason for differences in their behavior is due to the fact that, while most materials are almost transparent for frequency lower than 1 THz, the same substances strongly absorb the radiation between 1 and 10 THz; sources and detectors in the two ranges of frequencies are also completely different. The instrument here described can be modified to be used at frequencies lower than 1 THz, just using a different kind of sources.
The Fourier Transformer Infrared Spectrometer (FTIR) [3] is probably the most suitable and used instrument for frequencies higher than 1 THz. In these years, the Time Domain Spectroscopy (TDS) has obtained impressive results and it is successfully employed for frequencies lower than 2 THz [4], even if there are examples of systems operating at higher frequencies [5]. The FTIR can be used up to the visible part of the spectrum, but it needs vacuum to operate in the THz range; its optical complexity justifies its high cost that inhibits a widespread use; and, TDS are complex and expensive instruments. On the contrary, the instrument here proposed is approximatively two orders of magnitude less expensive than the FTIR and allows to perform spectroscopy in a very simple way, at the expenses of the spectral resolution. Many substances have a very wide absorption region at room temperature, so a very simple instrument can give all the required information. To prove that our instrument is able to perform a real spectroscopy, we compare the results that were obtained with those obtained by a high quality commercial FTIR on the same samples.
THz spectroscopy is a useful technique for the study and characterization of many materials: explosives or drugs [6], agri-food products [7], pharmaceutical substances [8], macromolecules of biological interest [9], and even pigments used in art [10]. Pigments used in art are very common, already available in thin powder form, so many of them were used to test this apparatus.
THz spectroscopy provides information on the basic structure of molecules and it is widely used in radio astronomy [11]. The vibrational frequencies of large molecules and optical phonon of solids fall in this spectral region. Molecules or biological solids have large absorption spectral regions that can be used as fingerprints to discriminate materials. The apparatus described here can be a simple way to perform spectroscopy in this range of values. Its interest is due to the possibility of having very simple, reliable, and cheap instruments for spectroscopic analysis in the frequency range between 1 and 10 THz.
2. The Instrument
The physical principles of the instrument are similar to those that are described elsewhere [1], but there are significant improvements that changed all performances. Figure 1 illustrates the scheme of the apparatus which allows to explain its functioning, while a photo of the apparatus is shown in Supplementary Material (Figure S1).
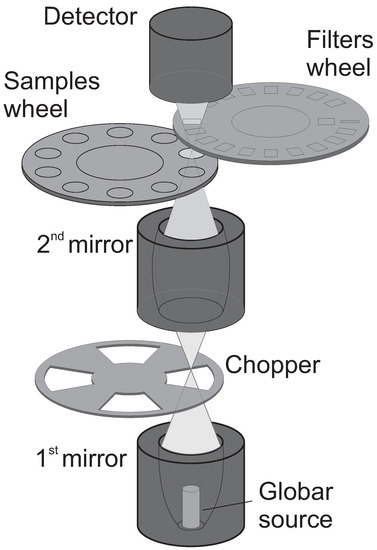
Figure 1.
Scheme of the apparatus.
The apparatus works vertically, a small hot black body (globar) is the source placed on the first focus of one ellipsoidal metal on-axis mirror, a second mirror collects the radiation on the sample. The filters and the pyroelectric detector are a few mm above, on the same optical line. The whole optical length is approximately 12 cm. In some measurements, we used a third mirror to better focus the signal on the pyroelectric detector: this causes an increase in the total optical length and this addition was only made when necessary as the optical path should be kept as short as possible to reduce the absorption from the atmosphere.
The samples are kept horizontally, so that the study of many kinds of materials is simplified: we can analyze solid slices, powders, soft materials, and liquids. Here, we present just measurements on some powders. The whole instrument has an height of 45 cm and a base 20 × 20 cm, so that it can be easily put in a small box with a controlled atmosphere, reducing the humidity to negligible values, if necessary. The weight of the apparatus is only of a few kilograms.
The system can also be easily assembled in a different way to perform 45° reflection measurements by adding a third mirror integrated with the pyroelectric detector. The additional mirror has the first focus on the surface of the reflecting material, while the second focus is on the detector in order to collect the radiation. The filters are between the third mirror and the pyroelectric. This is not a true reflection measurement, because the metal support is the real reflecting surface, due to the negligible thickness of the material. In this case, the total optical lenght is increased to a value of 17 cm.
The source is a small black body (globar [12]) made with a 1.4 mm diameter silicon carbide rod. The carbide rod is an igniter requesting just a 6 V supply. It is kept at 1200 K with a power supply of only 10 W. A small source and a low power guarantee greater durability and simplify the whole system, so that it is not necessary to remove the excess heat; in addition, local heating has a beneficial effect on the measurements, locally creating a zone of lower humidity.
The metallic mirrors are sandblasted and covered with black carbon to reduce the infrared background [1] and they are similar to those of the previous apparatus, but the new design allows an easy alignment along the optical axis.
A chopper in the focus, shared between the two mirrors, modulates the radiation at a frequency of 10 Hz, a value that is chosen in order to maximize the signal-to-noise ratio. The reference signal from the chopper is used for an accurate lock-in analysis made via software.
We used various sample holders. The ones used for the samples as compared with the measurements with the FTIR consists of a polycarbonate disc (a simple CD) with ten 12 mm holes on a 46 mm radius circle. The HDPE (High-density polyethylene) samples, as described later, are placed on the holes. The rotation of the sample holder is controlled by a stepper motor. Another stepper motor, fixed to the box containing the pyroelectric detector, rotates the metal support of the silicon wafer (the substrate for the THz filters). A LabVIEW-based computer software positions the two stepper motors through an Arduino board, controlling the sequence of the filters and of the samples to be analyzed. The beam spot size has a radius of 5.7 mm on the samples.
The metallic mirrors are fabricated by a CNC (Computer Numerical Control) machine and their cost is at least an order of magnitude less than glass mirrors. We use a high quality chopper wheel (model M1F2 by Thorlabs), but with a simple dc-motor. The trigger signal is acquired by common low cost devices: IR-LED and IR receiver.
The alignment of the optics for the previous apparatus [1] was a difficult task: the assembly of the instrument and the alignment required weeks of work, due to the six degrees of freedom of each mirror. The new mechanical project allows for us to leave just a degree of freedom for each mirror: a movement along the common optical axis. Aligning the sample holder, filters, and pyroelectric detector along the central line of the mirrors is an easy job. In one day all the apparatus can be mounted or demounted, thanks also to the THz wavelength that needs a mechanical precision of about 10 m.
The used detector is the same of the one described in the previous paper [1], a commercial pyroelectric sensor (QS2-THz-BL Gentec-EO), but we have substituted the factory silicon window with a thick layer of black HDPE; this has given a significant improvement to the apparatus. This new window has been characterized in the range 1.5 and 17 THz by means of a FTIR and its transmission curve in THz range is well described by a simple quadratic polynomial:
where is the frequency in THz. This window reduces the amplitude of the signal collected at 10 THz of about the 60%, but more significantly it reduces the residual mid-IR spurious signal, which is not eliminated by the absorption of the ellipsoidal mirrors.
3. Selective Filters
The selective filters are made of metasurfaces microfabricated on a silicon substrate [1]. Metasurfaces are periodic two-dimensional (2D) structures of complementary rings (annular holes on the metallic film). The filter with a central frequency of 10.5 THz has a square cell of 7 m lattice pitch, with a ring in the middle of 4.9 m outer diameter and a 0.75 m groove, while the lower frequency filter (1.2 THz) has a 56 m lattice pitch, a 39 m outer diameter of and a 3 m groove.
We span frequencies higher than those that were investigated by the previous apparatus: the highest filter has a central frequency of 10.5 THz. Only three filters operate between 1 and 2 THz, so most of the filters operate in a higher frequency range, where the power of the source is higher.
The manufacturing process is based on a direct writing made by electron beam lithography on a 75 mm double-side polished silicon wafer, previously covered with a layer of about 200 nm of aluminum and an electronic resist. Once developed the film is wet etched. For our process, the wet etching is appropriate for low frequency filters, but it is a technological limit for those at higher frequency.
The 18 filters have been characterized by a FTIR and their transmitted signal has been well fitted by a Lorentz distribution:
where is the frequency in THz, is the central frequency, and A is the amplitude of the maximum. is a linear function of the project scaling factor: we have a base structure at 3.7 THz and, to obtain the highest frequency filter (10.5 THz), we multiply all measures for 0.35 (the scaling factor), and for 2.8 to obtain that one at the lowest frequency (1.2 THz).
The use of the Lorentz distribution for computing the expected signals is a good approximation, even if it does not take into account the residual mid-IR spurious signal at higher frequency; this signal cannot be easily measured, but just attenuated by the window of black HDPE on the detector and by the ellipsoidal mirrors.
In Figure 2, we plot the expected signal by each filter (continuous line) and the experimental results (stars). The expected signal is the convolution of the Lorentz distribution of filters, the HDPE window transmission curve and the emission of the black body source. The ratio between the radiation passing through the higher (10.5 THz) and the lower (1.2 THz) filters is expected to be approximatively one hundred and it is experimentally verified. The black HDPE window and metal mirrors are both necessary in order to reduce the spurious signal in the mid-infrared.
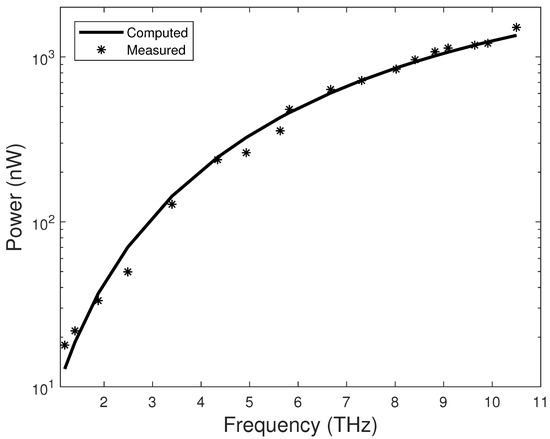
Figure 2.
Expected and measured performances of the eighteen band pass filters.
4. Main Sample Preparation
The transmission characteristic curve of the material is obtained by the ratio between the signal measured by each filter with the sample and the one obtained with an empty disc of HDPE. The measurement error depends on the amplitude of the signal: if we have a power greater than 50 nW, the error is less than 1% (with an acquisition time of 10 s for each filter); if the power is lower than 5 nW, the error can be larger than 10%. A complete measurement (with 18 filters) takes about 200 s, while a fast measurement (1 s for filter) can be performed in 36 s. To avoid confusion, from now on we will call the measuring apparatus with an acronym: MFA (Metasurface Filters Apparatus).
We tested many powdered inorganic materials with the MFA: Al(OH)3, Al2O3, BaCO3, CaCO3, CaSiO3, CuO, FeO, KBr, Li2CO3, Mg(OH)2, MnO2, Na2CO3, NaCl, NaF, SiO2, SnO2, ZnO, ZrSiO4. Most of them are fine powders used as ceramic pigments. To avoid the effect due to the dispersion of radiation, the maximum size limit for the grains is about 20 m. The size of grains of ceramic pigments is always lower that this limit. The other materials are soft and can be easily ground to reduce their grain size, if necessary.
All of these materials are stable over a wide range of temperatures. To prepare the samples we distribute the powders to be investigated on an HDPE disc (10 mm initial diameter and 1 mm thickness), compress the stack between two glass slides and put it in an oven at 140 °C for a few minutes. The procedure causes a thinning and a flattening of the disc, but the powder does not change its position. HDPE is a thermoplastic polymer that easily supports the thermal cycle and is almost transparent to THz. We usually put more powder than needed. The disc is measured with a rapid measurement, the excess material is removed and the disc is covered with a thin layer of HDPE (10 m thick) and placed back into the oven. Accordingly, we have stable samples that can be measured by the MFA and FTIR. The protective layer prevents problems of hygroscopicity and guarantees the stability of the samples. We can estimate the average thickness of the samples from their weight. The two faces of the samples are intentionally not parallel (when possible) in order to remove the artifact in the FTIR response (signal modulation), caused by the interference between them. The flatness of the surfaces guarantees a higher signal in both of the used instruments.
The sample preparation takes a few minutes and we have prepared two samples for all of the materials at least: some of them (BaCO3, CaCO3, CaSiO3, KBr, Li2CO3, NaF and SnO2) show clear features in the THz spectrum with the MFA; the other ones, even if they are easily discriminated, have less interesting features.
5. Experimental Validation
To validate the MFA, we performed transmission measurements of the same samples with the FTIR.
FTIR, having a very good optics, has a spot size smaller than the one of MFA; only if the powder is uniformely distributed on the support, the two measurements can be equal; if the sample, as it often happens, is not perfectly uniform, the investigated areas are a priori different. The sample thickness is inferred from its weight: then, if the sample is not uniform, we can have a more pronounced difference on measurements of supposed different thicknesses made with MFA compared with FTIR measurements. The frequency resolution of the FTIR is about 0.03 THz, that one of MFA is about : that means 1.5 THz at 10.5 THz and 0.16 THz at 1.1 THz. For all these reasons, our target is just a qualitative agreement of the measurements in both instruments; of course, FTIR, having a better resolution, can detect absorption features non detectable by MFA.
The first measurements presented here is on Barium Carbonate (BaCO3) as shown in Figure 3. The two samples have almost the same equivalent thickness of about 22 m. Sample C probably has two parallel faces, which causes an artifact on the FTIR measurement, many peaks due to the interference between the two faces. Sample D, measured with both systems, has the same features, there is only an additional very small absorption at 10 THz in MFA measurement, that disappears in less noisy measurements. It should be noted that the filters at lower frequencies are affected by an error that can also be of 10% (due to the fact that the signal is small), then the measurements in this range of frequencies is often less significant. In Figure 3, the sample C was additionally measured in pure Nitrogen atmosphere, but no significant differences were found, just the 10 THz feature disappears.
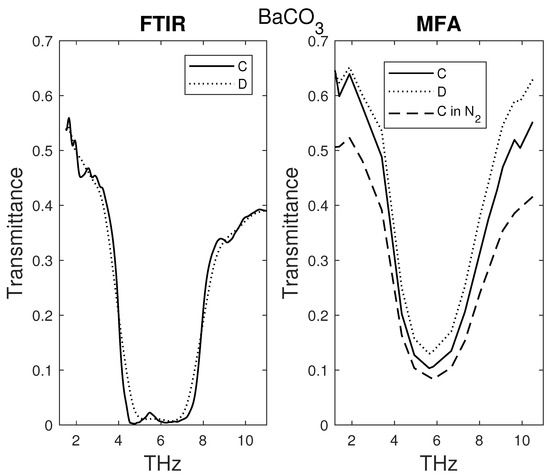
Figure 3.
Comparison on two samples C and D of using Fourier Transformer Infrared Spectrometer (FTIR) (left) and Metasurface Filters Apparatus (MFA) right).
The second measurement here presented is on Calcium Carbonate (CaCO3) and is shown in Figure 4. Two samples were measured: sample E 19 m and sample F 10 m. The absence of the absorption at 7.5 THz in the MFA measurements is due to the fact that its bandwidth is too wide to discriminate small features. Additionally, in this case we made a measurement in pure Nitrogen: there are no significant differences with the measurement in air. The difference in amplitude between the samples E and F is more pronounced in MFA measurements compared with those of FTIR probably because MFA spot size is larger and it mediates on both whole samples.
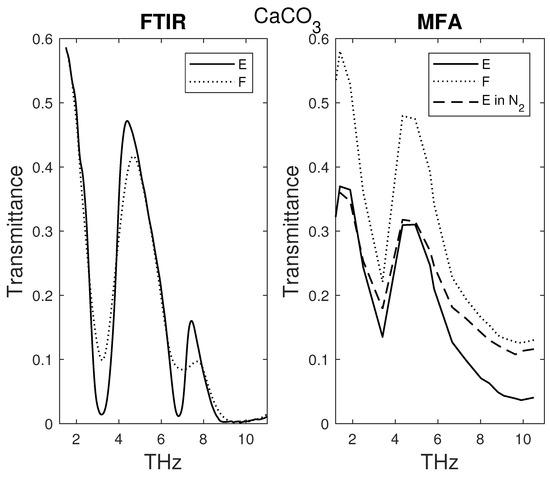
Figure 4.
Comparison on two samples C and D of using FTIR (left) or filter (right).
The third measurement is performed on an alkaline halides: the sodium fluoride (NaF), as shown in Figure 5. The two samples have a different thickness: sample E 39 m and sample F 21m. Our results confirm the transmittance of alkaline halides known in literature (see e.g., p. 60 of the review book [13]). We think that the difference between FTIR and MFA at low frequency are due to the noise in MFA for small signals.
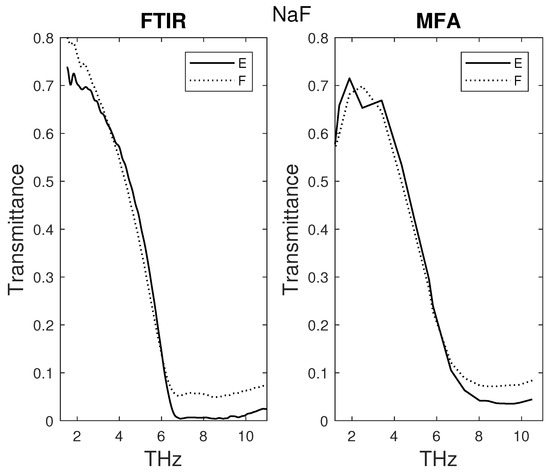
Figure 5.
Comparison on two samples E and F of using FTIR (left) or filter (right).
The measures with MFA were made using a flat disk of HDPE as a reference, while in those with FTIR the vacuum was used as reference, in order to reduce the possibility to have interference between the two faces of the samples. The measurements on all other materials are available on Supplementary Material (Figures S2–S16).
6. Other Ways of Sample Preparation
We tried other preparation techniques that give the same spectrum for many materials, like those shown in Figure 6 for Lithium Carbonate (Li2CO3):
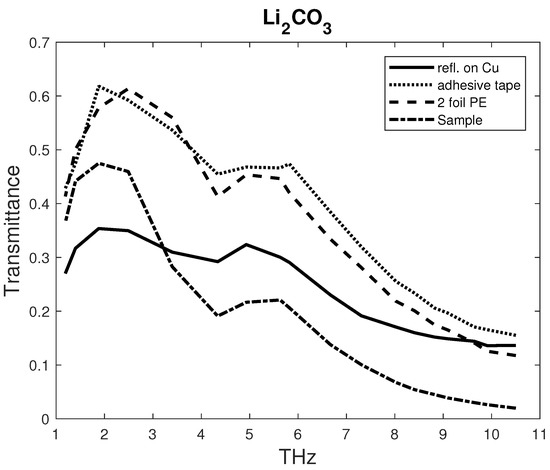
Figure 6.
The MFA used to test different typologies of sample preparation for Li2CO3: Solid line: the material is on a flat copper surface. Dotted line: the powder is on adhesive tape. Dashed line: the powder is between two thin sheet of polyethylene. Dashed-dot line: the powder is inglobate in High-density polyethylene (HDPE) (the stable sample preparation).
- continuous line: the pigment dispersed in a small amount of water is distributed on a smooth surface of copper with a brush and left to dry. The radiation has an angle of incidence at 45° on the sample, the ray reflected at the same angle is collected by the pyroelectric with an additional ellipsoidal mirror. The ratio between this measurement and that one obtained with the glossy copper is the shown spectrum. We performed measurements using a thicker layer of material, but the signal was too low to obtain meaningful information.
All of the other measurements are made with the instrument with two mirrors, as described in Figure 1.
- dotted line: we used a common adhesive tape, that is usually almost transparent at THz, as support and simply brushed some powder on the glue of the tape;
- dashed line: The samples are distributed between two very thin foils of polyethylene (less than 20 m each) and sealed on a large rigid plastic support with an o-ring; and,
- dashed dotted: the main sample preparation (powder inglobate in HDPE).
The last two methods can be both used to compare samples with the FTIR, but using a sample between two very thin foils of polyetilene, the parallelism of the sample produces an artifact (modulation) on the FTIR measurements. All of the measurements give the same result, three regions of absorption: lower than 2 THz, around 4.3 THz, and for frequency higher than 6 THz. The measurement with FTIR (see Figure S9 of Supplementary Material) shows the same results.
All four techniques are suitable for spectroscopy, even if we normally use the most stable one with the disk of HDPE. However, that method can be used only for materials stable for a temperature below 140 °C. The use of adhesive tape to prepare samples, is the simplest technique, but it is more sensitive to dust between preparation and measurement.
7. Conclusions
In this paper, we show that the use of selective filters can be an easy way to perform spectroscopy in the THz range of frequencies. The system described here does not require a special preparation of the samples, it works in air and can discriminate features in the limit of the bandwidth of the filters used. Actually, we can discriminate features covering a range larger than , which, ias shown in Figure 4, has been found for other materials.
The choice of a low Q has been made in order to have a very large range of frequencies to investigate, because the choice of materials was absolutely casual, as we did not have any previous information.
There is not a technological problem to implement band-pass filters with a Q factor that is many times larger than the one used for this work (we can easily increase the Q reducing the shape of the element of the metasurface) and consequently increasing the spectral resolution. We think that our MFA could be used to discriminate different kinds of interesting materials, like explosives (see e.g., [14]) or drugs (see e.g., [6]).
Most materials have a large absorption coefficient in THz range of frequencies: a few tens of milligrams are usually enough to analyze a substance. This allows to analyze extremely limited quantities, an advantage on the study of art-works pigments.
The sample preparation is much easier in THz, if compared with the mid-infrared range; the larger wave length allows less constrains. We showed that many simple techniques of sample preparation can be successfully used. This instrument is a low cost alternative to standard THz spectrometers, its interest is in its extreme simplicity and low cost, suitable for a widespread use.
Supplementary Materials
The following are available at https://www.mdpi.com/2410-390X/4/3/24/s1, Figures S1–S17.
Author Contributions
Validation and editing, F.M.; filter design and fabrication by Electron Beam Lithography, formal analysis, E.G.; conceptualization and software, F.C.; methodology; formal analysis, writing, supervision, P.C. All authors have read and agreed to the published version of the manuscript.
Funding
This research received no external funding.
Acknowledgments
We thank Guido Torrioli for many electronic suggestion. We thank Francesco Del Grande for his mechanical support. We thank the Center of Microscopy of L’Aquila University which gave us the possibility to use the FTIR. F.M. acknowledges the support of the H2020 Marie Skłodowska-Curie Actions (SHAMROCK, 795923).
Conflicts of Interest
The authors declare no conflict of interest.
References
- Carelli, P.; Chiarello, F.; Torrioli, G.; Castellano, M.G. THz Discrimination of Materials: Development of an Apparatus Based on Room Temperature Detection and Metasurfaces Selective Filters. J. Infrared Millim. Terahertz Waves 2017, 38, 303–313. [Google Scholar] [CrossRef]
- Redo-Sanchez, A.; Laman, N.; Schulkin, B.; Tongue, T. Review of terahertz technology readiness assessment and applications. J. Infrared Millim. Terahertz Waves 2017, 34, 500–518. [Google Scholar] [CrossRef]
- Griffiths, P.R.; De Haseth, J.A. Fourier Transform Infrared Spectrometry; John Wiley & Sons: Hoboken, NJ, USA, 2007; Volume 171. [Google Scholar]
- Liebermeister, L.; Nellen, S.; Kohlhaas, R.; Breuer, S.; Schell, M.; Globisch, B. Ultra-fast, high-bandwidth coherent cw THz spectrometer for non-destructive testing. J. Infrared Millim. Terahertz Waves 2019, 40, 288–296. [Google Scholar] [CrossRef]
- Shen, Y.C.; Upadhya, P.C.; Linfield, E.H.; Beere, H.E.; Davies, A.G. Ultrabroadband terahertz radiation from low-temperature-grown GaAs photoconductive emitters. Appl. Phys. Lett. 2003, 83, 3117–3119. [Google Scholar] [CrossRef]
- Davies, A.G.; Burnett, A.D.; Fan, W.; Linfield, E.H.; Cunningham, J.E. Terahertz spectroscopy of explosives and drugs. Mater. Today 2008, 11, 18–26. [Google Scholar] [CrossRef]
- Wang, K.; Sun, D.W.; Pu, H. Emerging non-destructive terahertz spectroscopic imaging technique: Principle and applications in the agri-food industry. Trends Food Sci. Technol. 2017, 67, 93–105. [Google Scholar] [CrossRef]
- Shen, Y.C. Terahertz pulsed spectroscopy and imaging for pharmaceutical applications: A review. Int. J. Pharm. 2011, 417, 48–60. [Google Scholar] [CrossRef] [PubMed]
- Yang, X.; Zhao, X.; Yang, K.; Liu, Y.; Liu, Y.; Fu, W.; Luo, Y. Biomedical applications of terahertz spectroscopy and imaging. Trends Biotechnol. 2016, 34, 810–824. [Google Scholar] [CrossRef] [PubMed]
- Fukunaga, K.; Ogawa, Y.; Hayashi, S.I.; Hosako, I. Terahertz spectroscopy for art conservation. IEICE Electron. Express 2007, 4, 258–263. [Google Scholar] [CrossRef]
- Siegel, P.H. THz instruments for space. IEEE Trans. Antennas Propag. 2007, 55, 2957–2965. [Google Scholar] [CrossRef]
- ML6-10-203FS by by Crystal Technica Ltd. UK.
- Bründermann, E.; Hübers, H.W.; Kimmitt, M.F. Terahertz Techniques; Springer: Berlin/Heidelberg, Germany, 2012. [Google Scholar]
- Leahy-Hoppa, M.R.; Fitch, M.J.; Zheng, X.; Hayden, L.M.; Osiander, R. Wideband terahertz spectroscopy of explosives. Chem. Phys. Lett. 2007, 434, 227–230. [Google Scholar] [CrossRef]
© 2020 by the authors. Licensee MDPI, Basel, Switzerland. This article is an open access article distributed under the terms and conditions of the Creative Commons Attribution (CC BY) license (http://creativecommons.org/licenses/by/4.0/).