
Article

Prototype Scintillating-Fiber SiPM-Based Beam Monitor for Conventional and FLASH Proton Therapy

by
Georgios Mystridis
1,2,*,
Fabio Acerbi
1 and
Benedetto Di Ruzza
3
1
Center for Sensor and Devices (SD), Fondazione Bruno Kessler (FBK), Via Sommarive 18, 38123 Trento, Italy
2
Department of Medical and Surgical Sciences, Polo Biomedico Emanuele Altomare, University of Foggia, Via Napoli 121, 71122 Foggia, Italy
3
Department of Agriculture, Food, Natural resources and Engineering, University of Foggia, Via Napoli 25, 71122 Foggia, Italy
*
Author to whom correspondence should be addressed.
Instruments 2026, 10(3), 36; https://doi.org/10.3390/instruments10030036
Submission received: 4 February 2026 / Revised: 17 June 2026 / Accepted: 25 June 2026 / Published: 2 July 2026

Abstract

The development of FLASH particle therapy, especially proton therapy, characterized by ultra-high dose rates (>40 Gy/s), presents significant challenges for dosimetry and beam monitoring. For example, ionization chambers (ICs) exhibit charge recombination effects leading to saturation, and other passive detectors cannot be used for real-time monitoring. This paper presents the idea, simulations and the preliminary prototype of a scintillating-fibers SiPM-based dosimeter for both high-flux and conventional dose-rate proton beam therapy. The prototype is based on 1 mm diameter plastic scintillating fibers, coupled to Silicon Photomultipliers (SiPMs). We estimated the interactions and the produced light signal within the fibers by the protons and towards the photodetectors using a semi-analytical model combining SRIM and analytical calculations. We estimated a light signal reaching the SiPMs in the range of 107–1011 photons (in a 50 ms beam pulse), for proton energies in the range 70–228 MeV, between the minimum and maximum beam current levels for conventional and FLASH conditions. Results highlight the very large dynamic range needed to be compatible with conventional and FLASH regimes. We also evaluated the linearity limits of the SiPMs and of the scintillating fibers. Finally, we preliminarily validated a reduced prototype version with a proton beam, demonstrating a good linearity of the system.

1. Introduction

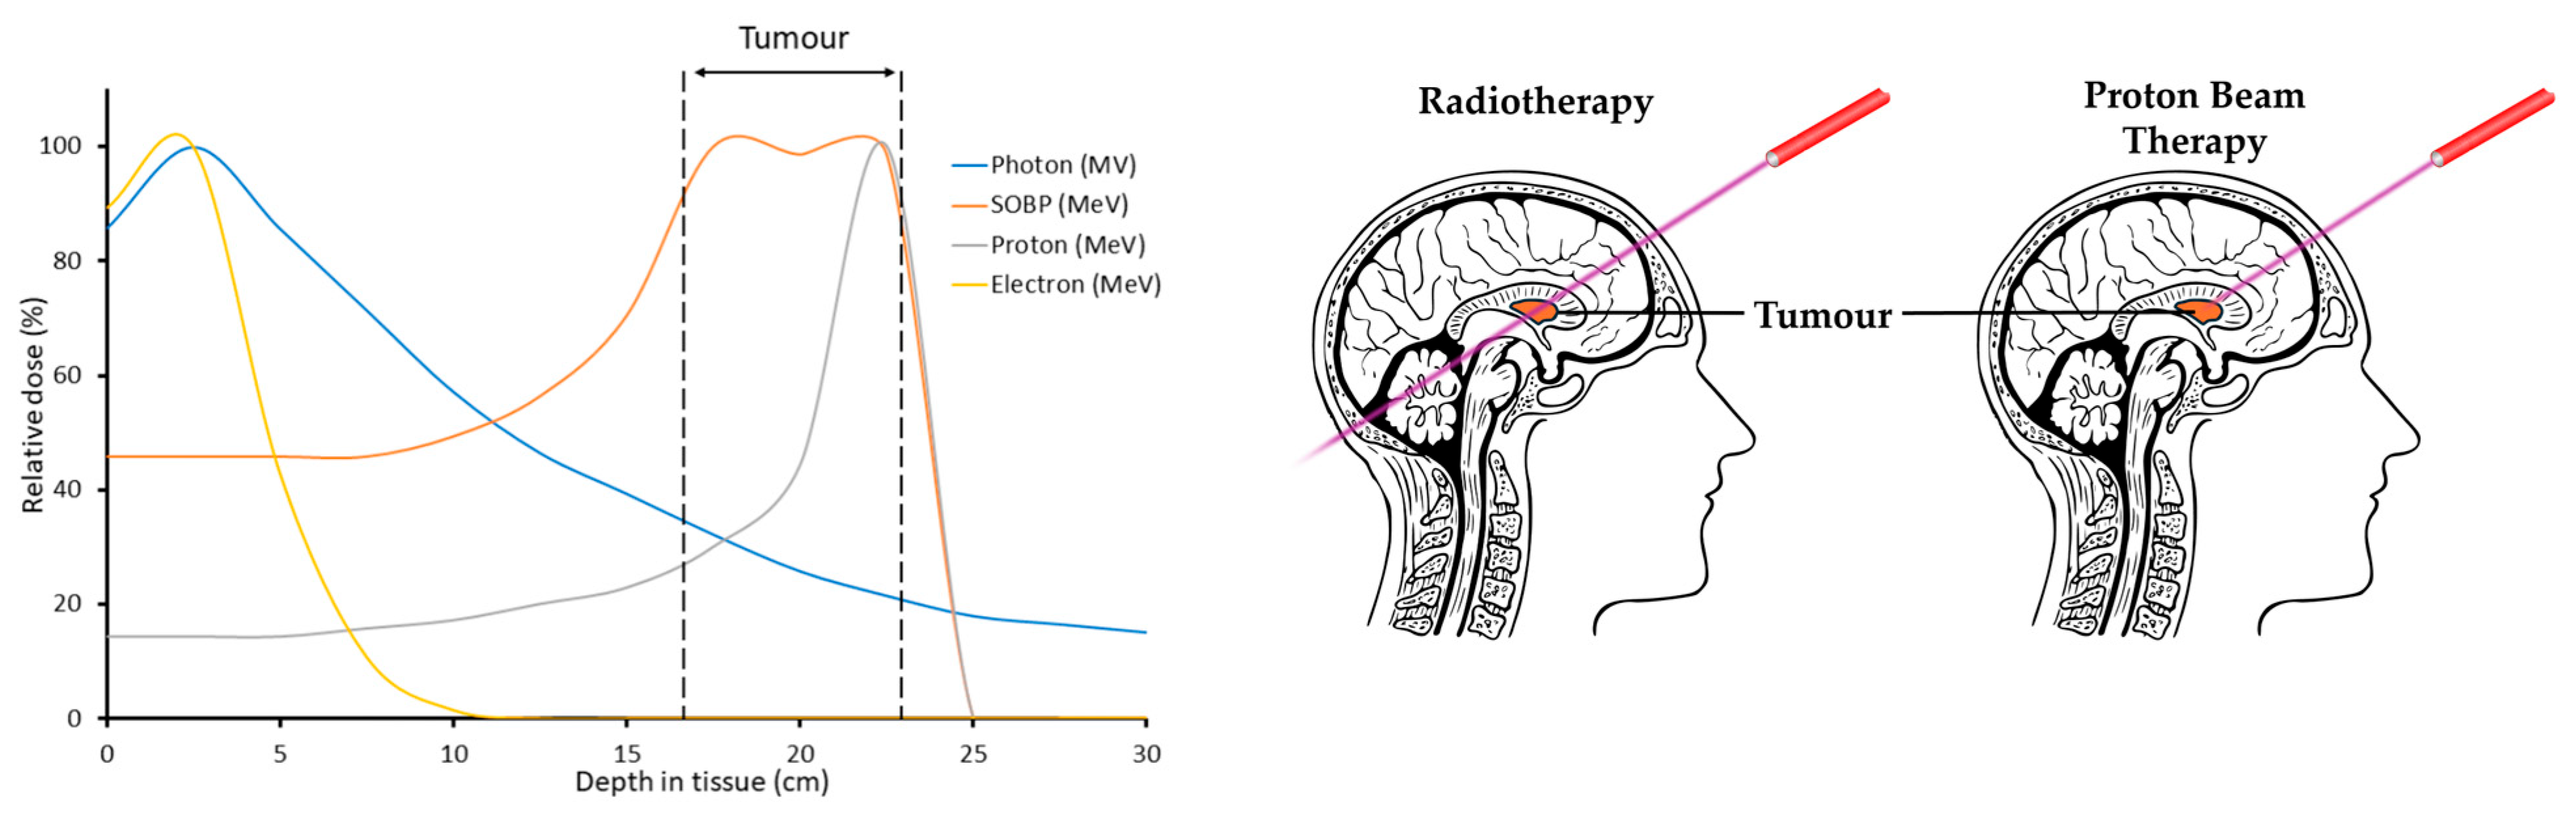
Currently, Radiotherapy (RT) using X-Rays (photons) is widely used to treat tumors, with ~50% of all cancer patients receiving radiotherapy [1]. However, the same mechanism that achieves tumor control is also responsible for its primary drawback: damage to the surrounding healthy tissue caused by unavoidable irradiation, i.e., radiation toxicity or normal tissue complications (NTCP) [2]. To enhance the sparing of healthy tissues, it is fundamental to focus the RT effects only on the tumor. Many techniques have been proposed and can be used for this purpose, for example: (i) multiple irradiations with different angles [3], (ii) spatially fractionated RT [2,4], or (iii) moving from RT to Particle Therapy (PT), using electrons and protons [5,6,7], or heavier ions [8], to better target the location of interest. For example, Proton Therapy has the advantage of an improved spatial distribution of the absorbed dose compared to X-rays (photons). This is clearly evident when comparing their respective depth-dose profiles (Figure 1). Unlike photons, which deposit dose exponentially along their path, protons deposit the majority of their energy at a precise depth, i.e., in the Bragg peak [5]. By modulating the beam energy, this peak can be widened to create a Spread-Out Bragg Peak (SOBP), allowing for the conformal treatment of deep-seated tumors with minimal exit dose to healthy tissue behind the target [5].
In addition to these approaches, in recent years, a new dose delivery method—the “FLASH” Radiotherapy (FLASH RT) or Particle Therapy (FLASH PT)—has been the subject of intense investigation due to its potential to mitigate side effects on healthy tissue. In particular, it can improve the sparing effects while still preserving the effects on tumor tissues [1], thus enlarging the therapeutic window [9]. The FLASH effect can be obtained when using Ultra-High Dose Rates (UHDR), i.e., in the order of >40 Gy/s [1,9,10,11], whereas in conventional dose rates (CONV) it is in the order of ~0.03 Gy/s [1,9,10]. This allows for higher normal tissue sparing while still maintaining tumor control [1,9,12,13].
However, currently, the pre-clinical and clinical implementation of FLASH RT and FLASH PT is hindered by practical limitations, such as the instrumentation. Among others, reliable active dosimetry and beam monitoring [1,9,13]. Typically, for dosimetry in RT and PT, ionization chambers (ICs) are the most used because of their stability and repeatability. They are also used in UHDR conditions, but they have limitations; for example, they show saturation at high dose rate, due to their ~ms ion collection times and the high density of charge carriers generated in the active volume, which leads to massive ion recombination [9], resulting in a nonlinear response. Other detector options for dosimetry include passive detectors, such as radiochromic films (e.g., EBT3) [13] and alanine [13]. Although they are used as a reference standard for FLASH due to their almost dose-rate independence and high spatial resolution, they cannot be used for real-time monitoring. Among active detectors, synthetic diamonds are a leading candidate, offering tissue equivalence, fast response (~μs range), and good linearity [9,13], even though they are typically not cheap and might exhibit saturation at very-high dose-per-pulse levels [14]. Scintillator-based solutions, such as, for example, Plastic Scintillation Detectors (PSDs), represent a good alternative for cost-effective, real-time dosimetry. Based on water-equivalent materials [15], they might have nanosecond decay times and are immune to the ion recombination that plagues ionization chambers [9]. Thus, there has been a significant interest in using plastic scintillation detectors for modern radiation therapy, including photon, electron, and proton treatments [16].
However, their clinical adoption requires careful characterization of ionization quenching (Birks’ effect) in high-LET proton fields [9,15]. PSD technologies have already demonstrated significant utility in clinical settings. For instance, scintillating fiber arrays have been successfully used for 2D dose profiling in water phantoms and for verifying complex intensity-modulated radiation therapy (IMRT) plans [17]. Furthermore, miniature plastic scintillators have been characterized for use in proton therapy across clinical energy ranges (50–250 MeV), proving their capability for surface dose measurements and real-time beam characterization [18].
Generally, there has recently also been a large interest in the development and characterization of novel detectors for both dosimetry and beam monitoring [9], capable of maintaining linearity, thus being usable, both in CONV and UHDR regimes, while also offering the high spatial resolution and good repeatability and stability over time.
In this paper, we propose a Scintillating-fiber (Sci-Fi) based solution, read out by high-efficiency, high internal-gain and fast-response detectors such as Silicon Photomultipliers (SiPMs) [19,20,21]. While some old implementations of Sci-Fi used photomultiplier tubes (PMTs), these are not well-suited for the design of a large array in a small form factor, as is required for medical applications [17]. The transition to SiPM technology has enabled the development of compact and high-speed fiber arrays that are ideally suited for clinical environments. SiPMs are arrays of single-photon avalanche diodes (SPAD), working in parallel, to give the detector both single-photon sensitivity and photon number resolution. They are compact, solid-state and operate with relatively low bias voltages. These characteristics have already driven a major technological shift in medical imaging. For example, they are used in new generations of Positron Emission Tomography with Time of Flight (ToF)-PET systems [22].
The proposed system leverages these established advantages, combining water equivalence, minimizing beam perturbation, good linearity over a large dose-rate range, and fast response times (theoretically within the nanosecond scale). In this work, we present a simulation-driven evaluation of a Sci-Fi SiPM-based dosimeter designed to meet these challenges, supported by a compact, proof-of-concept experimental implementation.

2. Sci-Fi SiPM-Based Detector

The proposed detector is based on a two-layer plastic scintillating detector (PSD). Each layer is composed of many (target 31 elements) EJ-104 plastic scintillating fibers (Eljen Technology, Sweetwater, TX, USA) [23]. They have been selected due to: (i) their minimal beam perturbation, in terms of energy and dose reduction, but still producing sufficient light signal to the photodetectors (single photon sensitive, SiPMs), (ii) the fast decay time constant of 1.8 ns [23] and (iii) the peak emission wavelength (at 408 nm) and spectrum, which are well matched with the photon detection efficiency (PDE) spectrum of the FBK NUV-HD SiPMs technology [20]. The fibers are circular with a core made of polyvinyl toluene (PVT) and a cladding made of PMMA, with a thickness at 3% of the fiber diameter (total diameter of 1 mm).
While tightly arranged square scintillating fibers could theoretically provide a more uniform path length and mitigate energy degradation blurring, circular ones are generally more common and might be better towards the maximization of the area-averaged transparency of the detector. Also, the circular geometry yields a volumetric reduction in scintillating material of approximately 20% per fiber compared to a square cross-section. Furthermore, although circular fibers do not perfectly match the square surface of the SiPMs, the 1 mm diameter ensures the light output is contained within the SiPMs’ active area.
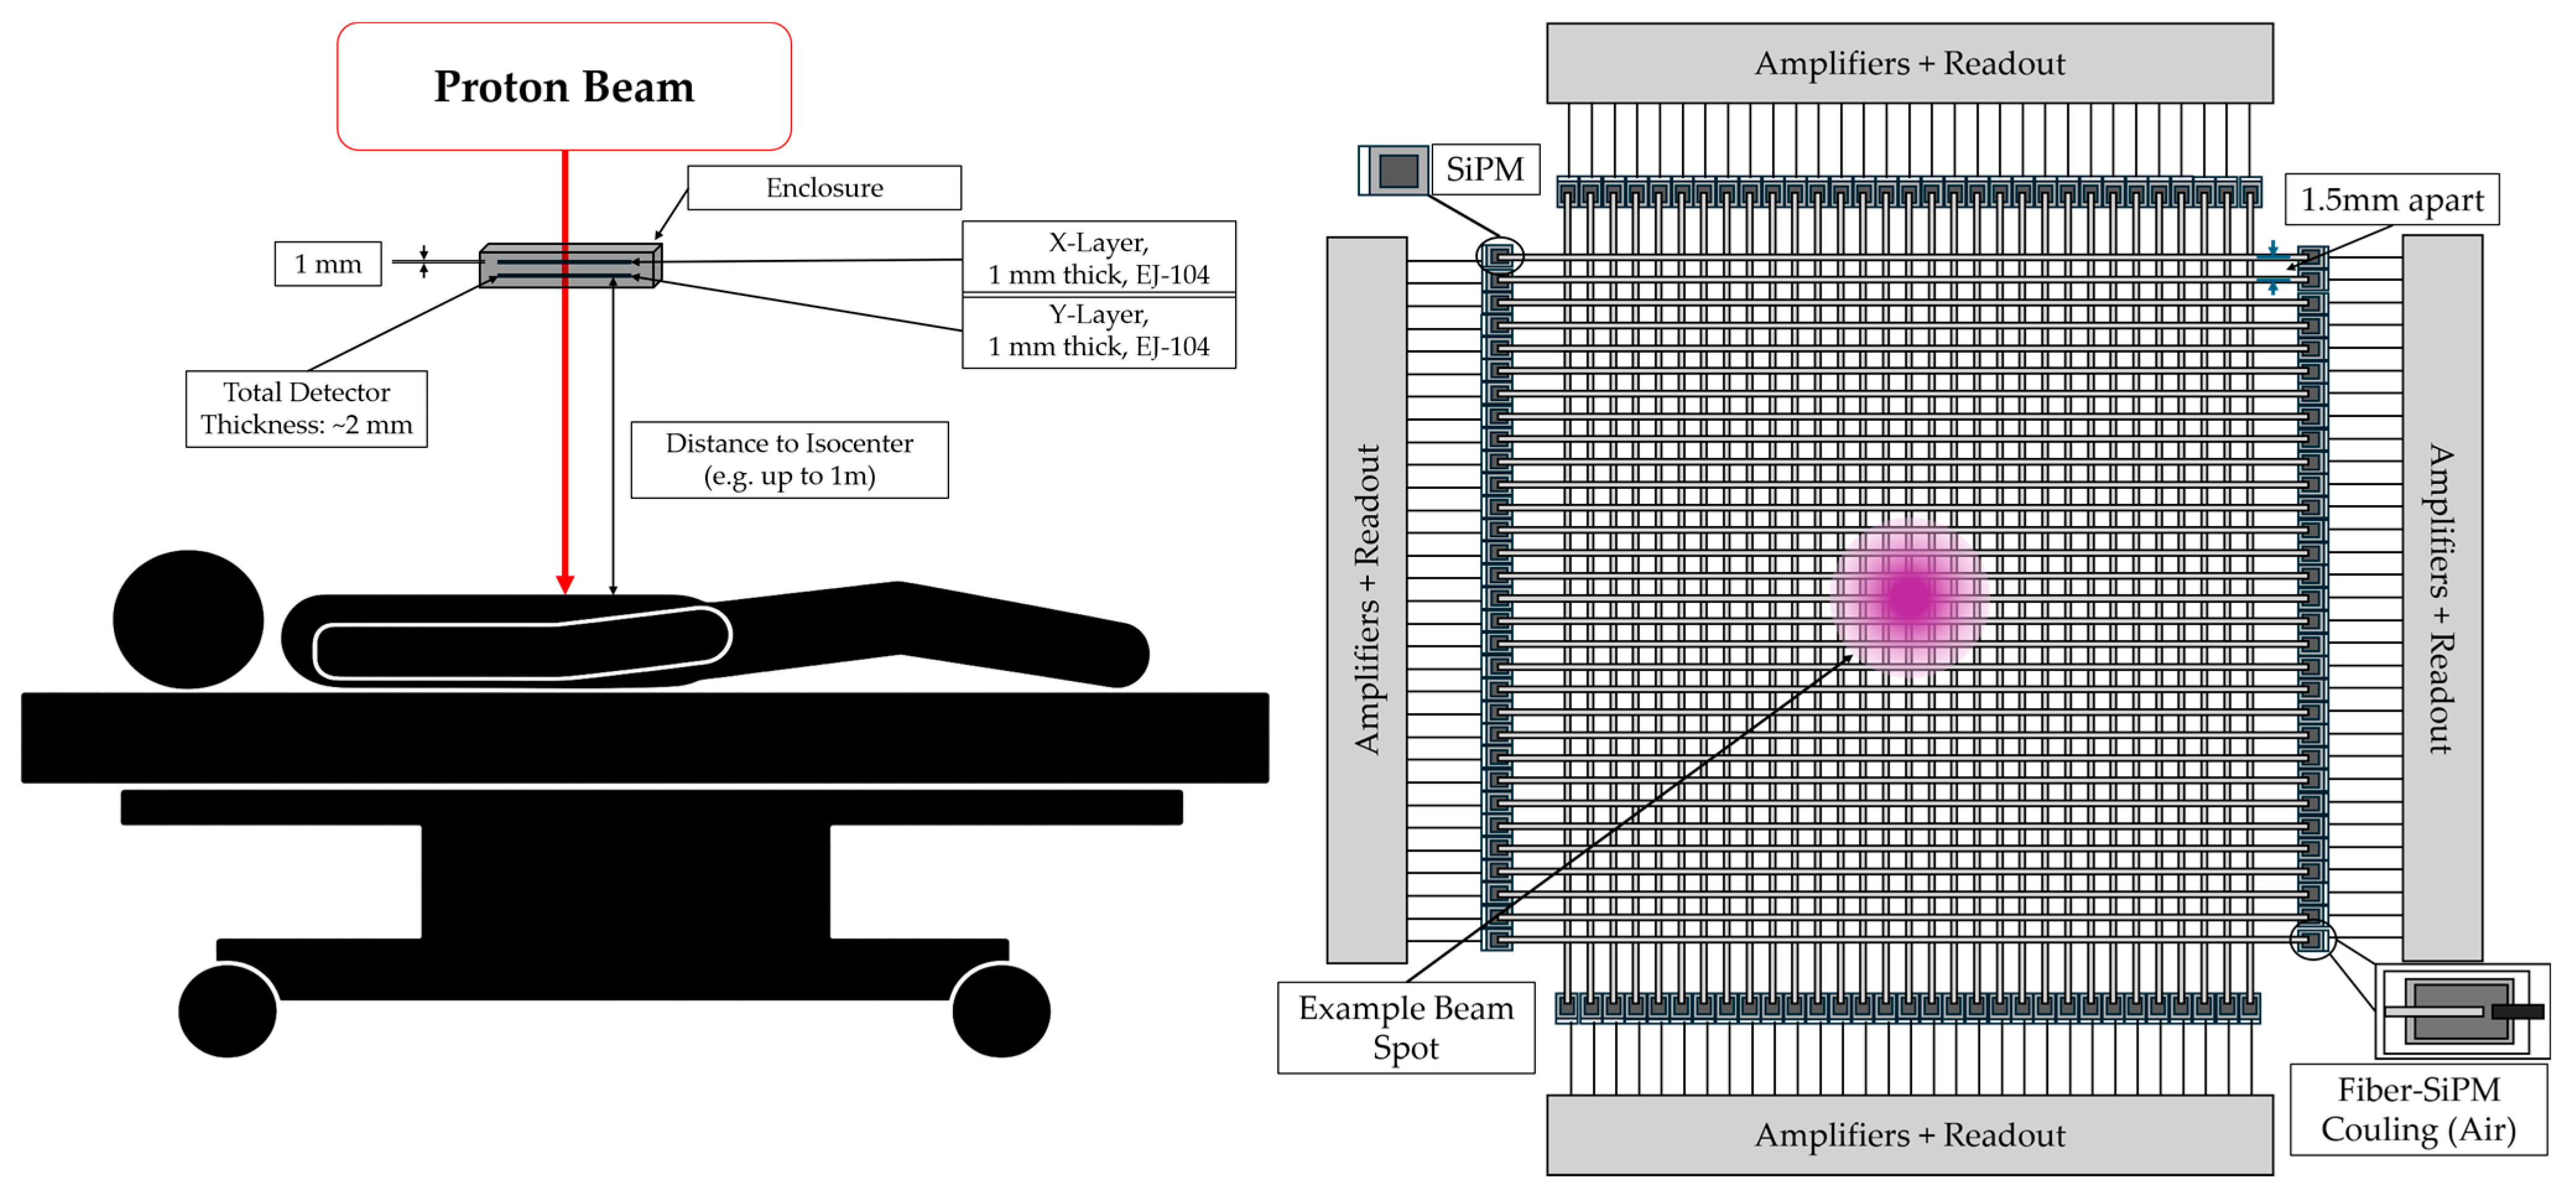
Each fiber is coupled to two SiPMs, one at each end. The SiPMs have been chosen with an active area of 1 × 1 mm2, matching the fiber core dimension. They can be read out with custom transimpedance amplifiers or by ASIC-based systems, and the data collected synchronously with the beam trigger. In the central area of the beam monitoring system (the one exposed to the beam during operation), the fibers are housed and kept aligned using a plastic 3D-printed, custom-made holder, which is also designed to shield the detector from ambient light with a thin plastic cover. The fibers are spaced 1.5 mm apart (this being also the spatial resolution of the beam monitoring system), for a total nominal sensitive area of around 46 × 46 mm2.
The overall system architecture, operational principle and the conceptual design are illustrated in Figure 2. As shown, the device is designed as a transmission detector to be positioned directly upstream of the patient to minimize air-gap scattering. The active detection area consists of two orthogonal layers of 1 mm diameter (in depth) scintillating fibers, resulting in a total physical thickness of just 2 mm (in the central area of the circular fibers).
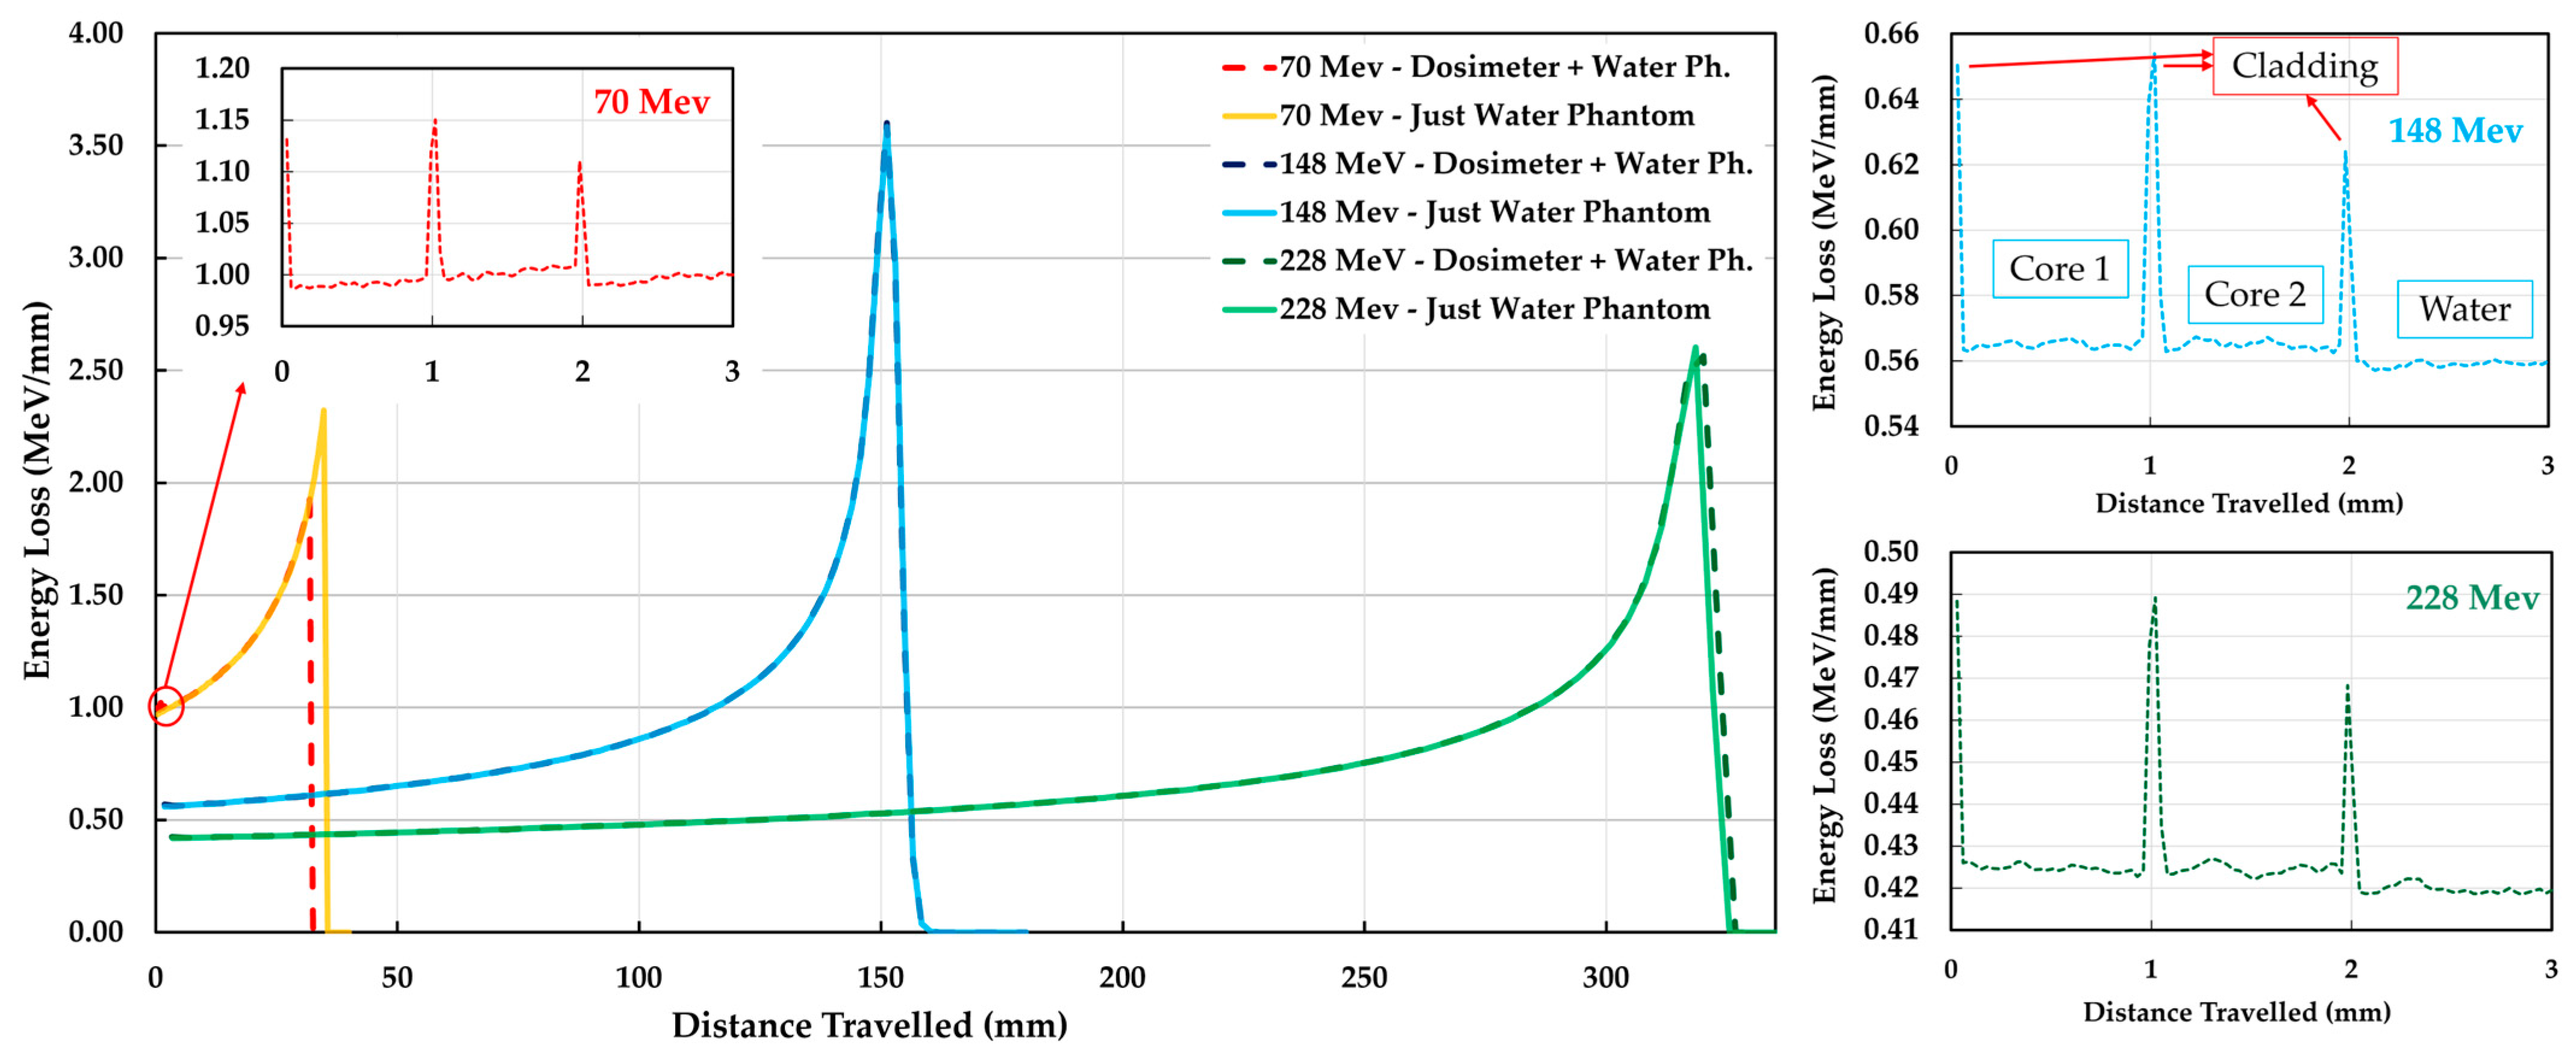
This ultra-thin profile yields a minimal water-equivalent thickness (WET), ensuring the detector remains almost transparent to the beam with minimal attenuation (see estimations in Figure 3 and Table 1). It can be seen that the energy loss is within 0.56% and 2.79%. The higher loss is at the lowest energy, due to the higher interaction of the protons with the fiber material. The corresponding variation in Bragg peak is represented, being maximum at 70 MeV of 2.95 mm (referred to the case with and without the Sci-Fi dosimeter in between). This variation is negligible for the majority of beam energies used in proton therapy. However, even at the lowest energy (where the variation is the highest), the variation is still reasonable since it can be easily compensated for within the treatment planning. The schematic in Figure 2 highlights the X-Y fiber arrangement, which exploits this geometry to enable real-time spatial profiling and monitoring.
Based on the data reported in [24], the beam diameter’s FWHM is between 6.41 mm and 16.32 mm (in CONV regimes). Thus, given the fiber pitch of 1.5 mm, between 5 and 12 fibers (on each layer) are to be simultaneously irradiated by the beam during operation. Therefore, the system is designed to handle a broad dynamic range of proton fluxes and energies, corresponding to the facility’s operational limits. The detector should be able to monitor the beam flux down to 1 nA and up to ultra-high dose rates (>300 nA, up to 500 nA), and energies (between ~70 and ~228 MeV). This capability to cover much more than two orders of magnitude in beam intensity leads to the choice of using the SiPM as the photodetector and of using 2 different types of SiPMs at both ends of the fibers, with different cell pitch, different gain and photon detection efficiency.
Finally, as an additional feature of the proposed system, it can be noted that by positioning the two layers upstream of the patient and combining their temporal information, or using another detector within a certain distance, it might be possible to exploit the Time-of-flight (ToF) of the protons, to determine the beam energy in real-time. This has been done, for example, with other types of silicon detectors [25,26,27]. Alternatively, this can also be achieved by incorporating another detector downstream of the patient that allows for an estimation of the residual beam energy and total absorbed dose, providing immediate feedback on targeting accuracy and verification of the Bragg peak position. This is possible thanks to the good time resolution of the SiPM (in the order of tens or hundreds of picoseconds) [19,21], which is also reduced when detecting more than one photon at a time, i.e., the single-photon time resolution (SPTR) is indeed in the order of 70–100 ps for a 1 × 1 mm2 SiPM, and the few-photon time resolution (FPTR) reduces to a few tens of picoseconds [26]. This feature is interesting and will be further investigated in a future version of the prototype system.

3. Performance Simulations

3.1. Estimation of the Light Output

To predict the detector’s theoretical response and account for the non-linear light yield characteristic of scintillators in proton beams, a semi-analytical simulation was developed. This model combined fundamental interaction data obtained with SRIM\TRIM (v2013) [28] with a geometric discretization method to account for the cylindrical shape of the fiber and the spatial profile of the proton beam.
In the following estimations, we used the beam parameters of the Trento Proton Therapy Center (TIFPA), as reported in [24], to have realistic operating conditions (in terms of energies and doses). Indeed, this facility is currently capable of both patient treatment (CONV) and experimental applications with both CONV and UHDR conditions [11]. We will therefore also validate the prototype of the proposed system in such a facility.
In the following, we detail the steps for the estimation of the signal by the fibers:
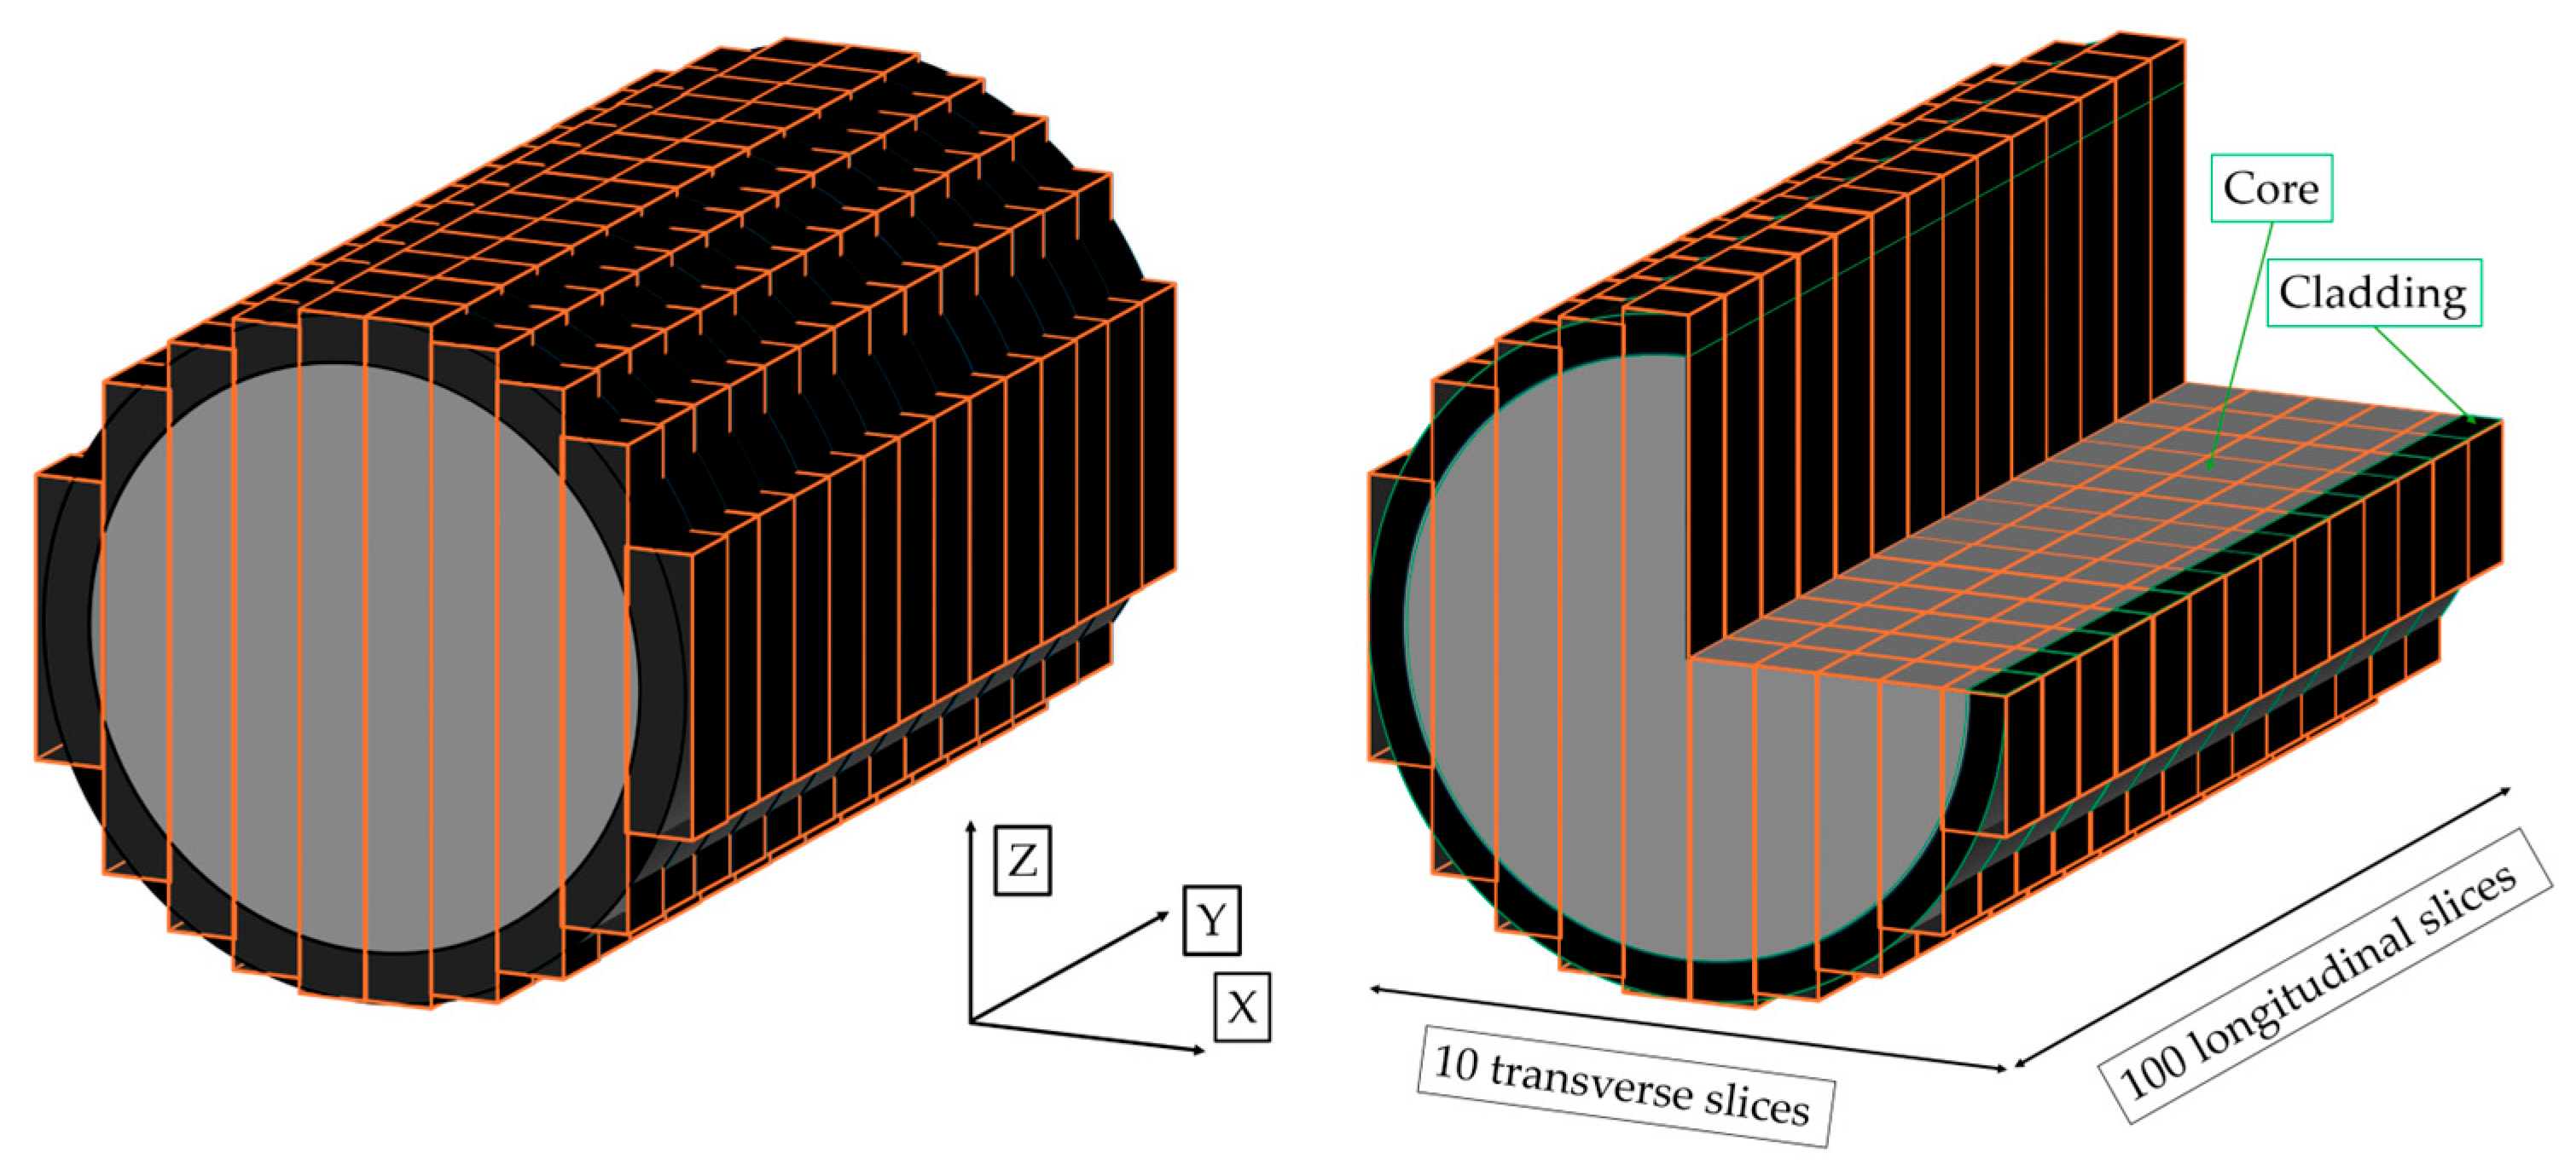
(a) Voxelization: Since the SRIM/TRIM code generates data based on planar (slab) geometry, the cylindrical scintillating fiber has not been simulated as a single continuous volume, but discretized into many voxels, starting in the X direction by dividing it into a total of 10 slices, centered on the central axis. In each of these slices of fiber, we calculated the average cladding and core dimensions and proton interaction.
Each slice was defined as a multi-layer composite block consisting of three distinct regions: (i) entrance Cladding: A layer of PMMA corresponding to the chord length of the cladding at the voxel’s specific height, (ii) Active Core, i.e., a central block of Polyvinyl toluene (PVT) representing the scintillating volume, (iii) exit Cladding, i.e., a final layer of PMMA, symmetrical to the entrance one (Figure 4).
(b) Fluence and Flux Calculation: To determine the number of protons interacting with a single fiber core, the macroscopic proton beam parameters were mapped onto the single fiber geometry through the following steps:
  • The measured flux at the experimental room output, provided by the facility (protons/s), was used to calculate the particle count per pulse width, based on the cyclotron’s temporal structure (a Pulse Width of 50 ms) [24].
  • Using the Gaussian spot size of the beam (σ), the peak proton fluence—ΦMAX (protons per Pulse Width per mm2) at the center of the beam spot was calculated by normalizing the total integrated proton count (flux) by the Gaussian beam width (2πσxσy)
  • The fiber interaction volume was discretized along two axes: the fiber diameter was divided into 10 vertical slices (X-axis on Figure 4), while the fiber length (Y-axis on Figure 4) was segmented into multiple longitudinal steps (to capture the Gaussian intensity drop-off away from the center). For each specific voxel in this grid, the local fluence was determined by scaling ΦMAX according to the beam’s Gaussian distribution at those exact coordinates.
  • The local fluence for each voxel was converted into a particle count (Flux, NPi,j) by multiplying by the voxel’s cross-sectional area. These individual fluxes were then summed up (as seen in Equation (1)) to determine the total number of protons interacting with the single fiber core and the photon production.
Note that, ideally, the light yield of plastic scintillators is linearly proportional to the energy deposited by the incident particle, but this linearity breaks down for heavy charged particles like protons, particularly with high Linear Energy Transfer (LET), such as within the Bragg Peak [29,30,31,32]. The LET of a particle is heavily influenced by its energy, and so is the non-linearity. This is evident in our estimations, where we confirmed that this effect is most pronounced at lower energies—calculated at 16.20% for 70 MeV protons—and decreases to 9.63% at 148 MeV and 7.18% at 228 MeV. However, typically these saturation effects are smaller than in other types of particle detectors.
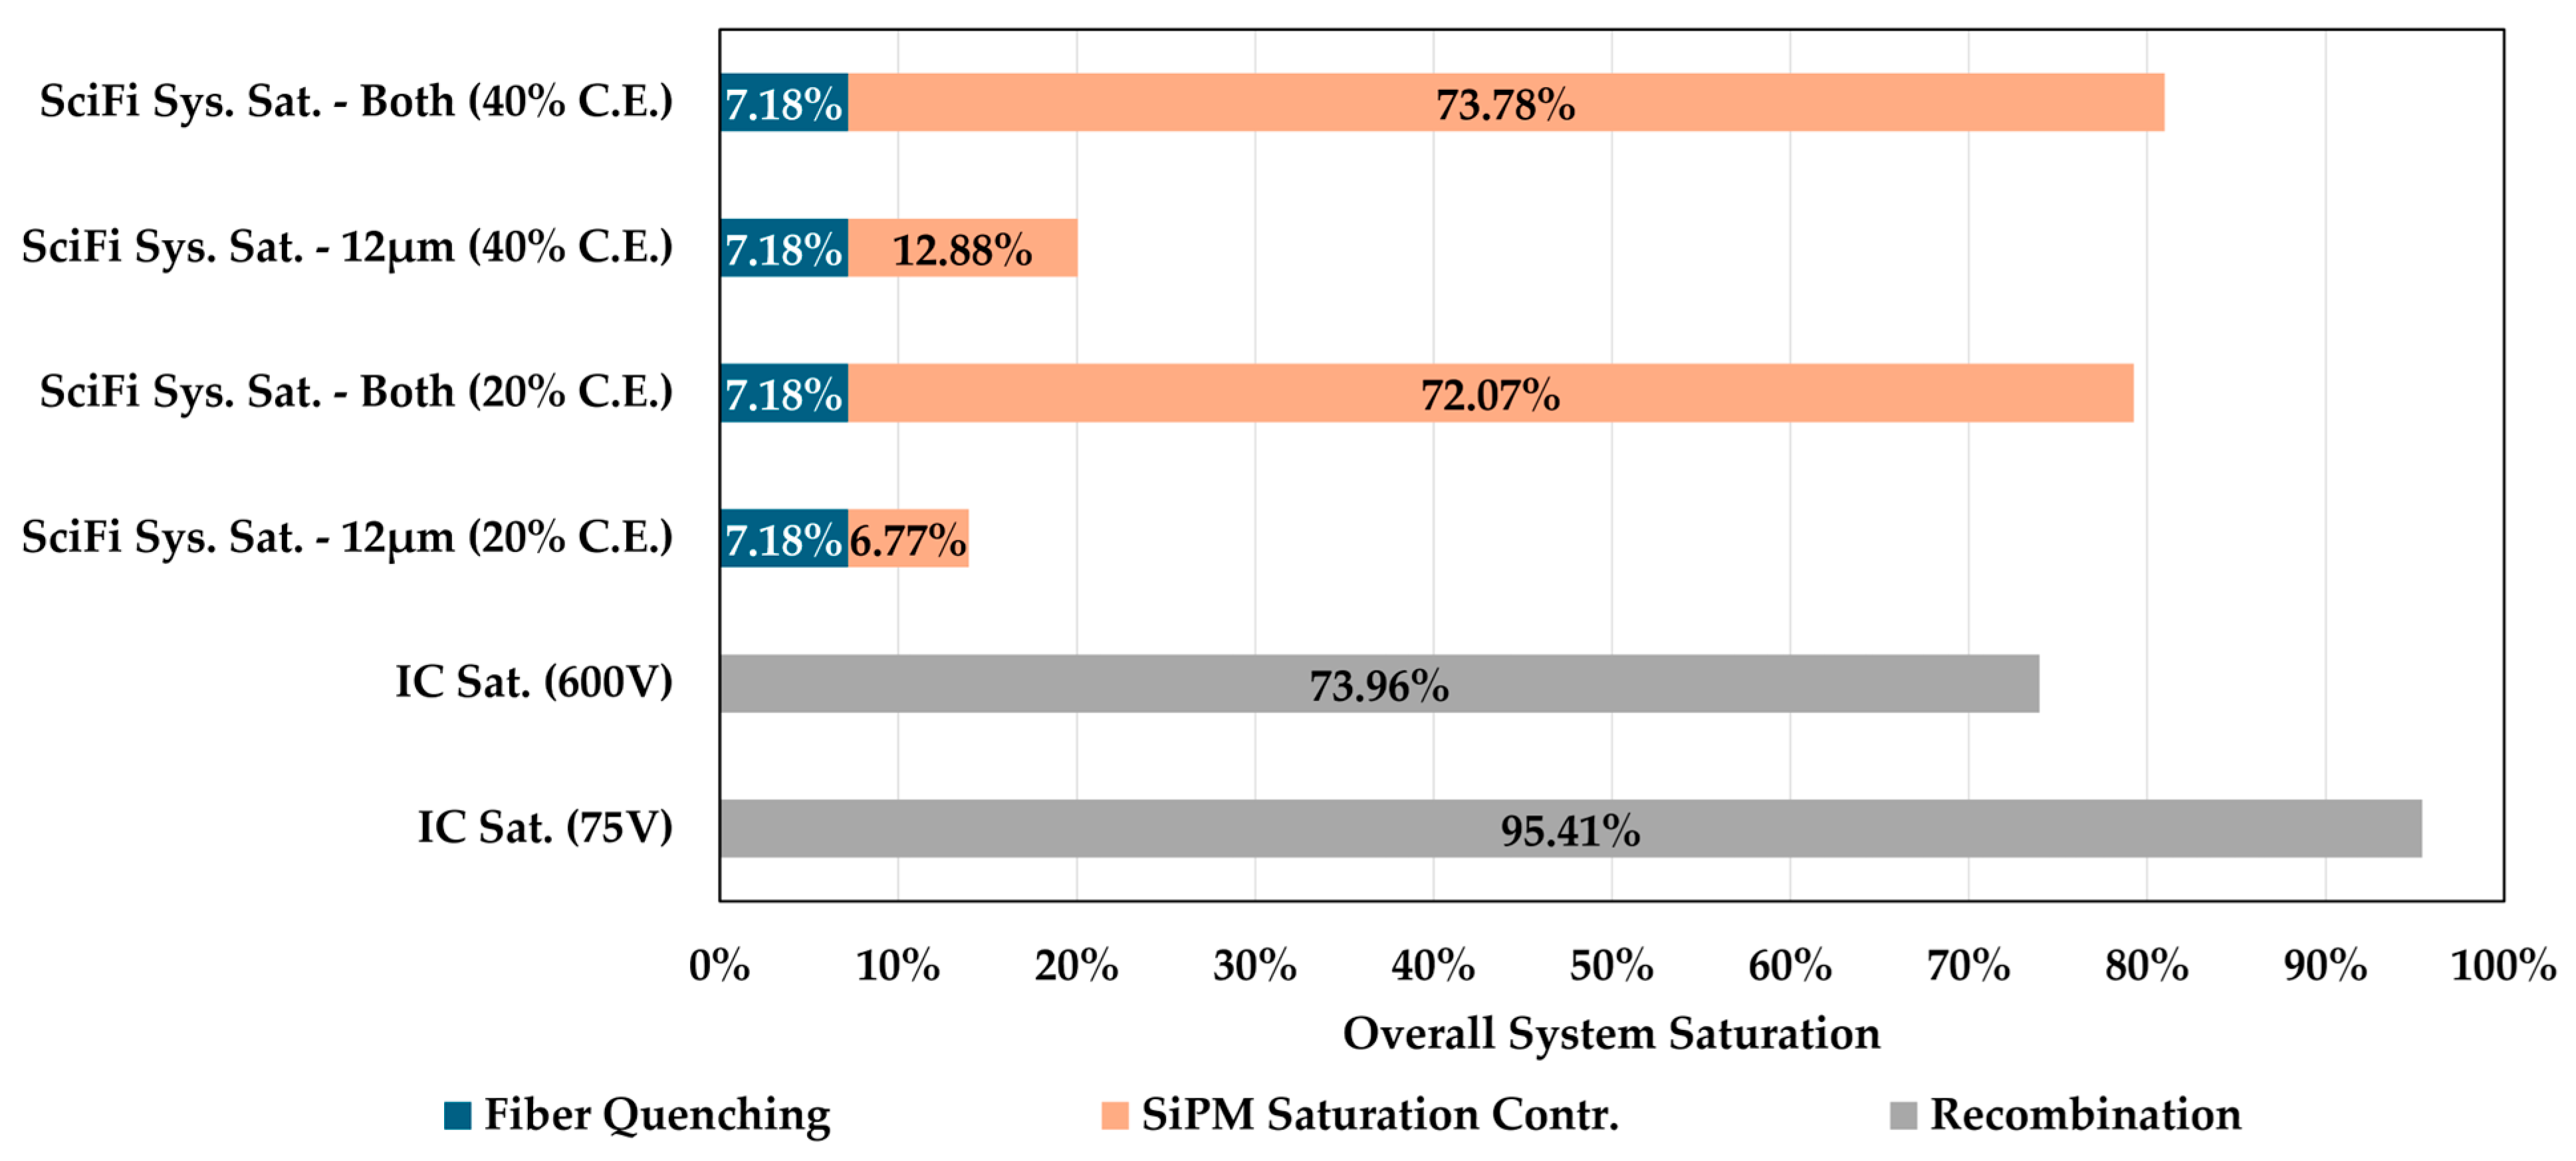
Indeed, as an example, we report a comparison between the calculated total Sci-Fi system saturation and that of an IC [33] under FLASH conditions for different operating voltages in Figure 5. Specifically, to establish a comparison between the two technologies, the saturation due to recombination was calculated based on the data from [33] using the ion recombination correction factor (ks) for the highest and lowest operational voltages provided for ~5 Gy/pulse—corresponding to an instantaneous dose-rate of up to 5 × 10⁶ Gy/s and an overall average dose-rate of up to 117 Gy/s. These yield ~74% and ~95% saturation, respectively. For the Sci-Fi detector, the total system saturation is presented as the contribution of the baseline fiber quenching and the subsequent SiPM saturation. Importantly, the SiPM percentages depicted in the figure (e.g., 12.88% for the 12 µm architecture at 40% coupling efficiency) represent their specific contribution to the entire system’s saturation, rather than the absolute saturation of the SiPMs in isolation (analyzed in later chapters).
As a proton slows down, the density of ionization events along its track increases drastically, thus having a higher effect on lower proton beam energies. This high local concentration of excited states increases the probability of non-radiative recombination, where energy is dissipated as heat rather than emitted as light [34]. This “ionization quenching” has been modeled with Birk’s Law [29,30,31,32], employing a semi-empirical correction (Birk’s Light Yield—BLY), relating the specific fluorescence (dL/dx) to the specific energy loss (dE/dx) via a material-dependent quenching parameter (kB) [35]. Birk’s Law’s accuracy can be lower at very low proton energies, where the LET is high and high ionization densities occur [36,37]. However, at our minimum energy of 70 MeV, it is still acceptable; thus, within our investigated energy range, the Birk’s model remains within an acceptable accuracy for organic scintillators.
The total photon yield was calculated by integrating the contributions of the entire voxelated grid. Following the flux determination in Step 4, the specific photon yield for each individual voxel (i,j) within a transverse slice was computed. This was done by multiplying the local Gaussian-weighted proton count—or Flux (NPi,j) by the effective photon yield per proton (BLY).
The total number of photons generated (NGEN) is obtained by:
N G E N = i = 1 10 B L Y i × j = 1 100 N p i , j
Here, the inner summation aggregates the protons along the longitudinal (Y axis on Figure 4) Gaussian profile for the i-th slice, while the outer summation that combines the ten transverse layers (X axis on Figure 4) is used to approximate the cylindrical geometry for SRIM/TRIM.
To obtain the final electronic signal, we accounted for light transport efficiency, optical losses and photodetector efficiency (Table 2). The number of photons reaching the sensor interface (NEM) was estimated by accounting for optical transport losses. Scintillation emission is isotropic [34]; thus only a fraction of the generated photons satisfies the condition for Total Internal Reflection (TIR) and thus is guided along the fiber. This (total) trapping efficiency was estimated at 6.09%, calculated based on the solid angle defined by the critical angle for TIR, using the core and cladding refractive indices. This value represents the trapping efficiency when accounting for both meridional and skew rays, as in [38], considering a single propagation direction along the fiber. Indeed, utilizing the single-sided value allows for a more precise simulation of the individual SiPM response at each fiber end. Given that the actual trapping efficiency in long fibers lies closer to the meridional-only (3.14%) than the combined meridional and skew ray limit (6.09%) [38,39], we opted to use their average value (4.62%) to represent a more realistic theoretical yield for a 1 m distance between the fibers’ center and the SiPMs (which is the case in these simulations). Additionally, photon loss during propagation was modeled using the bulk attenuation length of 2 m [23], which is typical for commercial fibers and accounts for self-absorption and scattering. For a scintillation event occurring at 1 m, it corresponds to a transmission efficiency of 60.7%. Finally, a generic and conservative coupling efficiency of 30% (i.e., 70% total loss) was applied at the fiber-SiPM interface. This is composed of a ~10% interface loss (from plastic to air to protective resin on the SiPM’s active area) [34,40] and by expansion at the fiber exit face, creating a divergent emission (~66%). The impact of the coupling efficiency is visualized in Figure 5.
Despite the fact that these optical efficiencies may appear modest, the response remains sufficient for the proton energy regime addressed in this study (70–228 MeV). We estimate 107 to 1010 photons reaching the sensors (for CONV conditions). In case increasing the efficiency is needed, it is possible to: (i) use shorter fiber lengths, (ii) use a coupling medium between the fiber and the detector, (iii) use a reflective coating on the optical fibers.
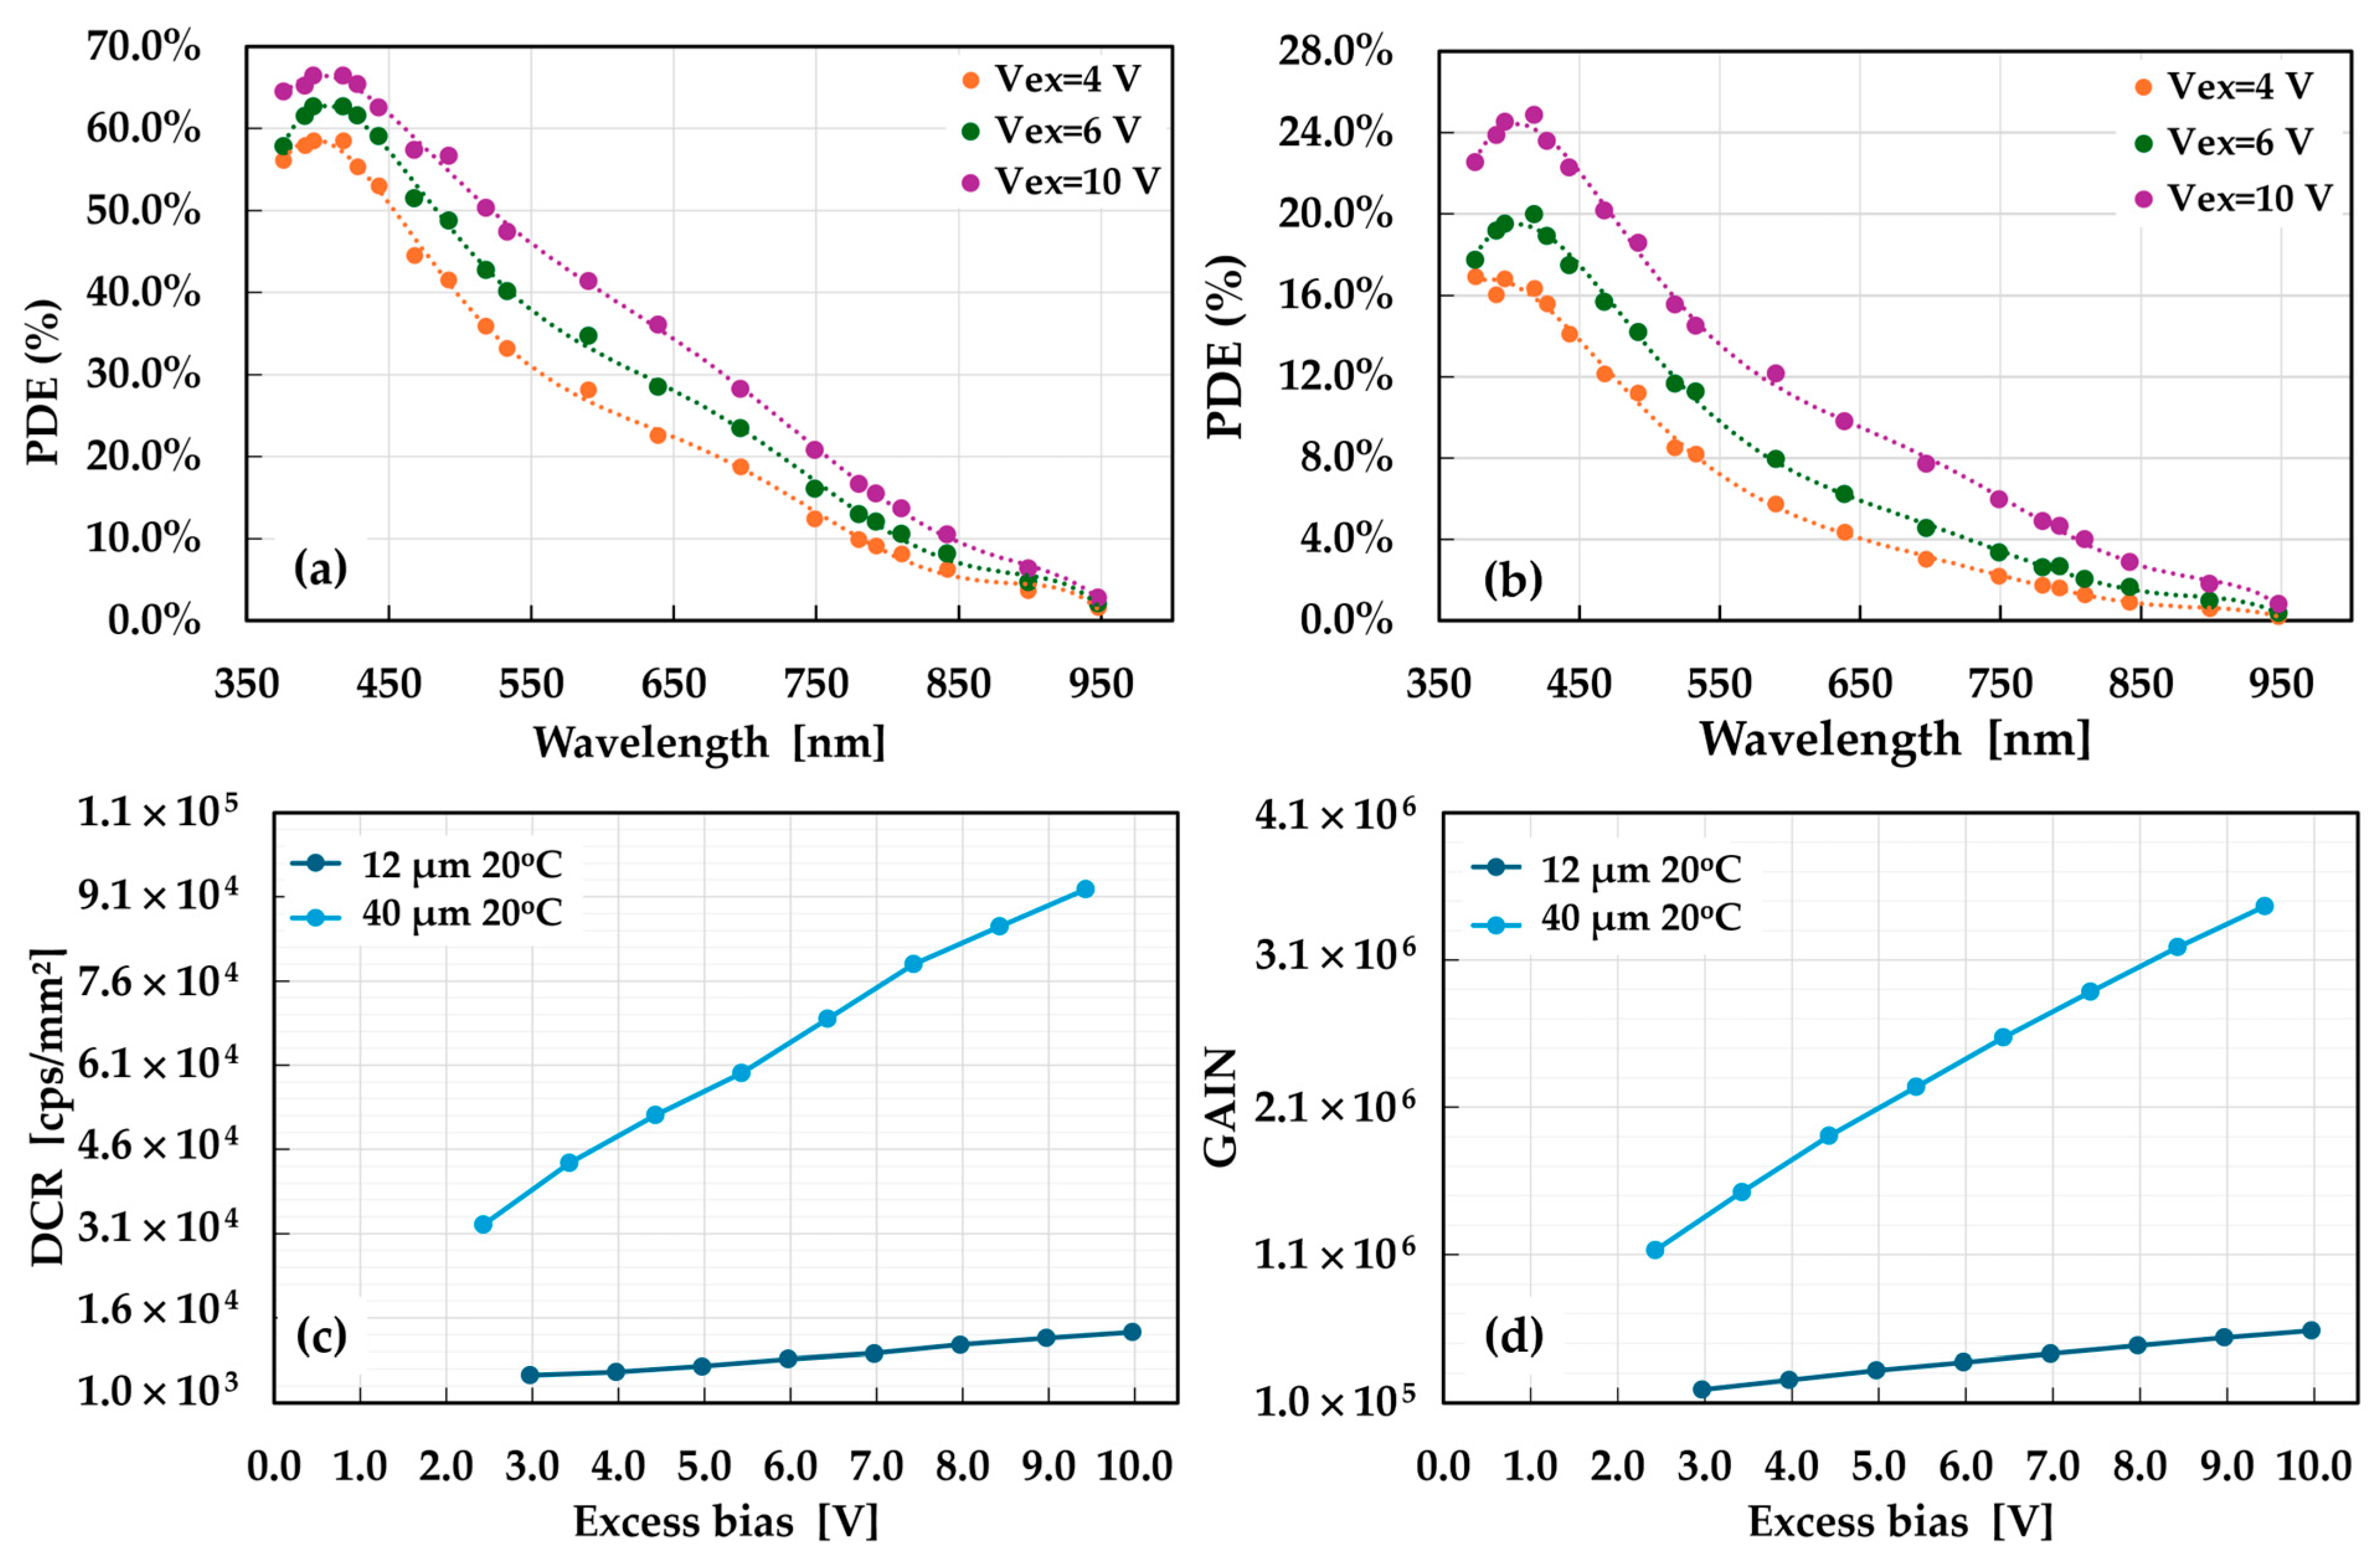
Finally, the conversion from generated (emitted) photons (NEM) to detected avalanche pulses (counts) (NDET) is through the SiPM’s Photon Detection Efficiency (PDE). Since the PDE is strongly wavelength dependent (as well as on the SiPM cell pitch), we took into account the whole emission spectrum of the EJ-104. The number of photons emitted at each wavelength (NEM(λ)) was calculated and multiplied by the measured PDE. The actual detection efficiency (spectral) as well as the main functional parameters in dark conditions have been measured on several samples of SiPMs, at a controlled temperature of 20 °C. These measurements have been done in a light-tight and temperature-controlled chamber using established procedures, e.g., the PDE was determined via the pulsed-light counting method in [41], based on illumination (light pulses) of the device under test using an integrating sphere in a pre-calibrated setup. The other SiPM parameters were measured in counting mode by analyzing the inter-time between pulses in long waveforms, as described in [42]. The main results are reported in Figure 6. The total number of detected (primary) avalanche pulses (NDET) was then obtained by summing the contributions from all spectral bins:
N D E T V E X = λ N E M λ × P D E λ , V E X
In the simulations, we accounted for the full range of beam parameters, i.e., lowest (70 MeV) to highest energy (228 MeV) and with the lowest and highest current (i.e., 20 nA up to 300 nA), which translates into the lowest and highest dose rate to the patient. Moreover, we also took into account the UHDR beam conditions of the facility. This is available at 228 MeV only, and the beam current can be increased up to 500 nA [11]. The beam spot diameter is quoted in [24], being increased up to around 10 mm [11].

3.2. System Response

Table 3 summarizes the typical flux at 1 nA current and the corresponding beam width. In the calculation, the flux has been scaled when using higher beam currents.
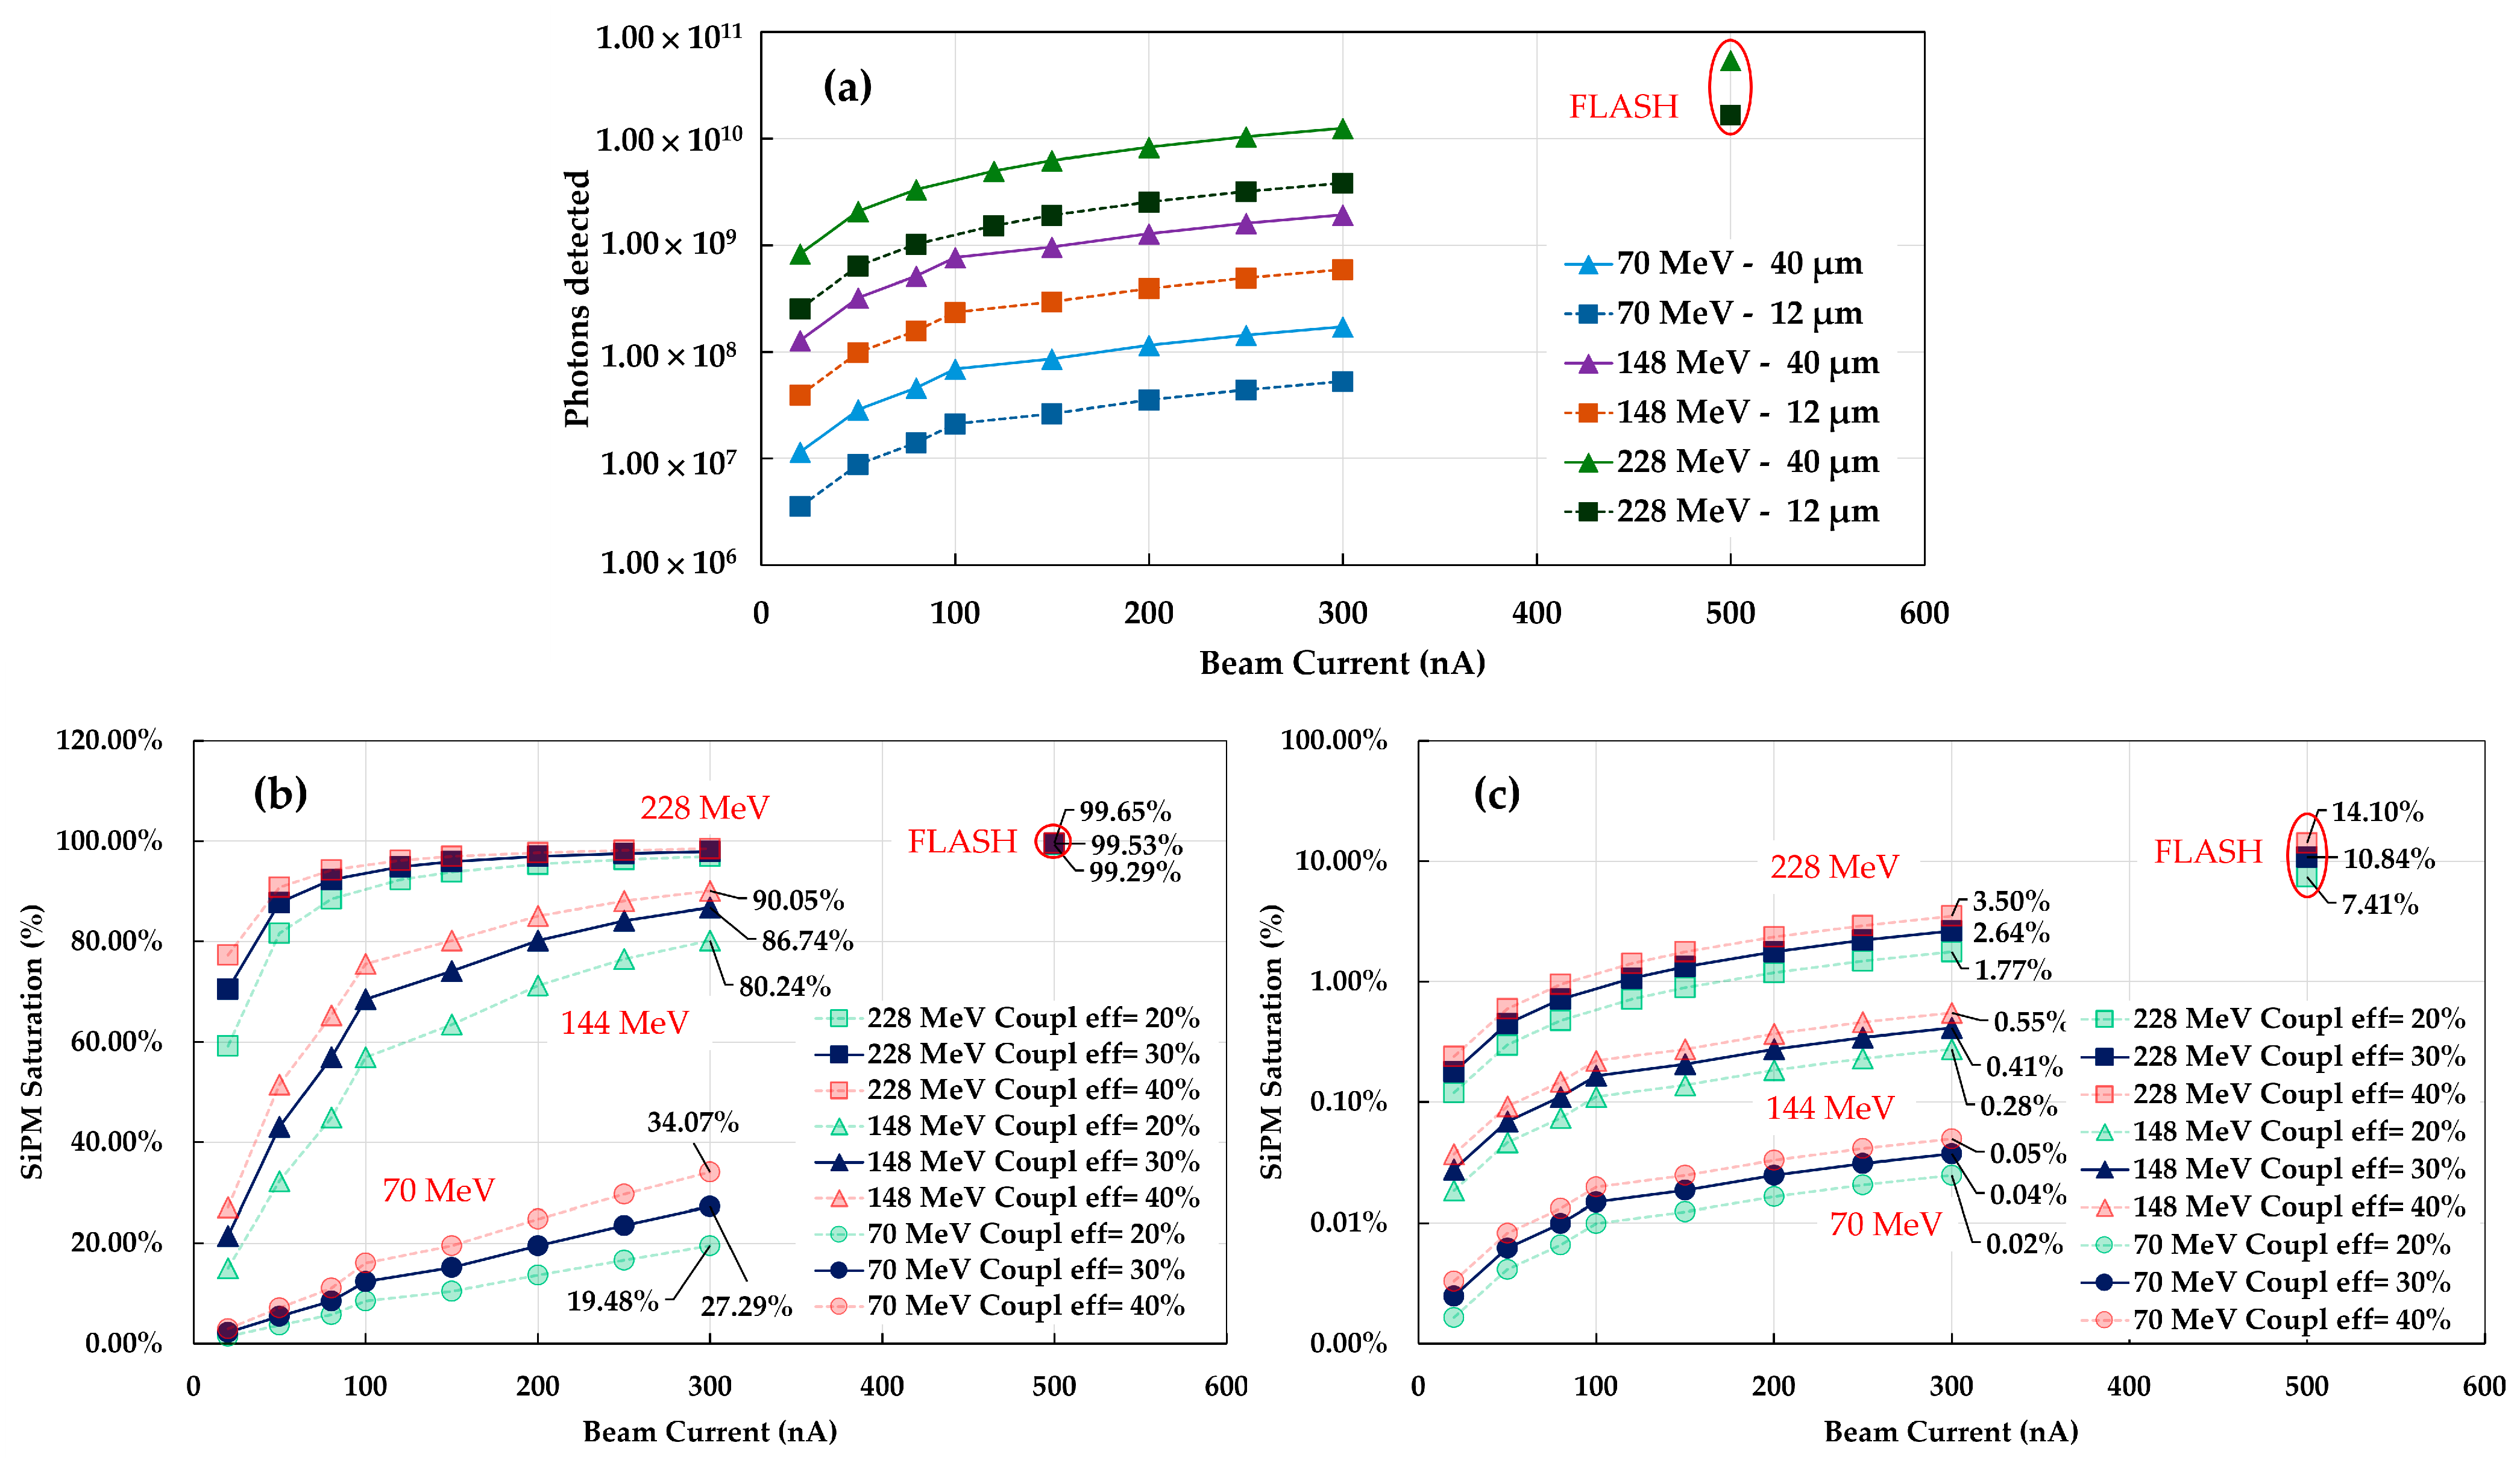
Note that the proton beam is Gaussian with a slight asymmetry as illustrated in [24]. The system performance was simulated by varying: (i) Beam Energy, (ii) Beam current, and (iii) SiPM Bias Voltage. For a typical proton pulse of 50 ms (realistic pulse width also in FLASH conditions), Table 4 shows the estimated number of detected photons (NDET) by the SiPMs (i.e., proportional to the number of avalanche pulses), while Table 5 shows the estimated saturation percentage of the SiPM (which depends on the number of microcells and incident photons). Both are visualized in Figure 7. In Table 4, the Bias voltages for both types of SiPMs are 34 V and 35 V, respectively. These voltages were determined empirically during the experimental validation of a preliminary version of the system, representing an optimized trade-off between maximizing signal amplitude at low photon fluxes and reducing saturation at high fluxes (i.e., good dynamic range). The different values between the two SiPM types are due to their different PDE, correlated noise and gain.
To evaluate the linearity limits of the system, by simulations first, we quantified the deviation between the detector’s ideal response and its actual saturated output. First, the ideal linear response (ideal number of counts, NID-DET) was calculated [43]:
N I D D E T = N D E T × 1 + P
where NDET is calculated according to Equation (2), while P accounts for correlated noise probability, i.e., as a very first approximation, the sum of the Crosstalk and After pulse probabilities. This is only valid for small probability values. These Crosstalk and Afterpulsing probabilities of the SiPMs were experimentally measured contextually to DCR and gain, as described earlier. Direct crosstalk is estimated from the amplitude distribution of pulses, while delayed crosstalk and afterpulsing are determined from the inter-times histogram of the pulses.
The actual SiPM output follows an exponential saturation curve as the number of incident photons approaches the number of available microcells (NCELLS) [21]. The number of actually triggered cells (NCOUNTS) was calculated using a time-dependent saturation model. Since the proton pulse duration (PW = 50 ms) is orders of magnitude longer than the typical microcell recovery time (td), the microcells can recharge many times, thus we can use the formula [43]:
N C O U N T S = N C E L L S × P W t d × 1 e N I D D E T N C E L L S × P W t d
The saturation level was defined as the percentage level of the non-linear response.
The simulation results highlight a significant saturation level for the 40 μm pitch SiPMs, particularly at higher energies and current (>148 MeV) (Table 5). At 228 MeV, the 40 μm SiPM is saturated >70%. This is primarily driven by the fact that the proton flux (protons/s) at 228 MeV is approximately two orders of magnitude higher than at 70 MeV.
Conversely, the 12 μm pitch SiPM, while having a much lower detection efficiency, has a higher linearity due to its higher microcell density (NCELLS). The SiPM saturation is approaching zero (<0.1%) at 70 MeV, and at 148 MeV <0.5%. These results indicate that while SiPM with a larger pitch may be beneficial at low-signal intensities (e.g., having a better signal-to-noise ratio), the 12 μm is essential for maintaining linearity in FLASH. The idea of using both SiPM types, with one variant at each end of every fiber, on the two ends of the fibers, is therefore towards the maximization of the dynamic range.
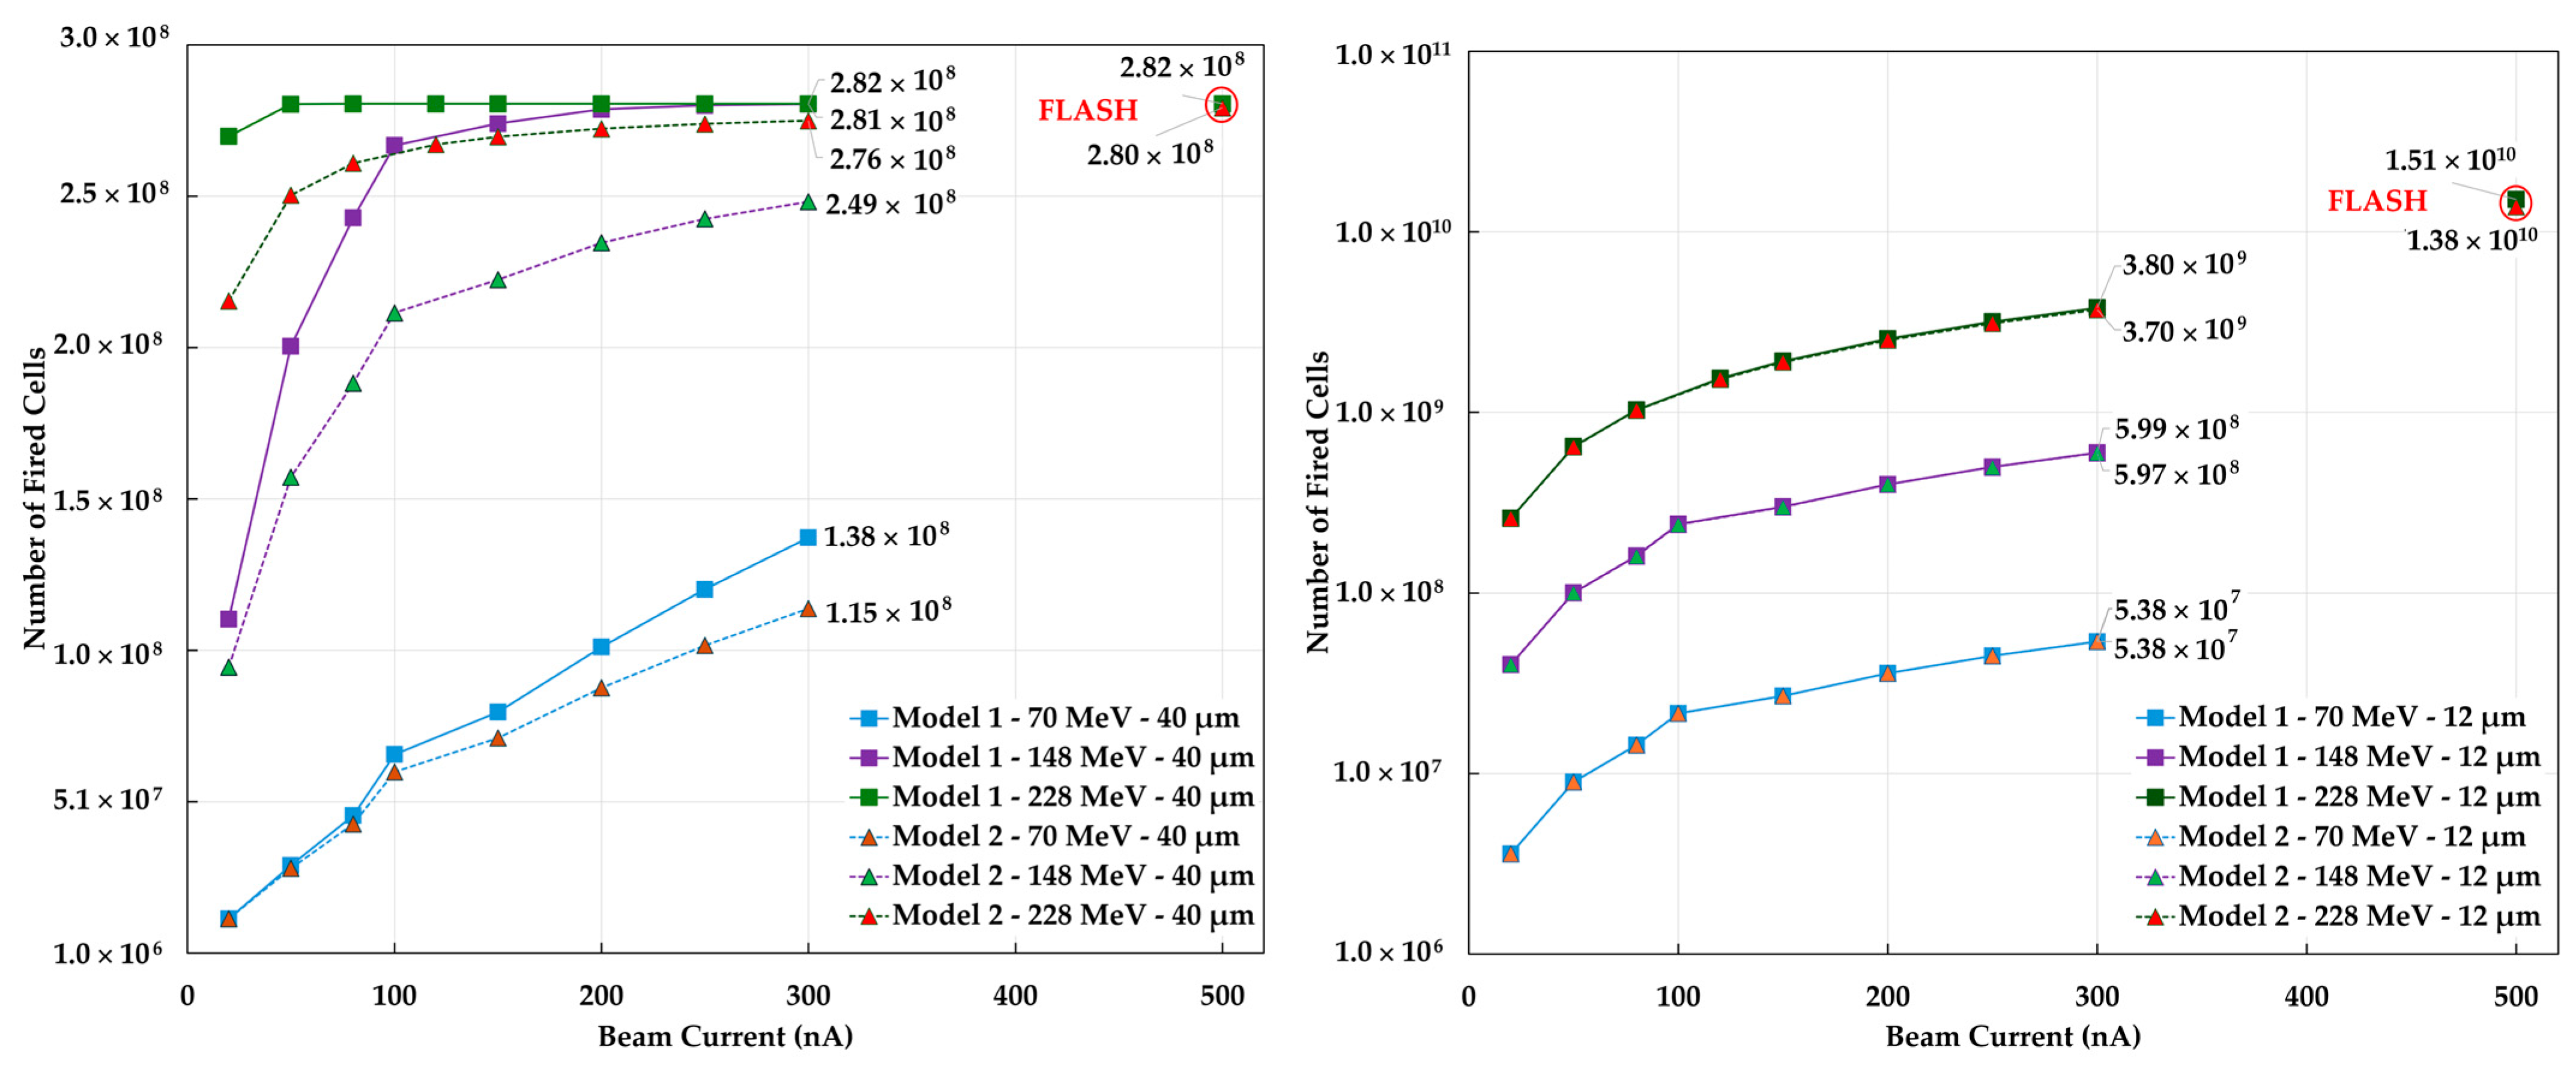
As a further analysis on the dynamic range at ultra-high dose rates, we cross-compared the anticipated SiPM response using the transient analytical model proposed in [44], which evaluates the SiPM response in short, medium and long-term time regions, with respect to its microcell recharge time. It can be seen that it tends to estimate a higher level of saturation (or equivalently, a smaller number of fired cells) with respect to the previous model (Figure 8). Moreover, it is worth noting the apparent deviation of the 228 MeV (FLASH) data point from the expected monotonic trend observed for the other “conventional” data points in Figure 8. This behavior is caused by a significant increase in the proton beam’s standard deviation (Table 3) under FLASH conditions. This spatial broadening of the beam alters the light yield distribution and is clearly registered by the 12 μm SiPM due to its preserved linearity. In contrast, this effect is masked in the 40 μm configuration, where the sensor’s saturation flattens the response.
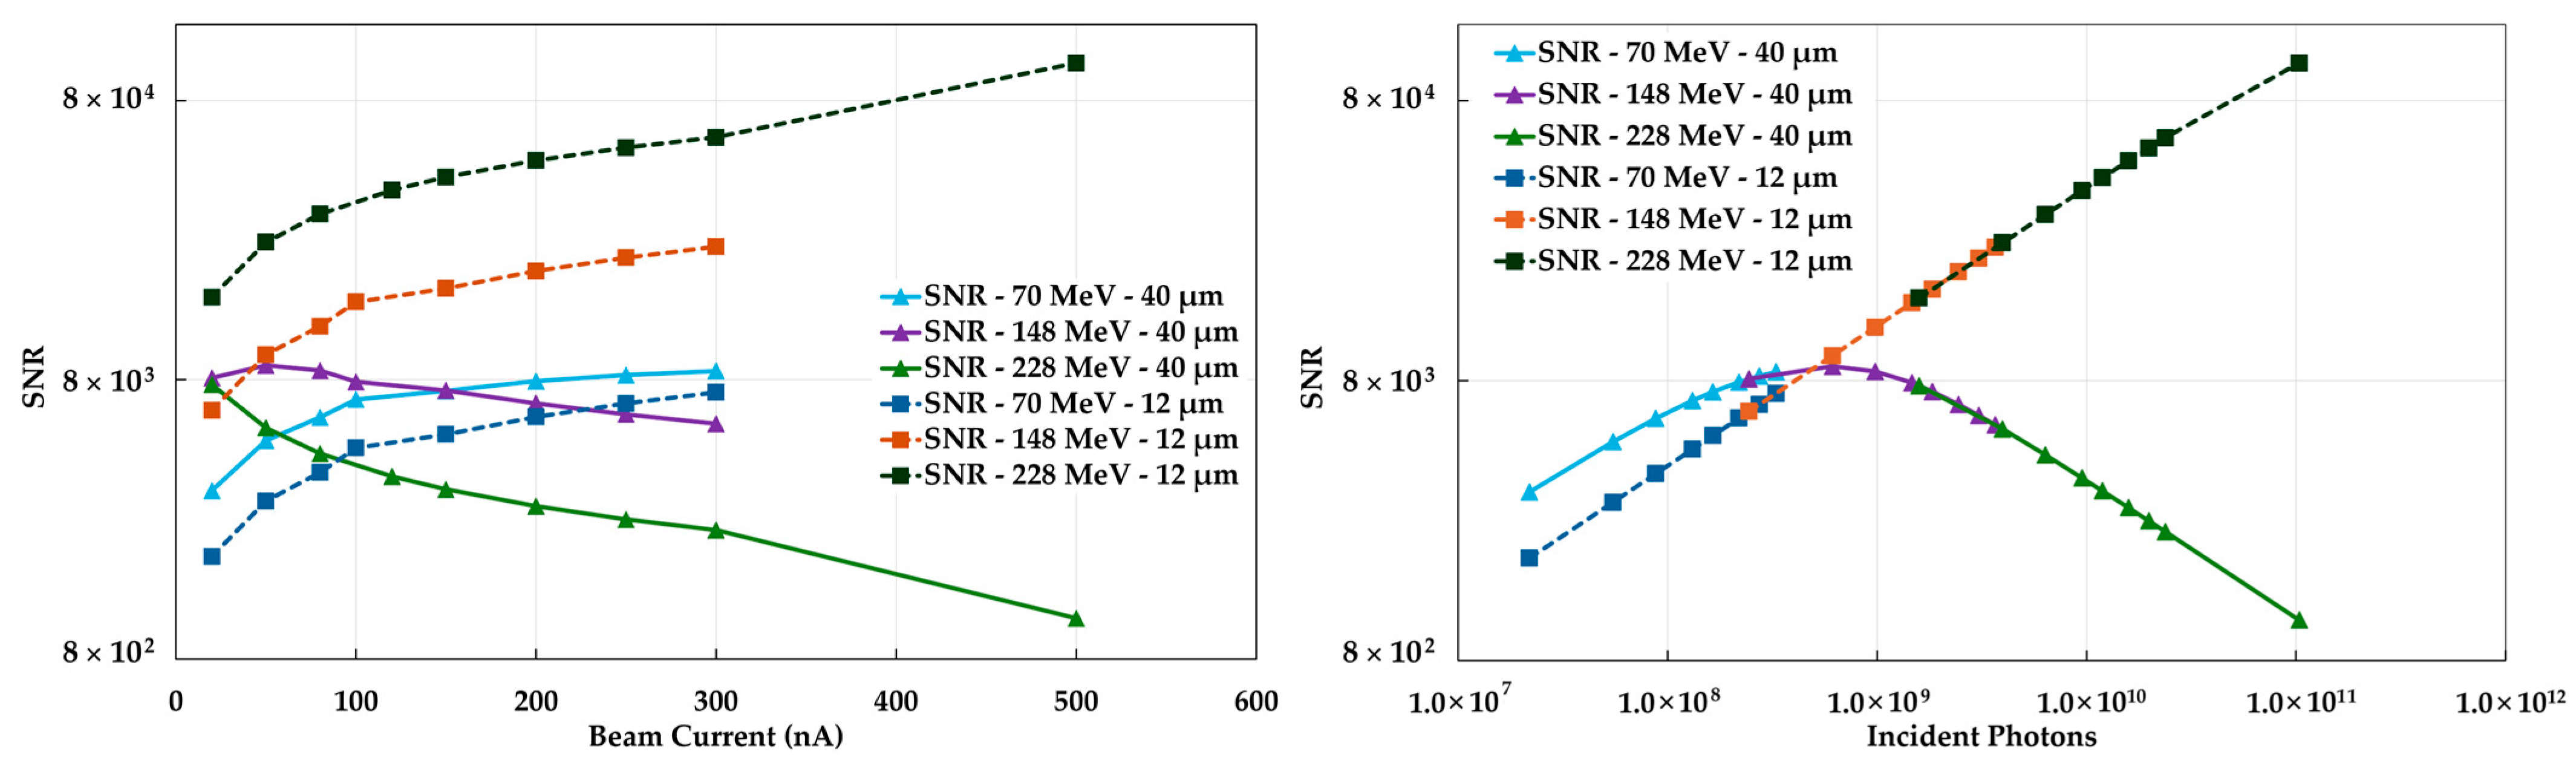
Finally, we also analyzed another important parameter, the Signal to Noise Ratio (SNR) for both readout configurations. It was calculated using the number of detected photons and the noise as the statistical fluctuation in the triggered cell, also due to the intrinsic noise (including correlated noise) within the integration time, following the formulation in [45].
A critical parameter in this model, the Excess Noise Factor (ENF), was initially measured under dark conditions, but here we also added the estimated ENF component accounting for the saturation (i.e., non-linearity of the SiPM) as proposed in [46].
At low beam intensities (e.g., at 70 MeV), the 40 µm SiPM has a higher SNR, as expected, mainly because of the higher Photon Detection Efficiency (PDE). However, as beam energy and current increase, the higher saturation of the 40 µm sensor causes its SNR to degrade significantly (mainly due to the ENF saturation contribution). In contrast, the 12 µm SiPM avoids saturation and maintains a linear response, allowing its SNR to continuously improve (Figure 9).

4. Preliminary Experimental Validations

We assembled and tested a preliminary version of the proposed beam-monitoring system with a reduced set of fibers, i.e., just 5 scintillating fibers in each of the two layers. Each fiber was coupled to a SiPM detector on both ends (distant about 1 m from the center of the fiber). We used 2 amplification boards, with 10 SiPMs each, one with the 40 μm cell-pitch SiPMs and one with the 12 μm cell-pitch SiPMs. These are coupled (air-coupled) to the 5 + 5 scintillating fibers. This system is divided into the scintillating detector head, the photon detection unit and the data acquisition (DAQ) backend.
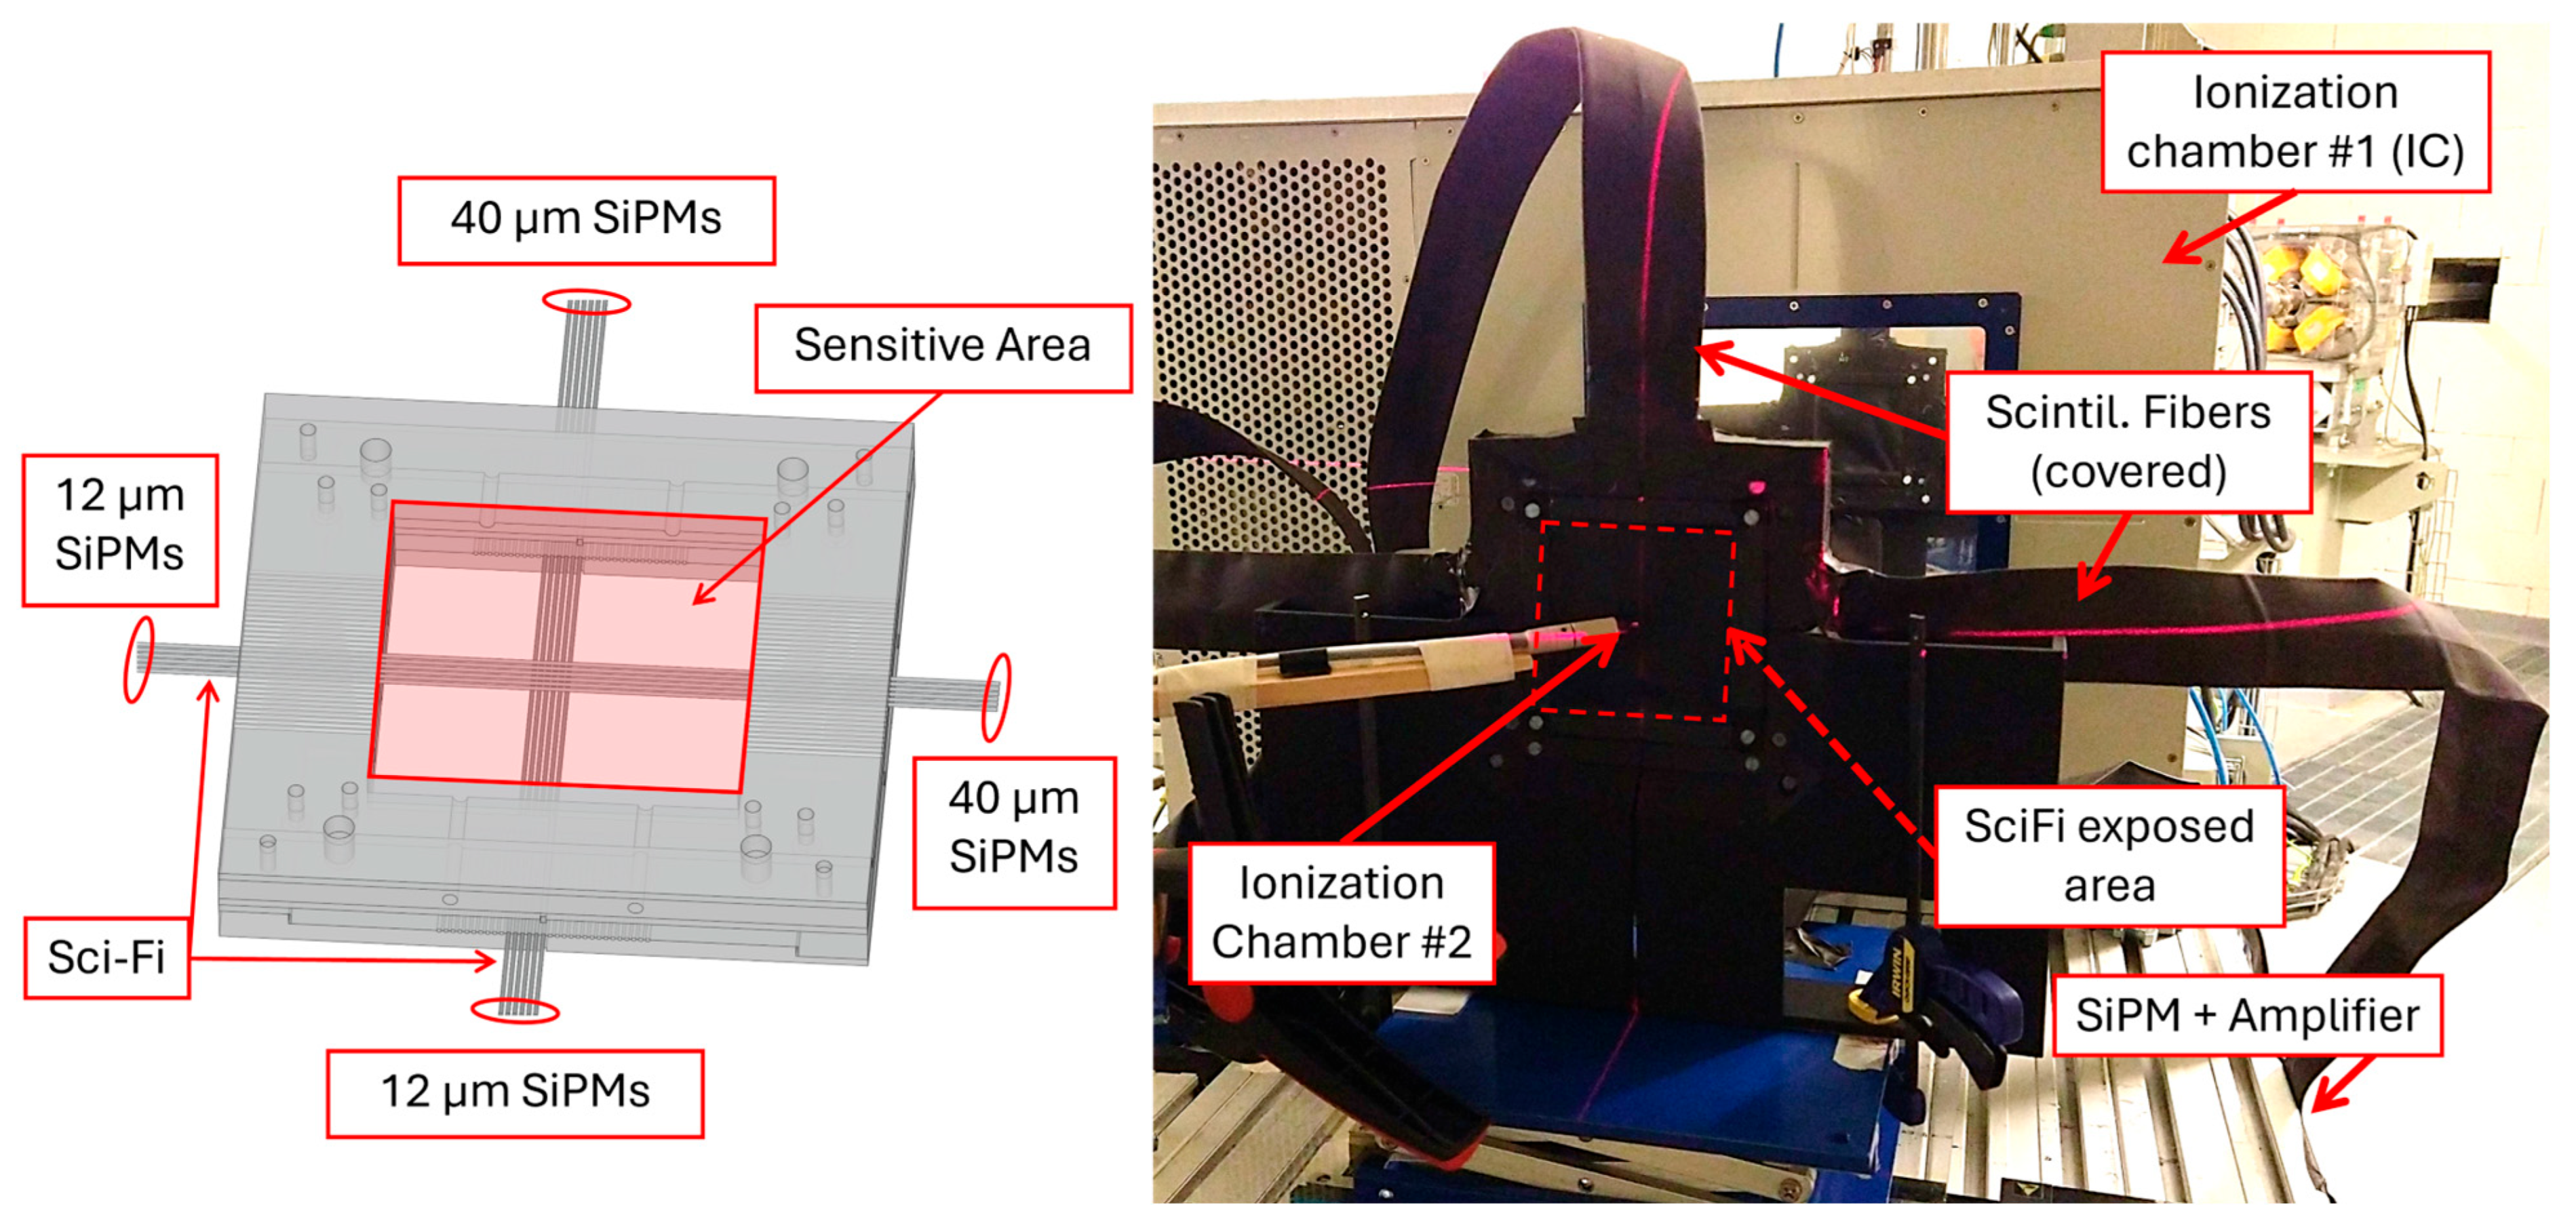
In this prototype, we used 2 m long fibers, specifically to position the SiPM readout blocks far from the beam interaction point, thereby minimizing potential direct radiation to the sensors and radiation damage effects (Figure 10). To ensure mechanical stability and reproducible positioning, the fibers are embedded in a custom-made 3D-printed holder, which was positioned such that the beam impinged on the longitudinal center of the fibers, ensuring an equal optical path length towards the SiPMs positioned at both ends.
The fibers were then mechanically aligned to the SiPMs through a 3D-printed holder. The electrical signals generated by the SiPMs are amplified by the custom multi-channel boards, including transimpedance amplifiers. The SiPM bias voltage was 34 V for the 40 μm and alternated between 35 V and 37 V for the 12 μm (corresponding to an excess bias of ~3 V for the 40 μm and between ~4 V and ~6 V for the 12 μm). These values have been selected as a compromise between good detection efficiency and reduced signal saturation (SiPM) at peak flux levels.

4.1. Linearity

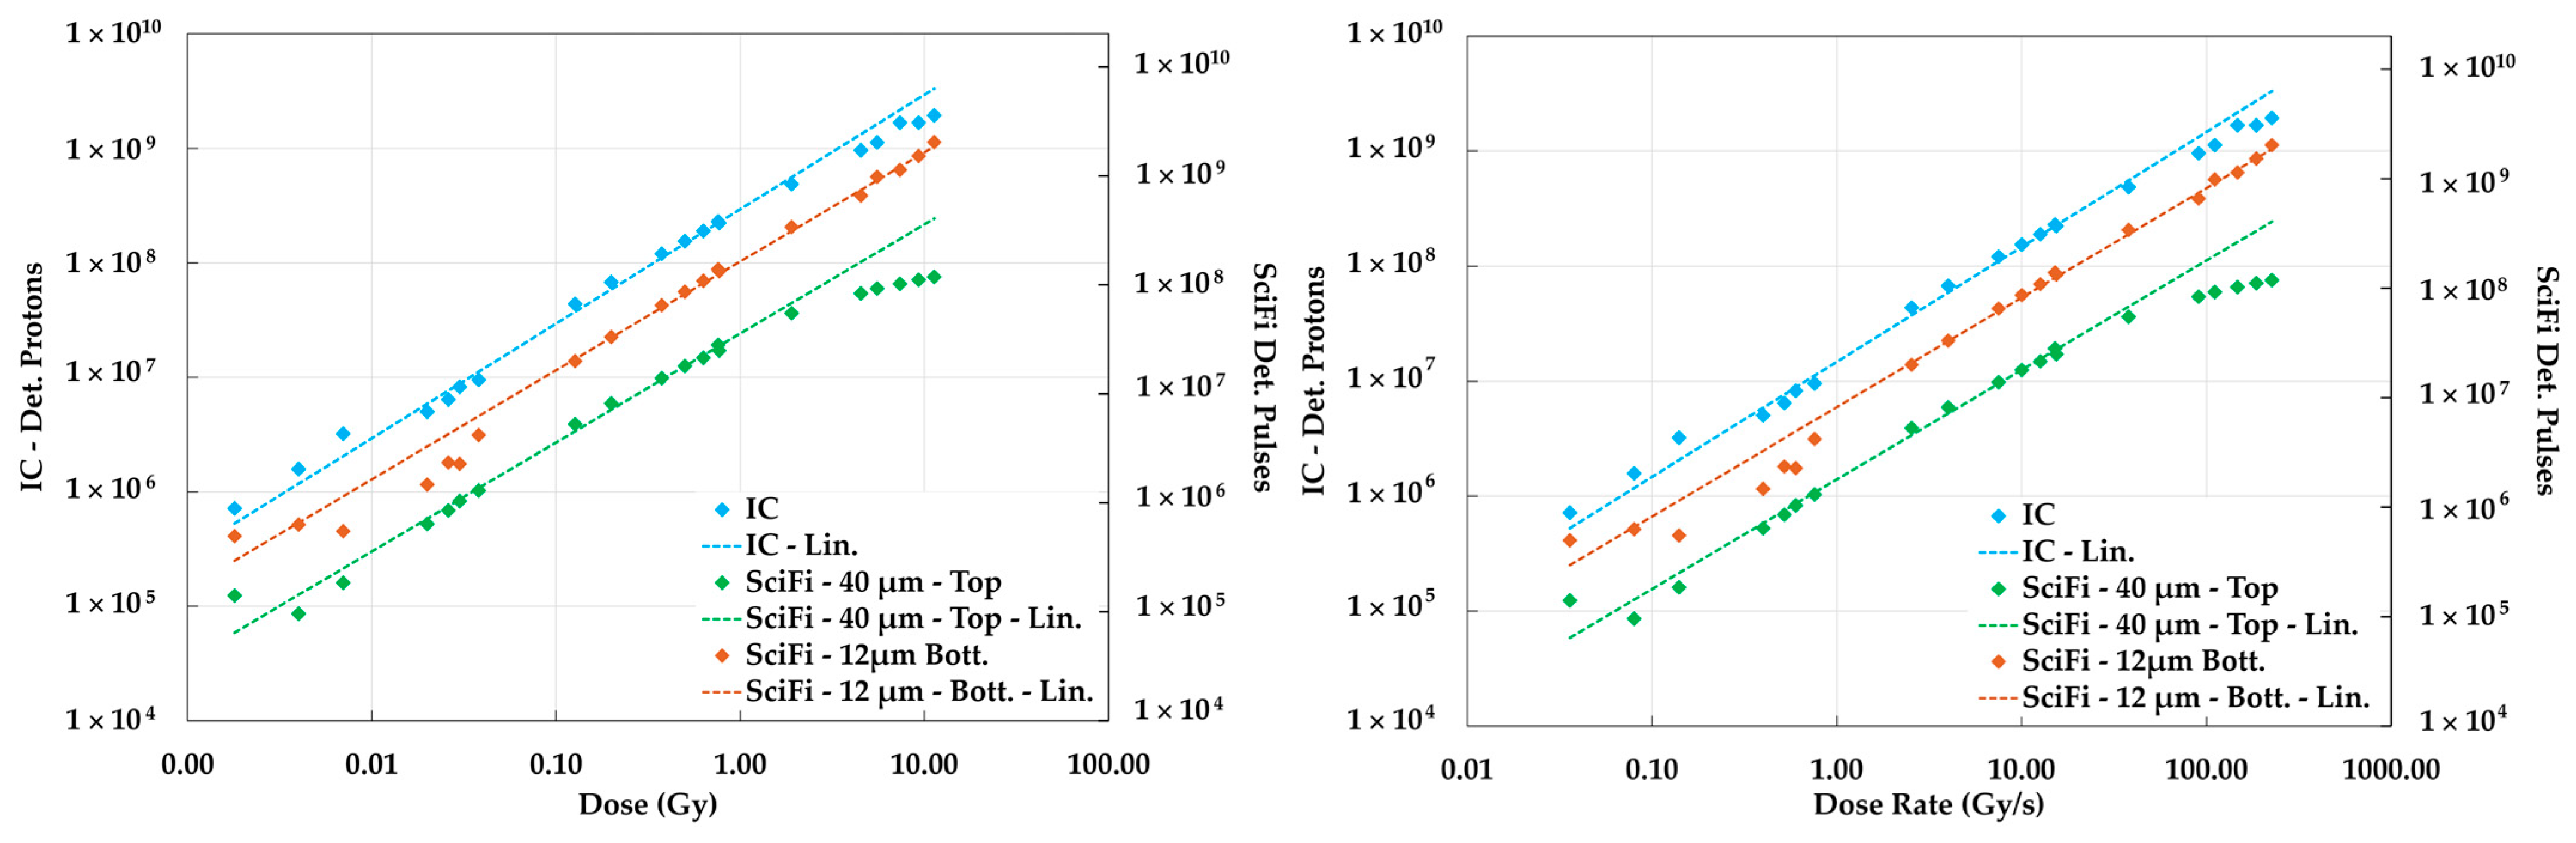
To preliminarily characterize the performance of the prototype, the linearity of the system was evaluated by measuring the total integrated charge (in the 50 ms proton pulse) as a function of the delivered dose. The beam monitoring was performed by a usual large-area IC (counting number of protons, a reference for CONV measurements), whereas the dose was monitored with a second but small-volume IC (2 mm sensitive volume diameter, placed always in the central area of the Gaussian beam, with a direct measurement of the dose), both shown in Figure 10. We performed measurements between <0.002 Gy and <12 Gy, corresponding to a dose rate between <0.04 Gy/s and >220 Gy/s.
As shown in Figure 11, the system distinguishes clearly between the two sensor architectures. The response of the 12 μm cell-pitch is generally more linear, also when compared with the IC response, following similar line trends without saturating. Note that in this figure, the number of SiPM detected pulses presented was analytically derived by dividing the integrated charge (within the proton pulse) by the elementary charge and the bias-specific SiPM “current gain” (i.e., the microcell gain times the excess charge factor, ECF). Moreover, we applied a small, simulation-based correction factor to account for the differential energy deposition in the fibers across the three energies, alongside a geometric (beam profile) correction to match the sensitive volume of the Sci-Fi to the small IC (X axis on Figure 11). Finally, energy perturbation corrections were applied to both the IC and Sci-Fi datasets.
The simulation effectively models the fundamental physical response of the detector (Figure 8—Model 1), showing a strong qualitative agreement with the experimental trends (Figure 11) across the tested energy range 70–228 MeV. The experimental results are presented as a function of Dose (Gy) and Dose rate (Gy/s) to reflect the clinical context of the measurements, while the simulation is parameterized by Beam Current (nA). For a fixed geometry and beam energy, there is a direct proportionality between the two, allowing for a consistent comparison of the detector’s response trends across both datasets. The evident discrepancies in the photon count might be due to preliminary experimental boundary conditions, including early-stage fiber-to-sensor coupling efficiency and optical crosstalk between adjacent fibers during the high-intensity irradiation pulses. Additionally, as noted earlier, the experimental data reflect alternating bias voltages of 35 V and 37 V for the 12 μm SiPM, whereas the simulations were conducted exclusively at 35 V. Specifically, the simulations successfully predict the signal’s dynamic range and the onset of non-linearity observed in the SiPMs. This consistent correlation validates the simulation as a predictive tool for optimizing the final clinical architecture and mitigating performance bottlenecks in high-dose-rate environments.
To explicitly quantify the saturation effect, the non-linearity (NL) was calculated using the relation:
N L = 1 M M E A S U R E D M I D E A L
where MIDEAL represents the theoretical linear response, which was determined via a linear regression of the low dose-rate measurements, where the sensors exhibit linear behavior. For example, at the final measurement at 11.3 Gy, the 12 µm Sci-Fi remained the most robust, showing only ~10% non-linearity compared to 71% and 41% for the 40 µm Sci-Fi and IC. This demonstrates that optimizing SiPM microcell density not only mitigates inherent detector saturation but possibly allows the fiber-optic system to effectively outperform standard IC dosimetry in highly intense radiation environments.
Note that in this preliminary prototype, we used discrete electronics and an independent output readout. In the future full-scale version, a dedicated acquisition board (e.g., digitizer or based on ASICs) can be used to have a compact standalone system and perform separate but simultaneous charge integration for each SiPM. To combine the signals and the information from the two types of SiPMs, a look-up table can be employed. This approach will possibly allow the system to dynamically select the most accurate signal, relying on one of the two SiPM types in extreme conditions or combining in intermediate regimes.

4.2. Repeatability

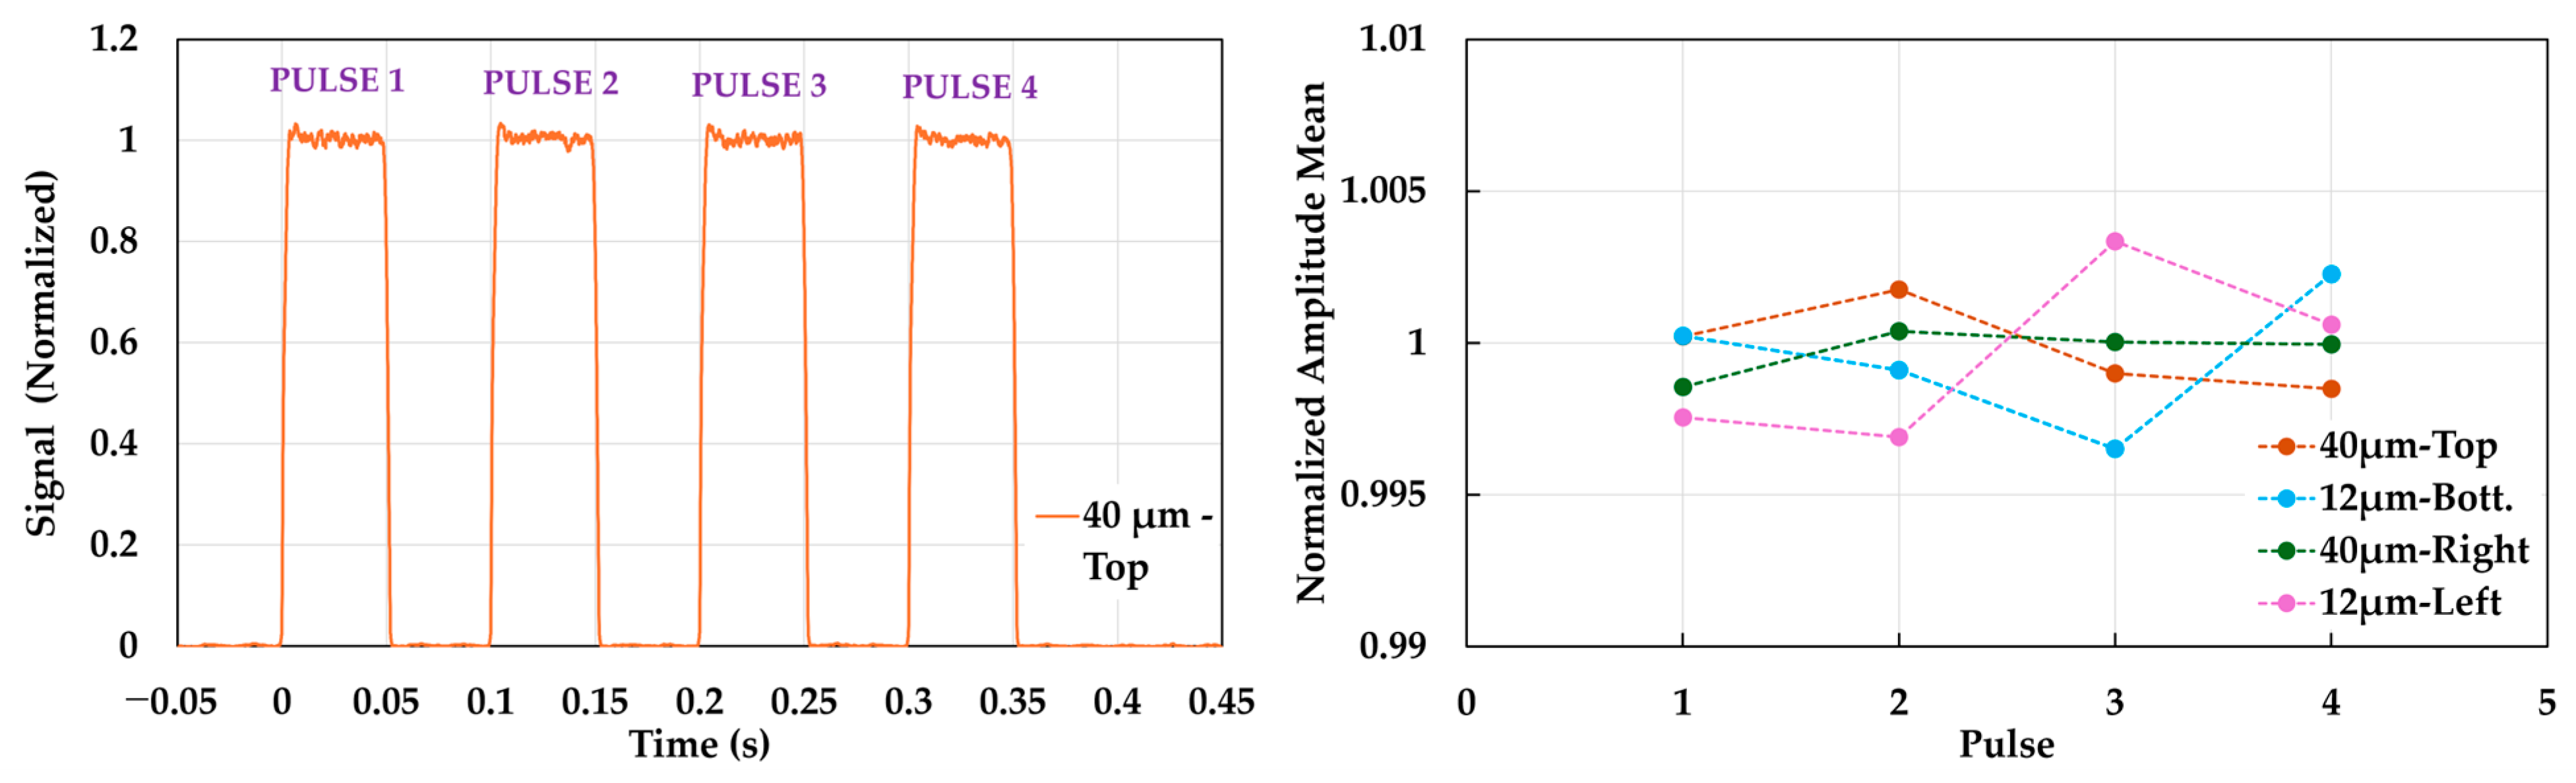
We also preliminarily evaluated the system’s stability, or equivalently, its pulse-to-pulse repeatability, by analyzing the time-resolved signal response to consecutive beams irradiation. As shown in Figure 12, the system accurately resolved four distinct pulses over a ~0.40 s. window. These data were extracted simultaneously using a single oscilloscope directly from the central scintillating fiber (out of the five on each level). The two traces represent the concurrent readout from both ends of the fiber using a 40 µm cell-pitch SiPM (top end of the fiber) and a 12 µm cell-pitch SiPM (bottom end of the fiber).
Additionally, the pulse-to-pulse stability of the system was quantified by calculating the standard deviation of the normalized mean pulse amplitudes (Figure 12), following a methodology similar to [47]. Their values were found to be <1% for all measured SiPM configurations.
Evidently, the signal amplitude and temporal profile remained highly consistent from pulse to pulse. The flat pulse profiles and complete absence of signal degradation, dead-time, or baseline drift confirm the excellent repeatability and robustness of our detector for real-time beam monitoring.

5. Conclusions

We proposed a new Scintillating-fibers SiPM-based dosimeter and beam monitor system for particle therapy. We presented the idea, design and specific simulations of the produced signals to the photodetectors. The proposed system is tailored for proton-therapy systems (but not limited to only this application), with the goal of addressing the dosimetry challenges of FLASH (ultra-high dose rate, UHDR) proton therapy. In particular, the system is based on 1 mm diameter EJ-104 scintillating fibers coupled to two different Silicon Photomultipliers (SiPMs). This can offer the advantages of being a water-equivalent solution capable of real-time monitoring without possible recombination issues like in the standard ionization chambers.
The reported simulations have been used to determine the necessary sensor architecture to maintain acceptable linearity across the large range of beam conditions, i.e., energies and beam currents used in the conventional (ranging from a few to hundreds nanoampere currents) and UHDR regimes (500 nA currents). The semi-analytical model used accounted for the ionization quenching of the scintillating fibers and pulse-structure dependent saturation, showing the effects in the readout with SiPMs with different pixel pitches. For example, while large pitch SiPMs are needed for monitoring low-current conventional beams due to their higher detection efficiency, they have high saturation levels (~98%) under extreme UHDR conditions (228 MeV at 300 nA). Conversely, the 12 μm pixel architecture showed a higher linearity, also under UHDR conditions. The combination of the two might be helpful to extend the dynamic range.
We preliminarily validated a prototype of the proposed system with a reduced number of fibers at the Trento Proton therapy center. We investigated in particular the linearity, with a beam energy between 70 and 228 MeV and currents between 20 and 300 nA. We measured the signal in all the conditions, showing the stability (with a <1% standard deviation) and usability of the system in approximately five orders of magnitude of dose and dose-rates. The prototype will be further optimized for spatial resolution and re-evaluated for linearity and repeatability.

Author Contributions

Conceptualization, G.M. and F.A. and B.D.R.; methodology, G.M. and F.A. and B.D.R.; software, G.M.; validation, G.M. and F.A.; formal analysis, G.M. and F.A.; investigation, G.M. and F.A. and B.D.R.; resources, F.A.; data curation, G.M. and F.A.; writing—original draft preparation, G.M.; writing—review and editing, F.A.; visualization, G.M. and F.A.; supervision, F.A. and B.D.R.; project administration, F.A. and B.D.R.; funding acquisition, F.A. All authors have read and agreed to the published version of the manuscript.

Funding

This research was partially funded by the European Union—Next Generation EU—PNRR—Mission 4C2—I.3.3.

Data Availability Statement

The original contributions presented in this study are included in the article. Further inquiries can be directed to the corresponding author.

Conflicts of Interest

The authors declare no conflict of interest.

References

  1. Hughes, J.R.; Parsons, J.L. FLASH Radiotherapy: Current Knowledge and Future Insights Using Proton-Beam Therapy. Int. J. Mol. Sci. 2020, 21, 6492. [Google Scholar] [CrossRef] [PubMed]
  2. Grimm, J.; Marks, L.B.; Jackson, A.; Kavanagh, B.D.; Xue, J.; Yorke, E. High Dose per Fraction, Hypofractionated Treatment Effects in the Clinic (HyTEC): An Overview. Int. J. Radiat. Oncol. 2021, 110, 1–10. [Google Scholar] [CrossRef] [PubMed]
  3. Bortfeld, T. IMRT: A Review and Preview. Phys. Med. Biol. 2006, 51, R363–R379. [Google Scholar] [CrossRef] [PubMed]
  4. Billena, C.; Khan, A.J. A Current Review of Spatial Fractionation: Back to the Future? Int. J. Radiat. Oncol. 2019, 104, 177–187. [Google Scholar] [CrossRef] [PubMed]
  5. Levin, W.P.; Kooy, H.; Loeffler, J.S.; DeLaney, T.F. Proton Beam Therapy. Br. J. Cancer 2005, 93, 849–854. [Google Scholar] [CrossRef] [PubMed]
  6. Wilson, R.R. Radiological Use of Fast Protons. Radiology 1946, 47, 487–491. [Google Scholar] [CrossRef] [PubMed]
  7. Hogstrom, K.R.; Almond, P.R. Review of Electron Beam Therapy Physics. Phys. Med. Biol. 2006, 51, R455–R489. [Google Scholar] [CrossRef] [PubMed]
  8. Schardt, D.; Elsässer, T.; Schulz-Ertner, D. Heavy-Ion Tumor Therapy: Physical and Radiobiological Benefits. Rev. Mod. Phys. 2010, 82, 383–425. [Google Scholar] [CrossRef]
  9. Ashraf, M.R.; Rahman, M.; Zhang, R.; Williams, B.B.; Gladstone, D.J.; Pogue, B.W.; Bruza, P. Dosimetry for FLASH Radiotherapy: A Review of Tools and the Role of Radioluminescence and Cherenkov Emission. Front. Phys. 2020, 8, 328. [Google Scholar] [CrossRef]
  10. Romano, F.; Bailat, C.; Jorge, P.G.; Lerch, M.L.F.; Darafsheh, A. Ultra-high Dose Rate Dosimetry: Challenges and Opportunities for FLASH Radiation Therapy. Med. Phys. 2022, 49, 4912–4932. [Google Scholar] [CrossRef] [PubMed]
  11. Taffelli, A. FLASH Proton Therapy: Planning and Delivery Challenges—Are We Close to the Clinics? Presented at the Seminari di Sezione INFN Pisa, Pisa, Italy, 3 April 2025. [Google Scholar]
  12. Vanreusel, V.; Gasparini, A.; Galante, F.; Mariani, G.; Pacitti, M.; Cociorb, M.; Giammanco, A.; Reniers, B.; Reulens, N.; Shonde, T.B.; et al. Point Scintillator Dosimetry in Ultra-High Dose Rate Electron “FLASH” Radiation Therapy: A First Characterization. Phys. Med. 2022, 103, 127–137. [Google Scholar] [CrossRef] [PubMed]
  13. Siddique, S.; Ruda, H.E.; Chow, J.C.L. FLASH Radiotherapy and the Use of Radiation Dosimeters. Cancers 2023, 15, 3883. [Google Scholar] [CrossRef] [PubMed]
  14. Kranzer, R.; Schüller, A.; Bourgouin, A.; Hackel, T.; Poppinga, D.; Lapp, M.; Looe, H.K.; Poppe, B. Response of Diamond Detectors in Ultra-High Dose-per-Pulse Electron Beams for Dosimetry at FLASH Radiotherapy. Phys. Med. Biol. 2022, 67, 075002. [Google Scholar] [CrossRef] [PubMed]
  15. Santurio, G.V.; Andersen, C.E. Quantifying the Ionization Quenching Effect in Organic Plastic Scintillators Used in MV Photon Dosimetry. Radiat. Meas. 2019, 129, 106200. [Google Scholar] [CrossRef]
  16. Beaulieu, L.; Beddar, S. Review of Plastic and Liquid Scintillation Dosimetry for Photon, Electron, and Proton Therapy. Phys. Med. Biol. 2016, 61, R305–R343. [Google Scholar] [CrossRef] [PubMed]
  17. Beddar, A.S.; Archambault, L.; Briere, T.M.; Lacroix, F.; Gingras, L.; Beaulieu, L. Recent Developments in Scintillating Fiber Detection Systems in Radiation Therapy. In Proceedings of the Medical Imaging 2008: Physics of Medical Imaging, San Diego, CA, USA, 6 March 2008; Hsieh, J., Samei, E., Eds.; SPIE: Bellingham, WA, USA, 2008; p. 69130R. [Google Scholar]
  18. Archambault, L.; Polf, J.C.; Beaulieu, L.; Beddar, S. Characterizing the Response of Miniature Scintillation Detectors When Irradiated with Proton Beams. Phys. Med. Biol. 2008, 53, 1865–1876. [Google Scholar] [CrossRef] [PubMed]
  19. Gundacker, S.; Heering, A. The Silicon Photomultiplier: Fundamentals and Applications of a Modern Solid-State Photon Detector. Phys. Med. Biol. 2020, 65, 17TR01. [Google Scholar] [CrossRef] [PubMed]
  20. Acerbi, F.; Paternoster, G.; Capasso, M.; Marcante, M.; Mazzi, A.; Regazzoni, V.; Zorzi, N.; Gola, A. Silicon Photomultipliers: Technology Optimizations for Ultraviolet, Visible and Near-Infrared Range. Instruments 2019, 3, 15. [Google Scholar] [CrossRef]
  21. Acerbi, F.; Gundacker, S. Understanding and Simulating SiPMs. Nucl. Instrum. Methods Phys. Res. Sect. Accel. Spectrometers Detect. Assoc. Equip. 2019, 926, 16–35. [Google Scholar] [CrossRef]
  22. D’Ascenzo, N.; Saveliev, V. Study of Silicon Photomultipliers for the Medical Imaging Systems. Nucl. Instrum. Methods Phys. Res. Sect. Accel. Spectrometers Detect. Assoc. Equip. 2012, 695, 265–267. [Google Scholar] [CrossRef]
  23. Fibers—Eljen Technology. Available online: https://eljentechnology.com/products/fibers (accessed on 29 December 2025).
  24. Tommasino, F.; Rovituso, M.; Fabiano, S.; Piffer, S.; Manea, C.; Lorentini, S.; Lanzone, S.; Wang, Z.; Pasini, M.; Burger, W.J.; et al. Proton Beam Characterization in the Experimental Room of the Trento Proton Therapy Facility. Nucl. Instrum. Methods Phys. Res. Sect. Accel. Spectrometers Detect. Assoc. Equip. 2017, 869, 15–20. [Google Scholar] [CrossRef]
  25. Puill, V.; Bazin, C.; Breton, D.; Burmistrov, L.; Chaumat, V.; Dinu, N.; Maalmi, J.; Vagnucci, J.F.; Stocchi, A. Single Photoelectron Timing Resolution of SiPM as a Function of the Bias Voltage, the Wavelength and the Temperature. Nucl. Instrum. Methods Phys. Res. Sect. Accel. Spectrometers Detect. Assoc. Equip. 2012, 695, 354–358. [Google Scholar] [CrossRef]
  26. Gundacker, S.; Martinez Turtos, R.; Kratochwil, N.; Pots, R.H.; Paganoni, M.; Lecoq, P.; Auffray, E. Experimental Time Resolution Limits of Modern SiPMs and TOF-PET Detectors Exploring Different Scintillators and Cherenkov Emission. Phys. Med. Biol. 2020, 65, 025001. [Google Scholar] [CrossRef] [PubMed]
  27. Vignati, A.; Giordanengo, S.; Milian, F.M.; Ganjeh, Z.A.; Donetti, M.; Fausti, F.; Ferrero, M.; Ali, O.H.; Villarreal, O.A.M.; Mazza, G.; et al. A New Detector for the Beam Energy Measurement in Proton Therapy: A Feasibility Study. Phys. Med. Biol. 2020, 65, 215030. [Google Scholar] [CrossRef] [PubMed]
  28. Ziegler, J.F.; Ziegler, M.D.; Biersack, J.P. SRIM—The Stopping and Range of Ions in Matter (2010). Nucl. Instrum. Methods Phys. Res. Sect. B Beam Interact. Mater. At. 2010, 268, 1818–1823. [Google Scholar] [CrossRef]
  29. Awe, C.; Barbeau, P.; Haghighat, A.; Hedges, S.; Johnson, T.; Li, S.; Link, J.M.; Mascolino, V.; Runge, J.; Steenis, J.; et al. Measurement of Proton Quenching in a Plastic Scintillator Detector. J. Instrum. 2021, 16, P02035. [Google Scholar] [CrossRef]
  30. Wang, L.L.W.; Perles, L.A.; Archambault, L.; Sahoo, N.; Mirkovic, D.; Beddar, S. Determination of the Quenching Correction Factors for Plastic Scintillation Detectors in Therapeutic High-Energy Proton Beams. Phys. Med. Biol. 2012, 57, 7767–7781. [Google Scholar] [CrossRef] [PubMed]
  31. Pöschl, T.; Greenwald, D.; Losekamm, M.J.; Paul, S. Measurement of Ionization Quenching in Plastic Scintillators. Nucl. Instrum. Methods Phys. Res. Sect. Accel. Spectrometers Detect. Assoc. Equip. 2021, 988, 164865. [Google Scholar] [CrossRef]
  32. Navas, S.; Amsler, C.; Gutsche, T.; Hanhart, C.; Hernández-Rey, J.J.; Lourenço, C.; Masoni, A.; Mikhasenko, M.; Mitchell, R.E.; Patrignani, C.; et al. Review of Particle Physics. Phys. Rev. D 2024, 110, 030001. [Google Scholar] [CrossRef]
  33. McManus, M.; Romano, F.; Lee, N.D.; Farabolini, W.; Gilardi, A.; Royle, G.; Palmans, H.; Subiel, A. The Challenge of Ionisation Chamber Dosimetry in Ultra-Short Pulsed High Dose-Rate Very High Energy Electron Beams. Sci. Rep. 2020, 10, 9089. [Google Scholar] [CrossRef] [PubMed]
  34. Knoll, G.F. Radiation Detection and Measurement, 4th ed.; Wiley: Hoboken, NJ, USA, 2010. [Google Scholar]
  35. Torrisi, L. Plastic Scintillator Investigations for Relative Dosimetry in Proton-Therapy. Nucl. Instrum. Methods Phys. Res. Sect. B Beam Interact. Mater. At. 2000, 170, 523–530. [Google Scholar] [CrossRef]
  36. Boivin, J.; Beddar, S.; Bonde, C.; Schmidt, D.; Culberson, W.; Guillemette, M.; Beaulieu, L. A Systematic Characterization of the Low-Energy Photon Response of Plastic Scintillation Detectors. Phys. Med. Biol. 2016, 61, 5569–5586. [Google Scholar] [CrossRef] [PubMed]
  37. Christensen, J.B.; Andersen, C.E. Relating Ionization Quenching in Organic Plastic Scintillators to Basic Material Properties by Modelling Excitation Density Transport and Amorphous Track Structure during Proton Irradiation. Phys. Med. Biol. 2018, 63, 195010. [Google Scholar] [CrossRef] [PubMed]
  38. Arkin, W.T. (Ed.) Focus on Lasers and Electro-Optics Research; Nova Science Publishers: New York, NY, USA, 2004. [Google Scholar]
  39. Luxium Solutions. Plastic Scintillating and Wavelength-Shifting Fibers; Luxium Solutions: Hiram, OH, USA, 2026. [Google Scholar]
  40. Lu, Y.; Zhao, Z.; Fan, X.; Cao, X.; Hai, M.; Yang, Z.; Zheng, K.; Lu, J.; Zhang, J.; Ma, Y.; et al. Zirconia/Phenylsiloxane Nano-Composite for LED Encapsulation with High and Stable Light Extraction Efficiency. RSC Adv. 2021, 11, 18326–18332. [Google Scholar] [CrossRef] [PubMed]
  41. Zappalà, G.; Acerbi, F.; Ferri, A.; Gola, A.; Paternoster, G.; Zorzi, N.; Piemonte, C. Set-up and Methods for SiPM Photo-Detection Efficiency Measurements. J. Instrum. 2016, 11, P08014. [Google Scholar] [CrossRef]
  42. Piemonte, C.; Ferri, A.; Gola, A.; Picciotto, A.; Pro, T.; Serra, N.; Tarolli, A.; Zorzi, N. Development of an Automatic Procedure for the Characterization of Silicon Photomultipliers. In Proceedings of the 2012 IEEE Nuclear Science Symposium and Medical Imaging Conference Record (NSS/MIC), Anaheim, CA, USA, 29 October–3 November 2012; IEEE: Anaheim, CA, USA, 2012; pp. 428–432. [Google Scholar]
  43. Grodzicka, M.; Szczęśniak, T.; Moszyński, M.; Szawłowski, M.; Grodzicki, K. New Method for Evaluating Effective Recovery Time and Single Photoelectron Response in Silicon Photomultipliers. Nucl. Instrum. Methods Phys. Res. Sect. Accel. Spectrometers Detect. Assoc. Equip. 2015, 783, 58–64. [Google Scholar] [CrossRef]
  44. Vinogradov, S.; Arodzero, A.; Lanza, R.C.; Welsch, C.P. SiPM Response to Long and Intense Light Pulses. Nucl. Instrum. Methods Phys. Res. Sect. Accel. Spectrometers Detect. Assoc. Equip. 2015, 787, 148–152. [Google Scholar] [CrossRef]
  45. Altamura, A.R.; Acerbi, F.; Di Ruzza, B.; Verroi, E.; Merzi, S.; Mazzi, A.; Gola, A. Radiation Damage on SiPMs for Space Applications. Nucl. Instrum. Methods Phys. Res. Sect. Accel. Spectrometers Detect. Assoc. Equip. 2023, 1045, 167488. [Google Scholar] [CrossRef]
  46. Vinogradov, S. Performance of Silicon Photomultipliers in Photon Number and Time Resolution. Proc. Sci. 2015, 6, 002. [Google Scholar]
  47. Ciarrocchi, E.; Ravera, E.; Cavalieri, A.; Celentano, M.; Del Sarto, D.; Di Martino, F.; Linsalata, S.; Massa, M.; Masturzo, L.; Moggi, A.; et al. Plastic Scintillator-Based Dosimeters for Ultra-High Dose Rate (UHDR) Electron Radiotherapy. Phys. Med. 2024, 121, 103360. [Google Scholar] [CrossRef] [PubMed]
Figure 1. Bragg curve as a function of depth (left—Adapted from [1]). Schematic illustration comparing the spatial targeting of PT versus conventional Radiotherapy (right).
Instruments 10 00036 g001
Figure 2. Schematic representation of the positioning of the Sci-Fi and SiPM Detector(s) during PT (left), and idea of the Sci-Fi detector with SiPM readout on the sides, with respect to the beam spot dimensions (right).
Instruments 10 00036 g002
Figure 3. Simulated energy perturbation caused by the dosimeter for the three considered beam energies (70, 148, and 228 MeV). Specifically: the overall energy loss versus distance (left), with the inset providing a magnified view of the entrance region at 70 MeV, and specific energy absorption peaks within the dosimeter structure (cladding and cores) over the first 3 mm at 148 MeV (right-top) and 228 MeV (right-bottom).
Instruments 10 00036 g003
Figure 4. Schematic representation of the voxelated fiber geometry used for flux calculations. The interaction volume is discretized into transverse slices along the X-axis to account for varying scintillator thickness, and longitudinal segments to capture the beam’s spatial gradient and Gaussian intensity drop-off.
Instruments 10 00036 g004
Figure 5. Comparison of beam monitoring system saturation under UHDR (FLASH) conditions. In particular, IC recombination saturation at ~5 Gy/pulse (data from [33]) against the calculated saturation of the proposed Sci-Fi detector (evaluated for a single fiber with 12 µm SiPM or with the dual readout), in similar conditions, considering a range between 20% and 40% for the fiber-to-SiPM coupling efficiency (C.E.). The SiPMs’ bias voltages are 34 V and 35 V for the 40 μm and 12 μm, respectively.
Instruments 10 00036 g005
Figure 6. PDE vs wavelength at different excess bias for the 40 μm pitch SiPM (a) and for the 12 μm one (b). Measured primary DCR (c) and microcell gain (d) of 40 μm pitch and 12 μm pitch SiPMs.
Instruments 10 00036 g006
Figure 7. Number of photons detected in simulations during a 50ms proton pulse for various beam currents (no SiPM saturation considered), as reported also in Table 4 (a). Estimated saturation with 40μm-pitch SiPM (b) and with 12 μm-pitch SiPM (c) (note the different vertical scales), for different values of coupling efficiencies to the SiPM.
Instruments 10 00036 g007
Figure 8. Cross-comparison of SiPM response models as a function of beam current. The resulting number of fired cells is compared between the primary (Model 1—as in [43]) and the second (Model 2—as in [44]) model. Results are shown for both the 40 µm (left) and 12 µm (right) SiPM configurations (note the different vertical scales).
Instruments 10 00036 g008
Figure 9. Calculated Signal-to-Noise Ratio (SNR) for the 40 µm and 12 µm SiPM configurations as a function of beam current at proton energies of 70 MeV, 148 MeV, and 228 MeV (left) and plotted against the total number of incident (to the SiPMs) photons (right). The 40 µm sensor demonstrates superior SNR at lower photon fluxes due to its higher PDE, but saturation causes its SNR to degrade at higher intensities. The 12 µm SiPM crosses over and outperforms the 40 µm variant at higher beam currents and energies.
Instruments 10 00036 g009
Figure 10. CAD schematic of the two-layer fiber holder (left) and picture of the experimental setup in the experimental room (right) used for the preliminary version of the system.
Instruments 10 00036 g010
Figure 11. Comparison between the Sci-Fi system’s and IC’s responses as a function of the deposited dose (left) and dose rate (right) as measured by the facility’s diamond detector, showing strong linearity for the 12 μm pitch SiPM across 5 OoM. The IC data were LET-normalized. Note that the right vertical axes are intentionally offset to prevent data points from overlapping.
Instruments 10 00036 g011
Figure 12. Time-resolved signal response of the central scintillating fiber during four consecutive 50 ms beam pulses for the 40 μm pitch (top) SiPM (left). Stability evaluation of the normalized mean pulse amplitudes of the SiPMs (right). This plot additionally evaluates the stability of the 40 μm-right and 12 μm-left SiPMs, which are attached to the central fiber of the second Sci-Fi layer, as shown in Figure 2 and Figure 10. Beam Parameters: 228 MeV, 50 nA, 38 Gy/s.
Instruments 10 00036 g012
Table 1. Simulation of the maximum energy perturbation induced by the dosimeter (two fibers—one per layer) for a single incident proton. The values represent the upper limit of energy loss, calculated assuming the proton’s trajectory intersects the full diameter of the fibers in both layers.
Proton
Energy (MeV)
Tot. Energy Lost in
the Detector (MeV)
Energy Lost Compared to Initial Proton Energy (%)Energy Lost in the
2 Fiber Cores (MeV)
701.962.79%1.76
1481.110.75%1.00
2280.830.56%0.75
Table 2. Key Parameters used for the simulation.
ParameterValuesUnitsSource
Birk’s Constant0.207 m m M e V [35]
Fiber’s Attenuation Length2m[23]
Trapping Efficiency—Single End (%)4.62-Estimated
Coupling efficiency (Sci-Fi to SiPM)30%-Estimated
Sci-Fi Light Yield10,400 p h o t o n s M e V [23]
Sci-Fi Decay time1.8ns[23]
Sci-Fi Peak Emission Wavelength408nm[23]
SiPM Peak PDE 40 μm (34 V) ~ 53.6 % -Measured
SiPM Peak PDE 12 μm (35 V) 20.0 % -Measured
Table 3. Beam Spot characteristics in the X-Y plane (perpendicular to the beam direction). The data for this table were taken from [24].
Nominal Energy (MeV) σ X
m m
σ Y
m m
Asymmetry
(%)
Flux
p r o t o n s s
70 6.93 6.91 0.1 3.8 × 10 6
148 4.39 4.52 1.4 4.36 × 10 7
(estimated)
228 2.74 2.72 0.2 2.3 × 10 8
228 (FLASH) 9.34 10.19 4.35 (estimated) 2.07 × 10 12
Table 4. Number of photons detected during a 50 ms proton pulse according to Equation (2)—no SiPM saturation considered. The Bias Voltages (34 V and 35 V for the 40 μm and 12 μm SiPM pitch, respectively) are representative of typical operative conditions.
Beam Energy
(MeV)
70148228
SiPM Pitch (μm)-401240124012
Beam
Current (nA)
201.15 × 1073.53 × 1061.28 × 1083.94 × 1078.33 × 1082.55 × 108
502.88 × 1078.82 × 1063.21 × 1089.85 × 1072.08 × 1096.38 × 108
804.60 × 1071.41 × 1075.14 × 1081.58 × 1083.33 × 1091.02 × 109
1006.90 × 1072.12 × 1077.71 × 1082.36 × 108- -
120----5.00 × 1091.53 × 109
1508.63 × 1072.65 × 1079.63 × 1082.95 × 1086.24 × 1091.91 × 109
2001.15 × 1083.53 × 1071.28 × 1093.94 × 1088.33 × 1092.55 × 109
2501.44 × 1084.41 × 1071.61 × 1094.92 × 1081.04 × 10103.19 × 109
3001.73 × 1085.29 × 1071.93 × 1095.91 × 1081.25 × 10103.83 × 109
500 (FLASH)- ---5.44 × 10101.67 × 1010
Table 5. Estimated saturation (percentage) of the SiPMs for different beam conditions at a 50 ms pulse width. The SiPM bias voltages correspond to those listed in Table 4.
Beam Energy (MeV)-70148228
SiPM Pitch (μm)-401240124012
Beam
Current (nA)
202.2%0.0%21.4%0.0%70.5%0.2%
505.4%0.0%43.1%0.1%87.7%0.4%
808.5%0.0%56.9%0.1%92.3%0.7%
10012.4%0.0%68.5%0.2%--
120----94.9%1.1%
15015.1%0.0%74.1%0.2%95.9%1.3%
20019.5%0.0%80.2%0.3%96.9%1.8%
25023.5%0.0%84.1%0.3%97.5%2.2%
30027.3%0.0%86.7%0.4%98.0%2.6%
500 (FLASH)----99.5%10.8%
Disclaimer/Publisher’s Note: The statements, opinions and data contained in all publications are solely those of the individual author(s) and contributor(s) and not of MDPI and/or the editor(s). MDPI and/or the editor(s) disclaim responsibility for any injury to people or property resulting from any ideas, methods, instructions or products referred to in the content.