3.1. Cosmic-Rays Commissioning
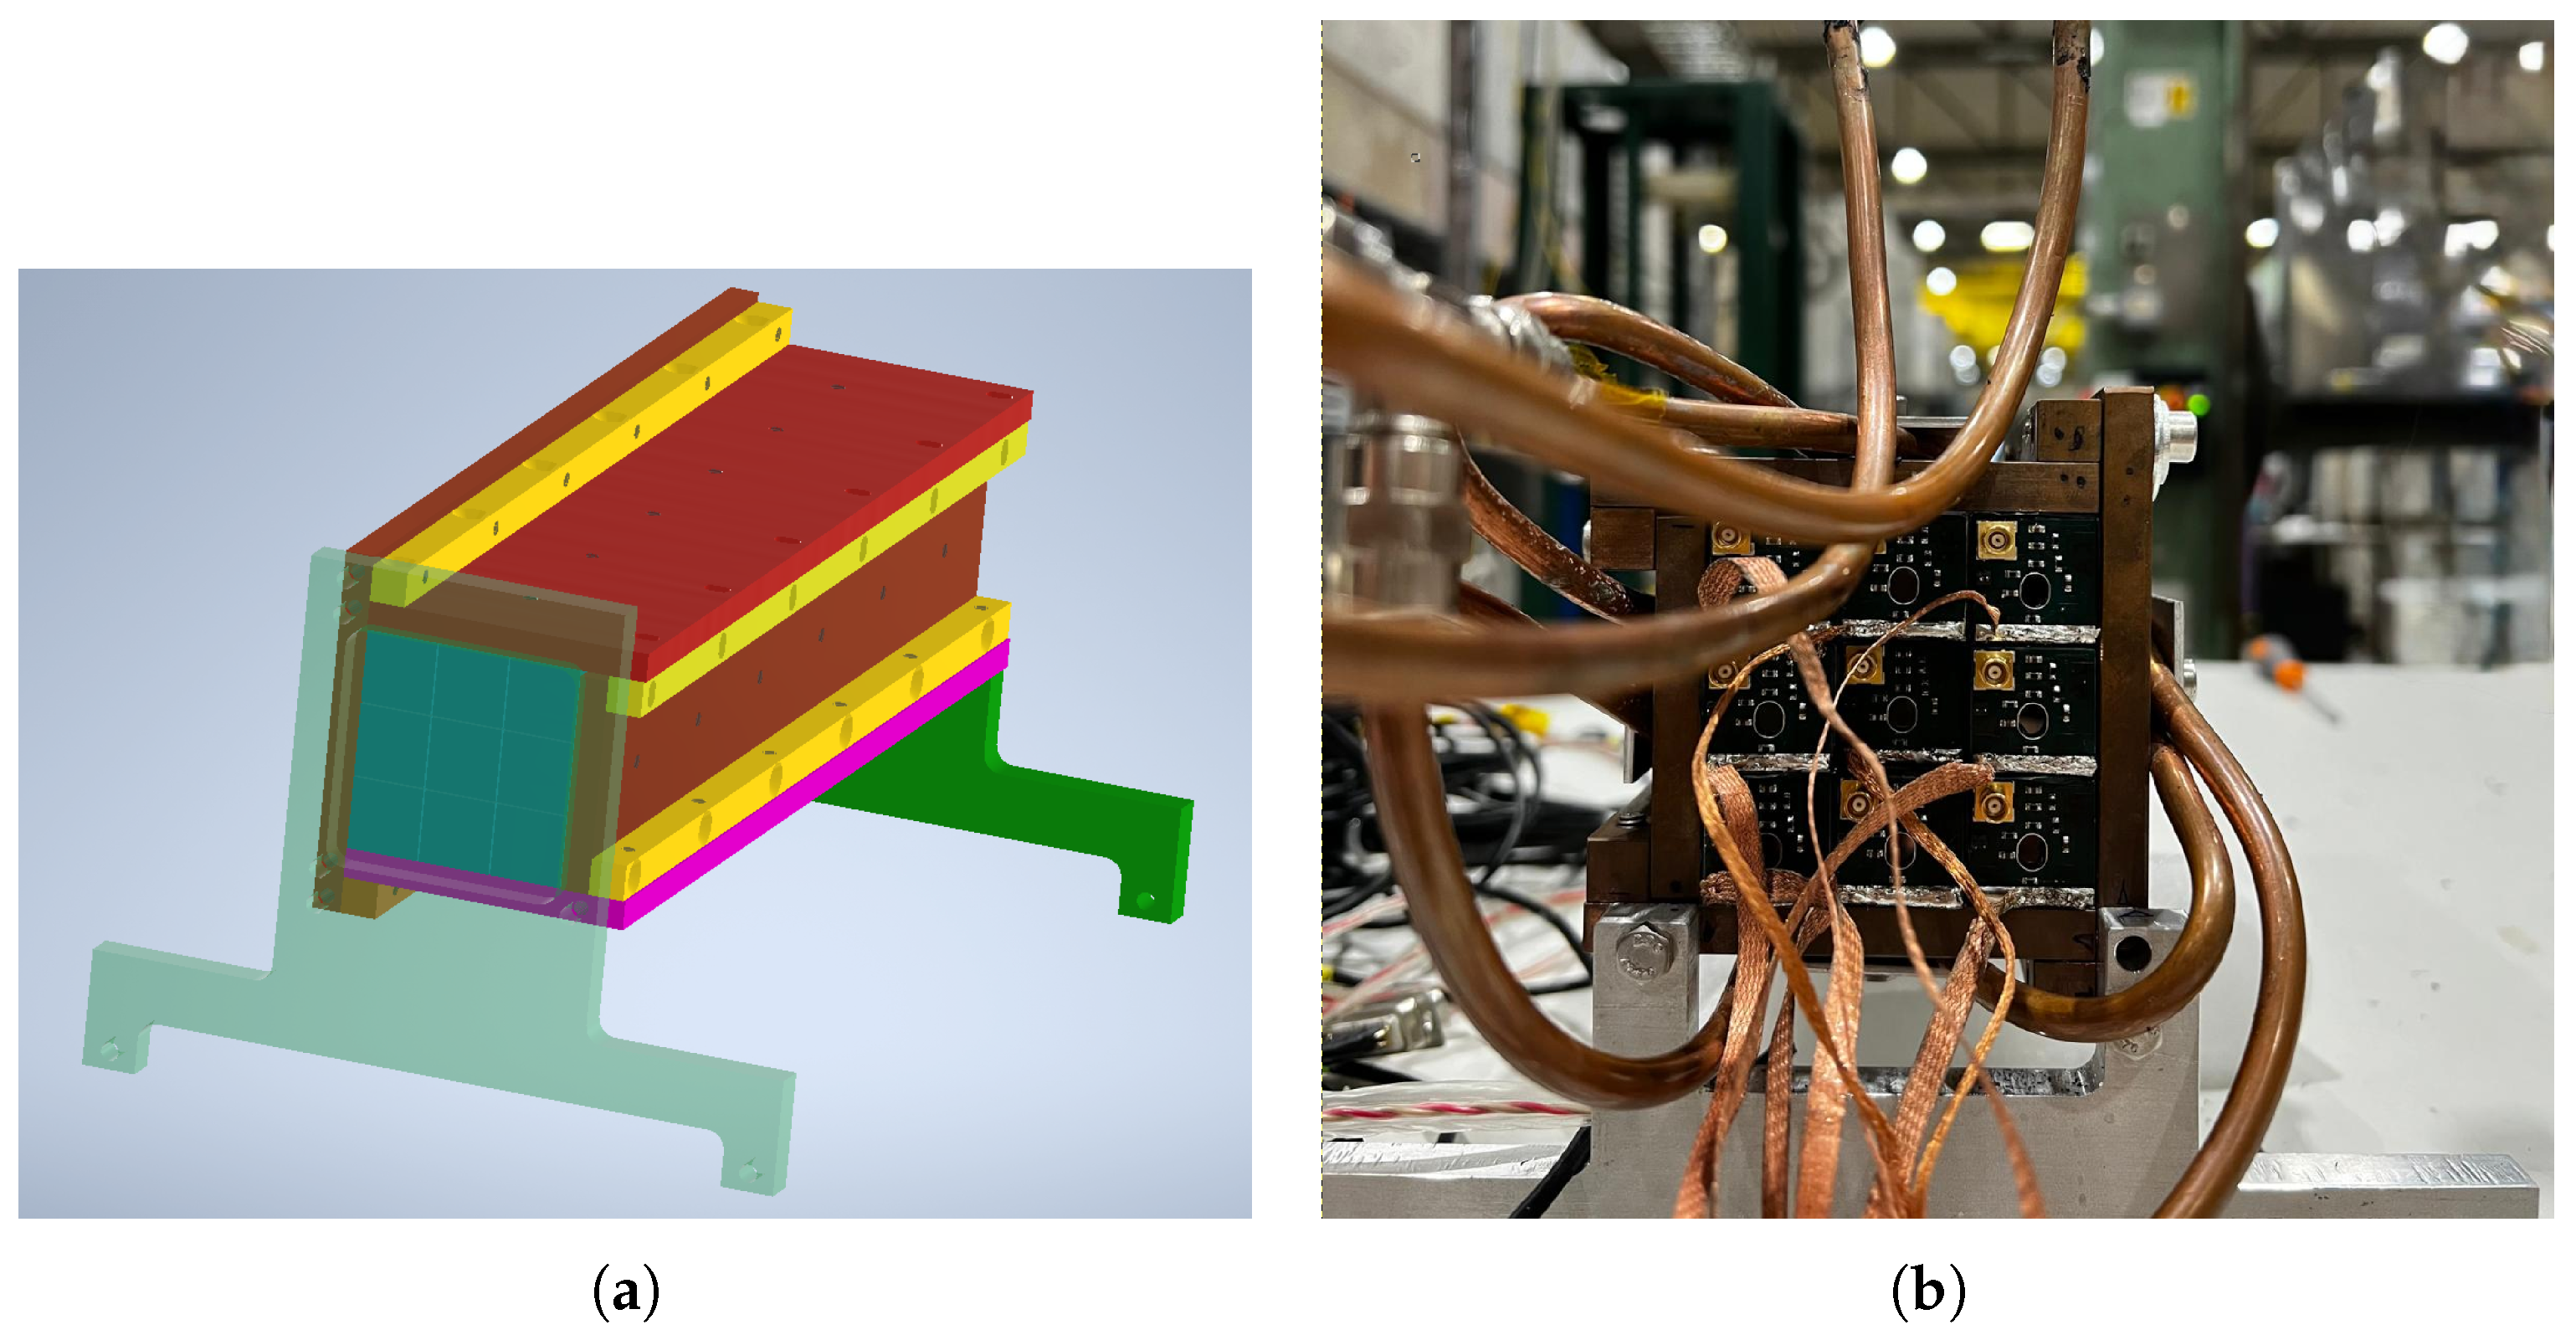
During the commissioning phase, the POKERINO detector was installed within the EEE-based cosmic ray telescope, on top of the uppermost chamber. The PbWO4 crystals were aligned with their long axis along the EEE Y axis, with the PKR-CAL-SiPM sensor close to the low-Y edge. Different data-taking runs were collected, operating the detector with different bias voltages, to study each channel’s response. On average, each run lasted for a few days. During all tests, the chiller water temperature was set to 20 °C.
Recorded data were processed offline to select a clean set of events with a vertical cosmic-ray muon passing through the POKERINO active volume. The selection criteria required, for each EEE event, the presence of a single down-going cosmic-ray track, with a vertical direction cosine larger than 0.95, in time coincidence with a single event recorded by the POKERINO DAQ system.
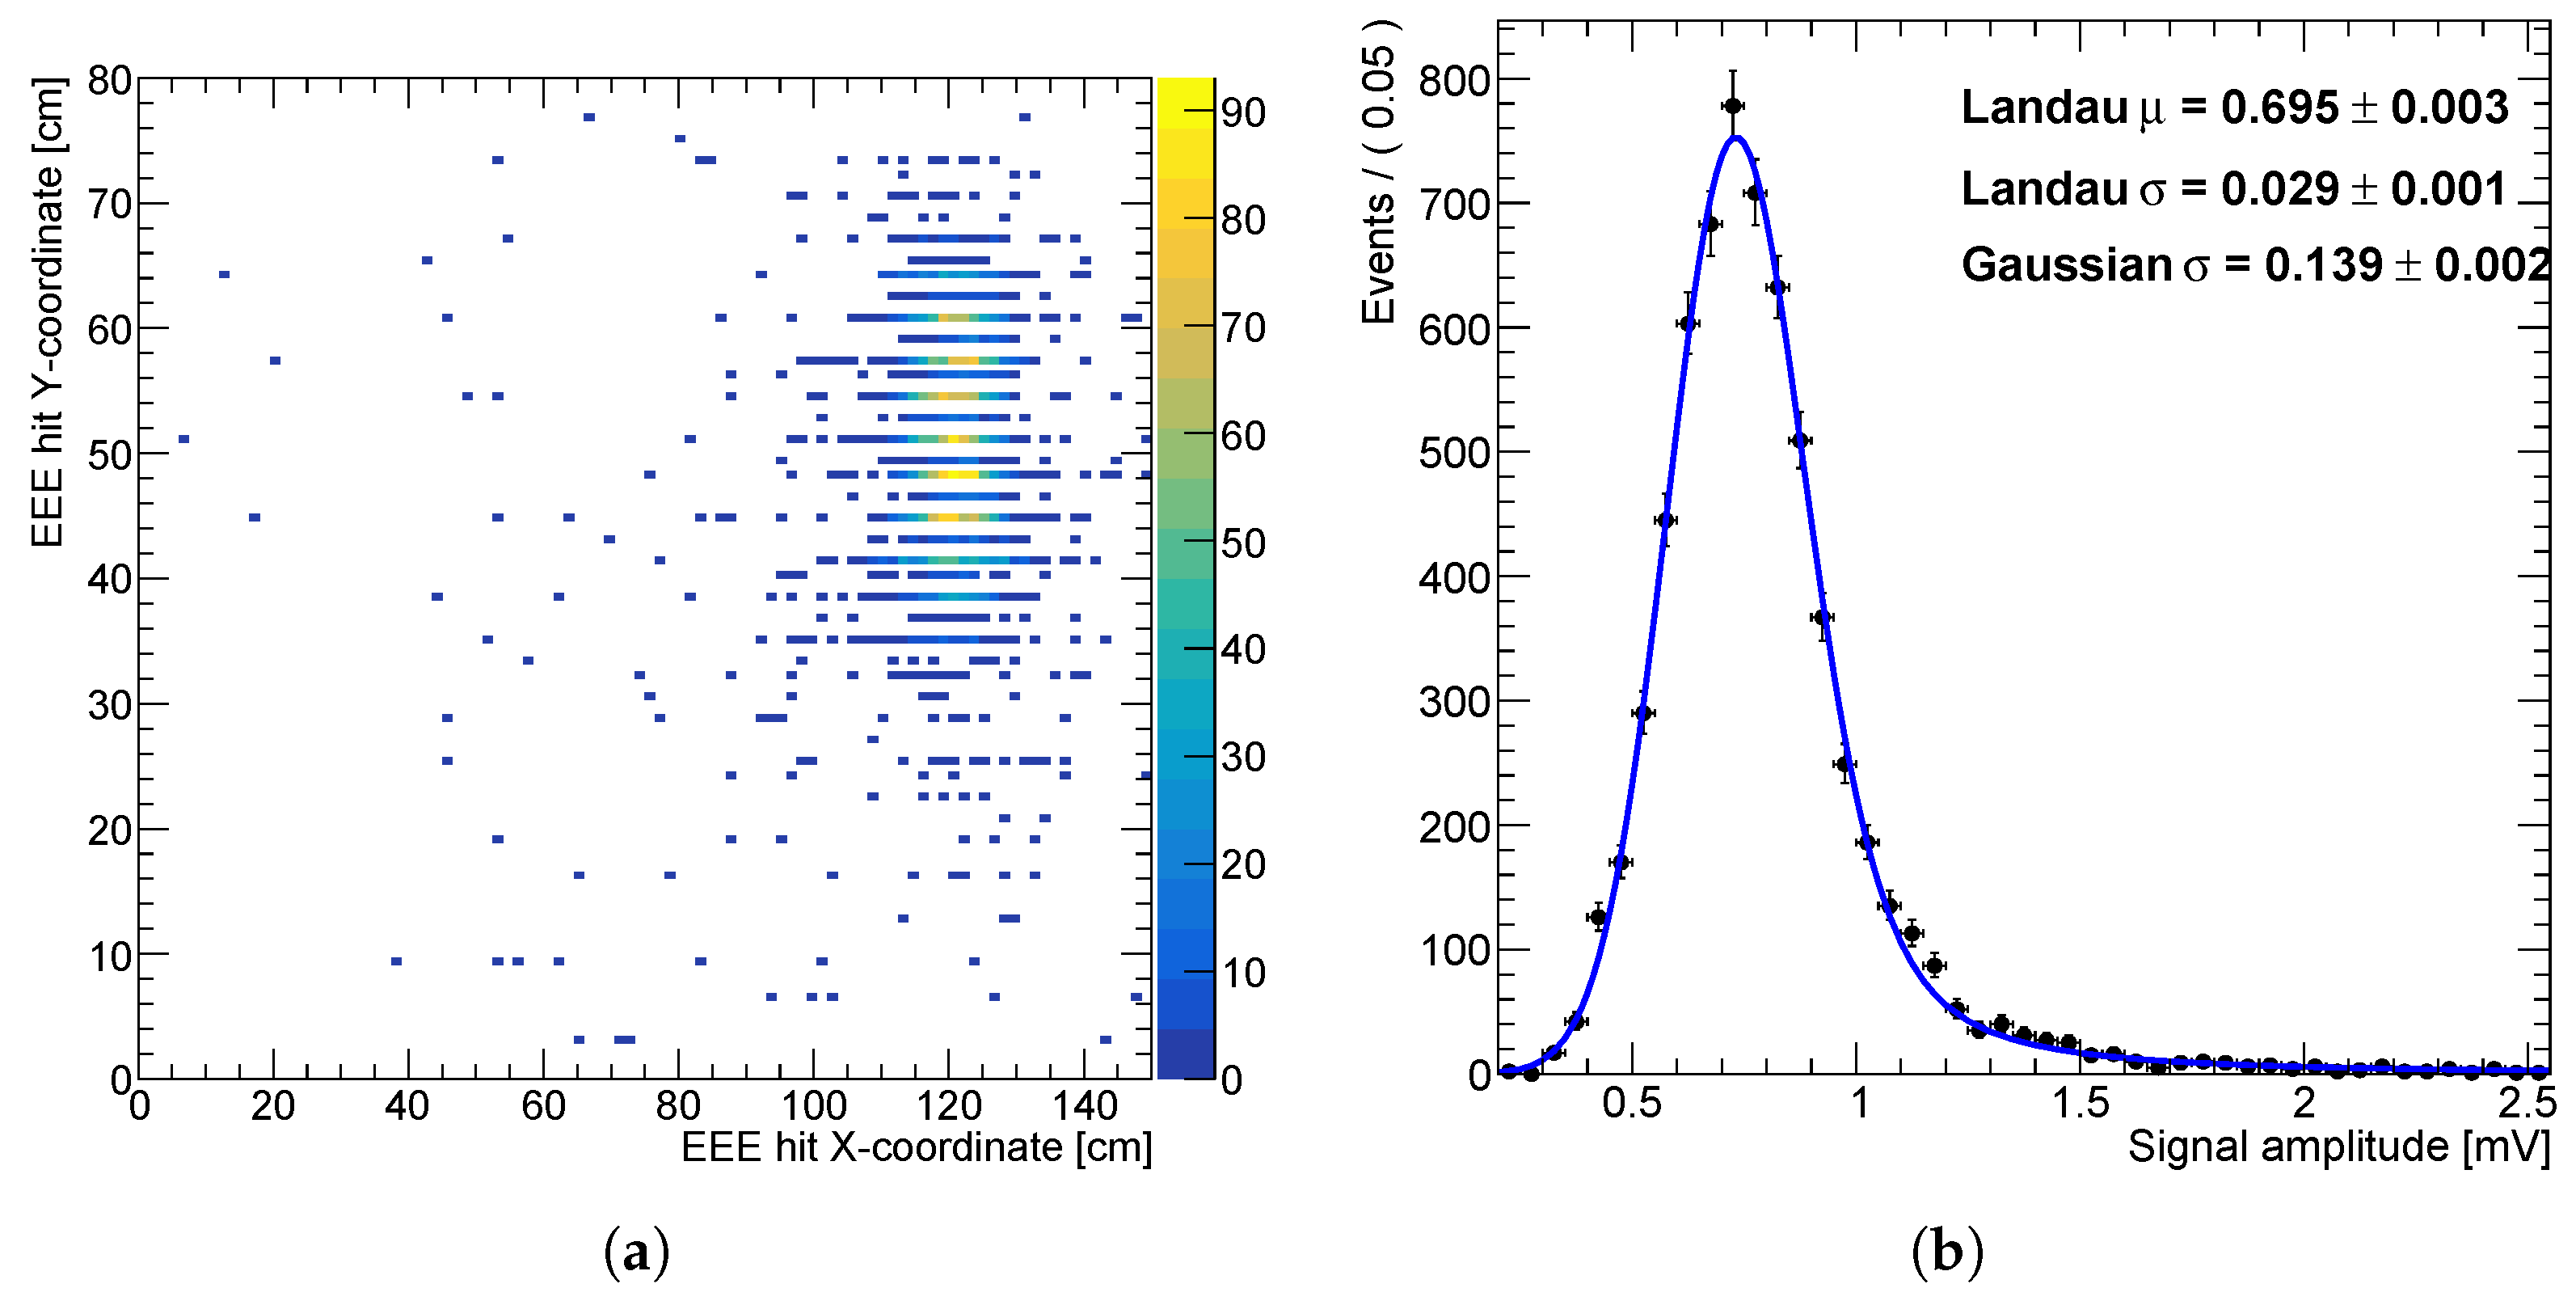
Figure 7, left panel, shows the EEE top chamber XY hit position for events with at least one signal from POKERINO crystals—the shape of the latter is visible. Finally, for each crystal in a given column, events with the reconstructed EEE top chamber XY hit position matched to the column position were selected, and the corresponding amplitude distribution was calculated. All distributions showed a clear peak from MIP-like energy deposition from cosmic rays—for illustration,
Figure 7, right panel, reports results obtained for the center-most crystal for bias voltage
V. To extract the peak position, a maximum likelihood unbinned fit was performed with a Landau function convoluted with a Gaussian resolution model. The most probable value of the Landau distribution was found to be approximately 0.65 mV for all channels, with an overall variation of about 10%. Monte Carlo simulations predicted a most probable energy deposition value for cosmic rays of about 20 MeV, resulting in an overall response of about 32.5 mV/GeV for this bias voltage value. This result, combined with other ancillary measurements not discussed in this document, returned an estimated light yield of about 5 phe/MeV. With these tests, we confirmed the proper operation of all prototype channels, obtaining a preliminary energy calibration value.
3.3. Linearity Study and Energy Correction
To study the effect of the finite number of active cells in PKR-CAL-SiPM photosensors and derive an appropriate correction to saturation effects, we measured the linearity of the detector by collecting various acquisition runs at different electron-beam energies, ranging from 10 GeV to 100 GeV at 10 GeV steps, and comparing the results with the predictions from Monte Carlo. In these runs, the beam impinged on the center of the POKERINO central cell. The observed purity of the electron beam, estimated from the measured spectrum from the relative yield of full-energy deposition events, was more than 90% for all momentum values.
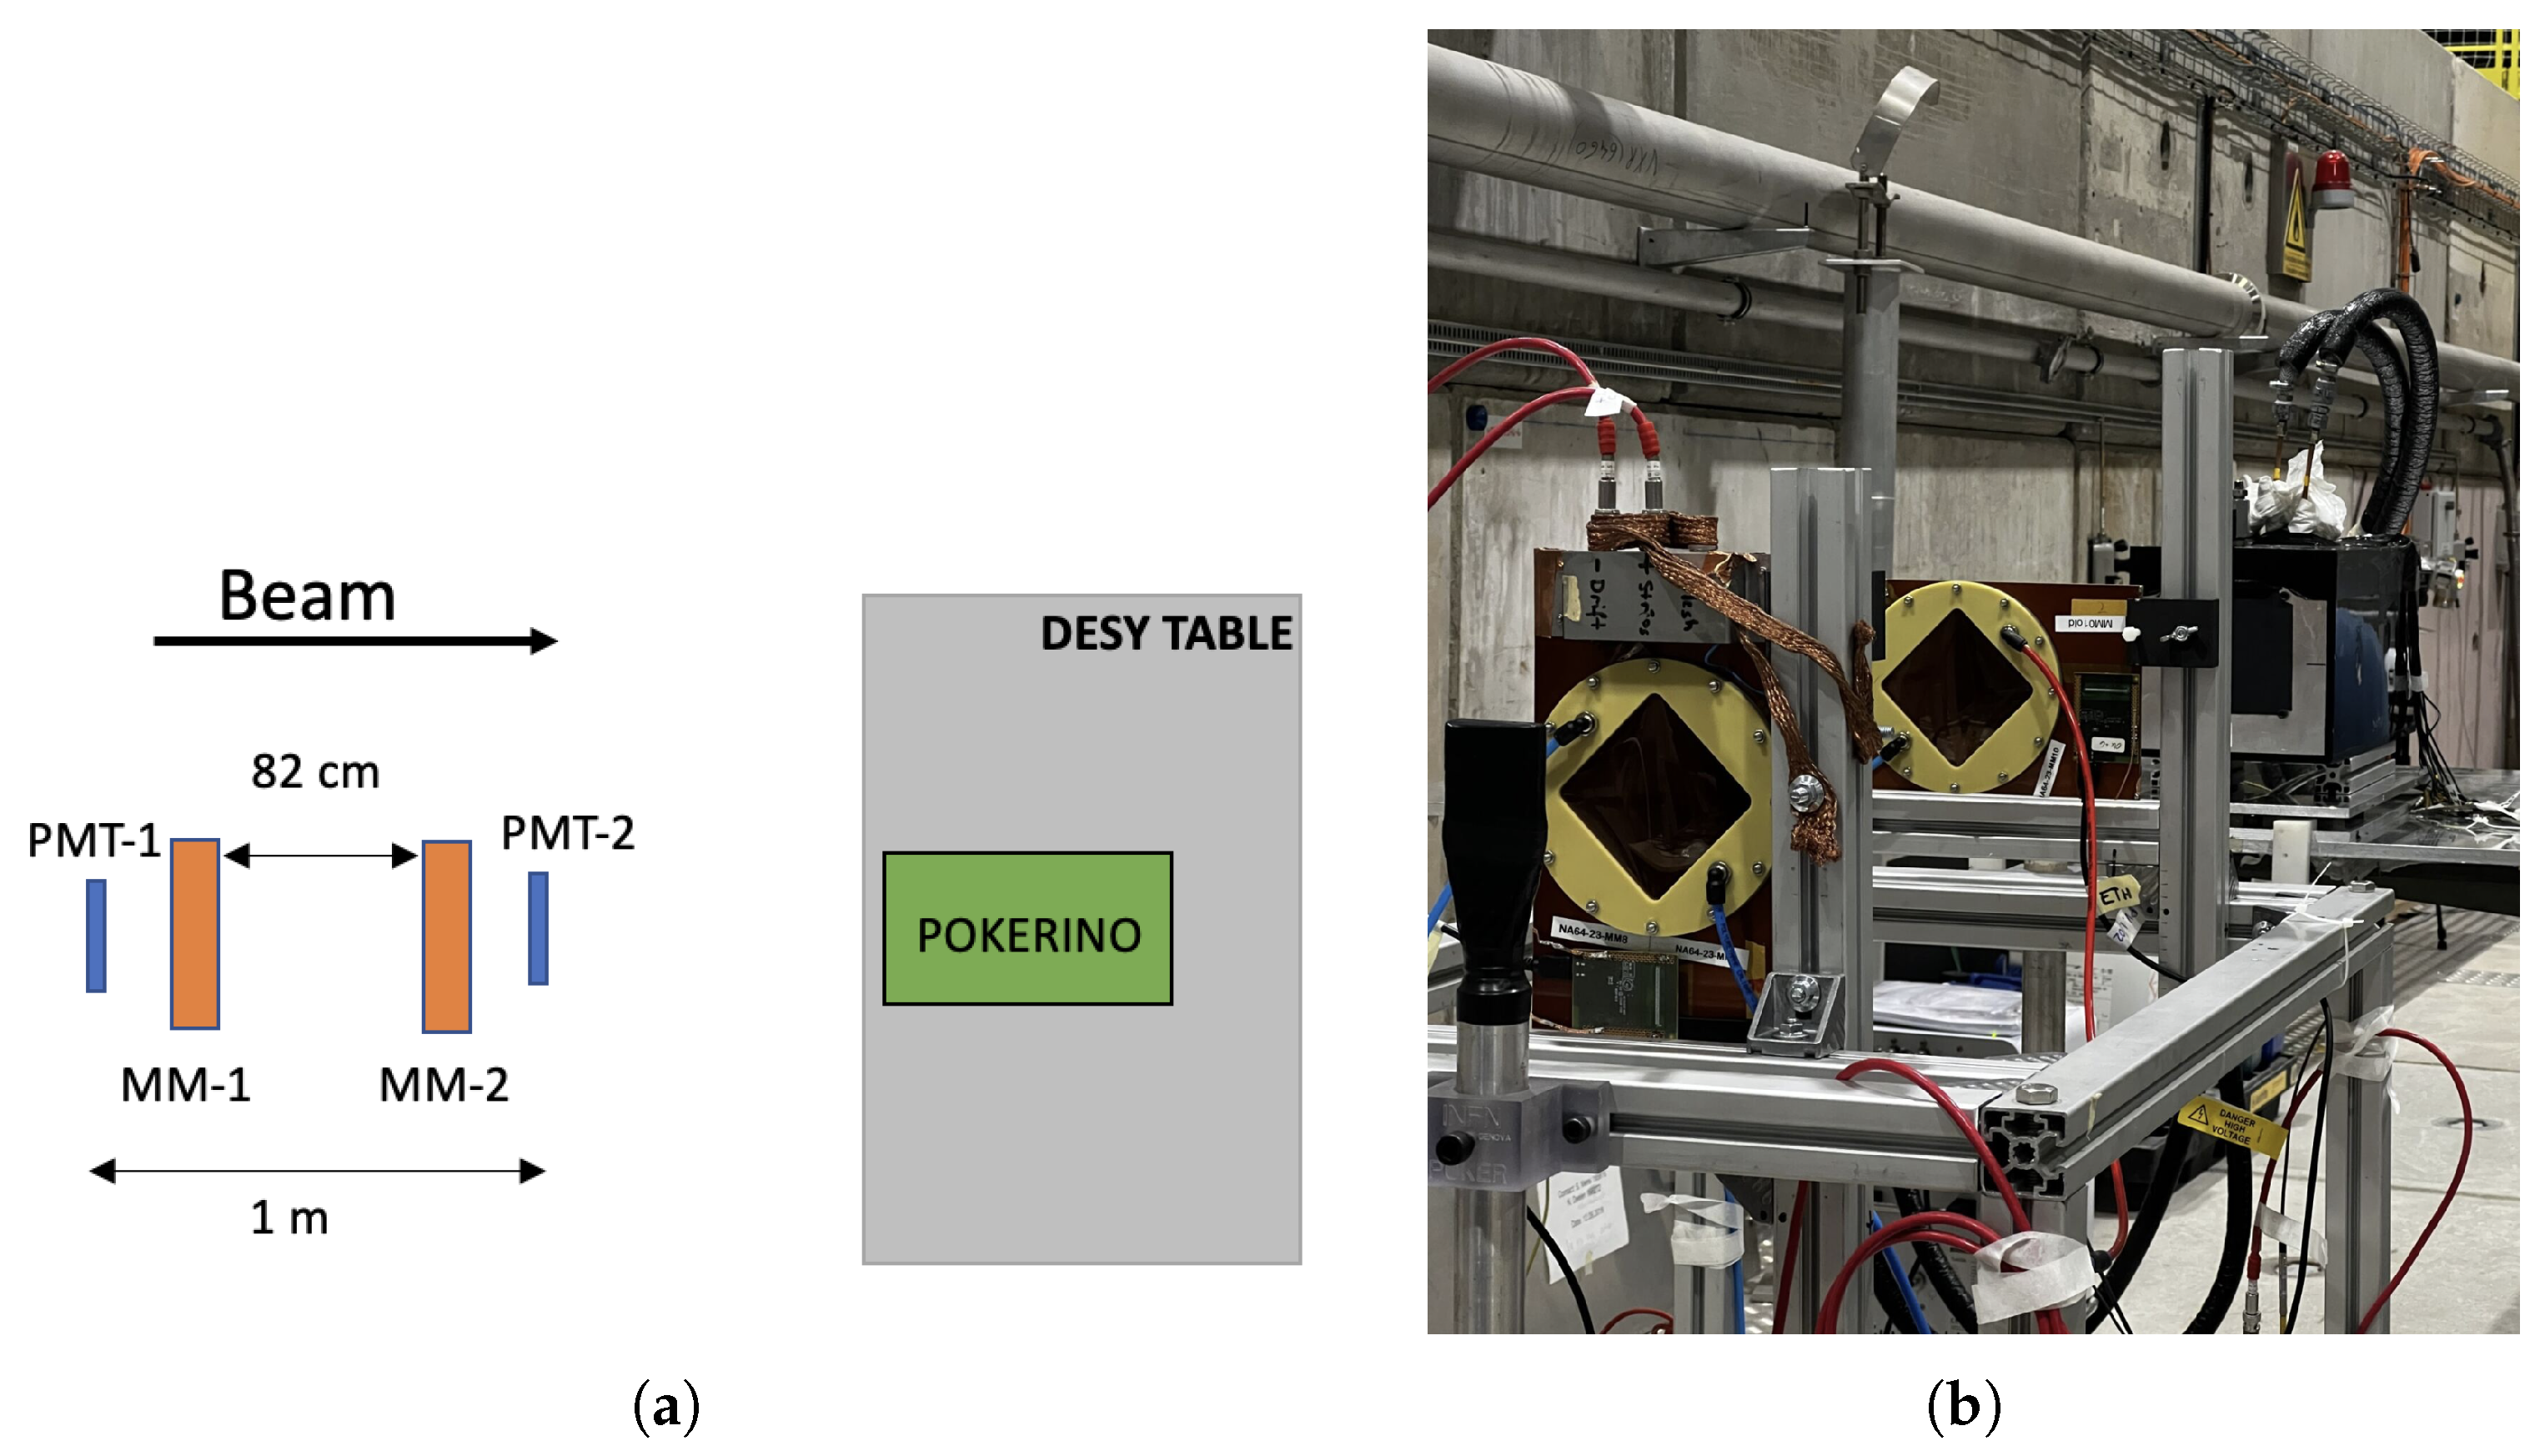
To minimize the intrinsic momentum spread of the beam, correlated with the beam spatial dimensions, we optimized the H6 configuration by closing the two beam-defining collimators from their nominal mm setting to the value of mm. To identify a clean set of events for the comparison, avoiding biases due to an inaccurate description of the beam shape in Monte Carlo, we exploited the hit position information provided by the two MM detectors, extrapolating the straight trajectory to the calorimeter front face and introducing a 3 mm cut on the distance between the extrapolated hit position and the seed cell center. The same procedure was implemented on the Monte Carlo dataset, in which, for simplicity, we employed the generator-level extrapolated track point without including the MM detectors resolution effects.
For each run, we measured the energy deposition in the POKERINO central cell, and we performed a fit to the corresponding distribution with a
RooFit RooCrystalBall PDF. As an example,
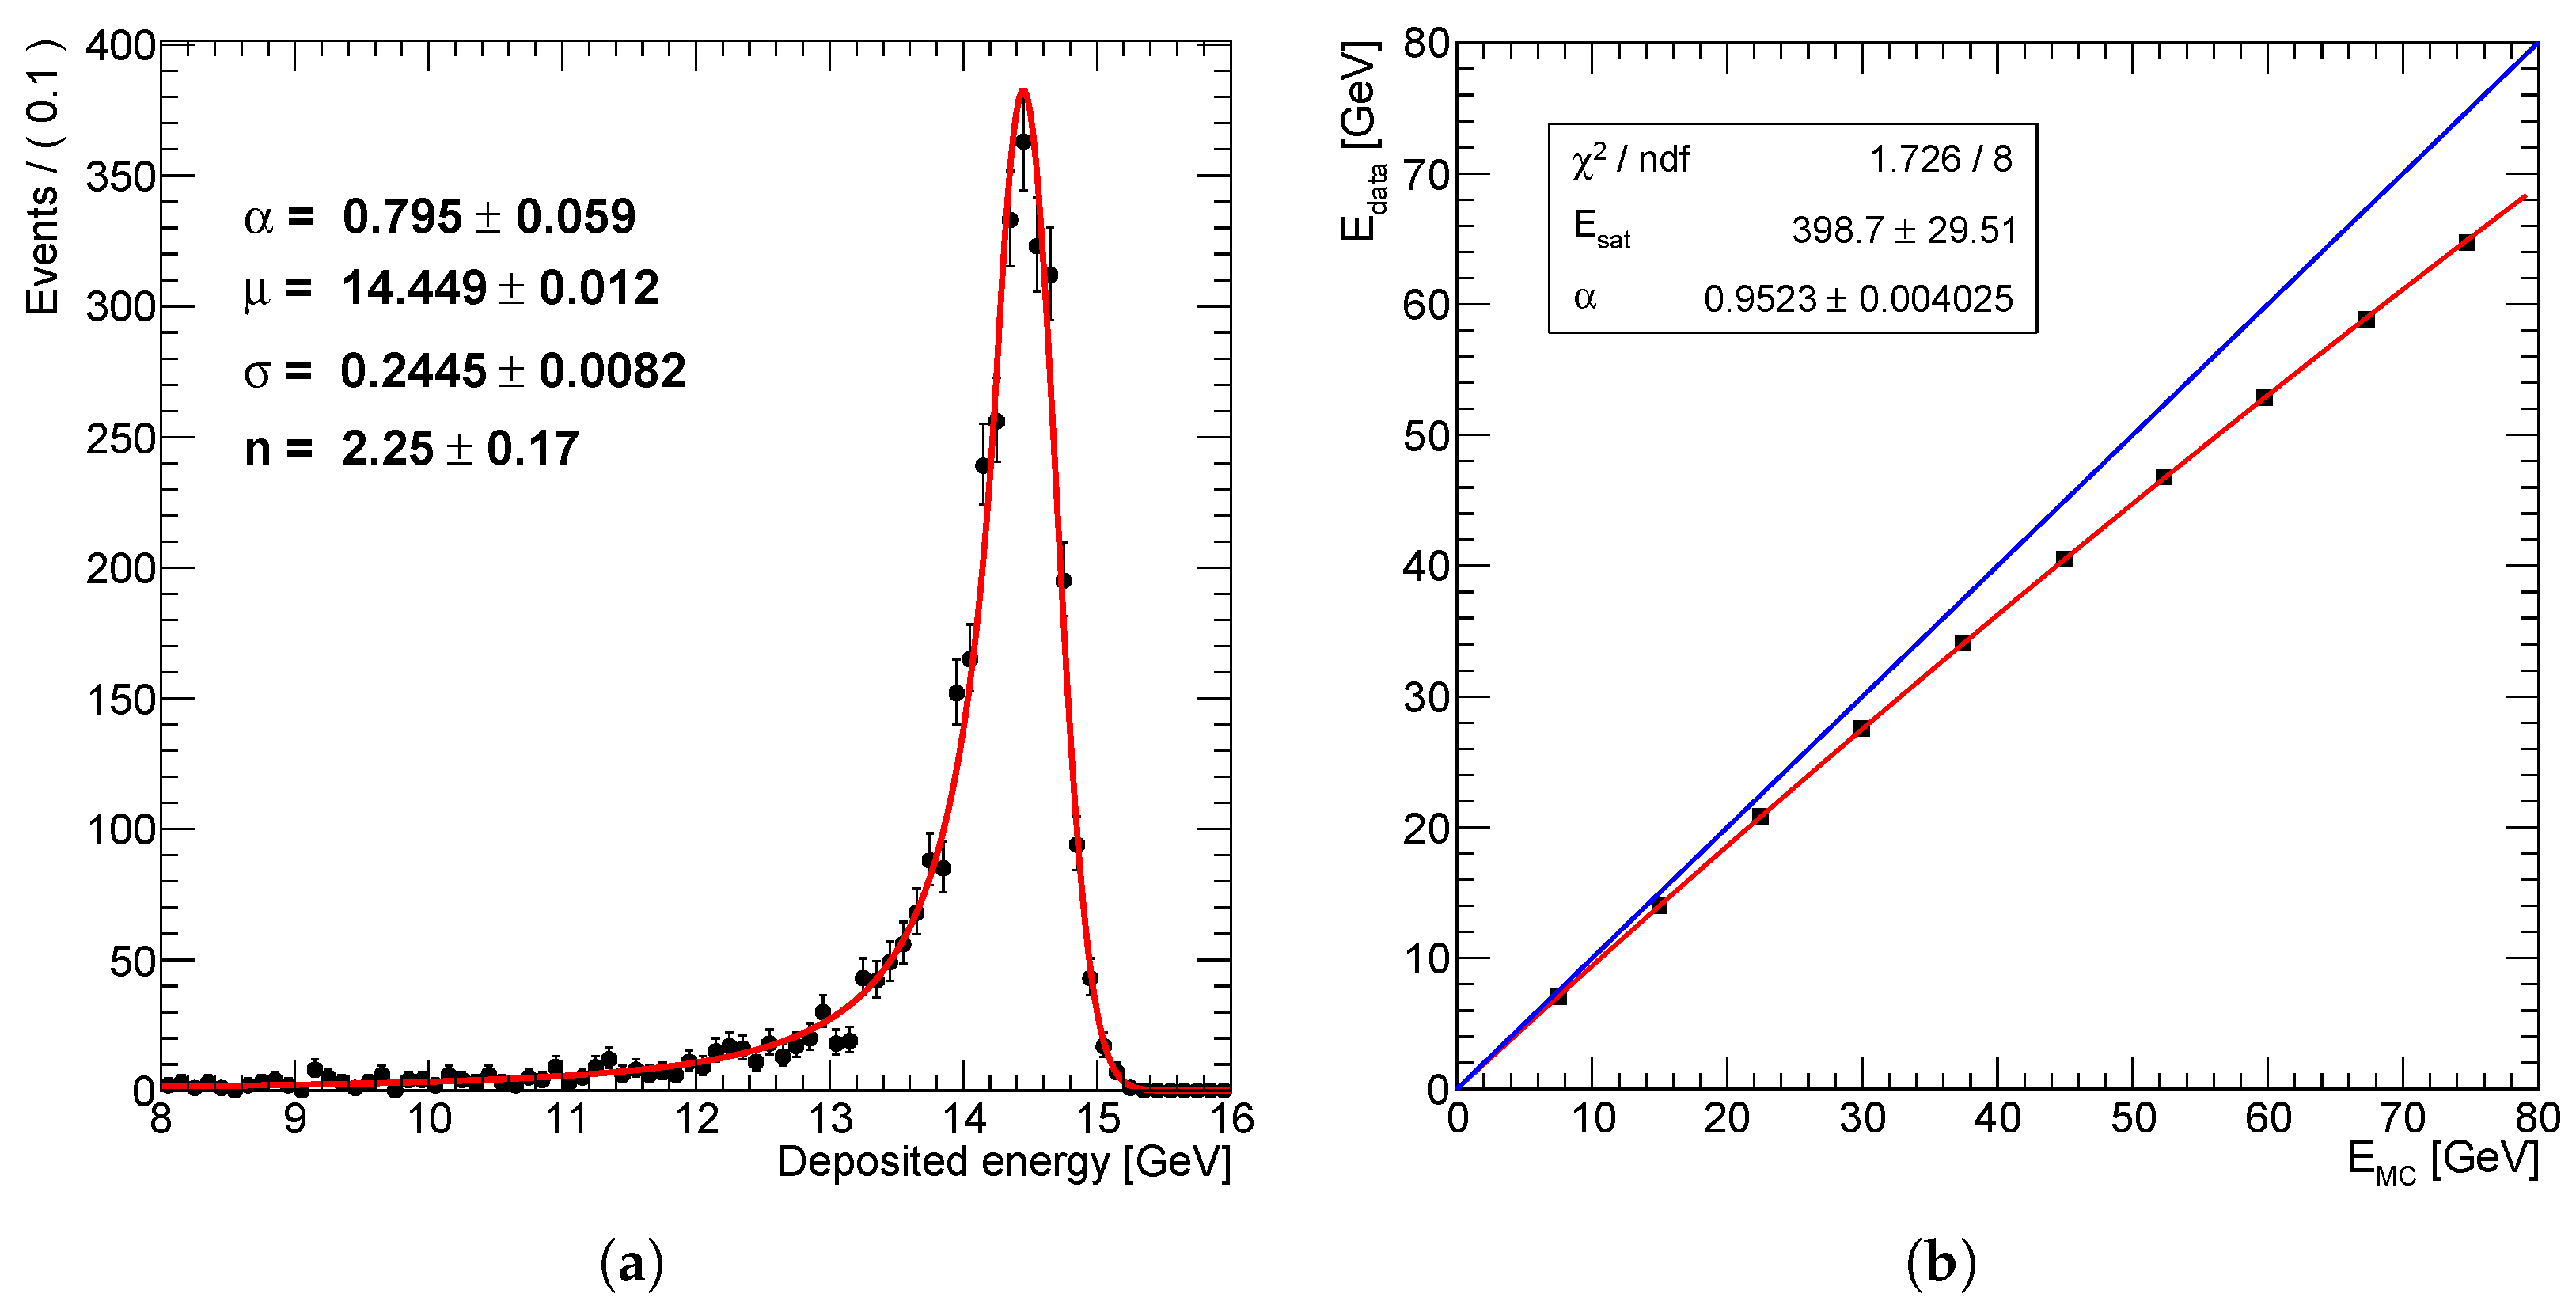
Figure 9, left panel, shows the obtained result for the 20-GeV run. To assess the systematic uncertainty of the measurements, two independent runs at 10 GeV/c were collected at different times. The corresponding seed energy mean values,
GeV and
GeV, were found to be different by more than
. A systematic uncertainty of
was therefore assigned to each measured mean value, corresponding to the relative value of the observed difference, subtracted by the statistical uncertainty contribution. This estimate is supported by an independent analysis of the spill-by-spill fluctuations of
, whose standard deviation was found to be of the same order of magnitude. We scrutinized the possible origin of this effect by investigating whether it could be attributed to variations in the beam impact position or beam-spot properties between the two runs. Although the 3 mm cut on the reconstructed impact point was applied in the analysis to mitigate such effects, we performed an additional cross-check by comparing the total energy deposited in POKERINO for the two measurements, since this observable is less sensitive to small variations in the beam position within the matrix. The corresponding total energy mean values were found to be compatible within their uncertainties, indicating that the observed difference in the seed energy is not associated with a change in the overall calorimeter response but is most likely due to small differences in the beam conditions.
The obtained mean energy values were compared to the predictions from Monte Carlo simulations, in which no saturation effects are present.
Figure 9, right panel, reports the result for the POKERINO central cell, for which the largest energy interval was scrutinized. The data points show a deviation from linearity, with a clear saturation trend. We parameterized this through an exponential function
with
and
free parameters. Here,
parametrizes the maximum equivalent energy that can be recorded by the
PKR-CAL-SiPM due to SiPM cell saturation, while
is a correction term to the energy calibration coefficient. The results of a
fit performed with this function on the data are reported in the same figure. The obtained value for
GeV can be related to the detector properties, observing that the average number
of activated SiPM cells due to a light pulse with
optical photons is given by the formula
, where
is the total number of available cells and
,
being the SiPM photon detection efficiency. The function used for the fit (Equation (
2)) corresponds to this model by recognizing
, where
is the calorimeter cell overall light yield, being
. From the
value obtained from the fit, and considering the light yield of about 5 phe/MeV, measured during the detector commissioning in Genova, we compute the effective number of total cells
. This number is
higher than the real number of cells in the
PKR-CAL-SiPM sensor, as predicted by a more refined saturation model in which cell recharge and re-triggering effects are included [
25].
The same study was repeated for the 8 periphery cell—due to the limited run time, their response was characterized only for lower beam energies, at 10 GeV, 20 GeV, and 40 GeV—this was motivated by the fact that, during the measurements with the beam impinging on the central cell, representative of the final POKER measurement setup, the energy released in the periphery cells was significantly smaller. Also in this case, the two-parameter exponential function previously discussed was adopted to describe the saturation trend. We observed that all the saturation parameters are compatible within their uncertainty, confirming the uniformity of the individual cell properties.
3.4. Energy Resolution
The POKERINO energy resolution
was characterized using the same dataset employed for the linearity studies, with the
beam impinging on the central cell. For each cell, an event-by-event energy correction was applied to account for saturation effects, introducing a new variable
, where
is the energy saturation parameter of the cell determined through the procedure discussed before. To reproduce the high-intensity conditions expected in POKER, in which the expected beam-spot radius is of the order of one cm, no selection cuts on the beam impact point on the detector were included.
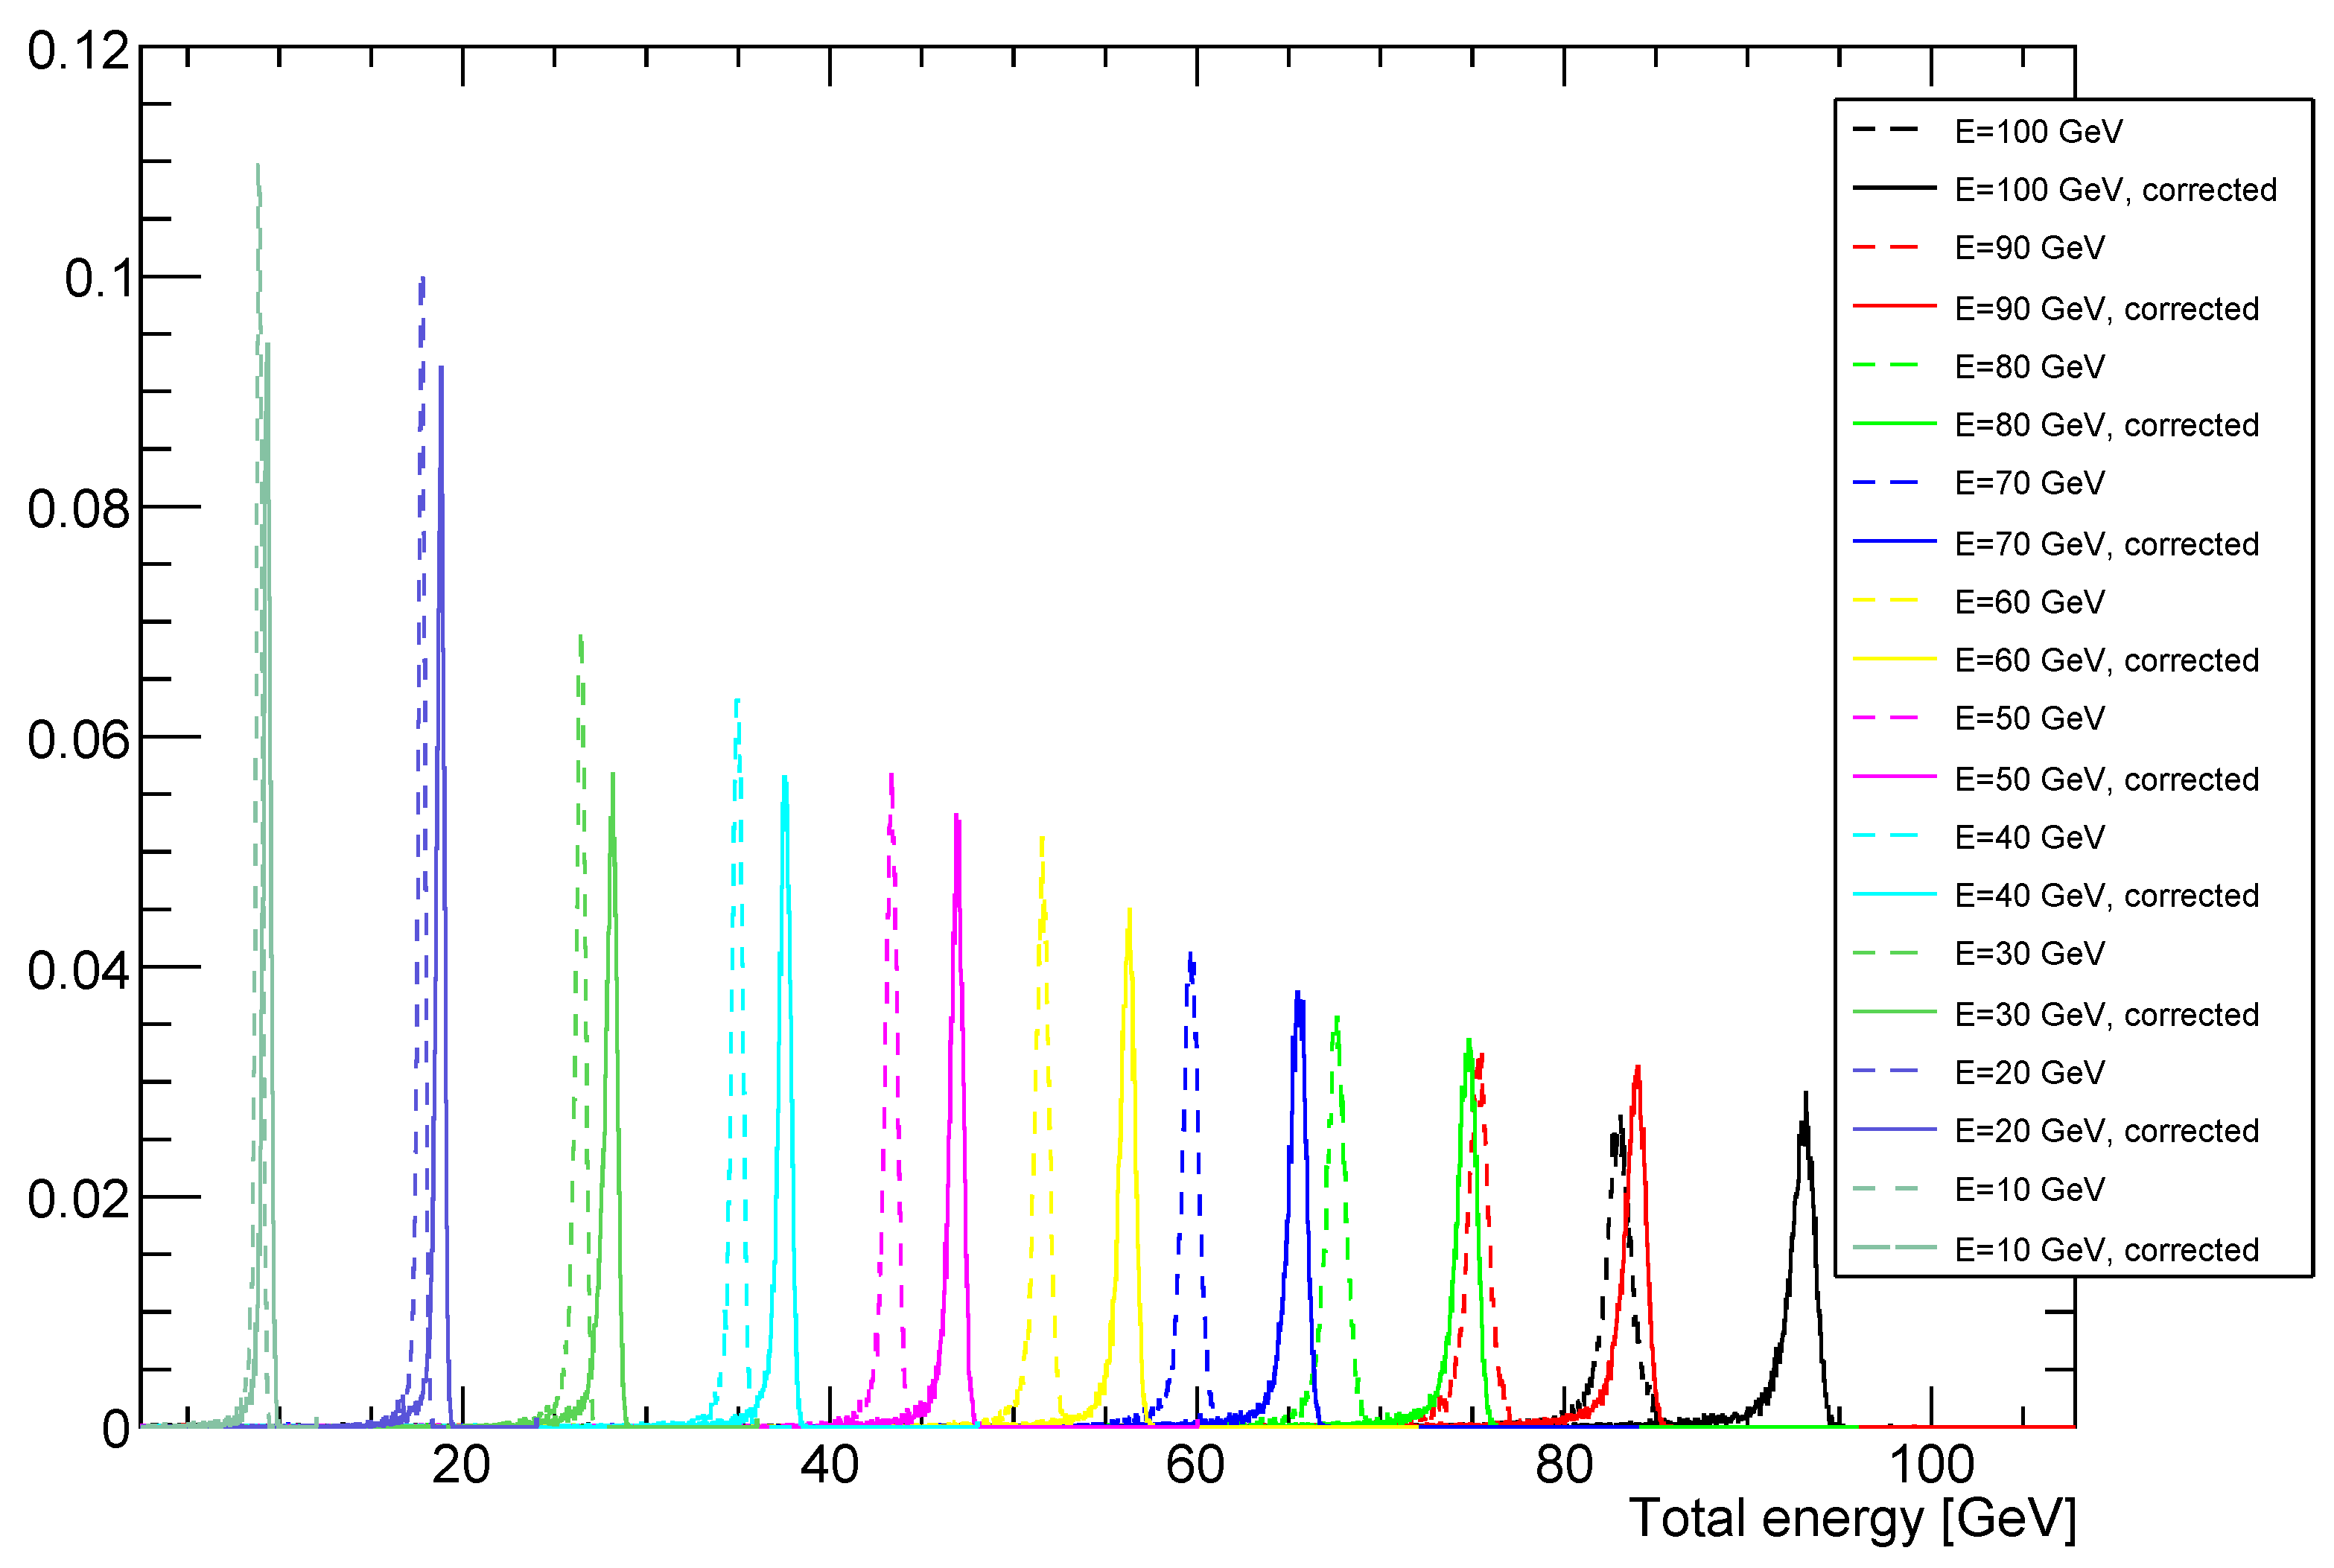
Figure 10 shows the obtained results, comparing for each beam setting the total energy distribution in POKERINO, including (full lines) or not (dashed lines) the saturation correction.
Each energy-corrected distribution was fit through a
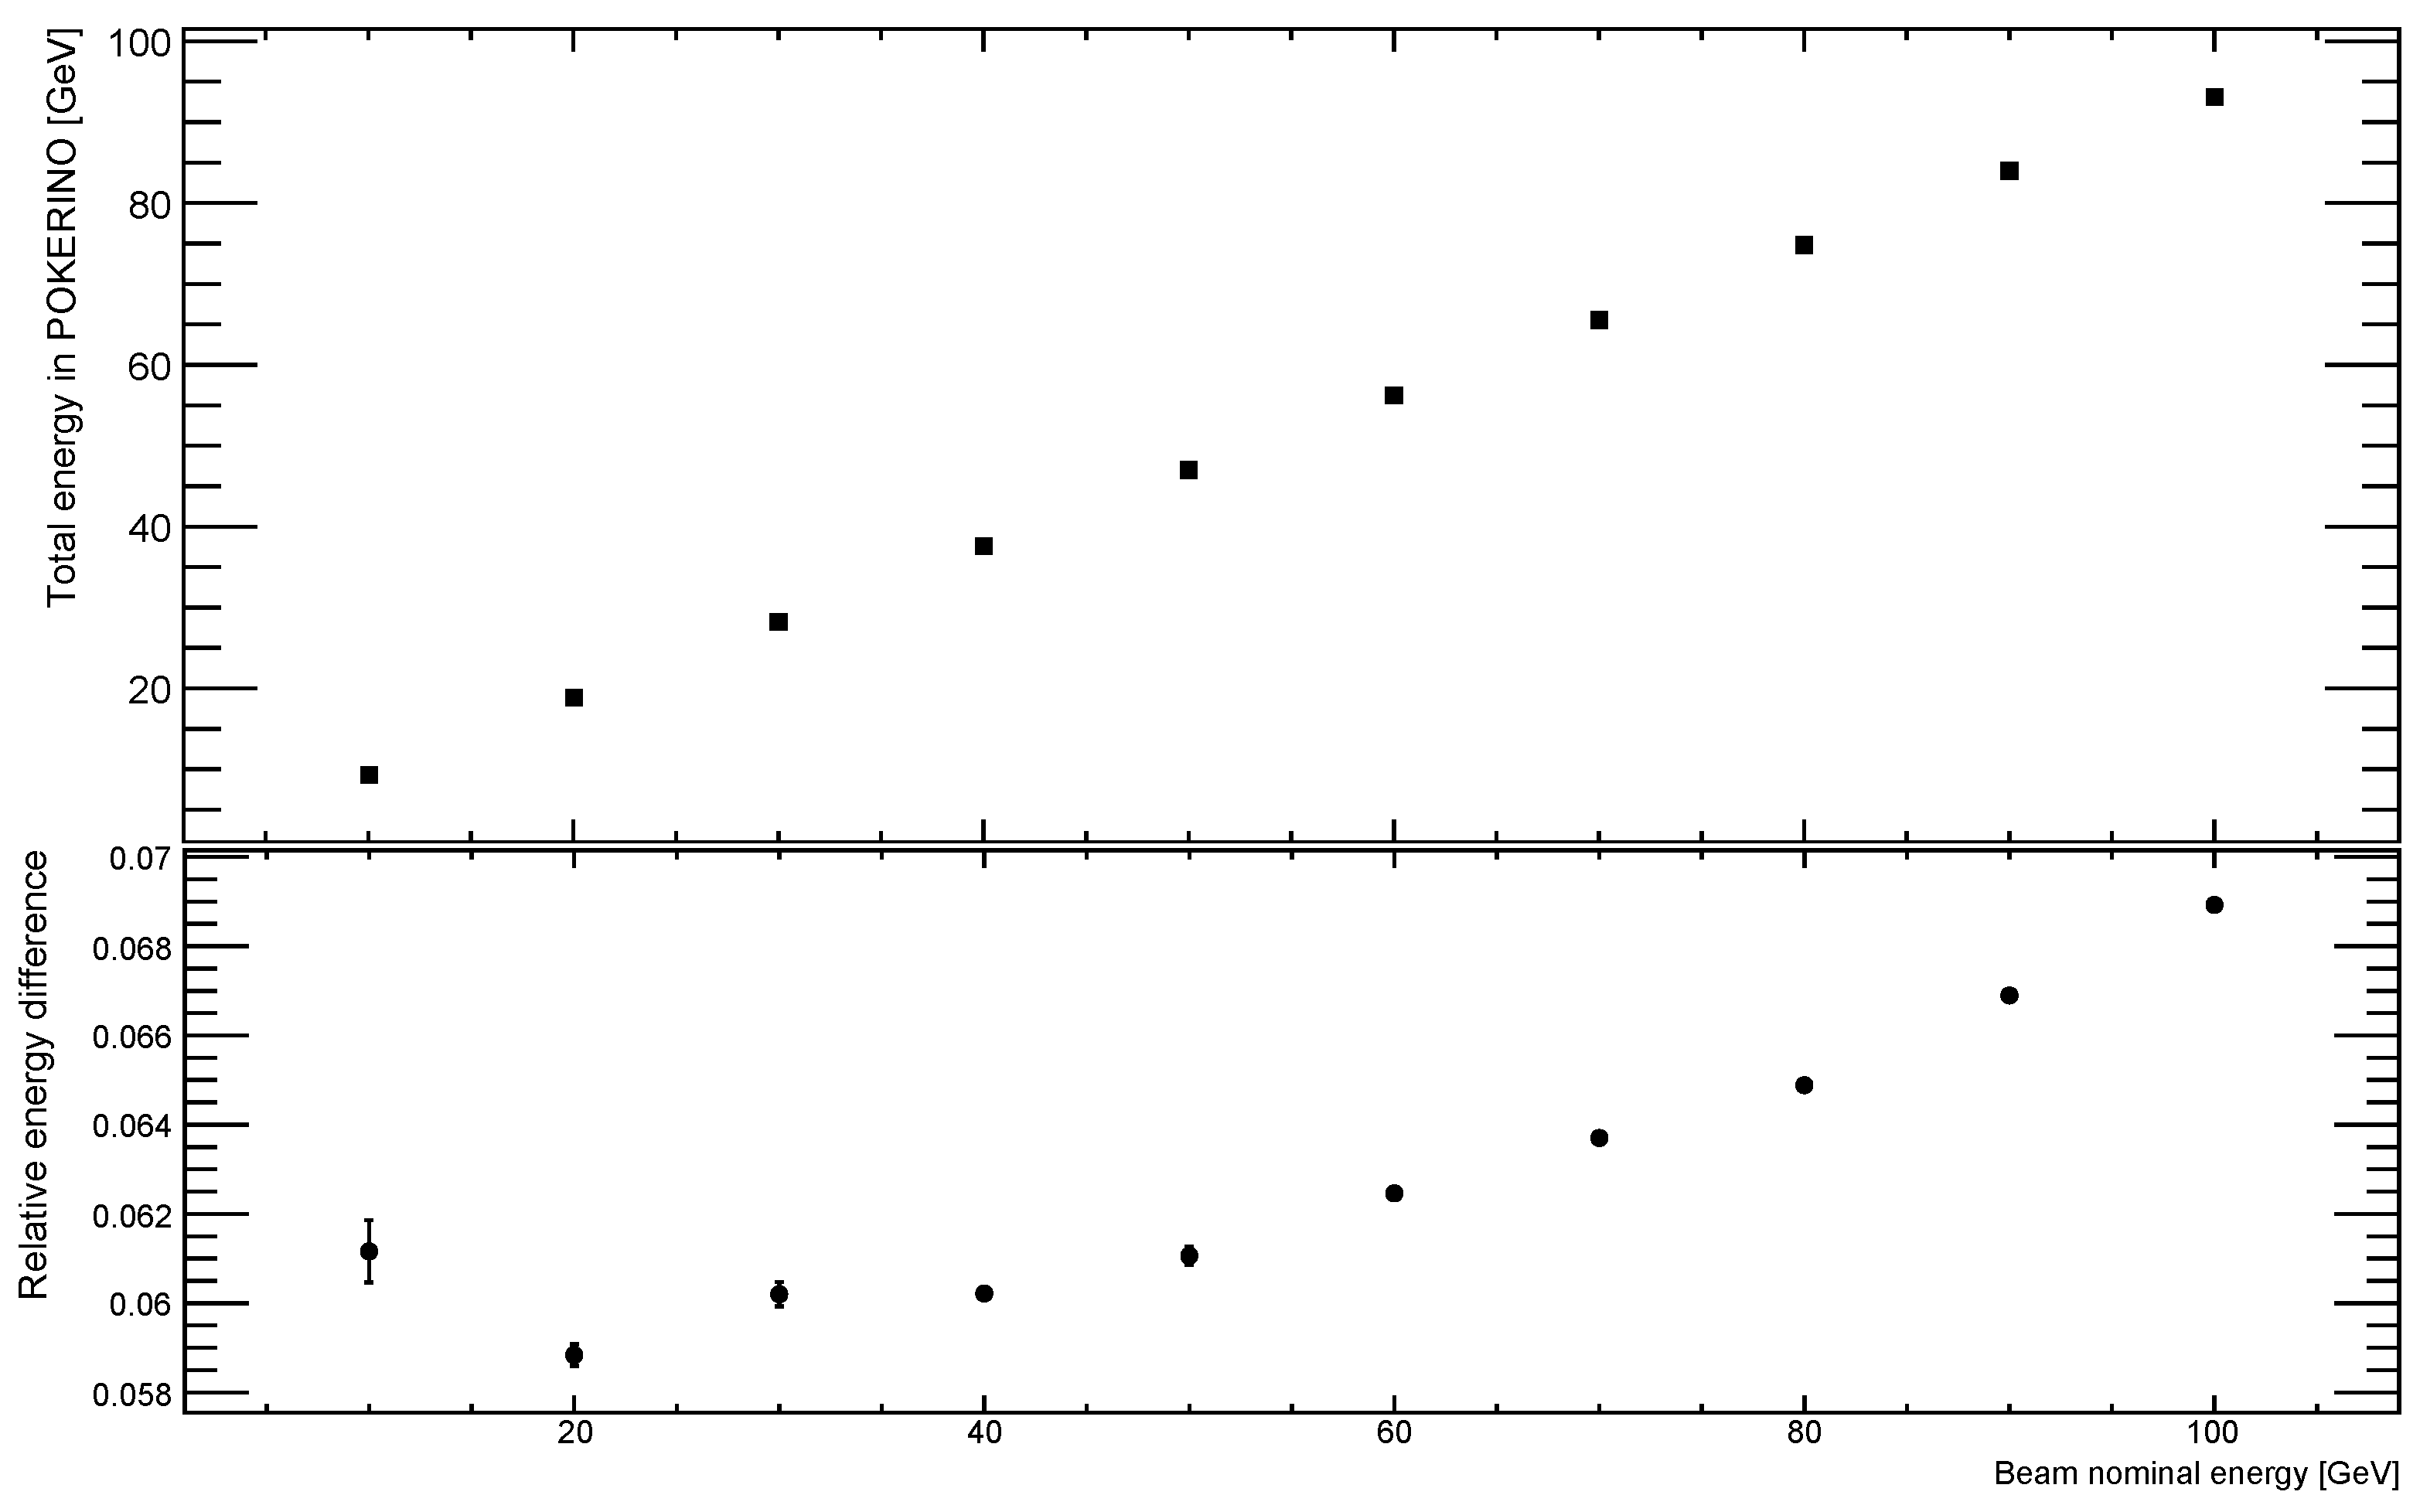
Roofit RooCrystalBall PDF to determine the average energy deposition and the corresponding resolution. The linearity of the POKERINO response is shown in
Figure 11, in which the top (bottom) plot shows the correlation between the average energy deposition (relative difference between the nominal beam energy and the average energy deposition) and the nominal beam energy, respectively. Since no energy-leakage corrections are applied, the relative energy difference is about 0.065, with a ≈10% variation in the considered energy interval—we anticipate correcting this effect in POKER through an ad hoc energy correction mechanism derived from MC simulations. The relative energy resolution is shown in
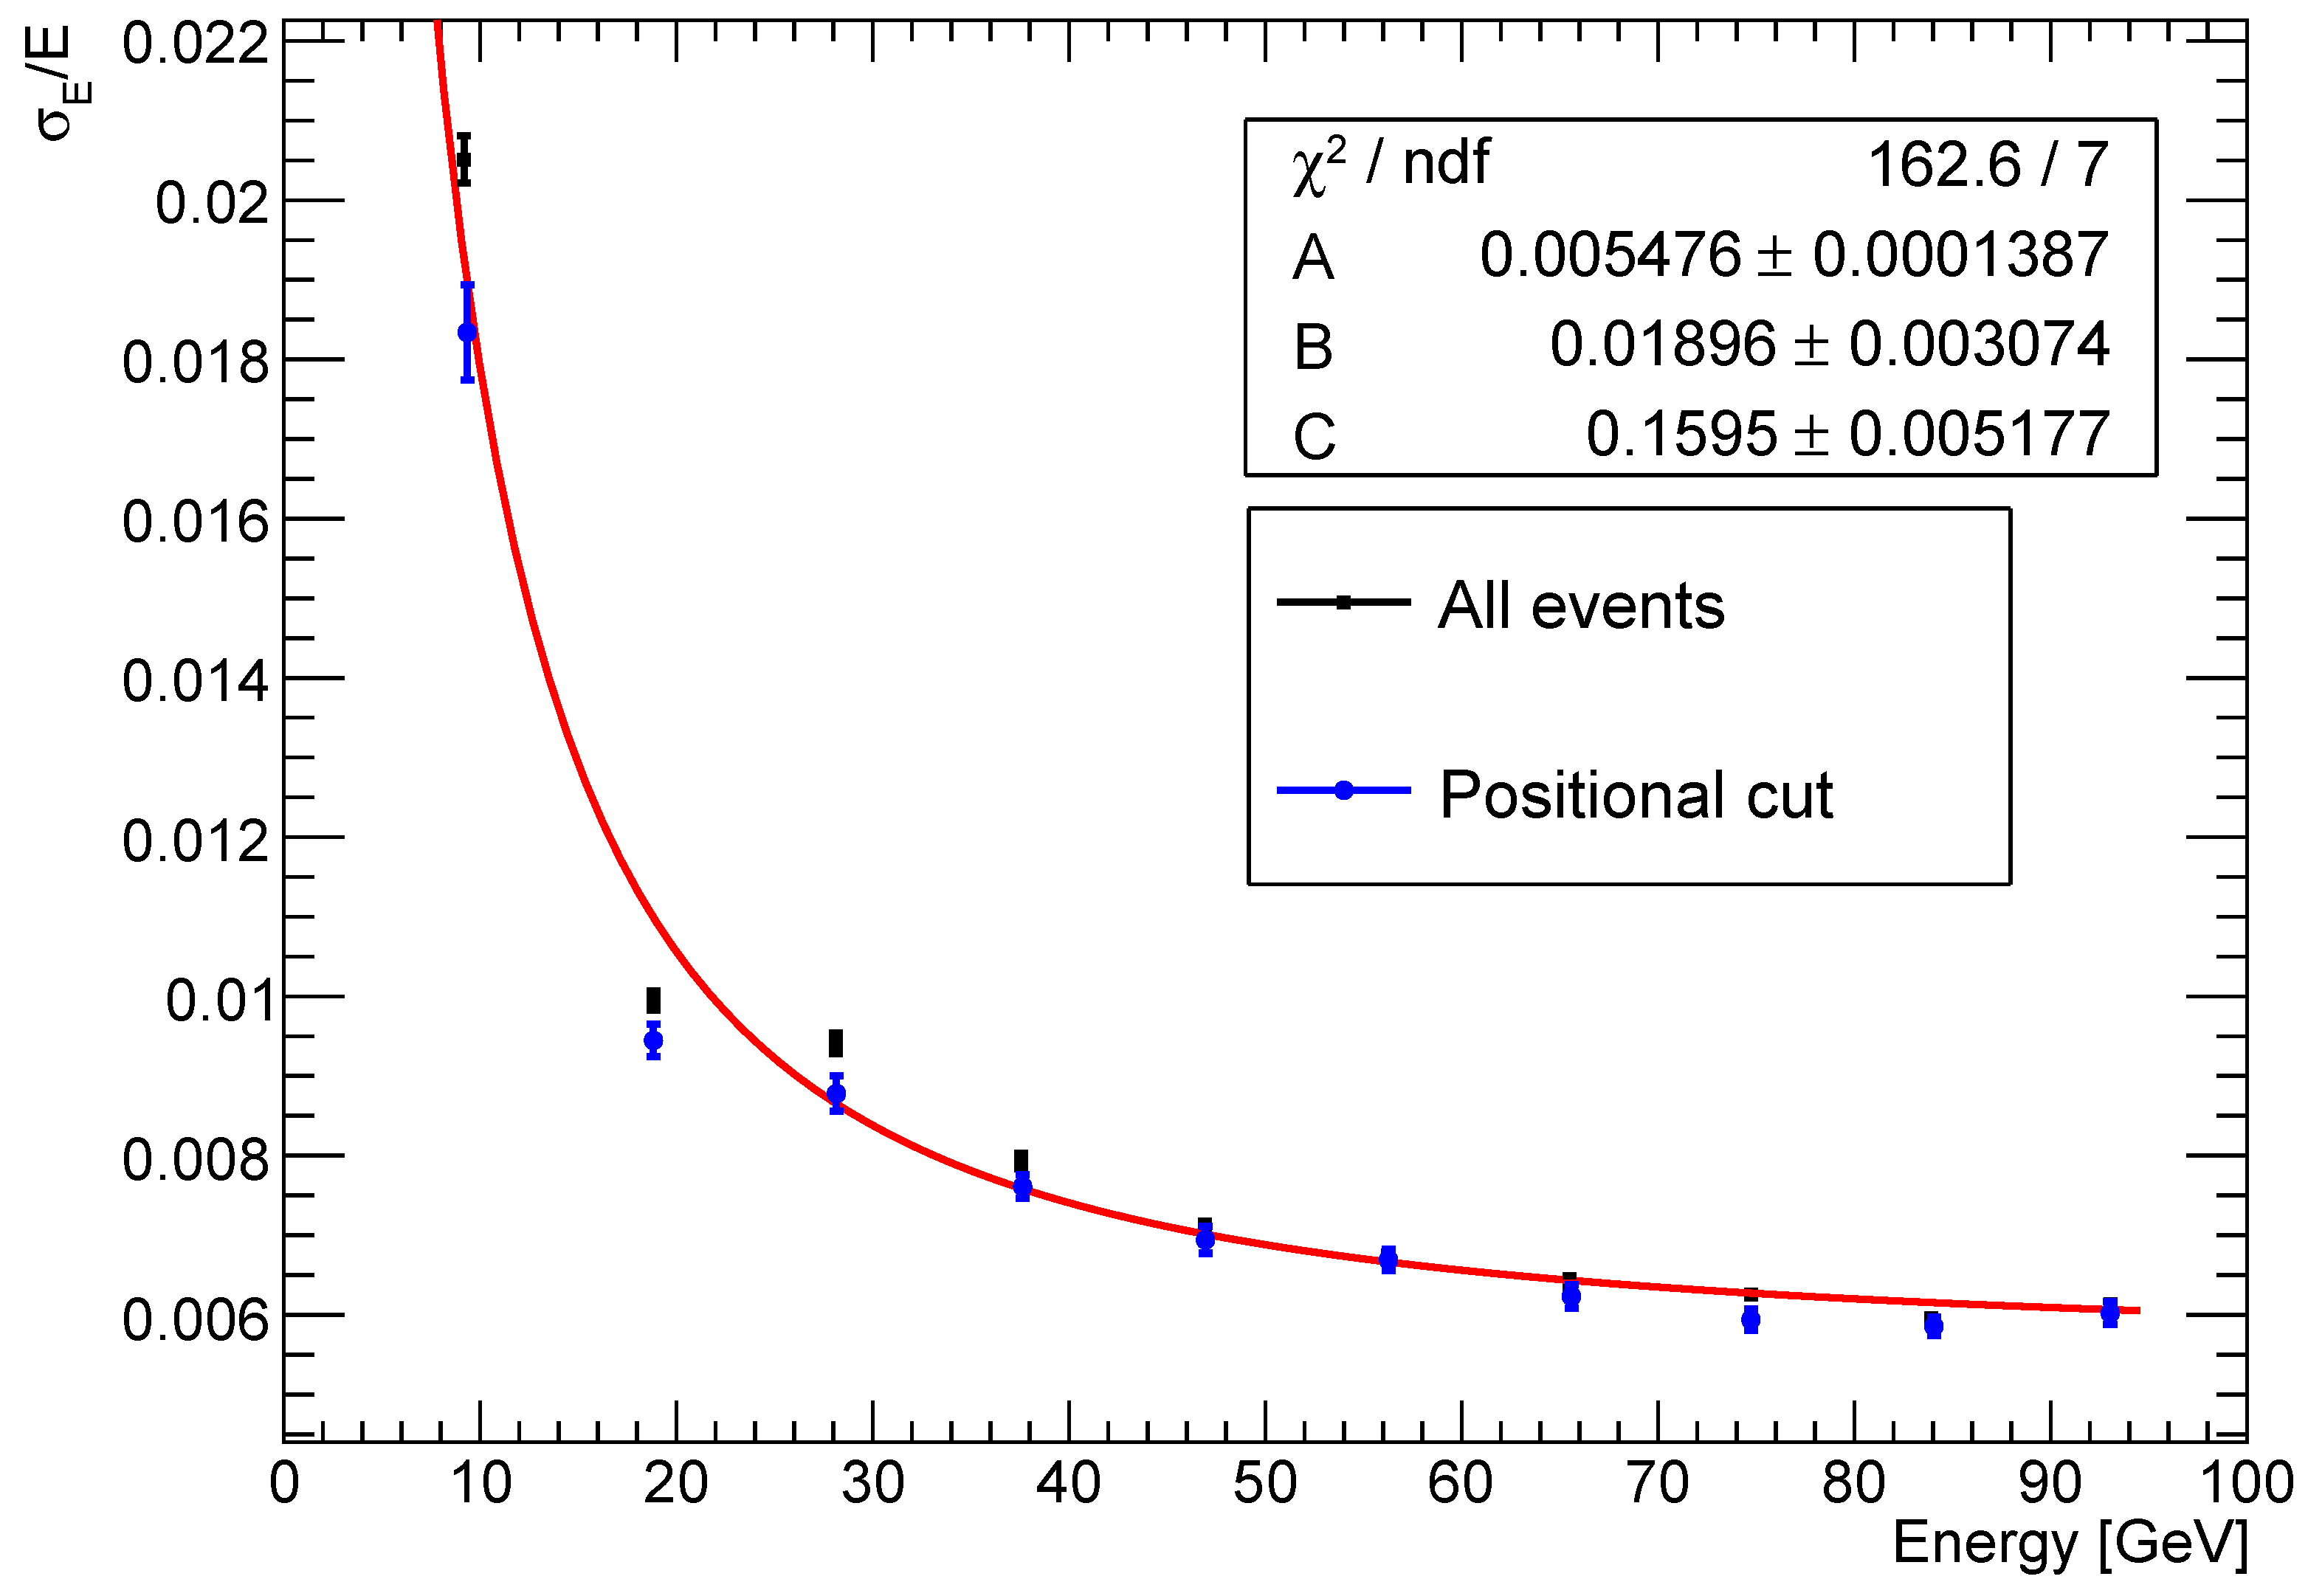
Figure 12, reporting the
observable as a function of the total measured energy. The data were parameterized via a function
, where ⊕ denotes a quadratic sum. The obtained value of the systematic parameter
A was
, compatible with the design requirements. Similarly, the statistical term
B was
, confirming the overall light collection yield of about
phe/MeV. The noise term
MeV is also compatible with the conservative single-cell ENE estimate previously discussed. The measured point at 10 GeV beam energy deviates from the overall trend visible at higher energy; we observe that this energy value corresponds to the minimum momentum acceptance of the H6 beamline and, thus, possible spurious effects on the momentum spread or on the nominal value are possible. If this point is excluded from the fit, the result shows a lower
value, with the constant resolution term reducing to
, at the price of a slightly larger value for the statistical term
B.
All measurements discussed previously were performed closing the two H6 momentum-defining collimators to ±5 mm—in this configuration, the expected momentum spread width (assuming a rectangular PDF) is 0.7%, with an equivalent standard deviation
. To check the possible effect of the momentum spread on the energy resolution, we repeated the analysis by selecting events with projected
impact points within 3 mm from the crystal center (see again
Figure 12, blue points). In general, the two datasets agree quite well, apart from at low energy, where the point from the filtered dataset is characterized by a lower relative resolution—this supports our explanation of the resolution behavior at low energy. If the lowest energy point is again excluded from the analysis, the fit result yields
and
, with
. The value of the
A parameter is compatible with the result obtained previously, supporting the fact that, in both scenarios, the intrinsic beam spread is smaller than the calorimeter resolution.
3.5. Response to High-Frequency Beams
In POKER, the PKR-CAL-SiPM sensors are exposed to the intense scintillation light from PbWO4 crystals induced by impinging 100 GeV/c positrons at an average rate in the range of 100 kHz–1 MHz, resulting in a sizeable DC current flowing across the bias resistors. Due to the voltage drop on the latter, the effective bias voltage of the photosensors, and hence the gain, is reduced. This effect leads to a dependency of the SiPM response on the beam average intensity , and, most important, in case of any sudden variation of the impinging particle rate, may introduce gain fluctuations affecting the overall detector resolution.
The magnitude of this effect can be estimated through a simplified DC model of the
PRK-CAL-SiPM devices in which the intrinsic particle detection efficiency dependency on the bias voltage is neglected. Qualitatively, the process is governed by a negative-feedback mechanism: if the beam intensity suddenly increases, so does the bias current flowing through the sensor, and thus the voltage drop across the bias resistor grows. As a consequence, the voltage difference across the sensor diminishes and the gain drops, resulting in a decrease in the bias current. Quantitatively, at a fixed temperature, the
PRK-CAL-SiPM gain can be expressed as:
where
is the bias voltage provided by the generator,
is the SiPM breakdown voltage,
I is the average current flowing through the bias resistor, and
is a proportionality constant, depending on the SiPM cells capacitance (For the S14160-6010 device, a fit to the data reported on the datasheet provides
35,000/V). Here,
is the overall detector bias resistance—in the present setup,
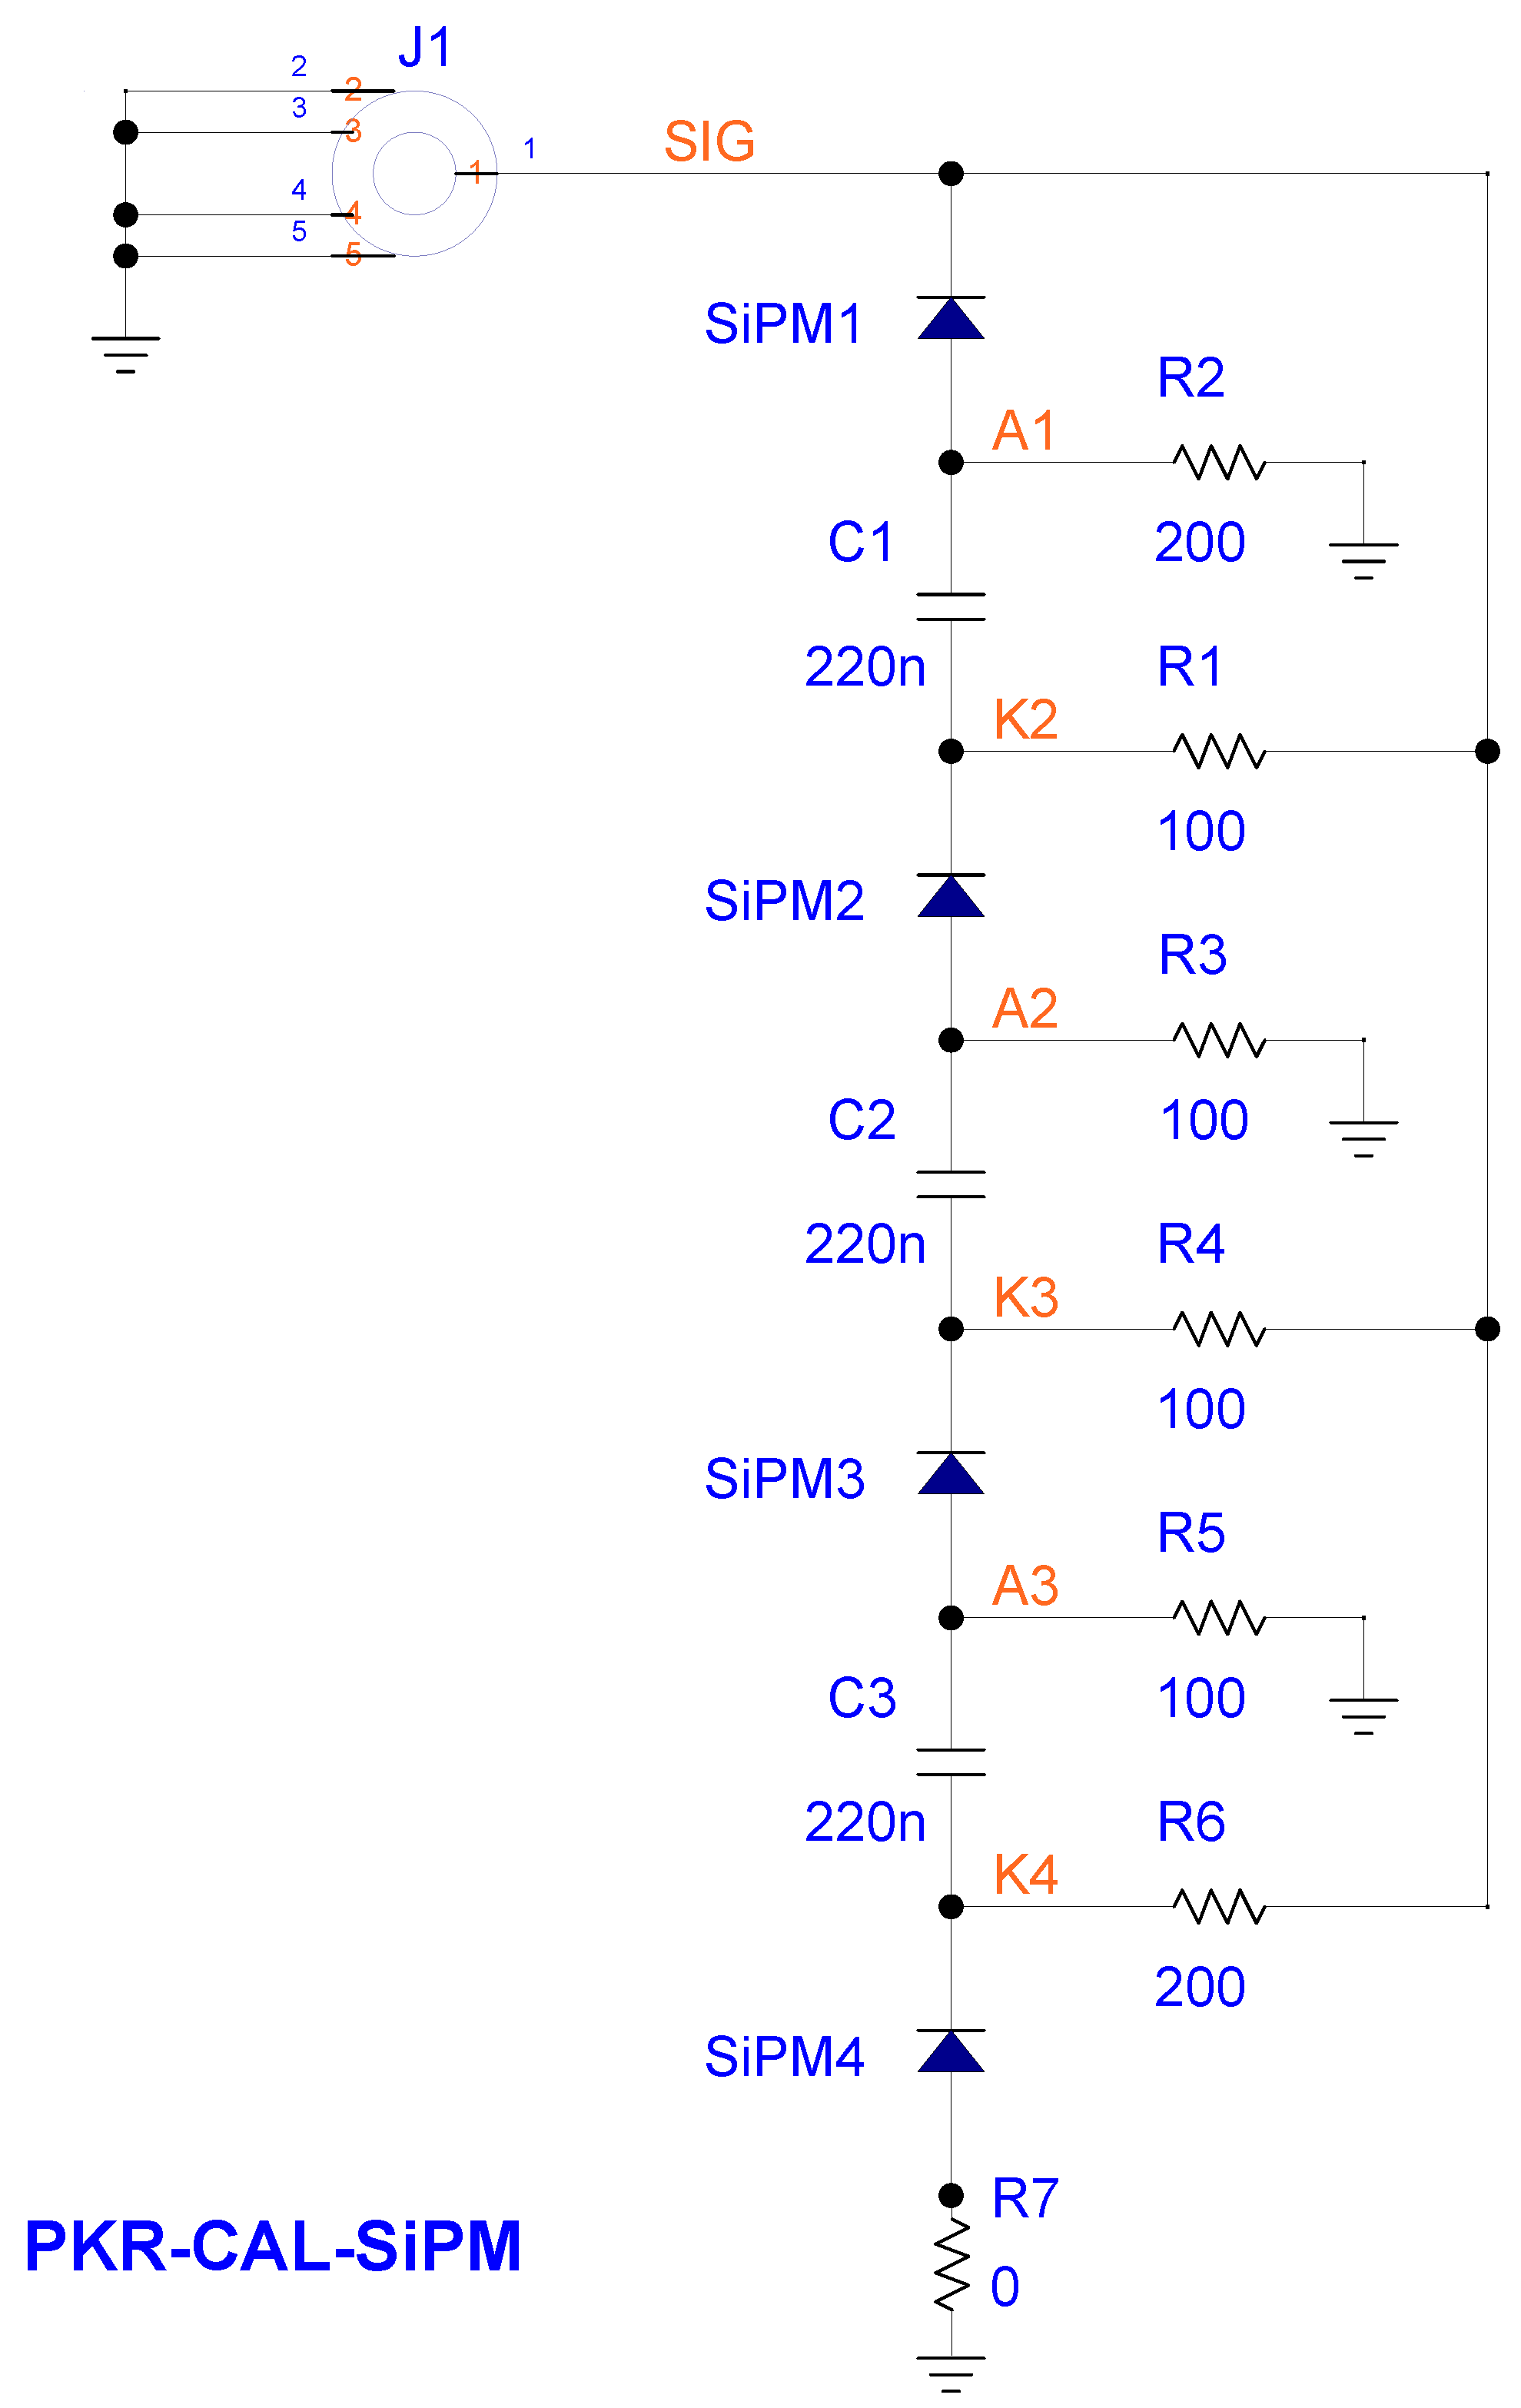
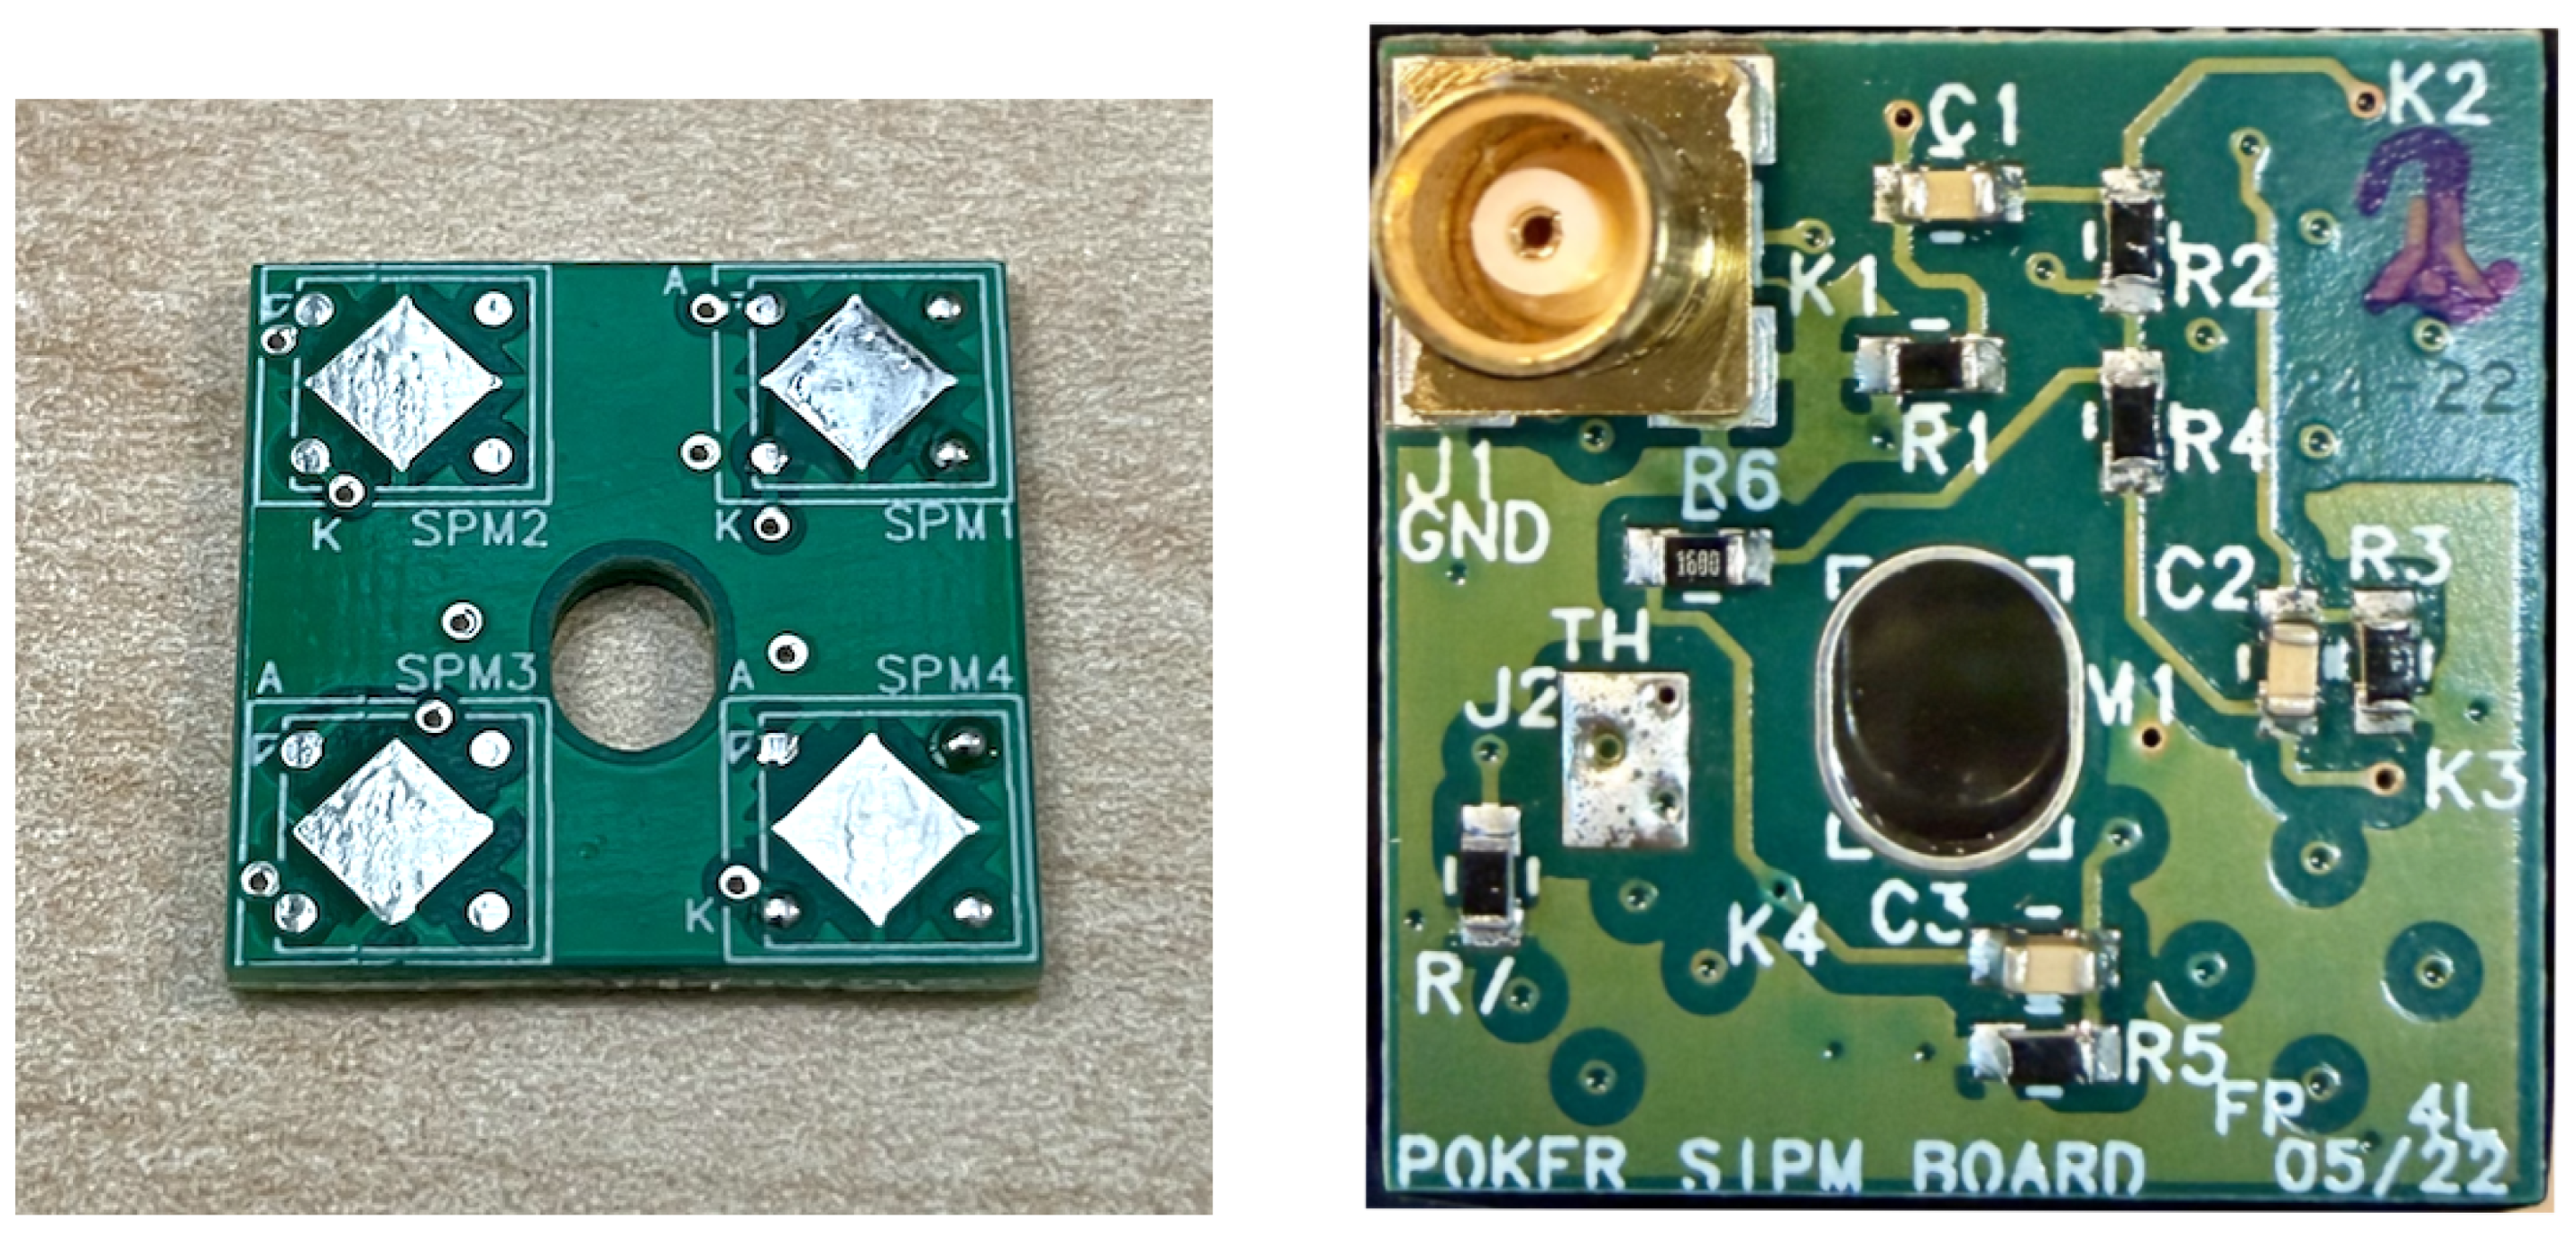
is the parallel combination of the four 200
bias resistors mounted on the
PKR-CAL-SiPM, plus a 10
contribution from the external bias circuit. Considering the average impinging particle rate
and calling
the average number of cells activated by the scintillation light pulses, the relation
holds, resulting in the following result:
This equation shows that, for beam rate
, with
, a linear relation between the gain and
holds, while at larger frequencies the gain drops as
. For the PKR-CAL center-most crystal, a conservative estimate for
is
phe; therefore,
MHz. Any instantaneous beam rate fluctuation
would induce a variation in the gain, and thus in the reconstructed energy response of the calorimeter, contributing to the overall energy resolution through a constant term
In the POKER experiment, the nominal value of
is about 100 kHz, so that
. Since at H4, for these operating conditions, the in-spill beam intensity fluctuations can reach up to
, this ensures that intensity-induced gain fluctuations contribute as a sub-dominant term to the overall energy resolution (We observe that, in principle, larger spill-by-spill variations of
are possible at H4—in POKER, we plan to compensate for this effect by recalibrating the central cell response for each spill, exploiting the signature of 100 GeV/c
events.).
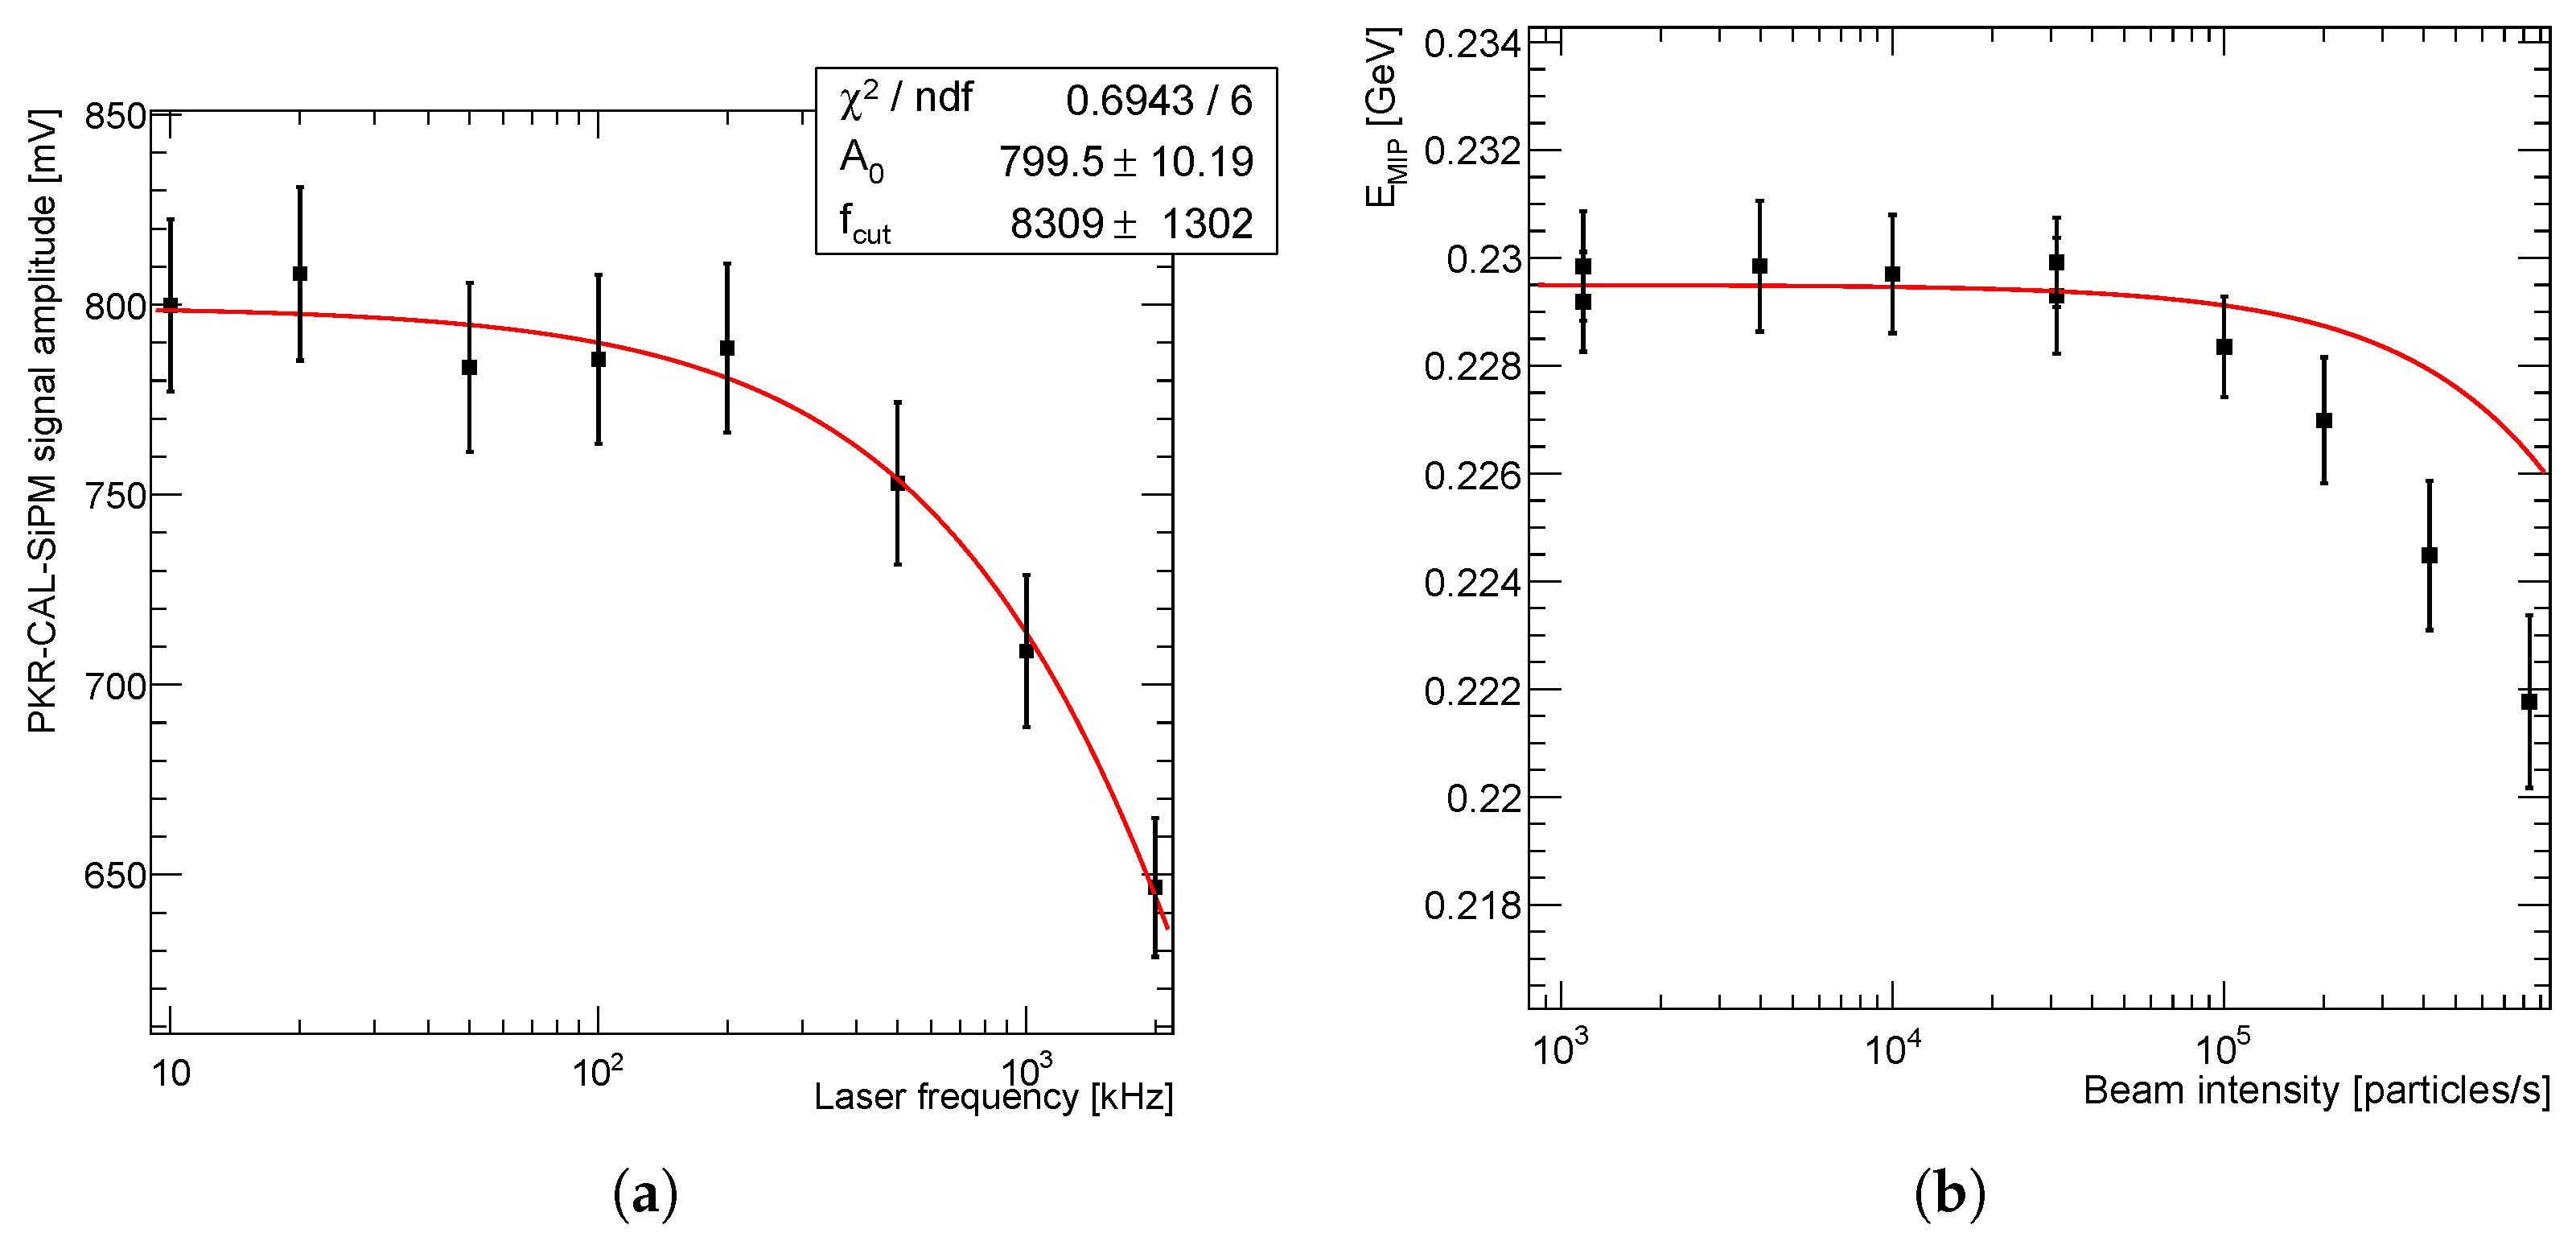
The validity of this model was checked with a dedicated measurement using the setup discussed in
Section 2.2. The pulsed laser intensity was set to obtain a
PKR-CAL-SiPM signal equivalent to approximately
phe at low frequency, and the sensor response was then measured as a function of the laser pulse frequency
. In this configuration, the expected cut-off frequency is approximately
MHz. To correct any possible dependency of the laser itself on the latter observable, for each frequency value we measured the laser average power
P with the photodiode, and we applied a correction to account for any frequency-dependent variation of the light intensity through the relation
, where
is the measured power at the lowest measured frequency
kHz. The magnitude of this correction was frequency-dependent, with a maximum value of
for
MHz. The uncertainty on this correction factor, properly accounted for in the analysis, is dominated by the
accuracy on the absolute laser power
P measured with the photodiode. The obtained result is shown in
Figure 13, left panel, reporting the experimental measurements together with a fit performed with the simplified-model function
, with the two free parameters
and
. The measured cut-off frequency
MHz is in good agreement with the model prediction, accounting for the uncertainty on
.
In order to verify the obtained results in a condition representative of the PKR-CAL foreseen measurement at H4, we performed a high-intensity test during the POKERINO test beam, exploiting the H6 beam line versatility. We configured H6 to deliver a 120 GeV/c
beam with maximum intensity ≈
particles/spill. In this setup, the average energy deposited by beam particles in the detector central cell, determined from a simplified FLUKA [
26,
27]-based simulation of the setup, is approximately 10 GeV; a rough estimate for the cut-off frequency reads
MHz, having
phe. The typical energy deposition per unit time
, at the maximum beam intensity, is approximately 8 GeV/
s. This is comparable to that expected for the full PKR-CAL, in which the 100 GeV/c
beam deposits on average 68 GeV in the central cell, with a maximum intensity of
particles/s, resulting in
7 GeV/
s. We exposed the POKERINO central cell to the beam, changing the opening of the various beamline collimators to vary the beam intensity, which was measured from the counting rate of a large plastic scintillator counter installed on the beamline upstream to our setup (Counter
XSCI 041.488.). In each run, we assessed the central cell gain by isolating events with small total energy deposition in the lateral crystals, imposing a 300 MeV threshold on the latter. For selected events, we measured the central cell energy distribution. This showed a clear peak for MIP-like events, in which the impinging hadron passes through the PbWO
4 crystals without any hard interaction. The position of the MIP peak
was determined via an unbinned maximum-likelihood fit using a Landau distribution convoluted with a Gaussian curve. We assigned the RMS of the spill-by-spill
distribution as the systematic uncertainty associated, for each run, with this observable.
The correlation between
and the beam intensity is shown in
Figure 13, right panel. In case of multiple runs executed at the same intensity, we decided to report all data points in the graph. The superimposed red curve represents the model prediction with
MHz. This exhibits a non-negligible discrepancy with the experimental data, showing a stronger dependency on the frequency, down to a gain reduction of ≈3.5% for the largest beam intensity. We attributed this discrepancy to other long-term effects, such as the decrease in the
transparency due to the radiation damage induced by impinging hadrons. In order to check this hypothesis, we analyzed data collected during two low-intensity muon runs taken just before and just after the intensity scan, observing a decrease in the MIP peak position of approximately 4.5 %. This value is comparable to observed
reduction observed in the intensity scan. As such, we did not attempt a fit to the data to extract a quantitative estimate
, but we just observe that the data trend is qualitatively consistent with the expectations from the simplified model discussed above, with a modest decrease of the MIP peak position at the highest beam intensities, slightly larger than that predicted from the value of
for this configuration. A more precise evaluation of
in realistic beam conditions is postponed to the future PKR-CAL measurement, where a dedicated laser calibration system, currently in preparation, will allow us to quantify precisely the radiation-induced transparency degradation of
.



 ,
,