Abstract
This study investigated the impact of samarium and lanthanum fluorides (SmF3 and LaF3) on the physical and mechanical properties of Tl0.8Hg0.2Ba2Ca2−xRxCu3O9−δ−yFy superconducting phases (specifically the (Tl, Hg)-1223 phase), where R = Sm and La, with . The superconducting samples were synthesized using the solid-state reaction method. X-ray diffraction (XRD) verified the formation of the (Tl, Hg)-1223 phase without altering its tetragonal structure. Scanning electron micrographs (SEM) reveal the improvement of the grain size and inter-grain connectivity as Sm and La contents increased up to . The electrical properties of (Tl, Hg)-1223 were studied using I-V and electrical resistivity measurements. Improved superconducting transition temperature (Tc) and transport critical current density (Jc) were observed up to , beyond which they decreased substantially. Vickers microhardness (Hv) measurements were performed at room temperature to investigate their mechanical performance with various applied loads ( N) and times (s). For both substitutions, the mechanical properties were enhanced up to an optimal value at . All samples exhibited normal indentation size effect (ISE) behavior. The proportional sample resistance (PSR) model best explained Hv values among five theoretical models. Dislocation creep was the primary creep mechanism in the samples, according to indentation creep studies.
1. Introduction
Research on high-temperature superconductors (HTSCs) has been a central focus since their initial discovery in 1986 by Bednorz and Müller [1]. Since then, scientists have been dedicated to advancing the understanding and applications of HTSCs, aiming to discover even higher-temperature superconductors and unravel their potential applications. The superconducting phases MBa2Ca2Cu3O9-δ, where M = Tl or Hg, are among the most intriguing compounds in the HTSCs families and are frequently identified as Tl-1223 and Hg-1223, respectively. These materials are distinguished by their elevated superconducting transition temperature (Tc), strong pinning efficiency, and irreversible fields that are pushed to higher levels [2]. Because of these properties, the Tl-1223 and Hg-1223 phases have the potential to be desirable materials for creating superconducting wires, tapes, and thin films [3]. These applications are critical in fields like sensors, electronics, power lines, and magnetic shielding devices, demonstrating HTSCs’ adaptability and promise in current technology [4]. However, there are challenges in the manufacture of Tl-1223 and Hg-1223 superconductors due to the toxicity of thallium and mercury oxides and their instability at high temperatures [5,6]. Moreover, because these materials are not conventional superconductors, the possibilities for obtaining even higher superconducting transition temperatures by this technique remain unclear. Conventional HTSCs exhibit remarkable electrical conductivity without resistance at increased temperatures when compared to their traditional counterparts [7]. Investigating their properties and underlying mechanisms is essential for advancing our understanding of superconductivity and exploring potential applications in diverse fields. The Bardeen–Cooper–Schrieffer theory of conventional superconductivity provides insights for reaching high Tc with no theoretical upper limit, requiring a favorable combination of high-frequency phonons, strong electron–phonon coupling, and a high density of states [8,9]. The study of electron–phonon coupling in superconductors is still very significant in current research. Electron–phonon coupling is critical in defining the mechanism of superconductivity in specific materials. Doping specific elements in various positions in their structure may aid in their synthesis and help stabilize the phases [2]. The volume fraction of the Tl1−xHgxBa2Ca2Cu3O9 superconducting phase was increased, and Tc was raised from 120 K to 130 K, according to Chang et al. [10]. Furthermore, the increase in Tl-content from to enhanced the intergrain critical current density (Jc) in Hg1−xTlxBa2Ca2Cu3O9−δ [11].
Rare-earth (RE) replacements at the Ca site enhanced the superconducting characteristics for low substitution concentration and degraded superconductivity for greater substitution content [12]. Research has extensively examined the superconducting characteristics of numerous high-temperature superconducting phases substituted by Sm3+ and La3+ ions [12,13,14]. Sm substitution in Tl0.8Hg0.2Ba2Ca2−xSmxCu3O9−δ reduced the phase transition temperature while increasing the inter-grain critical density until x = 0.05 and then decreased it [12]. Samarium (Sm) substitution improved both Jc and Tc in the (Bi, Pb)-2212 phase [13]. Pr and La substitutions with lower substitution content at Ca sites of the (Cu0.5Tl0.5)-1223 superconductor phase increased volume fraction and Tc [14]. In terms of manufacturing conditions and product design factors, improving the mechanical characteristics of HTSCs is crucial from a technological and financial perspective. Many researchers investigated the influence of fluorine (F) doping on HTSC characteristics [15,16]. The effect of PbF2 doping on the structural, electrical, and mechanical properties of (Bi, Pb)-2223 was investigated by Anas [15]. XRD and SEM analysis revealed that x = 0.10 resulted in the greatest volume fraction and largest grain size. Furthermore, Tc, Jc, and Hv measurements revealed that the sample with x = 0.10 had the best electrical and mechanical characteristics. Hamdan et al. [16] investigated the impact of fluorine on high-temperature superconductors (Tl0.5Pb0.5)Sr1.6Ba0.4Ca2Cu3Oy. By partially substituting CuO with CuF2 in the initial materials with fluorine concentration , the formation of the Tl-1223 phase was enhanced. This substitution also led to an increase in the superconducting transition temperature to 128 K and a remarkable 300% improvement in the critical current density when compared to the fluorine-free sample.
Previous research has demonstrated that both chemical addition and substitution may be used to improve the mechanical characteristics of such materials [17,18,19,20]. Mohammed et al. [17] conducted comparative research on the impact of nano-SnO2 and nano-In2O3 addition on (CuTl-1223) superconductors. The results revealed that adding nano-SnO2 up to wt% increased the mechanical characteristics of (CuTl-1223); however, only a small quantity of nano-In2O3, wt% improved the phase’s microhardness. Awad et al. [18] studied the mechanical characteristics of Cu0.5Tl0.5Ba2Ca2−xPrxCu3O10 at room temperature using Vickers microhardness tests. The results revealed that the substituting of Pr in the Ca site raised the Tc value from to K and increased the volume fraction up to, after which they dropped. Vickers microhardness values (Hv) and Young’s modulus, on the other hand, decreased with Pr content. Furthermore, it was discovered that the indentation-induced cracking model was the most accurate model to illustrate the Vickers microhardness behavior of these samples. Mohammed and Jasim [19] investigated the structural, electrical, and mechanical properties of Tl0.5Pb0.5Ba2Ca2Cu3-xNixO9-δ using a nickel oxide substitution. The results indicated that the optimal Tc value was achieved for where Tc recorded K. Furthermore, increasing Ni concentration strengthens the interlayer bonding as seen by the increase in HV, elastic modulus (E), and yield strength (Y) values. Khattar et al. [20] used PbO and PbO2 to compare the influence of Pb substitution at the thallium site of the Tl0.8-xHg0.2PbxBa2Ca2Cu3O9−δ superconductor phase. The result showed that both forms of lead ion substitution increased the formation of the (Tl, Hg)-1223 superconducting phase. Tc increased to its maximum for PbO and PbO2. Furthermore, the microhardness findings of PbO replaced materials show a diminishing behavior as x rises, whereas HV is boosted for for PbO2 substituted samples.
The purpose of this work is to investigate the influence of SmF3 and LaF3 substitution on the structural, electrical, and mechanical characteristics of the superconductor phase Tl0.8Hg0.2Ba2Ca2−xRxCu3O9−δ−yFy, where R = Sm and La with and. X-ray diffraction (XRD) and scanning electron microscopy (SEM) were employed to examine the microstructure and morphology of the samples. The electrical properties of all samples were investigated using resistivity (ρ-T) and I-V characteristics. Mechanical behavior was studied through Vickers microhardness measurements under varying loads and times.
2. Experimental Techniques
2.1. Sample Preparation
Superconducting samples of the nominal composition Tl0.8Hg0.2Ba2Ca2−xRxCu3O9−δ−yFy were synthesized using solid-state reaction techniques, where R = Sm and La. The samples had varied doping levels: andInitially, Tl2O3, HgO, BaO2, CaO, CuO, SmF3, and LaF3 high-purity powders (Sigma–Aldrich with purity greater than 99%) were weighed in appropriate ratios by using a sensitive balance. To compensate for the thallium and mercury losses during the heating process, an excess of 10% Tl2O3 and HgO were added [21]. Then, the powders were mixed and well crushed for around 30 min in an agate mortar to produce fine powder, which was then sifted through a 60 µm sieve to tone the mixture. Using a hydraulic press, 1.5 cm diameter pellets were obtained and carefully coated in silver foil to minimize the loss of thallium and mercury during the heating process. The samples were put in a quartz tube and heated in the box furnace to 993 K at a rate of 4 K/min, followed by further heating to 1133 K at a rate of 2 K/min. They were maintained at this temperature for a duration of 5 h before gradually cooling to room temperature at a rate of 2 K/min.
2.2. Samples Characterization and Measurements
The structure and phase characterization were determined using the XRD measurement method on a Bruker D8 focus diffractometer with Cu Kα radiation ( Å) in the range. However, the microstructure morphology of the samples was examined using a scanning electron microscope (AIS 2100C). The images were obtained at a magnification of 5000×. The electrical resistivity was measured using the traditional four-probe method, and the temperature was reduced from K down to K using liquid nitrogen. The critical current density Jc was calculated using I-V curves at liquid nitrogen temperature (77 K). For mechanical investigation, room temperature Vickers microhardness tests were conducted using MHVD-1000IS with applied static loads ranging from to N from to s.
3. Results and Discussion
3.1. Sample Investigation
Figure 1 depicts X-ray powder diffraction patterns and the Rietveld refinement for Tl0.8Hg0.2Ba2Ca2−xRxCu3O9−δ−yFy superconductor samples, where R = Sm and La with andBased on the XRD scans, the distinct and sharp diffraction peaks observed are in excellent agreement with the tetragonal structure of the (Tl, Hg)-1223 phase, characterized by the P4/mmm space group. These peaks dominate over any impurities or alternative superconducting phases present in the samples [22]. The existence of secondary low-intensity peaks indicates the presence of impurity phases, such as the (Tl, Hg)-1212 phase, BaHgO2, BaCuO2, and CaHgO2 [23]. Such impurities are formed as a result of fluctuations in the partial pressure of oxygen throughout the preparation procedure [14]. The vapor pressure increased during the heating procedure because the samples were processed in closed quartz with air rather than a vacuum. According to XRD examination, the partial replacement of Ca2+ by Sm3+ and La3+ ions did not change the tetragonal structure of the superconducting samples. This is demonstrated by the comparable X-ray pattern and the execution of the Rietveld refinement for all the produced specimens by the MAUD software, as illustrated in Figure 1. The relative volume fractions of (Tl, Hg)-1223, (Tl, Hg)-1212, BaHgO2, BaCuO2, and CaHgO2 were estimated using the MAUD software. Figure 2 depicts the volume fraction of the superconducting phases (Tl, Hg)-1223 and (Tl, Hg)-1212, as well as all other impurities in both replacements. Figure 2 shows that the volume fractions of the replaced samples were higher than those of the pure specimen in both substitutions. The SEM images, which are examined in further detail below, show that this improvement can be attributed to a rise in grain connection following replacement. The lattice parameters a and c were estimated using the MAUD software after the Rietveld refinement of the XRD patterns. Figure 3a,b shows the fluctuation of a and c with Sm and La contents, respectively. Depending on the concentration of Sm and La, it was discovered that the lattice parameter values were different from those of the unsubstituted sample. As the Sm and La contents rise, the lattice parameter a elongates. This elongation is most probably induced by the enlargement of the Cu-O plane, which occurs by the introduction of an electron into the antibonding orbital as a result of the partial substitution of Ca2+ ions by Sm3+ and La3+ ions [12]. The elongation rate of a is predicted to be (da/dx) = and , respectively, with increasing Sm and La contents. On the other hand, when the amount of Sm and La increases, the value of c drops. This reduction is assumed to be because the ionic radii of Sm3+ ( Å) and La3+ (Å) are less than those of Ca2+ ions ( Å) [24,25]. Furthermore, an increase in fluorine might explain the reduction in the lattice parameter c. This is due to two possible factors: first, fluorine has a slightly lower ionic radius (1.47 Å) than oxygen (1.52 Å), and second, fluorine has a greater electronegativity (3.98) than oxygen (3.44) [15]. The contraction rate of c is expected to be (dc/dx) = and as Sm and La content increases, respectively. This suggests that the lattice parameter a experiences less elongation compared to the contraction rate reported for the lattice parameter c. This implies that the Cu-O bond length is greater within the planes (xy planes) than in the direction perpendicular to the xy planes [12].
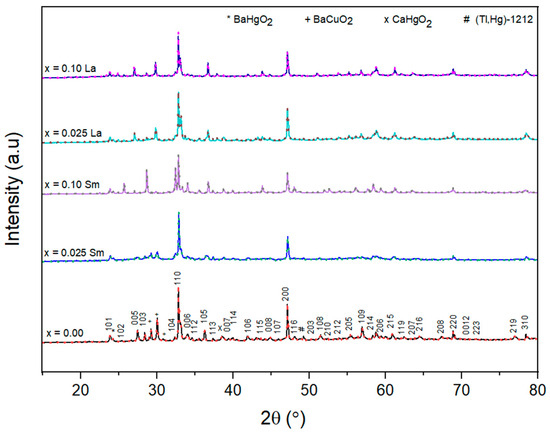
Figure 1.
Typical XRD patterns and the Rietveld refinements of the XRD spectra for Tl0.8Hg0.2Ba2Ca2−xRxCu3O9−δ−yFy superconductor samples, where R = Sm and La.
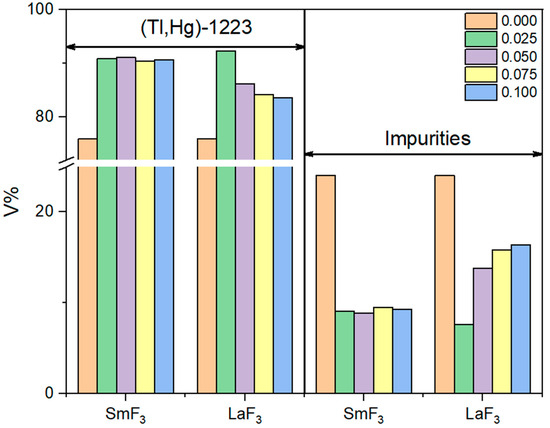
Figure 2.
Variation of volume fractions (V %) versus SmF3 and LaF3 contents of the (Tl, Hg)-1223 phase and the (Tl, Hg)-1212 impurity phase with all other impurities.
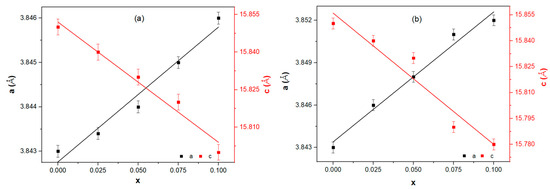
Figure 3.
The variation of lattice parameters a and c for Tl0.8Hg0.2Ba2Ca2−xRxCu3O9−δ−yFy as a function of the substitution content x, where (a) R = Sm and (b) R = La.
The scanning electron microscope (SEM) micrographs of Tl0.8Hg0.2Ba2Ca2−xSmxCu3O9−δ−yFy and Tl0.8Hg0.2Ba2Ca2−xLaxCu3O9−δ−yFy, with andare depicted in Figure 4. The presence of rectangular plates in the sample’s structure indicates the formation of the (Tl, Hg)-1223 phase, as indicated by previous studies [12,20]. It is worth noting that the rectangular form remains stable as the substitute content increases. Conversely, the low replacement of Sm and La, with , promotes the formation of the (Tl, Hg)-1223 plates, enhances their alignments, and decreases porosity among the superconducting grains. Figure 4 shows that as the replacement content of Sm and La increases, so does the number of irregular forms and porosity.
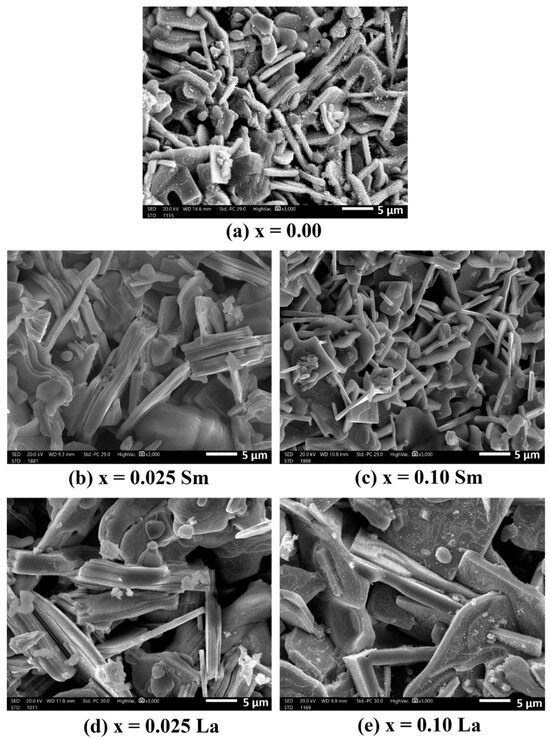
Figure 4.
Micrographs of (a) Tl0.8Hg0.2Ba2Ca2Cu3O9−δ, (b) Tl0.8Hg0.2Ba2Ca1.975Sm0.025Cu3O9−δ−yFy, (c) Tl0.8Hg0.2Ba2Ca1.9Sm0.1Cu3O9−δ−yFy, (d) Tl0.8Hg0.2Ba2Ca1.975La0.025Cu3O9−δ−yFy, and (e) Tl0.8Hg0.2Ba2Ca1.9La0.1Cu3O9−δ−yFy.
3.2. Electrical Transport Measurements
3.2.1. Electrical Resistivity Measurements
Figure 5 illustrates the temperature dependence of the resistivity measurements for the Tl0.8Hg0.2Ba2Ca2−xRxCu3O9−δ−yFy superconducting phase, where R = Sm and La, with and. The measurements were carried out at temperatures ranging from , where T0 represents the zero superconducting transition temperature. At high temperatures, all samples displayed metallic variation, which was followed by the superconducting transition at lower temperatures. Once Tc is reached, the resistivity curves rapidly decline until they approach the zero superconducting transition temperature (T0). Tc is commonly obtained from the derivative of ρ(T) with respect to T, where the maximum of dρ(T)/dT corresponds to Tc, as shown in the inset of Figure 5. It can be observed from Table 1 and Figure 5 that Tc shows an increase from K to K for Sm substitution and K for La substitution as the value of x changes from to . However, as x continues to increase, Tc starts to decrease. The same behavior is observed for T0 with the variations in Sm and La content. Consequently, when Sm and La are substituted at the optimal content of , it leads to an enhancement in the superconducting transition temperature of the (Tl, Hg)-1223 phase.
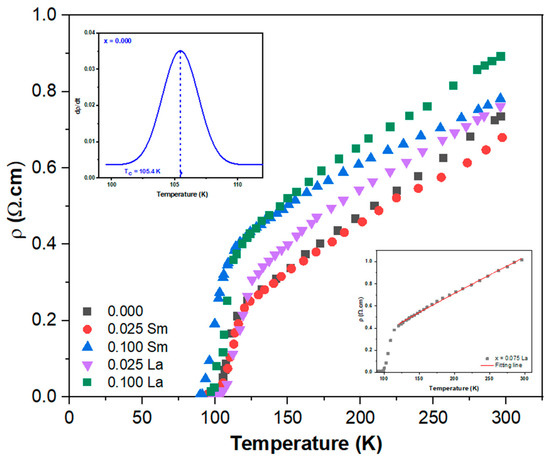
Figure 5.
Variation of resistivity versus temperature plots for the Tl0.8Hg0.2Ba2Ca2−xRxCu3O9−δ−yFy phase, with , where R = Sm and La.

Table 1.
Different superconducting parameters for Tl0.8Hg0.2Ba2Ca2−xRxCu3O9−δ−yFy composites, with , where R = Sm and La.
The rise in Tc and T0 in both replacements up to may be attributable to a reduction in weak connections between grains, as demonstrated by SEM micrographs [26]. Furthermore, the reduction in the number of holes in CuO2 planes caused by the partial substitution of Ca2+ ions by Sm3+ or La3+ ions may be the cause of the increase in Tc. Moreover, because Tc was observed to climb with increasing O loss, removing oxygen from the structure by F substitution resulted in a decrease in hole concentration and optimization of the superconducting characteristics [15]. Therefore, at , the unsubstituted sample is changed from an over-doped sample to an optimally doped sample. Conversely, the gradual decrease in Tc observed for values of may be attributed to factors such as oxygen vacancy disorder and trapping of mobile carriers [27]. Furthermore, when x > 0.025, the transition from optimally doped to underdoped samples may be the source of Tc suppression [28].
The variation in electrical resistivity with temperature data is well-fitted by Matthiessen’s rule [29]:
where is the resistivity temperature coefficient, and ρ0 is the residual resistivity. Table 1 provides the values of fitting parameters for ρ0, α, and ρn (room-temperature resistivity) and the superconducting transition width (∆T = Tc − T0) for all samples. The parameter ρ0 reflects the defect density and homogeneity of the samples, while for α, it undergoes a slight change with x due to the influence of CuO2 planes on charge carriers [30]. The substitution of Sm and La leads to a decrease in ρn, observed up to for Sm substitution and for La substitution. This decrease can be attributed to improved inter-grain connectivity and reduced grain boundaries resulting from the replacements. Conversely, an increase in ρn corresponds to a higher number of scattering centers and weakened intergranular coupling [26]. The broadening of the transition width ΔT is likely due to increased inhomogeneities and transition temperatures of Tl-1223 superconducting grains resulting from the substitution of Sm and La [31].
The Debye temperature , a crucial parameter in understanding the lattice dynamics of a material and can be deduced from the normal part fit of resistivity data, as shown in the inset of Figure 5 using the Bloch–Grüneisen (BG) equation [32]:
where B is a fitting parameter; the obtained values of are listed in Table 1. for (Tl, Hg)-1223 is clearly lower than for Tl-1223 ( = 503.7 K) [33]. This is due to the presence of both Hg and Tl in the charge reservoir of (Tl, Hg)-1223, which makes the reservoir conductive and the conducting layer thicker. It is seen that exhibits the same behavior as Tc, confirming the validity of the relationship between and Tc [34]:
where λ is the phonon–electron coupling and μ is the repulsive screened coulomb part, with values ranging from 0.1 to 0.15. The values of λ are listed in Table 1. It is obvious that the values of λ are less than unity for all tested samples, indicating weak electron–phonon coupling [34].
3.2.2. Critical Current Density (Jc) Measurements
The transport critical current density Jc is used to measure the current carrying capability of the produced superconducting samples. In the Tl0.8Hg0.2Ba2Ca2−xRxCu3O9−δ−yFy superconducting phase, Figure 6 shows the relationship between the electric field E and the current density J, with the inset displaying their logarithmic representations. These figures demonstrate the impact of Sm and La substitutions with x values of and , utilizing a threshold of 1 μV/cm [35]. The acquired E–J curves are explored using the following relationship [36]:
where β and n are material constants. The curves’ behavior can be explained in the following manner: In the initial section of the curve, where the current is insufficient to cause vortex pair unbinding, the system exhibits zero voltage (V(I) = 0), indicating a resistance-less state [37]. In the subsequent part of the curve, characterized by low voltage values, the presence of free vortices below Tc is attributed to a limited penetration depth that is resolved by thermally aided flux flow. The nonlinear segment of the curve shows a voltage drop occurring at a specific applied current value (Ic), described by flux creep (Lorentz force FL = Pinning force FP). The final portion of the curve demonstrates an increase in the linear trend, resulting from vortex pair unbinding induced by a strong Lorentz force (), explained through flux flow theories [38]. Various factors, including porosity, crystal structure, oxygen deficiency, grain morphology, relative volume fraction, and the presence of different elements, can influence both Jc and Tc. The n values or transition indices of a superconductor characterize its homogeneity. The log(E)-log(J) curves were used to calculate these values. The predicted n values for samarium substituted samples range from 4.2 to 9.2 and from 4.2 to 11.5 for lanthanum substituted samples. More homogeneous superconductors have higher n values [23]. Figure 7 also shows the relationship between Tc and Jc of the produced samples as a function of Sm and La concentration. Jc clearly followed the same pattern as Tc with x. Jc rises from roughly A/cm2 for the pure sample to A/cm2 and A/cm2 for of Sm and la, respectively, as shown in Figure 6 and Figure 7. This improvement might be attributed to Sm and La replacements functioning as pinning centers to stabilize vortices and improve inter-grain and intergranular flux pinning [39,40]. However, La has a bigger influence on the flux pinning and critical current density of the prepared samples than Sm. This is likely a result of lattice defects introduced by partially replacing La3+ with Ca2+, which appears to be more effective than substituting Sm3+ with Ca2+ in enhancing flux pinning and grain coupling [12]. When Sm and La contents grow (), Jc falls and reaches A/cm2 for and A/cm2 for . This is attributable to several causes, including a rise in impurity content, the occurrence of voids among grains, grain alignment disorder, a reduction in the volume fraction of (Tl, Hg)-1223 superconductors, and a decrease in inter-grain connection [26,41].
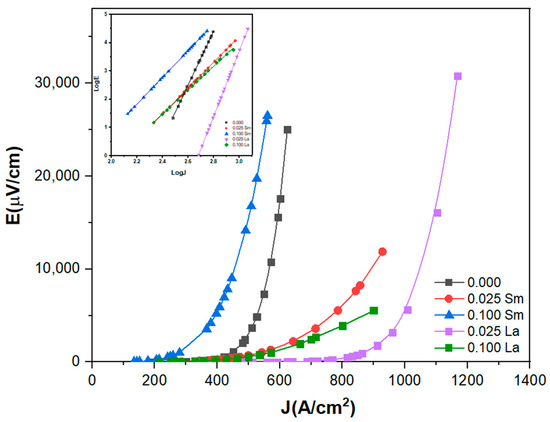
Figure 6.
The electric field variation as a function of the critical current density for Tl0.8Hg0.2Ba2Ca2−xRxCu3O9−δ−yFy superconducting samples, with , where R = Sm and La. The inset represents the logarithmic plots of (E) versus (J).
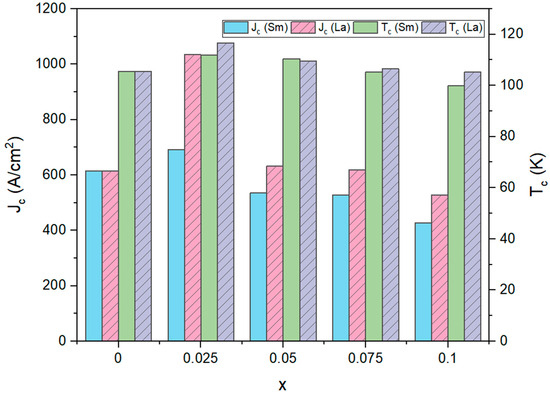
Figure 7.
Variations of Tc and Jc versus x for the Tl0.8-xHg0.2Ba2Ca2−xRxCu3O9−δ−yFy superconducting phase, with , where R = Sm and La.
3.3. Vickers Microhardness Measurement Examination
Numerous practical applications are limited by the weak mechanical characteristics of HTSCs. This is due to the oxide compounds’ lack of slip planes, which kills the ductility of HTSCs and increases their brittleness [15]. Using a digital microhardness tester at room temperature, many microhardness measurements have been performed on the surface of the manufactured superconducting samples in order to examine their mechanical characteristics. The load-dependent Vickers microhardness (Hv) was estimated with the relationship [42]:
where d is the diagonal length in μm, and F is the applied load in Newton (N). Figure 8a,b demonstrated the variation of HV values as a function of applied force at a dwell time of 20 s for the Tl0.8Hg0.2Ba2Ca2−xRxCu3O9−δ−yFy phase, where R = Sm and La with and, respectively. According to the graph, HV values exhibit two different behaviors as applied load (F) increases: a fast reduction in HV values in the applied force up to 2.94 N, followed by steady saturation (plateau region) at higher applied forces. This nonlinear behavior has been observed in various literature [43,44,45,46]. This behavior is commonly referred to as a normal indentation size effect NISE and is associated with the weak grain boundaries found in ceramic materials [45]. This effect results in large microhardness values for small indentation forces and small microhardness values for large indentation forces. This trend suggests that the microhardness value may have been lowered due to weak grain boundaries under strong indentation pressures. However, the measured hardness is large when indentation loads are small, leading to the conclusion that this condition indicates a single crystal state without interference from grain boundaries. At the lowest load, elastic recovery dominates in prepared samples, but beyond that, plastic deformation takes over as the main characteristic of the materials. As a result, all prepared samples undergo both plastic and elastic deformations simultaneously [47].
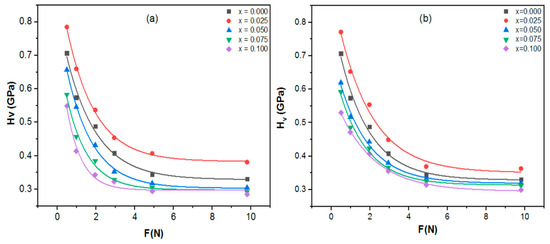
Figure 8.
The variation of HV as a function of the applied indentation test loads F of Tl0.8Hg0.2Ba2Ca2−xRxCu3O9−δ−yFy; (a) R = Sm (b) R = La at a dwell time of 20 s.
Furthermore, as demonstrated in Figure 8a,b, the Vickers microhardness values of all superconducting samples vary unsystematically with La and Sm concentrations. However, for Sm and La substituted at , HV achieved the highest values compared to the pure sample and all substituted samples. This indicated that LaF3 and SmF3 had a considerable impact on enhancing the microhardness of the samples at low doping levels. This enhancement is explained by increased grain connectivity as a result of decreased porosity, which increases sample resistance to fracture propagation among grains [23], as also supported by the SEM results. On the other hand, higher Sm, La, and F contents are associated with a drop in microhardness values. This behavior might be linked to an increase in irregular orientation at grain boundaries, void density, as well as specimen cracking, and disorders [48].
3.3.1. Meyer’s Law
Meyer’s law is one of the greatest standards for defining the mechanical characteristics of a solid, describing an empirical link between the size of the hardness test indentation and the load necessary to produce the indentation. The relationship between the applied load (F) and the indentation diagonal length (d) is as follows [49]:
where the exponent n is known as Meyer’s index, which characterizes the ISE, and A′ is a constant that represents the load required to begin unit indentation. The NISE is present for , but the reverse ISE is present for . As shown in Figure 9a,b, the plots of ln(F) vs. ln(d) may be used to determine the values of A′ and n. A′ is calculated from the y-intercept, and n is represented by the slope of the linear plot. The values of these parameters are reported in Table 2. The values of n are clearly shown to be smaller than 2 for all the superconducting samples, indicating that the produced samples confirm NISE behavior [15]. Additionally, the value of n may be used to categorize the hardness of a material if the values of n for all samples are , designating these materials as hard materials; otherwise, it is considered soft [50]. Table 2 classified all produced samples as “hard materials” and supports the ceramic behavior of HTSCs.
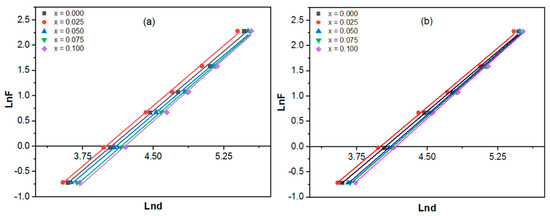
Figure 9.
versus for the (a) Sm-substituted samples and (b) La-substituted samples at a dwell time of 20 s.

Table 2.
The fitting parameters derived from the theoretical models for the Tl0.8Hg0.2Ba2Ca2−xRxCu3O9−δ−yFy phase with R = Sm and La and 0.
3.3.2. Hays–Kendall Approach
According to the Hays–Kendall (HK) method [51], there exists a specific test load threshold denoted as sample resistance pressure “W”. This threshold serves to differentiate between two deformation stages. When the applied load exceeds “W”, plastic deformation occurs, while below “W”, only elastic deformation is observed. As a result, the effective load becomes Feff = F − W. Then, the following rule represents the load dependency of indentation size [15]:
where A1 denotes a load-independent coefficient. A1 and W may be calculated by graphing (F) versus (d2), as shown in Figure 10a,b, where A1 is the slope and W is the y-intercept. Table 2 displays the values of these parameters. All the samples have positive W values, suggesting that the imposed load was adequate to cause both elastic and plastic deformation. The Hays–Kendall microhardness (HHK) could be calculated by using the corrected load.
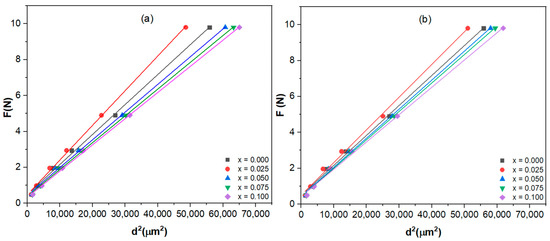
Figure 10.
Applied loads F versus the square of the impression length for the superconducting samples with (a) Sm substitution and (b) La substitution.
3.3.3. Elastic/Plastic Deformation Model
Another helpful model to characterize the superconducting materials exhibiting the ISE behavior is the elastic/plastic deformation (EPD) approach [52]. The indentation size would decrease to a certain amount upon the removal of the applied load. This assumes that elastic recovery occurs; hence, an elastic component could be considered and applied to the plastic indentation diagonal. Consequently, the relationship between indentation size and applied load is explained by [53]:
d0 stands for the d adjustment resulting from both a blunt indenter tip and elastic recovery connected to new regions of plastic deformation, where A2 is the load-independent constant. The values of the parameters A2 and d0 are determined from the plot of F0.5 versus d, as shown in Figure 11a,b. The slope of the plotting corresponds to A2 and the y-intercept term to d0, and their values are reported in Table 2. All the samples had positive d0 values. This indicates that for this range of applied stresses, both elastic and plastic deformation are visible and elastic relaxation exists. Hence, elastic and plastic deformation, as well as elastic relaxation, are evident for this range of applied stresses [15].
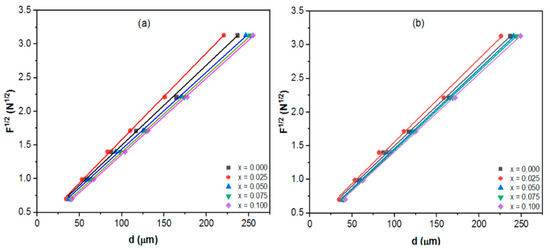
Figure 11.
Variation of F0.5 against d for the Tl0.8Hg0.2Ba2Ca2−xRxCu3O9−δ−yFy phase at a dwell time of 20 s; (a) R = Sm (b) R = La.
Using the following equation, the elastic/plastic deformation technique is used to compute the load-independent microhardness (HEPD) values:
3.3.4. Proportional Specimen Resistance (PSR) Model
The proportional sample resistance (PSR) model is an enhanced version of the Hays–Kendall approach by replacing the load-independent constant “W” with αd term. Li and Bradt [54] introduced this model, which is employed to identify whether materials demonstrate ISE or RISE behavior. The Vickers hardness values, both load-dependent and load-independent, for the PSR model can be calculated using the following equation [23]:
where α is the surface energy, and the variation in the α value corresponds to the dispersion of the energy along the cracks on the surface [15]. The constant β represents the true microhardness of a material in relation to its plastic properties. Parameters α and β can be evaluated through the graph F/d versus d in Figure 12a,b, where β is the slope and α is the y-intercept, and their values and listed in Table 2. All samples have the ISE characteristic since the parameters α have positive values, demonstrating that elastic deformation always outperforms plastic deformation in all samples [47]. The following formula is used to represent the load-independent microhardness values in the PSR model (HPSR):
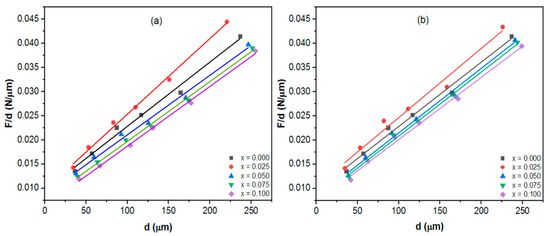
Figure 12.
F/d versus d for the Tl0.8Hg0.2Ba2Ca2−xRxCu3O9−δ−yFy phase at a dwell time of 20 s; (a) R = Sm (b) R = La.
3.3.5. Modified Proportional Specimen Resistance Model (MPSR)
The PSR model was updated into the following equation to take into consideration the effect of the machining-induced plastically deformed surface on the micro-hardness data [55]:
where α2 is the smallest applied force that indentations in the samples are caused by. It relates the residual surface tensions brought on by polishing and grinding the sample’s surface to the threshold load constant “W” of the Hays–Kendall model. α3 and α4 parameters have the same physical meaning as in the PSR model [56]. The change of F with d for the Tl0.8Hg0.2Ba2Ca2−xRxCu3O9-δ−yFy phase is shown in Figure 13. Table 2 lists the MPSR parameters α2, α3, and α4 that were determined using a standard polynomial fitting procedure applied to the data. The samples exhibit both elastic and plastic deformation, as seen by the positive values of α2 [57]. Additionally, the α4 parameter increased from 1.44 × 10⁻⁴ N/μm2 for the pure sample to the maximum value of 1.63 × 10⁻⁴ N/μm2 for the Sm substitution and 1.60 × 10⁻⁴ N/μm2 for La substitution at . Then, when Sm and La content increased further, α4 declined until it reached the minimum value at the highest value of substitution . The optimal replacement value promotes stabilization in the stable tetragonal phase, which is consistent with the overall mechanical characteristics [58].
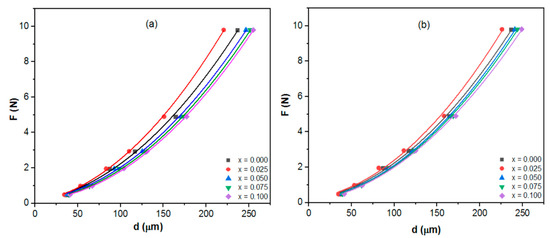
Figure 13.
F versus d for the Tl0.8Hg0.2Ba2Ca2−xRxCu3O9−δ−yFy phase at a dwell time of 20 s; (a) R = Sm (b) R = La.
To calculate the MPSR load-dependent microhardness (HMPSR), the following equation was utilized:
The comparison between the experimental and theoretical estimated values of microhardness are shown in Figure 14 and Figure 15a–e for Tl0.8Hg0.2Ba2Ca2−xRxCu3O9−δ−yFy (R = Sm and La) with and . When the results of the stated microhardness models are examined, it is evident that both the PSR and MPSR models align closely with the experimental data, particularly at higher loads. However, at lower applied loads, the PSR Model exhibits minimal divergence compared to other models (). This conclusion might be attributed to the low needed minimum applied load α2 values as a result of the flawless finishing of all manufactured samples [20]. The PSR model is applicable to both phases. This is supported by SEM images, which demonstrate that reducing the spacing between grains leads to a greater contact area between grains, subsequently elevating surface energy. Consequently, this increased surface energy acts to resist the movement of the indenter through the samples.
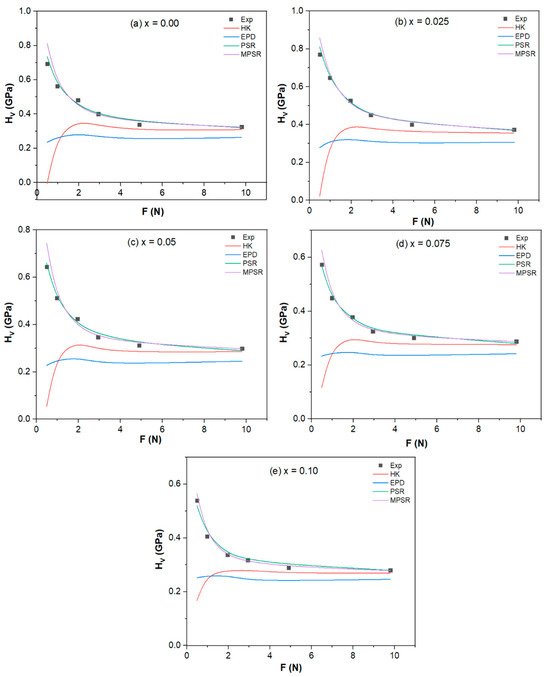
Figure 14.
Variations of the measured HV and estimated HV using various models with the applied load F of the Tl0.8Hg0.2Ba2Ca2−xSmxCu3O9−δ−yFy phase, with (a) , (b) , (c) , (d) , and (e) .
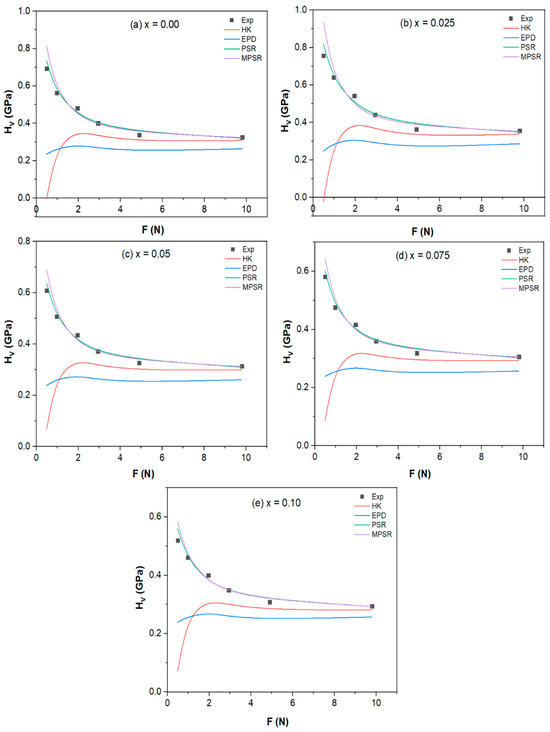
Figure 15.
Variations of the measured HV and estimated HV using various models with the applied load F of the Tl0.8Hg0.2Ba2Ca2−xLaxCu3O9−δ−yFy phase, with (a) , (b) , (c) , (d) , and (e) .
The elastic modulus (E), yield strength (Y), and fracture toughness (K) are all linked to real Vickers microhardness (Hv), as shown in the formulas below [57].
Figure 16a,b illustrates the fluctuation of the mechanical parameters E, Y, and K for the Tl0.8Hg0.2Ba2Ca2−xRxCu3O9−δ−yFy phase with R = Sm and La composites. The results show that E, Y, and K exhibit a similar trend as the variation of Hv as function x in both replacements. Zewen et al. [59] investigated the relationship between elastic modulus and critical grain size to determine the threshold grain size at which microcracking occurs due to anisotropic thermal stresses that arise during processing. The greater the sample’s E and Y values, the stronger the binding between atoms or molecules in the material. The fracture toughness K is a measure of the material’s ability to resist cracks. The rise in K is connected to the rise in surface energy. Thus, to improve the mechanical characteristics of the (Tl, Hg)-1223 superconductor phase, the optimal level of Sm and La substitution must be no more than .
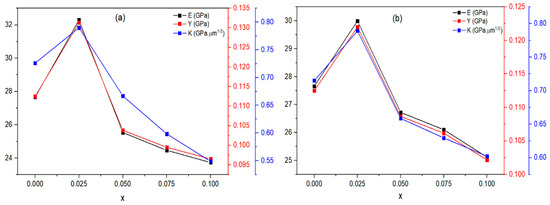
Figure 16.
Variation of the mechanical parameters E, Y, and K for the Tl0.8Hg0.2Ba2Ca2−xRxCu3O9−δ−yFy phase with respect to x for (a) R = Sm (b) R = La.
3.3.6. Indentation Creep
To investigate the indentation creep behavior of Sm and La replacements in Tl0.8Hg0.2Ba2Ca2−xRxCu3O9−δ−yFy, indentation creep investigations were conducted at room temperature. These investigations involved applying a constant load and examining the time-dependent penetration of a hard indenter into the material. Figure 17 and Figure 18 showed the variation HV with dwell time (10–90 s) at loads of 2.94 N (Figure 17 and Figure 18a), 4.9 N (Figure 17 and Figure 18b), and N (Figure 17 and Figure 18c), with . As the dwell duration increases, HV experiences a sharp initial decline, followed by a consistent linear decrease as time increases. Such a phenomenon is explained by the bearing creep indentation [60]. The Sargent–Ashby model [61] was employed to explore the power-law indentation creep behavior, and the link between time-dependent microhardness and creep is as follows:
where Hv(t) is the time-dependent Vickers microhardness, σ0 is the strain rate at reference stress r0, c is the constant, and η is the stress exponent. η can be calculated from the plot of ln HV versus ln t with a slope of (−1/η) as illustrated in Figure 19 and Figure 20 and listed in Table 3. Furthermore, η values are helpful to establish the mechanisms controlling the deformation. Diffusion creep is associated with η values close to 1 [62], grain boundary sliding with η values close to 2 [63], and dislocation climbing with η values in the range of 4–6 [64]. When the values of η are between 3 and 10, dislocation creep is the dominant mechanism [65]. From Table 3, it is obvious that the dislocation creep is the dominant process taking place in the samples where . Furthermore, large values observed in Sm substituted samples were thought to be in the power law breakdown zone [66].
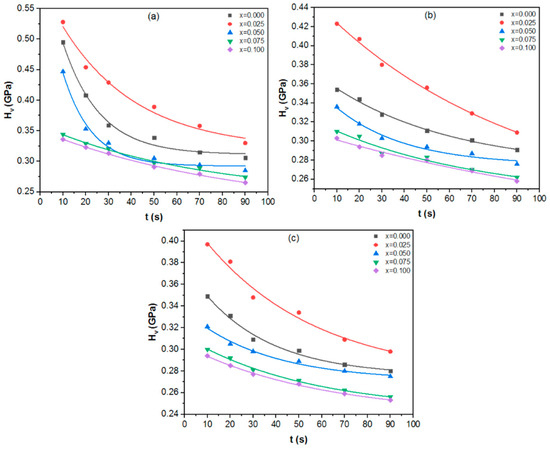
Figure 17.
Variation of HV versus time at applied loads of (a) N, (b) N, and (c) N for the Tl0.8Hg0.2Ba2Ca2−xSmxCu3O9−δ−yFy phase.
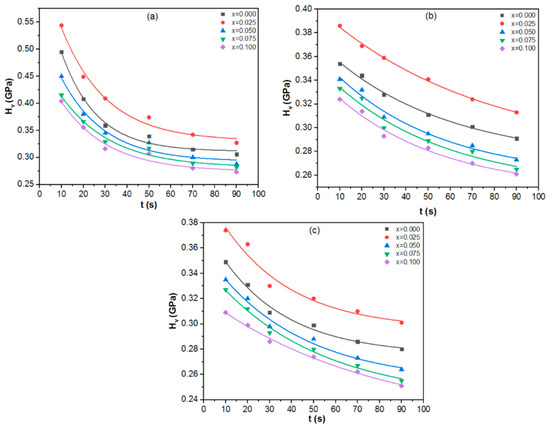
Figure 18.
Variation of HV versus time at applied loads of (a) N, (b) N, and (c) N for the Tl0.8Hg0.2Ba2Ca2−xLaxCu3O9−δ−yFy phase.
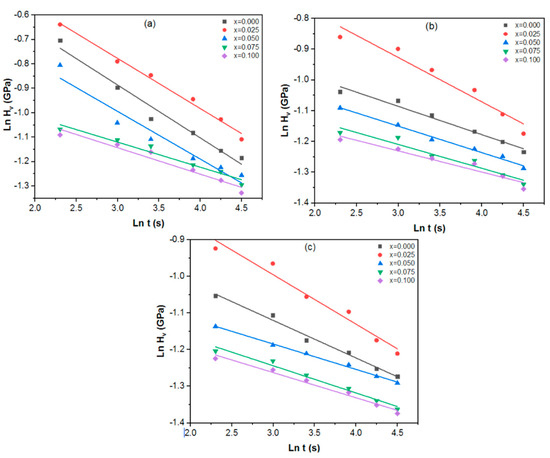
Figure 19.
Variation of ln HV versus ln t at applied loads of (a) N, (b) N, and (c) N for the Tl0.8Hg0.2Ba2Ca2−xSmxCu3O9−δ−yFy phase.
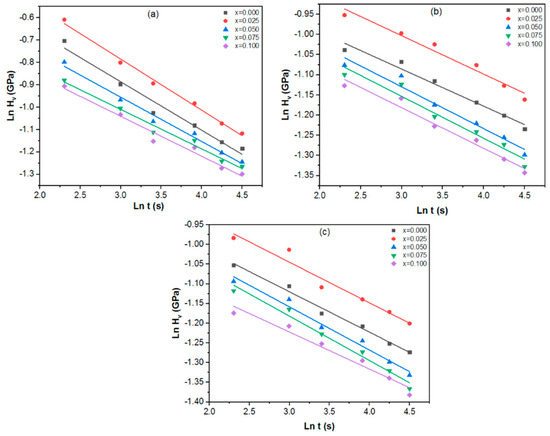
Figure 20.
Variation of ln HV versus ln t at applied loads of (a) N, (b) N, and (c) N for the Tl0.8Hg0.2Ba2Ca2−xLaxCu3O9−δ−yFy phase.

Table 3.
Stress exponents for the Tl0.8Hg0.2Ba2Ca2−xRxCu3O9−δ−yFy superconducting phase where R = Sm and La at constant loads of N and and N.
4. Conclusions
A conventional solid-state reaction method was employed to synthesize Tl0.8-xHg0.2Ba2Ca2−xRxCu3O9−δ−yFy samples, where R= La and Sm, with and. Interestingly, both substitutions did not alter the crystal structure of the (Tl, Hg)-1223 superconductor, as confirmed by XRD analysis, indicating that they did not replace any lattice site within the unit cell. However, the volume fraction and crystallite size were found to increase with Sm and La substitution. The variation in lattice parameters was attributed to the enlargement of the Cu-O plane and the smaller ionic radii of the substituting ions compared to calcium and oxygen ions. SEM images revealed that Sm and La substitution up to led to improved grain connectivity and reduced voids between superconducting grains. Measurements of the Dc-electrical resistance and I-V characteristics unveiled an enhancement in the superconducting transition temperature (Tc) and critical current density (Jc) for both substitutions up to . Moreover, substituting La in the compound results in significantly higher values for Tc, Jc, and (Tl, Hg)-1223 volume fractions when compared to the substitution of Sm. These findings establish that the incorporation of LaF3 into the compound has proven to be notably more effective in enhancing superconducting characteristics than the replacement of SmF3. Furthermore, Vickers microhardness values (Hv) exhibited an increasing trend with increasing up to , followed by a decrease with further increases in up to . The analysis indicated that Hv values followed the proportional sample resistance (PSR) model. Additionally, the mechanical parameters E, Y, and K values showed a similar trend to the Hv values as a function of Sm and La content. Moreover, the Hv values decreased exponentially with an increase in the dwell time, and the results were fitted based on the Sargent–Ashby model. Indentation creep experiments revealed that dislocation creep was the predominant creep mechanism in the samples. Notably, the Sm-substituted samples exhibited large values that were within the power-law breakdown zone.
Author Contributions
Conceptualization, R.F.K. and R.A.; methodology, R.F.K., K.H., R.A. and M.A.; validation, M.A. and R.A.; formal analysis, R.F.K. and K.H.; investigation, R.F.K. and K.H.; data curation, R.F.K. and K.H.; writing—original draft preparation, R.F.K.; review and editing, R.F.K., K.H., M.A. and R.A.; visualization, K.H.; supervision, K.H., M.A. and R.A.; project administration, R.A. All authors have read and agreed to the published version of the manuscript.
Funding
This research received no external funding.
Institutional Review Board Statement
Not applicable.
Data Availability Statement
Data will be made available on request.
Acknowledgments
This work was conducted in the Faculty of Science, Beirut Arab University, at the Specialized Materials Science Laboratory, Physics Department, Lebanon, in collaboration with the Faculty of Science at Alexandria University, Egypt.
Conflicts of Interest
The authors declare no conflict of interest.
References
- Bednorz, J.G.; Müller, K.A. Possible high Tc Superconductivity in the Ba-La-Cu-O System. Z. Phys. B Condens. Matter 1986, 64, 189–193. [Google Scholar] [CrossRef]
- Cigáň, A.; Maňka, J.; Mair, M.; Gritzner, G.; Plesch, G.; Zrubec, V. Influence of the Tl- and Hg-Content on Magnetic and Transport Properties of the Pb, Sr-Doped Tl-1223 and Hg-1223 Superconductors. Phys. C Supercond. 1999, 320, 267–276. [Google Scholar] [CrossRef]
- Piehler, A.; Ströbel, J.P.; Reschauer, N.; Löw, R.; Schönberger, R.; Renk, K.F.; Kraus, M.; Daniel, J.; Saemann-Ischenko, G. Critical Current Density of TlBa2Ca2Cu3O9 Thin Films on MgO (100) in Magnetic Fields. Phys. C Supercond. 1994, 223, 391–395. [Google Scholar] [CrossRef]
- Selvamanickam, V. High Temperature Superconductor (HTS) Wires and Tapes. In High Temperature Superconductors (HTS) for Energy Applications; Elsevier: Amsterdam, The Netherlands, 2012; pp. 34–68. ISBN 978-0-85709-012-6. [Google Scholar]
- Metskhvarishvili, I.; Lobzhanidze, T.E.; Dgebuadze, G.N.; Bendeliani, B.G.; Metskhvarishvili, M.R.; Rusia, M.S.; Gabunia, V.M.; Komakhidze, K. SG and SSR Approach in the Preparation of Precursors and Influence on Superconducting Properties of Tl-1223 Superconductors. Res. Sq. 2020. in review. [Google Scholar] [CrossRef]
- Abed, N.S.; Fathi, S.J.; Jassim, K.A.; Mahdi, S.H. Partial Substitution of Zn Effects on the Structural and Electrical Properties of High Temperature Hg0.95Ag0.05Ba2Ca2Cu3O8+δ Superconductors. J. Phys. Conf. Ser. 2018, 1003, 012098. [Google Scholar] [CrossRef]
- Flores-Livas, J.A.; Boeri, L.; Sanna, A.; Profeta, G.; Arita, R.; Eremets, M. A Perspective on Conventional High-Temperature Superconductors at High Pressure: Methods and Materials. Phys. Rep. 2020, 856, 1–78. [Google Scholar] [CrossRef]
- Drozdov, A.P.; Eremets, M.I.; Troyan, I.A.; Ksenofontov, V.; Shylin, S.I. Conventional Superconductivity at 203 Kelvin at High Pressures in the Sulfur Hydride System. Nature 2015, 525, 73–76. [Google Scholar] [CrossRef]
- Kvashnin, A.G.; Semenok, D.V.; Kruglov, I.A.; Wrona, I.A.; Oganov, A.R. High-Temperature Superconductivity in a Th–H System under Pressure Conditions. ACS Appl. Mater. Interfaces 2018, 10, 43809–43816. [Google Scholar] [CrossRef]
- Chang, I.C.; Liu, J.Z.; Lan, M.D.; Klavins, P.; Shelton, R.N. Superconducting Properties of the System Tl1−xHgxBa2Ca2Cu3O8+δ. Chin. J. Phys. 1996, 34, 497–504. [Google Scholar]
- Pandey, A.K.; Verma, G.D.; Srivastava, O.N. Investigations on the Tl-Doped Hg–Ba–Ca–Cu–O High Temperature Superconductors in Regard to Hole Doping and Microstructural Characteristics. Phys. C Supercond. 1998, 306, 47–57. [Google Scholar] [CrossRef]
- Abou-Aly, A.I.; Awad, R.; Ibrahim, I.H.; Abdeen, W. Effect of Sm-Substitution on the Electrical and Magnetic Properties of (Tl0.8Hg0.2)-1223. J. Alloys Compd. 2009, 481, 462–469. [Google Scholar] [CrossRef]
- Prabitha, V.G.; Biju, A.; Abhilash Kumar, R.G.; Sarun, P.M.; Aloysius, R.P.; Syamaprasad, U. Effect of Sm Addition on (Bi,Pb)-2212 Superconductor. Phys. C Supercond. 2005, 433, 28–36. [Google Scholar] [CrossRef]
- Abou-Aly, A.I.; Awad, R.; Kamal, M.; Anas, M. Excess Conductivity Analysis of (Cu0.5Tl0.5)-1223 Substituted by Pr and La. J. Low Temp. Phys. 2011, 163, 184–202. [Google Scholar] [CrossRef]
- Anas, M. The Effect of PbF2 Doping on the Structural, Electrical and Mechanical Properties of (Bi,Pb)–2223 Superconductor. Chem. Phys. Lett. 2020, 742, 137033. [Google Scholar] [CrossRef]
- Hamdan, N.M.; Ziq, K.A.; Al-Harthi, A.S. Effect of Fluorine on the Phase Formation and Superconducting Properties of Tl-1223 Superconductors. Phys. C Supercond. 1999, 314, 125–132. [Google Scholar] [CrossRef]
- Mohammed, N.H.; Abou-Aly, A.I.; Ibrahim, I.H.; Awad, R.; Rekaby, M. Effect of Nano-Oxides Addition on the Mechanical Properties of (Cu0.5Tl0.5)-1223 Phase. J. Supercond. Nov. Magn. 2011, 24, 1463–1472. [Google Scholar] [CrossRef]
- Awad, R.; Abou Aly, A.I.; Kamal, M.; Anas, M. Mechanical Properties of (Cu0.5Tl0.5)-1223 Substituted by Pr. J. Supercond. Nov. Magn. 2011, 24, 1947–1956. [Google Scholar] [CrossRef]
- Mohammed, L.A.; Jasim, K.A. Synthesis and Study the Structural and Electrical and Mechanical Properties of High Temperature Superconductor Tl0.5Pb0.5Ba2Can−1Cun−xNixO2n+3−δ Substituted with Nickel Oxide for N = 3. IHJPAS 2018, 31, 26–32. [Google Scholar] [CrossRef]
- Khattar, R.F.; Habanjar, K.; Awad, R.; Anas, M. Comparative Study of Structural, Electrical, and Mechanical Properties of (Tl, Hg)-1223 High Temperature Superconducting Phase Substituted by Lead Oxide and Lead Dioxide. J. Low Temp. Phys. 2023, 211, 166–192. [Google Scholar] [CrossRef]
- Abou-Aly, A.I.; Mohammed, N.H.; Roumié, M.; El Khatib, A.; Awad, R.; Nour El Dein, S.A. Ion Beam Analysis and Physical Properties Measurements of (Tl0.8Hg0.2−xSbx)Ba2Ca2Cu3O9−δ. J. Supercond. Nov. Magn. 2009, 22, 495–504. [Google Scholar] [CrossRef]
- Awad, R.; Abou-Aly, A.I.; Ibrahim, I.H.; Abdeen, W. Normal-State Hall Effect Measurements for Tl0.8Hg0.2Ba2Ca2Cu3O9−δ Substituted by Sm and Yb. Solid State Commun. 2008, 146, 92–96. [Google Scholar] [CrossRef]
- El Makdah, M.H.; El Ghouch, N.; El-Dakdouki, M.H.; Awad, R.; Matar, M. Structural, Electrical and Mechanical Properties of the (NdFeO3)x/(CuTl)-1223 Superconductor Phase. Appl. Phys. A 2023, 129, 265. [Google Scholar] [CrossRef]
- Cao, R.; Wang, W.; Ren, Y.; Hu, Z.; Zhou, X.; Xu, Y.; Luo, Z.; Liang, A. Synthesise, Energy Transfer and Tunable Emission Properties of Ba2La2ZnW2O12:Sm3+ Phosphors. J. Lumin. 2021, 235, 118054. [Google Scholar] [CrossRef]
- Bae, E.G.; Jeong, J.; Han, S.C.; Kwak, J.S.; Pyo, M. Calcium-Doping for Structure Stabilization of Sodium Transition Metal Oxide Cathodes in Sodium Ion Batteries. Meet. Abstr. 2014, MA2014-04, 390. [Google Scholar] [CrossRef]
- Nasser, A.; Srour, A.; El Ghouch, N.; Malaeb, W.; Al-Oweini, R.; Awad, R. Investigation of the Physical Properties of (Cu0.5Tl0.5)Ba2Ca2Cu3O10−δ Impregnated with Mono Cobalt(II)-Substituted Undecatungstosilicate Nanoparticles. Appl. Phys. A 2020, 126, 951. [Google Scholar] [CrossRef]
- Anas, M.; El-Shorbagy, G.A. Impact of Nano-Sized Diluted Magnetic Semiconductors Addition on (Cu, Tl)1234 Superconducting Phase. J. Low Temp. Phys. 2019, 194, 183–196. [Google Scholar] [CrossRef]
- Abou Aly, A.; Ibrahim, I.; Awad, R.; El-Harizy, A.; Khalaf, A. Stabilization of Tl-1223 Phase by Arsenic Substitution. J. Supercond. Nov. Magn. 2010, 23, 1325–1332. [Google Scholar] [CrossRef]
- Ulgen, A.T.; Turgay, T.; Terzioglu, C.; Yildirim, G.; Oz, M. Role of Bi/Tm Substitution in Bi-2212 System on Crystal Structure Quality, Pair Wave Function and Polaronic States. J. Alloys Compd. 2018, 764, 755–766. [Google Scholar] [CrossRef]
- Aftabi, A.; Mozaffari, M. Fluctuation Induced Conductivity and Pseudogap State Studies of Bi1.6Pb0.4Sr2Ca2Cu3O10+δ Superconductor Added with ZnO Nanoparticles. Sci. Rep. 2021, 11, 4341. [Google Scholar] [CrossRef]
- Mortada-Hamid, H.; Ilhamsyah, A.B.P.; Abd-Shukor, R. Formation of Tl-1212 Phase in Ga-Substituted Tl(BaSr)Ca1−xGaxCu2O7 Superconductor. J. Mater. Sci. Mater. Electron. 2020, 31, 5316–5323. [Google Scholar] [CrossRef]
- Talantsev, E.F. The Electron–Phonon Coupling Constant and the Debye Temperature in Polyhydrides of Thorium, Hexadeuteride of Yttrium, and Metallic Hydrogen Phase III. J. Appl. Phys. 2021, 130, 195901. [Google Scholar] [CrossRef]
- Awad, R.; Abou-Aly, A.I.; Mahmoud, S.A.; Barakat, M.M. Thermal Expansion Measurements Using X-Ray Powder Diffraction of Tl-1223 Substituted by Molybdenum. Supercond. Sci. Technol. 2007, 20, 401–405. [Google Scholar] [CrossRef]
- Abou Aly, A.I.; Awad, R.; Ibrahim, I.H.; Kamal, M.; Anas, M. Thermomechanical Analysis of (Cu0.5Tl0.5)-1223 Substituted by Pr and La. J. Mater. Sci. Technol. 2012, 28, 169–176. [Google Scholar] [CrossRef]
- Seiler, E.; Gömöry, F.; Mišík, J.; Richter, D. Critical Current Density of Coated Conductors Determined from Rescaled Magnetic Moment at Temperatures Close to 77 K. Phys. C Supercond. Its Appl. 2018, 551, 66–71. [Google Scholar] [CrossRef]
- Vallès, F.; Palau, A.; Rouco, V.; Mundet, B.; Obradors, X.; Puig, T. Angular Flux Creep Contributions in YBa2Cu3O7−δ Nanocomposites from Electrical Transport Measurements. Sci. Rep. 2018, 8, 5924. [Google Scholar] [CrossRef]
- Katona, T.M.; Pierson, S.W. Zero-Field Current-Voltage Characteristics in High-Temperature Superconductors. Phys. C Supercond. 1996, 270, 242–248. [Google Scholar] [CrossRef]
- Jukna, A. Study of Energy Dissipation in the Mixed-State YBa2Cu3O7−δ Superconductor with Partially Deoxygenated Structures. Materials 2022, 15, 4260. [Google Scholar] [CrossRef]
- Oboudi, S.F. Synthesis and Magnetic Properties of Bi1.7Pb0.3Sr2Ca2Cu3O10+δ Added with Nano Y. J. Supercond. Nov. Magn. 2017, 30, 1473–1482. [Google Scholar] [CrossRef]
- Ghazanfari, N.; Kılıç, A.; Gencer, A.; Özkan, H. Effects of Nb2O5 Addition on Superconducting Properties of BSCCO. Solid State Commun. 2007, 144, 210–214. [Google Scholar] [CrossRef]
- Nurbaisyatul, E.S.; Azhan, H.; Ibrahim, N.; Saipuddin, S.F. Structural and Superconducting Properties of Low-Density Bi(Pb)-2223 Superconductor: Effect of Eu2O3 Nanoparticles Addition. Cryogenics 2021, 119, 103353. [Google Scholar] [CrossRef]
- Zalaoglu, Y.; Bekiroglu, E.; Dogruer, M.; Yildirim, G.; Ozturk, O.; Terzioglu, C. Comparative Study on Mechanical Properties of Undoped and Ce-Doped Bi-2212 Superconductors. J. Mater. Sci. Mater. Electron. 2013, 24, 2339–2345. [Google Scholar] [CrossRef]
- Leenders, A.; Mich, M.; Freyhard, H.C. Influence of Thermal Cycling on the Mechanical Properties of VGF Melt-Textured YBCO. Phys. C Supercond. 1997, 279, 173–180. [Google Scholar] [CrossRef]
- Tickoo, R.; Tandon, R.P.; Bamzai, K.K.; Kotru, P.N. Microindentation Studies on Samarium-Modified Lead Titanate Ceramics. Mater. Chem. Phys. 2003, 80, 446–451. [Google Scholar] [CrossRef]
- Sahoo, B.; Behera, D. Investigation of Superconducting and Elastic Parameters of YBCO/LSMO Thick Films. J. Mater. Sci. Mater. Electron. 2019, 30, 12992–13004. [Google Scholar] [CrossRef]
- Foerster, C.E.; Lima, E.; Rodrigues Jr, P.; Serbena, F.C.; Lepienski, C.M.; Cantão, M.P.; Jurelo, A.R.; Obradors, X. Mechanical Properties of Ag-Doped Top-Seeded Melt-Grown YBCO Pellets. Braz. J. Phys. 2008, 38, 341–345. [Google Scholar] [CrossRef]
- Saritekin, N.K.; Üzümcü, A.T. Improving Superconductivity, Microstructure, and Mechanical Properties by Substituting Different Ionic Pb Elements to Bi and Ca Elements in Bi-2223 Superconductors. J. Supercond. Nov. Magn. 2022, 35, 2259–2273. [Google Scholar] [CrossRef]
- Khalil, S.M. Effect of Y3+ Substitution for Ca on the Transport and Mechanical Properties of Bi2Sr2Ca1−xYxCu2O8+δ System. J. Phys. Chem. Solids 2003, 64, 855–861. [Google Scholar] [CrossRef]
- Koralay, H.; Arslan, A.; Cavdar, S.; Ozturk, O.; Asikuzun, E.; Gunen, A.; Tasci, A.T. Structural and Mechanical Characterization of Bi1.75Pb0.25Sr2Ca2Cu3−xSnxO10+y Superconductor Ceramics Using Vickers Microhardness Test. J. Mater. Sci. Mater. Electron. 2013, 24, 4270–4278. [Google Scholar] [CrossRef]
- Terzioglu, R.; Altintas, S.P.; Varilci, A.; Terzioğlu, C. Modeling of Micro-Hardness in the Au-Doped YBCO Bulk Superconductors. J. Supercond. Nov. Magn. 2019, 32, 3377–3383. [Google Scholar] [CrossRef]
- Hays, C.; Kendall, E.G. An Analysis of Knoop Microhardness. Metallography 1973, 6, 275–282. [Google Scholar] [CrossRef]
- Lawn, B.R.; Howes, V.R. Elastic Recovery at Hardness Indentations. J. Mater. Sci. 1981, 16, 2745–2752. [Google Scholar] [CrossRef]
- Dogruer, M.; Yildirim, G.; Ozturk, O.; Terzioglu, C. Analysis of Indentation Size Effect on Mechanical Properties of Cu-Diffused Bulk MgB2 Superconductor Using Experimental and Different Theoretical Models. J. Supercond. Nov. Magn. 2013, 26, 101–109. [Google Scholar] [CrossRef]
- Li, H.; Bradt, R.C. The Microhardness Indentation Load/Size Effect in Rutile and Cassiterite Single Crystals. J. Mater. Sci. 1993, 28, 917–926. [Google Scholar] [CrossRef]
- Gong, J.; Miao, H.; Zhao, Z.; Guan, Z. Load-Dependence of the Measured Hardness of Ti (C, N)-Based Cermets. Mater. Sci. Eng. A 2001, 303, 179–186. [Google Scholar] [CrossRef]
- Quinn, J.B.; Quinn, G.D. Indentation Brittleness of Ceramics: A Fresh Approach. J. Mater. Sci. 1997, 32, 4331–4346. [Google Scholar] [CrossRef]
- Rekaby, M.; Mohammed, N.H.; Ahmed, M.; Abou-Aly, A.I. Synthesis, Microstructure and Indentation Vickers Hardness for (Y3Fe5O12)x/Cu0.5Tl0.5Ba2Ca2Cu3O10−δ Composites. Appl. Phys. A 2022, 128, 261. [Google Scholar] [CrossRef]
- Turkoz, M.B.; Zalaoglu, Y.; Turgay, T.; Ozturk, O.; Akkurt, B.; Yildirim, G. Evaluation of Key Mechanical Design Properties and Mechanical Characteristic Features of Advanced Bi-2212 Ceramic Materials with Homovalent Bi/Ga Partial Replacement: Combination of Experimental and Theoretical Approaches. Ceram. Int. 2019, 45, 21183–21192. [Google Scholar] [CrossRef]
- Zewen, W.; Wanqi, J. Microhardness of Hg1−xMnxTe. Mater. Sci. Eng. A 2007, 452–453, 508–511. [Google Scholar] [CrossRef]
- Zaki, H.M.; Abdel-Daiem, A.M.; Swilem, Y.I.; El-Tantawy, F.; Al-Marzouki, F.M.; Al-Ghamdi, A.A.; Al-Heniti, S.; Al-Hazmi, F.S.; Al-Harbi, T.S. Indentation Creep Behavior and Microstructure of Cu-Ge Ferrites. Mater. Sci. Appl. 2011, 2, 1076. [Google Scholar] [CrossRef][Green Version]
- PM, S.; Ashby, M.F. Indentation Creep. Mater. Sci. Technol. 1992, 8, 594–601. [Google Scholar] [CrossRef]
- Langdon, T.G. Identifiying Creep Mechanisms at Low Stresses. Mater. Sci. Eng. A 2000, 283, 266–273. [Google Scholar] [CrossRef]
- Walser, B.; Sherby, O.D. The Structure Dependence of Power Law Creep. Scr. Metall. 1982, 16, 213–219. [Google Scholar] [CrossRef]
- Sharma, G.; Ramanujan, R.V.; Kutty, T.R.G.; Tiwari, G.P. Hot Hardness and Indentation Creep Studies of a Fe–28Al–3Cr–0.2 C Alloy. Mater. Sci. Eng. A 2000, 278, 106–112. [Google Scholar] [CrossRef]
- Goetze, C.; Brace, W.F. Laboratory Observations of High-Temperature Rheology of Rocks. In Developments in Geotectonics; Elsevier: Amsterdam, The Netherlands, 1972; Volume 4, pp. 583–600. [Google Scholar] [CrossRef]
- Abd El-Salam, F.; Wahab, L.A.; Nada, R.H.; Zahran, H.Y. Temperature and Dwell Time Effect on Hardness of Al-Base Alloys. J. Mater. Sci. 2007, 42, 3661–3669. [Google Scholar] [CrossRef]
Disclaimer/Publisher’s Note: The statements, opinions and data contained in all publications are solely those of the individual author(s) and contributor(s) and not of MDPI and/or the editor(s). MDPI and/or the editor(s) disclaim responsibility for any injury to people or property resulting from any ideas, methods, instructions or products referred to in the content. |
© 2023 by the authors. Licensee MDPI, Basel, Switzerland. This article is an open access article distributed under the terms and conditions of the Creative Commons Attribution (CC BY) license (https://creativecommons.org/licenses/by/4.0/).