Improved Transition Metal Dichalcogenides-Based Surface Plasmon Resonance Biosensors

 , and
, and
Abstract
:
1. Introduction
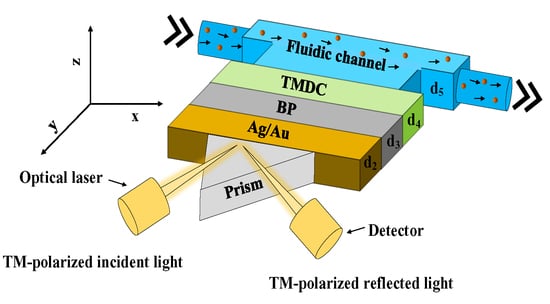
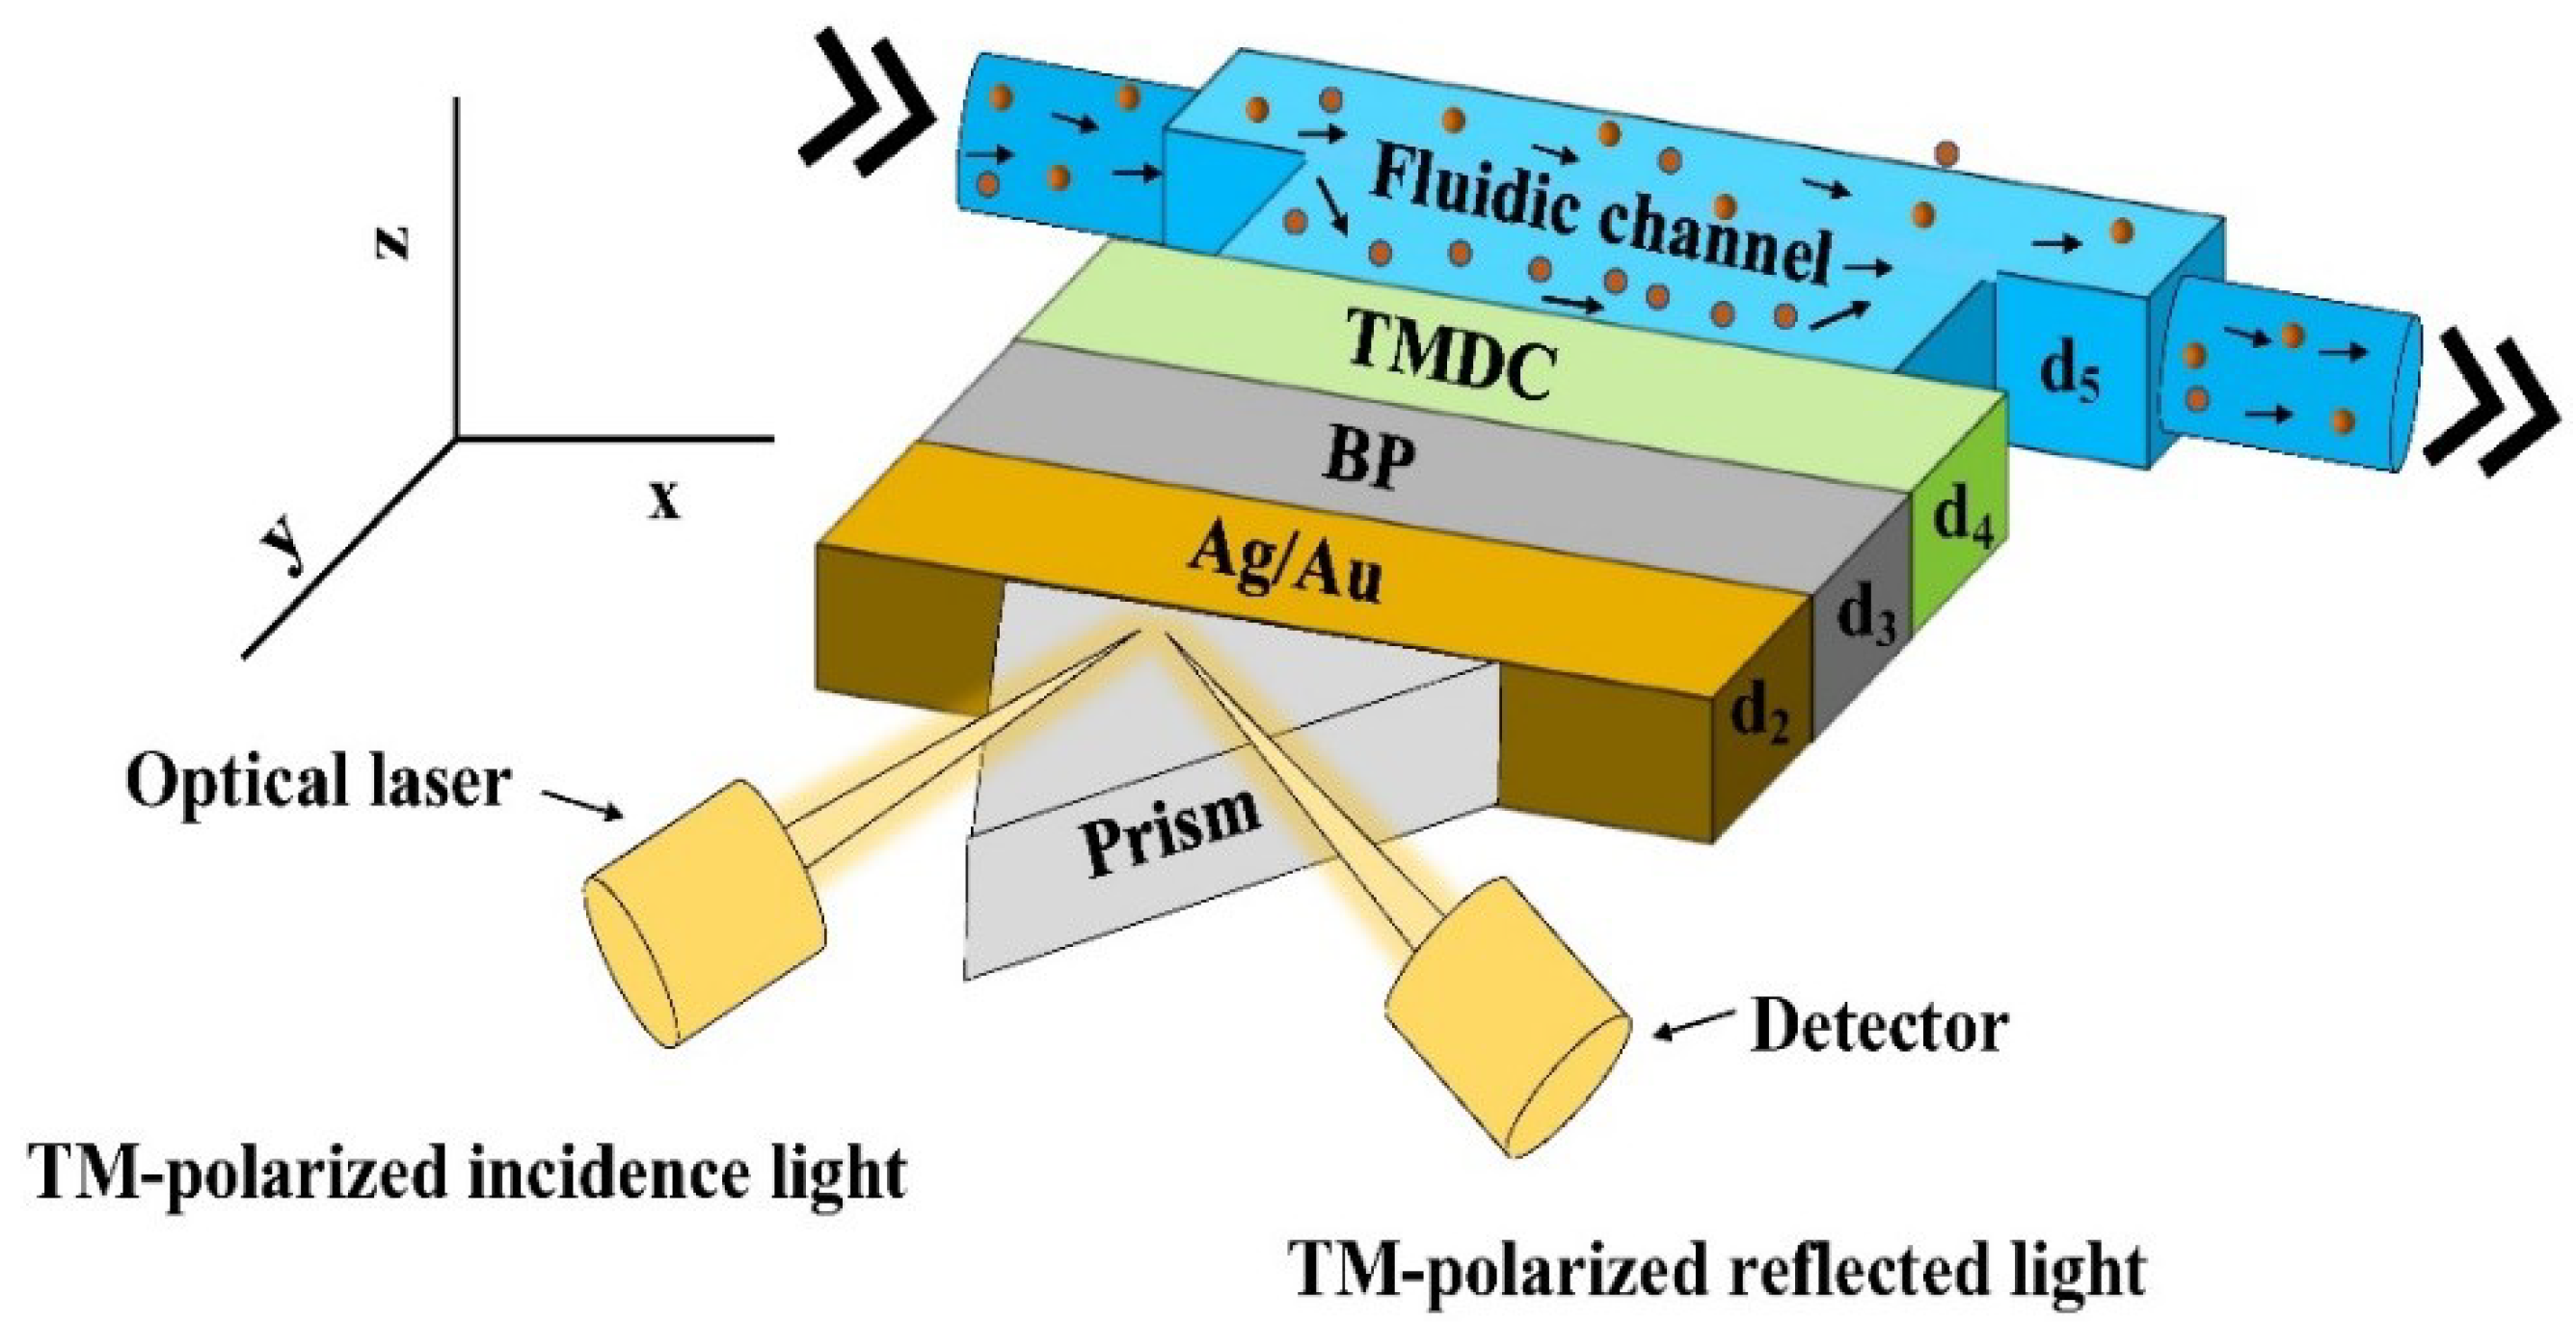
2. Design Consideration of the Proposed SPR Biosensor
3. Numerical and Mathematical Model
3.1. Optical Properties
3.2. Sensitivity and Other Parameters
4. Results and Analysis
4.1. Determination of TMDC Performances
4.2. Determination of Proposed Performance Parameter
4.2.1. Combination Parameter
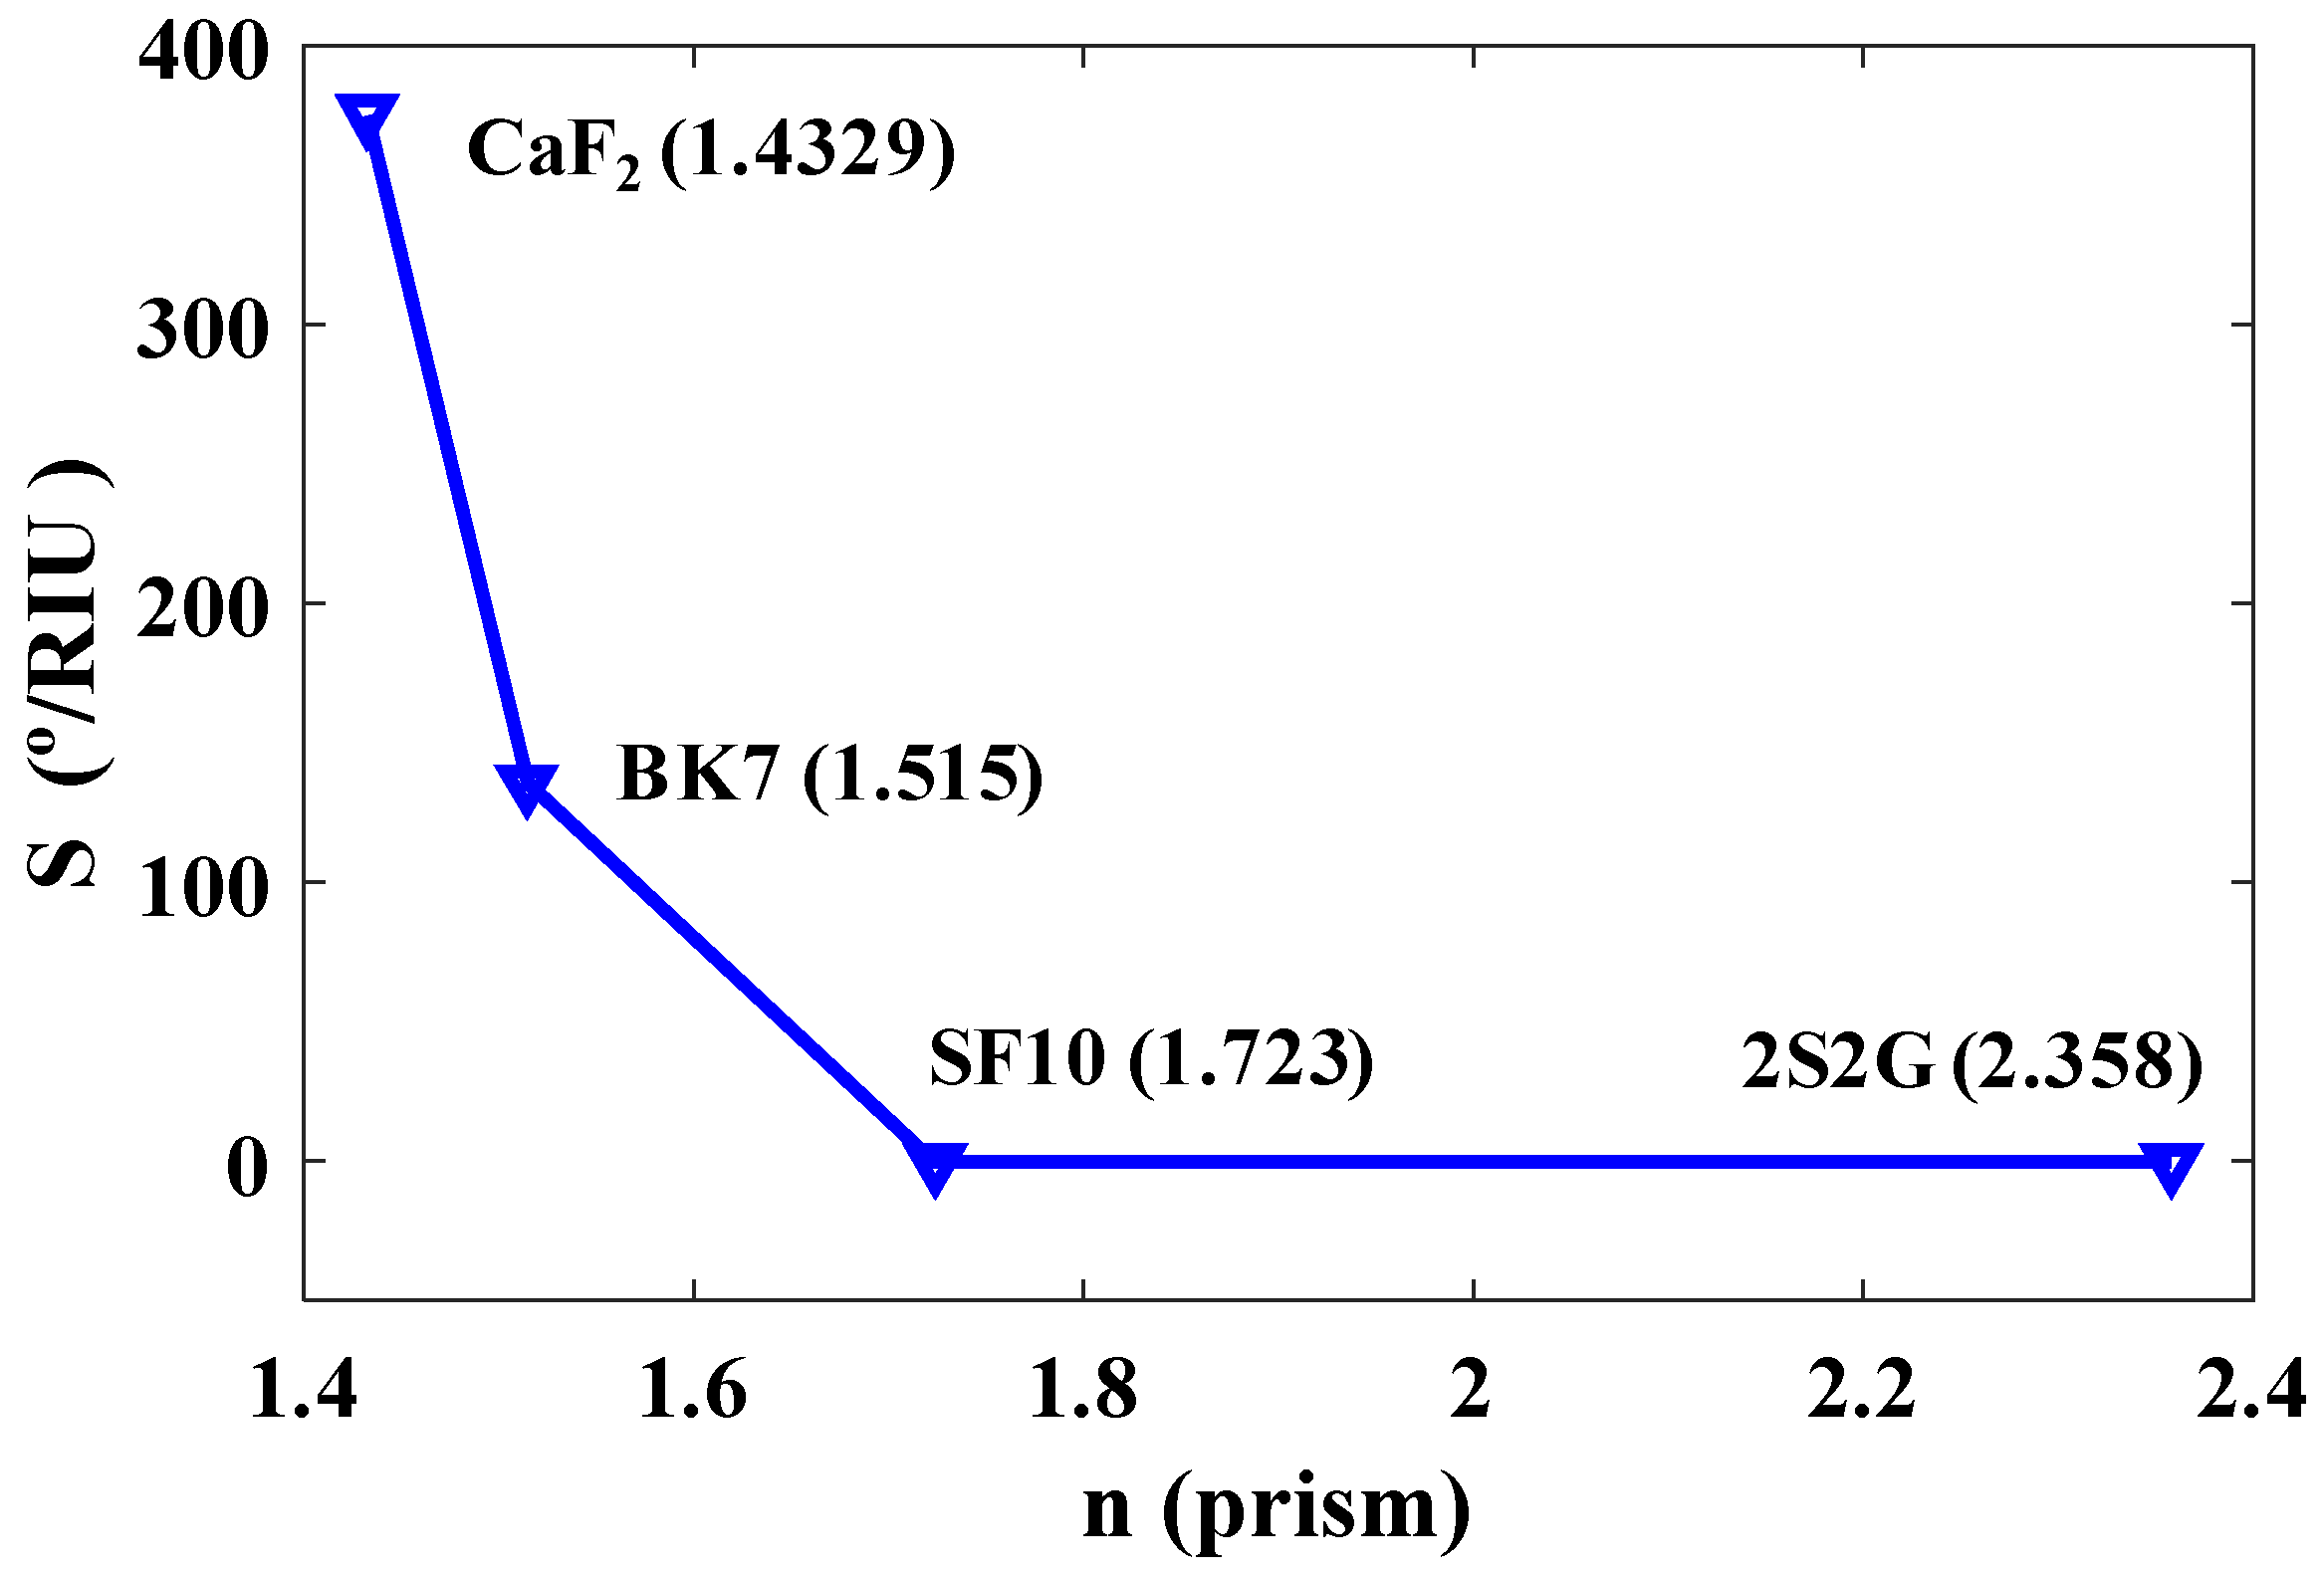
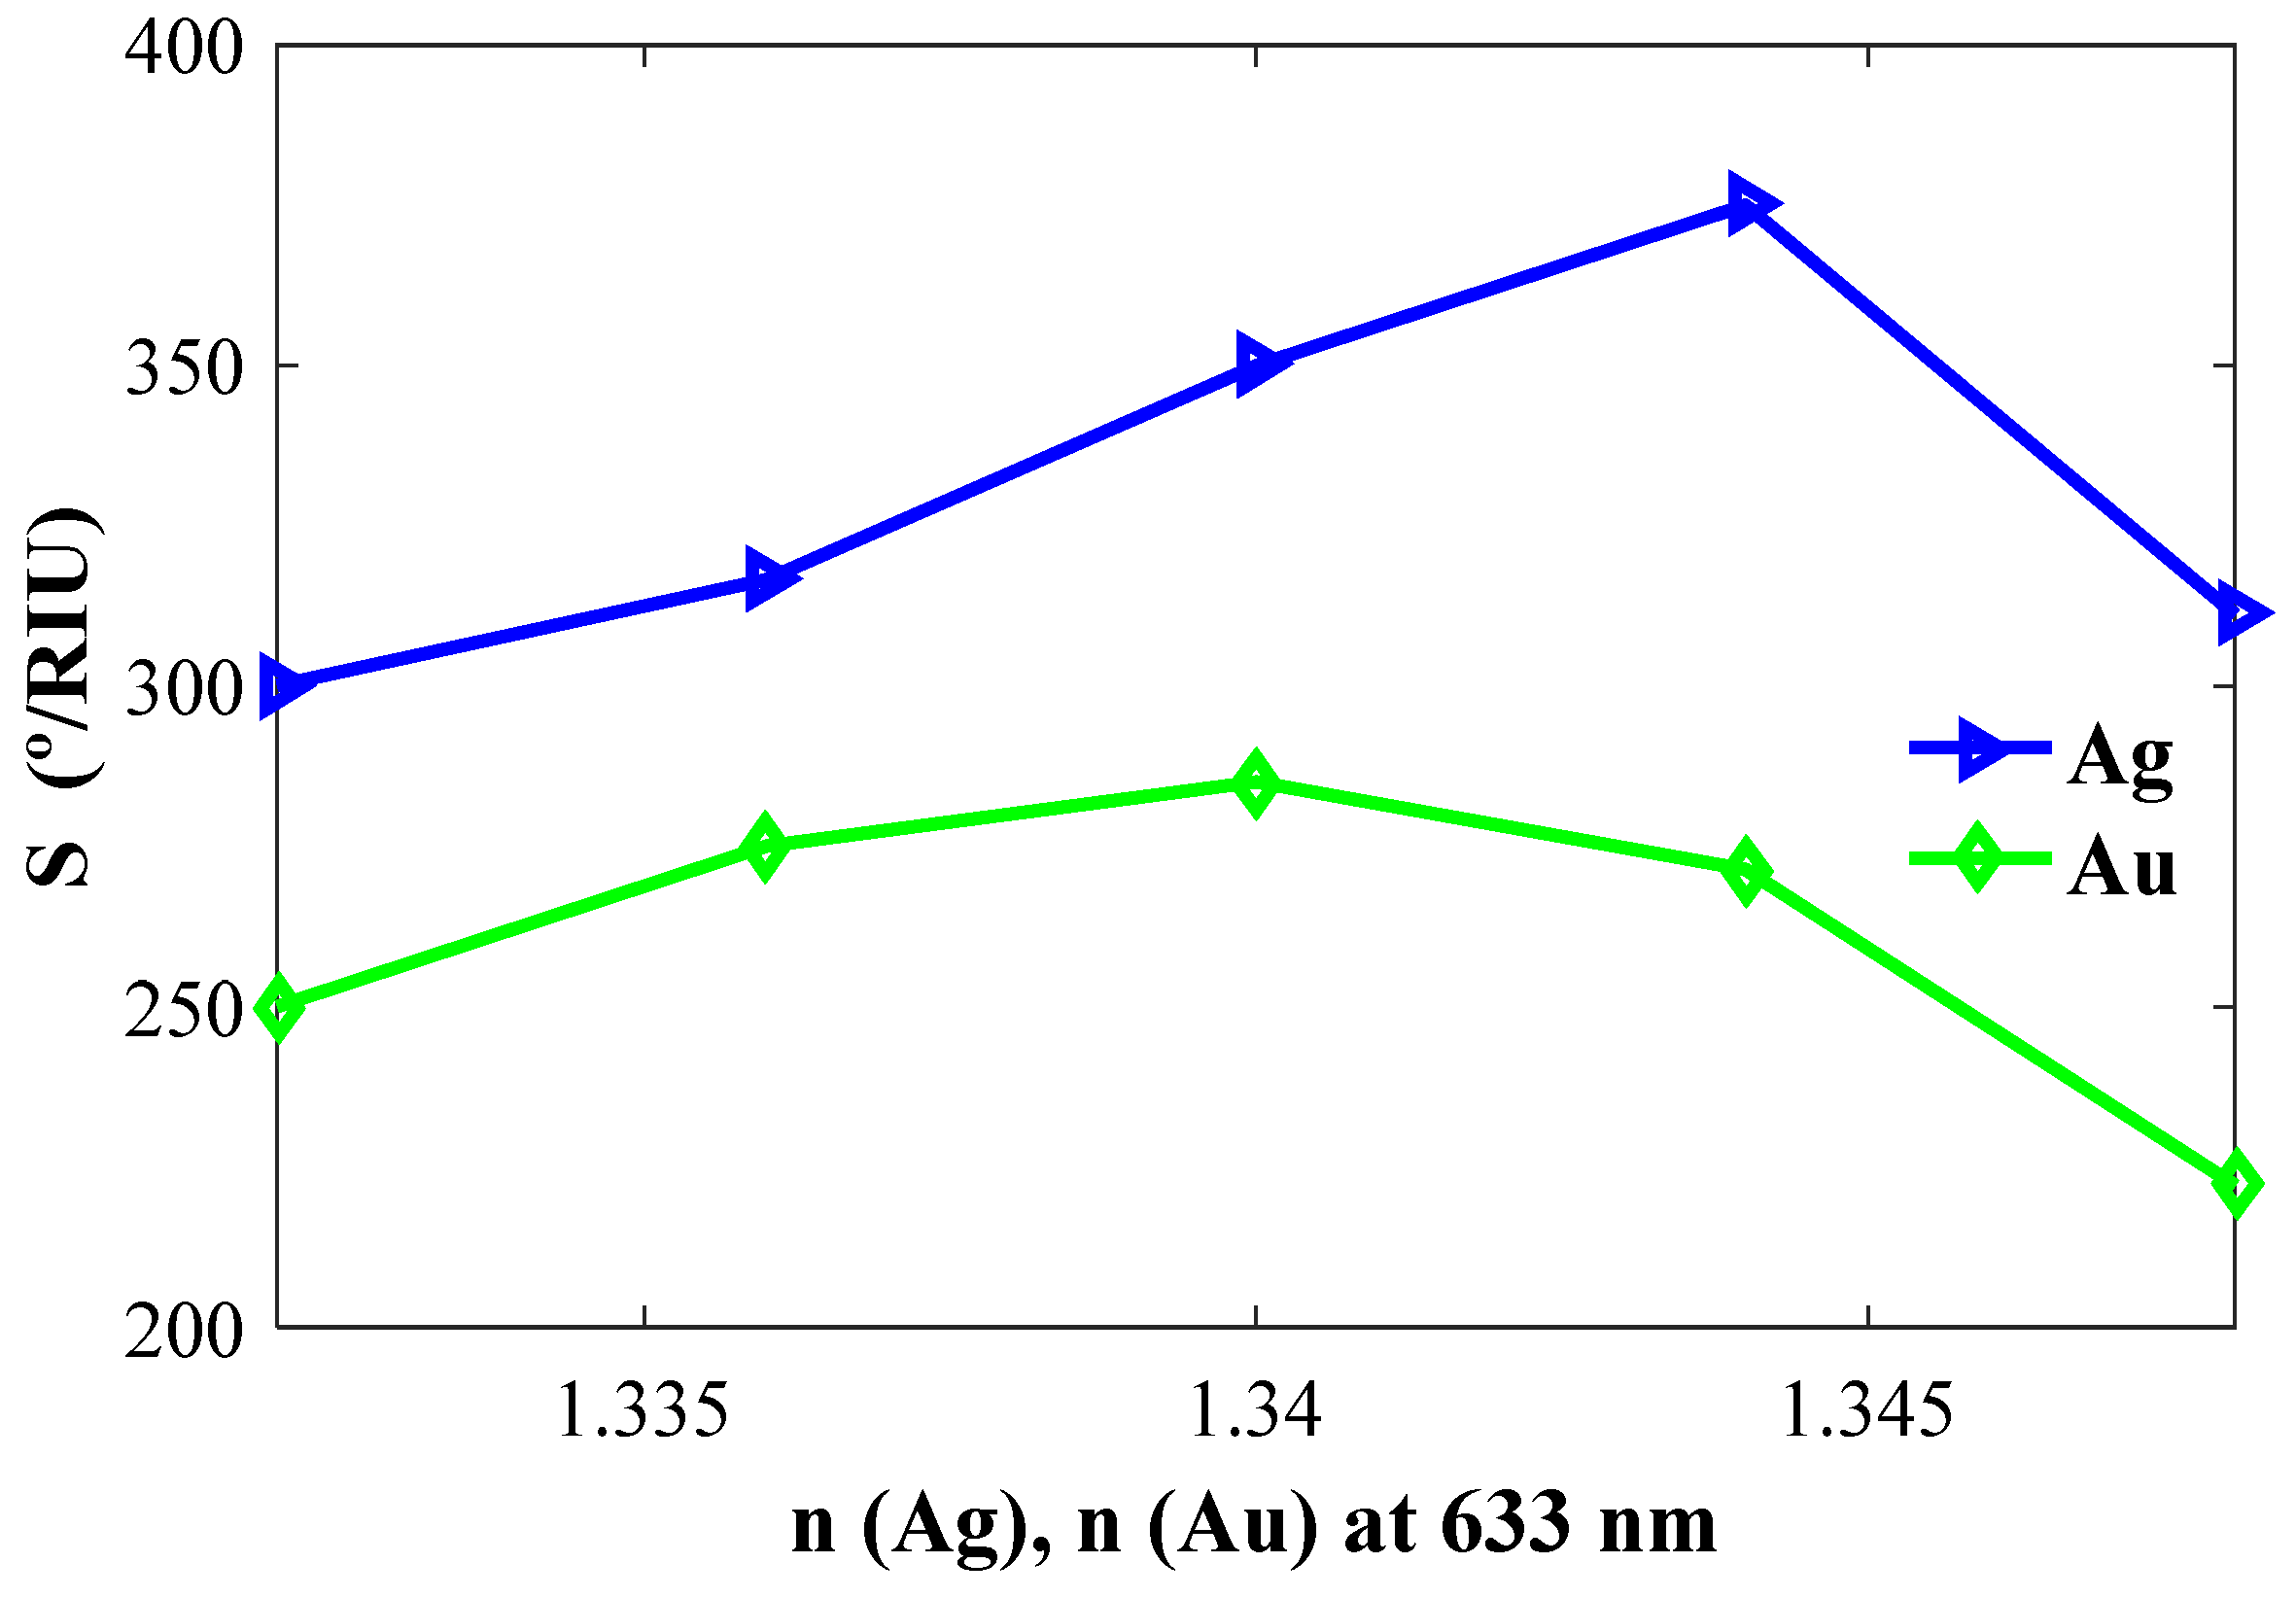
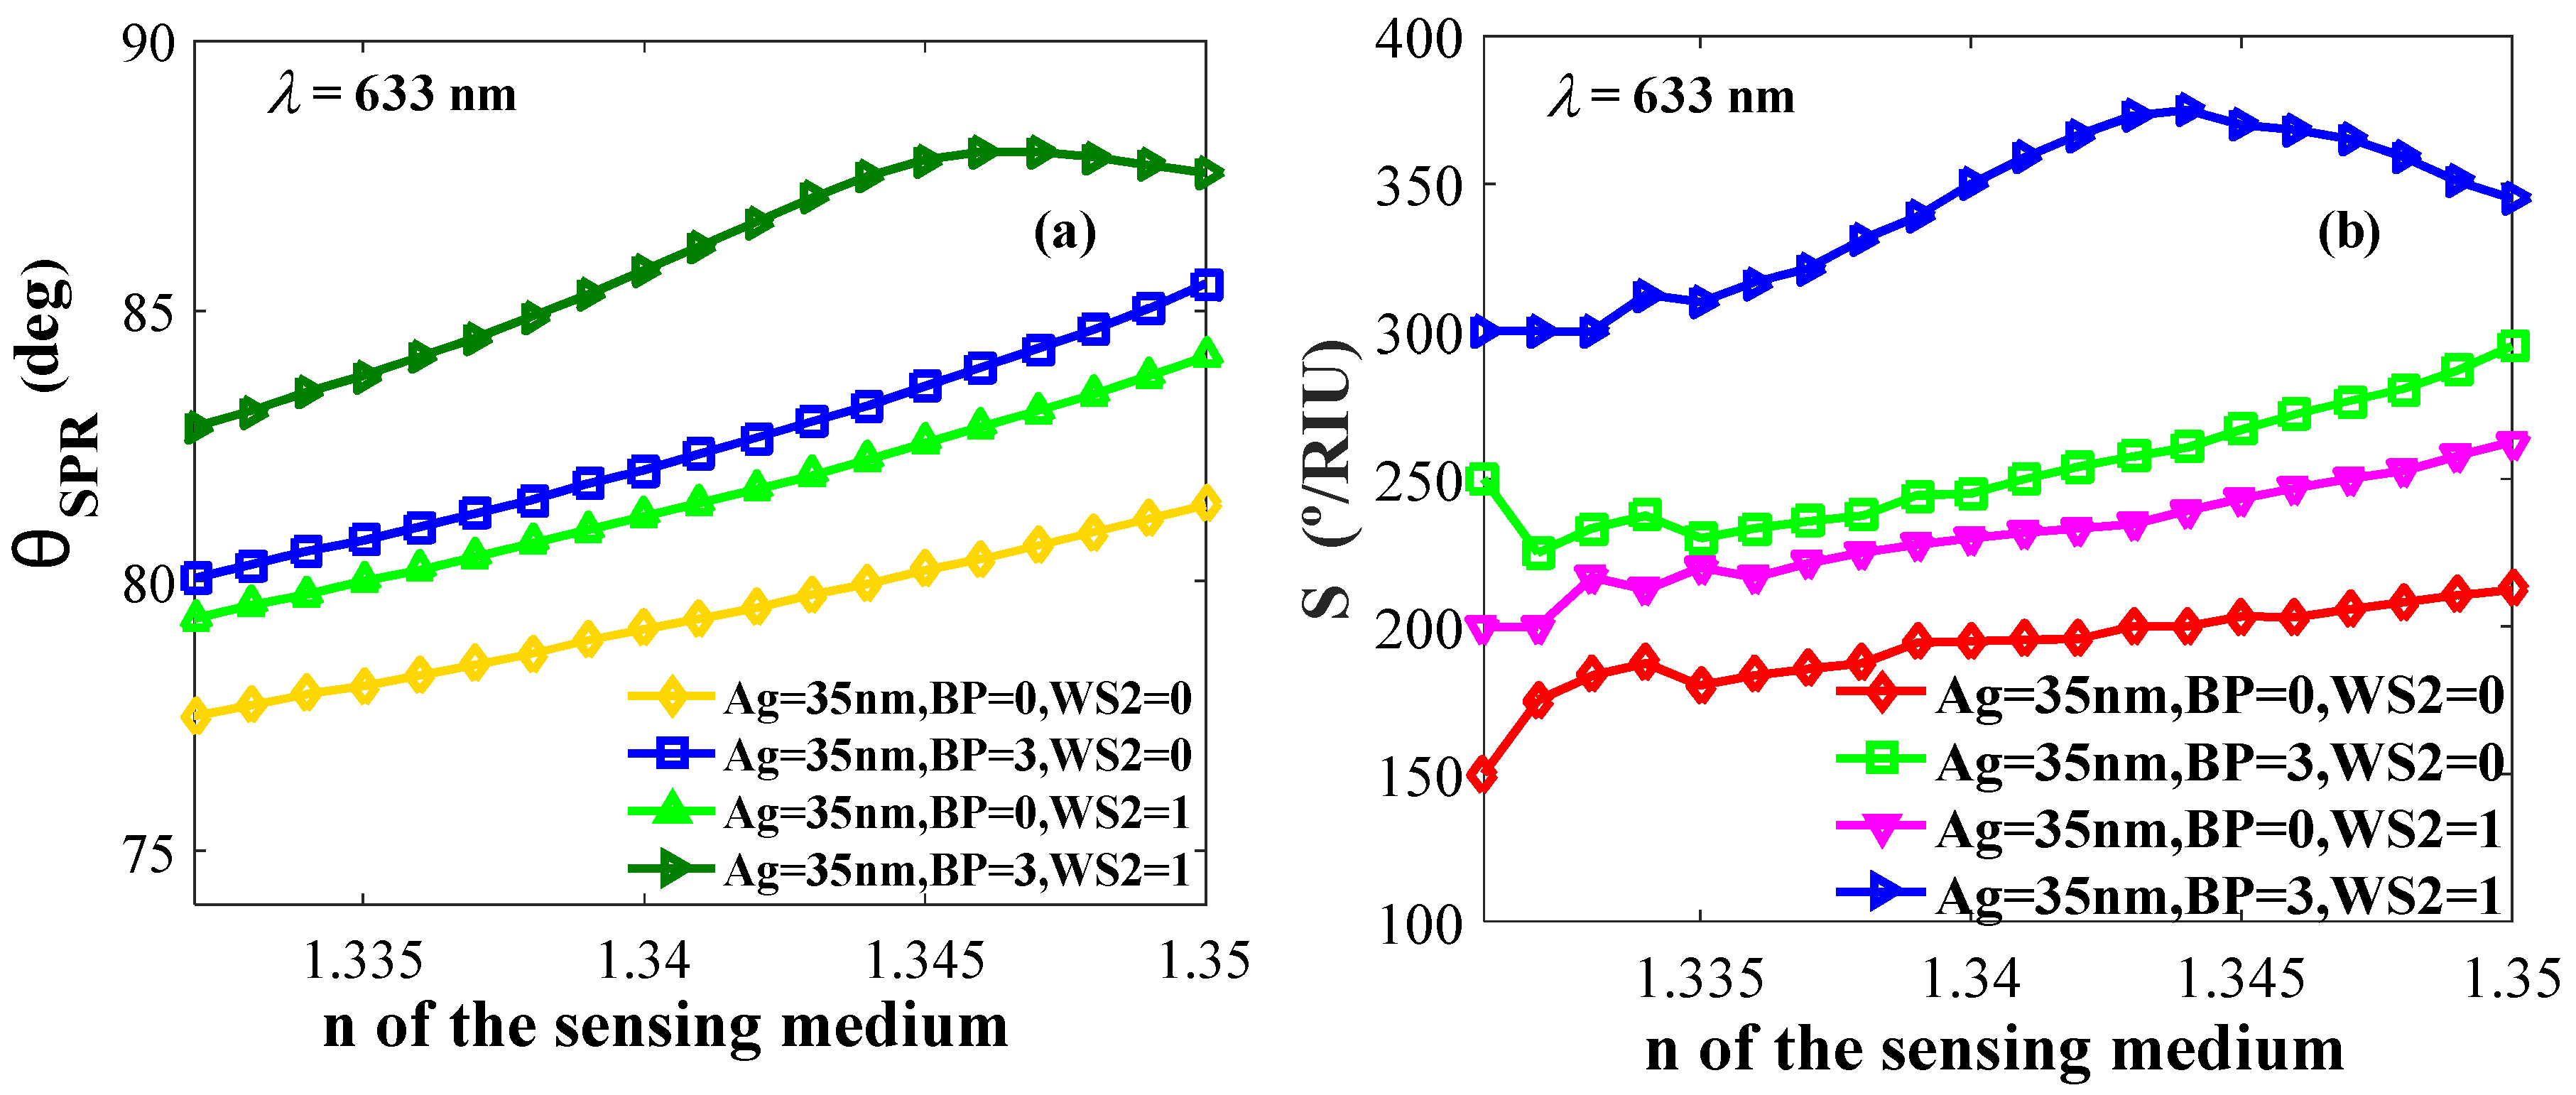
4.2.2. Effect of Refractive Indices on Resonance Angle and Sensitivity
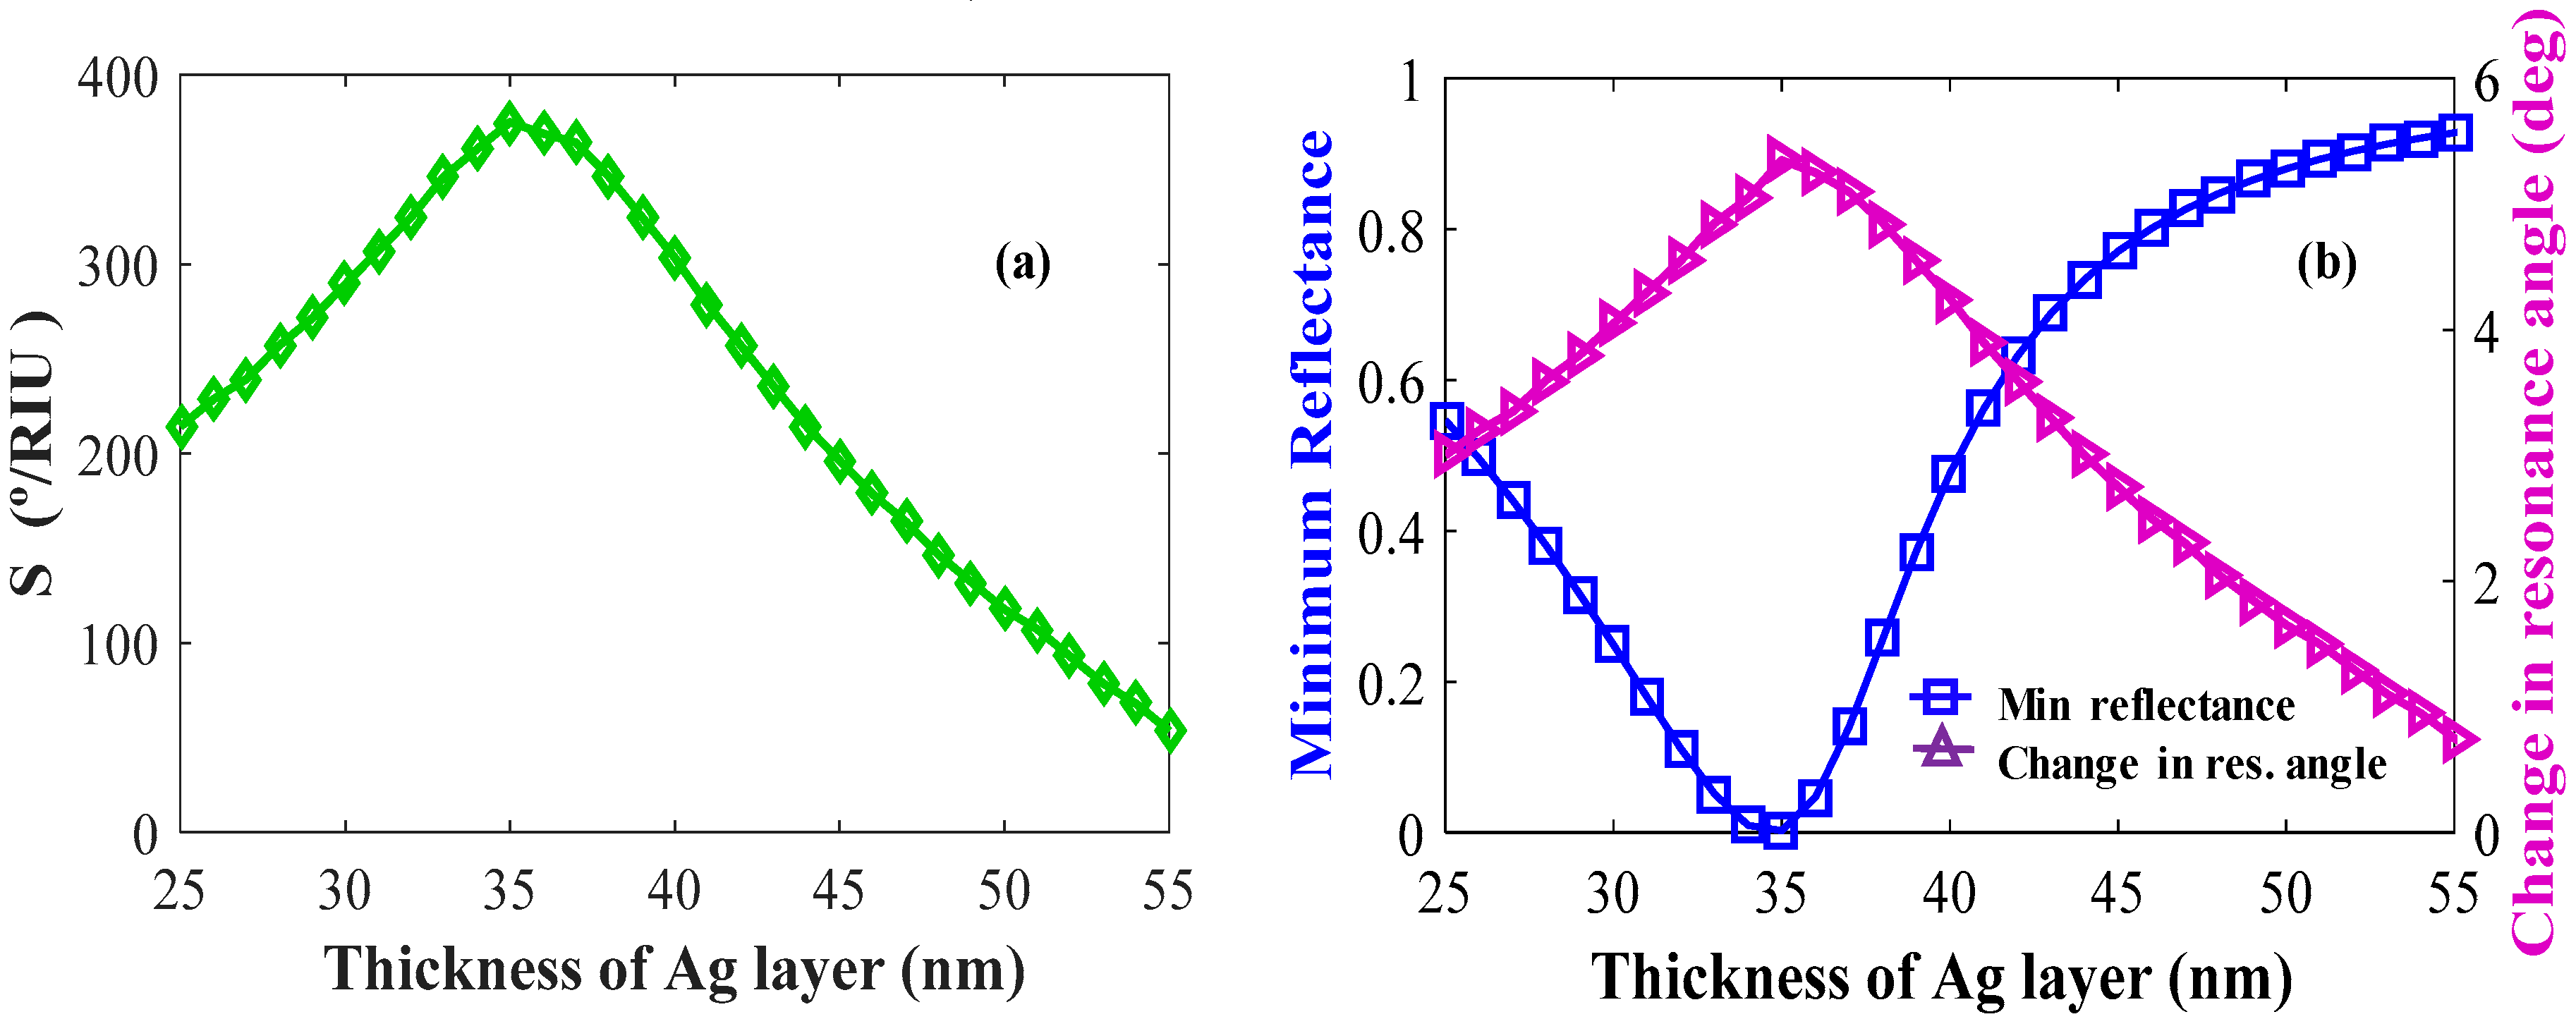
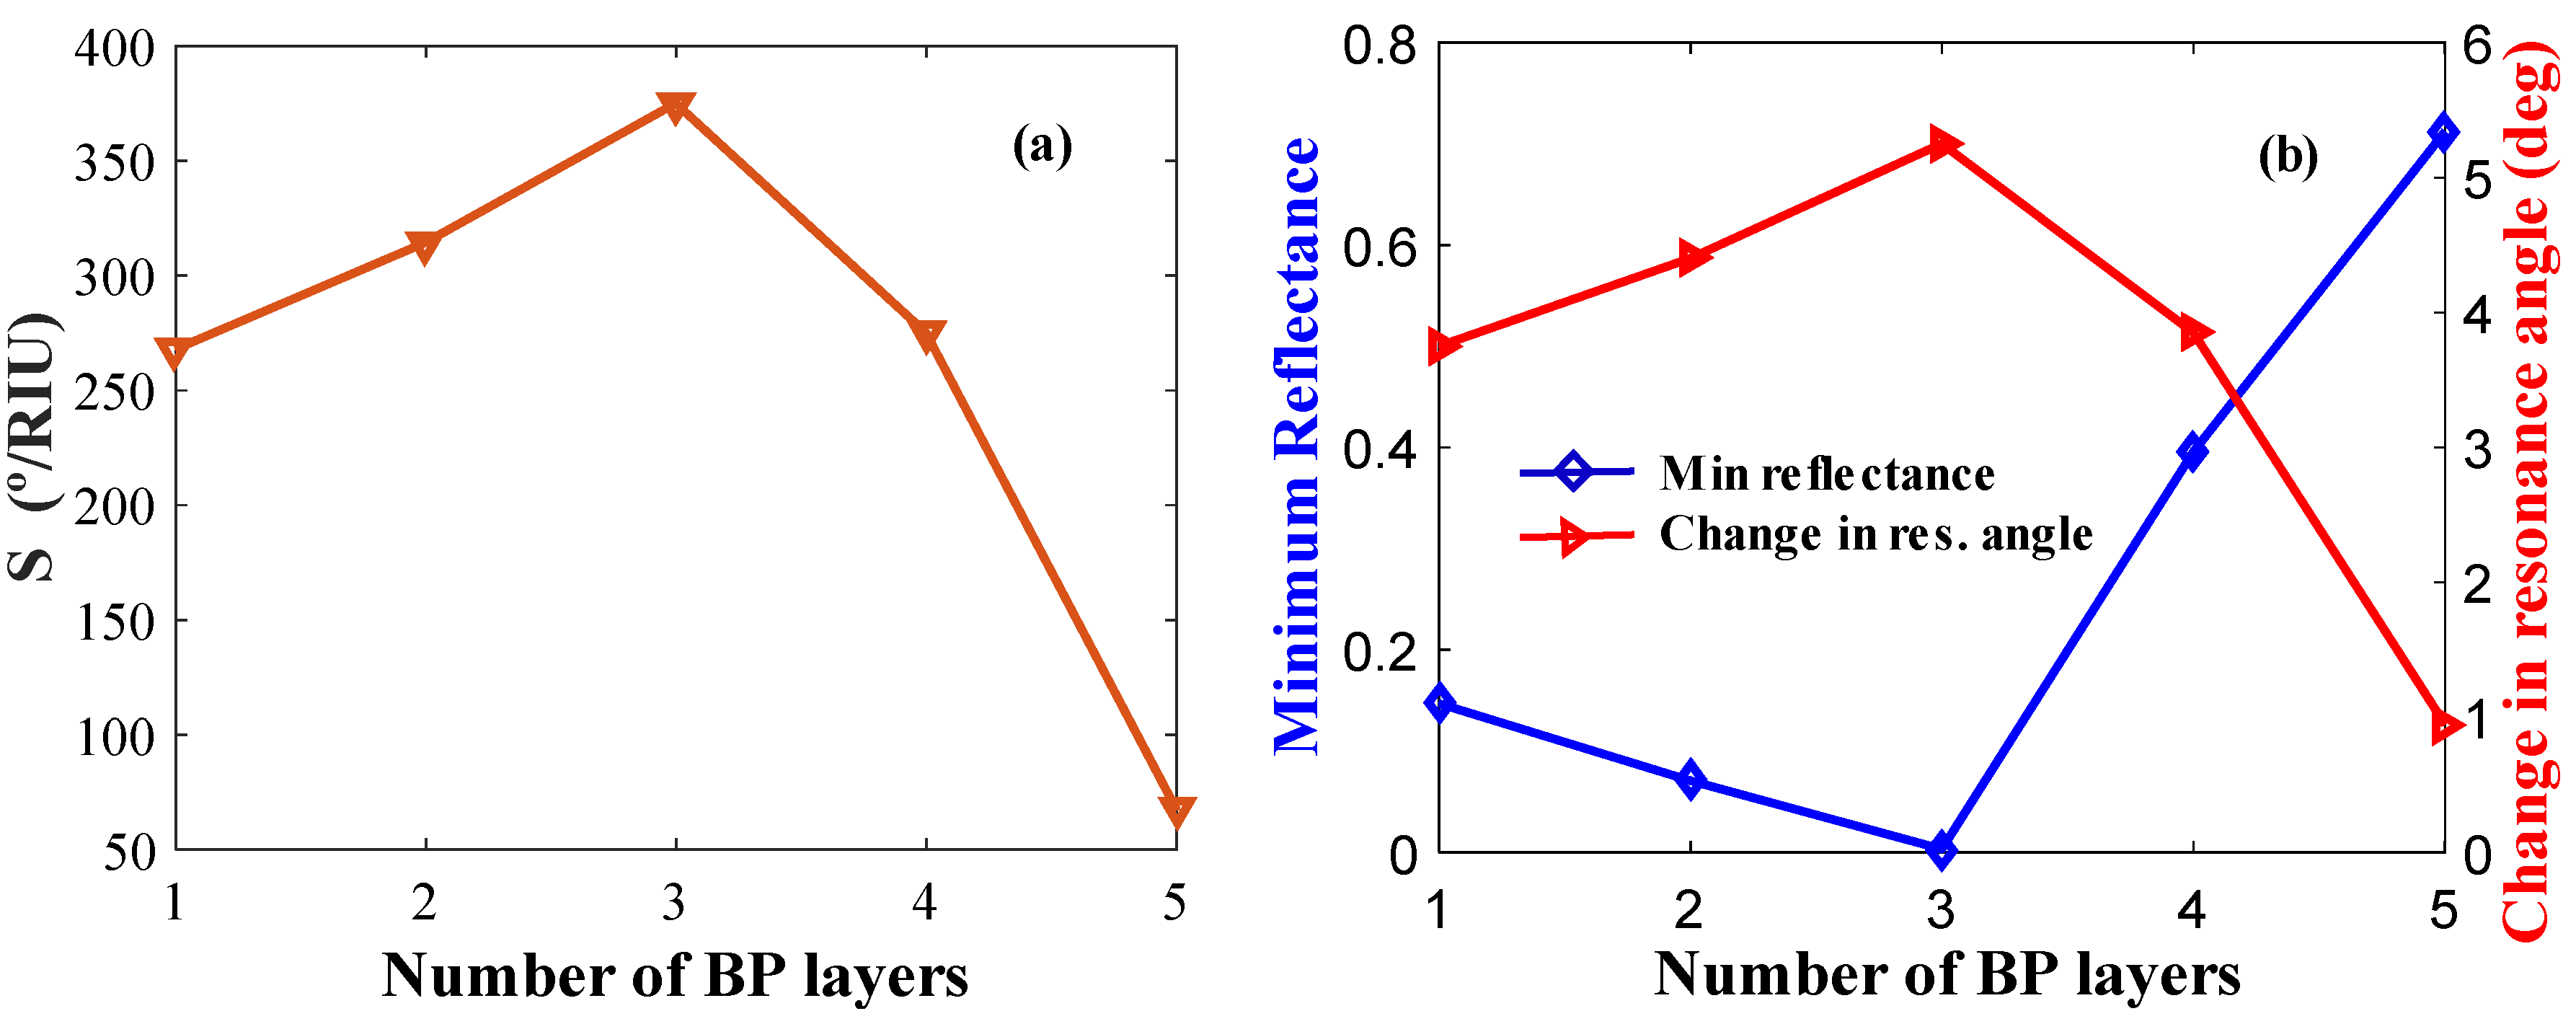
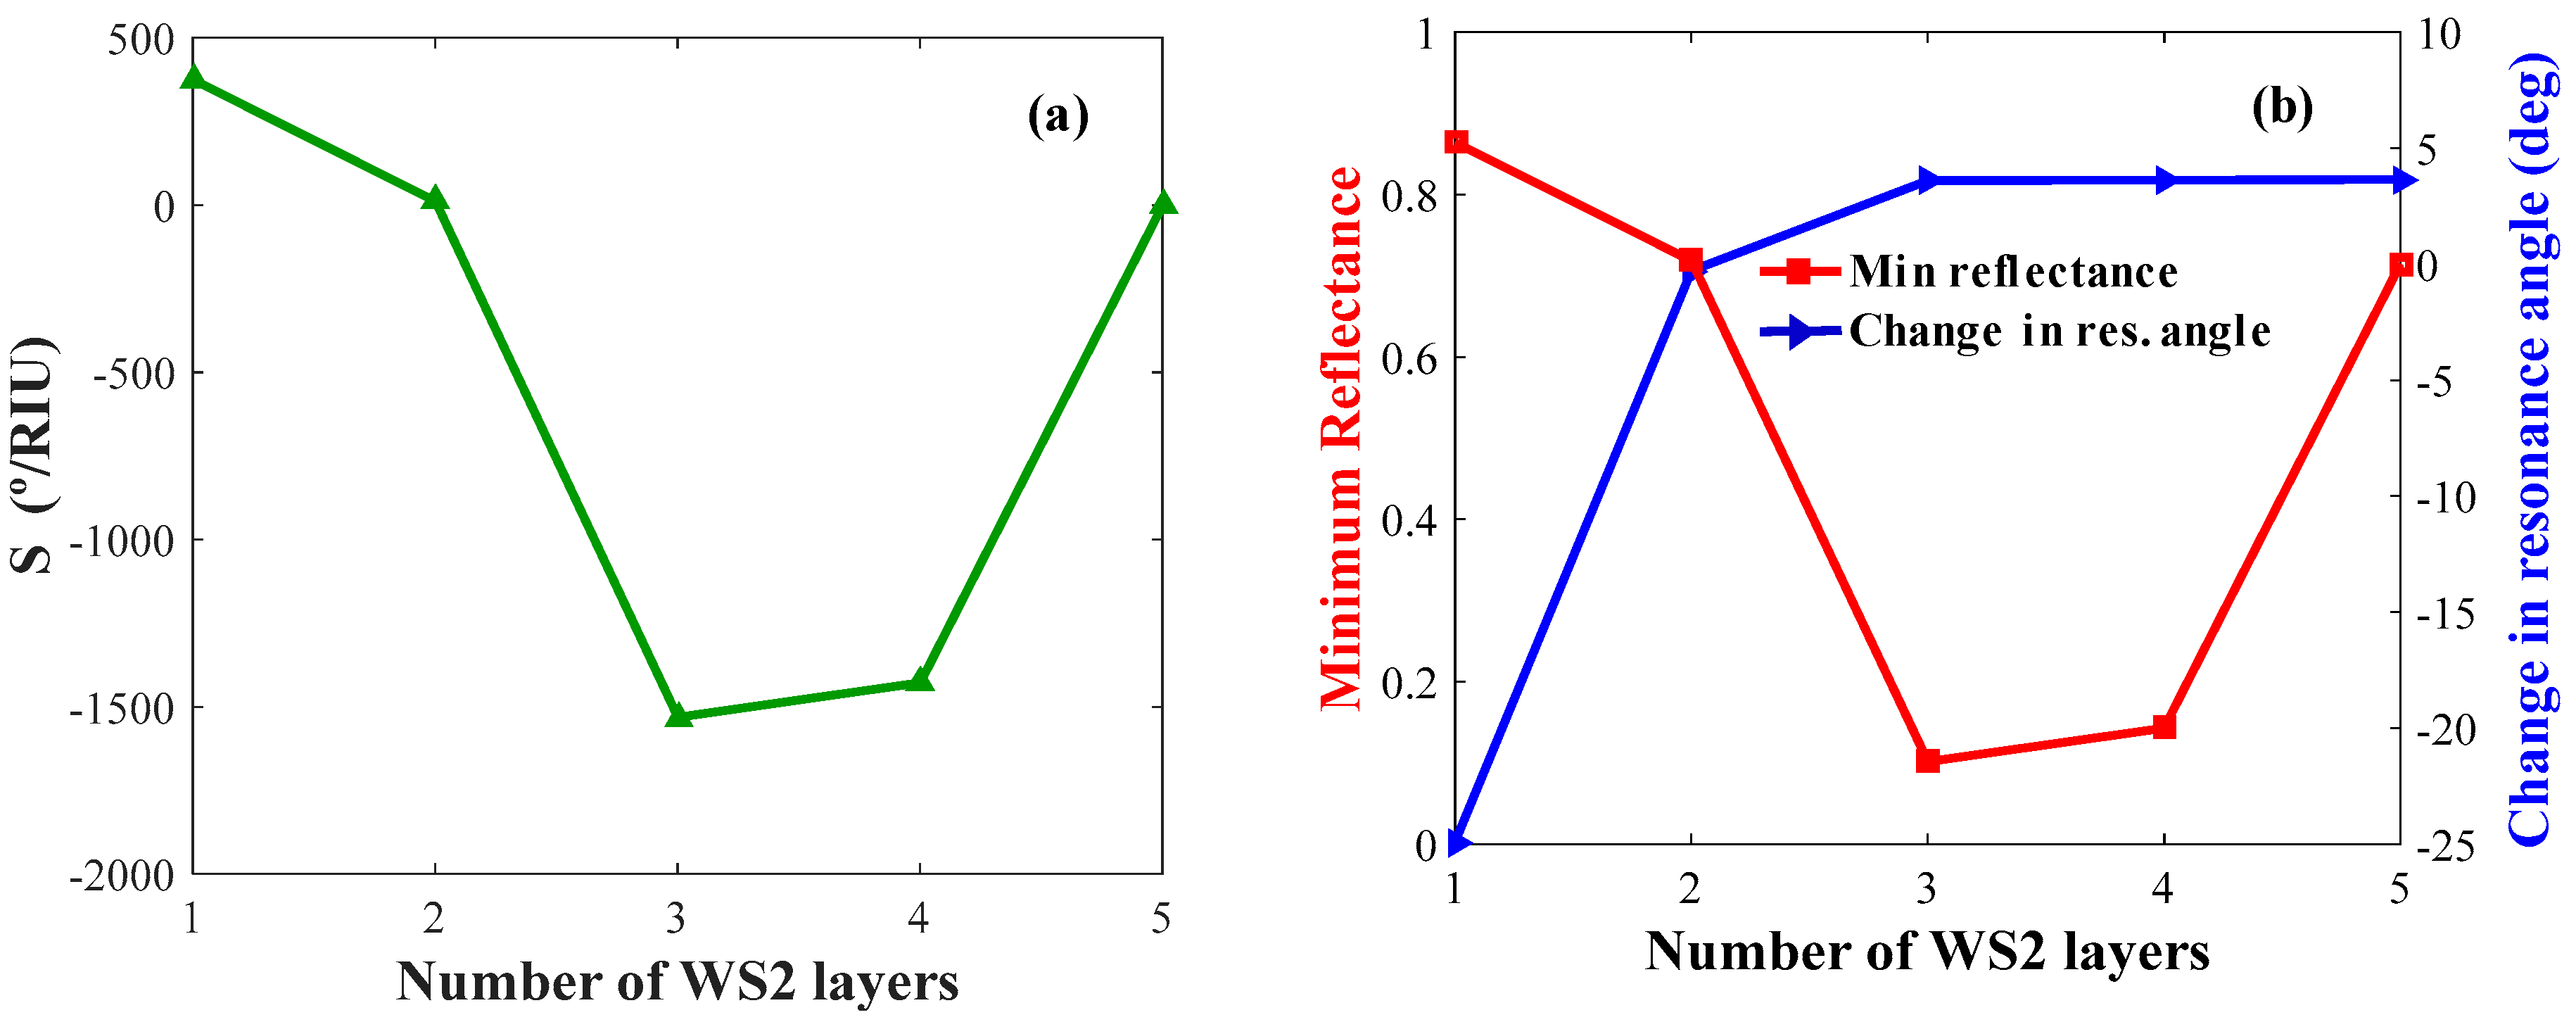
4.2.3. Optimization of Layer Thicknesses
5. Conclusions
Author Contributions
Funding
Conflicts of Interest
References
- Manzeli, S.; Ovchinnikov, D.; Pasquier, D.; Yazyev, O.V.; Kis, A. 2d transition metal dichalcogenides. Nature Rev. Mater. 2017, 2, 17033. [Google Scholar] [CrossRef]
- Rizal, C.; Pisana, S.; Hrvoic, I. Improved magneto-optic surface plasmon resonance biosensors. Photonics 2018, 5, 15. [Google Scholar] [CrossRef]
- Ignatyeva, D.O.; Knyazev, G.A.; Kapralov, P.O.; Dietler, G.; Sekatskii, S.K.; Belotelov, V.I. Magneto-optical plasmonic heterostructure with ultranarrow resonance for sensing applications. Sci. Rep. 2016, 6, 28077. [Google Scholar] [CrossRef] [PubMed]
- Piliarik, M.; Homola, J. Surface plasmon resonance (spr) sensors: Approaching their limits? Opt. Exp. 2009, 17, 16505–16517. [Google Scholar] [CrossRef]
- Nur, J.N.; Shushama, K.N.; Asrafy, F.; Hasib, M.H.H.; Khan, M.A.G. Sensitivity enhancement of surface plasmon resonance biosensor using black phosphorus and WSe2. In Proceedings of the 2019 International Conference on Robotics, Electrical and Signal Processing Techniques (ICREST), Dhaka, Bangladesh, 10–12 January 2019. [Google Scholar]
- Regatos, D.; Sepúlveda, B.; Fariña, D.; Carrascosa, L.G.; Lechuga, L.M. Suitable combination of noble/ferromagnetic metal multilayers for enhanced magneto-plasmonic biosensing. Opt. Exp. 2011, 19, 8336–8346. [Google Scholar] [CrossRef]
- Rizal, C. Magneto-optic surface plasmon resonance ti/au/co/au/pc configuration and sensitivity. Magnetochemistry 2018, 4, 35. [Google Scholar] [CrossRef]
- Lin, Z.; Jiang, L.; Wu, L.; Guo, J.; Dai, X.; Xiang, Y.; Fan, D. Tuning and sensitivity enhancement of surface plasmon resonance biosensor with graphene covered au-mos 2-au films. IEEE Photon. J. 2016, 8, 1–8. [Google Scholar] [CrossRef]
- Narsaiah, K.; Jha, S.N.; Bhardwaj, R.; Sharma, R.; Kumar, R. Optical biosensors for food quality and safety assurance—A review. J. Food Sci. Technol. 2012, 49, 383–406. [Google Scholar] [CrossRef]
- Slavík, R.; Homola, J. Ultrahigh resolution long range surface plasmon-based sensor. Sens. Actuators B Chem. 2007, 123, 10–12. [Google Scholar] [CrossRef]
- Liu, H.; Neal, A.T.; Zhu, Z.; Luo, Z.; Xu, X.; Tománek, D.; Ye, P.D. Phosphorene: An unexplored 2d semiconductor with a high hole mobility. ACS NANO 2014, 8, 4033–4041. [Google Scholar] [CrossRef] [PubMed]
- Nelson, S.; Johnston, K.S.; Yee, S.S. High sensitivity surface plasmon resonace sensor based on phase detection. Sens. Actuators B Chem. 1996, 35, 187–191. [Google Scholar] [CrossRef]
- Novoselov, K.S.; Geim, A.K.; Morozov, S.V.; Jiang, D.; Zhang, Y.; Dubonos, S.V.; Grigorieva, I.V.; Firsov, A.A. Electric field effect in atomically thin carbon films. Science 2004, 306, 666–669. [Google Scholar] [CrossRef] [PubMed]
- Sa, B.; Li, Y.-L.; Qi, J.; Ahuja, R.; Sun, Z. Strain engineering for phosphorene: The potential application as a photocatalyst. J. Phys. Chem. C 2014, 118, 26560–26568. [Google Scholar] [CrossRef]
- Shulenburger, L.; Baczewski, A.D.; Zhu, Z.; Guan, J.; Tomanek, D. The nature of the interlayer interaction in bulk and few-layer phosphorus. Nano Lett. 2015, 15, 8170–8175. [Google Scholar] [CrossRef]
- Rahman, M.S.; Hasan, M.R.; Rikta, K.A.; Anower, M. A novel graphene coated surface plasmon resonance biosensor with tungsten disulfide (ws2) for sensing DNA hybridization. Opt. Mater. 2018, 75, 567–573. [Google Scholar] [CrossRef]
- Vahed, H.; Nadri, C. Sensitivity enhancement of spr optical biosensor based on graphene–MOS2 structure with nanocomposite layer. Opt. Mater. 2019, 88, 161–166. [Google Scholar] [CrossRef]
- Alim, N.; Uddin, M.N. Surface plasmon resonance biosensor in healthcare application. In Proceedings of the 2017 IEEE Region 10 Symposium (TENSYMP), Cochin, India, 14–16 July 2017. [Google Scholar]
- Walsh, L.A.; Addou, R.; Wallace, R.M.; Hinkle, C.L. Molecular beam epitaxy of transition metal dichalcogenides. In Molecular Beam Epitaxy; Elsevier: Amsterdam, The Netherlands, 2018; pp. 515–531. [Google Scholar]
- Shushama, K.N.; Rana, M.M.; Inum, R.; Hossain, M.B. Sensitivity enhancement of graphene coated surface plasmon resonance biosensor. Opt. Quant. Electron. 2017, 49, 381. [Google Scholar] [CrossRef]
- Miceli, P.; Neumann, D.; Zabel, H. X-ray refractive index: A tool to determine the average composition in multilayer structures. Appl. Phys. Lett. 1986, 48, 24–26. [Google Scholar] [CrossRef]
- Johnson, P.; Christy, R. Optical constants of transition metals: Ti, v, cr, mn, fe, co, ni, and pd. Phys. Rev. B 1974, 9, 5056. [Google Scholar] [CrossRef]
- Guo, X.B.; Zuo, Y.L.; Cui, B.S.; Li, D.; Yun, J.J.; Wu, K.; Wang, T.; Xi, L. Post annealing induced magnetic anisotropy in cofesi thin films on mgo(0 0 1). J. Phys. D Appl. Phys. 2017, 50, 085006. [Google Scholar] [CrossRef]
- Wu, L.; Guo, J.; Wang, Q.; Lu, S.; Dai, X.; Xiang, Y.; Fan, D. Sensitivity enhancement by using few-layer black phosphorus-graphene/tmdcs heterostructure in surface plasmon resonance biochemical sensor. Sens. Actuators B Chem. 2017, 249, 542–548. [Google Scholar] [CrossRef]
- Malitson, I.H. A redetermination of some optical properties of calcium fluoride. Appl. Opt. 1963, 2, 1103–1107. [Google Scholar] [CrossRef]
- Schott Zemax Catalog 2017-01-20b [http://www.Schott.Com]. Available online: https://refractiveindex.info/download/data/2017/schott_2017-01-20b.agf (accessed on 22 May 2019).
- Sharma, A.K.; Pandey, A.K. Blue phosphorene/mos 2 heterostructure based spr sensor with enhanced sensitivity. IEEE Photon. Technol. Lett. 2018, 30, 595–598. [Google Scholar] [CrossRef]
- Abraha, K.; Bambang Setio Utomo, A. Computational study of sensitivity enhancement in surface plasmon resonance (spr) biosensors by using the inclusion of the core-shell for biomaterial sample detection. Biosensors 2018, 8, 75. [Google Scholar]
- Pal, S.; Verma, A.; Prajapati, Y.; Saini, J. Influence of black phosphorous on performance of surface plasmon resonance biosensor. Opt. Quant. Electron. 2017, 49, 403. [Google Scholar] [CrossRef]
- Ouyang, Q.; Zeng, S.; Jiang, L.; Hong, L.; Xu, G.; Dinh, X.-Q.; Qian, J.; He, S.; Qu, J.; Coquet, P. Sensitivity enhancement of transition metal dichalcogenides/silicon nanostructure-based surface plasmon resonance biosensor. Sci. Rep. 2016, 6, 28190. [Google Scholar] [CrossRef]


| Materials | Thickness (nm) | n + ik | Sources |
|---|---|---|---|
| Ag | 25–60 | 0.80 + 4.236i | [21,22] |
| Au | 25–60 | 0.1378 + 3.6196i | [21,22] |
| BP | 0.53 | 3.50 + 0.01i | [21,22] |
| MoS2 | 0.65 | 5.0805 + 1.1723i | [24] |
| MoSe2 | 0.70 | 4.6226 + 1.0063i | [24] |
| WS2 | 0.80 | 4.8937 + 0.3124i | [24] |
| WSe2 | 0.70 | 4.5501 + 0.4332i | [24] |
| TMDC | Layers (nm) | n | Sensitivity (°/RIU) | QF (1/RIU) | DA | |
|---|---|---|---|---|---|---|
| MoS2 | 1 × 0.65 | 1.3450 | 4.85 | 323.333 | 47.90 | 0.7185 |
| MoSe2 | 1 × 0.70 | 1.3460 | 5.30 | 331.250 | 50.77 | 0.8123 |
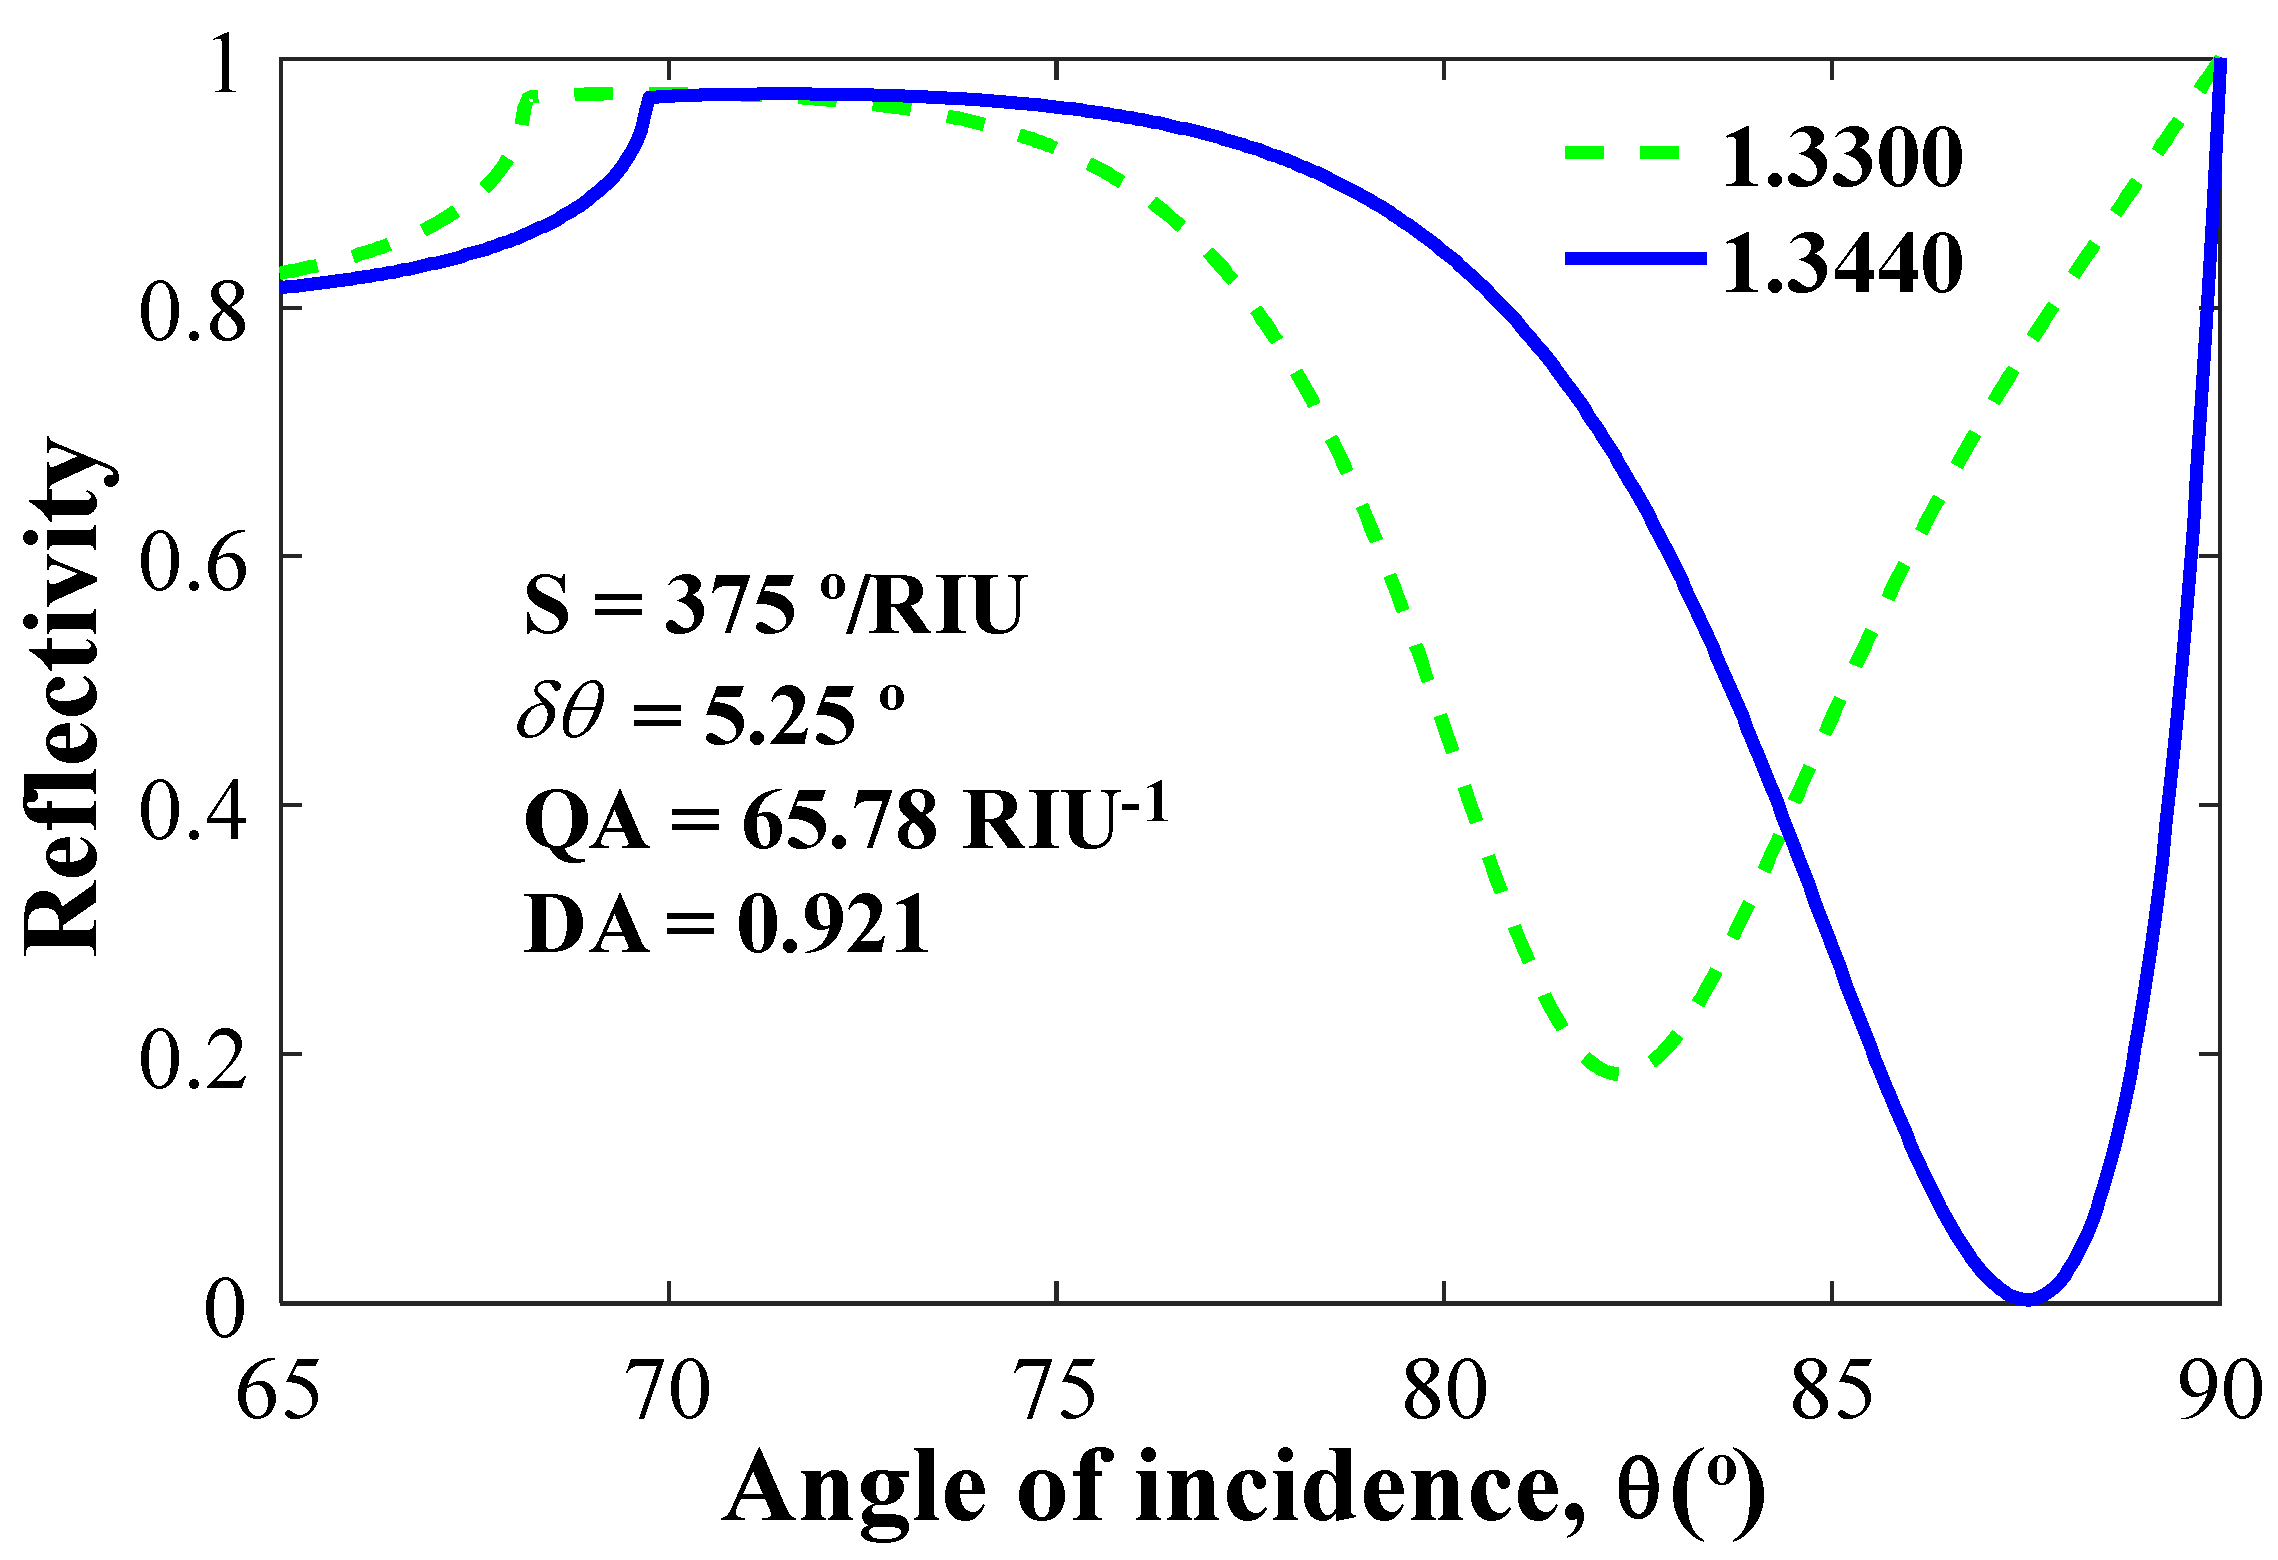
| WS2 | 1 × 0.80 | 1.3440 | 5.25 | 375.000 | 65.78 | 0.9210 |
| WSe2 | 1 × 0.70 | 1.3460 | 5.75 | 359.375 | 62.23 | 0.9957 |
| Ag (1) (nm) | BP (0.53) (nm) | WS2 (0.8) (nm) | Sensitivity °/RIU | QF 1/RIU | DA | Resonance Angle (θSPR) | |
|---|---|---|---|---|---|---|---|
| 35 | 0 | 0 | 200 | 43.96 | 0.6154 | 79.95 | 2.80 |
| 35 | 3 | 0 | 260.71 | 47.40 | 0.6636 | 83.25 | 3.65 |
| 35 | 0 | 1 | 239.29 | 41.98 | 0.5877 | 82.25 | 3.35 |
| 35 | 3 | 1 | 375 | 65.78 | 0.9210 | 87.50 | 5.25 |
| References | Sensor Configuration | Wavelength (nm) | Sensitivity (°/RIU) |
|---|---|---|---|
| Ouyang and Zeng (2016) [30] | Prism/Au/Si/MoS2 | 600 | 155.68 |
| Lin (2016) [8] | Prism/Au/MoS2/Au | 633 | 182 |
| Pal (2017) [29] | Prism/Au/Bp | 633 | 180 |
| Shushama (2017) [20] | Prism/Au/Si/MoS2/Au/Graphene | 633 | 210 |
| Hamid (2019) [17] | Air/MoS2/Nanocomposite/MoS2/Graphene | 633 | 200 |
| Proposed [This Work] | Prism/Ag/BP/WS2 | 633 | 375 |
© 2019 by the authors. Licensee MDPI, Basel, Switzerland. This article is an open access article distributed under the terms and conditions of the Creative Commons Attribution (CC BY) license (http://creativecommons.org/licenses/by/4.0/).
Share and Cite
Hasib, M.H.H.; Nur, J.N.; Rizal, C.; Shushama, K.N. Improved Transition Metal Dichalcogenides-Based Surface Plasmon Resonance Biosensors. Condens. Matter 2019, 4, 49. https://doi.org/10.3390/condmat4020049
Hasib MHH, Nur JN, Rizal C, Shushama KN. Improved Transition Metal Dichalcogenides-Based Surface Plasmon Resonance Biosensors. Condensed Matter. 2019; 4(2):49. https://doi.org/10.3390/condmat4020049
Chicago/Turabian StyleHasib, Mohammad Hasibul Hasan, Jannati Nabiha Nur, Conrad Rizal, and Kamrun Nahar Shushama. 2019. "Improved Transition Metal Dichalcogenides-Based Surface Plasmon Resonance Biosensors" Condensed Matter 4, no. 2: 49. https://doi.org/10.3390/condmat4020049
APA StyleHasib, M. H. H., Nur, J. N., Rizal, C., & Shushama, K. N. (2019). Improved Transition Metal Dichalcogenides-Based Surface Plasmon Resonance Biosensors. Condensed Matter, 4(2), 49. https://doi.org/10.3390/condmat4020049