Review

The Variational Reduction for Low-Dimensional Fermi Gases and Bose–Fermi Mixtures: A Brief Review

1
Departamento de Ciencias Físicas, Universidad de La Frontera, Casilla 54-D, Temuco 4811230, Chile
2
Instituto de Alta Investigación, CEDENNA, Universidad de Tarapacá, Casilla 7D, Arica 1000000, Chile
3
Department of Physical Electronics, School of Electrical Engineering, Faculty of Engineering, Tel Aviv University, Tel Aviv IL-69978, Israel
*
Author to whom correspondence should be addressed.
Condens. Matter 2019, 4(1), 22; https://doi.org/10.3390/condmat4010022
Submission received: 26 December 2018 / Revised: 24 January 2019 / Accepted: 5 February 2019 / Published: 10 February 2019

Abstract

:
We present a summary of some recent theoretical results for matter-wave patterns in Fermi and Bose–Fermi degenerate gases, obtained in the framework of the quasi-mean-field approximation. We perform a dimensional reduction from the three-dimensional (3D) equations of motion to 2D and 1D effective equations. In both cases, comparison of the low-dimensional reductions to the full model is performed, showing very good agreement for ground-state solutions. Some complex dynamical regimes are reported too for the corresponding 1D systems.

1. Introduction

Ultracold atomic gases have been widely explored from both experimental and theoretical point of view due to their ability to emulate many effects from condensed-matter physics and create novel states of quantum matter. Various results obtained in this area have been reviewed in many publications—see, in particular, Refs. [1,2,3,4,5,6,7,8]. Important experimental tools, the application of which opens ways to the observation diverse novel phenomena in the quantum gases, are, inter alia, optical-lattice (OL) potentials, the use of the Feshbach resonance (FR) to control the strength of interactions between atoms, and the implementation of the effective spin-orbit coupling [9,10,11,12,13].
The effective spatial dimension of the setting in which quantum gases are created strongly affects the ensuing physics. The use of confining potentials makes it possible to reduce the dimension from 3D to 2D and 1D. In particular, the dimensional reduction of confined Bose gases can be approximated by means of the variational method [14,15,16,17]. Recently, similar approaches for ultracold Fermi gases in confining potentials have been elaborated in Refs. [18,19,20,21]. These reductions make it possible to study the complex dynamics and pattern formation in ultracold gases in 2D and 1D settings. In this context, the study of dark solitons in ultracold gases was reported in Bose-Einstein condensates (BECs) [22], and further developed later [23,24,25]. For dark solitons in Fermi gases, several works have reported theoretical and experimental results [26,27,28,29,30,31,32]. The reduced 1D equation for Fermi gases was used for studies of interactions between dark solitons [21].
The earliest experimental studies of Bose-Fermi mixtures (BFMs) were performed with lithium isotopes [33,34], as well as in 174 Yb- 6 Li [35] and 87 Rb- 40 K [36] settings. Much interest has been also drawn to heavy-atom mixtures, such as 87 Sr- 84 Sr [37]. These isotopes, which are characterized by a large nuclear spin, have been proposed for the design of prototype quantum-information processing devices. The use of FRs in the mixtures plays a major role, as it allows one to control nonlinear interactions between the species. For the 87 Rb- 40 K mixture, the FR has been observed in Ref. [38,39], and a giant FR effect was reported in the 85 Rb- 6 Li system [40]. Further, in the 6 Li- 133 Cs mixture five FRs have been observed [41], and over 30 resonances are expected to be available in the 23 Na- 40 K system [42]. Multiple heteronuclear FRs were reported in the triply quantum-degenerate mixture of bosonic 41 K and two fermionic species, 40 K and 6 Li [43]. In a recently elaborated framework, the BFM is transformed into a strongly interacting isotopic mixture immersed into a Fermi sea, with the help of a wide s-wave resonance for the 41 K- 40 K combination. Many theoretical works have addressed the dynamics of BFMs under various conditions [44,45,46,47,48,49,50]. To describe the ground state (GS) of the mixture, the quasi-mean-field theory may be a useful approach [9,51,52,53,54]. In this framework, the use of FRs was studied in 23 Na- 6 Li, 87 Rb- 40 K, 87 Rb- 6 Li, 3 He- 4 He, 173 Yb- 174 Yb, and 87 Sr- 84 Sr mixtures [55,56]. Recently, effective 1D and 2D nonlinear Schrödinger equations have been derived for BFMs in cigar-shaped and disc-shaped configurations [57], using the variational approximation (VA) along the lines previously developed in Refs. [14,21]. In addition, dark solitons in BFMs have been analyzed in Ref. [58]. Here, we address, in particular, dark solitons in the 7 Li- 6 Li BFM, using the effective low-dimensional equations derived in Ref. [57].
The general aim of the present article is to present a brief review of the spatial reduction for Fermi gases and BFMs, based on the VA. In particular, we outline the procedure for implementing the 2D and 1D reduction, starting from the full 3D equations of motions. To test the accuracy of the approximations, we present a comparison of the results with full 3D numerical simulations. Using the corresponding effective equations, we address various dynamical settings, such as dark solitons and their interactions. In the case of BFMs, we consider the construction of GSs, varying the interaction strength. Finally, for the 1D situation, we address the formation of dark solitons in the mixture, and compare the corresponding 1D solution to results of the full numerical simulations, observing good agreement between them. The presentation is arranged as follows: the Fermi gases and BFMs are considered, severally, in Section 2 and Section 3, and the paper is concluded in Section 4.

2. The Fermi Gas

We consider a dilute superfluid formed by N fermionic atoms of mass m F and spin s F , loaded into an optical trap at zero temeprature. We apply the local density approximation [4] to the description of this setting. The corresponding dynamical equations can be derived from the action functional
S = d t d r L ,
where the Lagrangian density is
L = i 2 λ 1 Ψ * Ψ t Ψ Ψ * t 2 2 λ 2 m F Ψ 2 U ( r ) Ψ 2 3 5 β 2 2 m F C F Ψ 10 / 3 g F 2 Ψ 4 ,
Ψ r , t being a complex order parameter, whose norm is equal to the number of particles. Here, C F = 6 π 2 / 2 s F + 1 2 / 3 is a constant that depends on spin s F , g F = 4 π 2 ( a F / m F ) [ 2 s F / ( 2 s F + 1 ) ] with scattering length a F , which determines interactions of fermions belonging to different spin states (the interactions which are not forbidden by the Pauli principle) [3], and U ( r ) is to an external potential applied to fermions.
Parameters λ 1 , λ 2 , β , and s F in Equation (2) correspond to three different regimes addressed in this article, which are listed in Table 1. It is relevant to mention that the spin polarization may affect some parameters, such as coefficient C F [63].
Lagrangian density (2) gives rise to the following The Euler–Lagrange equation,
i λ 1 Ψ t = 2 2 λ 2 m F 2 + U + g F Ψ 2 + 2 2 m F β C F Ψ 4 / 3 Ψ ,
which as an effective quasi-mean-field equation for the fermi gas under the consideration; note that it may be rewritten in the form of hydrodynamic equations [64,65]. More details on the derivation of this equation are given in Appendix A. Below, we focus on the BCS (Bardeen-Cooper-Schrieffer) setting, referring to atoms of 6 Li with mass 6 a.u.
In numerical simulations we use the fourth-order Runge–Kutta method in time, and the centered second-order finite-difference method for handling the spatial discretization. In the next two subsections we reduce the full 3D equation to the corresponding 2D and 1D effective equations, using the VA proposed in Ref. [21].

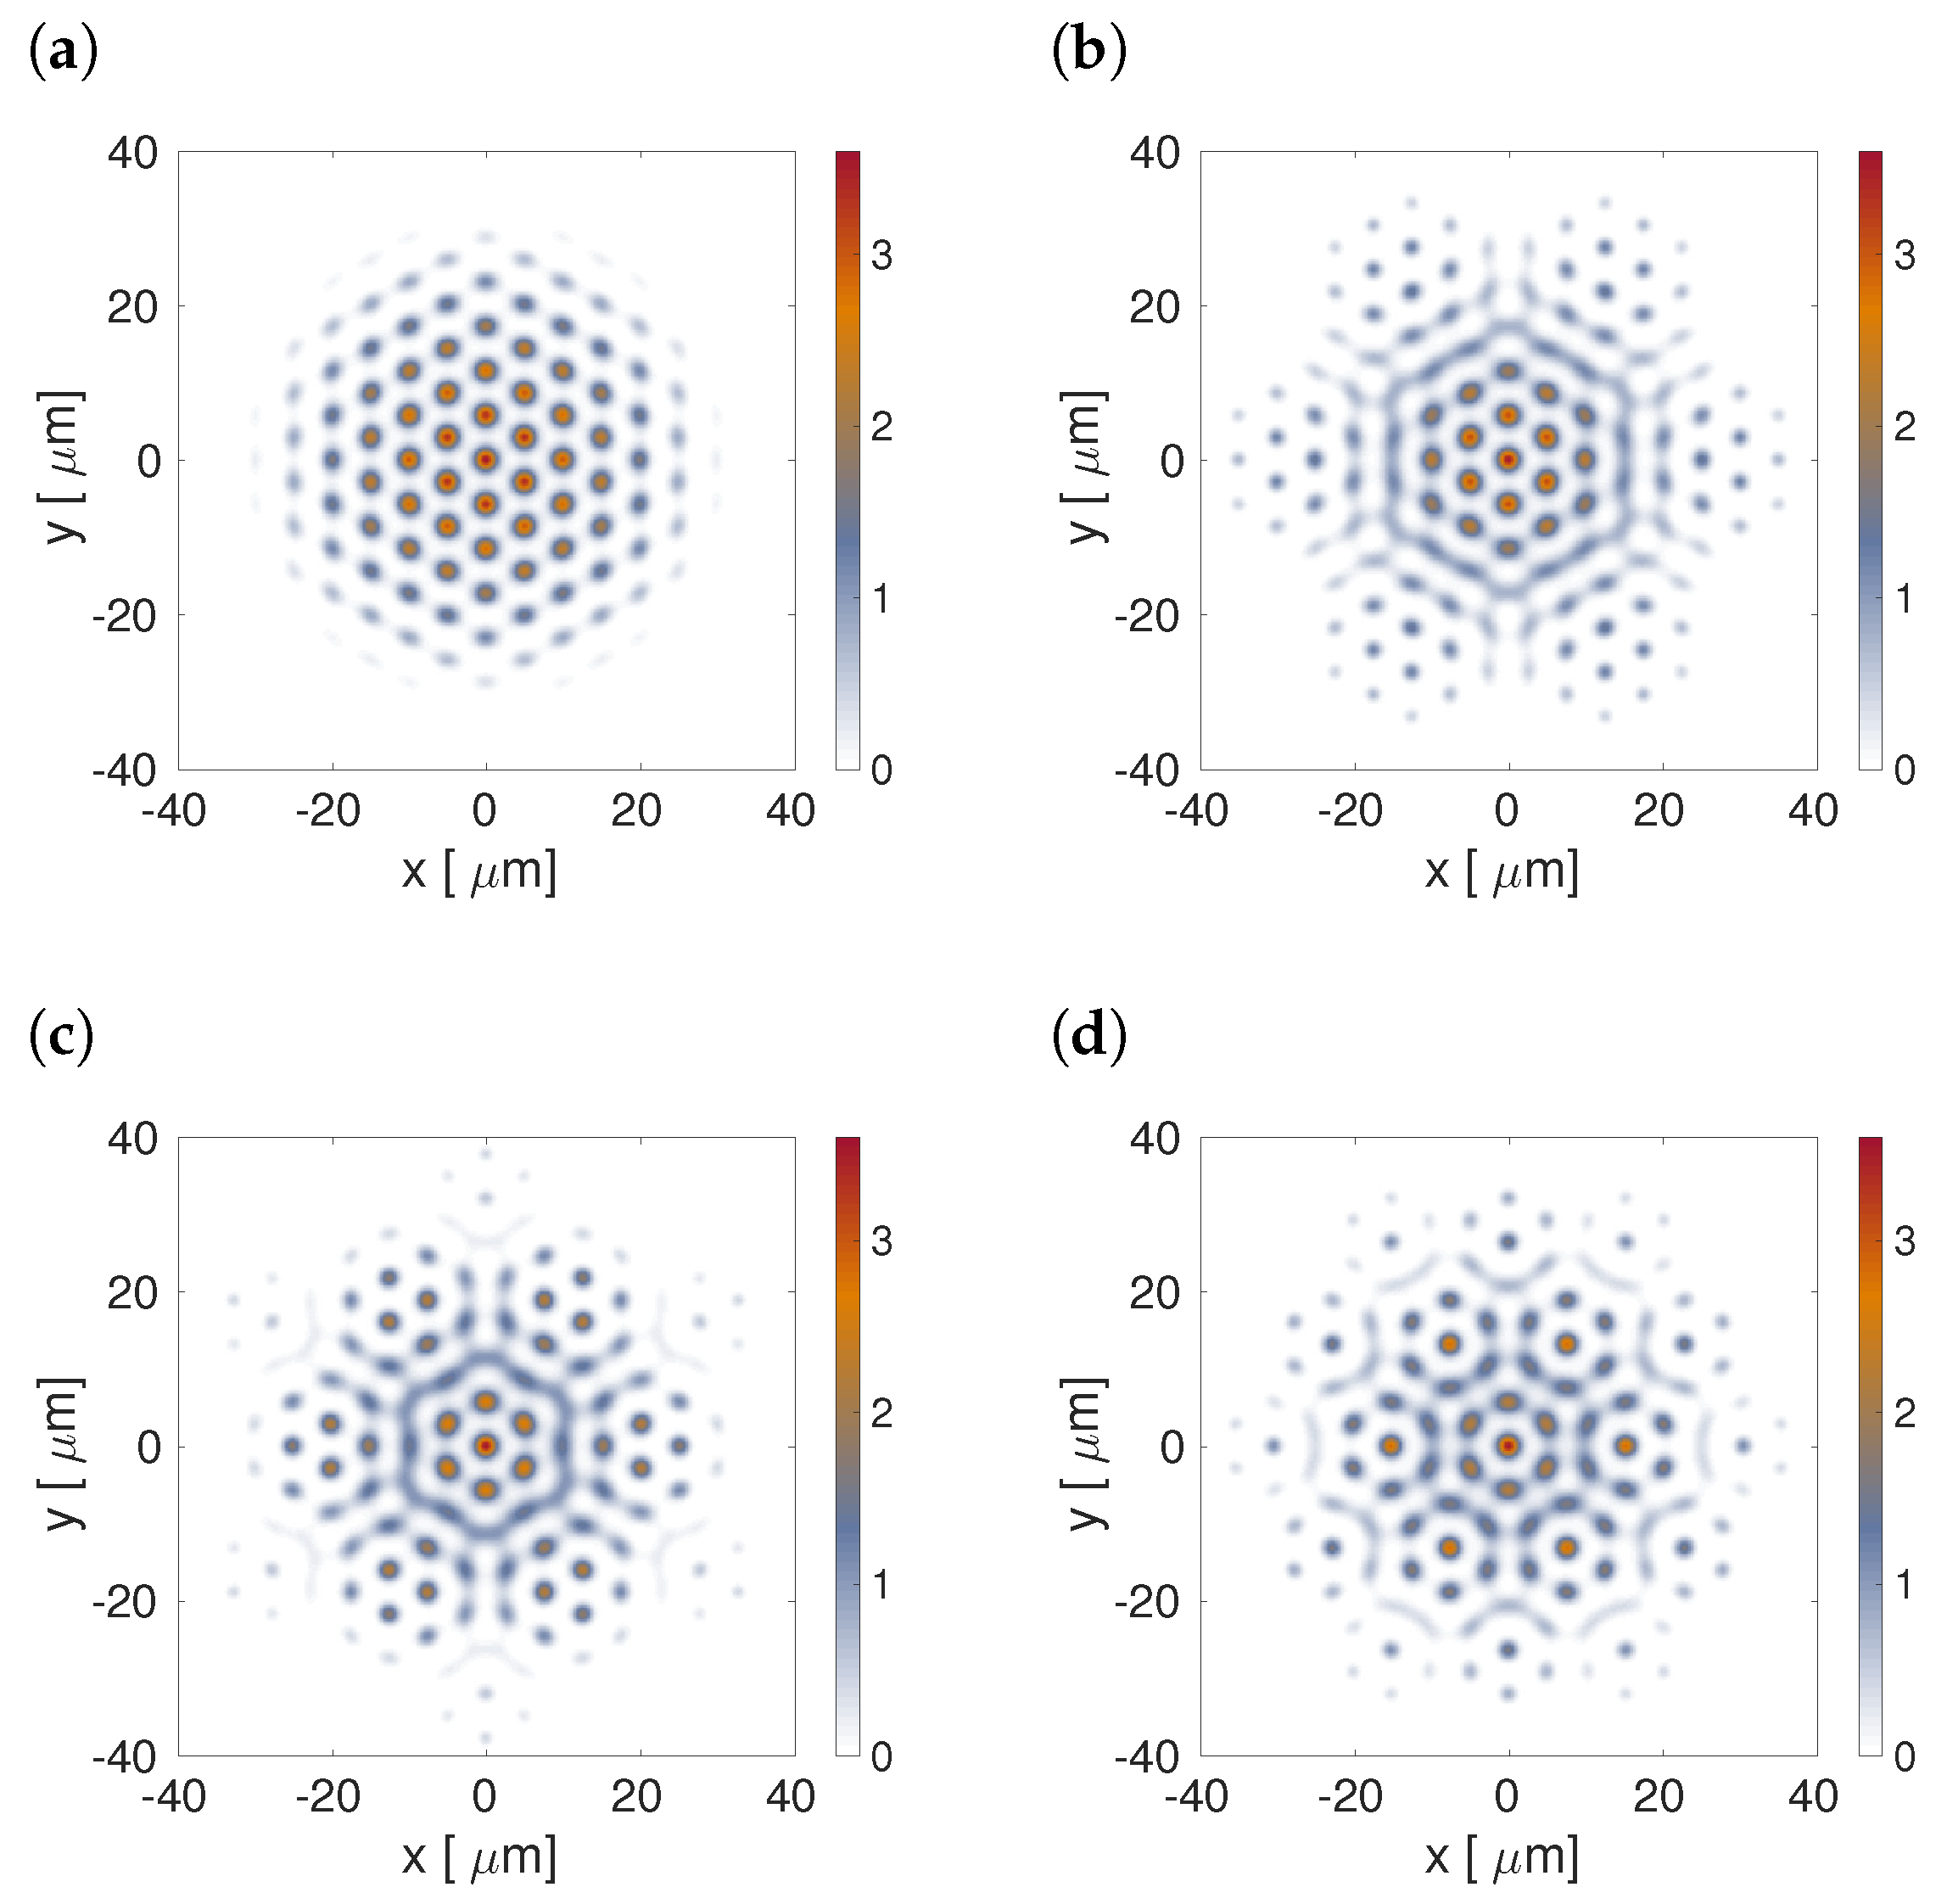
2.1. The Two-Dimensional Reduction

We derive effective 2D equations, applying the VA to the Fermi gas in the disk-shaped trap. For this purpose, we consider an external potential composed of two terms: the parabolic (harmonic-oscillator) one accounting for the confinement in the z direction, transverse to the disk’s plane, and the in-plane potential, U 2 D :
U r = 1 2 m F ω z 2 z 2 + U 2 D r , t .
The initial ansatz assumes, as usual, the factorization of the 3D wave function into a product of functions of z and r , the former one being the Gaussian ground state of the harmonic-oscillator potential [14]:
Ψ r , t = 1 π 1 / 4 ξ ( r , t ) exp z 2 2 ( ξ ( r , t ) ) 2 ϕ r , t .
The Gaussian is subject to the unitary normalization, with transverse width ξ considered as a variational parameter, while the 2D wave function, ϕ , is normalized to the number of atoms. Therefore, the reduction from 3D to 2D implies that the system of equations should be derived for the pair of functions ϕ r , t and ξ r , t , using the reduced action functional, which is obtained by integrating the 3D action over the z-coordinate:
S 2 D = d t d x d y L 2 D ,
where the respective Lagrangian density is
L 2 D = i 2 λ 1 ϕ * t ϕ ϕ t ϕ * 2 2 λ 2 m F ϕ 2 U 2 D ϕ 2 2 2 m F 3 β C 2 D 5 ξ 2 / 3 ϕ 10 / 3 g F 2 2 π 1 / 2 ξ ϕ 4 2 4 m F λ 2 ξ 2 ϕ 2 1 4 m F ω z 2 ξ 2 ϕ 2 ,
C 2 D ( 3 / 5 ) 1 / 2 ( 6 / ( 2 s F + 1 ) ) 2 / 3 π , the last two terms being produced by the reduction to 2D, the penultimate term corresponding to the spread in the confined dimension. Hence, the Euler–Lagrange equations, derived by varying the 2D action, which is generated by Lagrangian (7), with respect to ϕ and ξ , take the form of
i λ 1 t ϕ = 2 2 λ 2 m F 2 + U 2 D + g F 2 π ξ ϕ 2 + 2 2 m F β ξ 2 / 3 C 2 D ϕ 4 / 3 + 2 4 λ 2 m F ξ 2 + 1 4 m F ω z 2 ξ 2 ϕ ,
m F ω z 2 ξ 4 2 2 5 m F β C 2 D ϕ 4 / 3 ξ 4 / 3 g F 2 π ϕ 2 ξ 2 λ 2 m F = 0 .
Algebraic Equation (9) for ξ cannot be solved analytically, therefore we used the Newton’s method to solve it numerically. The necessity to find ξ at each step of the integration is a numerical complication of a minimal cost compared to the 3D integration of the underlying Equation (3). Note that a further simplifications can be achieved by assuming in Equation (5) that the Gaussian width is a constant ξ ( r , t ) = ξ 0 . In this case ξ , naturally, does not depend on ϕ . Then, the solution of Equation (9) with the density tending to zero can be calculated analytically and it is given by ξ 0 = λ 2 1 / 4 / m F ω z .
We consider a 2D potential consisting of the axisymmetric parabolic potential and the superposition of two triangular OLs:
U 2 D = A b = 1 2 a = 1 3 sin 2 2 π λ ( k a , b · r ) + 1 2 m F ω x 2 x 2 + 1 2 m F ω y 2 y 2 ,
where { k a , 1 } and { k a , 2 } are triplets of unitary vectors of both triangular lattices, which are separated by a specific angle θ . Here A denotes the lattice’s amplitude, and ( ω x , ω y ) are frequencies of the magnetic-optical trapping potential. In the absence of the OLs ( A = 0 ), we have verified the accuracy of the 2D reduction by comparing results generated by this approximation to those obtained by integrating the underlying 3D Equation (3). The respective GS was found by means of the imaginary-time integration based on the fourth-order Runge–Kutta algorithm with Δ t = 0.5 μ s. The spatial discretization for the simulations was performed with Δ x = 0.25 μ m and Δ y = 0.25 μ m. The comparison is displayed in panel (a) of Figure 1, where the radial-density profiles are plotted. We can observe excellent agreement between the reduced 2D and full 3D descriptions. This result suggests one to use the Equations (8) and (9) for studying 2D patterns. Panel (b) of Figure 1 shows a comparison of 3D full numerical simulations versus the VA, assuming a constant width ξ 0 . One can observe that the latter approximation produces less accurate results, which is at least ten times worse than the VA with a density-dependent width.
Figure 2 shows the density as a function of coordinates x and y when the OLs are taken into account. We observe that this particular combination of the OLs (a superlattice) produces a pattern in the form of the superstructure, with the number of density peaks varying when the angle between the unitary vectors increases. Note that the multitude of different coexisting robust multi-peak patterns suggests that this setting has a potential for the use as a data-storage system.

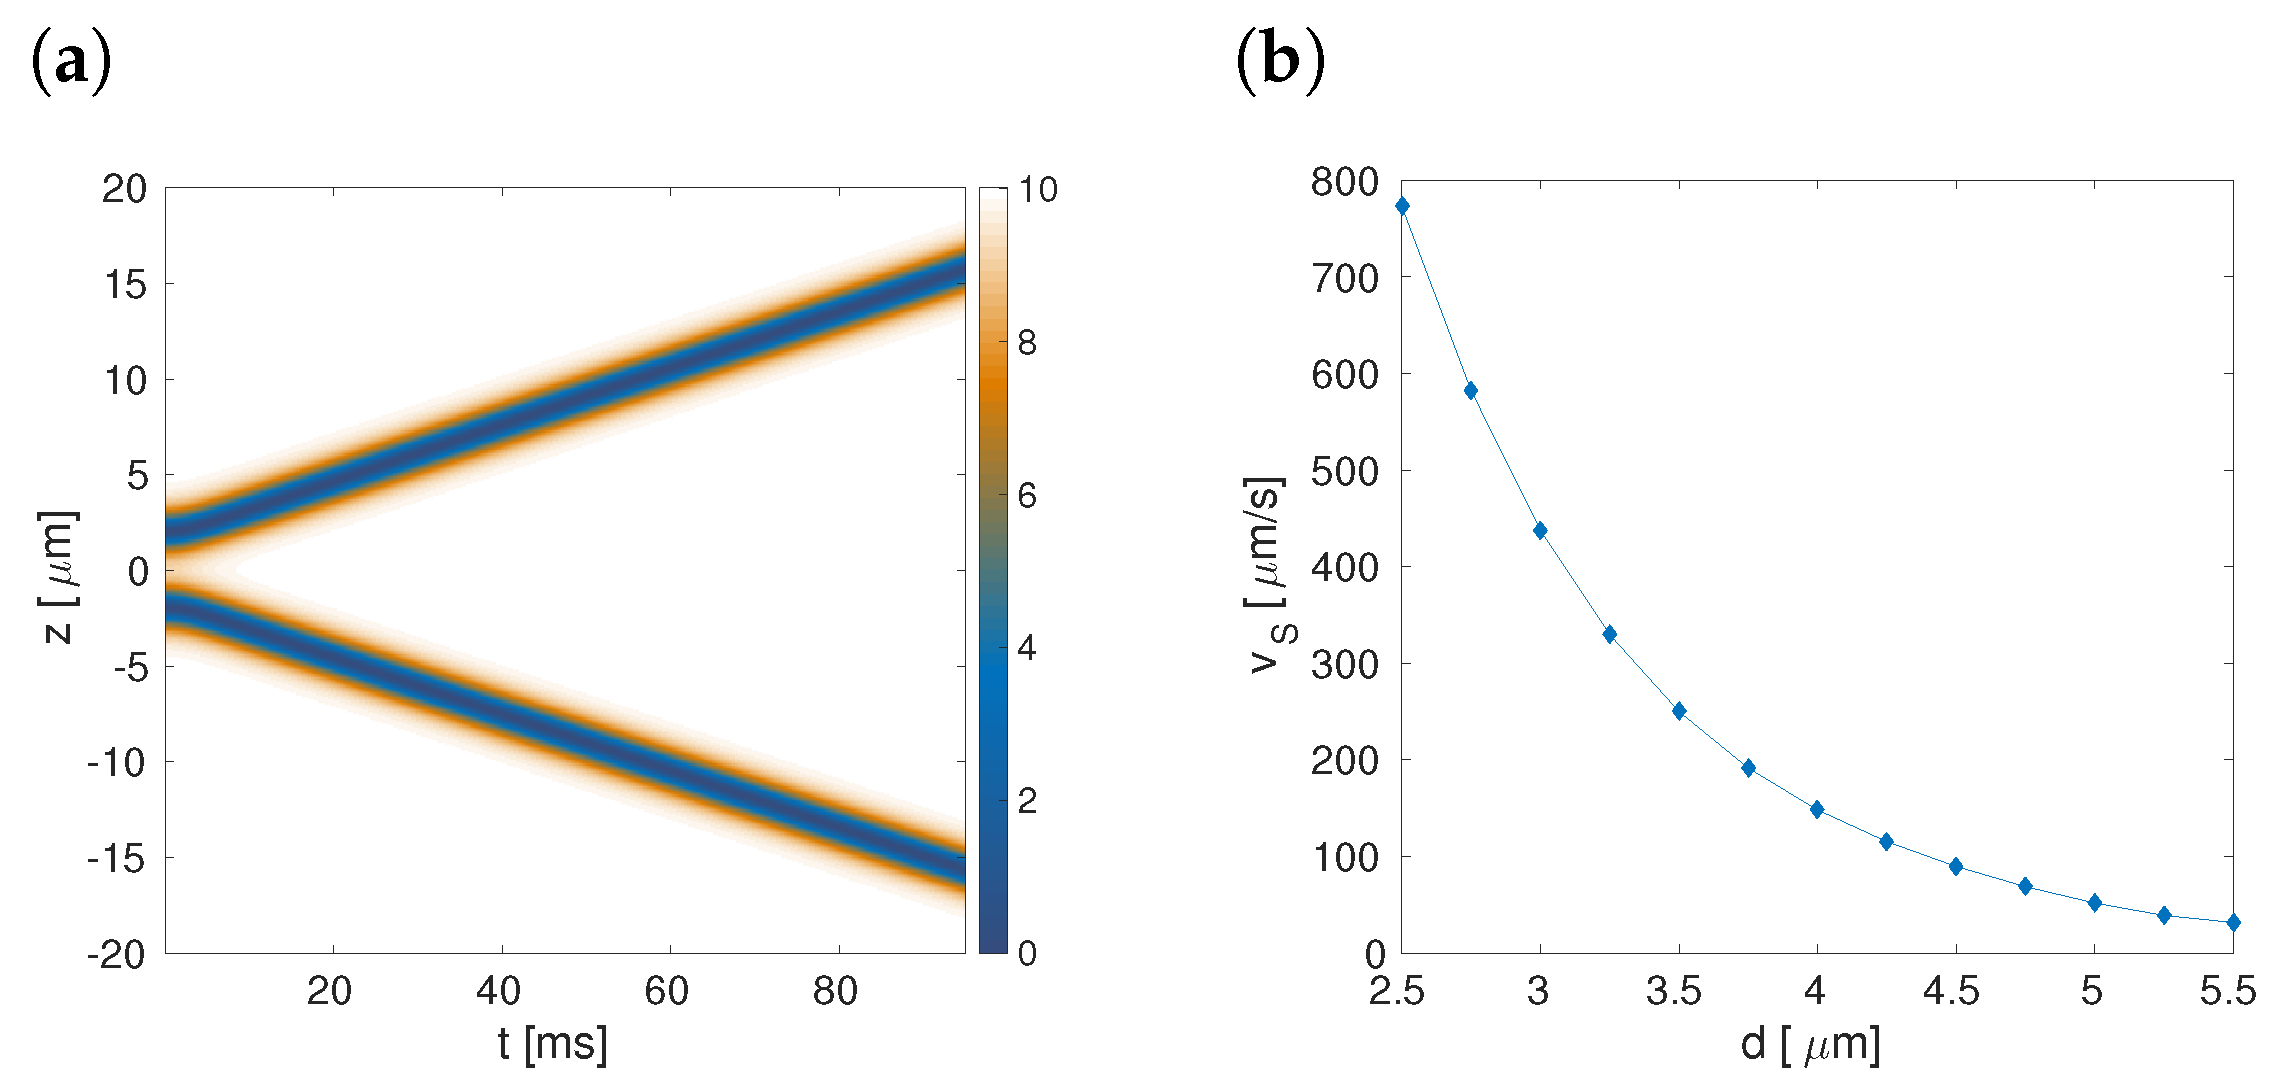
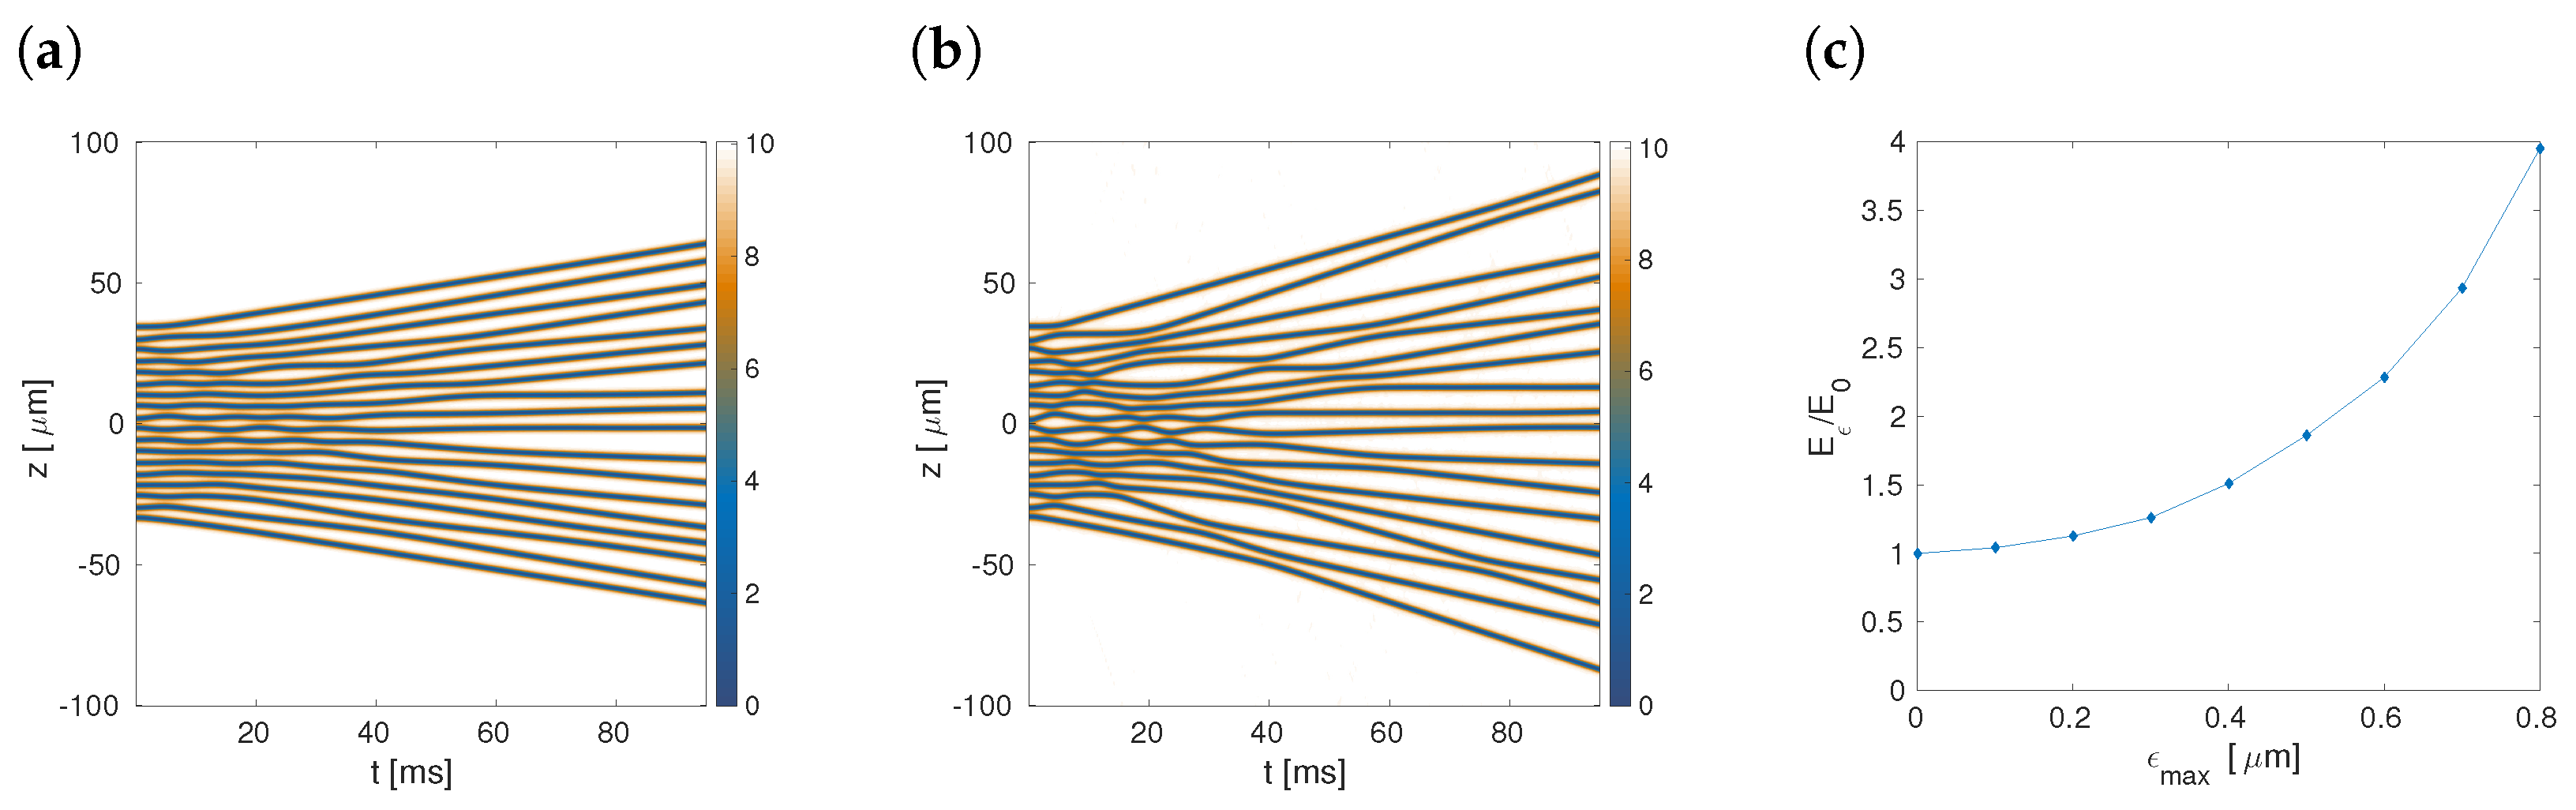
2.2. The One-dimensional Reduction

Next, we consider the system confined in one dimension, which implies a cigar-shaped configuration, elongated in the z direction. In this case, the potential trap acting in transeverse plane is the harmonic oscillator in the transverse plane:
U r = U 1 D z + 1 2 m F ω t 2 r 2 ,
where r 2 = x 2 + y 2 . It is assumed that the potential in the transverse direction is much stronger than the axial one. The simplest option is to adopt a Gaussian shape in the transverse plane, which represents the ground state of a the 2D harmonic oscillator, similar to what is adopted above in the case of the 2D reduction. As a result, the variable-separation assumption can be applied, defining the 3D wave function as [14,15,16]
Ψ r , t = 1 π 1 / 2 σ z , t exp r 2 2 σ z , t 2 f z , t ,
where f is normalized to N, such that the 1D density is n 1 D = f 2 . Here σ is the Gaussian width, which is a function of z and time. After some algebra, similar to that performed above, one derives the Euler–Lagrange equations:
i λ 1 t f = 2 2 λ 2 m F z 2 + U 1 D + g F 2 π σ 2 f 2 + 2 2 m F β C 1 D σ 4 / 3 f 4 / 3 + 2 2 m F λ 2 σ 2 1 2 m F ω t 2 σ 2 f ,
m F ω t 2 σ 4 2 5 2 m F β C 1 D | f | 4 / 3 σ 2 / 3 2 λ 2 m F g F 2 π | f | 2 = 0 ,
where C 1 D = ( 3 / 5 ) ( 6 π ( 2 s F + 1 ) ) 2 / 3 . Similar to the 2D case, algebraic Equation (14) is solved using the Newton’s method, and here too the quasi-BCS regime is addressed. We set U 1 D = 0 , a F = 5 nm, and ω t = 1000 Hz, these parameters being in the range of experimental values [29]. Since Equations (13) and (14) produce results which agree well with the full 3D simulations [21], one can use the effective 1D equations to study more complex dynamical behavior, such as that of dark solitons [29,32].
To generate a dark soliton, it is posible to consider the initial condition with zero imaginary part, f I ( z , t = 0 ) = 0 , while the real part is given by f R ( z , t = 0 ) = f b tanh ( ( z z s ) / Δ s ) , where f b and Δ s are the soliton’s amplitude and width, respectively. We have found that values of the square amplitude and width, n b = 10 particles/ μ m and Δ s = 0.8 μ m, respectively, can be chosen to minimize the background noise. If we consider a set of N s dark solitons, the initial condition for the imaginary part is again zero, f I = 0 , while the real part can be cast in the form of
f R z , t 0 = 1 2 + 1 2 j = 1 N s / 2 1 1 + j tanh z z j Δ s + 1 + 1 j tanh z z j Δ s + 1 ,
where the positions of the solitons are z j and z j on the positive and negative z half-axes, receptively. Moreover, the widths of the solitons ( Δ s ) are considered the same, and that the number of initial solitons N s is even. This initial ansatz was normalized to secure the correct density of the wave function, n b = | f b | 2 . Then, the system was simulated with the help of the standard fourth-order Runge-Kutta method with Δ t = 0.095 μ s. The spatial discretization for the simulations was performed with Δ z = 0.100 μ m. Figure 3 shows the shape of the initial conditions for the case of one and N s = 18 dark solitons.
In the case of two solitons, we have z i = z i = d / 2 , where d is the initial inter-core separation. Frame (a) of Figure 4 shows the spatiotemporal diagram for two solitons at d = 4 μm. One clearly observes that both solitons separate in the course of the evolution. Frame (b) of Figure 4 shows the speed taken after 90ms of the evaluation as a function of different initial inter-core separations between the dark solitons. naturally, smaller initial separations generate higher speeds. In fact, at this fix time the speed follows the law v s d α , with α = 3.49 . Other features of the two-soliton interaction can be found in Ref. [32].
Figure 5 shows the spatiotemporal diagrams for the 1D density, n 1 D , for different numbers of dark solitons N s = ( 6 , 10 , 14 , 18 ) . Similar to the case of two solitons, we observe that the solitons interact repulsively. To measure the strength of the interaction is provided by the distance between the central part and the positive-side border of the soliton gas, δ z e = | z central z bond | .
Figure 6 shows δ z e as a function of time for different values of N s . We obverse that it increases monotonously with time, and its time derivative (speed) change as N s increases. Nevertheless, the speed tends to a limit with the increase of the number of solitons, so that there is no dramatic difference between N s = 14 and N s = 18 . This happens because the interaction between the solitons has an effective range, as shown in frame (b) of Figure 4, hence the solitons located near the edges interact weaker with the central ones.
To analyze the case of a large number of solitons, it is enough to take N s = 18 . Frame (a) of Figure 7 shows the speed at t = 90 ms of each soliton as a function of its initial position for different initial distances d. We observe that the central solitons have smaller speeds than their counterparts placed near the edges, so that the speed is given by v s tanh ( γ d z d ) with γ d = 0.01 d + 0.077 in the range of Figure 7. Frame (b) of Figure 7 shows the speed of the soliton located near the positive edge at t = 90 ms. Similar to the two-soliton case, the speed decays with the increase of the initial distance, v s d α , with α = 3.385 .
Finally, we consider random initial positions of the solitons, with N s = 18 . We define the initial positions as z j , ϵ = z j , 0 + ϵ , where ϵ is a random fluctuation, and z j , 0 are the soliton positions, with the mean distance between them d = 4 μ m, like in the symmetric case. Figure 8 shows the spatiotemporal diagrams of the 1D density n 1 D for two different random realizations. In particular, we assume that ϵ takes random values in the ranges [ ϵ max , ϵ max ] = [ 0.4 , 0.4 ] μ m and [ 0.8 , 0.8 ] μ m, in panels (a) and (b), respectively. It is observed that the speed of the expansion is higher than in the absence of the randomness, because the interaction energy generates higher internal pressure in the gas of solitons. We analyze the influence of the random-fluctuation magnitude, ϵ on the dynamics. In particular, we calculate the sum of the squared velocities at the final moment of time,
E ϵ = j = 1 N s v j , ϵ 2 .
Panel (c) of Figure 8 shows E ϵ normalized to E 0 (the kinetic energy of the set of dark solitons with equidistant initial positions) as a function of ϵ max . We can observe that E ϵ strongly increases with the growth of ϵ max , which naturally means that the gas of solitons expands faster when the fluctuations are stronger.

3. The Bose–Fermi Mixture

In this section we consider a dilute superfluid mixture formed by N B bosonic atoms of mass m B , and N F fermionic atoms of mass m F and spin s F . The atoms interact through the pseudopotential, δ ( r ) [4]. We assume that bosons form a BEC, described by the Gross–Pitaevskii equation [4], while the local density approximation [4] applies to the description of the weakly interacting fermionic component. Accordingly, the dynamical equations can be derived from the functional,
S = d t d r L B + L F + L BF ,
where L B and L F are the Lagrangian densities of the Bose and Fermi components, while L BF accounts for the interaction between them [57]:
L B = i 2 Ψ B * Ψ B t Ψ B Ψ B * t 2 2 m B Ψ B 2 U B ( r ) Ψ B 2 1 2 g B Ψ B 4 ,
L F = i 2 λ 1 Ψ F * Ψ F t Ψ F Ψ F * t 2 2 λ 2 m F Ψ F 2 U F ( r ) Ψ F 2 1 2 g F Ψ F 4 3 β C F 2 10 m F Ψ F 10 / 3 ,
L B F = 1 2 g BF Ψ B 2 Ψ F 2 .
Here, g B 4 π 2 a B / m B , g F 4 π 2 ( a F / m F ) [ 2 s F / ( 2 s F + 1 ) ] , and g BF 4 π 2 a BF / m BF are three interaction parameters of the mixture, with a B , a F and a BF being the respective scattering lengths; m BF m B m F / ( m B + m F ) is the reduced mass; and U B / F ( r ) are external potentials acting on bosons/fermions. Complex wave functions Ψ B / F r , t are normalized to the respective numbers of particles, N B / F . The other parameters of the fermionic Lagrangian density are the same as in Section 2.
Varying action S with respect to Ψ B * and to Ψ F * , we derive the following system of nonlinear Schrödinger equations for bosons and fermions:
i t Ψ B = 2 2 m B 2 + g B Ψ B 2 + g BF Ψ F 2 + U B Ψ B ,
i λ 1 t Ψ F = 2 2 λ 2 m F 2 + g F Ψ F 2 + g BF Ψ B 2 + U F + β C F 2 2 m F Ψ F 4 / 3 Ψ F .
We apply the formalism developed below to the 7 Li- 6 Li mixture, with the same scattering parameter for both species, a B = a F = 5 nm. The use of isotopes of the same alkali element is suggested by the similarity of their electric polarizability, thus implying similar external potentials induced by an optical trap. Unless specified otherwise, in what follows below we consider configurations with fully polarized fermions. Note that the BCS and unitarity regimes involve more than one spin state of fermions, hence the magnetic trap will split the respective spin energy levels. For this reason, we assume the presence of the optical trap, which supports equal energy levels for all the spin states, making it possible to discriminate different regimes of the interaction in the BFM. In the BCS and unitarity regimes, we assume balanced populations of the two spin components.
Our analysis is first presented for the GS and dynamics of perturbations around it. In particular, for the GS we focus on determining the spatial correlation C s between the spatial particle densities in both species, defined as
C s n ¯ B , n ¯ F = n ¯ B n ¯ F n ¯ B 2 n ¯ F 2 ,
where n ¯ B / F = n B / F n B / F , standing for the spatial average. For dynamical perturbations around the GS, a spatiotemporal correlation, which is defined by replacing the spatial average with the spatiotemporal average, is known as the Pearson coefficient C s t [66]. We remark that when C s = 1 and C s = 1 the mixture is fully synchronized and anti-synchronized, respectively; whereas, the mixture is not synchronized at C s = 0 .
While numerical integration of this system in the 3D form is very heavy computationally, the effective dimension may be reduced to 1D or 2D when the system is tightly confined by a trapping potential. To this end, the VA is employed, making use, as above, of the factorization of the 3D wave function, which includes the Gaussian ansatz in the tightly confined transverse directions. As mentioned above too, the factorization has been widely used for Bose and Fermi systems separately, as it shown in Refs. [14,21], respectively. In the next two subsections we reduce the full 3D system to the corresponding 2D and 1D effective systems, using the VA proposed in Ref. [57].

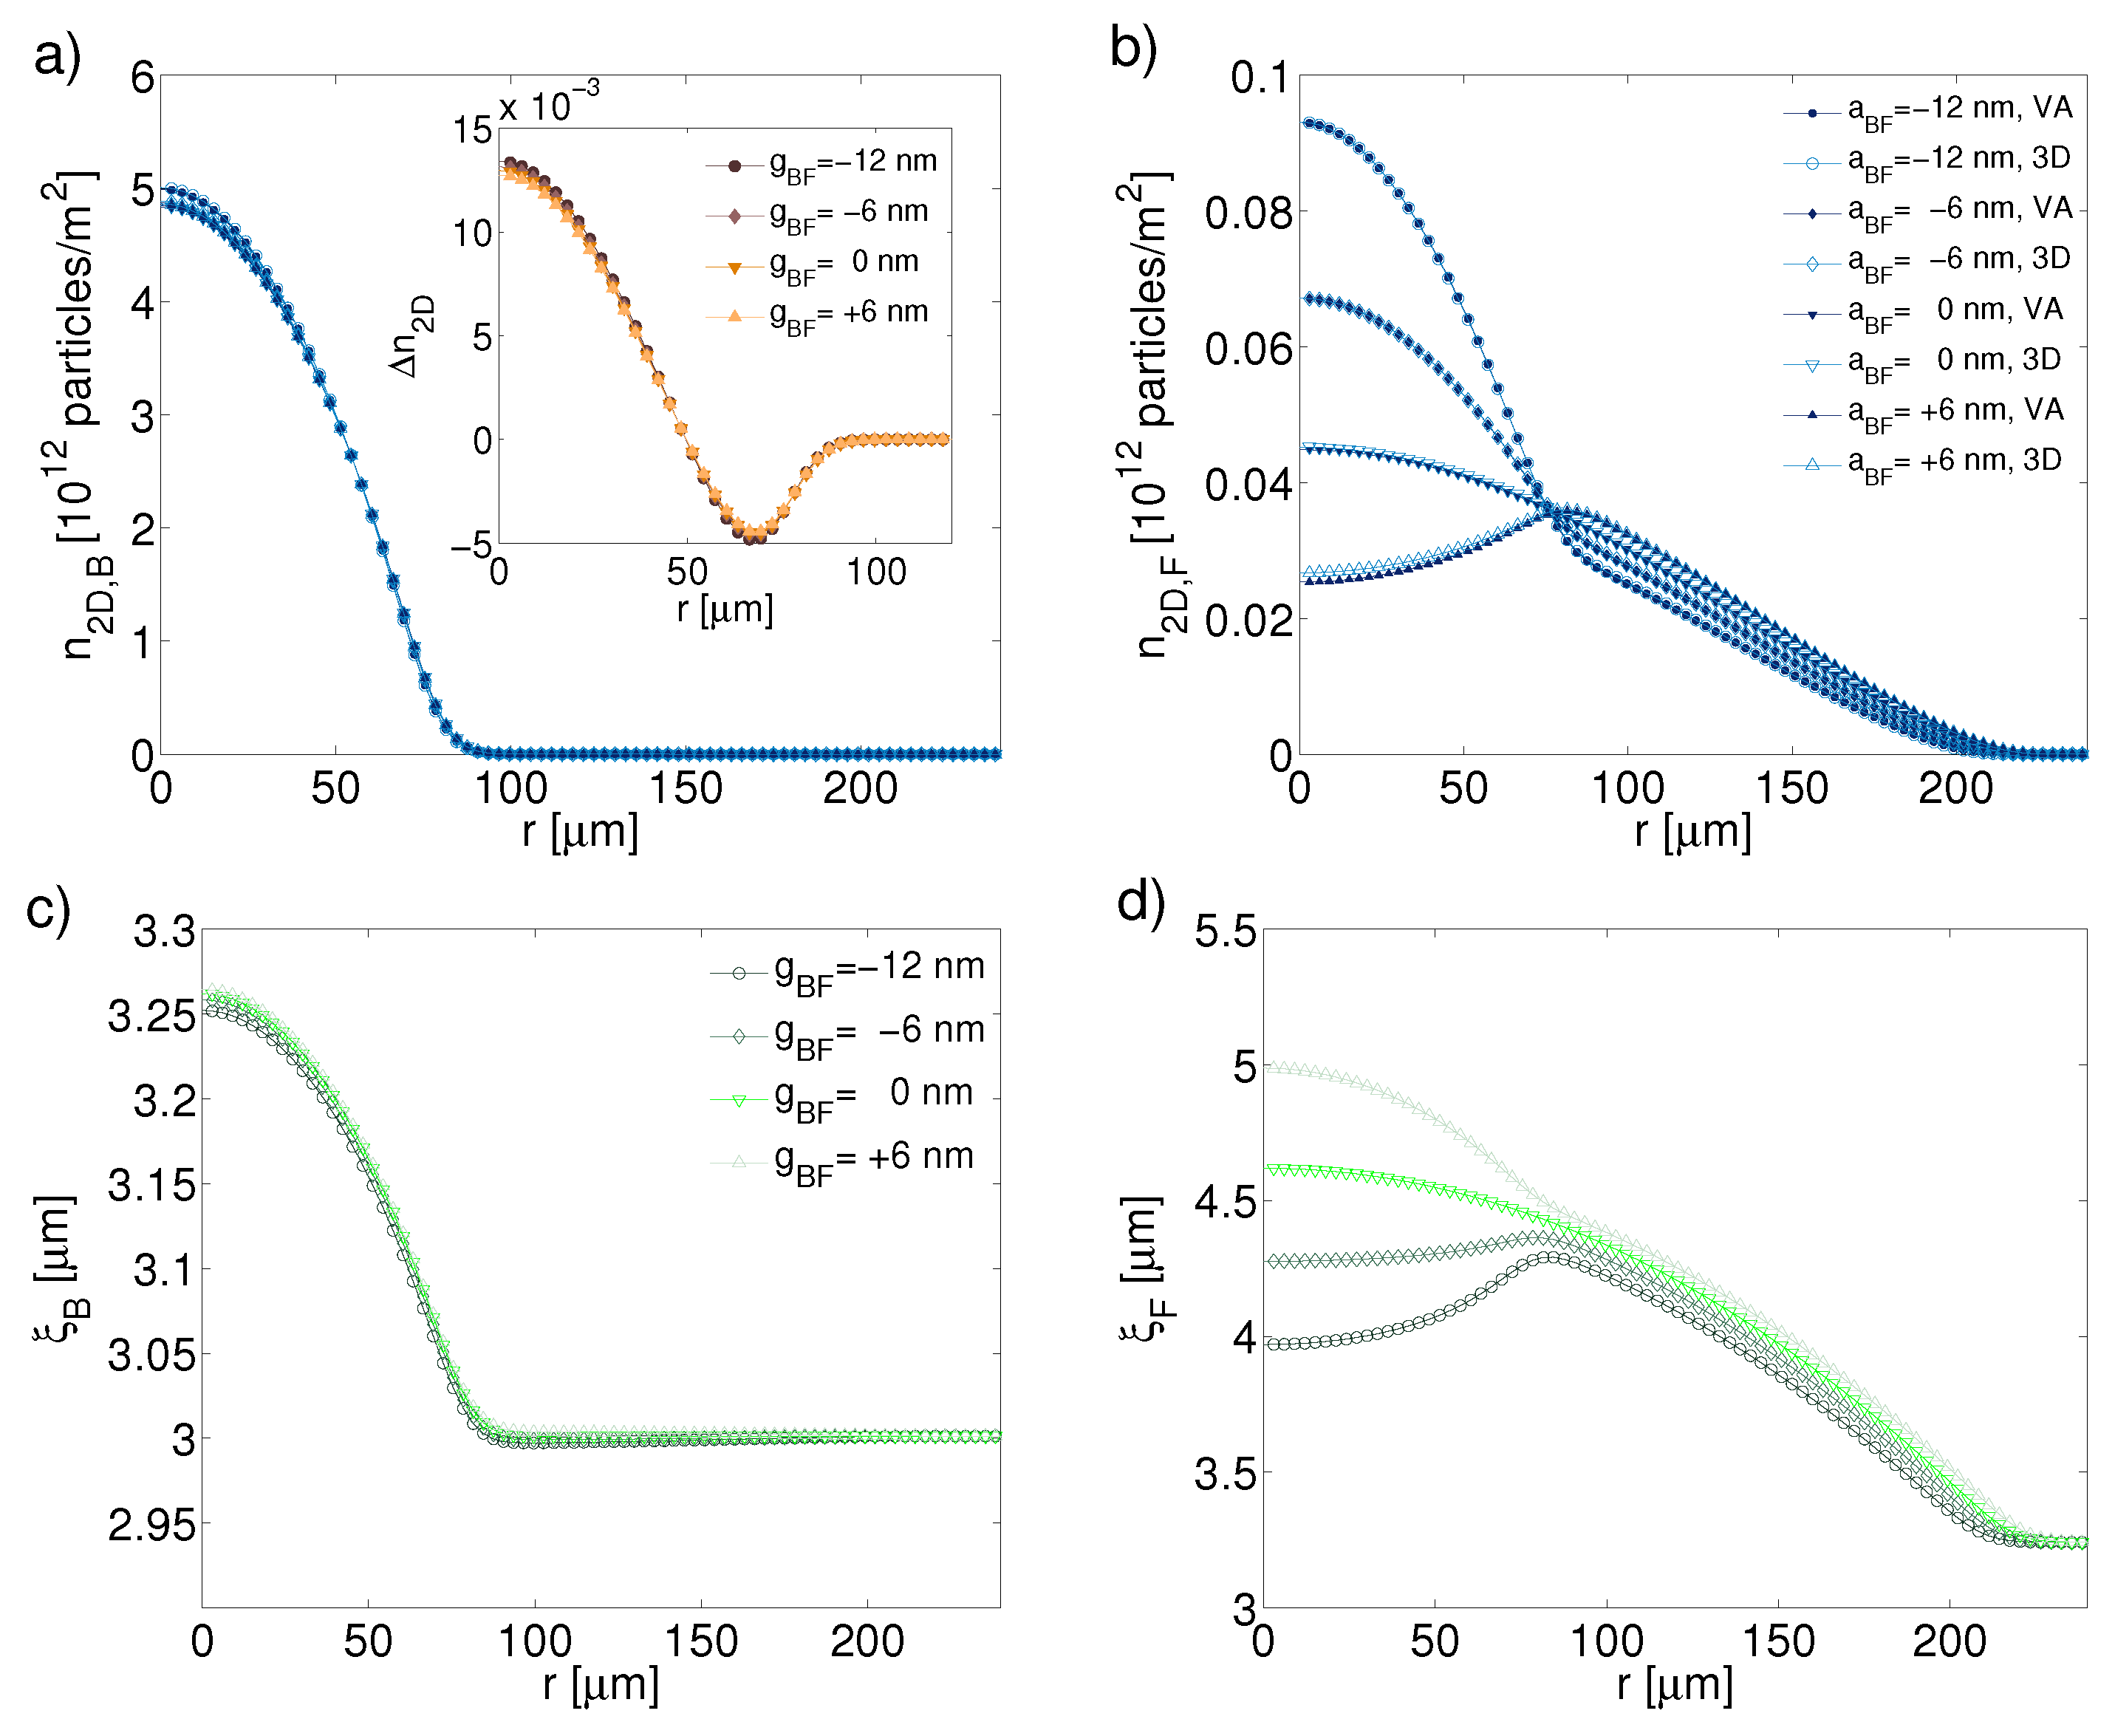
3.1. The Two-Dimensional Reduction

Similar to the case of the pure Fermi gas, we derive 2D equations for the disc-shaped configuration. Accordingly, the structure of the confinement potential is taken as
U B / F r = 1 2 m B / F ω z , B / F 2 z 2 + U 2 D , B / F r ,
where the second term corresponds to the strong harmonic-oscillator trap acting along the z direction. The corresponding factorized ansatz is adopted as
Ψ B / F r , t = 1 π 1 / 4 ξ B / F ( r , t ) exp z 2 2 ξ B / F ( r , t ) 2 ϕ B / F ( r , t )
where ϕ B / F is normalized to N B / F , and ξ B / F x , y , t are widths of the gas in the confined direction. Substituting the factorized ansatz (25) in action (17) and integrating over z, we arrive at the following expression for the effective 2D action:
S = d t d x d y L 2 D , B + L 2 D , F + L 2 D , BF ,
where
L 2 D , B = i 2 ϕ B * t ϕ B ϕ B t ϕ B * U 2 D , B n 2 D , B e 2 D , B ,
L 2 D , F = i 2 λ 1 ϕ F * t ϕ F ϕ F t ϕ F * U 2 D , F n 2 D , F e 2 D , F ,
L 2 D , BF = 1 π 1 / 2 g B F ξ B 2 + ξ F 2 n 2 D , B n 2 D , F ,
so that n 2 D , B / F ϕ B / F x , y 2 are the 2D particle densities of the boson and fermion species, and e 2 D , B and e 2 D , F are their energy densities:
e 2 D , B = 2 2 m B ϕ B 2 + g B 8 π ξ B n 2 D , B + 2 4 m B ξ B 2 + 1 4 m B ω z , B 2 ξ B 2 n 2 D , B ,
e 2 D , F = 2 2 λ 2 m F ϕ F 2 + g F 8 π ξ F n 2 D , F + 2 4 λ 2 m F ξ F 2 + 1 4 m F ω z , F 2 ξ F 2 + 2 2 m F ξ 3 5 ξ F 2 / 3 C 2 D , F n 2 D , F 2 / 3 n 2 D , F ,
with C 2 D , F ( 3 / 5 ) 1 / 2 ( 6 / ( 2 s F + 1 ) ) 2 / 3 π . The field equations for the 2D system are obtained by the variation of the action S given by Equation (26) with respect to variables ϕ B and ϕ F :
i t ϕ B = 2 2 m B 2 + U 2 D , B + 1 π 1 / 2 g BF ξ B 2 + ξ F 2 n 2 D , F + g B 2 π ξ B ϕ B 2 + 2 4 m B ξ B 2 + 1 4 m B ω z , B 2 ξ B 2 ϕ B ,
i λ 1 t ϕ F = 2 2 λ 2 m F 2 + U 2 D , F + 1 π 1 / 2 g BF ξ B 2 + ξ F 2 n 2 D , B + g F 2 π ξ F ϕ F 2 + 2 2 m F ξ 1 ξ F 2 / 3 C 2 D , F ϕ F 4 / 3 + 2 4 λ 2 m F ξ F 2 + 1 4 m F ω z , F 2 ξ F 2 ϕ F .
Relations between ξ B / F and ϕ B / F are produced by the Euler–Lagrange equations associated to ξ B / F :
κ I , B ξ B 4 g B 2 π n 2 D , B ξ B 2 m B = 0 ,
κ I , F ξ F 4 2 2 5 m F ξ C 2 D , F n 2 D , F 2 / 3 ξ F 4 / 3 g F 2 π n 2 D , F ξ F 2 λ 2 m F = 0 ,
where κ I , F m F ω z , F 2 + 2 g BF n 2 D , B / [ π 1 / 2 ( ξ B 2 + ξ F 2 ) 3 / 2 ] . Thus, Equations (32)–(35) constitute a system of four 2D coupled equations produced by the reduction of the underlying 3D system (21). Note also that when g B F = 0 , the system is decoupled and Equation (32) corresponds to the dimensional reduction of the Gross–Pitaevskii equation. Equations (34) and (35) for ξ B / F can be solved numerically by dint of the Newton’s method. The basic external potential is taken as the harmonic-oscillator one: U 2 D , B / F = m B / F ω x , B / F 2 x 2 / 2 + m B / F ω y , B / F 2 y 2 / 2 . The simulations were based on the fourth-order Runge-Kutta algorithm with Δ t = 4.77 μ s. The spatial discretizations was performed with Δ x = 1 μ m, Δ y = 1 μ m and Δ z = 0.05 μ m. The GS was found by means of the imaginary-time integration. We here focus on the case when the number of bosons is much greater than the number of fermions, viz., N B = 5 × 10 4 and N F = 2.5 × 10 3 .
Frames (a) and (b) of Figure 9 show the radial profile of both 2D bosonic and fermionic densities, n 2 D , B / F , respectively. The panels for the bosonic and fermionic components are the left and right ones, respectively. Each density has been computed using the VA and the full 3D system. To obtain the 2D profile from the 3D simulations, Equations (21) and (22) were solved, and the 3D density was integrated along the z axis, n ¯ 2 D , B / F = + Ψ 2 D , B / F ( r ) d z . We infer that the repulsive mixture concentrates the bosons at the center, while the attractive mixture concentrates both species at the center. Panels (c) and (d) of Figure 9 show the radial dependence of the width for both bosonic and fermionic component, respectively. We observe that only the width of the fermionic density profile varies significantly with the change of the scattering length of the inter-species interaction, which is a consequence of a greater number of bosons in comparison with fermions. It is clearly seen that fermions are stronger confined when the interaction is attractive, and their spatial distribution significantly expands when the interaction is repulsive. Similar results have been reported in Refs. [51,52,55].
Now, to compare the results obtained from the VA with those produced by the 3D simulations, we note that both profiles are practically identical, except for the repulsive case in which a discrepancy is observed. The inset in panel (a) of Figure 9 shows that the difference between the two results has a magnitude of nearly three orders of magnitude lower than the density itself. We define the overall percentage error of the VA as E % , 2 D = ρ 2 D n 2 D d x d y (for both species). Figure 10 shows the error for both species as a function of interspecies scattering parameter, a BF . For bosons it takes values 0.2 % , and does not change much, as shown in the inset to panel (a) of Figure 9. For fermions the error is greater than for bosons throughout the observed range, but it is quite small for the attractive mixture. Note that the error increases for the repulsive mixture, but remains lower that 2 % . Thus we conclude that the 2D approximation is very accurate.
Finally, we measure the correlations of the BFM states. To this end, the spatial correlation, C s , in the GS was calculated using the definition given in Equation (23). Figure 11 presents the analysis of the GS synchronization of the mixture as a function of a BF , where three possible regimes are considered for the fermions: fully polarized, BCS, and unitarity. Parameters of the Lagrangian density for each fermionic regime are given in Table 1. When the interaction is attractive, there is not a large discrepancy between the correlation curves. In fact, for a BF ( 25 , 15 ) nm the values of C s 0.9 , and therefore the GS states are synchronized. In the unitarity regime, it is again observed that the correlation reaches a maximum close to 1 at a BF 10 nm, dropping to negative values when the mixture is strongly repulsive. Also, we observe that the three curves demonstrate stronger demixing when a BF changes from negative to positive values of a BF , and for a BF 15 the value of C s tends to zero implying that the GS states are not synchronized.

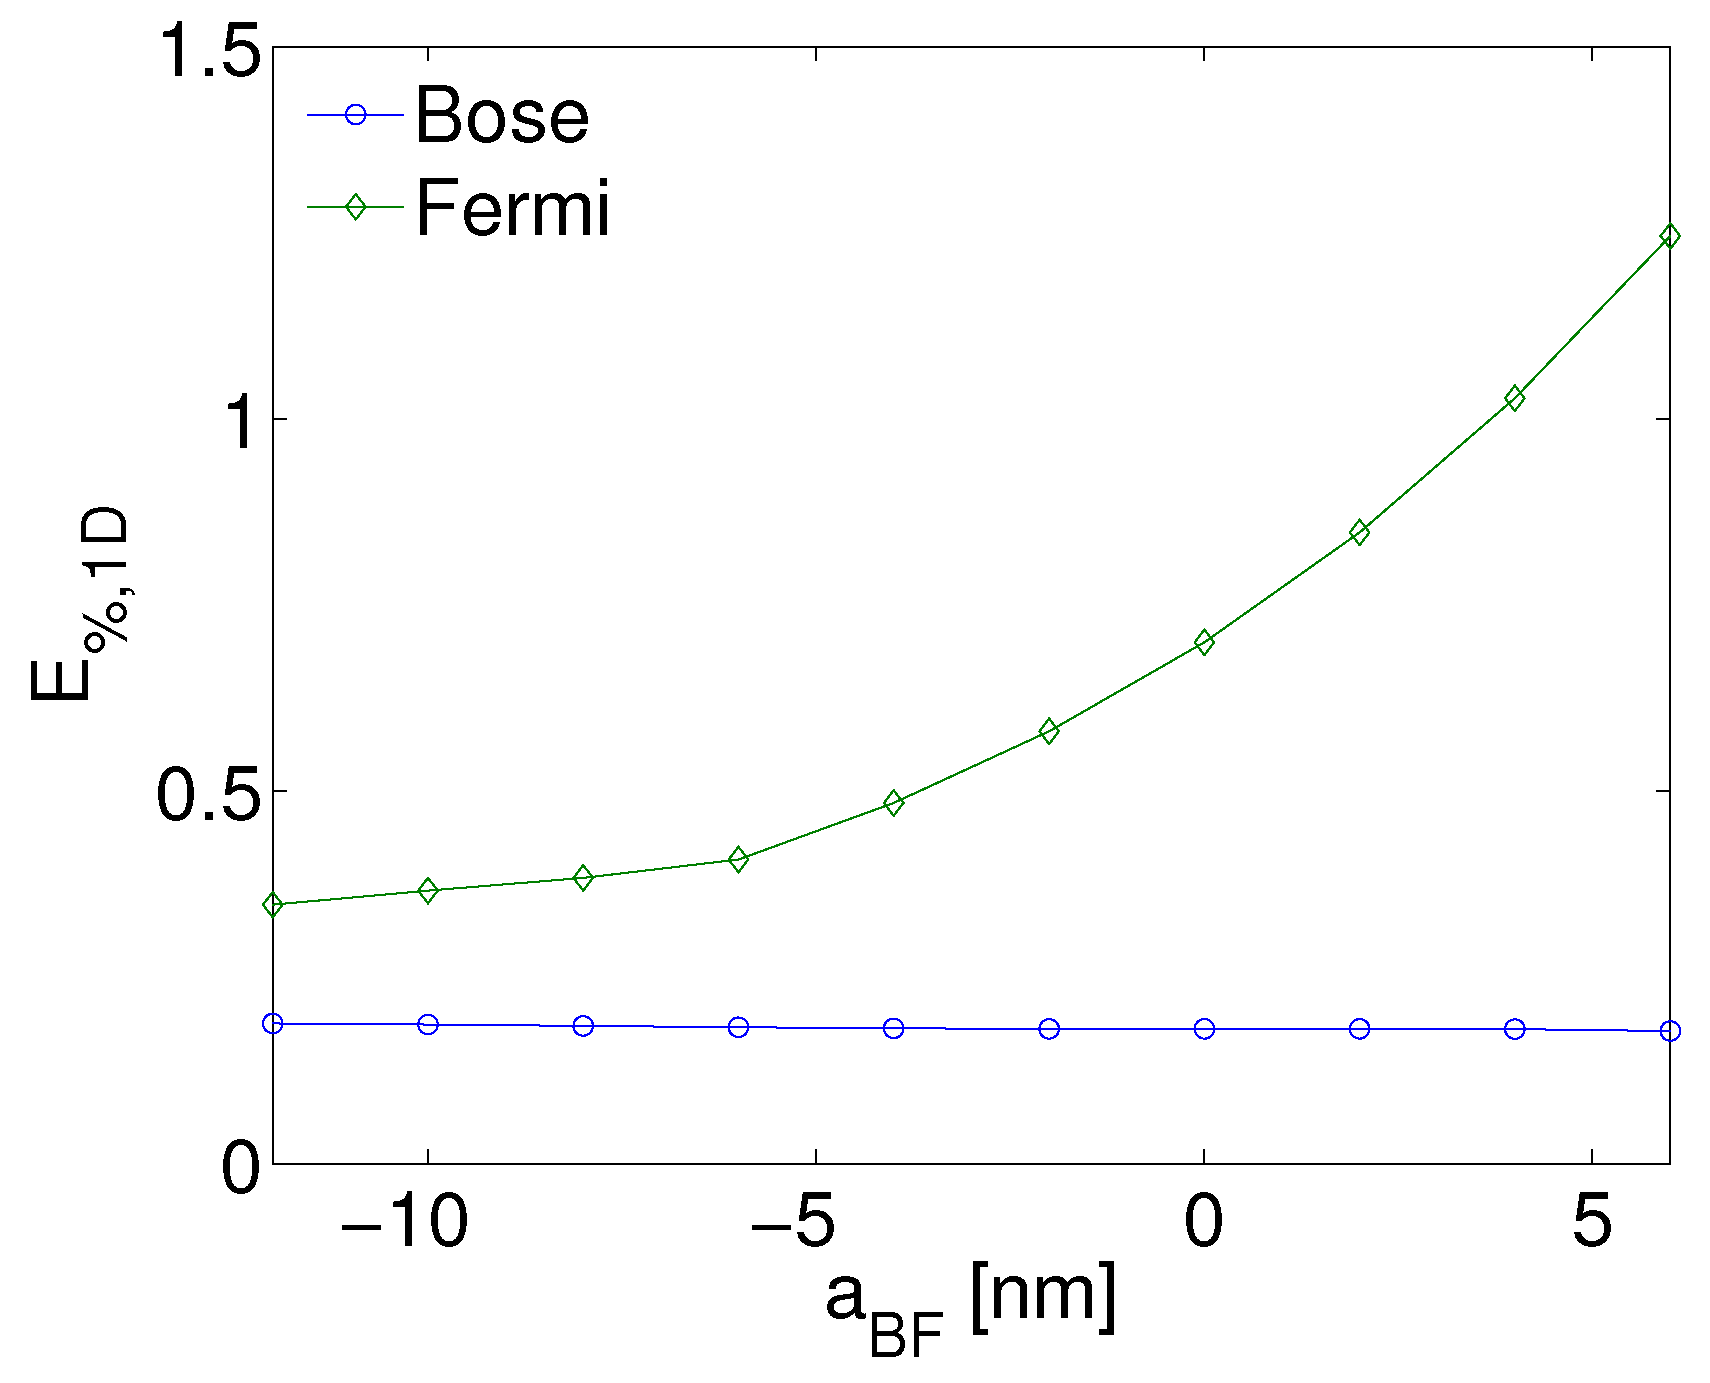
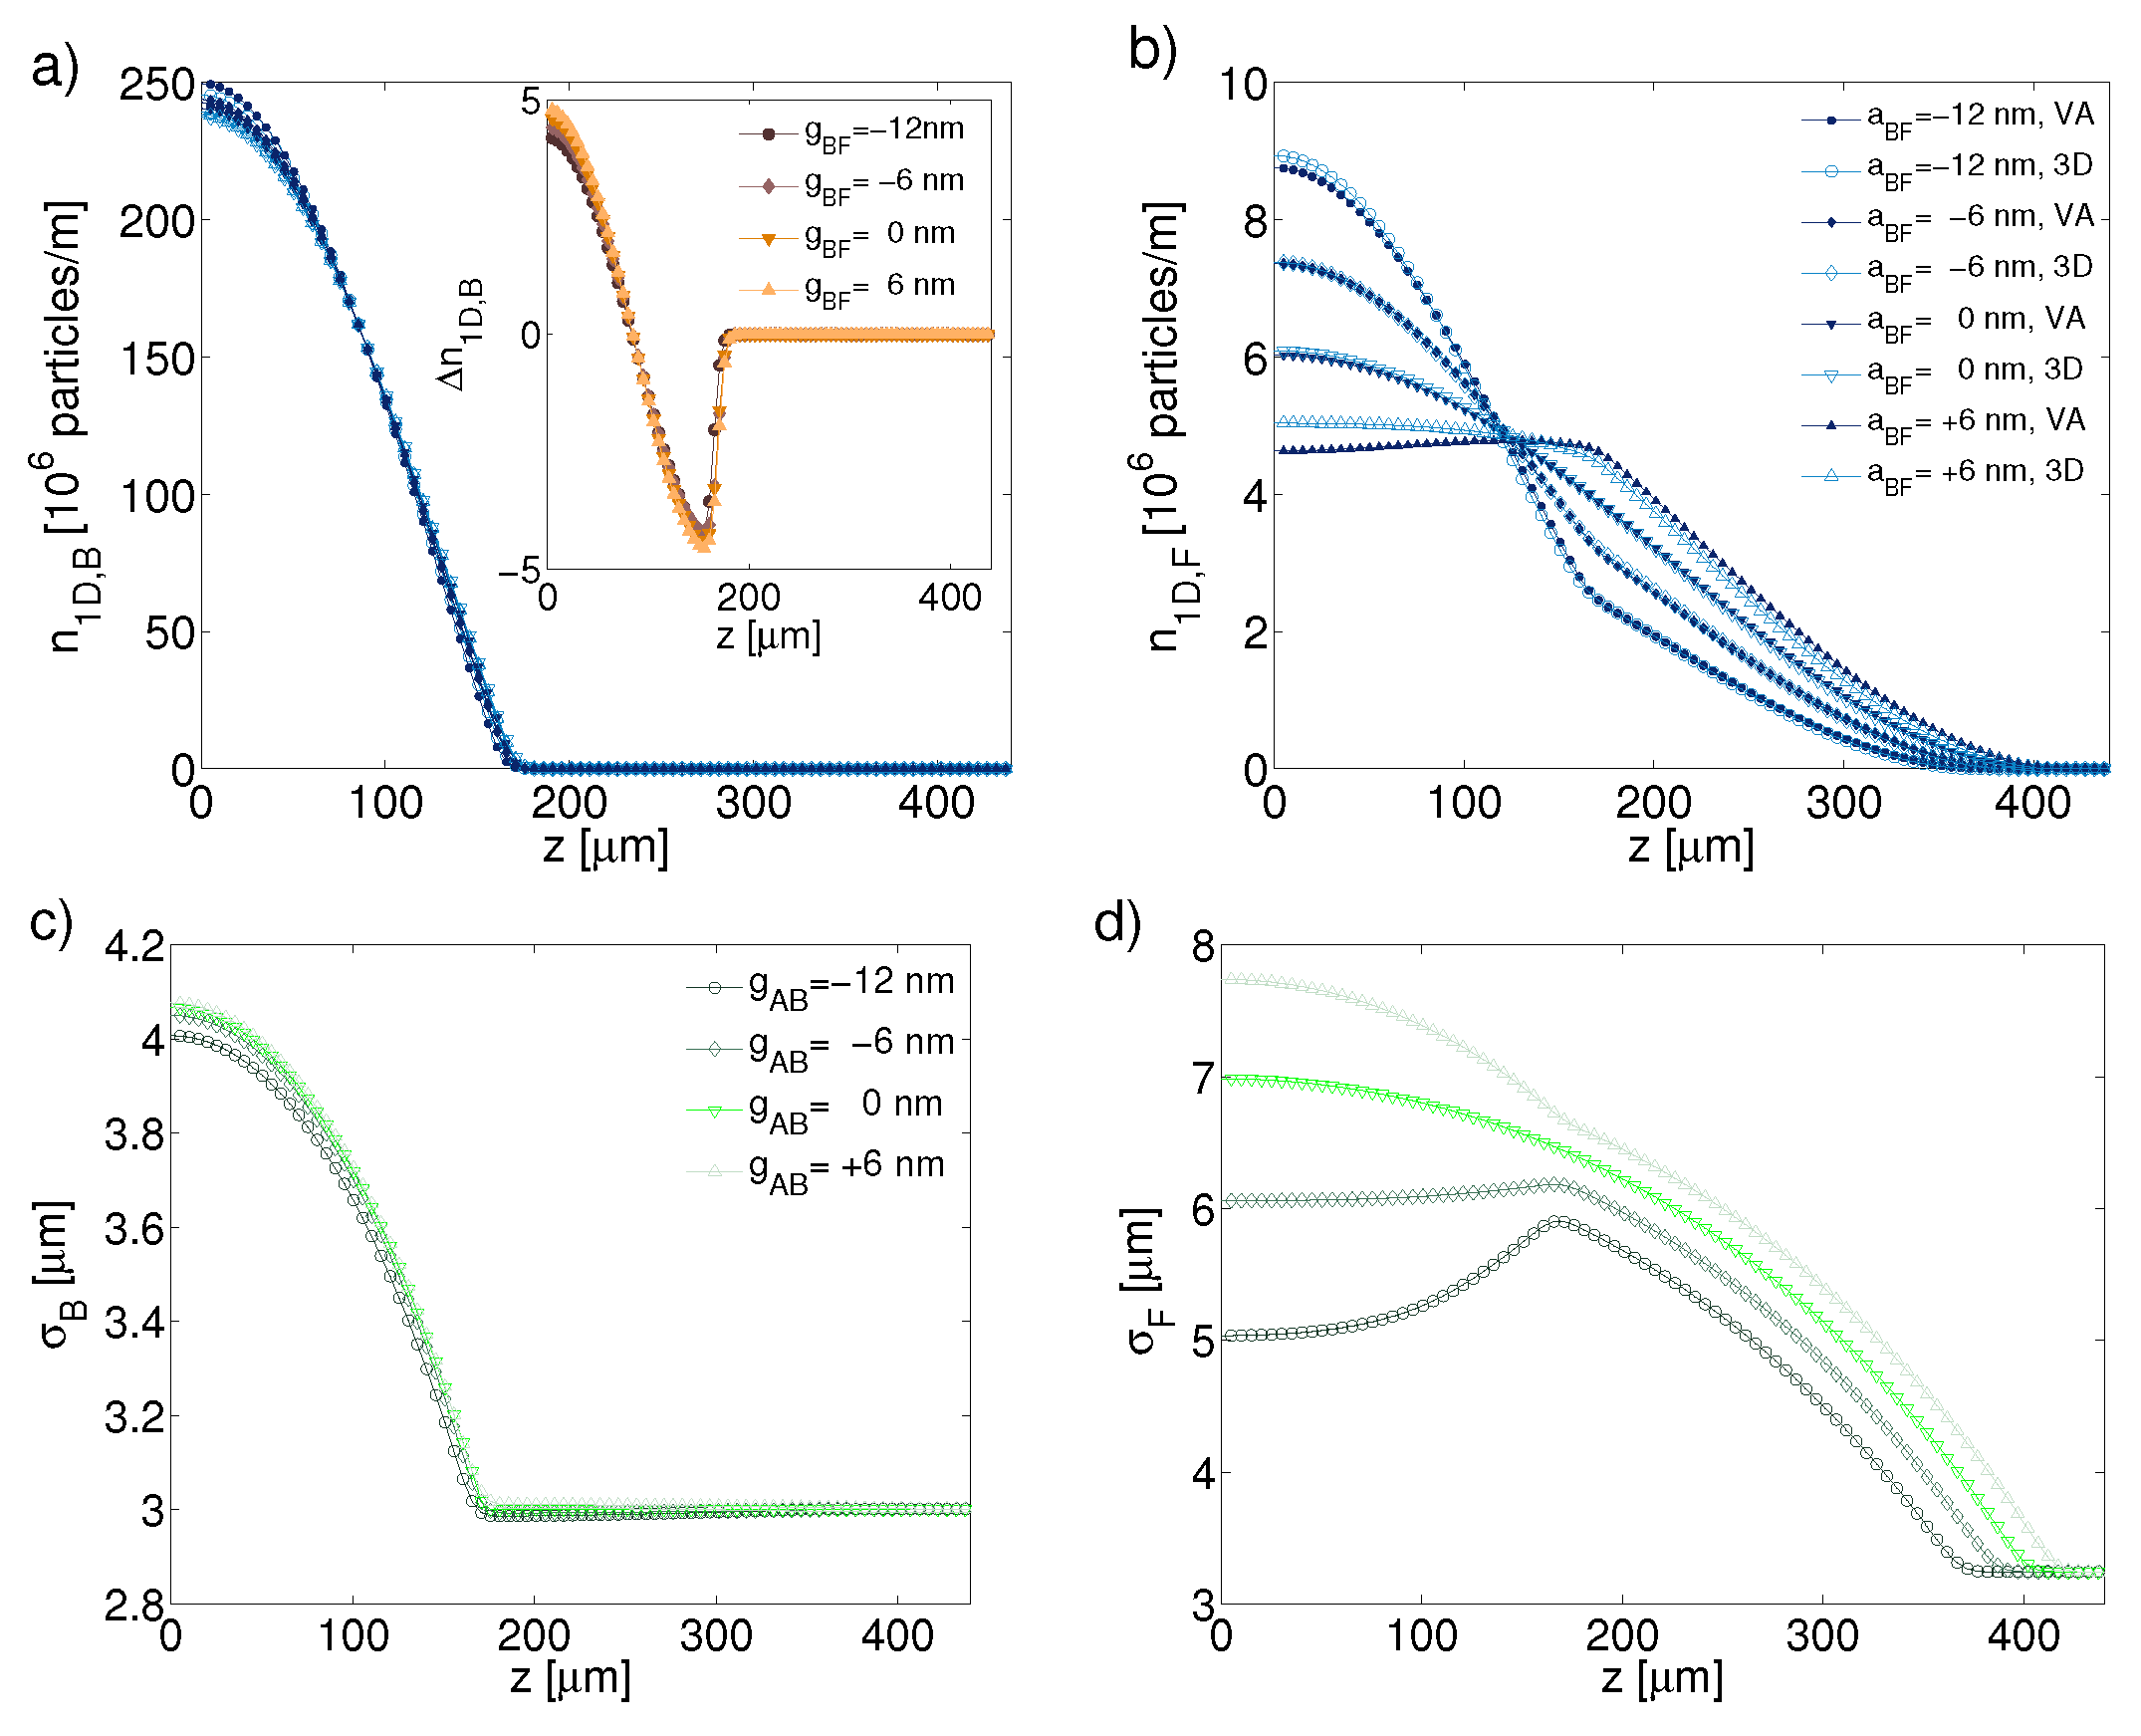
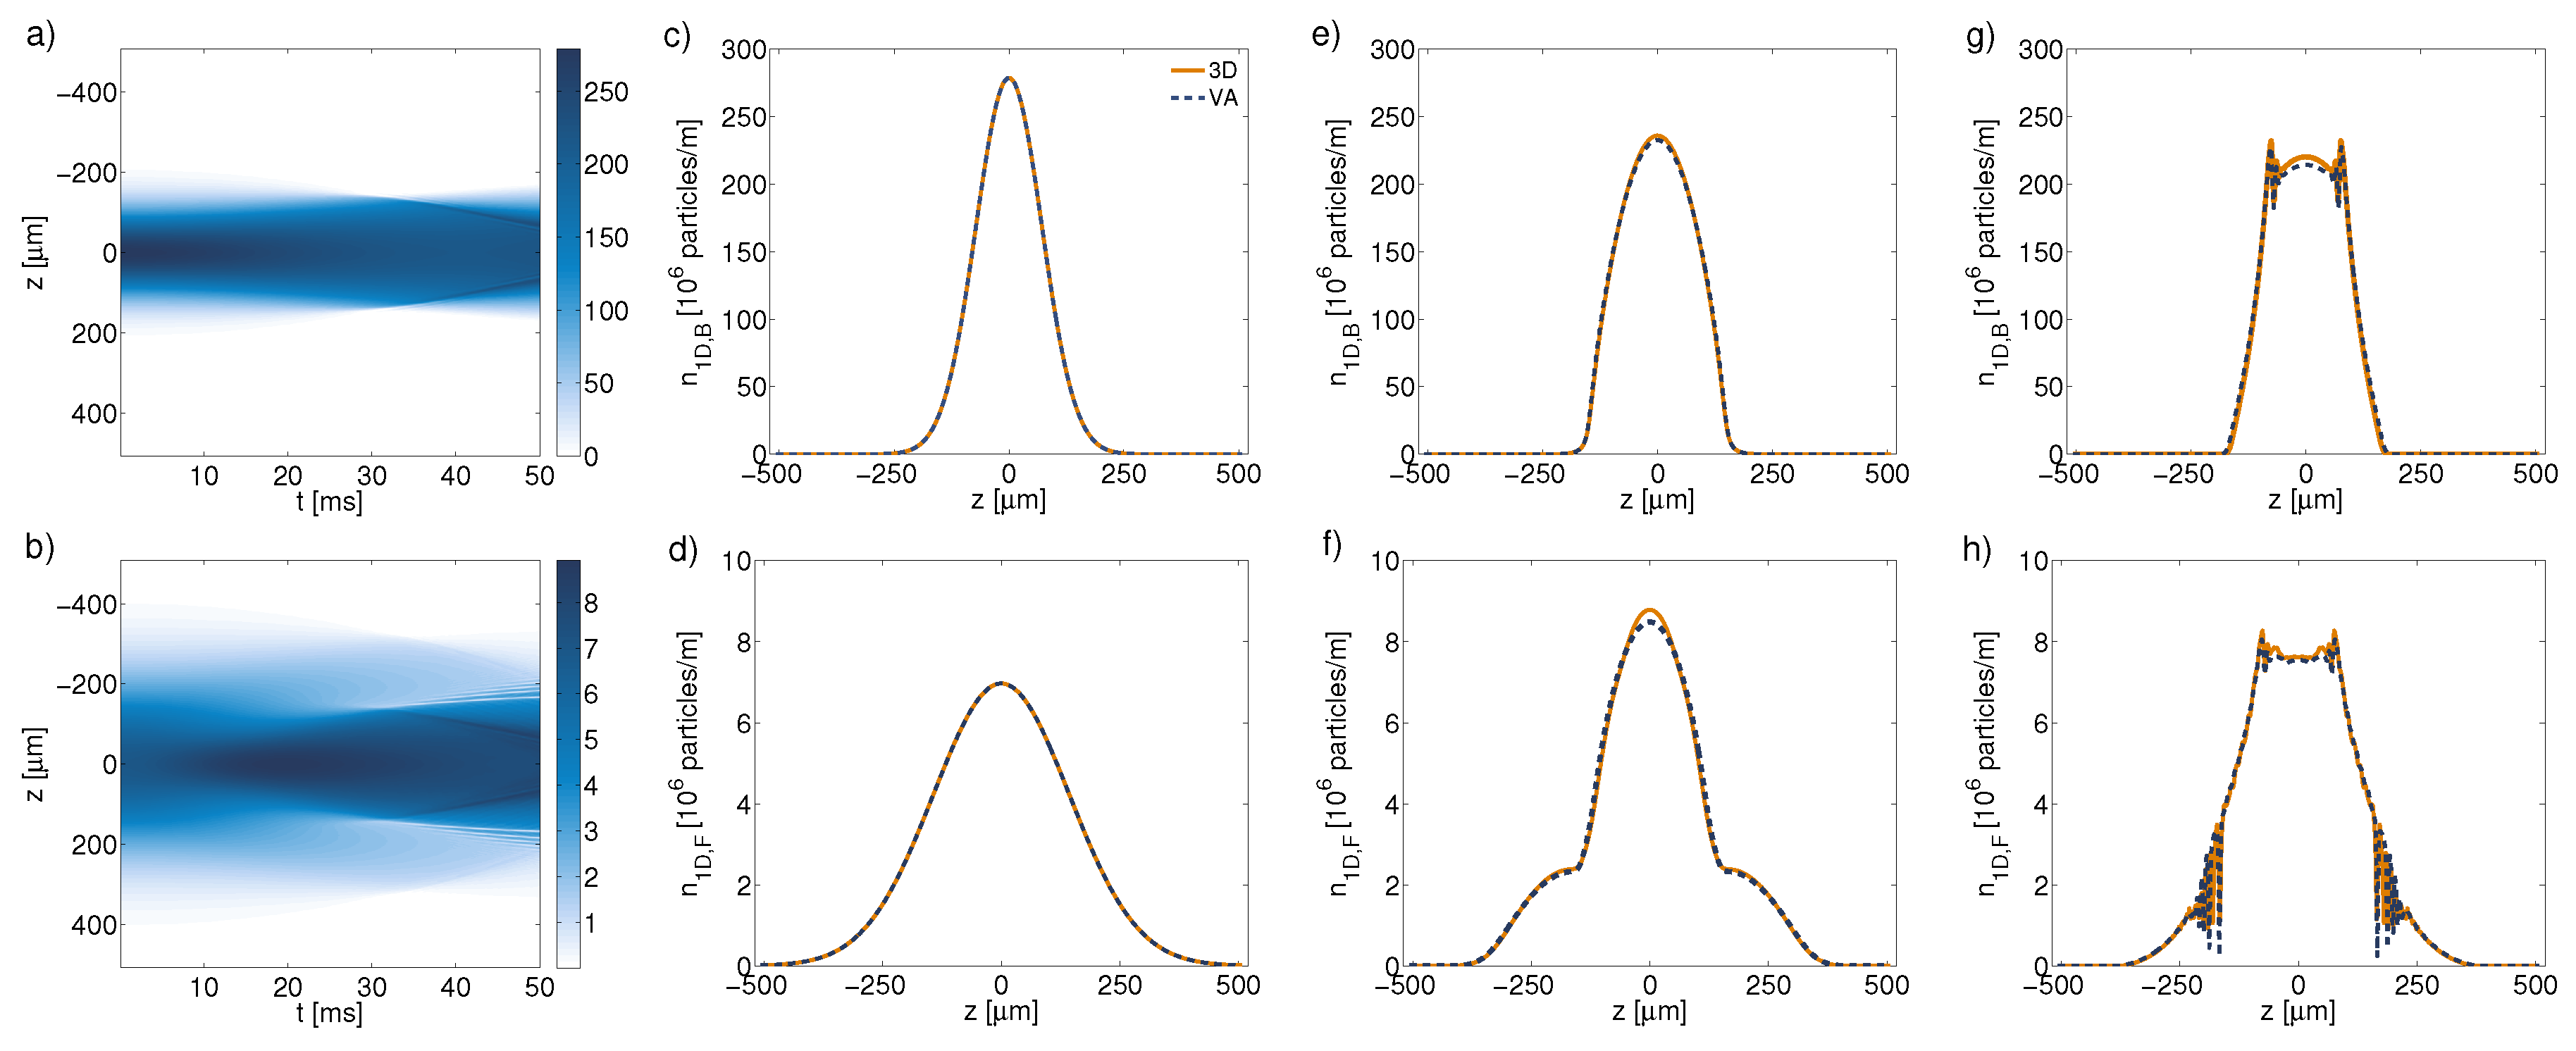
3.2. The One-Dimensional Reduction

The 1D confinement means, as above, a cigar-shaped configuration elongated in the direction of z. In this case, the corresponding confining potentials trap is written as
U B / F r , t = 1 2 m B / F ω t , B / F 2 r 2 + U 1 D , B / F z , t ,
where U 1 D , B / F z , t are the axial potentials. Assuming that the transverse trapping potential is strong enough, the dimensional reduction is carried out by means of the usual factorized ansatz for the wave functions,
Ψ B / F r , t = 1 π 1 / 2 σ B / F z , t exp r 2 2 σ B / F z , t 2 f B / F z , t ,
where σ B / F are the transverse GS Gaussians widths. Here, the axial functions, f B / F , are normalized to N B / F . For both species, we define the axial density as n 1 D , B / F f B / F 2 . By means of a procedure similar to the one outlined above for the 2D reduction, we derive the Euler–Lagrange equations for the BFM in the 1D approximation:
i t f B = 2 2 m B Z 2 + U 1 D , B + 1 π g BF σ B 2 + σ F 2 f F 2 + g B 2 π σ B 2 f B 2 + 2 2 m B σ B 2 + 1 2 m B ω t , B 2 σ B 2 f B ,
i λ 1 t f F = 2 2 λ 2 m F Z 2 + U 1 d , F + 1 π g BF σ B 2 + σ F 2 f B 2 + g F 2 π σ F 2 f F 2 + 2 ξ 2 m F C F , 1 D σ F 4 / 3 f F 4 / 3 + 2 2 m F λ 2 σ F 2 + 1 2 m F ω t , F 2 σ F 2 f F .
In addition, the algebraic relationships between σ B / F and f B / F are:
χ I , B σ B 4 2 m B g B 2 π n 1 D , B = 0 ,
χ I , F σ B 4 2 5 2 m F ξ C F , 1 D n 1 D , F 2 / 3 σ F 2 / 3 2 λ 2 m F g F 2 π n 1 D , F = 0 ,
where χ I , B / F m B / F ω t , B / F 2 2 g BF n 1 D , F / B / [ π ( σ B 2 + σ F 2 ) 2 ] . Thus, Equations (38)–(41) constitute a system of four 1D coupled equations produced by the reduction of the underlying 3D system (21) and (22). Simulations of the system were performed with mesh parameters Δ t = 0.5 μ s and Δ z = 0.25 μ m. The external potential is chosen here as the harmonic-oscillator one: U 1 d , B / F = m B / F ω z , B / F 2 z 2 / 2 .
The effect of the magnitude and sign of the interaction parameter on the spatial profile of both species, and the accuracy of the VA compared to the 3D solution, can be analyzed by varying the scattering length, a BF . In particular, we consider a mixture with more bosons than fermions, viz., N B = 5 × 10 4 , N F = 2.5 × 10 3 . Because of this condition, the bosonic profile is mainly determined by its self-interaction and the external potential. Frames (a) and (b) of Figure 12 show the spatial dependence of n 1 D , B and n 1 D , F , respectively. These densities are calculated using both the reduced Equations (38)–(41) and the full numerical simulations of Equations (21) and (22). In the latter case, the densities are calculated as n ¯ 1 D , j ( z ) = Ψ j ( r ) 2 d x d y with j = ( F , B ) . We observe that variations of the bosonic density profile are very small in comparison to the significant changes of the inter-species scattering length. The situation is opposite for the fermionic species. As the repulsive scattering length increases, the fermions tend to be pushed to the periphery of the bosonic-gas density profile. This phenomenon is known as demixing [18,19,51,55]. On the other hand, for the attraction case, fermions are, naturally, concentrated in the same region where the bosons are located. Frames (c) and (d) of Figure 12 correspond to the profiles of σ B and σ F . We observe that the width of the bosonic profile slightly increases while proceeding from the inter-species attraction to repulsion. A similar trend is observed for fermions, as shown in panel (d). However, the effect is amplified in the spatial zone of the interaction with the bosons, where the gas is compressed in the case of the attraction, and expands in the case of the repulsion. Note that the fermionic component expands in the confined direction much more than its bosonic counterpart, and that the fermionic width markedly varies, following changes in the density.
Further, one can see in the inset of panel (a) of Figure 12 the difference between the density calculated by means of the VA and the full 3D simulation, Δ n 1 D , B = n ¯ 1 D , B n 1 D , B is really small. In fact, the difference between the bosonic profiles obtained by both methods is 2 % of the maximum density for all cases (the fact that the error changes very little with variations in a BF is a consequence of the greater number of bosons). Frame (b) of Figure 12 shows that, for the attractive mixture, the variational profile is very close to the 3D result, in particular for the case of a BF = 6 nm. For the repulsive mixture, it is observed that the error increases, which is a consequence of the lower fermionic density at the center of the 3D harmonic-oscillator potential, which plays the dominant role for the bosons, hence a monotonously decreasing function in the transverse direction, such as the Gaussian, is not a sufficiently good approximation. We define the global error of the VA as E % , 1 D = + n ¯ 1 D , j n 1 D j d z (for both species). We have found that in the range of a BF 6 , 6 nm the global error for the bosonic species is around 2 % for all the values of a BF . For the fermionic species, it goes from 0.5 % to 5 % depending on a BF , such that for positive value of a BF the error is higher than for negative ones, and the minimum error is attained at a BF 4 nm. This is a consequence of the fact that, for this value of a BF , the interspecies interaction practically compensates the Pauli repulsion, making the dynamics of the fully polarized Fermi gas close to that governed by the linear Schödinger equation (recall that the Gaussian is the solution for the ground state). When the mixture becomes more attractive, the fermionic dynamics is dominated by the bosons, producing a similar error for both species, while for the repulsive mixture the Gaussian approximation is not appropriate. For the non-interacting mixture, the error for the fermions is smaller than for the bosons, because the fermionic density is very low, making the self-interaction terms weak in comparison to the external potential, therefore it is appropriate to use the Gaussian ansatz to approximate the 1D dynamics. Finally, note that the error is lower in the 2D case in comparison with 1D, because the reduction to 2D case is closer to the full 3D model.
Next, we address the BFM dynamics, considering a mixture with arbitrary initial conditions for the 1D fields. To create the initial state, we start with the GS found in the absence of the inter-species interaction ( a BF = 0 ). Then, at t = 0 , we switch the interaction on, which may imply the application of the magnetic field, that gives rise to a BF 0 via the FR. Figure 13 shows three cases of the temporal evolution with these initial conditions for a BF = 18 nm , a BF = 26 nm , and a BF = 34 nm . In the first case (panels (a) and (b) of Figure 13), it is observed that the densities converge towards the center of the potential, as may be expected, creating a pattern of oscillations around the potential minimum; in addition, the fermions are affected by bosons, as shown by the mark left by the bosons in the fermionic density. For the second case (panels (c) and (d) of Figure 13), it is observed that the increase in the strength of the attractive interaction generates dark solitons in the fermionic density, some of which show oscillatory dynamics very close to that observed in Refs. [27,29,67,68,69,70]. The last case (panels (e) and (f) of Figure 13) shows that the further increase of the strength of the interspecies interaction generates a larger number of dark solitons. In other words, we show that the attractive interaction of fermions with bosons in a state different from the GS eventually generates a gas of dark solitons.
Finally, we address the accuracy of the VA for the dynamical behavior near the GS. Figure 14 displays the spatiotemporal dynamics of the 1D density, as produced by the solution of 3D Equations (21) and (22) for a BF = 10 nm. The initial conditions for the 3D dynamics are given by the ansatz based on Equation (25), with the Gaussian profile along the z axes. Panels (a) and (b) of Figure 14 show the spatiotemporal diagrams of the bosonic and fermionic densities, making the emergence of dark solitons obvious. This result corroborates that the dark solitons emerge too in the 3D dynamics, which is approximated by the present 1D model. The other panels of Figure 14 show a comparison of the 1D spatial profiles, as obtained from the 3D simulations, and the 1D VA, for three instants of time: t = 0 ms ((c) and (d)), t = 25 ms ((e) and (f)), and t = 50 ms ((g) and (h)). The results demonstrate that the VA profiles are very similar to their counterparts produced by the 3D simulations, hence the present approximation provides good accuracy and allows one to study dynamical features of the BFM in a sufficiently simple form.

4. Conclusions

In this brief review we have summarized results produced by the VA (variational approximation) for reducing the 3D system to 1D and 2D forms for the Fermi gas and BFM (Bose–Fermi mixture) in the framework of the quasi-mean-field description [21,57]. The method is based on the Gaussian variational ansatz, which provides very accurate results for the GSs (ground states) of the gases loaded in the disc- and cigar-shaped traps. The reduced equations are useful, in particular, for modeling systems with low atomic densities and large spatiotemporal variations of the external potential. For the 1D case, the reduced equations provide results by means of modest computational resources, allowing one to quickly explore a vast volume of the parameter space. In the 2D case, the required simulation time is still significantly lower than what is necessary for the 3D simulations. We have shown that, for the Fermi gases and BFMs alike, the VA produces results with a very good accuracy, the error, in the comparison to the 3D simulations, being lower than 5 % , for both the GSs and dynamical states.
For the Fermi gas case in the 2D approximation, we have considered the example of the hexagonal superlattice, built as a superposition of two triangular lattices with different angles among them. This possibility may be relevant for emulating condensed-matter settings, such as graphene-like superlattices. In addition, we have presented results for dark solitons, obtained in the framework of the 1D approximation. We have verified that the interaction is repulsive [32] and strongly depends on the initial distance between the dark solitons.
Finally, for the BFM trapped in the harmonic-oscillator potential we have shown that a change in the interaction strength can generate a gas of dark solitons. The solitons oscillate under the action of the external potential.

Author Contributions

All the authors have equally contributed to the paper.

Funding

P.D. acknowledges partial financial support from DIUFRO project under grant DI18-0066. D.L. acknowledges partial financial support from Centers of Excellence with BASAL/CONICYT financing, Grant FB0807, CEDENNA. P.D. and D.L. acknowledge financial support from FONDECYT 1180905. The work of B.A.M. is supported, in part, by the joint program in physics between NSF and Binational (US-Israel) Science Foundation through project No. 2015616, and by the Israel Science Foundation, through grant No. 1287/17. The authors appreciate a support provided by the PAI-CONICYT program (Chile), grant No. 80160086.

Acknowledgments

P.D. acknowledges CMCC of the Universidad de La Frontera. The authors appreciate the hospitality of Instituto de Alta Investigación at Universidad de Tarapacá (Arica, Chile).

Conflicts of Interest

The authors declare no conflict of interest.

Appendix A Nonlinear Schrödinger Equation for the Fermionic Superfluid

Kim and Zubarev in Ref. [64] proposed an effective hydrodynamic equation for a Fermi gas, in the regime of the BCS-BEC crossover. The equation was derived from the time-dependent density-functional theory and has the form given by:
i t Ψ r , t = 2 2 m F 2 + U r + μ n r , t Ψ r , t ,
where Ψ is a complex field that represent the superfluid wave function, n r , t = Ψ r , t 2 is the particle density, and μ is the chemical potential. In addition, the relationship between the chemical potential and the energy density (energy per particle), ε n , is given by:
μ n = n n ε n
For the case of two spin states with balanced populations and a negative scattering length, a F < 0 , the BCS limit corresponds to k F a F 1 , where k F = ( 3 π 2 n ) 1 / 3 is the Fermi wavenumber. In this limit ε is given by [71]:
ε n = 3 5 ε F 1 + 10 9 π k F a F + 4 11 2 ln 2 21 π 2 k F a F 2 + ,
where ε F = 2 k F 2 / 2 m F is the Fermi energy. Taking the Equation (A3) into the Equation (A2) the chemical potential takes the form
μ n = 2 2 m F 3 π 2 2 / 3 n 2 / 3 + 2 2 π a F m F n 1 + 1.893 a F n 1 / 3 +
where the first term corresponds to the effective Pauli repulsion, and the following ones to the superfluidity due to collisions between the fermions in different spin states. Substituting the latter expression in Equation(A1), and keeping only the first collisional term, we obtain the known nonlinear Schrödinger equation for the fermionic superfluid [64,65]
i t Ψ = 2 2 m F 2 + U r + 2 2 m F 3 π 2 2 / 3 n 2 / 3 + 2 π 2 a F m F n Ψ ,
where the last term is similar to one in the Gross-Pitaevskii equation for bosons, but with an extra factor of 1 / 2 , as the Pauli exclusion principle allows only atoms in different spin states interact via the scattering. We remark that Equation (A5) implies equal particle densities and phases of the wave functions associated with both spin states.
When we have a system with multiple atomic spin states, σ j , associated with vertical projection of the spin s (with 2 s F + 1 states), we treat the atoms per state as a fully polarized Fermi gas. The term for the interactions by collisions between atoms in different spin states, with the same scattering length ( a F ), correspond to the scattering term in the Gross–Pitaevskii equation. The motion equation for the atoms in spin states j is given by:
i t Ψ j r , t = 2 2 m F 2 + U r + 2 2 m F 6 π 2 2 / 3 n j r , t 2 / 3 Ψ j r , t + 4 π 2 a F m F k j = ( s F + 1 / 2 ) s F + 1 / 2 n k r , t Ψ j r , t ,
where Ψ j is the wave function associated with spin projection σ j , such that n j r , t = Ψ j r , t 2 is the respective particle density, and V ( r ) an external potential, which is assumed to be identical for all the spin states.
In the case of fully locally balanced populations, the density of particles is the same in each component, n 1 = n 2 = ... = n 2 s F + 1 , hence the total density is n = n j / ( 2 s F + 1 ) . Assuming also equal phases of the wave-function components, we define a single wave function, Ψ = 2 s F + 1 Ψ j , such that the Equation (47) take the form
i t Ψ = 2 2 m F 2 + U r + 2 2 m F 6 π 2 2 s F + 1 2 / 3 Ψ r , t 4 / 3 + g F Ψ r , t 2 Ψ ,
where g F 8 s F π 2 a F / ( 2 s F + 1 ) m F is the scattering coefficient. This equation is the same that Equation (3) without considered the corrections of the first principles calculations given by λ 1 , λ 2 and β [59,60,61,62]. In particular, the fully polarized gas, with the interactions between identical fermions suppressed by the Pauli principle, formally corresponds to s F = 0 , hence g F = 0 , and the last term of Equation (A7) vanishes.
Finally, the Equation (A7) can be derived, as the Euler-Lagrange equation,
δ L δ Ψ * = L Ψ * t L t Ψ * L Ψ * = 0 ,
from the corresponding action, S = d t d r L , with the Lagrangian density
L = i 2 Ψ * Ψ t Ψ Ψ * t 2 2 m F Ψ 2 U ( r ) Ψ r , t 4 / 3 2 2 m F 3 5 6 π 2 2 s F + 1 2 / 3 Ψ r , t 10 / 3 1 2 g F Ψ r , t 4 ,
where the asterisk stands for the complex conjugate. Similar Lagrangian formalisms have been used, in the context of the density-functional theory, in diverse settings [19,65,72].

References

  1. Bongs, K.; Sengstock, K. Physics with coherent matter waves. Rep. Prog. Phys. 2004, 67, 907. [Google Scholar] [CrossRef]
  2. Jaksch, D.; Zoller, P. The cold atom Hubbard toolbox. Ann. Phys. 2005, 315, 52. [Google Scholar] [CrossRef]
  3. Giorgini, S.; Pitaevskii, L.P.; Stringari, S. Theory of ultracold atomic Fermi gases. Rev. Mod. Phys. 2008, 80, 1215. [Google Scholar] [CrossRef]
  4. Bloch, I.; Dalibard, J.; Zwerger, W. Many-body physics with ultracold gases. Rev. Mod. Phys. 2008, 80, 885. [Google Scholar] [CrossRef]
  5. Spielman, I.B. Light induced gauge fields for ultracold neutral atoms. Rev. Cold At. Mol. 2013, 1, 145. [Google Scholar]
  6. Goldman, N.; Juzeliūnas, G.; Öhberg, P.; Spielman, I.B. Light-induced gauge fields for ultracold atoms. Rep. Prog. Phys. 2014, 77, 126401. [Google Scholar] [CrossRef] [PubMed]
  7. Zhai, H. Degenerate quantum gases with spin–orbit coupling: A review. Rep. Prog. Phys. 2015, 78, 026001. [Google Scholar] [CrossRef] [PubMed]
  8. Malomed, B.A. Creating solitons by means of spin-orbit coupling. EPL 2018, 122, 36001. [Google Scholar] [CrossRef]
  9. Snoek, M.; Titvinidze, I.; Bloch, I.; Hofstetter, W. Effect of interactions on harmonically confined Bose-Fermi mixtures in optical lattices. Phys. Rev. Lett. 2011, 106, 155301. [Google Scholar] [CrossRef] [PubMed]
  10. Fröhlich, B.; Feld, M.; Vogt, E.; Koschorreck, M.; Zwerger, W.; Köhl, M. Radio-frequency spectroscopy of a strongly interacting two-dimensional Fermi gas. Phys. Rev. Lett. 2011, 106, 105301. [Google Scholar] [CrossRef] [PubMed]
  11. Lin, Y.-J.; Jimenez-Garcia, K.; Spielman, I.B. Spin–orbit-coupled Bose–Einstein condensates. Nature 2011, 471, 83. [Google Scholar] [CrossRef] [PubMed]
  12. Sakaguchi, H.; Li, B.; Malomed, B.A. Creation of two-dimensional composite solitons in spin-orbit-coupled self-attractive Bose-Einstein condensates in free space. Phys. Rev. E 2014, 89, 032920. [Google Scholar] [CrossRef] [PubMed]
  13. Díaz, P.; Laroze, D.; Ávila, A.; Malomed, B.A. Two-dimensional composite solitons in a spin-orbit-coupled Fermi gas in free space. Commun. Nonlinear Sci. Numer. Simul. 2019, 70, 372–383. [Google Scholar] [CrossRef]
  14. Salasnich, L.; Parola, A.; Reatto, L. Effective wave equations for the dynamics of cigar-shaped and disk-shaped Bose condensates. Phys. Rev. A 2002, 65, 043614. [Google Scholar] [CrossRef]
  15. Salasnich, L.; Parola, A.; Reatto, L. Condensate bright solitons under transverse confinement. Phys. Rev. A 2002, 66, 043603. [Google Scholar] [CrossRef]
  16. Salasnich, L.; Malomed, B.A. Solitons and solitary vortices in pancake-shaped Bose-Einstein condensates. Phys. Rev. A 2009, 79, 053620. [Google Scholar] [CrossRef]
  17. Young-S, L.E.; Salasnich, L.; Adhikari, S.K. Dimensional reduction of a binary Bose-Einstein condensate in mixed dimensions. Phys. Rev. A 2010, 82, 053601. [Google Scholar] [CrossRef]
  18. Adhikari, S.K.; Malomed, B.A. Miscibility in a degenerate fermionic mixture induced by linear coupling. Phys. Rev. A 2006, 74, 053620. [Google Scholar] [CrossRef]
  19. Adhikari, S.K. Superfluid fermi-fermi mixture: Phase diagram, stability, and soliton formation. Phys. Rev. A 2007, 76, 053609. [Google Scholar] [CrossRef]
  20. Adhikari, S.K.; Malomed, B.A. Gap solitons in a model of a superfluid fermion gas in optical lattices. Physica D 2009, 238, 1402–1412. [Google Scholar] [CrossRef]
  21. Díaz, P.; Laroze, D.; Schmidt, I.; Malomed, B.A. One-and two-dimensional reductions of the mean-field description of degenerate Fermi gases. J. Phys. B: At. Mol. Opt. Phys. 2012, 45, 145304. [Google Scholar] [CrossRef]
  22. Burger, S.; Bongs, K.; Dettmer, S.; Ertmer, W.; Sengstock, K.; Sanpera, A.; Shlyapnikov, G.V.; Lewenstein, M. Dark solitons in Bose-Einstein condensates. Phys. Rev. Lett. 1999, 83, 5198. [Google Scholar] [CrossRef]
  23. Becker, C.; Stellmer, S.; Soltan-Panahi, P.; Dörscher, S.; Baumert, M.; Richter, E.-M.; Kronjäger, J.; Bongs, K.; Sengstock, K. Oscillations and interactions of dark and dark–bright solitons in Bose-Einstein condensates. Nat. Phys. 2008, 4, 496. [Google Scholar] [CrossRef]
  24. Weller, A.; Ronzheimer, J.; Gross, C.; Esteve, J.; Oberthaler, M.; Frantzeskakis, D.; Theocharis, G.; Kevrekidis, P. Experimental observation of oscillating and interacting matter wave dark solitons. Phys. Rev. Lett. 2008, 101, 130401. [Google Scholar] [CrossRef] [PubMed]
  25. Stellmer, S.; Becker, C.; Soltan-Panahi, P.; Richter, E.-M.; Dörscher, S.; Baumert, M.; Kronjäger, J.; Bongs, K.; Sengstock, K. Collisions of dark solitons in elongated Bose-Einstein condensates. Phys. Rev. Lett. 2008, 101, 120406. [Google Scholar] [CrossRef] [PubMed]
  26. Antezza, M.; Dalfovo, F.; Pitaevskii, L.P.; Stringari, S. Dark solitons in a superfluid Fermi gas. Phys. Rev. A 2007, 76, 043610. [Google Scholar] [CrossRef]
  27. Scott, R.; Dalfovo, F.; Pitaevskii, L.; Stringari, S. Dynamics of dark solitons in a trapped superfluid Fermi gas. Phys. Rev. Lett. 2011, 106, 185301. [Google Scholar] [CrossRef] [PubMed]
  28. Liao, R.; Brand, J. Traveling dark solitons in superfluid Fermi gases. Phys. Rev. A 2011, 83, 041604. [Google Scholar] [CrossRef]
  29. Yefsah, T.; Sommer, A.T.; Ku, M.J.; Cheuk, L.W.; Ji, W.; Bakr, W.S.; Zwierlein, M.W. Heavy solitons in a fermionic superfluid. Nature 2013, 499, 426. [Google Scholar] [CrossRef] [PubMed]
  30. Ku, M.J.; Mukherjee, B.; Yefsah, T.; Zwierlein, M.W. Cascade of solitonic excitations in a superfluid fermi gas: From planar solitons to vortex rings and lines. Phys. Rev. Lett. 2016, 116, 045304. [Google Scholar] [CrossRef] [PubMed]
  31. Syrwid, A.; Delande, D.; Sacha, K. Emergence of dark soliton signatures in a one-dimensional unpolarized attractive Fermi gas on a ring. Phys. Rev. A 2018, 98, 023616. [Google Scholar] [CrossRef]
  32. Van Alphen, W.; Lombardi, G.; Klimin, S.N.; Tempere, J. Dark soliton collisions in superfluid Fermi gases. New J. Phys. 2018, 20, 053052. [Google Scholar] [CrossRef]
  33. Truscott, A.G.; Strecker, K.E.; McAlexander, W.I.; Partridge, G.B.; Hulet, R.G. Observation of Fermi pressure in a gas of trapped atoms. Science 2001, 291, 2570–2572. [Google Scholar] [CrossRef] [PubMed]
  34. Schreck, F.; Khaykovich, L.; Corwin, K.L.; Ferrari, G.; Bourdel, T.; Cubizolles, J.; Salomon, C. Quasipure Bose-Einstein Condensate Immersed in a Fermi Sea. Phys. Rev. Lett. 2001, 87, 080403. [Google Scholar] [CrossRef] [PubMed]
  35. Hansen, A.H.; Khramov, A.; Dowd, W.H.; Jamison, A.O.; Ivanov, V.V.; Gupta, S. Quantum degenerate mixture of Ytterbium and Lithium atoms. Phys. Rev. A 2011, 84, 011606. [Google Scholar] [CrossRef]
  36. Heinze, J.; Götze, S.; Krauser, J.; Hundt, B.; Fläschner, N.; Lühmann, D.-S.; Becker, C.; Sengstock, K. Multiband spectroscopy of ultracold fermions: Observation of reduced tunneling in attractive Bose-Fermi mixtures. Phys. Rev. Lett. 2011, 107, 135303. [Google Scholar] [CrossRef] [PubMed]
  37. Tey, M.K.; Stellmer, S.; Grimm, R.; Schreck, F. Double-degenerate Bose-Fermi mixture of Strontium. Phys. Rev. A 2010, 82, 011608. [Google Scholar] [CrossRef]
  38. Best, T.; Will, S.; Schneider, U.; Hackermüller, L.; Van Oosten, D.; Bloch, I.; Lühmann, D.-S. Role of interactions in 87Rb–40K Bose-Fermi mixtures in a 3D optical lattice. Phys. Rev. Lett. 2009, 102, 030408. [Google Scholar] [CrossRef] [PubMed]
  39. Cumby, T.D.; Shewmon, R.A.; Hu, M.-G.; Perreault, J.D.; Jin, D.S. Feshbach-molecule formation in a Bose-Fermi mixture. Phys. Rev. A 2013, 87, 012703. [Google Scholar] [CrossRef]
  40. Deh, B.; Gunton, W.; Klappauf, B.; Li, Z.; Semczuk, M.; Van Dongen, J.; Madison, K. Giant Feshbach resonances in Li 6 - Rb 85 mixtures. Phys. Rev. A 2010, 82, 020701. [Google Scholar] [CrossRef]
  41. Tung, S.-K.; Parker, C.; Johansen, J.; Chin, C.; Wang, Y.; Julienne, P.S. Ultracold mixtures of atomic 6 Li and 133 Cs with tunable interactions. Phys. Rev. A 2013, 87, 010702. [Google Scholar] [CrossRef]
  42. Park, J.W.; Wu, C.-H.; Santiago, I.; Tiecke, T.G.; Will, S.; Ahmadi, P.; Zwierlein, M.W. Quantum degenerate Bose-Fermi mixture of chemically different atomic species with widely tunable interactions. Phys. Rev. A 2012, 85, 051602. [Google Scholar] [CrossRef]
  43. Wu, C.-H.; Santiago, I.; Park, J.W.; Ahmadi, P.; Zwierlein, M.W. Strongly interacting isotopic Bose-Fermi mixture immersed in a Fermi sea. Phys. Rev. A 2011, 84, 011601. [Google Scholar] [CrossRef]
  44. Lelas, K.; Jukić, D.; Buljan, H. Ground-state properties of a one-dimensional strongly interacting Bose-Fermi mixture in a double-well potential. Phys. Rev. A 2009, 80, 053617. [Google Scholar] [CrossRef]
  45. Watanabe, T.; Suzuki, T.; Schuck, P. Bose-fermi pair correlations in attractively interacting Bose-Fermi atomic mixtures. Phys. Rev. A 2008, 78, 033601. [Google Scholar] [CrossRef]
  46. Kain, B.; Ling, H.Y. Singlet and triplet superfluid competition in a mixture of two-component Fermi and one-component dipolar Bose gases. Phys. Rev. A 2011, 83, 061603. [Google Scholar] [CrossRef]
  47. Mering, A.; Fleischhauer, M. Multiband and nonlinear hopping corrections to the three-dimensional Bose-Fermi-Hubbard model. Phys. Rev. A 2011, 83, 063630. [Google Scholar] [CrossRef]
  48. Song, J.-L.; Zhou, F. Anomalous dimers in quantum mixtures near broad resonances: Pauli blocking, Fermi surface dynamics, and implications. Phys. Rev. A 2011, 84, 013601. [Google Scholar] [CrossRef]
  49. Ludwig, D.; Floerchinger, S.; Moroz, S.; Wetterich, C. Quantum phase transition in Bose-Fermi mixtures. Phys. Rev. A 2011, 84, 033629. [Google Scholar] [CrossRef]
  50. Bertaina, G.; Fratini, E.; Giorgini, S.; Pieri, P. Quantum Monte Carlo study of a resonant Bose-Fermi mixture. Phys. Rev. Lett. 2013, 110, 115303. [Google Scholar] [CrossRef] [PubMed]
  51. Adhikari, S.K.; Salasnich, L. Superfluid Bose-Fermi mixture from weak coupling to unitarity. Phys. Rev. A 2008, 78, 043616. [Google Scholar] [CrossRef]
  52. Maruyama, T.; Yabu, H. Quadrupole oscillations in Bose-Fermi mixtures of ultracold atomic gases made of Yb atoms in the time-dependent Gross-Pitaevskii and Vlasov equations. Phys. Rev. A 2009, 80, 043615. [Google Scholar] [CrossRef]
  53. Iskin, M.; Freericks, J. Dynamical mean-field theory for light-fermion–heavy-boson mixtures on optical lattices. Phys. Rev. A 2009, 80, 053623. [Google Scholar] [CrossRef]
  54. Nishida, Y.; Son, D.T. Effective field theory of boson-fermion mixtures and bound fermion states on a vortex of boson superfluid. Phys. Rev. A 2006, 74, 013615. [Google Scholar] [CrossRef]
  55. Salasnich, L.; Toigo, F. Fermi-bose mixture across a Feshbach resonance. Phys. Rev. A 2007, 75, 013623. [Google Scholar] [CrossRef]
  56. Gautam, S.; Muruganandam, P.; Angom, D. Position swapping and pinching in Bose-Fermi mixtures with two-color optical Feshbach resonances. Phys. Rev. A 2011, 83, 023605. [Google Scholar] [CrossRef]
  57. Díaz, P.; Laroze, D.; Malomed, B.A. Correlations and synchronization in a Bose–Fermi mixture. J. Phys. B: At. Mol. Opt. Phys. 2015, 48, 075301. [Google Scholar] [CrossRef]
  58. Tylutki, M.; Recati, A.; Dalfovo, F.; Stringari, S. Dark–bright solitons in a superfluid Bose–Fermi mixture. New J. Phys. 2016, 18, 053014. [Google Scholar] [CrossRef]
  59. Manini, N.; Salasnich, L. Bulk and collective properties of a dilute fermi gas in the BCS-BEC crossover. Phys. Rev. A 2005, 71, 033625. [Google Scholar] [CrossRef]
  60. Salasnich, L.; Toigo, F. Extended Thomas-Fermi density functional for the unitary Fermi gas. Phys. Rev. A 2008, 78, 053626; ibod Erratum: Extended thomas-fermi density functional for the unitary fermi gas. Phys. Rev. A 2010, 82, 059902. [Google Scholar] [CrossRef]
  61. Ancilotto, F.; Salasnich, L.; Toigo, F. Dc Josephson effect with fermi gases in the Bose-Einstein regime. Phys. Rev. A 2009, 79, 033627. [Google Scholar] [CrossRef]
  62. Ancilotto, F.; Salasnich, L.; Toigo, F. Shock waves in strongly interacting Fermi gas from time-dependent density functional calculations. Phys. Rev. A 2012, 85, 063612. [Google Scholar] [CrossRef]
  63. Andreev, P.A. Spin current contribution in the spectrum of collective excitations of degenerate partially polarized spin-1/2 fermions at separate dynamics of spin-up and spin-down fermions. Laser Phys. Lett. 2018, 15, 105501. [Google Scholar] [CrossRef]
  64. Kim, Y.E.; Zubarev, A.L. Time-dependent density-functional theory for trapped strongly interacting fermionic atoms. Phys. Rev. A 2004, 70, 033612. [Google Scholar] [CrossRef]
  65. Adhikari, S.K. Mixing-demixing in a trapped degenerate fermion-fermion mixture. Phys. Rev. A 2006, 73, 043619. [Google Scholar] [CrossRef]
  66. Bragard, J.; Boccaletti, S.; Mendoza, C.; Hentschel, H.; Mancini, H. Synchronization of spatially extended chaotic systems in the presence of asymmetric coupling. Phys. Rev. E 2004, 70, 036219. [Google Scholar] [CrossRef] [PubMed]
  67. Shomroni, I.; Lahoud, E.; Levy, S.; Steinhauer, J. Evidence for an oscillating soliton/vortex ring by density engineering of a Bose–Einstein condensate. Nat. Phys. 2009, 5, 193. [Google Scholar] [CrossRef]
  68. Cardoso, W.B.; Zeng, J.; Avelar, A.T.; Bazeia, D.; Malomed, B.A. Bright solitons from the nonpolynomial Schrödinger equation with inhomogeneous defocusing nonlinearities. Phys. Rev. E 2013, 88, 025201. [Google Scholar] [CrossRef] [PubMed]
  69. Sacha, K.; Delande, D. Proper phase imprinting method for a dark soliton excitation in a superfluid Fermi mixture. Phys. Rev. A 2014, 90, 021604. [Google Scholar] [CrossRef]
  70. Donadello, S.; Serafini, S.; Tylutki, M.; Pitaevskii, L.P.; Dalfovo, F.; Lamporesi, G.; Ferrari, G. Observation of solitonic vortices in Bose-Einstein condensates. Phys. Rev. Lett. 2014, 113, 065302. [Google Scholar] [CrossRef] [PubMed]
  71. Lee, T.D.; Huang, K.; Yang, C.N. Eigenvalues and eigenfunctions of a Bose system of hard spheres and its low-temperature properties. Phys. Rev. 1957, 106, 1135. [Google Scholar] [CrossRef]
  72. Kim, Y.E.; Zubarev, A.L. Three-body losses in trapped Bose-Einstein-Condensed gases. Phys. Rev. A 2004, 69, 023602. [Google Scholar] [CrossRef]
Figure 1. (a) The 2D radial density, n 2 D ( r ) , as obtained from the full 3D equation, and the 2D reduction derived with the help of the variational approximation (VA). (b) The 2D radial density, n 2 D ( r ) , as obtained from the full 3D equation, and the 2D reduction derived with the help of the VA, assuming that the Gaussian width is a constant: ξ 0 = / 2 m F ω z . Different curves correspond to the indicated values of a s = ( 0 , 50 , 100 ) nm . The other parameters are N = 1000 , ω x = ω y = 1050 Hz , ω z = 21 kHz , and A = 0 . The panel (a) is taken from Ref. [21].
Condensedmatter 04 00022 g001
Figure 2. Density n 2 D as a function of coordinates x and y for four different angles between the triangular OLs θ . The fixed parameters are N = 1000 , ω x = ω y = 1050 Hz , ω z = 52.5 kHz , A = 1.74 × 10 29 J , λ = 10 μ m , and a s = 200 nm . (a) θ = 5 ° ; (b) θ = 10 ° ; (c) θ = 15 ° ; (d) θ = 20 ° .
Condensedmatter 04 00022 g002
Figure 3. The initial 1D density for one soliton (a) and eighteen dark solitons (b). In both cases, Δ s = 0.8 μ m and n b = 10 are used. The other fixed parameters are a F = 5 nm and ω t = 1000 Hz.
Condensedmatter 04 00022 g003
Figure 4. (a) The spatiotemporal diagram for the density, n 1 D , when the initial core-core separation between the two dark solitons is d = 4 μ m. (b) The speed of the solitons at t = 90 ms as a function of d. The other fixed parameters are the same as in Figure 3.
Condensedmatter 04 00022 g004
Figure 5. The spatiotemporal diagram for the density, n 1 D for different numbers of dark solitons: (a) N s = 6 , (b) N s = 10 , (c) N s = 14 , and (d) N s = 18 . In all the cases the initial distance between the solitons is d = 4 μ m. The other fixed parameters are the same as in Figure 3.
Condensedmatter 04 00022 g005
Figure 6. The distance between the central part and the edge at z > 0 of the dark-soliton gas, δ z e , as a function of time for different numbers of the dark solitons, N s . The other fixed parameters are the same as in Figure 3.
Condensedmatter 04 00022 g006
Figure 7. Dependence of the speed of the dark solitons for N s = 18 . (a) The distribution of the speed of each soliton at t = 90 ms for different initial distances d. (b) The speed of the dark soliton near the edge at t = 90 ms as a function of d. The other fixed parameters are the same as in Figure 3.
Condensedmatter 04 00022 g007
Figure 8. Spatiotemporal diagrams of the density n 1 D for N s = 18 for two different initial conditions in the presence of random perturbation ϵ . Panels (a) and (b) display the results for ϵ taking values in the ranges of [ ϵ max , ϵ max ] , with ϵ max = 0.4 μ m and 0.8 μ m, respectively. (c) E ϵ normalized to E 0 as a function of ϵ max , i.e., the amplitude of the randomly varying variable.
Condensedmatter 04 00022 g008
Figure 9. The radial profile of the 2D particle density, and the respective width for different values of interaction strength a BF . (a) n 2 D , B , (b) n 2 D , F , (c) ξ B , and (d) ξ F . The parameters are N B = 5 × 10 4 , N F = 2.5 × 10 3 , a B / F = 5 nm, ω z , B / F = 1000 Hz, and ω x , B / F = ω y , B / F = 30 Hz. The inset in panel (a) shows the difference between the VA and full 3D simulations, by means of Δ n 2 D n ¯ 2 D n 2 D . This figure is taken from Ref. [57].
Condensedmatter 04 00022 g009
Figure 10. The 2D overall percentage error of the VA versus the full 3D system, as a functionof a BF for both species. Parameters are the same as in Figure 9. This figure is taken from Ref. [57].
Condensedmatter 04 00022 g010
Figure 11. Spatial correlation C s of the GS of the 2D mixture as a a function of a BF , for three fermionic regimes: polarized, BCS, and unitarity. The fixed parameters are: N B = 5 × 10 4 , N F = 2.5 × 10 3 , a B / F = 5 nm, ω x , B / F = ω y , B / F = 30 Hz, and ω z , B / F = 1000 Hz. This figure is taken from Ref. [57].
Condensedmatter 04 00022 g011
Figure 12. Profiles of the particle density and the width in the confined direction as a function the z-coordinate for different values of the interaction strength a BF . (a) n 1 D , B , (b) n 1 D , F , (c) σ B , and (d) σ F . The parameters are N B = 5 × 10 4 , N F = 2.5 × 10 3 , a B / F = 5 nm, ω z , B / F = 30 Hz, and ω t , B / F = 1000 Hz. The inset in panel (a) shows the difference between the VA and full 3D simulations, by means of Δ n 1 D , B = n ¯ 1 D , B n 1 D , B . This figure is taken from Ref. [57].
Condensedmatter 04 00022 g012
Figure 13. Space-time diagrams of the densities of bosons (top) and fermions (bottom), for three different values of the interspecies scattering parameter: (a,b) a BF = 18 nm, (c,d) a BF = 26 nm, and (e,f) a BF = 34 nm. The initial conditions are the same in all the cases, see the text. The other parameters are the same as in Figure 12.
Condensedmatter 04 00022 g013
Figure 14. Comparison of the dynamics, as produced by the 1D VA, and from the 3D simulations. Spatiotemporal diagrams for bosons (a) and fermions (b) are obtained from the 3D simulations. The other panels show spatial profiles for: (c,d) t = 0 ms, (e,f) t = 25 ms, and (g,h) t = 50 ms. Here a BF = 10 nm, the initial conditions and other fixed parameters being the same as in Figure 12. This figure is taken from Ref. [57].
Condensedmatter 04 00022 g014
Table 1. λ 1 , λ 2 , β , and s F for three different regimes in the Fermi-gas dynamics [59,60,61,62].
Regime λ 1 λ 2 β s F
Polarized1110
BCS2411/2
Unitary240.441/2

