
Article

DFT-Guided Molecular Engineering of Donor–Bridge–Acceptor Semiconductors for Organic Photovoltaics Solar Cells

Dipartimento di Chimica e Chimica Industriale, Università degli Studi di Genova, via Dodecaneso 31, 16146 Genoa, GE, Italy
*
Author to whom correspondence should be addressed.
Condens. Matter 2026, 11(3), 29; https://doi.org/10.3390/condmat11030029
Submission received: 22 May 2026 / Revised: 17 July 2026 / Accepted: 29 July 2026 / Published: 31 July 2026
(This article belongs to the Section Physics of Materials)

Abstract

Organic semiconductors offer a potential class of materials for organic photovoltaic (OPV) applications due to their tunable optoelectronic properties and low-cost processing. A methodical DFT/TD-DFT study of a library of organic donor–π–acceptor (D–π–A) compounds based on triphenylamine donors, thiophene-based π-bridges, and benzothiadiazole/malononitrile acceptors is presented in this work, with the goal of rationalizing the structure–property relationships governing their photovoltaic behavior. CAM-B3LYP calculations were used to analyze the role of donor, bridge, and acceptor units in modulating frontier-orbital alignment, charge-transfer character, and optical absorption properties, as well as to evaluate the active-layer thickness in the estimation of the light-harvesting efficiency. The results, which are intended as internal comparative descriptors rather than predictive device efficiencies, reveal that the most pronounced bathochromic shifts and most favorable optical responses are not simply associated with the strongest donor or acceptor moieties, but rather arise from an optimal balance between frontier-orbital delocalization and charge-transfer character across the molecular framework. A preliminary assessment of photovoltaic descriptors suggests that the proposed computational workflow may provide useful guidelines for the descriptor-guided design and screening of next-generation organic photovoltaic materials.

1. Introduction

Over the past few decades up to now, organic semiconductors (OS) have achieved great relevance as active materials in a broad typology of devices such as field-effects transistors, light-emitting diodes, photodetectors and new generation solar cells [1]. Indeed, the great interest towards organic photovoltaic (OPVs) devices lies in the peculiar electronic properties of the conjugated systems for basic research and, from a technologic point of view, in the easy tuning of their manufacturing characteristics such as flexibility, cost-effectiveness, and in their capability to be produced in large area systems for low-temperature solution processing techniques [2,3].
To increase the power conversion efficiency (PCE) of OPVs, it was demonstrated that one of the most suitable architectures of the device implies a nanoscale interfacing between the donor and acceptor active layers [4]; this gives the so-called bulk heterojunction (BHJ) solar cells. To achieve efficient PCE values, the donor and acceptor molecules should have: (i) a suitable molecular energy level alignment, (ii) a high charge mobility to facilitate charge transport, and (iii) a broad absorption spectrum with a high extinction coefficient for at least one of the two active components, in order to maximize the harvesting of solar energy [5,6]. Among these requirements, it was also found that the most efficient chemical structure for OS is constituted by the presence of both donor and acceptor moieties in the same molecule, and a large number of works in the literature are focused on this kind of compounds [7]. Among the most successful molecular-design strategies for organic photovoltaic materials and DSSCs are the donor–π–acceptor (D–π–A) architectures. In such systems, efficient charge transfer, light absorption, and charge-transport properties strongly depend on the electronic and steric characteristics of the three main building blocks, namely the donor, π-bridge, and acceptor units. For instance, high photovoltaic performances have been achieved using a wide variety of chromophores incorporating triphenylamine-, carbazole-, and benzodithiophene-based donor motifs [7,8]. Similar molecular-engineering principles are also found in DSSC sensitizers, where donor–π–acceptor dyes constitute one of the most established classes of organic sensitizers. For example, quinoxaline-based sensitizers have been shown to combine broad absorption spectra and high molar extinction coefficients, leading to efficient light harvesting and promising photovoltaic performances [6]. These examples highlight the importance of understanding how donor, π-bridge, and acceptor fragments individually contribute to the electronic and optical response of the whole chromophore.
In this context, the present work focuses on the systematic assessment of donor, π-bridge, and acceptor contributions within a chemically coherent molecular library to extract transferable structure–property relationships and molecular-design guidelines. Attention is devoted to understanding how the individual donor, π-bridge and acceptor fragments contribute to the electronic, optical and photovoltaic descriptors of the resulting D–π–A chromophores. The reported examples of available donor and acceptor groups indicate that new systems can be potentially designed and synthesized to further improve the performance of OPV devices. In this framework, the in silico molecular design [9,10,11,12,13] by using the selection, connections and functionalization of the donor/acceptor moieties can easily build a molecular library for the selection of potential structures with the above characteristics.
In detail, this study reports theoretical insights derived from the investigation of a novel class of molecules designed within a conventional donor–bridge–acceptor (D–π–A) framework. The choice of the building blocks forming the chromophores under investigation is supported by numerous studies in the literature. In fact, triphenylamine (TPA) derivative was chosen as the donor because it is widely used due to its high electron-donating capacity and chemical stability, which favor charge transport and optimized optical absorption [14]. In addition to the referenced TPA-based structures, an oxygen-bridged derivative was included as a representative rigidified donor motif, allowing us to probe the influence of conformational constraint and enhanced π-electron delocalization on the structure–property relationships of the investigated D–π–A systems. Dithiophenyl moieties are used as the π–bridge because recent studies indicate that this molecular structure strongly enhances molecular rigidity, crystallinity and charge mobility, as well as improves chromophore absorption. The introduction of this group globally reduces the bandgap and increases the short-circuit current in OPV devices [14]. Finally, thiadiazole- and malononitrile-derived systems are chosen as acceptor groups because they are commonly known [15] to be used in push–pull systems to lower the LUMO level and promote charge separation, achieving superior photovoltaic efficiency. Through the density functional approach (DFT) together with its time-dependent extension (TD-DFT), we systematically investigate the role of the three fundamental subunits, donor, π-bridge, and acceptor, in modulating the properties of D–π–A molecules. By exploring different combinations of these building blocks, we elucidate how donor, π-bridge, and acceptor fragments individually and collectively control the electronic structure, optical response, light-harvesting efficiency and descriptor-based estimation of photovoltaic behavior. We show that this simple computational screening approach allows for the identification of the most representative candidates, within the constructed molecular library, for potential application in OSC devices.

2. Computational Methods and Moieties Used in This Study

The structures of the D–π–A systems were optimized at the B3LYP [16] level using the 6-311G basis set [17], while the optical properties were calculated in the framework of the TD-B3LYP approach [18]. All the in silico computations were performed using the Gaussian 09 software package [19]. This choice represents a reasonable compromise between the quality and accuracy of the modeling and the computational cost required to achieve it, since here we are more interested in comparative screening, rather than quantitative device-level predictions. To further assess the robustness of the adopted computational protocol, additional benchmark calculations were performed on the representative chromophore d1_dt_ac1 and on the dithiophene bridge (dt) using the larger 6-311++G(d,p) basis set. The corresponding results are reported in Table S1 of the Supplementary Materials and show only minor variations in the calculated electronic, optical, and photovoltaic descriptors with respect to the 6-311G calculations. In fact, for structure optimization it is well known that the B3LYP hybrid functional is widely used in this context and gives good results [20] for ground-state properties such as molecular geometry. The choice of the 6-311G basis set was motivated by preliminary calculations performed on thiophene-based model systems which showed that the molecular descriptors employed throughout the present screening procedure are only weakly affected by basis-set enlargement, although the inclusion of polarization and diffuse functions improves the variational description of the electronic energy. For the dithiophene-containing systems, benchmark calculations performed on both the isolated dithiophene bridge (dt) and the representative d1_dt_ac1 chromophore showed that the corresponding trans conformers are only slightly more stable and lead only to modest variations in the electronic and optical descriptors considered in this work (Table S1). Therefore, both conformations preserve the same qualitative structure–property relationships relevant to the present screening analysis. Consistent with previous theoretical studies on 2,2′-dithiophene derivatives, both conformers correspond to genuine minima on the potential-energy surface and exhibit very similar electronic behavior [21]. For this reason, and because both conformations show essentially identical qualitative trends, the cis conformers were retained throughout the comparative screening analysis in the present study. These results indicate that the TD-CAM-B3LYP/6-311G and B3LYP/6-311G computational protocol provides a balanced description of the occupied and virtual orbitals involved in the optically allowed excitations, while maintaining a computational cost compatible with the systematic screening of an extended molecular library. In view of the known limitations, associated with the use of the TD-B3LYP approach [22,23], and in particular for D–π–A systems, the simulated electronic spectra of these molecules were simulated using the TD-CAM-B3LYP [24,25].
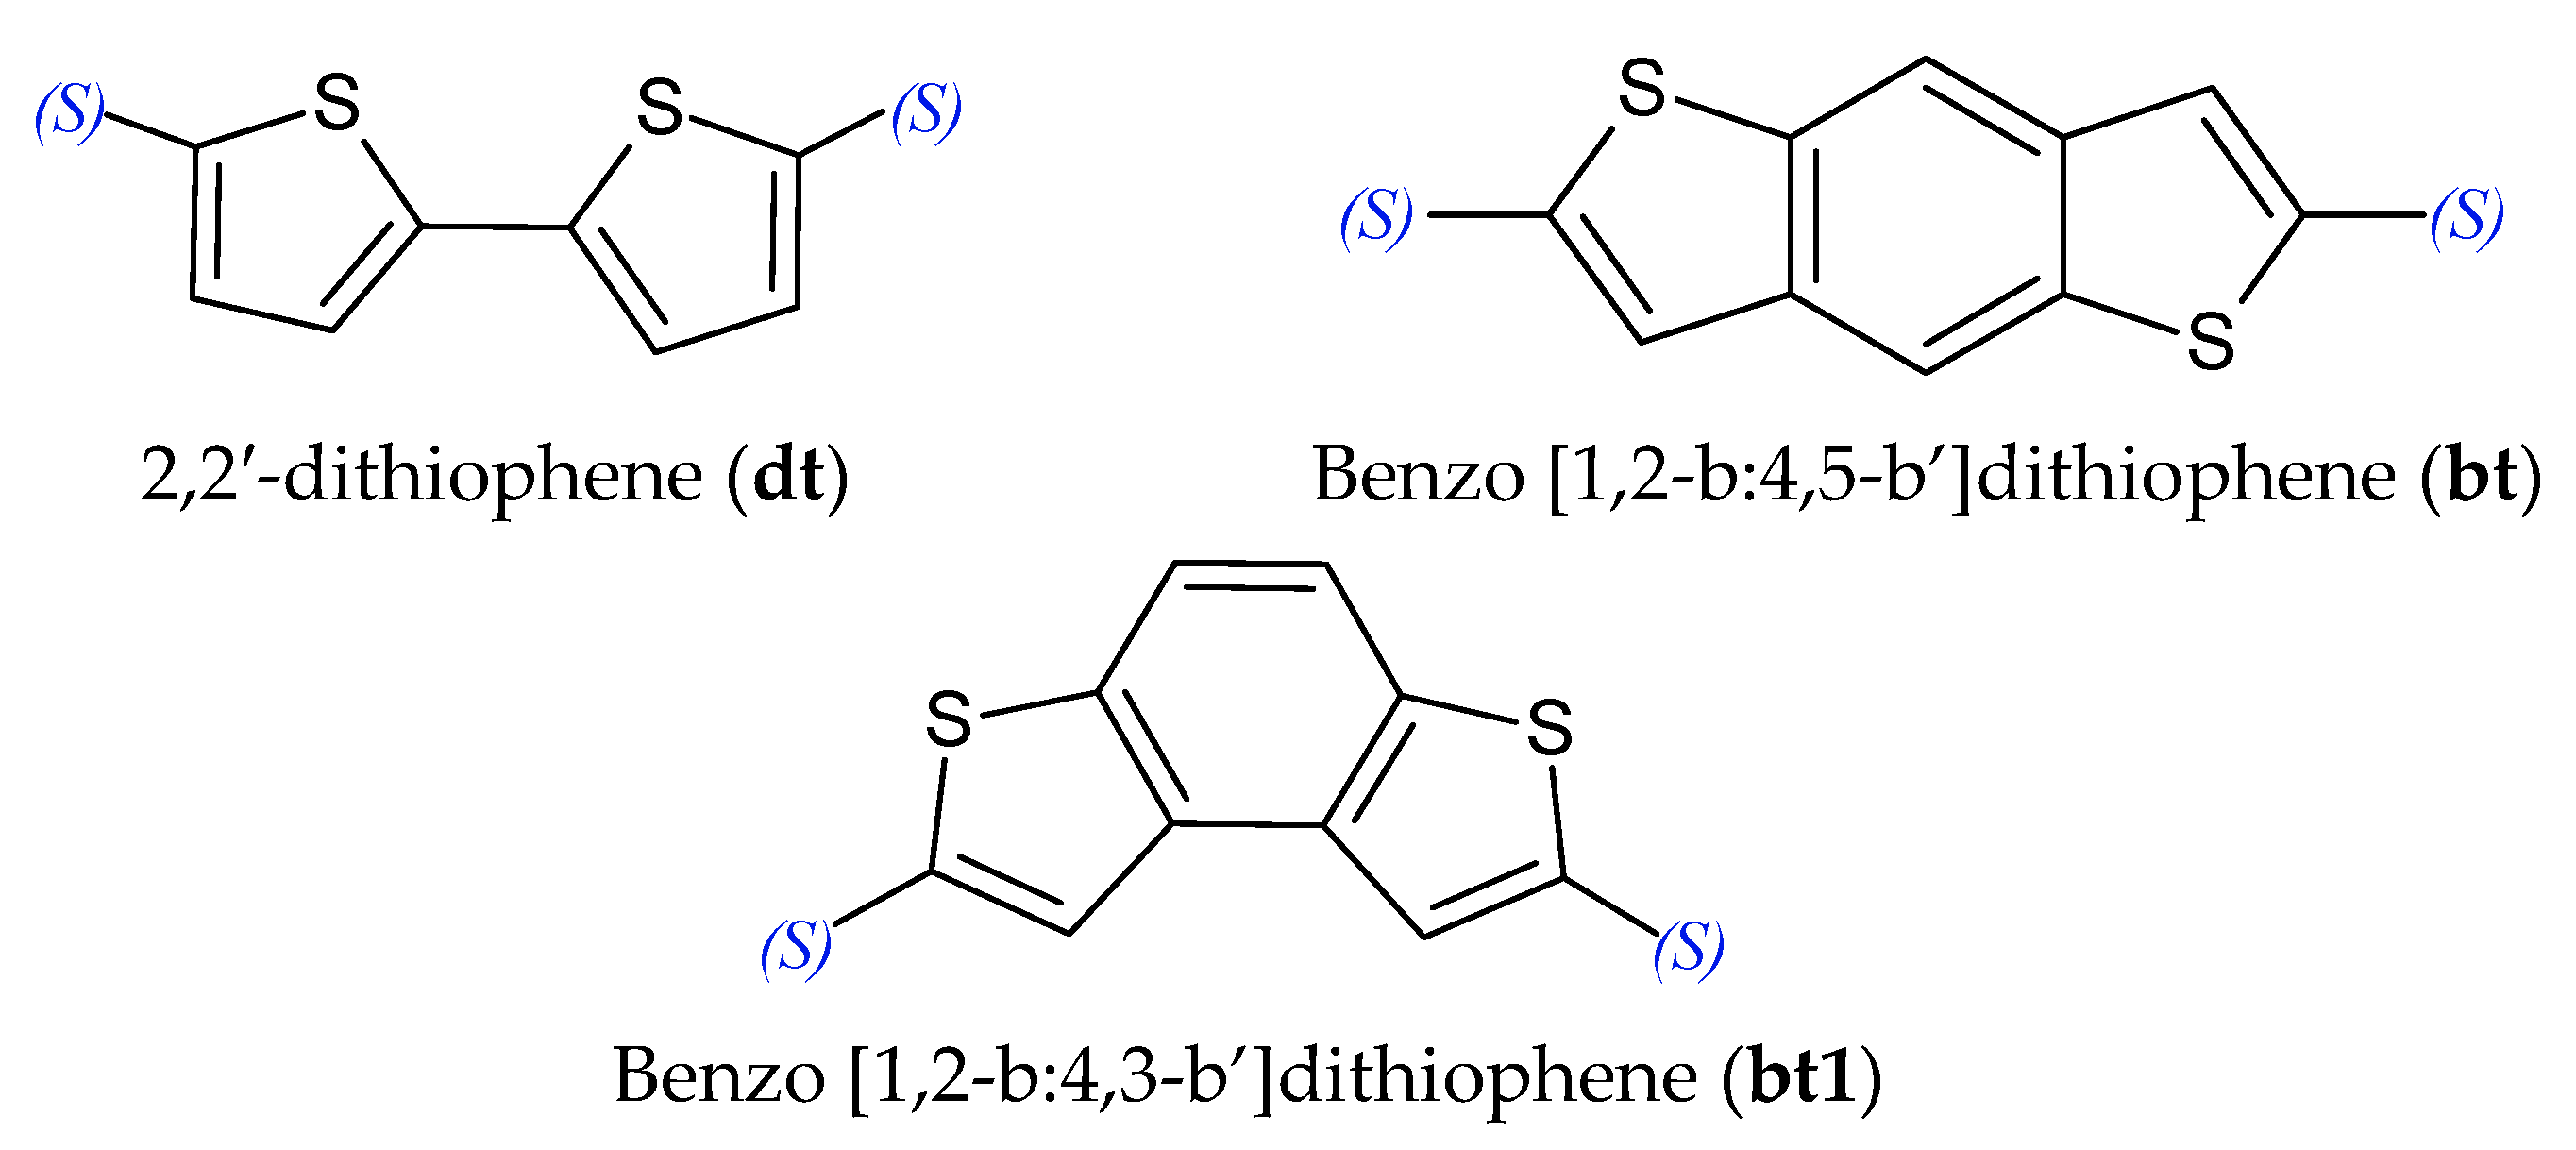
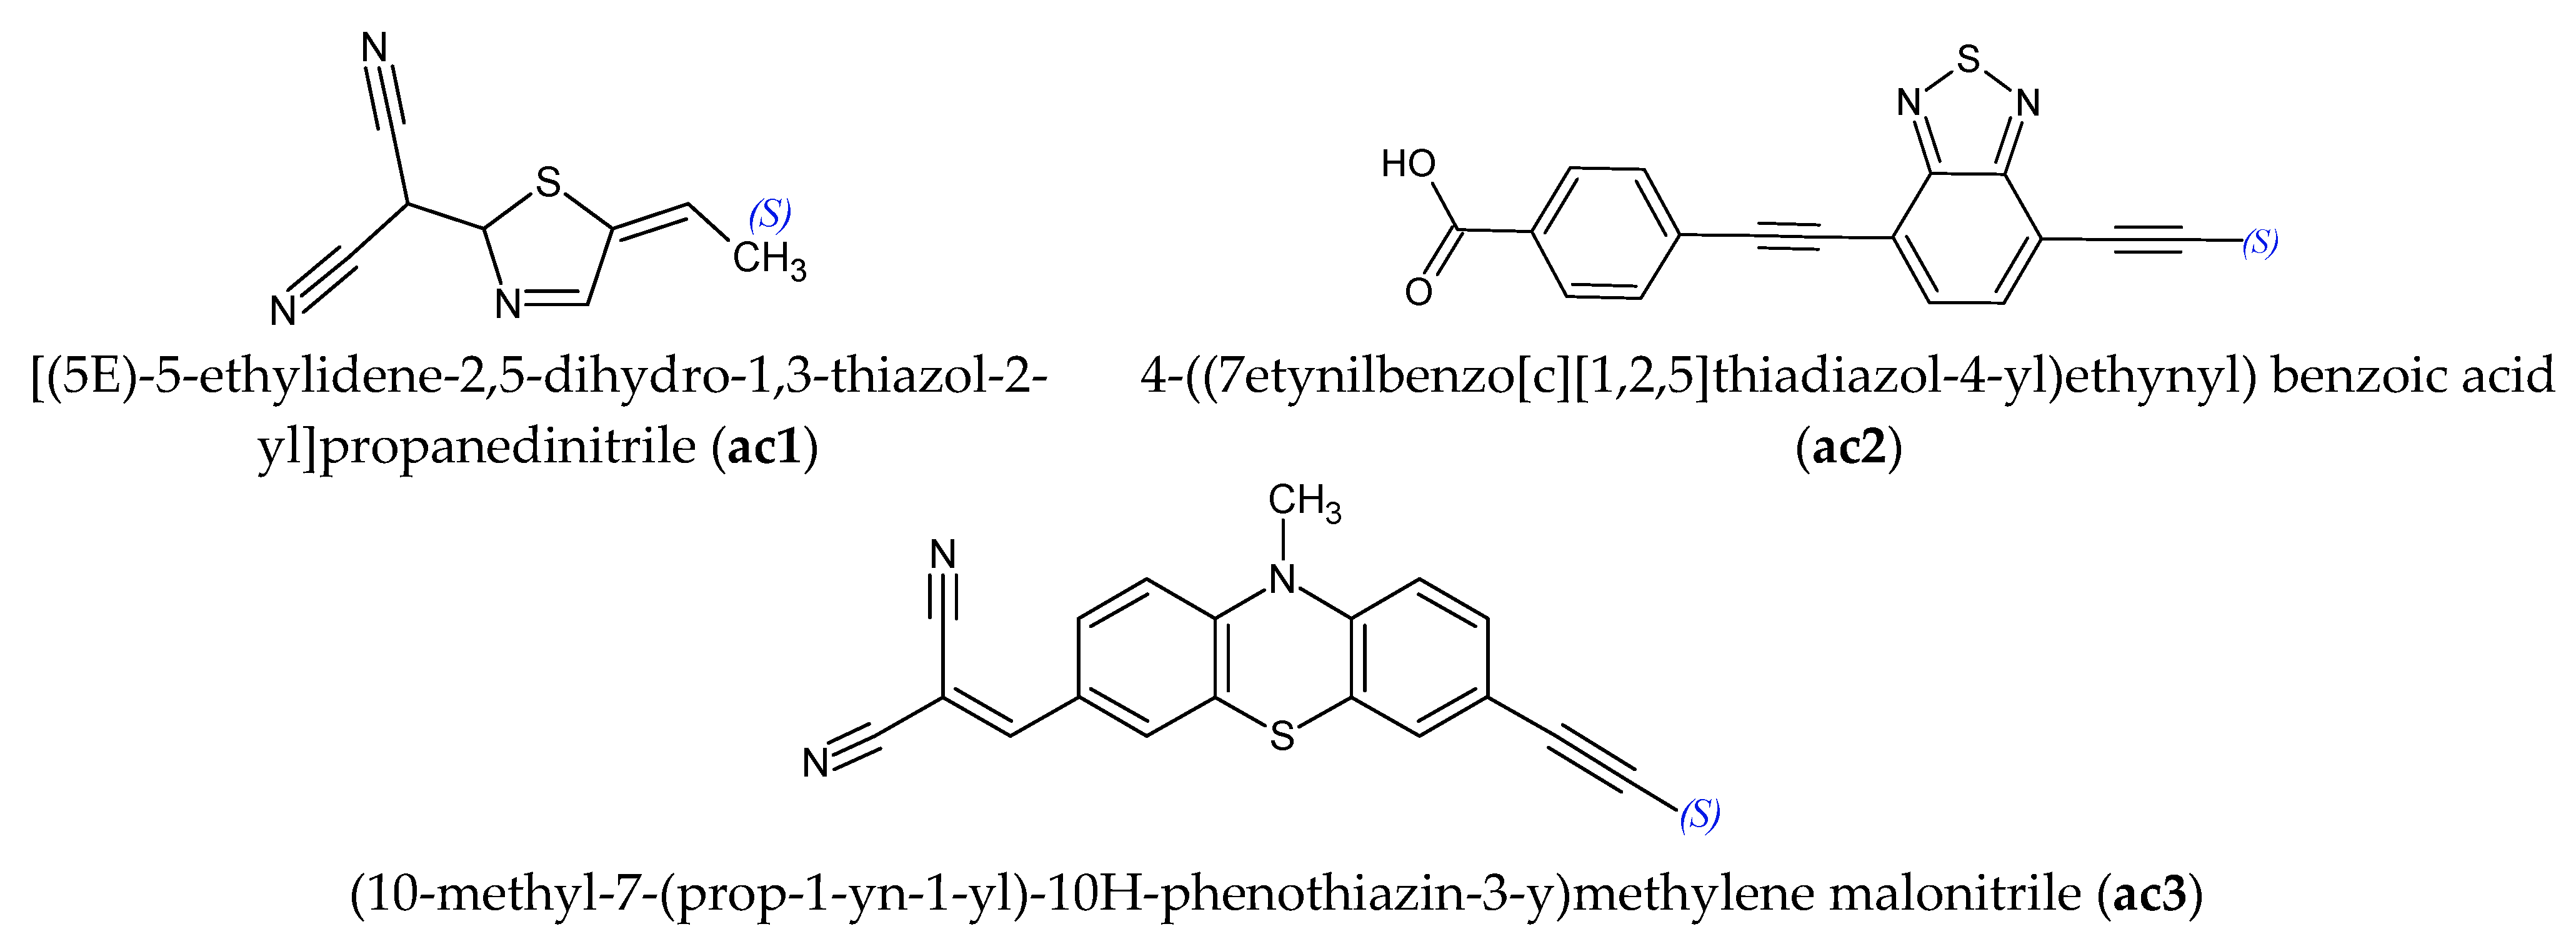
For the push–pull D–π–A library, remembering that our goal is to provide a guideline for the molecular design of potential photovoltaic materials with improved descriptors trends, for the donor (D) moieties we have chosen triphenylamine due to its well-known electron-donating properties [26], used here as reference donor. In addition to this reference unit, two further molecules were considered: a methoxy-substituted derivative, in order to enhance electron-donating strength through stabilization of the positive charge, and a structurally constrained derivative featuring intramolecular O-bridges to induce planarization and increase π-electron delocalization. Similarly, three structures were considered for the π-bridge: as a reference, the 2,2′-bithiophene’s widespread use as an active material in organic solar cells thanks to its favorable charge-carrier mobility [27], together with two analogous structures characterized by a higher degree of molecular planarization, allowing investigation of structural effects on the overall system by varying the relative distance between the donor and acceptor units. Finally, for the acceptors (A), the [(5E)-5-ethylidene-2,5-dihydro-1,3-thiazol-2-yl]propanedinitrile structure [28] was chosen as a reference, and based on a literature survey [29,30], two additional molecules with an extended conjugated framework, which exhibits interesting electronic properties and absorption bands shifted toward the low-energy visible region, were also selected. All the molecular structures chosen are shown in Figure 1, Figure 2 and Figure 3, together with their acronym used for denoting each specific D–π–A system.
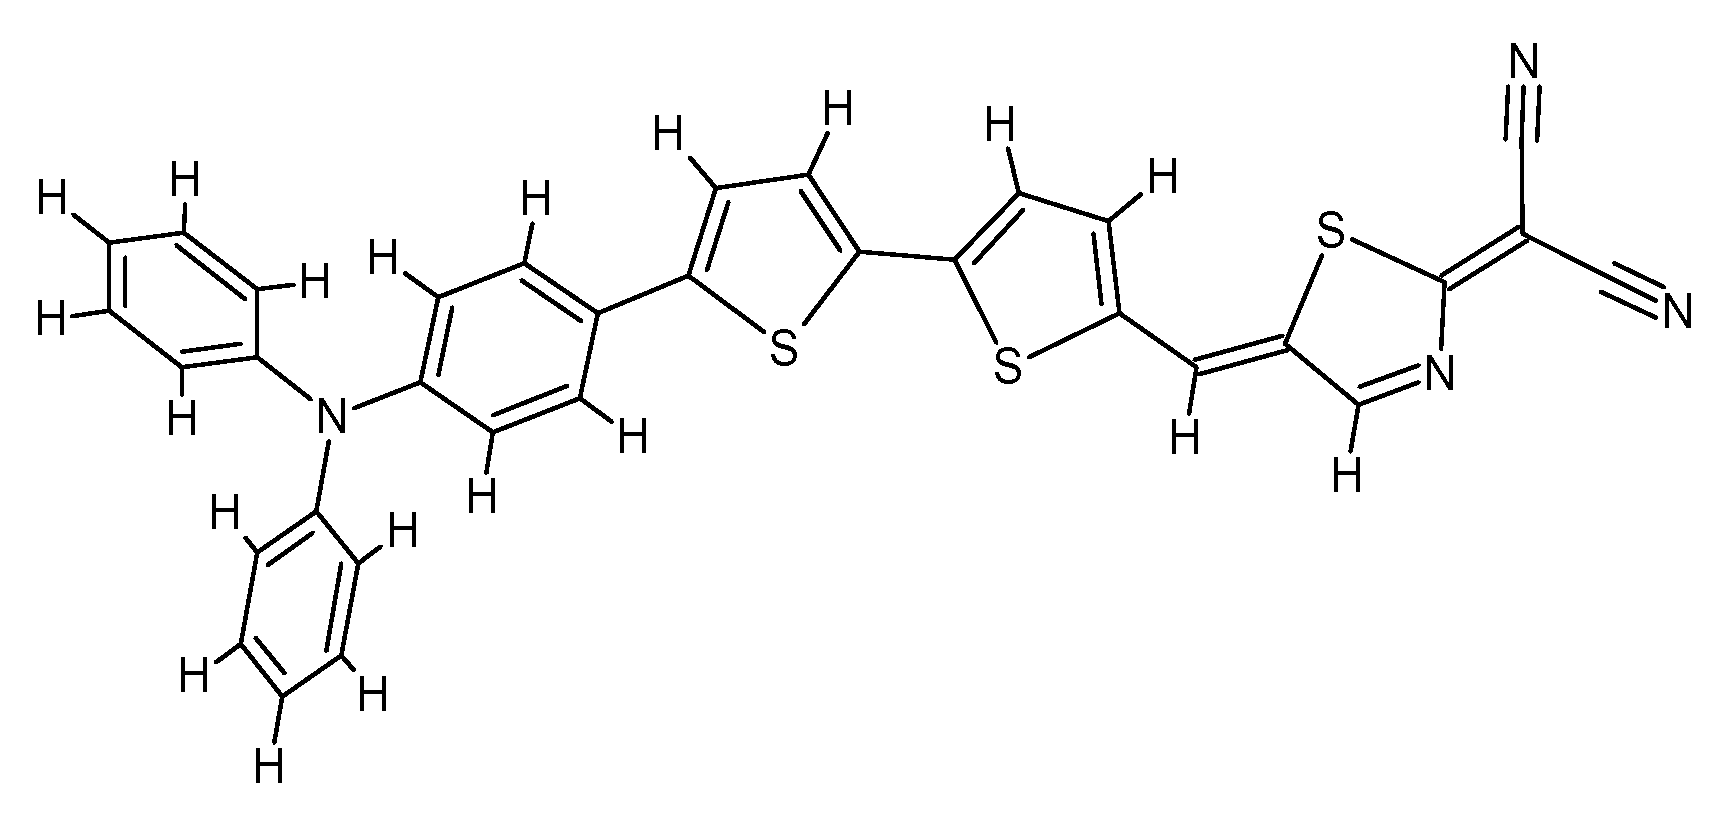
Scheme 1, as a representative example, shows the molecular structure of one of the D–π–A chromophores studied, denoted by the acronym used for defining the D, π, A moieties, respectively.

3. Results and Discussion

3.1. Analysis of the Frontier Molecular Orbitals (MOs) and Electronic Properties

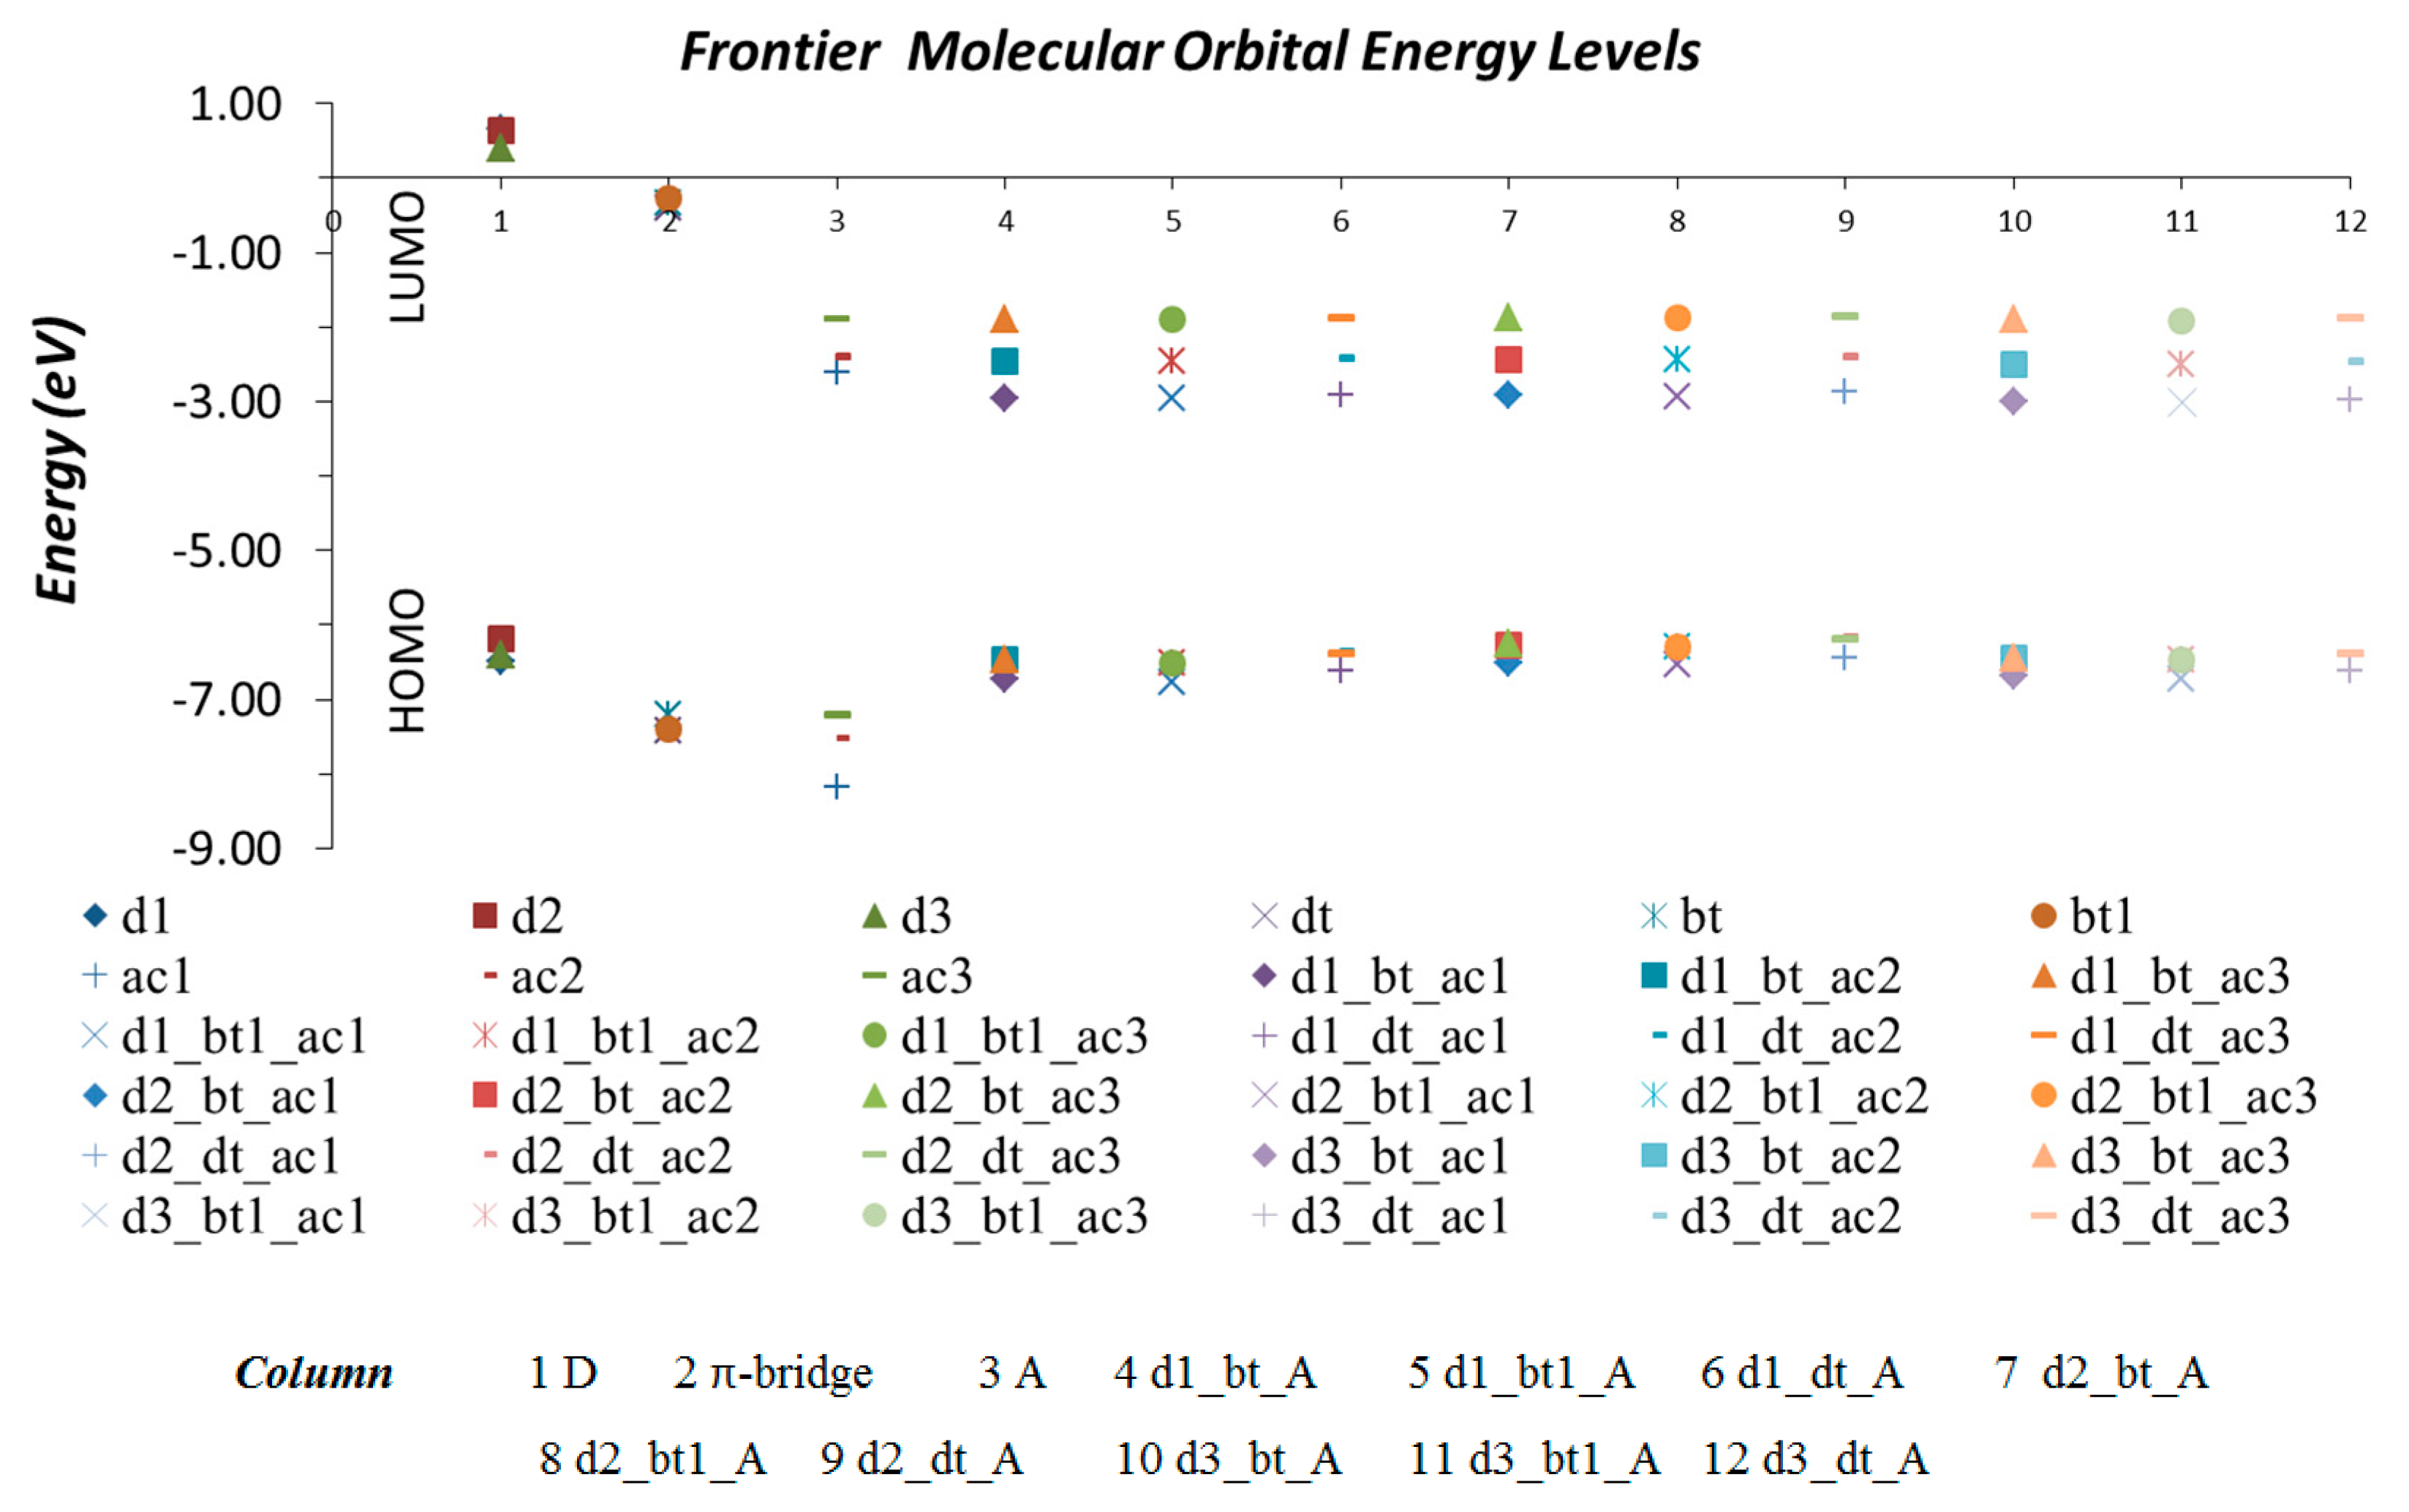
Although the nine units of Figure 1, Figure 2 and Figure 3, as well as the built D–π–A molecules, were optimized at the B3LYP/6-311G level, the data reported for comparison with the computed electronic spectra are based on TD-CAM-B3LYP/6-311G calculations performed on the optimized geometries. The HOMO/LUMO energies for each molecule are reported in the graphs of Figure 4, whereas the corresponding numerical values are listed in Table S2 of the Supplementary Materials. The expected result is that ELUMO(D–π–A) − EHOMO(D–π–A) ≤ ELUMO(A) − EHOMO(D), i.e., the electronic absorption spectrum of the push–pull systems results would be red-shifted with respect to the single building units. A qualitative analysis of the frontier MOs of the D, π, A units could provide hints for the library constructions. In fact, within the hypothesis that in the D–π–A structures the corresponding HOMO and LUMO orbitals arise from a three-level interaction of the HOMO/LUMO building moieties, one should expect that ELUMO(D–π–A) ≤ Min(ELUMO(D, π, A)) and EHOMO(D–π–A) ≥ Max(EHOMO(D, π, A)). On this basis, the least red-shift could be expected for the d3_π_ac3 systems.
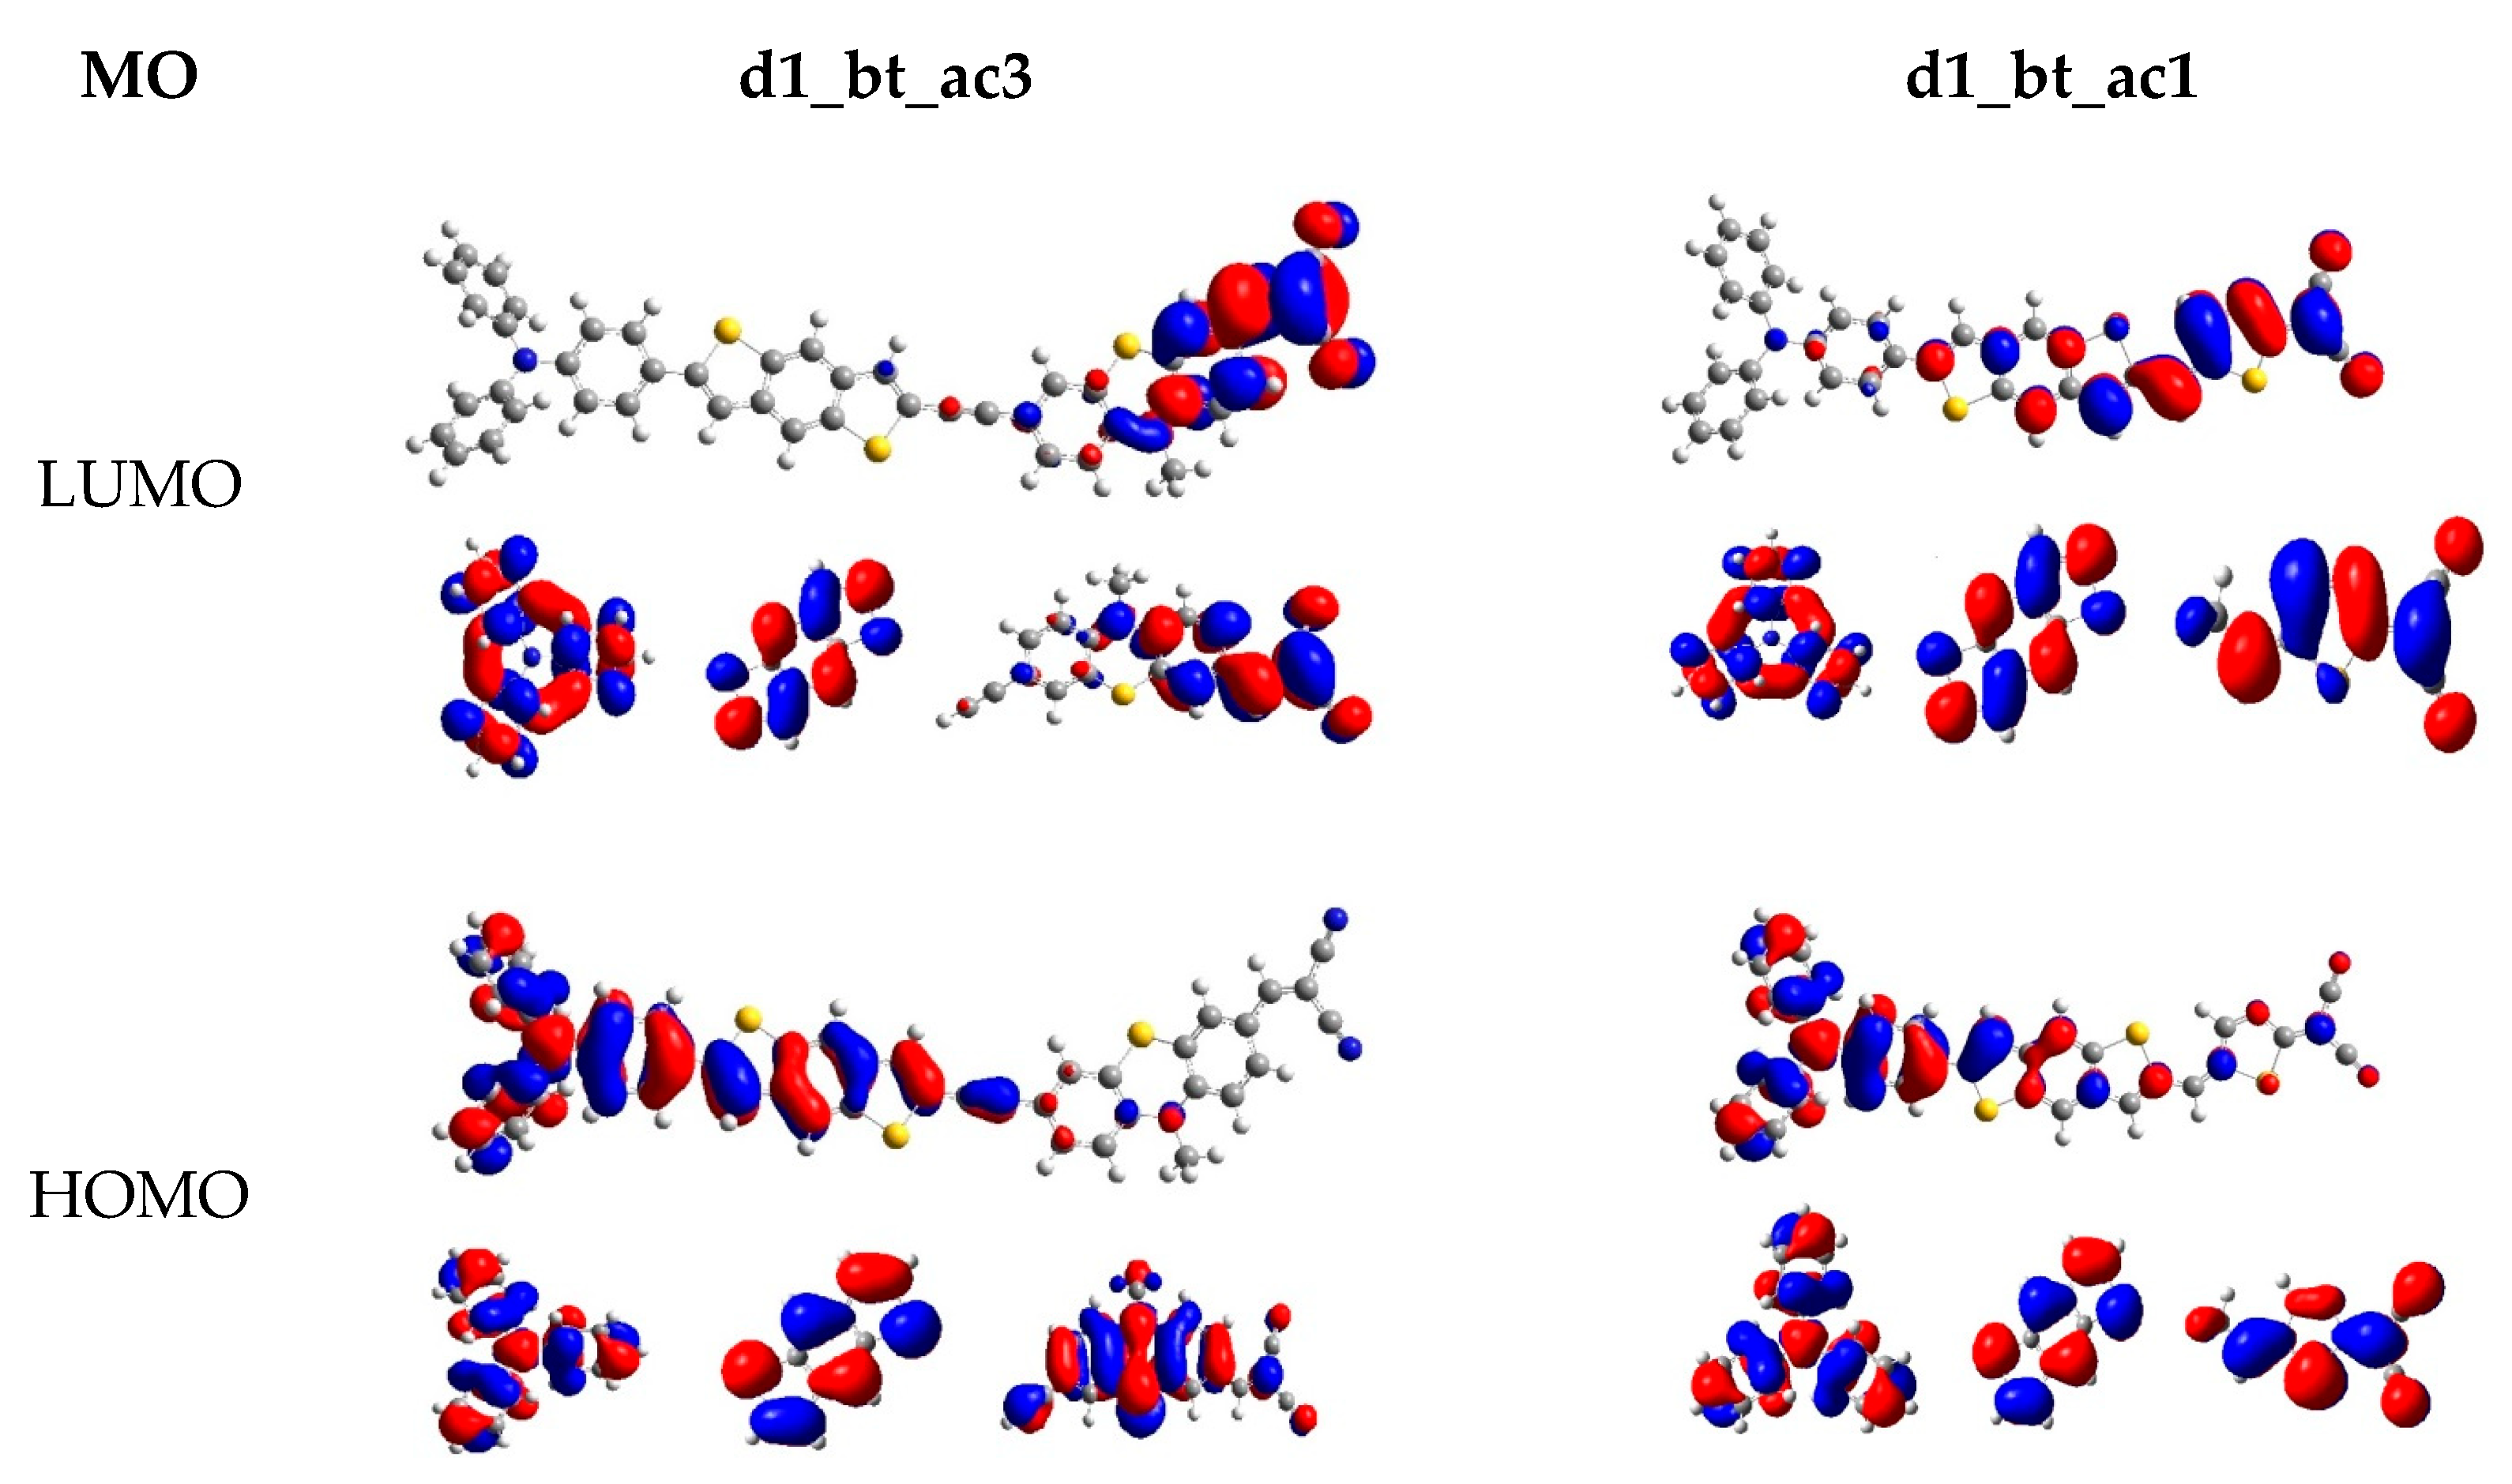
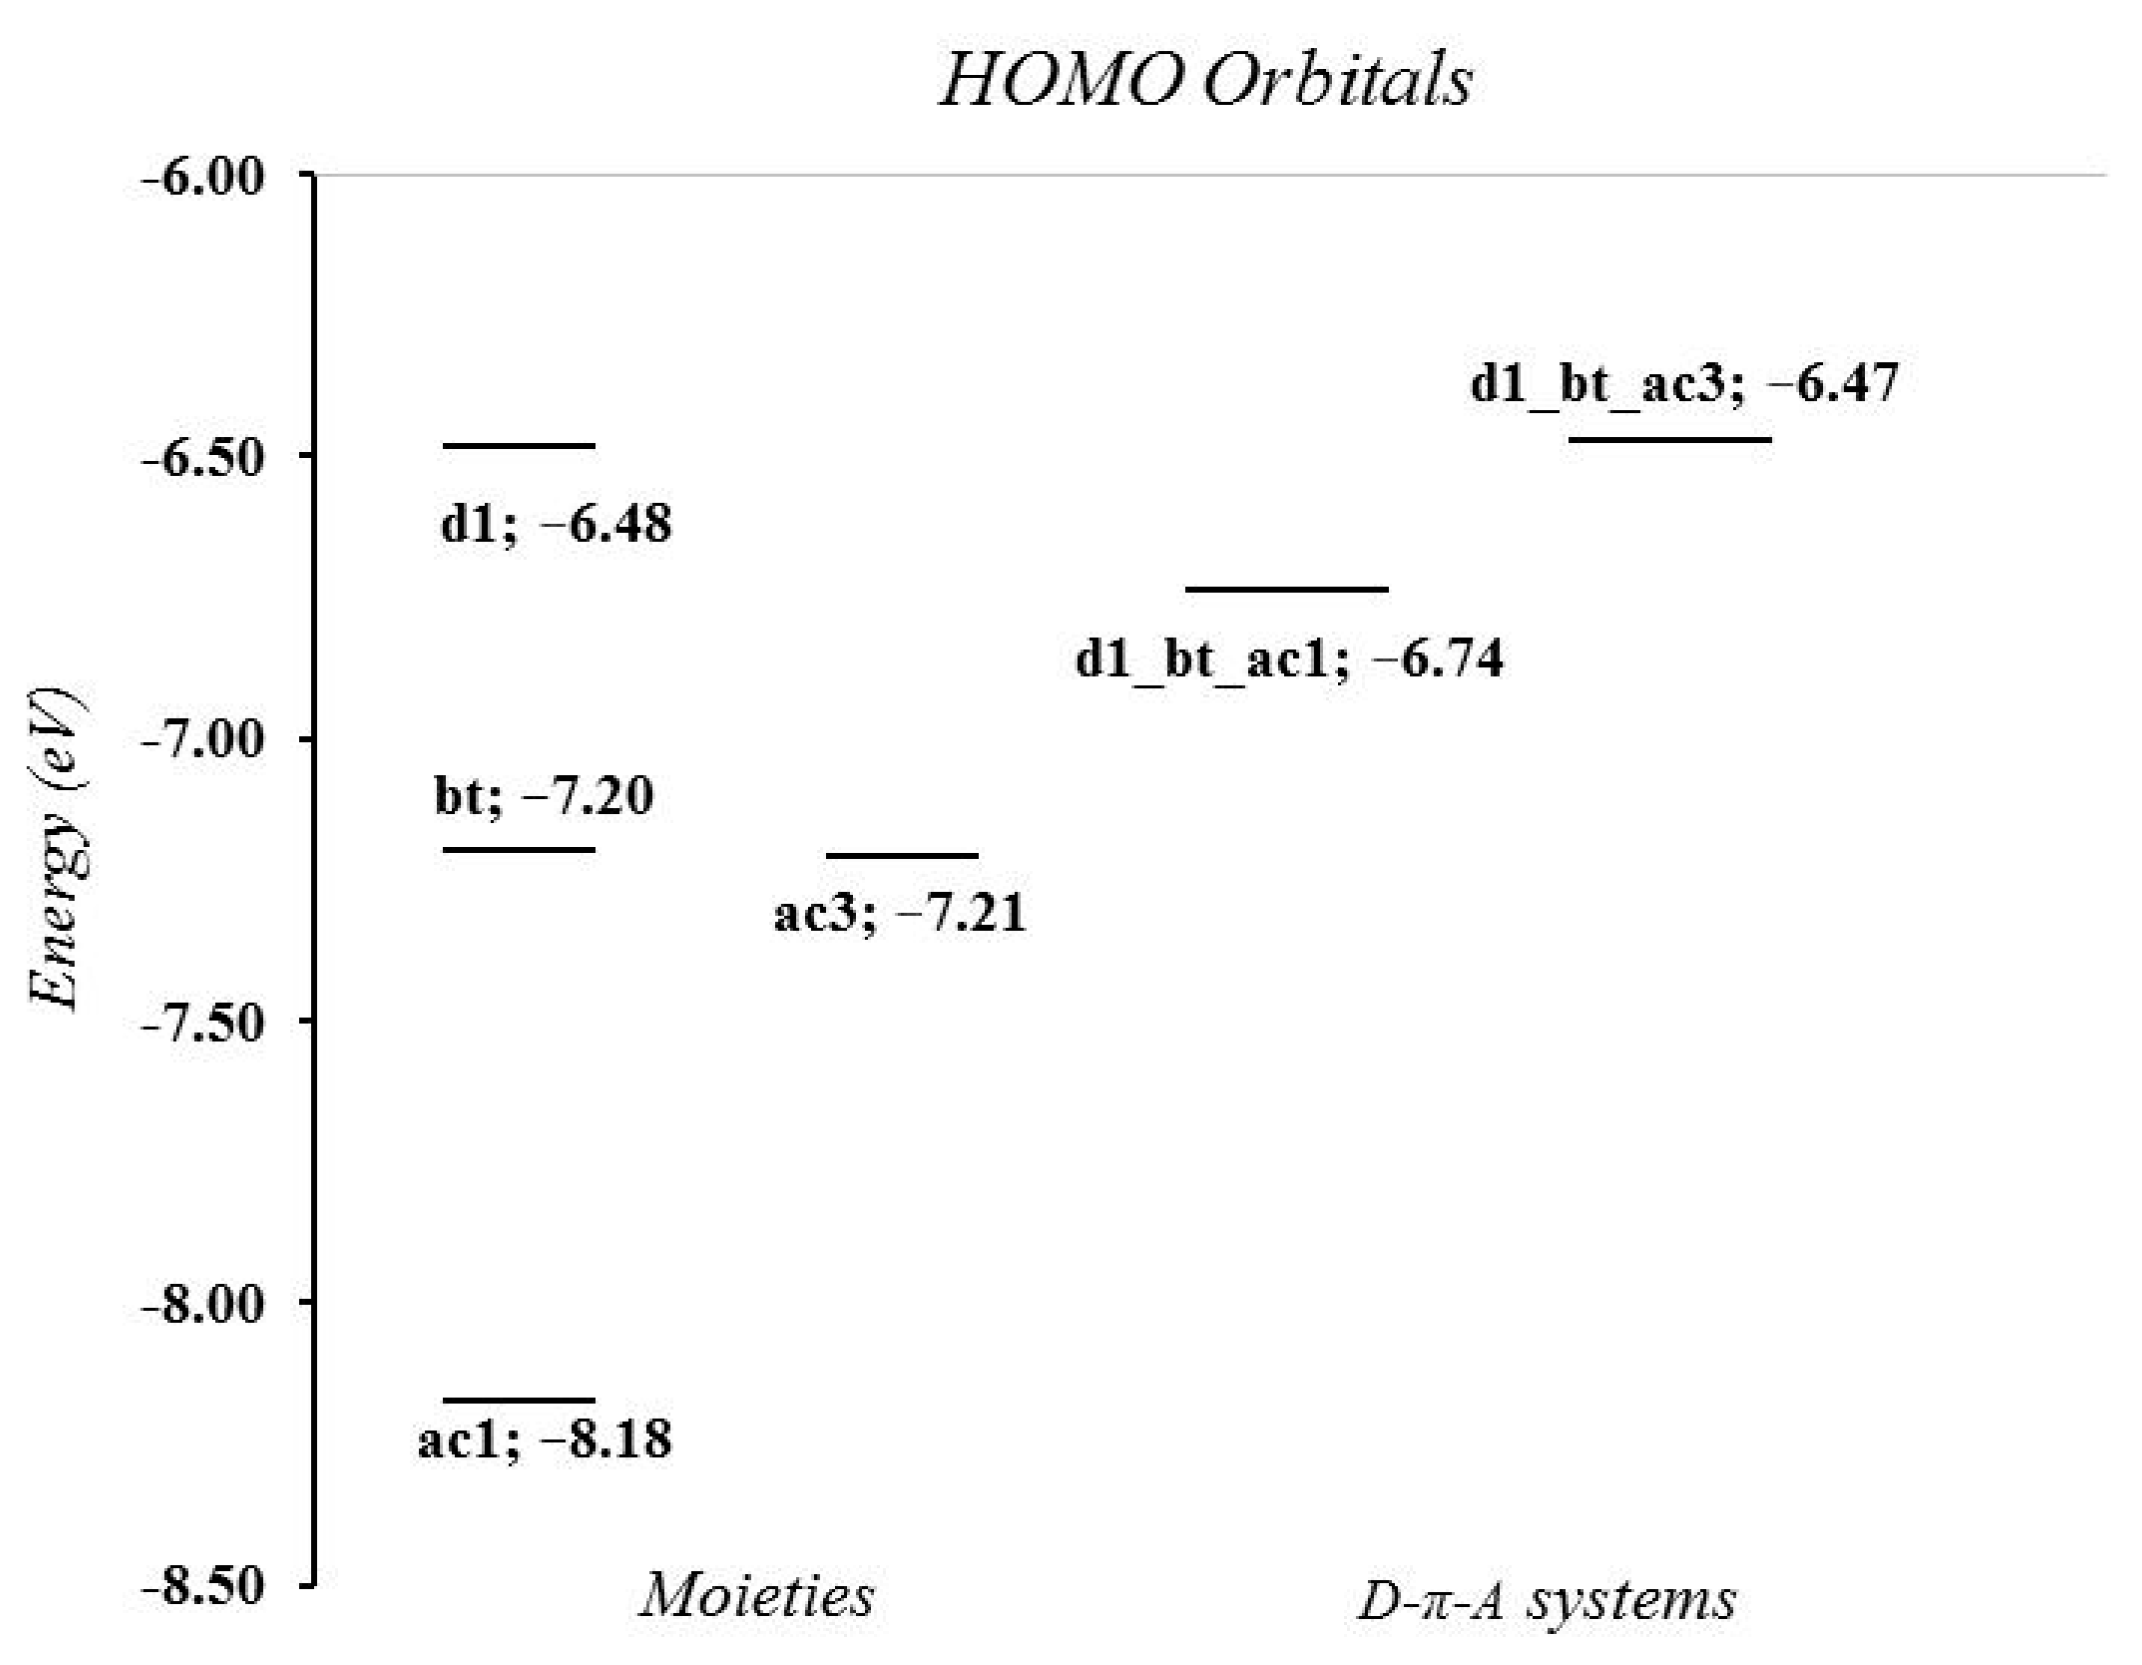
The analysis of the D–π–A data (numerical results are reported in Table S2) underlines that the simple approach based on the three-level interactions holds only for the LUMO orbitals. From Figure 4 (or from the energies reported in Table S2), it results in the condition ELUMO(D–π–A) ≤ Min(ELUMO(D, π, A)) being practically satisfied. On the contrary, for the HOMOs, in different cases an appreciable stabilization (by about 0.2–0.3 eV) with respect to this simple model (for which EHOMO(D–π–A) ≥ Max(EHOMO(D, π, A))) is observed. This indicates that a more complex interaction scheme should be assumed for HOMO orbitals, due to the energy ordering of the molecular orbitals of the units and to HOMO/LUMO mixing. To gain deeper insights into the origin of the electronic trends, a fragment-orbital interaction analysis was performed on the representative chromophores d1_bt_ac3 and d1_bt_ac1 (Figure 5). The HOMO and LUMO energies of the D–π–A chromophores are compared with those of the isolated donor (d1), π-bridge (bt), and acceptor (ac1 or ac3) building blocks. Inspection of Figure 5 (top) shows that the HOMO energy alignment qualitatively indicates that the occupied frontier orbitals retain a predominant donor character. In particular, the HOMO energy of d1_bt_ac3 (−6.47 eV) is almost the same as that of the isolated donor d1 (−6.48 eV), whereas d1_bt_ac1 exhibits a more pronounced stabilization of its HOMO, yielding a frontier-orbital energy of −6.74 eV, approximately reduced by 0.26 eV. This behavior suggests that additional orbital interactions contribute to the occupied electronic manifold and cannot be captured by the simple three-level scheme.
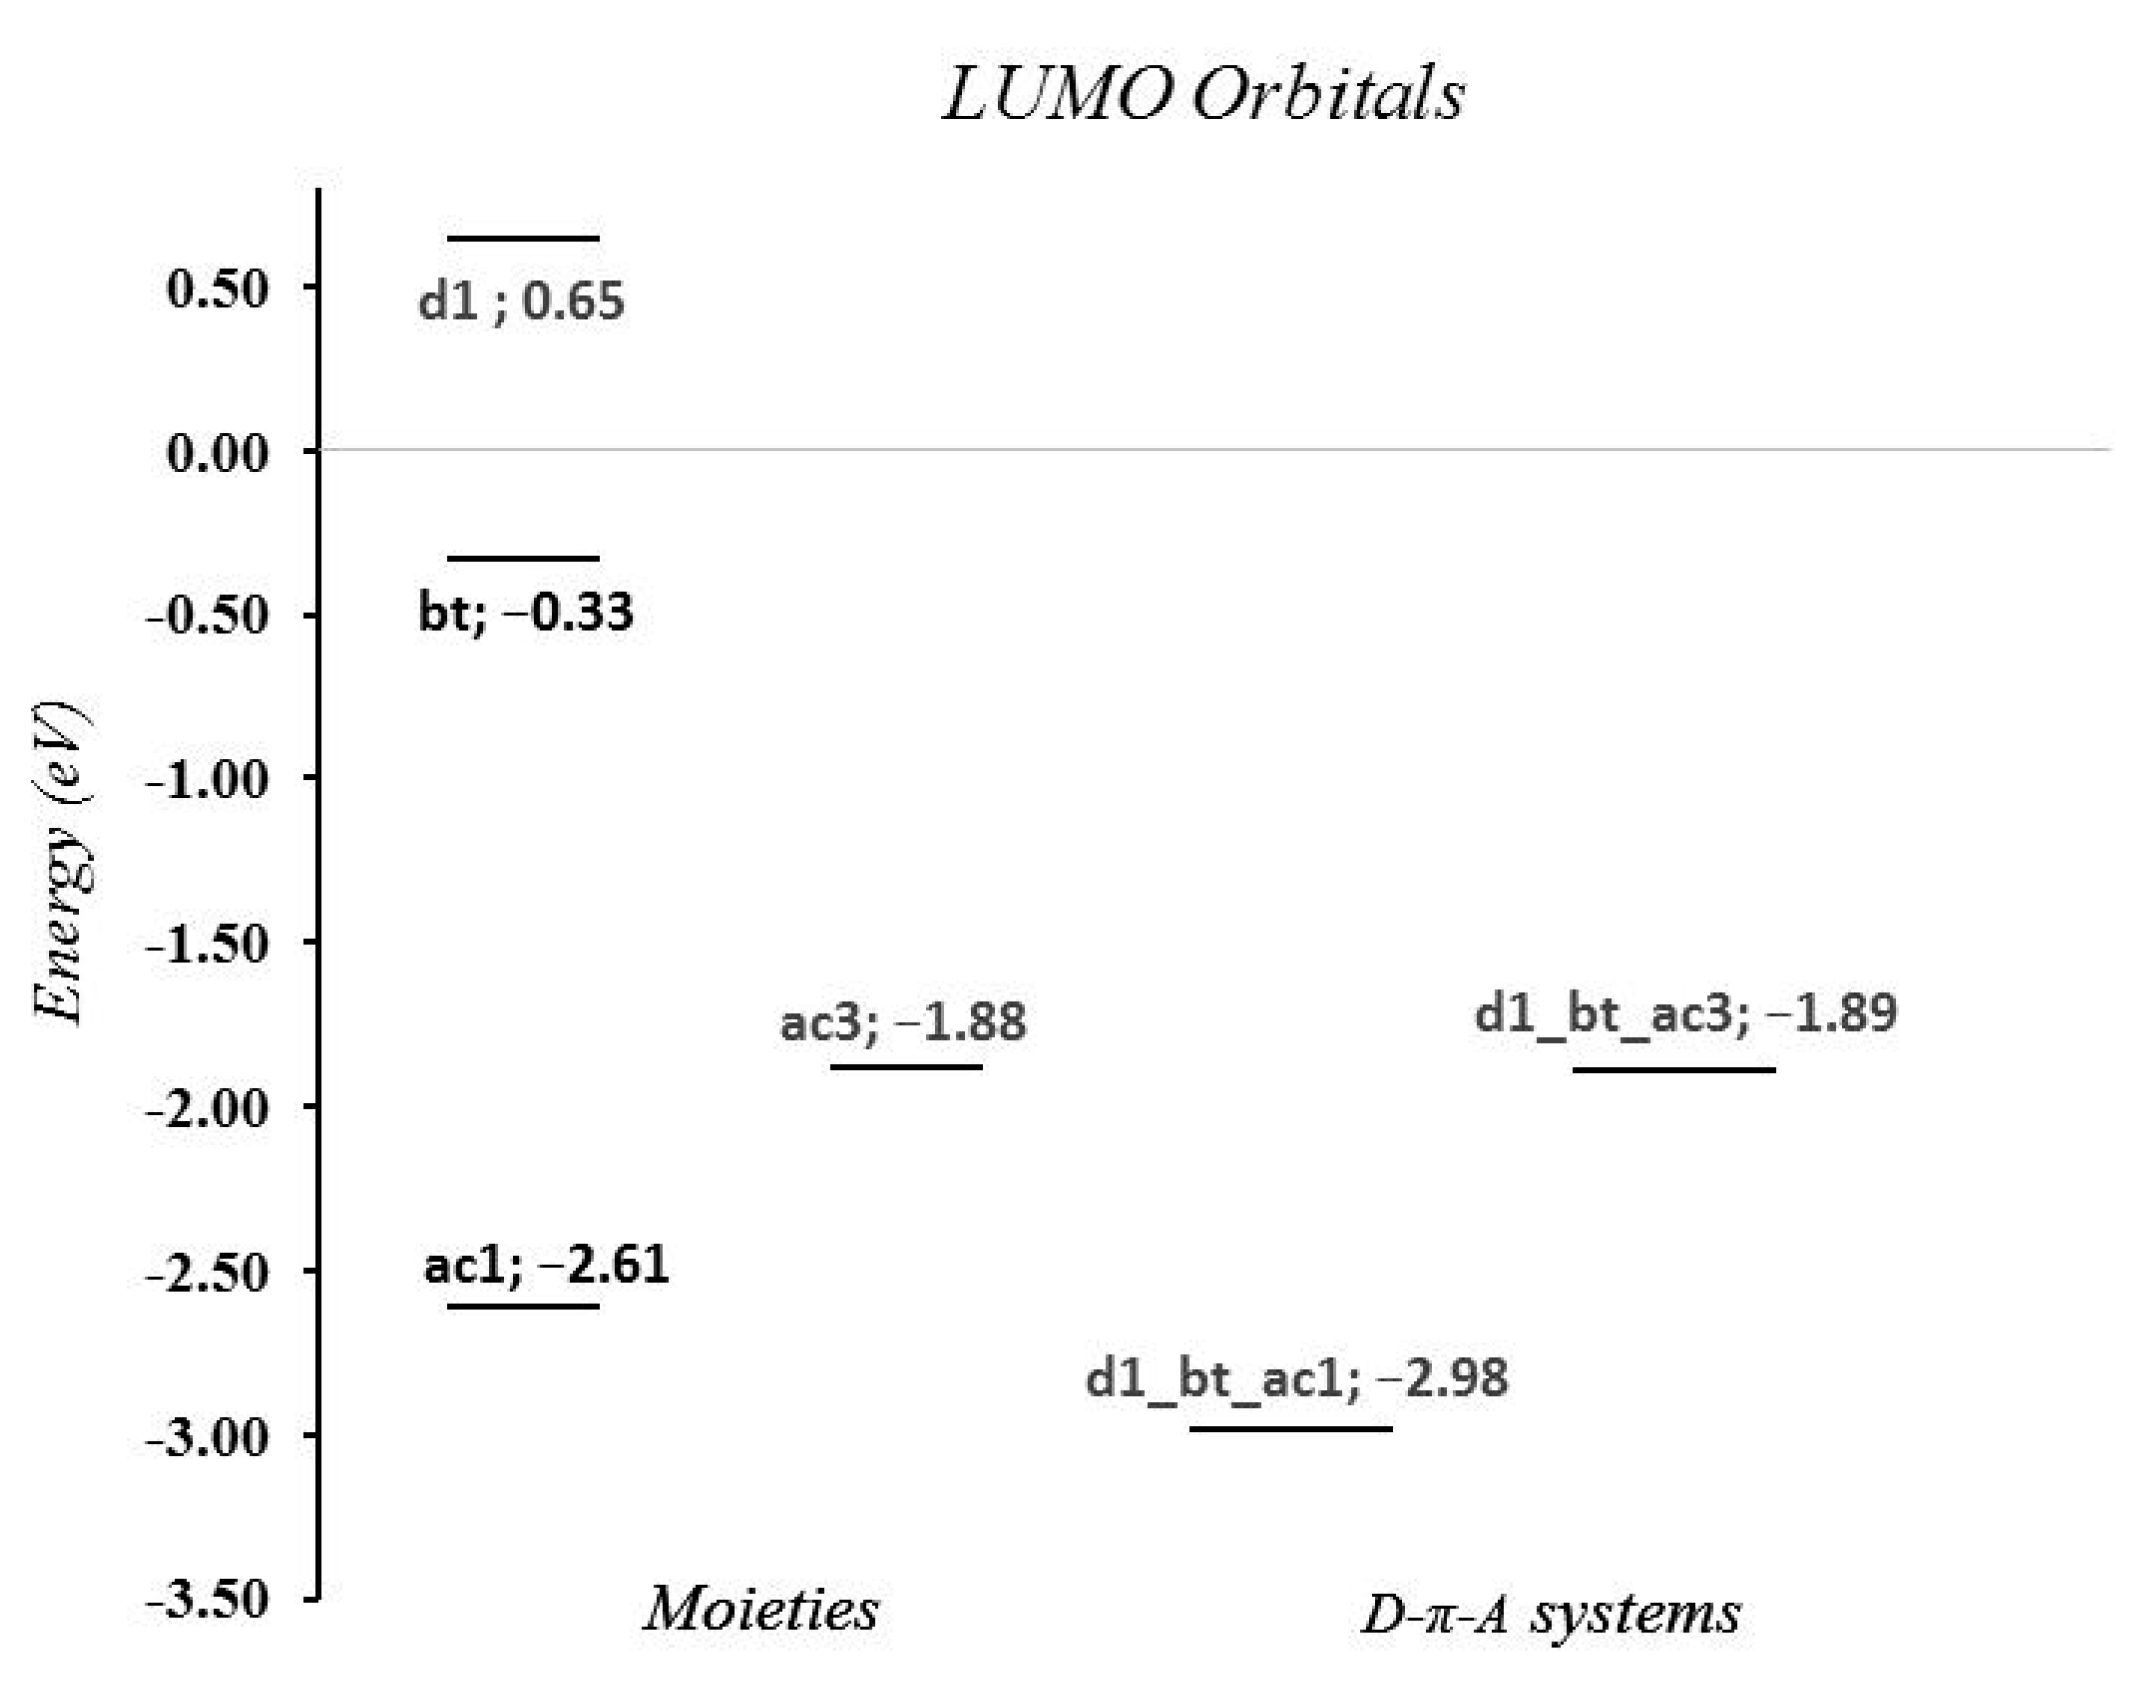
Conversely, the simple three-level interaction model appears to provide a more satisfactory qualitative description of the LUMO energies. For the d1_bt_ac3 chromophore the LUMO (−1.89 eV) is almost identical to that of the isolated ac3 fragment (−1.88 eV), indicating that the virtual frontier orbital mainly retains the energetic character of the acceptor unit. In contrast, the LUMO of d1_bt_ac1 (−2.98 eV) is stabilized by approximately 0.37 eV relative to the isolated ac1 fragment. These differences are further corroborated by the corresponding frontier-orbital isodensities shown in Figure 6.
Figure 6 shows that for both chromophores the HOMO is mainly distributed over the donor and π-bridge fragments, whereas the acceptor contribution remains comparatively limited. The d1_bt_ac3 LUMO exhibits a strong localization on the acceptor moiety, whereas the d1_bt_ac1 one shows a more evident participation of the π-bridge.
The combined analysis of Figure 5 and Figure 6 therefore provides a molecular-orbital picture of the observed HOMO and LUMO energies, HOMO–LUMO gaps, and optical properties. The increased stabilization and spatial extension of the ac1-derived LUMO contribute to a smaller HOMO–LUMO gap and, therefore, to a more pronounced bathochromic shift, as observed for the ac1-containing D–π–A systems. Similar trends are remarked on throughout the molecular library explored. Overall, the HOMO and LUMO distributions indicate that the lowest-energy electronic transitions involve electron-density displacement from the donor–bridge region towards the acceptor moiety one, consistent with the significant oscillator strengths observed for these chromophores.
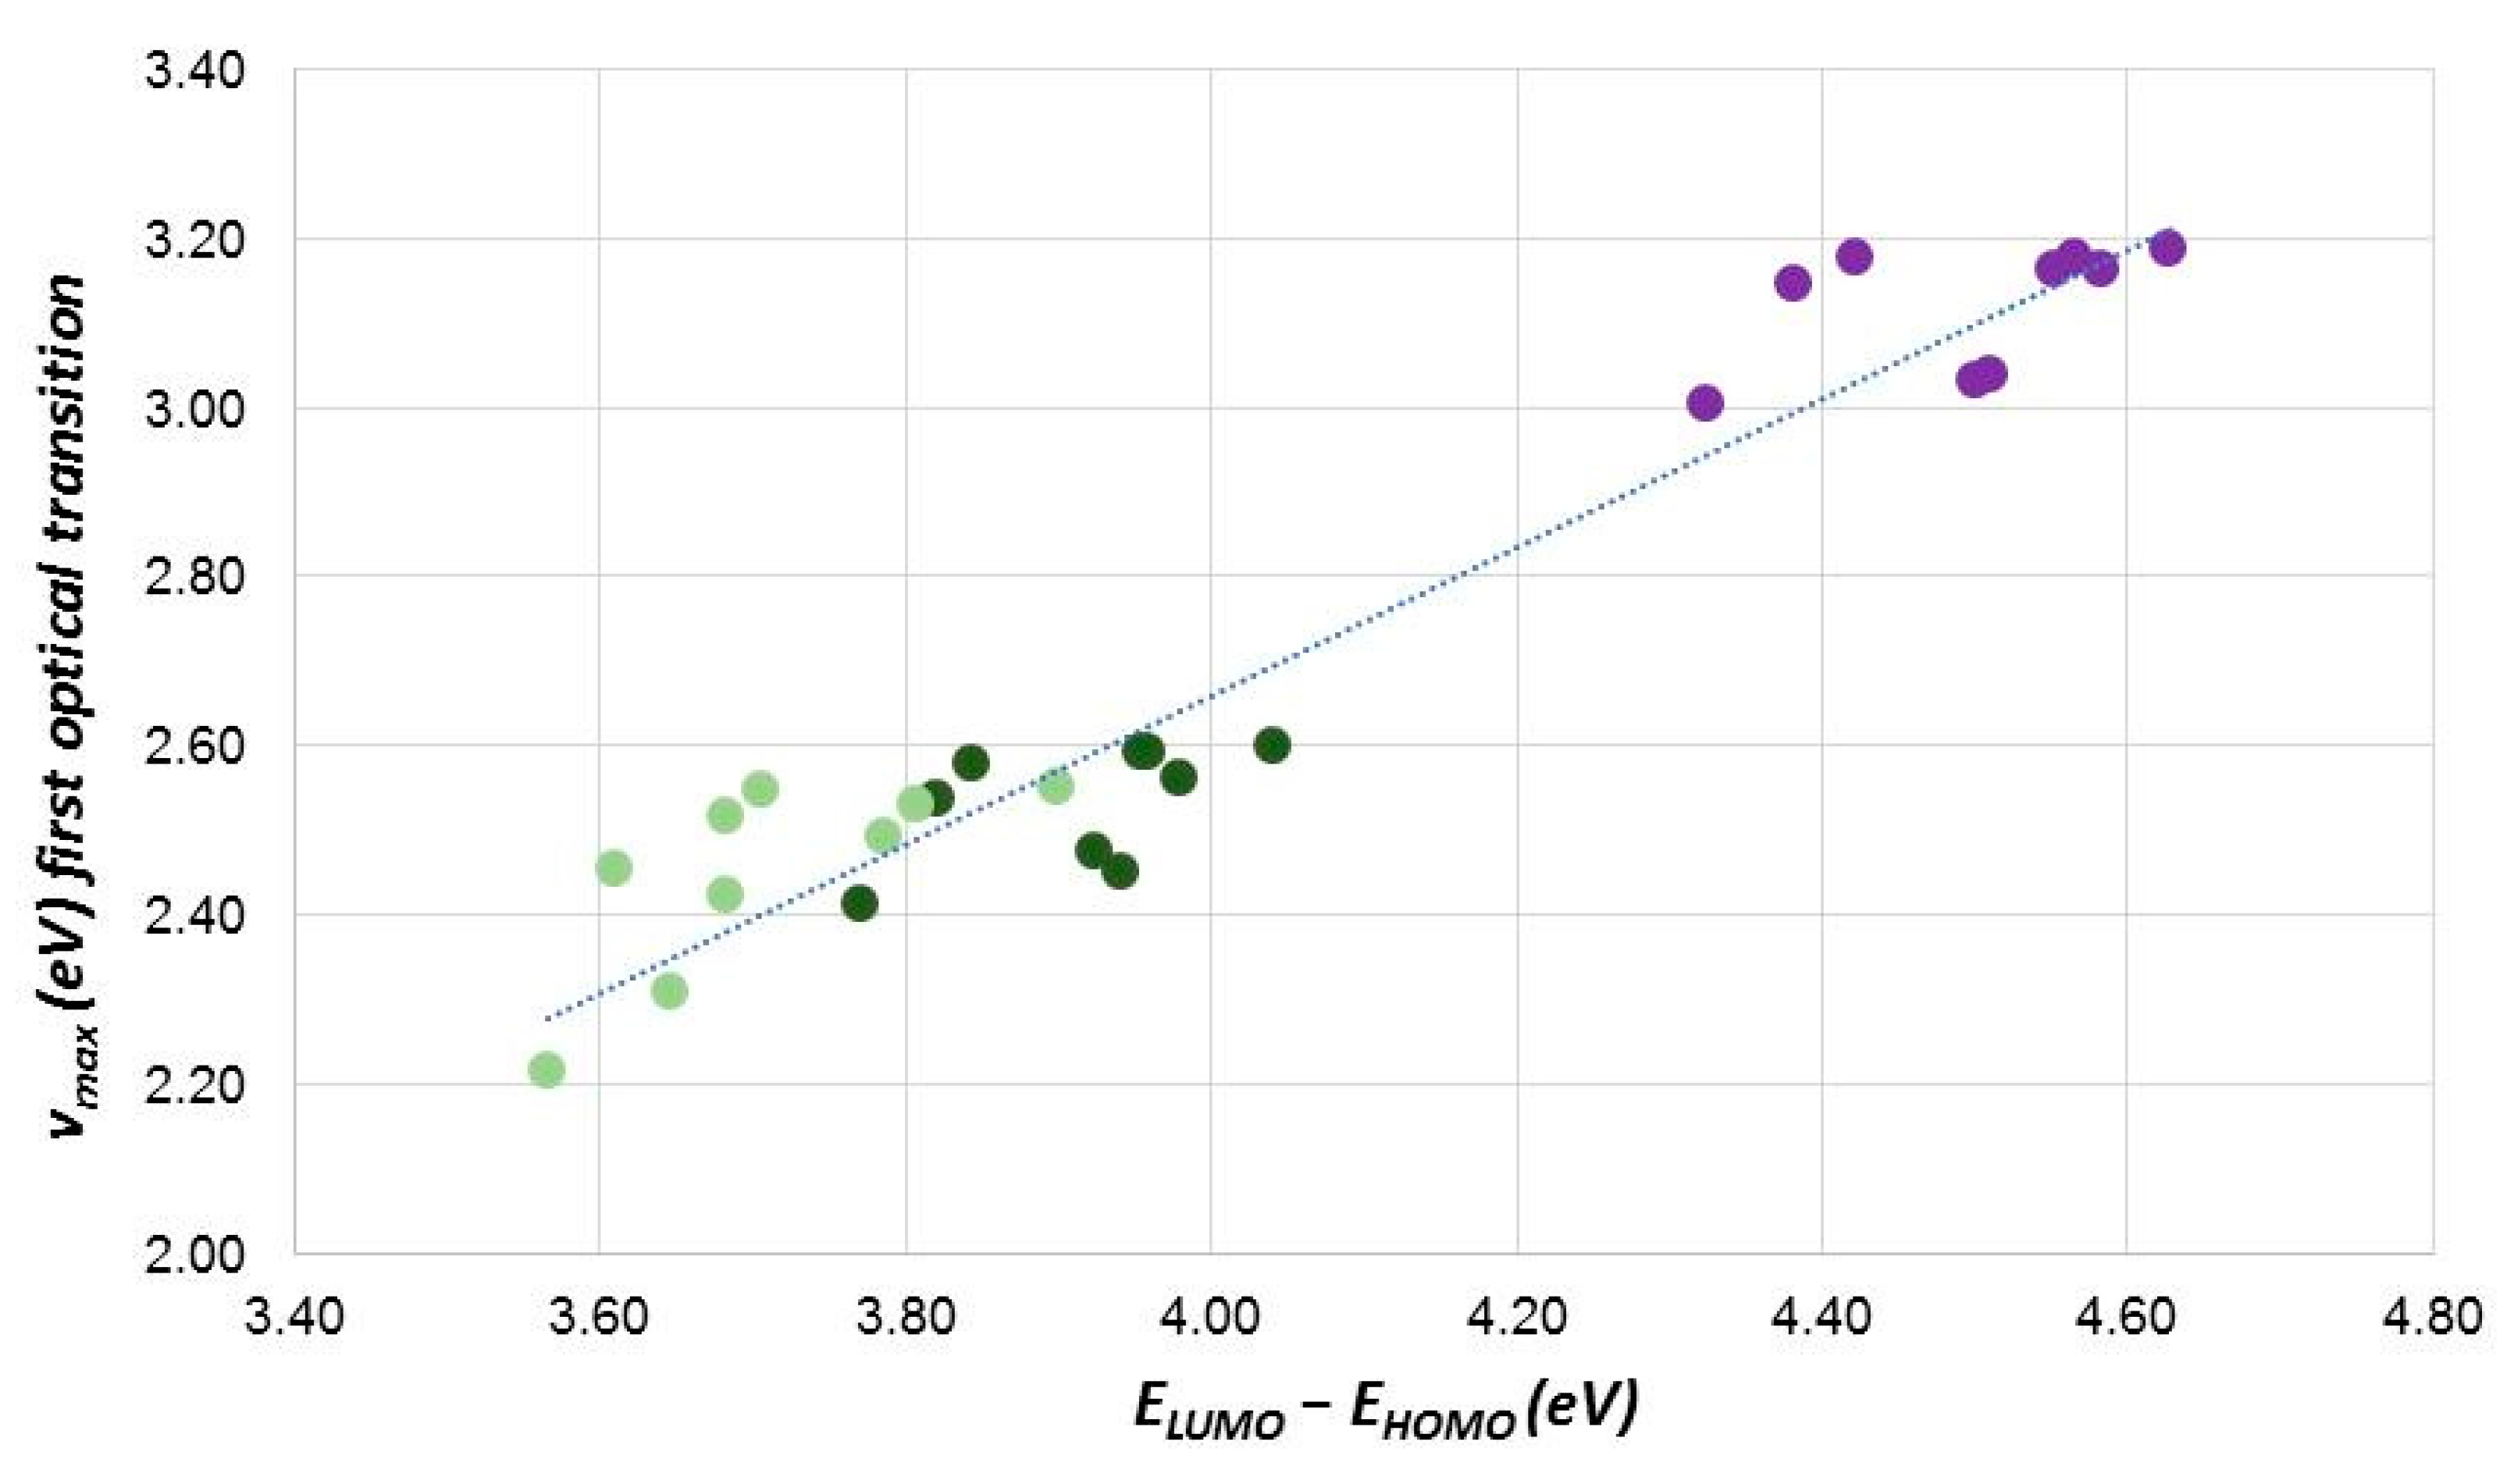
In agreement with the molecular-orbital interpretation discussed above, the influence of the acceptor on the optical properties can be further assessed by comparing D–π–A chromophores sharing the same D–π framework. For the systems exhibiting the highest λmax (i.e., maximum absorption wavelength), the ΔE(LUMO−HOMO) gaps, first optical transitions, and associated oscillator strengths are reported in Table 1. For comparison, the results obtained for the corresponding moieties are shown, and the results for all the systems studied are reported in Table S3 of Supplementary Materials. The largest red-shifts are observed for chromophores containing the ac1 and ac2 acceptors, in agreement with the MO analysis discussed above. This trend is further illustrated in Figure 7, where the relationship between the ΔE(LUMO−HOMO) gap and νmax is reported for the entire chromophore library.
From Figure 7 three distinct groups can be identified; the first group (violet dots), characterized by ELUMOEHOMO gaps in the 4.3–4.7 eV range, corresponds to the D–π–ac3 chromophores. Consistent with the fragment-orbital and isodensity analyses discussed above, these systems exhibit the smallest bathochromic shifts because their LUMOs largely retain the energetic characteristics of the isolated ac3 acceptor. Nevertheless, they remain associated with significant oscillator strengths (Table S3). The second group (where the ELUMOEHOMO gaps are in the range of about 3.9–4.1 eV, represented by dark green dots) corresponds to D–π–ac2 molecules. Finally, the third group (where the ELUMOEHOMO gaps are in the range of about 3.5–3.9 eV, represented by green dots) corresponds to D–π–ac1 molecules.
Within the latter group the most relevant bathochromic shifts are found for the chromophores with the d2 donor (see Table 1 and Table S3). Lastly, we observe from Figure 7 a relative dispersion in the correlation plot; this can be seen because of the multiconfigurational nature of the excited states [31,32], particularly important for push–pull systems where charge-transfer excitations occur (which involve electron density reorganizations). An incorrect balancing of short and large distances in the electronic interactions could artificially collapse a charge-transfer excitation into a monoelectronic HOMO–LUMO transition and linear correlation. In this framework, but beyond the scope of this work, the observed “dispersion” could be correlated at a fixed π-bridge unit with the specific excitonic stabilization/destabilization of the donor and acceptor couple.
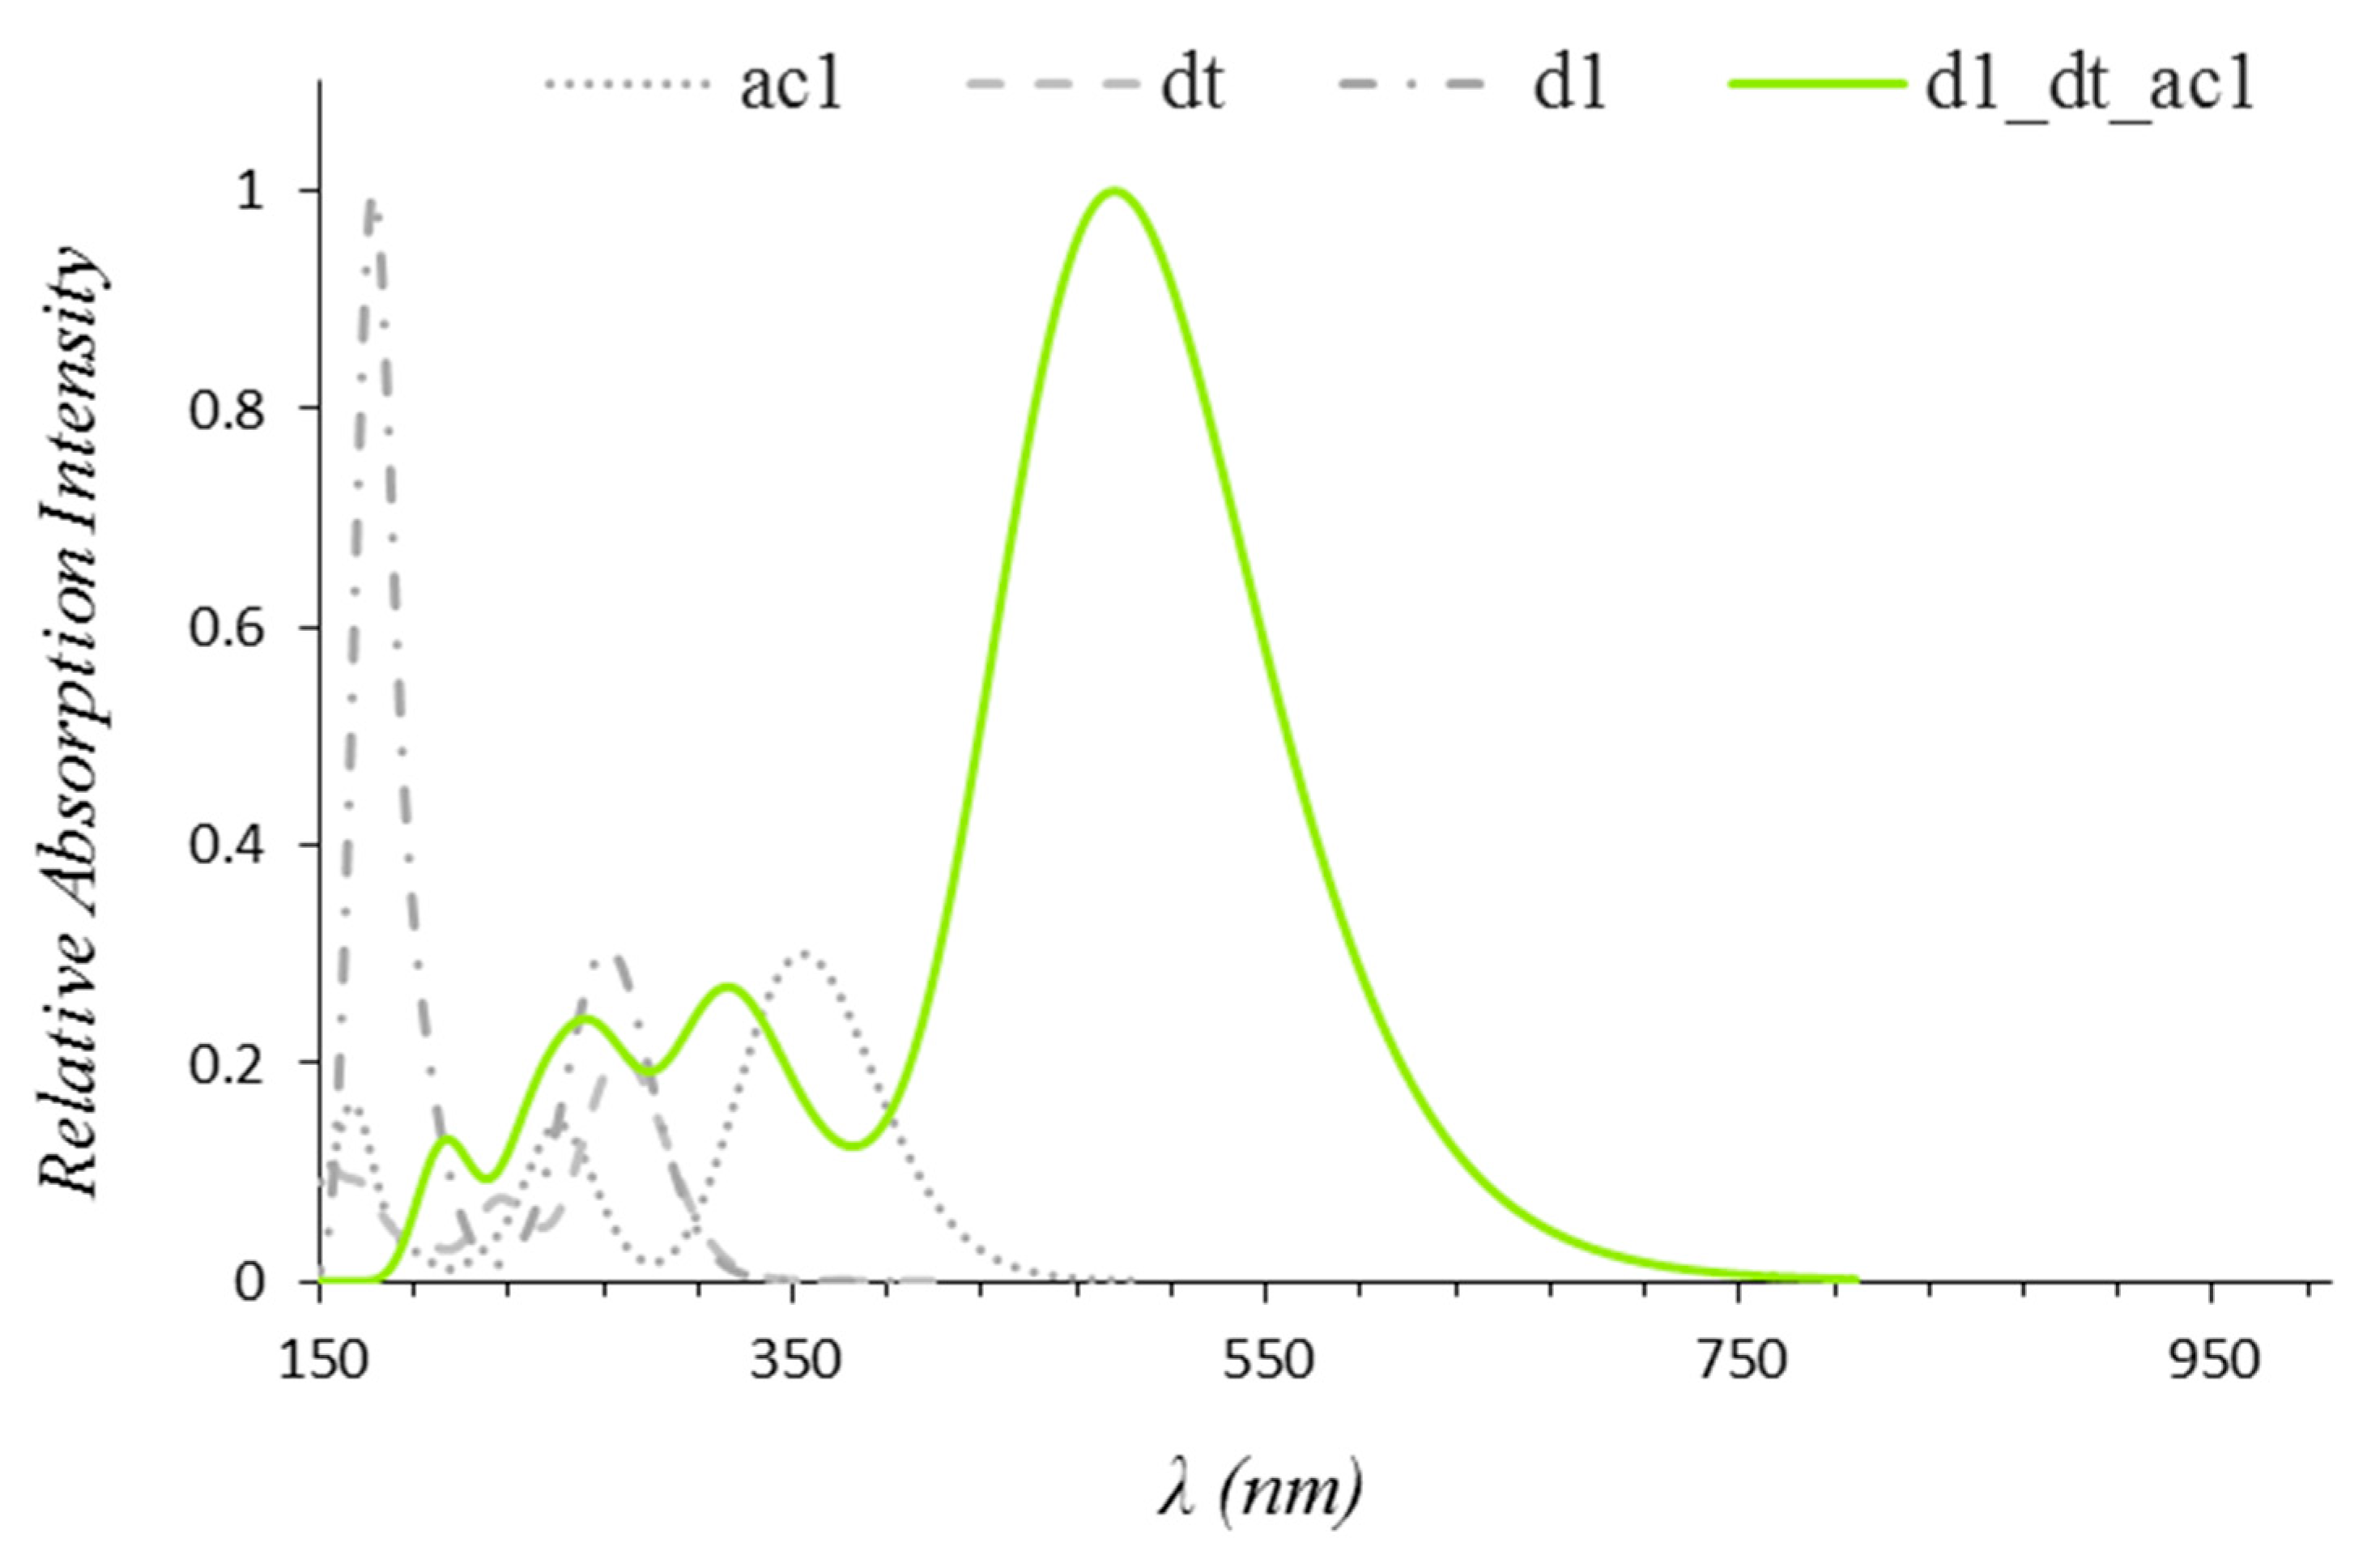
The predicted appreciable bathochromic effect and increase of the absorption band intensity (see Table 1 and Table S3) induced by the push–pull character of the molecules can be exemplified by the comparison between the computed spectra of d1_dt_ac1 and those of its individual moieties, shown in Figure 8.
Overall, in the (decreasing) magnitude of the bathochromic shift, the following trend is found: (i) ac1 > ac2 > ac3 with respect to the acceptor; (ii) dt > bt > bt1 with respect to the π-bridge; and (iii) d2 > d1 > d3 with respect to the donor unit. Bearing in mind the previous discussion about the multiconfigurational nature of the wavefunction, which describes the lowest optical excitation, the scope of our investigation is to describe the workflow for a simple screening-oriented study aimed at identifying general structure–property correlations. The above predicted trends can be, partially, rationalized by the analysis of the HOMO/LUMO isodensities. In fact, when ac3 is used as the acceptor in D–π–A architecture, the LUMO is largely dominated by the acceptor moiety (see Figure 4 and Figure S2), which shows very weak interaction with the D–π-bridge counterpart. Consequently, differently from the other acceptors, the D–π–ALUMO is not stabilized, and a reduced red-shift is consequently expected. At the same time, the strong LUMO localization leads to appreciable expectation value of the transition dipole moment upon the HOMO–LUMO excitation, resulting in relatively strong oscillator strengths, as confirmed by the TD calculations. For donor units, the simple MOs analysis would suggest that d1 and d2 should exhibit similar behavior, since both donors efficiently interact with the π-bridge and the resulting D–π–AHOMO is delocalized on the D–π-bridge framework. However, the TD-DFT results indicate that the largest bathochromic shift is associated with the d2 donor unit. The larger bathochromic shifts observed for the d2-containing chromophores are consistent with the stronger electron-donating character of the methoxy-substituted donor, which results in higher HOMO energies and reduced HOMO–LUMO gaps. In contrast, the oxygen-bridged donor d3 combines enhanced conformational rigidity with an intermediate donor strength, leading to bathochromic shifts that are generally in between those obtained for d1 and d2.
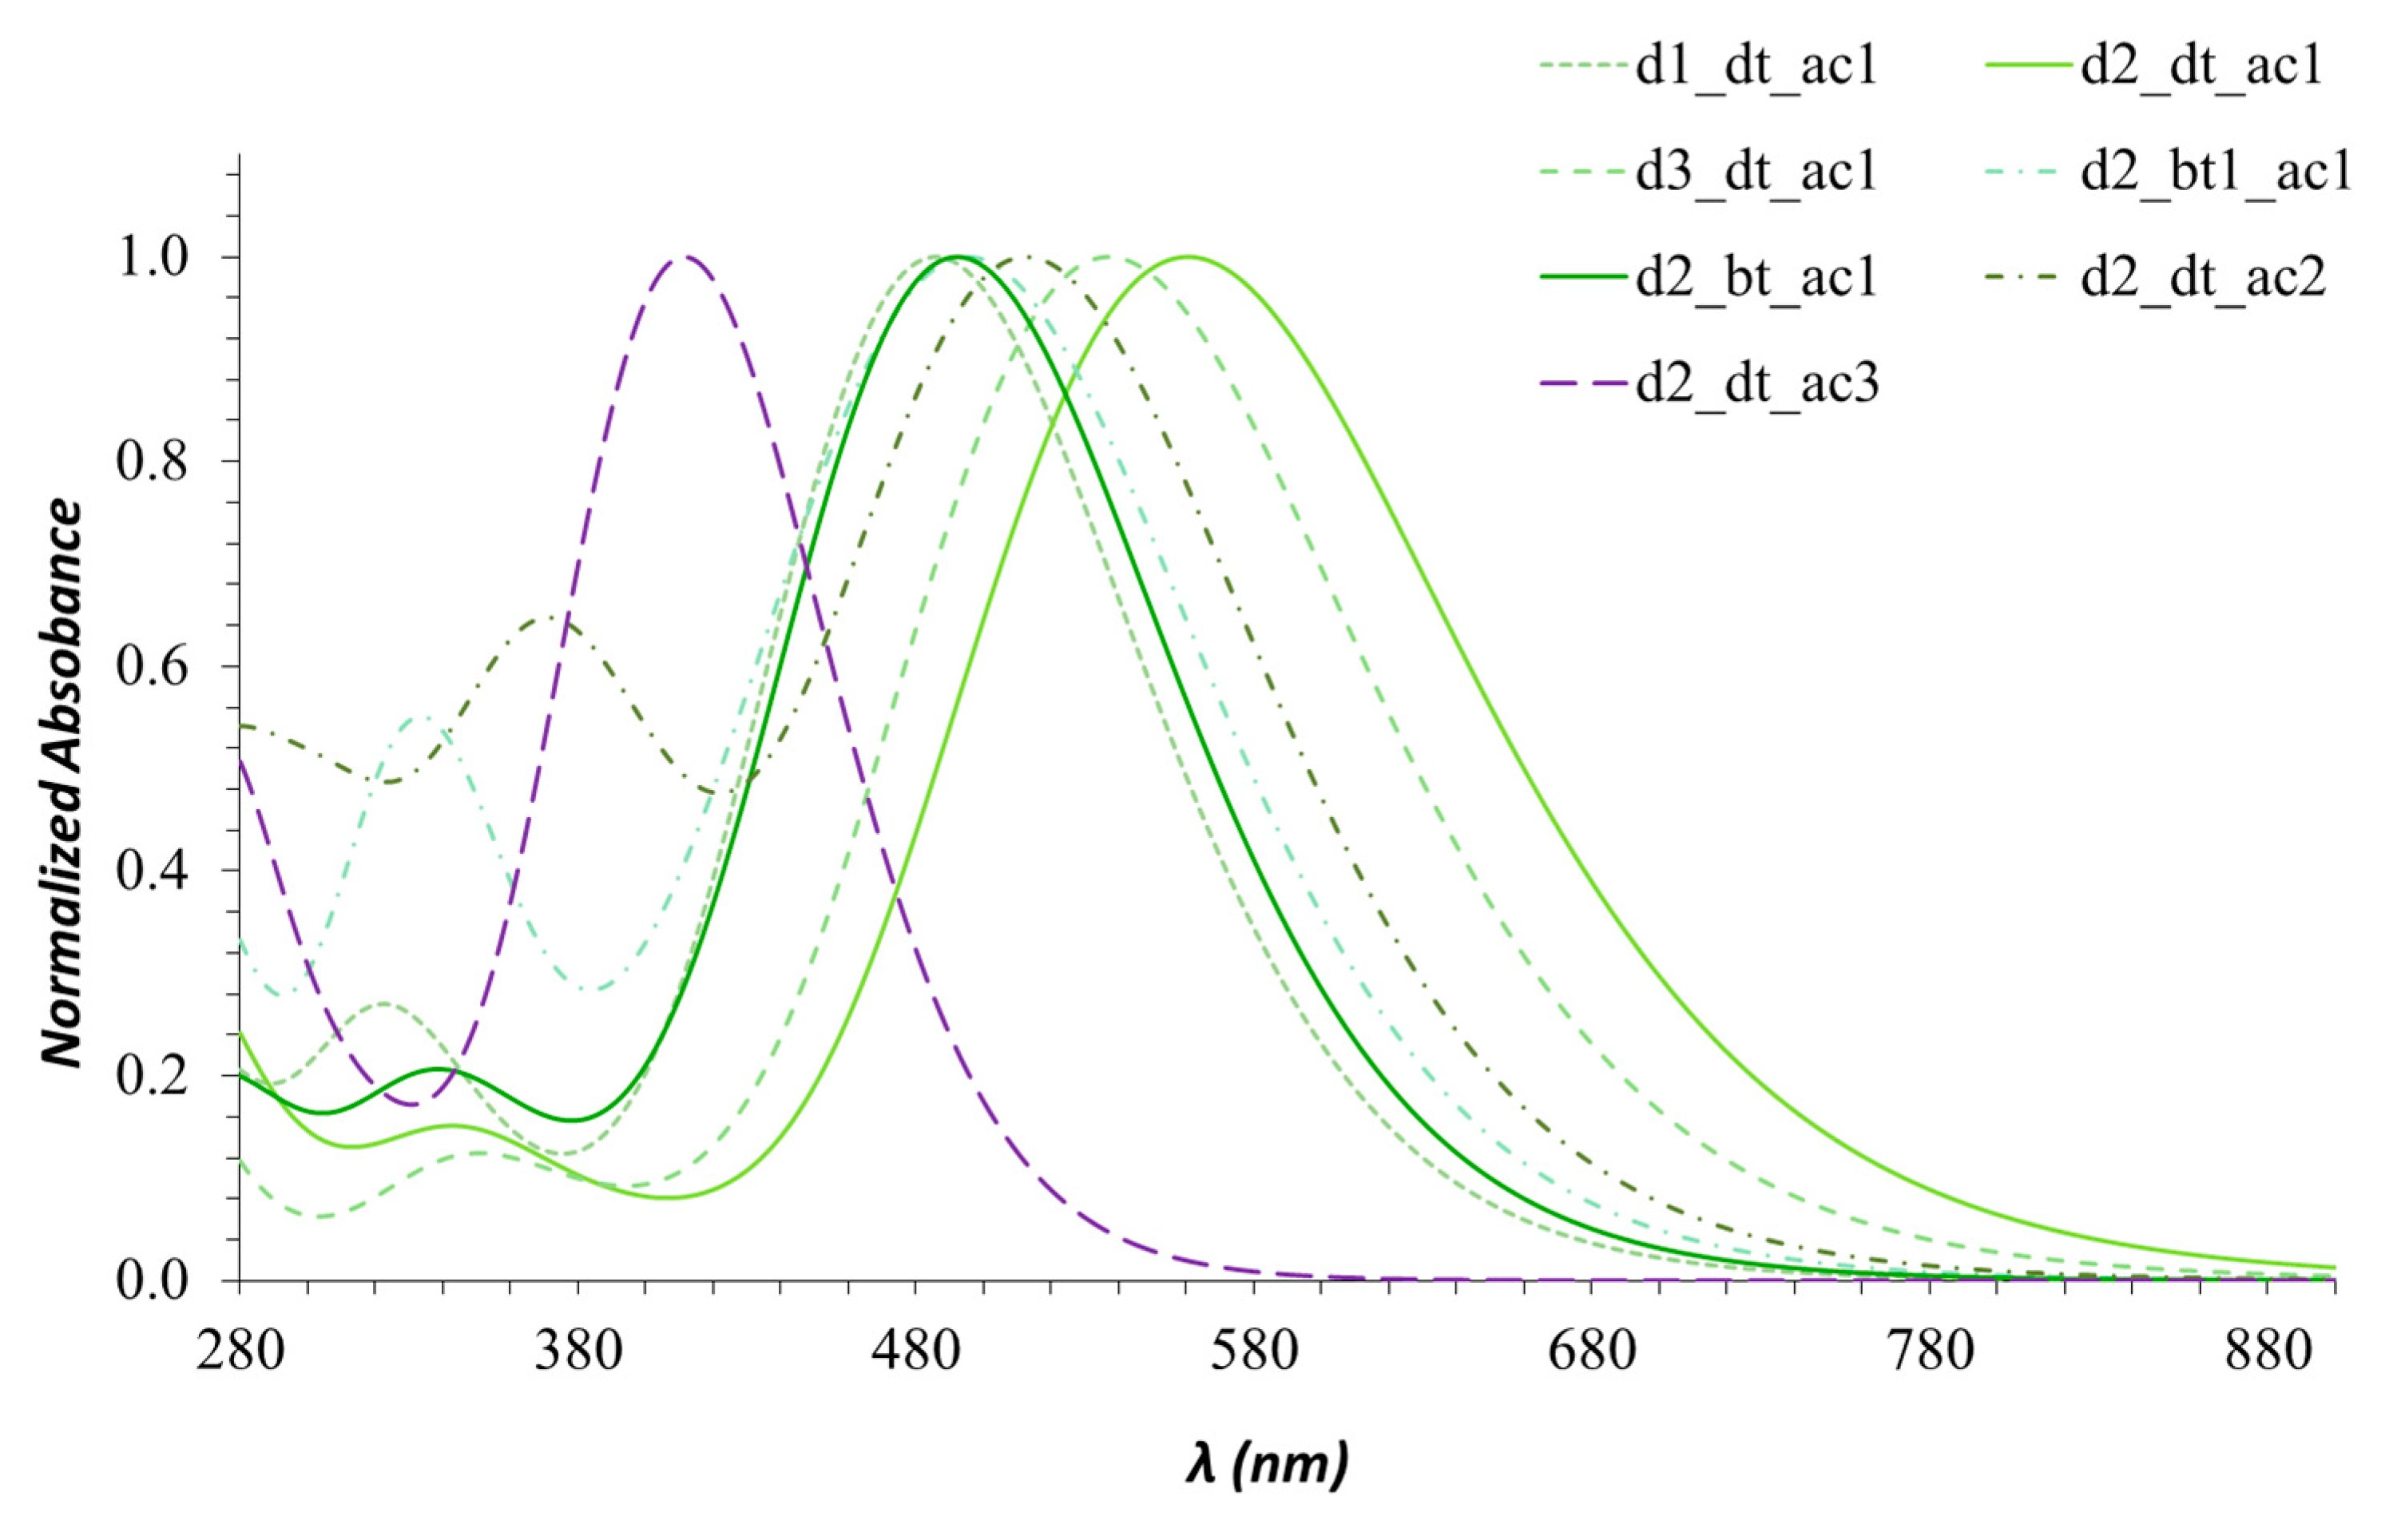
Taking d2_dt_ac1 (which exhibits the strongest predicted bathochromic shift) as the reference molecule, an example of these trends is illustrated in Figure 9. The computed spectra of all chromophores are instead shown in Figure S3. The spectral profiles highlight that the largest red-shift in D–π–A chromophores is observed when the frontier orbitals of the donor, π-bridge and acceptor units exhibit favorable energetic alignment and interaction.
For example, in Figure 9 the comparison between the D_dt_ac1 chromophores (yellow-green lines) shows that the maximum red-shift is obtained with the d2 donor. Here at fixed π–A the architecture raises the importance of the excited wavefunction multiconfigurational nature of the excited electronic state; in this case a deep analysis of the building unity MOs is required. For a fixed donor, d2, and acceptor, ac1, the π-bridge is associated with the largest bathochromic shift among the investigated bridges, suggesting that a more favorable interaction among the frontier orbitals of the building moieties is with dt (yellow-green continued line). Finally, at fixed D–π structures an increasing hypsochromic shift is predicted by switching from ac1 to ac3 (purple dashed line) which has the higher value. The band intensity, correlated with its strong charge-transfer character, increases correspondingly. For example, the band intensity ratio between d2_dt_ac3 and d2_dt_ac1 is equal to 1.2. To summarize, we have shown that an excessive donor or acceptor character of the corresponding moieties may give rise to high oscillator strength due to the localization of the frontier orbitals; however, it could generally increase the excitation energy, with a less favorable red-shift in the absorption spectra. Instead, the largest bathochromic shift is obtained when donor, π-conjugation, and acceptor character are optimally balanced, thereby maximizing the electronic delocalization, mainly in the D–π and π–A moieties, in the lowest allowed transition.

3.2. Structure–Property Relationship: Photovoltaic Descriptors

In photovoltaic cells based on inorganic or organic technologies, a key parameter to optimize is power conversion efficiency (PCE, η). Currently, the most mature photovoltaic technology is based on crystalline solar cells, which have reached PCEs in the 23–26% range [33]. Further progress has been achieved with metal-halide perovskite solar cells, with certified PCEs of 26–27% for single-junction devices [34]. The BHJ organic solar cells (OSCs) have increased their PCE performances up to 18–19% [35] by the introduction of non-fullerene acceptors (NFAs). In this framework the BHJ-OSCs architecture still offers promising potential considering its advantages, such as solution processability, lightweight construction, mechanical flexibility, and tunable optical properties [36]. Consequently, understanding the structure–property relationships of D–π–A chromophores remains a scientifically relevant task to guiding the rational design of next-generation organic photovoltaic materials.
In this work, as electron acceptor of the BHJ, we consider the [6,6]-phenylC61-butyric acid methyl ester (PCBM), which is nowadays primarily used as a benchmark or model acceptor for fundamental studies rather than for efficiency optimization, and is adopted here to ensure methodological consistency within a comparative computational framework. The PCE is defined as the ratio between the maximum power output of the solar cell, Pmax, and the incident solar power Pin (both per area unit), as shown in Equation (1):
η = P m a x P i n = P m a x V o c J s c P i n V o c J s c = V o c J s c P i n P m a x V o c J s c F F = V o c J s c P i n F F
where its correlation with the open-circuit voltage, Voc; the short-circuit current, Jsc; and the fill factor, FF, is explicitly shown. We underline that here the calculated η values should therefore not be interpreted as predictive device efficiencies but rather as internally consistent comparative descriptors within the investigated molecular library.
The PCE is strongly related to the structural and technological characteristics of the solar cell and is defined as the ratio between Pmax and the theoretical maximum power (Pmax,t, per area unit), equal to Voc·Jsc, which corresponds to the power achievable if the cell could simultaneously operate at its maximum current and maximum voltage values. In the literature different theories [37,38,39] have been developed for modeling FF. In this work, we follow the semiempirical approach proposed by Alharbi et al. [40], used for Equation (2) to compute the fill factor:
F F = V o c V o c + α k b T   .
In Equation (2), T is the system temperature in kelvin, kb is the Boltzmann constant, and α can be regarded as a semiempirical parameter that effectively incorporates the average effects of energetic disorder, recombination and all the other typical non-idealities of excitonic or non-excitonic organic solar cells. The authors have found that for the excitonic solar cells the best fit is obtained with α = 12.
For the BHJ organic solar cell, Voc can be defined as:
e V o c = ( E L U M O n E H O M O p ) e Δ V loss
where E L U M O n is the LUMO energy of the n-semiconductor, in our case PCBM, and E H O M O p is the HOMO energy of the p-semiconductor, here represented by the D–π–A chromophore. The open-circuit voltage loss Δ V l o s s in organic photovoltaic devices quantifies the deviation from the Shockley–Queisser limit, and is, generally, dominated by non-radiative recombination processes, which exponentially increase the dark saturation current and thus limits the achievable Voc [41,42]. For the fullerene-based BHJ OSCs Δ V l o s s is typically estimated to be around 0.7–1 eV [43].
Finally, Equation (4) is applied for the computation of the short-circuit current, Jsc [44]:
J s c = e F λ L H E λ ϕ λ χ λ d λ
F λ is the solar photons flux, strictly correlated with the emission solar spectrum (AM1.5 solar spectral irradiance) [45]; the Light Harvesting Efficiency, L H E λ , representing the efficiency of the photon capture by the active layer; and φ λ , which defines the quantum yield of charge injection and is related to the efficiency of the conversion from the excited state to the charge-separated state, that is, to the formation of free charge carriers (holes and electrons) and to their mobility within the solar cell. Finally, χ λ represents the efficiency of charge carrier collection at the electrodes.
In the present work, the main objective is a comparative evaluation of the chromophore library; consequently, for sake of simplicity φ λ and χ λ are both assumed to be 100%. Similarly, L H E λ is assumed due only to the internal photon harvesting and given [46,47] by Equation (5):
L H E λ = 1 I I 0 = 1 1 0 ε ( λ ) C d
where ε ( λ ) is the molar absorptivity, obtained in this work from the simulated electronic absorption spectra; C the chromophore concentration; and d the optical path length. In this framework, considering that BHJ organic photovoltaic devices typically employ an active layer thickness of approximately 80–120 nm [48,49], which represents a compromise between optical absorption and charge transport efficiency, here we assume d = 100 nm. Moreover, since the effective transparency range of the cover glasses is about 340–1200 nm [5,50], this interval is adopted as the integration range. Under these constraints Equation (4) becomes:
J s c = e 340 n m 1200 n m F λ · L H E λ d λ
In Table S4 of the Supplementary Materials, the calculated values of Voc and FF for all the systems here considered are reported, while Table 2 summarizes for selected chromophores. For the open circuit voltage (see Equation (3)) ΔVloss = 1.0 V is assumed, while for the fill factors (see Equation (2)) α = 12 and room temperature (T = 298 K) are used, taking into account the excitonic nature of the proposed BHJ organic solar cell.
The select chromophores reported in Table 2 include some of those exhibiting the most appreciable red-shift (see Table 1) with respect to the Voc ordering (see Table S4), or with a more suitable alignment of the frontier orbitals. It should be underlined that the relatively large predicted Voc values reflect the simplified energetic model adopted here, as well as the absence of explicit interfacial and non-radiative recombination effects ( φ λ = χ λ = 100%). Consequently, the calculated photovoltaic descriptors should therefore be interpreted in a comparative sense, rather than as quantitative predictions of device efficiencies.
From Table 2, it can be observed that also the computed frontier-orbital alignments between the chromophore and the acceptor layers, ΔEHOMO (EHOMO(D–π–A) − EHOMO(PCBM)) and ΔELUMO (ELUMO(D–π–A) − ELUMO(PCBM)) are relatively large, with the former being negative. This condition may imply that, in the corresponding solar cell devices, the effective PCE could be affected by a competitive energy transfer process with respect to charge-transfer mechanism. Such an effect could be partially mitigated through appropriate choice of the ΔVloss and α parameters. Nevertheless, these results suggest that a strategy for increasing the solar cell efficiency would be the replacement of PCBM with novel NFAs, such as perylene-3,4,9,10-tetracarboxylic diimide (PDI) derivatives, which may provide a more favorable alignment of the frontier orbitals [53].
The results obtained for Jsc (Equation (5)) and the estimated power conversion efficiency η (Equation (1)) for the chromophores with a predicted PCE greater of about 15% are shown in Table 3. We point out that these values represent a simulated upper limit and are therefore intended to be considered in a comparative sense rather than as absolute device efficiencies. All chromophores’ results are reported in Table S5, and for the selected wavelength integration range and using the spectral solar data reported in Ref. [38], the incident power Pin amounts to 73.59 mW/cm2.
As expected, poor efficiencies are obtained from the D–π–A chromophores containing the ac3 acceptor moiety, with η below 8%. In contrast, the highest predicted performances are generally associated with chromophores containing the ac1 acceptor, particularly when combined with the dt π-bridge, consistent with their pronounced bathochromic shifts and favorable light-harvesting properties. On the other hand, the energetic descriptors reported in Table 2 indicate that some ac2-containing systems exhibit a different balance between HOMO and LUMO offsets. This result highlights the importance of combining electronic, optical, and photovoltaic descriptors in the screening procedure, since favorable energetic offsets do not necessarily translate into the highest predicted photovoltaic response. Within the investigated molecular library, particularly promising candidate chromophores incorporate the methoxy-substituted donor (d2) moiety. In particular, d2_dt_ac1 exhibits the highest predicted photovoltaic response, while d2_dt_ac2 combines comparatively slightly more favorable frontier-orbital alignment with still-promising descriptor-based photovoltaic performances. These systems are expected to further improve their photovoltaic performance upon additional optimization of electronic delocalization and frontier-orbital engineering, as they already exhibit a favorable balance between orbital delocalization and molecular energy-level ordering.

4. Conclusions

In this work, a computational workflow based on density functional theory (DFT) is proposed to identify potential candidate chromophores from a selected molecular library within a conventional donor–bridge–acceptor (D–π–A) molecular framework. The screening is performed using a set of molecular descriptors, including: (a) molecular delocalization, as a qualitative indicator of charge-transfer character; (b) simulated absorption spectra; (c) frontier-orbital offsets between n- and p-type organic semiconductors; and (d) key photovoltaic parameters, such as energetic offsets, open-circuit voltage (Voc), short-circuit current (Jsc), and overall efficiency trends.
The main results indicate that the ac3 acceptor yields a strongly localized LUMO, leading to high oscillator strengths but limited π–A interaction, reduced red-shift, and lower Jsc contribution. Conversely, the dt_ac1 segment shows a more favorable balance, with HOMO delocalization over the D–dt moiety and LUMO delocalization over the dt_ac1 unit, resulting in improved optoelectronic response.
Overall, this study highlights the usefulness of a fragment-based analysis for rationalizing the individual roles of donor, π-bridge and acceptor units in D–π–A chromophores. The results show that the most favorable optoelectronic responses are obtained when charge-transfer character and frontier-orbital delocalization are appropriately balanced within the molecular architecture. It must be noted that the adopted model is not intended to provide quantitative efficiency predictions but rather to establish a simple computational workflow. The internally consistent trends obtained indicate that the proposed descriptor-guided approach can effectively support the comparative screening and rational prioritization of candidate materials for organic photovoltaics.
The present results also provide qualitative structure–property relationships and a basis for further experimental and higher-level theoretical investigations. Additional optimization of the investigated systems could be achieved by coupling the proposed donor units with alternative non-fullerene acceptors featuring more favorable frontier-orbital alignment. Future research should aim to further elucidate donor–acceptor interfacial mechanisms and establish more quantitative descriptors of charge-transfer dynamics and morphology-dependent effects, ultimately improving the reliability of photovoltaic performance predictions.

Supplementary Materials

The following supporting information can be downloaded at: https://www.mdpi.com/article/10.3390/condmat11030029/s1, Figure S1: Sketch of the TD-CAM-B3LYP/6-311G HOMO and LUMO isodensity (0.02 e/a03) for the single units of donor, π-bridge and acceptor groups. For the acronyms, refer to Figure 1, Figure 2 and Figure 3 of the main text; Figure S2: Sketch of the TD-CAM-B3LYP/6-311G HOMO and LUMO isodensity (0.02 e/a03) for the D–π–A chromophores. For the acronyms, refer to Figure 1, Figure 2 and Figure 3 of the main text. Figure S3: TD-CAM-B3LYP/6-311G//B3LYP/6-311G simulated electronic spectra of the D–π–A chromophores. The acronyms are defined in Figure 1, Figure 2 and Figure 3 of the main text. Each spectrum is normalized with respect to its highest absorption peak. Table S1: CAM-B3LYP basis set and conformers effects on the molecular descriptors adopted in the present work, for 2,2′-dithiophene (dt) and d1_dt_ac1. Table S2: TD-CAM-B3LYP/6-311G HOMO and LUMO energy (in eV) of the molecular systems investigated in the present work. Table S3: TD-CAM-B3LYP/6-311G HOMO–LUMO energy gap (ΔEHL = ELUMOEHOMO, eV), maximum absorption frequency (νmax), wavelength λmax, (eV, nm) and oscillator strengths f for the D–π–A systems. Table S4: Energy off-set ΔEHOMO, ΔELUMO, open-circuit voltage, Voc and fill factor, FF for the D–π–A systems considered in the present work. Results from TD-CAM-B3LYP/6-311G calculations. Table S5: Computed short-circuit current, Jsc and power efficiency, η, for the D–π–A systems. Results from TD-CAM-B3LYP/6-311G calculations.

Author Contributions

Conceptualization, M.O. and M.A.; Methodology, M.O. and M.A.; Software, M.O. and M.A.; Validation, M.O. and M.A.; Formal analysis, M.O. and M.A.; Investigation, M.O. and M.A.; Resources, M.O. and M.A.; Data curation, M.O. and M.A.; Writing – original draft, M.O.; Writing – review & editing, M.O. and M.A.; Visualization, M.O. and M.A.; Supervision, M.O. and M.A. All authors contributed equally to the manuscript. All authors have read and agreed to the published version of the manuscript.

Funding

This research received no external funding.

Data Availability Statement

Data will be available upon request.

Conflicts of Interest

The authors declare no conflicts of interest.

Abbreviations

The following abbreviations (not main text defined) are used in this manuscript:
HOMOHighest Occupied Molecular Orbital
LUMOLowest Unoccupied Molecular Orbital

References

  1. Beard, M.C.; Luther, J.M.; Semonin, O.E.; Nozik, A.J. Multiple Exciton Generation in Semiconductor Quantum Dots. Acc. Chem. Res. 2013, 46, 1252–1260. [Google Scholar] [PubMed]
  2. Dennler, G.; Scharber, M.C.; Brabec, C.J. Polymer–Fullerene Bulk-Heterojunction Solar Cells. Adv. Mater. 2009, 21, 1323–1338. [Google Scholar] [CrossRef] [Scilit]
  3. Kim, J.Y.; Lee, K.; Coates, N.E.; Moses, D.; Nguyen, T.Q.; Dante, M.; Heeger, A.J. Efficient Tandem Polymer Solar Cells Fabricated by All-Solution Processing. Science 2007, 317, 222–225. [Google Scholar] [CrossRef] [Scilit] [PubMed]
  4. Sariciftci, N.S.; Smilowitz, L.; Heeger, A.J.; Wudl, F. Photoinduced Electron Transfer from a Conducting Polymer to Buckminsterfullerene. Science 1992, 258, 1474–1476. [Google Scholar] [CrossRef] [Scilit] [PubMed]
  5. Cheng, P.; Yang, Y. Narrowing the Band Gap: The Key to High-Performance Organic Photovoltaics. Acc. Chem. Res. 2020, 53, 1218–1228. [Google Scholar] [CrossRef] [Scilit] [PubMed]
  6. Wang, Y.; Zheng, Z.; Li, T.; Robertson, N.; Xiang, H.; Wu, W.; Hua, J.; Zhu, W.-H.; Tian, H. D-A-π-A Motif Quinoxaline-Based Sensitizers with High Molar Extinction Coefficient for Quasi-Solid-State Dye-Sensitized Solar Cells. ACS Appl. Mater. Interfaces 2016, 8, 31016–31024. [Google Scholar] [CrossRef] [Scilit] [PubMed]
  7. Liu, J.; Jabbari, H.; Kadhim, M.M.; Ansari, M.J.; Ebadi, A.G. Design Organic Material with Acceptor–π–Donor Configuration for High Performance Solar Cells. Comput. Theor. Chem. 2022, 1212, 113729. [Google Scholar] [CrossRef] [Scilit]
  8. Wei, M.; Perepichka, D.F. Benzodithiophene-Based Polymer Donors for Organic Photovoltaics. J. Mater. Chem. A 2025, 13, 12785–12807. [Google Scholar] [CrossRef] [Scilit]
  9. Madrid-Úsuga, D.; Suárez, O.J.; Portacio, A. Impact of Molecular π-Bridge Modifications on Triphenylamine-Based Donor Materials for Organic Photovoltaic Solar Cells. Condens. Matter 2025, 10, 52. [Google Scholar] [CrossRef] [Scilit]
  10. Babu, N.S. DFT and TD-DFT Studies of New Triphenylamine-Based (D–A–D) Donor Materials for High-Efficiency Organic Solar Cells. Mater. Adv. 2022, 3, 3526–3535. [Google Scholar] [CrossRef] [Scilit]
  11. Delgado-Montiel, T.; Soto-Rojo, R.; Baldenebro-López, J.; Glossman-Mitnik, D. Theoretical Study of the Effect of Different π-Bridges Including an Azomethine Group in Triphenylamine-Based Dye for Dye-Sensitized Solar Cells. Molecules 2019, 24, 3897. [Google Scholar] [CrossRef] [Scilit] [PubMed]
  12. Wang, Q.; Xiong, L.; Shi, J.; Wu, Z.; Zhang, K.; Zhang, T. Theoretical Study of the Effect of the Terminal Groups of Triphenylamine Donors on the Photophysical Properties of D–A–π–A Dye Sensitizers. J. Fluoresc. 2025, 35, 13769–13781. [Google Scholar] [CrossRef] [Scilit] [PubMed]
  13. Zaier, R.; Ayachi, S. Designing Well-Organized Donor–Bridge–Acceptor Conjugated Systems for Bulk Heterojunction Organic Solar Cells: DFT-Based Modeling. In Solar Cells–Theory, Materials and Recent Advances; IntechOpen: London, UK, 2021. [Google Scholar]
  14. Zhou, B.; Dai, T.; Zhou, J.; Chen, Y.; Geng, Y.; Lei, P.; Zheng, G.; Zeng, Q.; Zhou, E. Conjugated D–π–A Photovoltaic Polymers Containing Thieno[3,2-b]thiophene π-Bridge. Mater. Chem. Front. 2024, 8, 1563–1590. [Google Scholar] [CrossRef] [Scilit]
  15. Valkeneers, K.; Vandewal, K.; Maes, W. Benzothiadiazole-Based Push-Pull Copolymers–Balancing Synthetic Complexity against Organic Solar Cell Efficiency. Org. Electron. 2022, 111, 106667. [Google Scholar] [CrossRef] [Scilit]
  16. Lee, C.; Yang, W.; Parr, R.G. Development of the Colle–Salvetti Correlation-Energy Formula into a Functional of the Electron Density. Phys. Rev. B 1988, 37, 785–789. [Google Scholar] [CrossRef] [Scilit] [PubMed]
  17. Krishnan, R.; Binkley, J.S.; Seeger, R.; Pople, J.A. Self-Consistent Molecular Orbital Methods. A Basis Set for Correlated Wave Functions. J. Chem. Phys. 1980, 72, 650–654. [Google Scholar] [CrossRef] [Scilit]
  18. Runge, E.; Gross, E.K.U. Density-Functional Theory for Time-Dependent Systems. Phys. Rev. Lett. 1984, 52, 997–1000. [Google Scholar] [CrossRef] [Scilit]
  19. Frisch, M.J.; Trucks, G.W.; Schlegel, H.B.; Scuseria, G.E.; Robb, M.A.; Cheeseman, J.R.; Scalmani, M.; Barone, V.; Mennucii, B.; Petersoon, G.A.; et al. Gaussian 09; Gaussian, Inc.: Wallingford, CT, USA, 2009. [Google Scholar]
  20. Goerigk, L.; Grimme, S. A Thorough Benchmark of Density Functional Methods for General Main Group Thermochemistry, Kinetics, and Noncovalent Interactions. Phys. Chem. Chem. Phys. 2011, 13, 6670–6688. [Google Scholar] [CrossRef] [Scilit] [PubMed]
  21. Alparone, A. Second Harmonic Generation, Electrooptical Pockels Effect, and Static First-Order Hyperpolarizabilities of 2,2′-Bithiophene Conformers: An HF, MP2, and DFT Theoretical Investigation. Adv. Phys. Chem. 2013, 2013, 394697. [Google Scholar] [CrossRef] [Scilit]
  22. Cohen, A.J.; Mori-Sánchez, P.; Yang, W. Challenges for Density Functional Theory. Chem. Rev. 2012, 112, 289–320. [Google Scholar] [CrossRef] [Scilit]
  23. Jacquemin, D.; Perpète, E.A.; Ciofini, I.; Adamo, C. Assessment of Functionals for TD-DFT Calculations of Absorption and Fluorescence Energies. J. Chem. Theory Comput. 2010, 6, 1532–1537. [Google Scholar] [CrossRef] [Scilit] [PubMed]
  24. Peach, M.J.G.; Benfield, P.; Helgaker, T.; Tozer, D.J. Excitation Energies in DFT: An Evaluation and Analysis of the Performance of CAM-B3LYP. J. Chem. Phys. 2008, 128, 044118. [Google Scholar] [CrossRef] [Scilit] [PubMed]
  25. Grimme, S.; Parac, M. Substantial Errors from Conventional DFT/TD-DFT for Excited States of Large π-Systems. ChemPhysChem 2003, 4, 292–295. [Google Scholar] [CrossRef] [Scilit] [PubMed]
  26. Blanchard, P.; Malacrida, C.; Cabanetos, C.; Roncali, J.; Ludwigs, S. Triphenylamine and Some of Its Derivatives as Versatile Building Blocks for Organic Electronic Applications. Polym. Int. 2019, 68, 589–606. [Google Scholar]
  27. Ueda, M.; Nagayama, R.; Nagaoka, M.; Suzuki, N.; Kodama, S.; Maeda, T.; Kato, S.-i.; Yagi, S. Synthesis and Electronic Properties of Novel Donor–π–Acceptor-Type Functional Dyes with a Carbonyl-Bridged Bithiophene π-Spacer. Molecules 2025, 30, 3084. [Google Scholar] [CrossRef] [Scilit] [PubMed]
  28. Abbas, F.; Ali, U.; Ahmad, H.M.R.; Tallat, A.; Shehzad, A.; Zeb, Z.; Hussain, I.; Saeed, A. Body Centered Non-Fullerene Acceptors Substitution on Triangular Shaped Sub-Phthalocyanines Based A–D–A Organic Solar Cells: A Step toward New Strategies for Better Performances. Opt. Quantum Electron. 2022, 54, 21. [Google Scholar] [CrossRef] [Scilit]
  29. Krishna, N.V.; Krishna, J.V.S.; Singh, S.P.; Giribabu, L.; Han, L.; Bedja, I.; Gupta, R.K.; Islam, A. Donor–π–Acceptor Based Stable Porphyrin Sensitizers for Dye-Sensitized Solar Cells: Effect of π-Conjugated Spacers. J. Phys. Chem. C 2017, 121, 6464–6477. [Google Scholar] [CrossRef] [Scilit]
  30. Al-Zahrani, F.A.; Arshad, M.N.; Asiri, A.M.; Mahmood, T.; Gilani, M.A.; El-Shishtawy, R.M. Synthesis and Structural Properties of 2-((10-Alkyl-10H-Phenothiazin-3-yl)Methylene)malononitrile Derivatives: A Combined Experimental and Theoretical Insight. Chem. Cent. J. 2016, 10, 13. [Google Scholar] [CrossRef] [Scilit] [PubMed]
  31. Jacquemin, D.; Wathelet, V.; Perpète, E.A.; Adamo, C. Extensive TD-DFT Benchmark: Singlet Excited States of Organic Molecules. Chem. Rev. 2012, 112, 542–585. [Google Scholar]
  32. Dreuw, A.; Head-Gordon, M. Failure of Time-Dependent Density Functional Theory for Long-Range Charge-Transfer Excited States. J. Am. Chem. Soc. 2004, 126, 4007–4016. [Google Scholar] [CrossRef] [Scilit] [PubMed]
  33. Lin, H.; Yang, M.; Ru, X.; Wang, G.; Yin, S.; Peng, F.; Hong, C.; Qu, M.; Lu, G.; Fang, L.; et al. Silicon Heterojunction Solar Cells with up to 26.81% Efficiency Achieved by Electrically Optimized Nanocrystalline-Silicon Hole Contact Layers. Nat. Energy 2023, 8, 789–799. [Google Scholar] [CrossRef] [Scilit]
  34. Park, N.-G.; Snaith, H.J.; Miyasaka, T. Key Advances in Perovskite Solar Cells. Nat. Rev. Clean Technol. 2026, 2, 6–7. [Google Scholar] [CrossRef] [Scilit]
  35. Yuan, J.; Zhang, Y.; Zhou, L.; Zhang, G.; Yip, H.-L.; Lau, T.-K.; Lu, X.; Zhu, C.; Peng, H.; Johnson, P.A.; et al. Single-Junction Organic Solar Cell with Over 15% Efficiency Using Fused-Ring Acceptor with Electron-Deficent Core. Joule 2019, 3, 1140–1151. [Google Scholar] [CrossRef] [Scilit]
  36. Hoppe, H.; Sariciftci, N.S. Morphology of Polymer/Fullerene Bulk Heterojunction Solar Cells. J. Mater. Chem. 2006, 16, 45–61. [Google Scholar] [CrossRef] [Scilit]
  37. Sahu, H.; Rao, W.; Troisi, A.; Ma, H. Toward Predicting Efficiency of Organic Solar Cells via Machine Learning and Improved Descriptors. Adv. Energy Mater. 2018, 8, 1801032. [Google Scholar] [CrossRef] [Scilit]
  38. Lampande, R.; Pizano, A.; Gui, M.; Cawthorn, R.; Rand, B.P.; Giebink, N.C. Dispersive Charge Transfer State Electroluminescence in Organic Solar Cells. Adv. Energy Mater. 2023, 13, 2300394. [Google Scholar] [CrossRef] [Scilit]
  39. Hosseini, S.M.; Wilken, S.; Sun, B.; Hang, F.; Jeong, S.Y.; Woo, H.Y.; Coropceanu, V.; Shoaee, S. Relationship between Energetic Disorder and Reduced Recombination of Free Carriers in Organic Solar Cells. Adv. Energy Mater. 2023, 13, 2203576. [Google Scholar] [CrossRef] [Scilit]
  40. Alharbi, F.H.; Rashkeev, S.N.; El-Mellouhi, F.; Luthi, H.P.; Tabet, N.; Kais, S. An Efficient Descriptor Model for Designing Materials for Solar Cells. NPJ Comput. Mater. 2015, 1, 15003. [Google Scholar] [CrossRef] [Scilit]
  41. Rau, U. Reciprocity Relation between Photovoltaic Quantum Efficiency and Electroluminescent Emission of Solar Cells. Phys. Rev. B 2007, 76, 085303. [Google Scholar] [CrossRef] [Scilit]
  42. Vandewal, K.; Tvingstedt, K.; Gadisa, A.; Inganäs, O.; Manca, J.V. On the Origin of the Open-Circuit Voltage of Polymer–Fullerene Solar Cells. Nat. Mater. 2009, 8, 904–909. [Google Scholar] [CrossRef] [Scilit] [PubMed]
  43. Benduhn, J.; Tvingstedt, K.; Piersimoni, F.; Ullbrich, S.; Rau, U.; Vandewal, K. Intrinsic Non-Radiative Voltage Losses in Fullerene-Based Organic Solar Cells. Nat. Energy 2017, 2, 17053. [Google Scholar] [CrossRef] [Scilit]
  44. Shang, Y.; Li, Q.; Meng, L.; Wang, D.; Shuai, Z. Computational Characterization of Organic Photovoltaic Devices. Theor. Chem. Acc. 2011, 129, 291–301. [Google Scholar] [CrossRef] [Scilit]
  45. ASTM G173-03(2020); Standard Tables for Reference Solar Spectral Irradiances: AM1.5 Direct Normal and AM1.5 Global on 37° Tilted Surface, Derived from SMARTS v. 2.9.2. ASTM International: West Conshohocken, PA, USA, 2020.
  46. Preat, J.; Michaux, C.; Jacquemin, D.; Perpète, E.A. Toward an Efficient Screening of Organic Dyes for Dye-Sensitized Solar Cells. J. Phys. Chem. C 2009, 113, 16821–16833. [Google Scholar] [CrossRef] [Scilit]
  47. Obi-Egbedi, N.O.; Ojo, N.D. Synthesis, Light Harvesting Efficiency, Photophysical and Nonlinear Optical Properties of 3-(5-(4-Hydroxybenzylideneamino)naphthalen-1-yliminomethyl)phenol: Spectroscopic and Quantum Chemical Approach. Res. Chem. Intermed. 2021, 47, 5249–5266. [Google Scholar] [CrossRef] [Scilit]
  48. Ali, A.Y.; Holmes, N.P.; Cooling, N.; Holdsworth, J.; Belcher, W.; Dastoor, P.; Zhou, X. Optimization of Bulk Heterojunction Organic Photovoltaics. Coatings 2023, 13, 1293. [Google Scholar] [CrossRef] [Scilit]
  49. Ghosh, T.; Panicker, J.S.; Nair, V.C. Self-Assembled Organic Materials for Photovoltaic Application. Polymers 2017, 9, 112. [Google Scholar] [CrossRef] [Scilit] [PubMed]
  50. Junda, M.M.; Podraza, N.J. Optical Properties of Soda-Lime Float Glass from 3 mm to 148 nm by Spectroscopic Ellipsometry. Surf. Sci. Spectra 2018, 25, 016001. [Google Scholar] [CrossRef] [Scilit]
  51. Weast, R.C. Handbook of Chemistry and Physics, 58th ed.; CRC Press: Boca Raton, FL, USA, 1979; p. 515. [Google Scholar]
  52. Shen, Y.; Scudiero, L.; Gupta, M.C. Temperature Dependence of HOMO–LUMO Levels and Open-Circuit Voltage for P3HT:PCBM Organic Solar Cells. Mater. Res. Soc. Symp. Proc. 2012, 1360, 51–59. [Google Scholar] [CrossRef] [Scilit]
  53. Ozerm, M.E. Comparing Molecular and Electronic Properties of Perylene Tetracarboxylic Diimides Decorated at 1,6- and 1,7-Bay-Positions Using DFT/TDDFT Method. Mater. Today Commun. 2021, 27, 102446. [Google Scholar] [CrossRef] [Scilit]
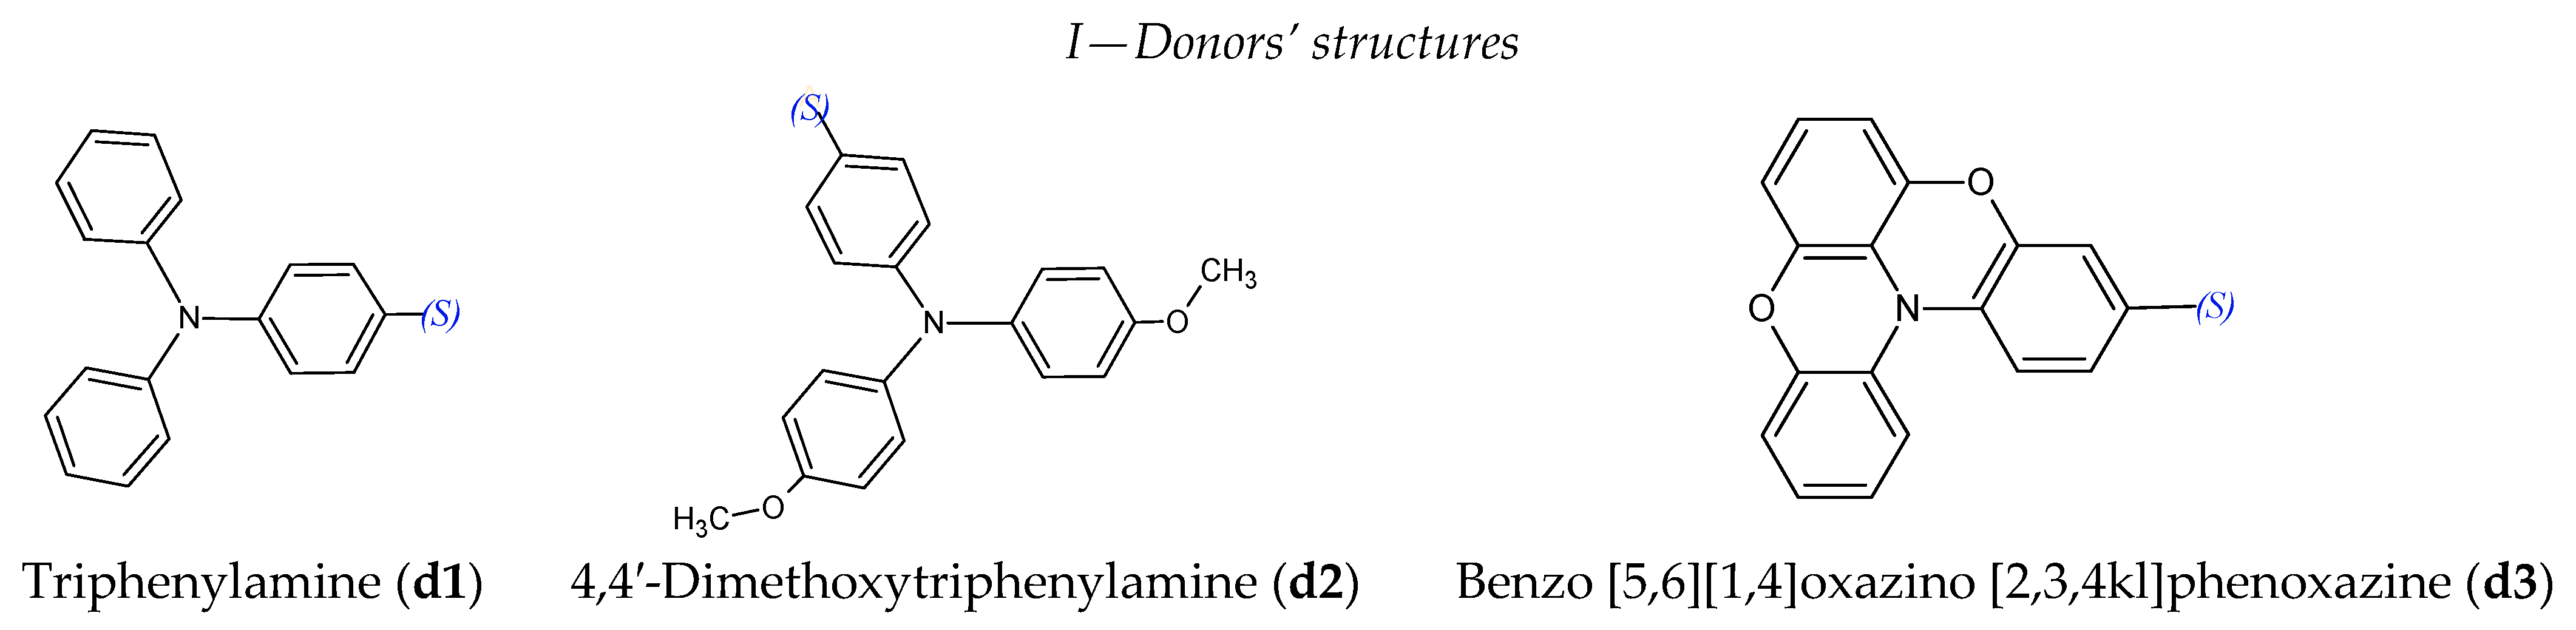
Figure 1. Sketch of the molecular structures of the donor groups with their name and acronym used for identification in parenthesis. The symbol (S) represents the binding site in the push–pull system.
Condensedmatter 11 00029 g001
Figure 2. Sketch of the molecular structures of the π-bridges with their name and acronym used for identification in parenthesis. The symbol (S) represents the binding site in the push–pull system.
Condensedmatter 11 00029 g002
Figure 3. Sketch of the molecular structures of the acceptor groups with their name and acronym used for identification in parenthesis. The symbol (S) represents the binding site in the push–pull system; for ac1, (S) replaces the methyl group.
Condensedmatter 11 00029 g003
Scheme 1. Molecular structure of d1_dt_ac1 as an example of a D–π–A system according to the acronym notation (D = d1, = dt and A = ac1).
Condensedmatter 11 00029 sch001
Figure 4. Comparison of the TD-CAM-B3LYP/6-311G HOMO and LUMO energies of the different molecules studied here. The first three columns refer to the single building moieties.
Condensedmatter 11 00029 g004
Figure 5. Fragment-orbital interaction diagram for the representative chromophores d1_bt_ac3 and d1_bt_ac1. The HOMO (top) and LUMO (bottom) energies of the D–π–A chromophores are compared with those of the donor (d1), π-bridge (bt), and acceptor (ac1 or ac3) fragments.
Condensedmatter 11 00029 g005aCondensedmatter 11 00029 g005b
Figure 6. Sketch of the TD-CAM-B3LYP/6-311G HOMO and LUMO isodensity (0.02 e/a03) for d1_bt_ac3 (left) and d1_bt_ac1 (right). In each panel, the chromophore MOs (top) are compared with those of the corresponding moieties (bottom). For the acronyms, refer to Figure 1, Figure 2 and Figure 3.
Condensedmatter 11 00029 g006
Figure 7. Plot of the first optical transitions frequencies νmax, in eV, versus the HOMO−LUMO energy gap (ELUMOEHOMO, eV) for the D–π–A systems. The chromophores with the ac3, ac2 and ac1 donors are depicted as violet, dark green and green dots, respectively. Calculations were performed at the TD−CAM-B3LYP/6-311G //B3LYP/6-311G level.
Condensedmatter 11 00029 g007
Figure 8. Comparison between the TD-CAM-B3LYP/6-311G//B3LYP/6-311G computed electron absorption spectra of d1_dt_ac1, d1, dt and ac1. The spectra are reported normalized with respect to the highest absorption band of d1_dt_ac1 in order to highlight the absorption changes upon formation of the complete D–π–A chromophore.
Condensedmatter 11 00029 g008
Figure 9. Comparison between the simulated absorption spectra of the D_dt_ac1, d2_π_ac1 and d2_dt_A chromophores obtained at TD-CAM-B3LYP/6-311G level. Calculations were performed on the optimized B3LYP/6-311G geometry.
Condensedmatter 11 00029 g009
Table 1. TD-CAM-B3LYP/6-311G HOMO–LUMO energy gap (ΔEHL = ELUMOEHOMO), maximum absorption frequency (νmax), wavelength (λmax), and oscillator strengths f for selected D–π–A systems 1,2 compared with the single moieties.
D–π–AΔEHLνmaxλmaxf
eVeVnm-
d1_bt_ac13.792.49498.092.1369
d1_bt1_ac13.812.53490.451.5780
d1_dt_ac13.902.55486.151.8600
d2_bt_ac13.682.42511.802.0902
d2_bt1_ac13.612.45505.721.3929
d2_dt_ac13.572.21560.602.0936
d3_bt_ac13.682.51493.422.0651
d3_bt1_ac13.712.55486.791.5385
d3_dt_ac13.652.31537.452.0311
d17.134.56272.230.2769
d26.814.52274.100.3178
d36.824.09303.410.1153
dt7.024.46277.880.3867
bt6.874.43279.860.1925
bt17.144.74261.660.3619
ac15.573.50354.350.5592
ac25.134.26291.170.6483
ac35.333.31374.790.5778
1 Among the set of D–π–A chromophores, keeping the D–π unit fixed and varying the acceptor, those with the highest λmax were selected. 2 For the acronyms, refer to Figure 1, Figure 2 and Figure 3.
Table 2. Energy off-set ΔEHOMO 1, ΔELUMO 2, open-circuit voltage, Voc 3 and fill factor, FF 4 for selected D–π–A systems. Results from TD-CAM-B3LYP/6-311G calculations.
D–π–A 5ΔEHOMOΔELUMOVocFF
eVV-
d1_bt1_ac1−0.670.742.070.871
d1_bt_ac1−0.640.752.040.869
d1_dt_ac1−0.570.931.970.864
d3_dt_ac1−0.530.721.930.862
d2_bt1_ac1−0.440.771.840.857
d2_bt_ac1−0.420.781.820.855
d2_dt_ac1−0.340.831.740.849
d2_bt1_ac3−0.191.251.590.838
d2_dt_ac2−0.081.301.480.827
1 ΔEHOMO = EHOMO(D–π–A) − EHOMO(PCBM), with EHOMO(PCBM) = −6.1 eV [51,52]. 2 ΔEL = ELUMO(D–π–A) − ELUMO(PCBM), with ELUMO(PCBM) = −3.7 eV [51,52]. 3 Calculated from Equation (3) of the main text, assuming ΔVloss = 1.0 V. 4 Calculated from Equation (2) of the main text, assuming T = 298 K and α = 12. 5 For the acronyms, refer to Figure 1, Figure 2 and Figure 3.
Table 3. Computed short-circuit current Jsc and power efficiency, η, for selected D–π–A systems. Results from TD-CAM-B3LYP/6-311G calculations.
D–π–A 1Jscη
mA/cm2-
d2_dt_ac113.0826.28%
d3_dt_ac111.4625.88%
d1_bt_ac19.1822.09%
d1_bt1_ac17.6318.71%
d2_bt_ac18.8318.68%
d1_dt_ac17.7817.96%
d2_bt1_ac18.3417.88%
d3_bt1_ac17.4617.75%
d3_bt_ac17.4617.52%
d1_dt_ac28.9417.11%
d3_dt_ac28.6716.74%
d2_dt_ac29.5815.88%
1 For the acronyms, refer to Figure 1, Figure 2 and Figure 3.
Disclaimer/Publisher’s Note: The statements, opinions and data contained in all publications are solely those of the individual author(s) and contributor(s) and not of MDPI and/or the editor(s). MDPI and/or the editor(s) disclaim responsibility for any injury to people or property resulting from any ideas, methods, instructions or products referred to in the content.