Article

Dynamic Changes of Environment and Gut Microbial Community of Litopenaeus vannamei in Greenhouse Farming and Potential Mechanism of Gut Microbial Community Construction

1
Institute of Oceanology & Marine Fisheries, No. 31, Jiaoyu Road, Nantong 226007, China
2
College of Animal Science and Technology, Yangzhou University, Yangzhou 225009, China
*
Author to whom correspondence should be addressed.
These authors contributed equally to this work.
Fishes 2024, 9(5), 155; https://doi.org/10.3390/fishes9050155
Submission received: 29 February 2024 / Revised: 20 April 2024 / Accepted: 24 April 2024 / Published: 26 April 2024
(This article belongs to the Special Issue Aquaculture Ecology and the Environmental Microbiome)

Abstract

:
The aim of this study was to investigate the dynamic changes in the microbial communities of both the environment and gut of Litopenaeus vannamei, as well as to elucidate the mechanisms underlying microbial community assembly in greenhouse farming. 16S rDNA high-throughput sequencing and bioinformatics methods were used to carry out the research on the community structure of the microorganisms under greenhouse culture conditions in water, sediment, and gut microorganisms; correlations pertaining to environmental factors; the feasibility of using Source Tracker; and the mechanisms of community construction. The results show that the dominant microorganisms in water, sediment, and gut farming in a greenhouse environment varied and were subject to dynamic change. A variety of beneficial microbiota such as Bacillus were found in the gut, whereas a variety of microorganisms such as Marivita and Pseudomonas, which function as nitrogen and phosphorus removers, were present in water. Source Tracker and environmental correlation analyses showed that changes in the gut were associated with eutrophication indicators (total nitrogen, total phosphorus, ammonia nitrogen) and changes in environmental microorganisms (in water and sediment). The results of the community-building mechanism analysis show that stochastic processes determine the community-building directions of environmental and gut microorganisms. These findings will help us to understand the microbiota characteristics of shrimp ponds under greenhouse farming conditions, and the complex interactions between the shrimp gut and the environmental microbiota and environmental variables, as well as revealing the changing rules of the gut microbiota.
Key Contribution:
Stochastic processes determine the construction of environmental and gut microbial communities. At the same time, changes in the gut are closely related to changes in eutrophication indicators as well as environmental microbiology.

1. Introduction

Litopenaeus vannamei has become the most widely farmed species in China’s coastal areas in recent years due to its great adaptability and fast growth rate [1,2]. In 2020, the global annual production of L. vannamei reached 5.8 million tons, accounting for 51.7% of the total production of cultured crustaceans [3]. This species is suitable for pond farming, factory farming, greenhouse farming, and other farming modes, among which greenhouse farming has attracted much attention in the L. vannamei farming industry [4]. The greenhouse farming model first appeared in Nantong, Jiangsu Province, China, where ponds covered in plastic and with an average surface area of 0.7 ha began to be used for shrimp culturing [5]. Compared with the traditional pond cultures, the greenhouse culture mode shows significant advantages, featuring high yields, independent environments, and controllable temperatures [6]. However, greenhouse farming also suffers from the excessive depletion of groundwater resources, low renewal rates of water, the eutrophication of water, and a lack of sewage systems [7]. It is important to conduct research on the construction of gut microbiota in eutrophicated environments, such as greenhouse farms, as this provides a scientific basis and guidance for improving productivity and environmental health.
Microbial communities are an important part of aquatic ecosystems, and their composition and diversity are key factors affecting nutrient cycling, growth and development, as well as disease prevention and control [8]. The gut microbiota of L. vannamei plays a crucial role in shrimp growth, metabolism, nutrient absorption, immunity, and disease resistance [9,10]. Environmental factors can directly or indirectly affect organisms in aquatic ecosystems. These factors include physical (pH, temperature, dissolved oxygen, salinity, etc.), chemical (chemical oxygen demand, nitrogen, nitrite, etc.), and biological (phytoplankton, zooplankton, microbial composition, etc.) components, playing an important role in inducing changes to the gut microbial community of L. vannamei, which has been studied in different culture models, such as pond cultures and higher-place ponds [11,12]. Recent studies on microbial communities in aquatic ecosystems have shown that changes in microbial communities in aquatic ecosystems are regulated by a combination of two types of ecological processes: deterministic processes and stochastic processes [13]. Deterministic processes are mainly related to ecological theory, which holds that biological factors (species interactions) and abiotic factors (environmental factors, space, etc.) govern the construction of microbial communities [14]. Stochastic processes are mainly related to the neutral theory, which holds that diffusion and stochastic action are the main determinants of shaping microbial community structure [14]. It has been found that stochastic processes play a dominant role in the construction of microbial communities in the gut of aquatic animals such as zebrafish [15] and Homarus gammarus [16]. The ratio of deterministic to stochastic processes is influenced by many factors, such as the degree of eutrophication. It has been shown that deterministic processes play a dominant role in microbial community assembly in eutrophic waters [17]. Both deterministic and stochastic processes play a key role in microbial community dynamics. Deterministic processes can serve as a way for us to predict trends in microbial communities and thus understand the evolution of their structure and function. Stochastic processes reflect the unpredictable aspects of microbial community change. Therefore, when studying microbial communities, it is important to give due consideration not only to the regularity and predictability of deterministic processes, but also to the uncertainties and potential effects introduced by stochastic processes.
However, studies on the microbial community construction mechanism of L. vannamei under greenhouse farming are limited, and its composition, changes, and influencing factors have not been clearly elucidated. Therefore, in this study, we conducted full-cycle monitoring of the microbial changes in the water, sediment and gut of L. vannamei under greenhouse farming. We aim to further improve the understanding of the culturing of L. vannamei under greenhouse farming, and provide a theoretical basis for the management of aquaculture ponds and scientific production in this mode.

2. Materials and Methods

2.1. Sample Collection and Processing

The three greenhouse ponds, which were located in He Ya Village, Rudong County, Nantong City, Jiangsu Province, China (121°11′37″ E, 32°27′11″ N), were of essentially the same size and depth (1.2 m) and managed using the same water, with a daily water change rate of 5%, a water depth of 0.8 m, a stocking rate of 70,000 fry, and a two-meals-per-day feeding schedule. The culture period was from 22 August 2022 to 21 November 2022, a total of 92 days. The average yield of the three greenhouse ponds was 870 kg, with an average harvest size of about 69 tails/kg and a survival rate of about 85.3%. Water, sediment, and shrimp samples were collected on days 2, 30, 60, and 90 from the three greenhouse ponds. In addition to normal feeding, water changes, and water quality monitoring, feed additives such as Bacillus subtilis (once every 2–3 days, 50 g/pond ≥ 1 × 10¹⁰ cfu/g) and EM bacteria (Photosynthetic Bacteria, Lactobacillus, etc., 0.25 L/pond, when there was sunlight) were applied during the breeding period, and the feed was mixed with brown sugar water daily.
Due to the structure of the shed ponds, water samples were collected from three sampling points (Figure 1), and 1 L of water was collected at a depth of 50 cm below the surface using an organic glass water sampler, and then mixed into a composite sample. The water samples were promptly transported to our laboratory and filtered through a 0.22 μm microporous membrane (Shanghai Xinya, Shanghai, China) within 4 h of collection. The membrane was stored in a 10 mL sterile centrifuge tube. Sediment samples (5 cm) were collected from the four corners of the greenhouse pond and mixed in 10 mL sterile centrifuge tubes (Figure 1). The above samples were stored at −80 °C for DNA extraction. Thirty prawns were randomly selected from the feeding table each time. Gut samples were collected after disinfection of the prawns’ body surfaces and stored in 10 mL sterile centrifuge tubes at −80 °C [9]. A total of 24 water, sediment, and gut samples (Table 1) were commissioned to be sequenced by Novogene Corporation (Beijing, China).

2.2. Determination of Environmental Factors

Water quality measurements were taken every 15 days, starting from the second day of release (23 August). Temperature (T), pH, salinity (S), and dissolved oxygen (DO) were measured in the field using a Multi-Parameter Meter (Hach, HQ40d). Chemical oxygen demand (COD) was measured using the permanganate method. Total nitrogen (TN) and total phosphorus (TP) were quantified by means of potassium persulfate oxidation, whereas ammonium nitrogen (NH4+-N) content was determined via hypo-bromate oxidimetry. Nitrite nitrogen (NO2-N) content, on the other hand, was analyzed using the ethylenediamine dihydrochloride spectrophotometric method [18].

2.3. DNA Extraction

DNA extraction was carried out using a magnetic bead method along with a soil and fecal genomic DNA extraction kit (Tian Gen, Beijing, China, DP712), and the DNA was diluted to 1 ng/μL using sterile water. The V3-4 region of 16SrDNA was amplified with the F primer (CCTAYGGGRBGCASCAG) and the R primer (GGACTACNNGGGTATCTAAT). Aliquots were mixed according to the concentration of the product and purified, and the product was recovered using a gel recovery kit (Qiagen, Dusseldorf, Germany). Libraries were constructed using the TruSeq@ DNA PCR-Free Sample Preparation Kit and quantified using the Qubit/Agilent Bioanalvzer 2100 System/Q-PCR (Agilent Technologies, Santa Clara, CA, USA). After quality checks and quantification, the libraries were sequenced using a Nova Seg 6000 (Illumina, San Diego, CA, USA) on board.

2.4. 16S rRNA Sequencing and Bioinformatic Analysis

The raw data were split down the machine, spliced, and filtered, and chimeras were removed to obtain the final valid data. The data were clustered with 97% consistency as OTUs using the Uparse algorithm. Species annotation was performed using the Mothur method with the SSUrRNA database from SILVA138.1. Multiple sequence comparisons were performed, using MUSCLE software (Version 5.1.0) to obtain phylogenetic relationships, and finally homogenized using the lowest number of data in the sample. Shannon and Chao1 indices were calculated using Qiime software (Version 1.9.1), and Wilcoxon.text tests were performed using the platform accessible at https://www.omicshare.com (accessed on 6 December 2023) for composition difference analysis and the plotting of images. PCoA analyses based on Bray–Curtis distances were performed using the ade4 package of R software (Version 4.2.1) and the ggplot2 package (Version 3.5.1) to evaluate microbial community structure. LDA Effect Size (LEfSe) analyses were used to determine the significant differences in microorganisms at different culture stages in the water, sediment, and gut samples. Mantel test analyses of microorganisms and environmental factors were performed using the R software product. The Spearman coefficients within the environmental factor groups were calculated using the OmicShare platform (https://www.omicshare.com (accessed on 12 December 2021), and dynamic network heat maps were drawn. Traceability analysis was carried out using the Source Tracker package.

3. Results and Discussion

3.1. Environmental Factors

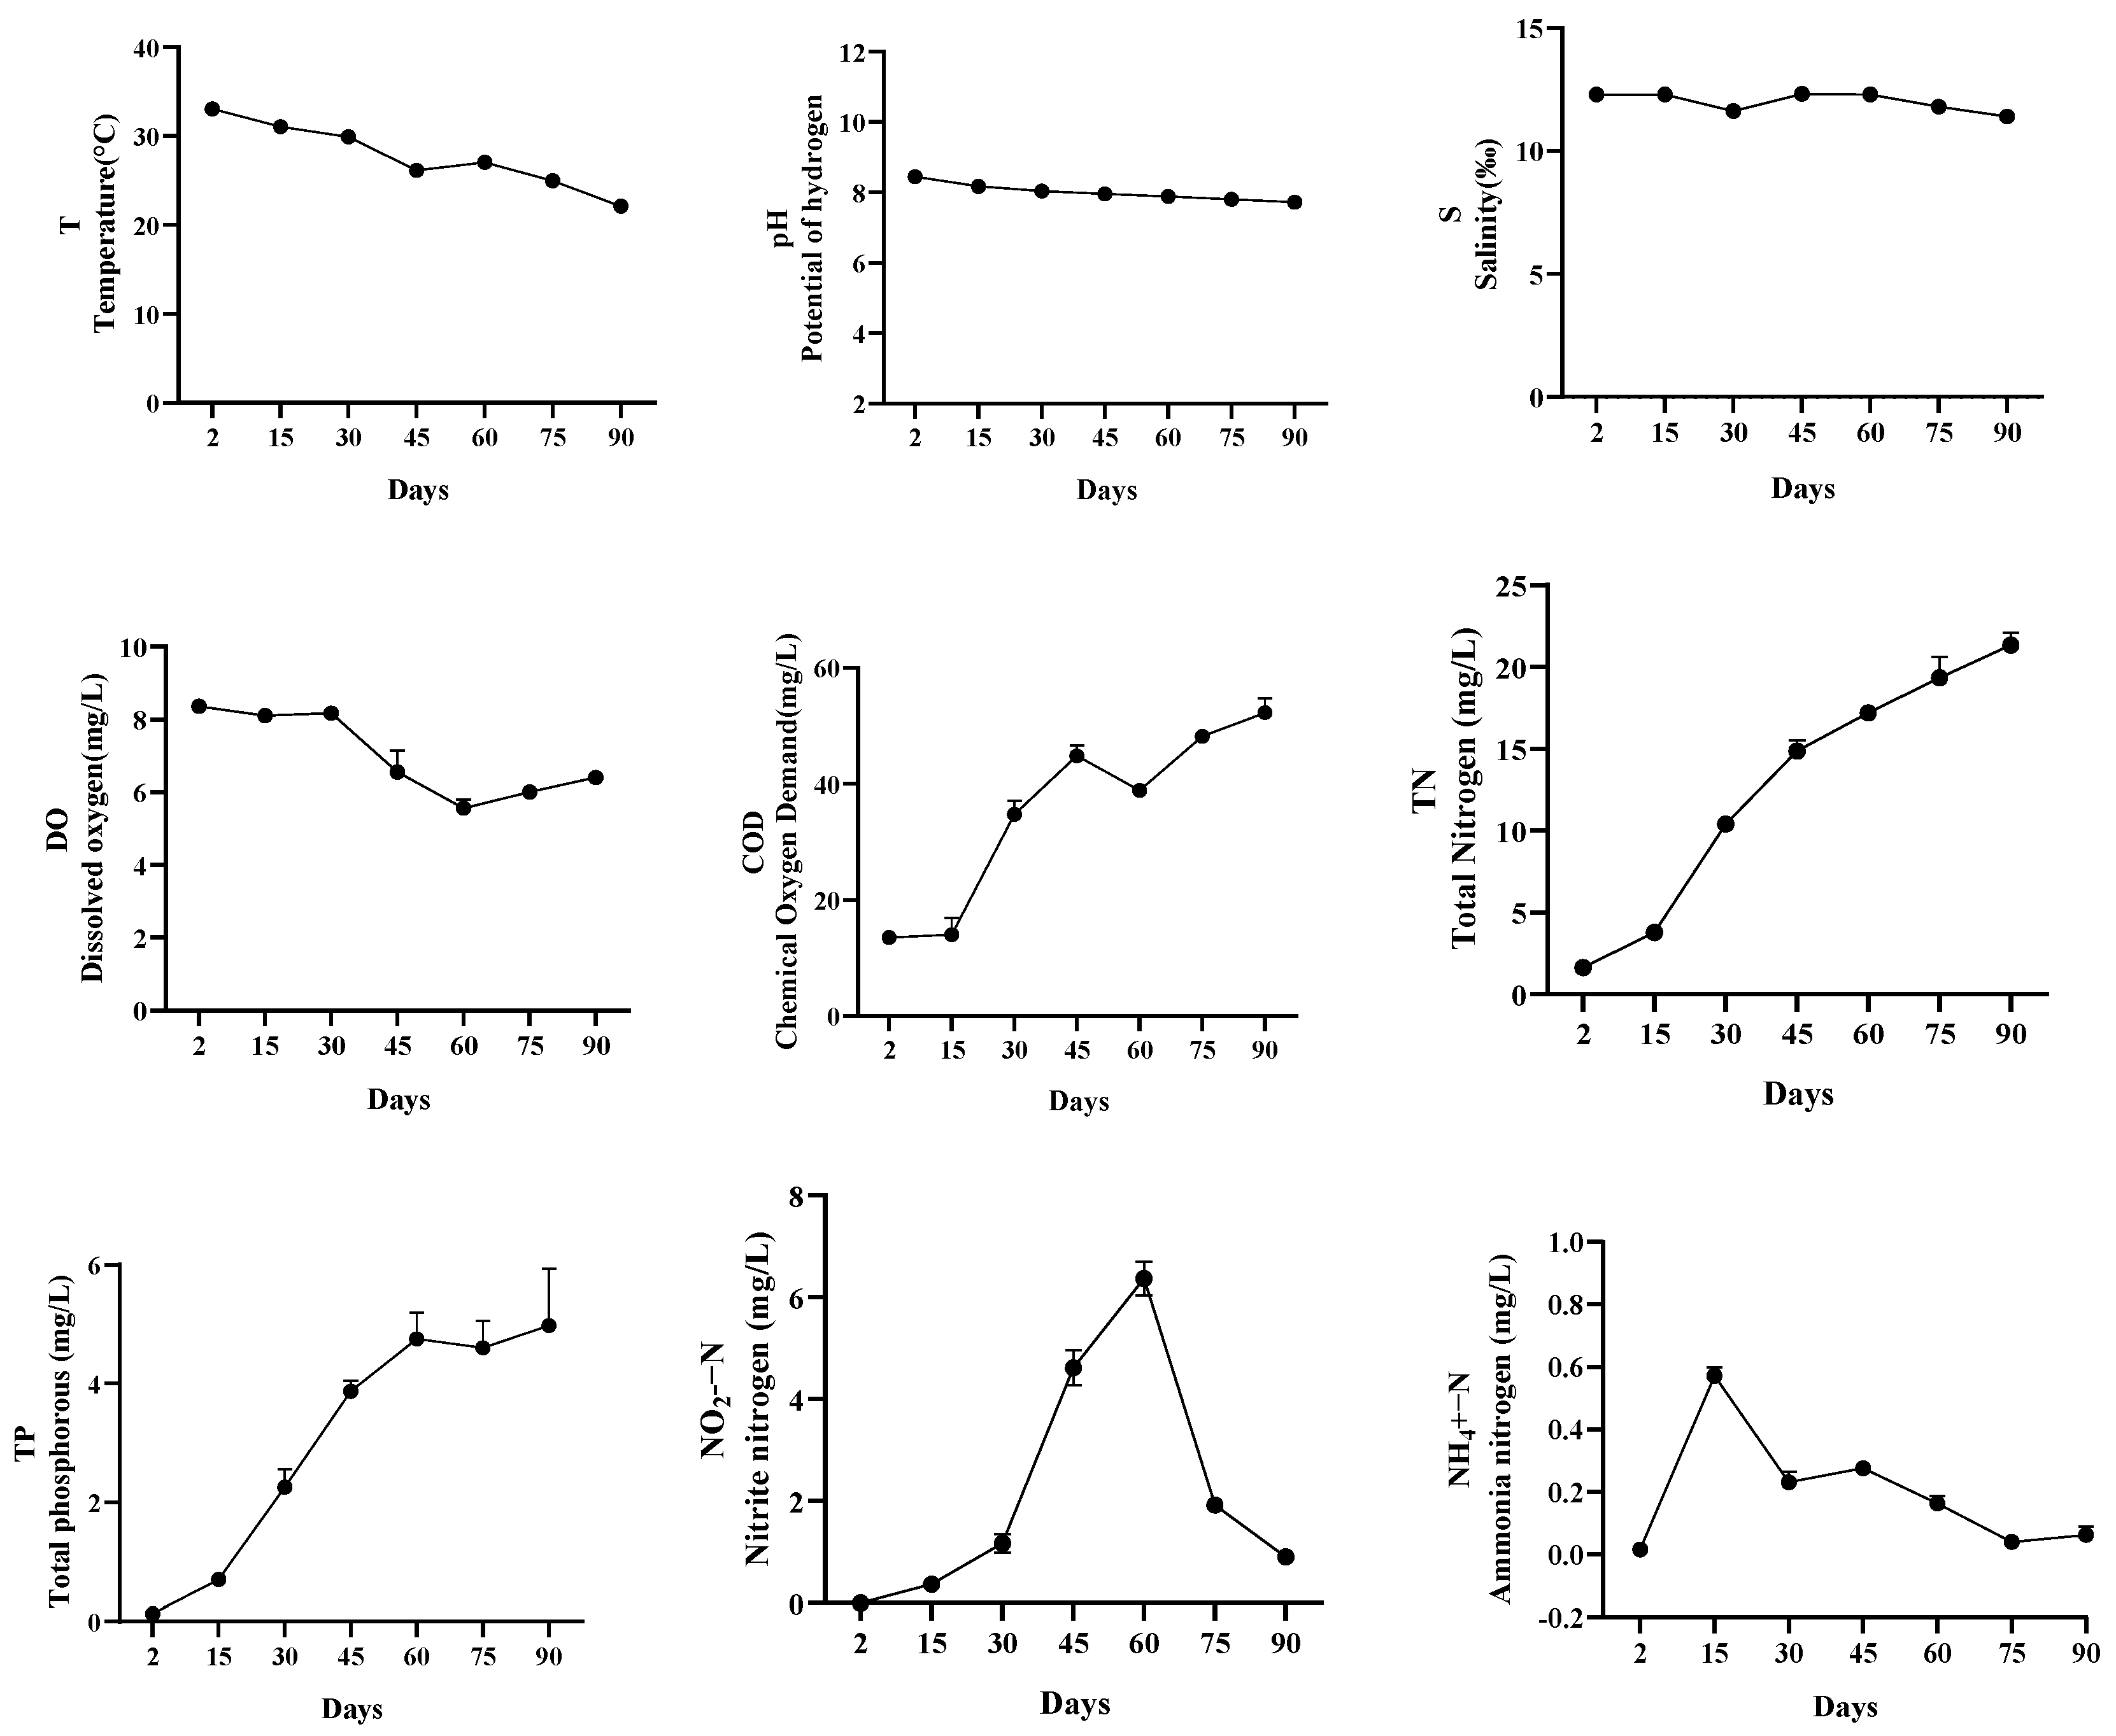
The water quality of the greenhouse ponds was monitored over a complete culture cycle (Figure 2). During the culture period, T showed a gradual decreasing trend, from 33 °C to 22 °C, and reached a minimum at 90 days, a result that is consistent with the climatic conditions at the test site. The pH, DO, and S values remained stable, and their ranges were 7.71–8.55, 5.29–8.40 mg/L, and 11.40–12.40, respectively. In the early stage of culturing, the concentrations of nitrogen and phosphorus in the water were low. With the increase in culture time, TN and TP showed an increasing trend and reached the highest values at 90 days, amounting to 22.2 mg/L and 5.76 mg/L, respectively. Nitrate nitrogen and ammonium nitrogen first increased and then decreased, among which nitrate nitrogen reached the highest value on the 60th day, while ammonium nitrogen reached the highest value on the 15th day and the lowest value on the 90th day, and its lowest values were 0.793 mg/L and 0.0312 mg/L, respectively (Figure 2).

3.2. Basic Information of Bacterial Communities

High-throughput sequencing was used to study changes in the environmental and gut microbial communities of L. vannamei throughout the culture cycle in greenhouse ponds. In total, 52,080–91,441 raw tags were obtained, 52,729–90,520 clean tags were obtained after filtering for low quality and short length, and 38,719–82,817 effective tags were acquired. The rarefaction curve developed showed that the samples were well sampled and sequenced to a sufficient depth to reflect the microbial community of each sample. Parallel samples from the three ponds during the same period were combined and analyzed, noting the water samples as W1, W2, W3, and W4; the sediment samples as S1, S2, S3, and S4; and the shrimp gut samples as G1, G2, G3, and G4.

3.3. Temporal Dynamics of Microorganisms in Water

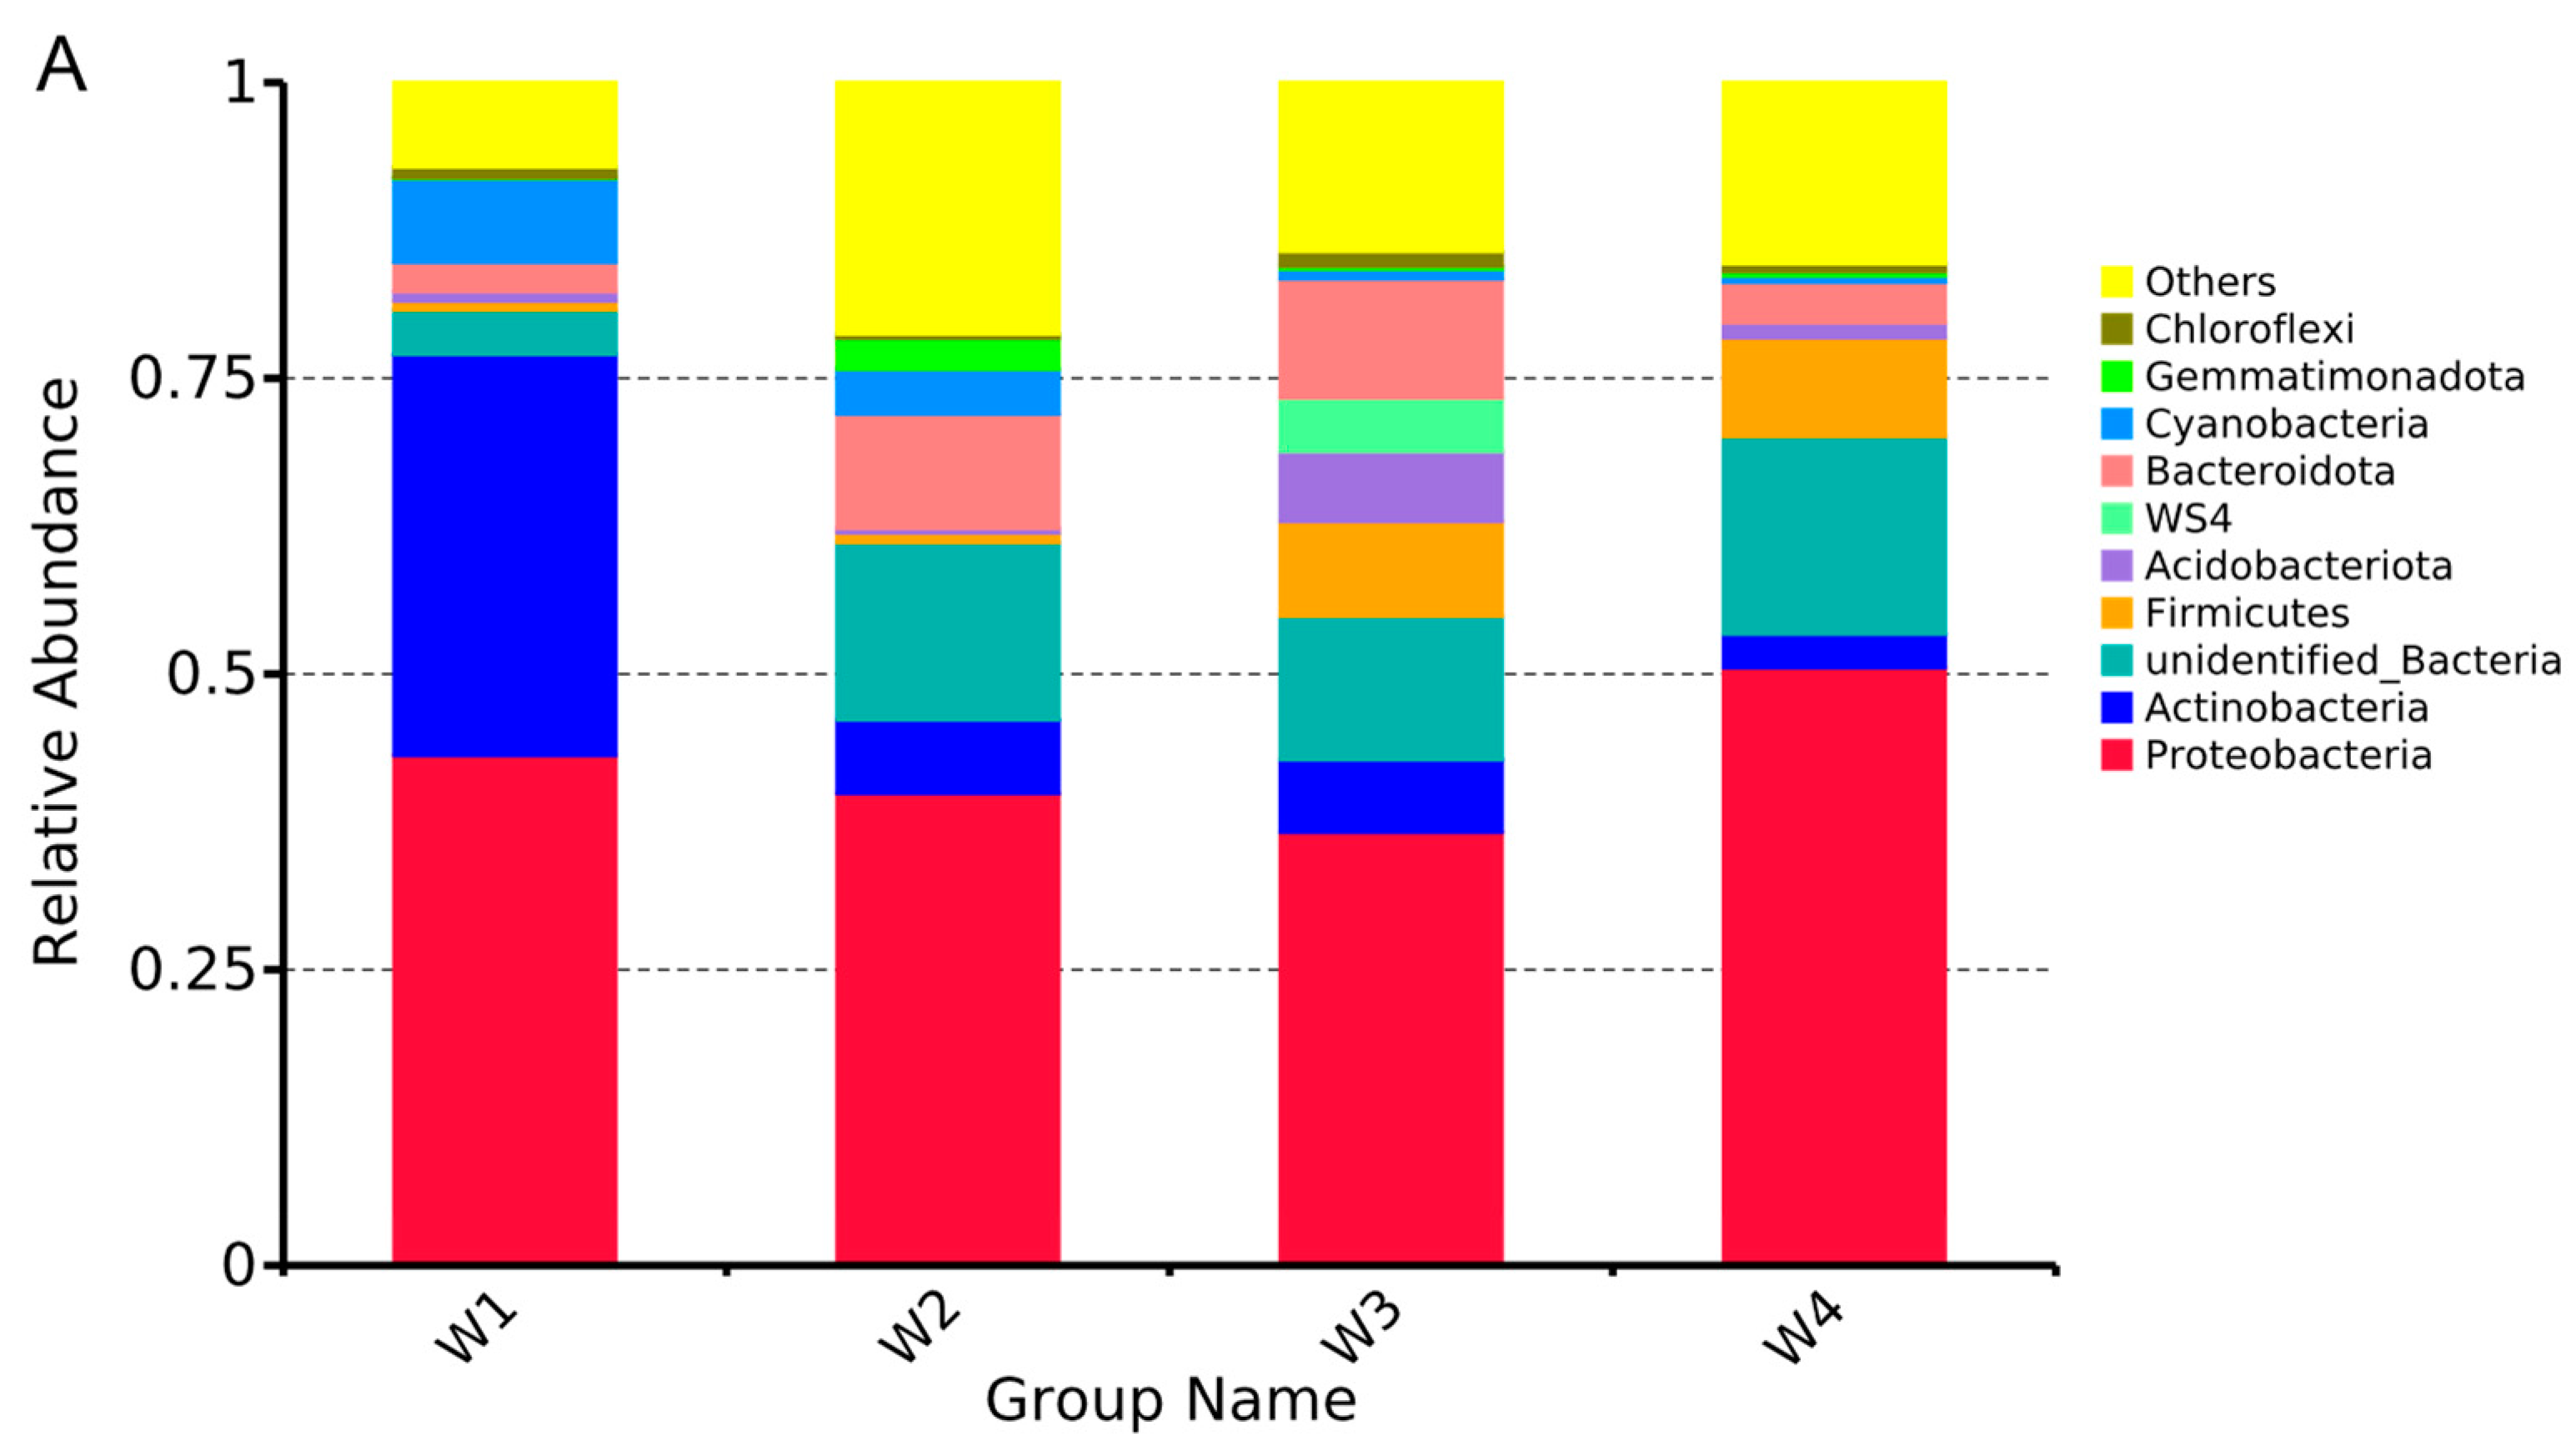
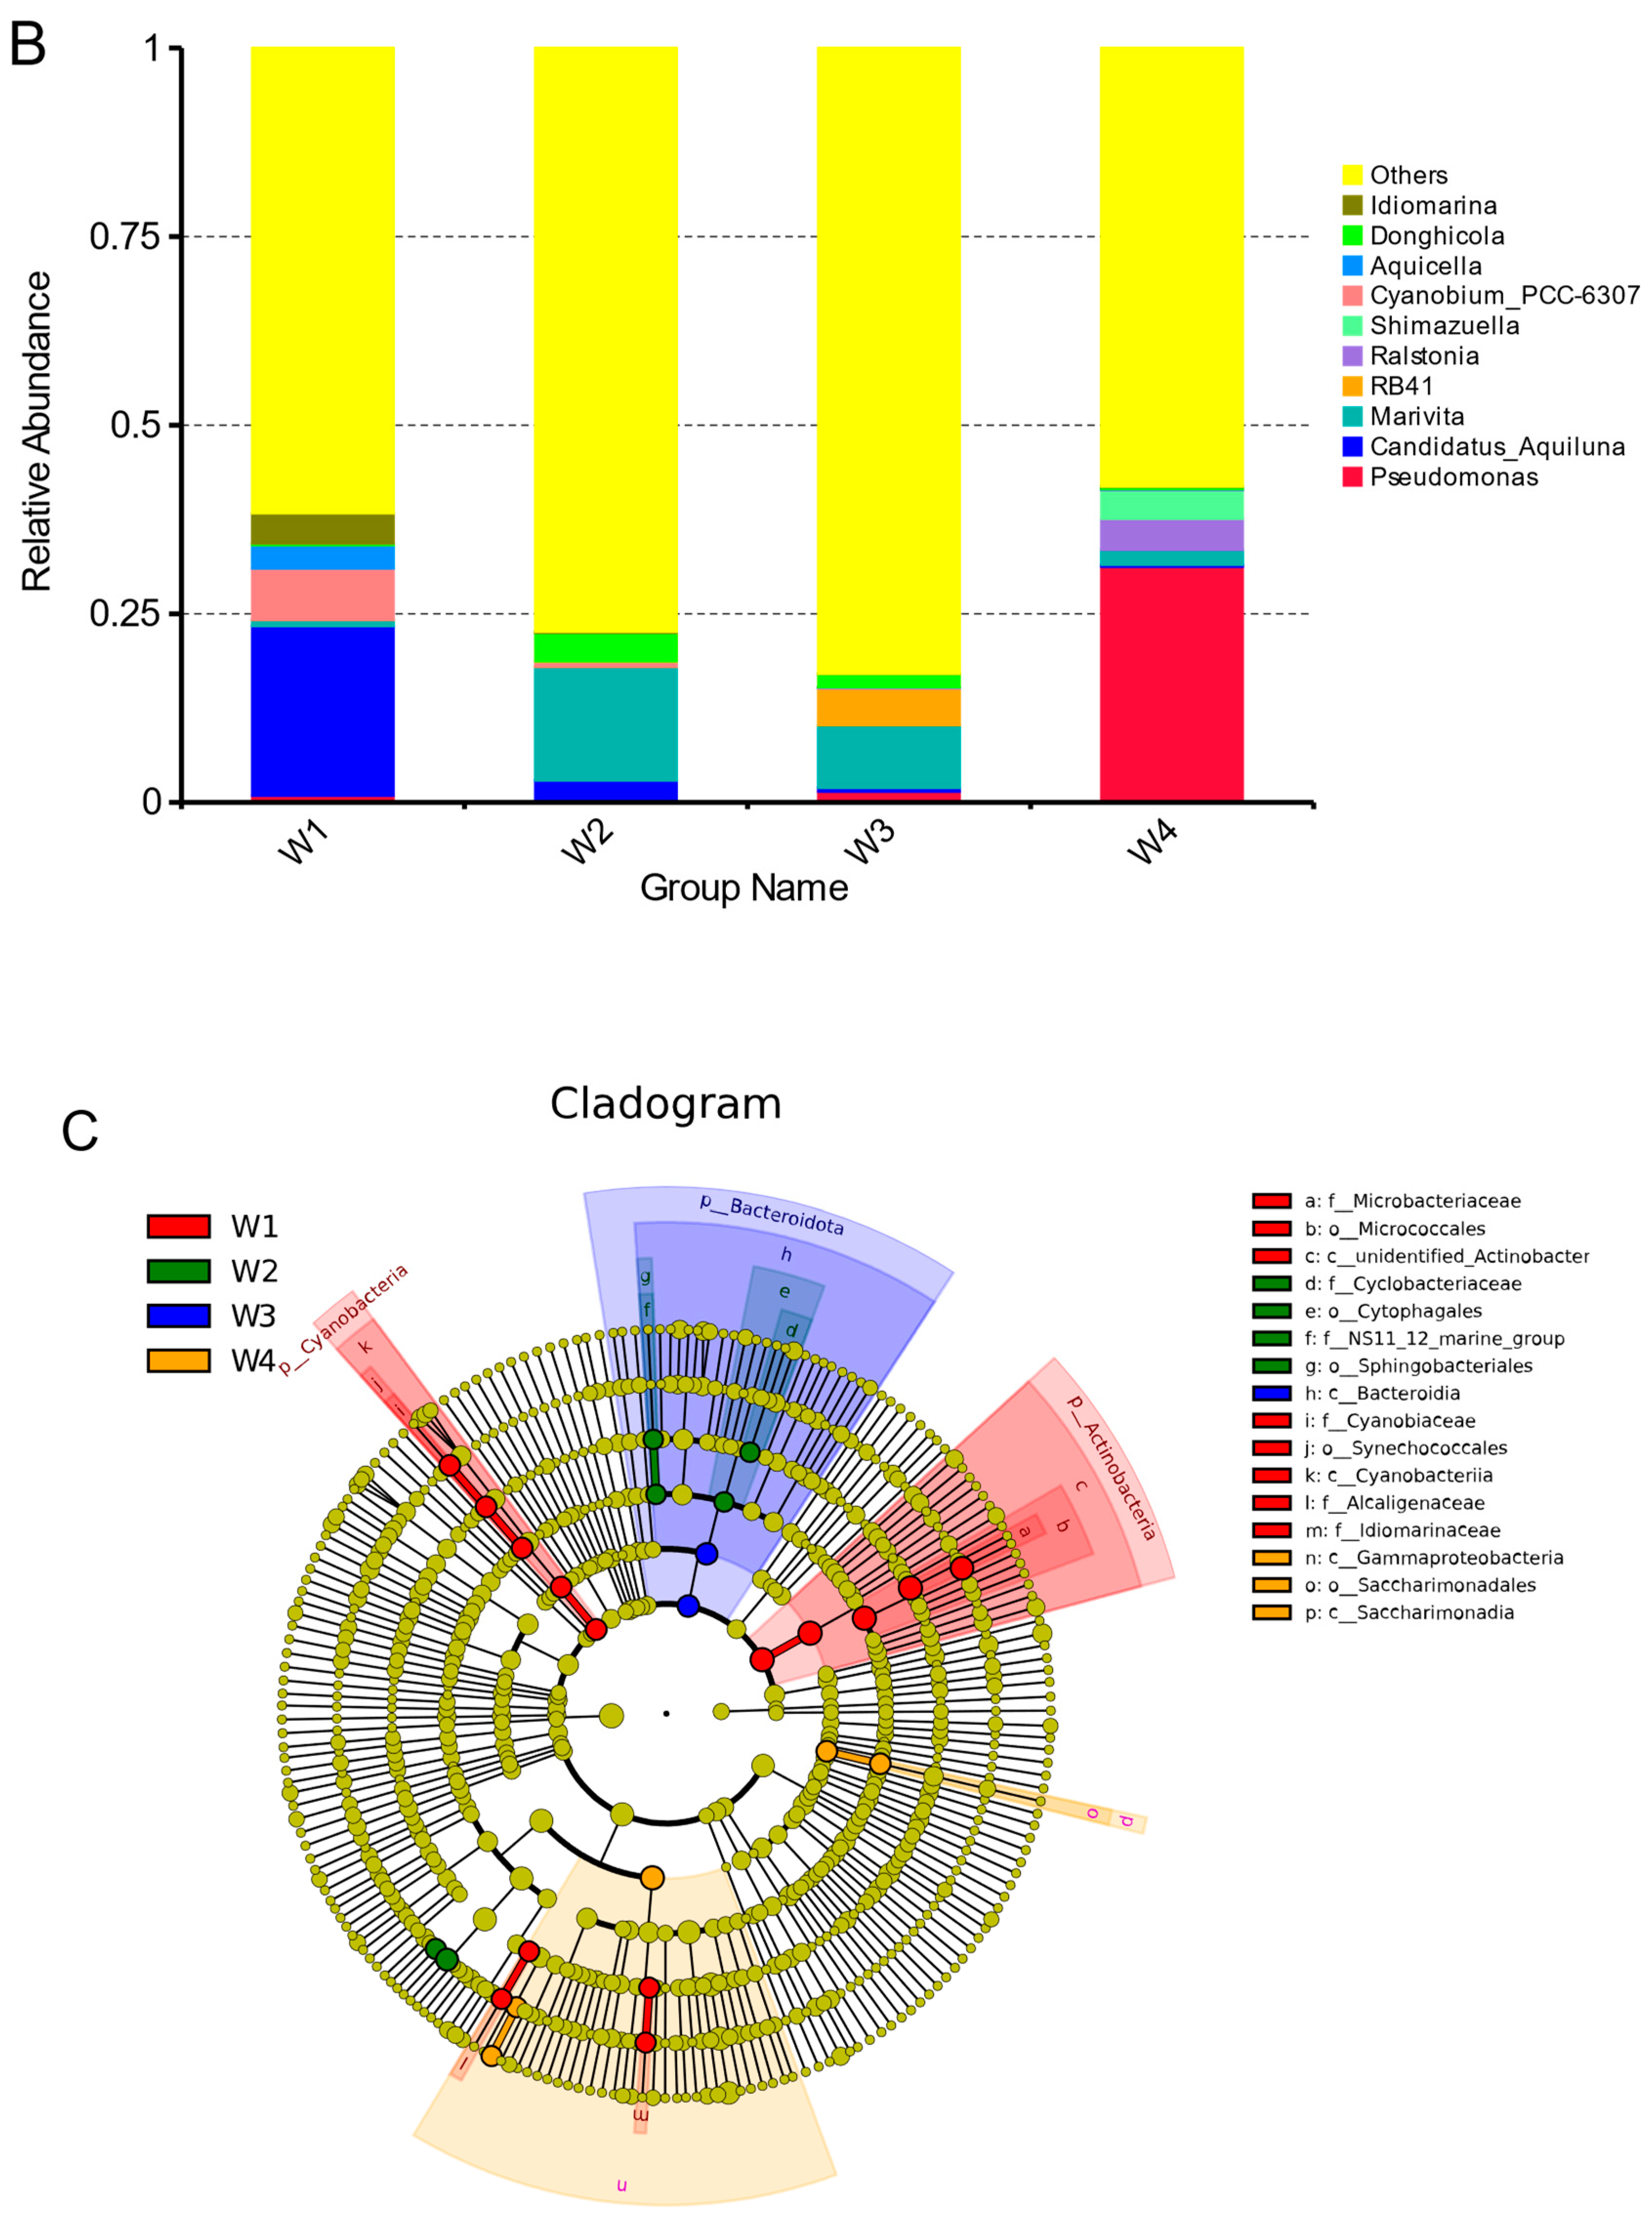
Water microorganisms are in a dynamic state in L. vannamei aquaculture ponds under greenhouse farming conditions. At the phylum level (Figure 3A), the top-ten most dominant phyla in water were Proteobacteria, Actinobacteria, unidentified Bacteria, Firmicutes, Acidobacteriota, WS4, Bacteroidota, Cyanobacteria, Gemmatimonadota, and Chloroflexi. Among them, the abundance of Actinobacteria and Cyanobacteria decreased significantly during the culture process, the abundance of Actinobacteria decreased from 33.9% to 2.8%, and the abundance of Cyanobacteria decreased from 7.1% to 0.5%. The abundance of Firmicutes increased significantly from 0.7% to 8.3%. At the genus level (Figure 3B), the most dominant genus changed as the culture progressed. On day 2, the most dominant genus was Candidatus aquiluna (22.5%); on days 30 and 60, Marivita had higher abundance (15.1% and 8.3%), and on day 90, Pseudomonas had the highest abundance (31.2%). The microbial abundance in water at different sampling times was compared using LEfSe analysis (Figure 3C). The water samples from days 2, 30, 60, and 90 exhibited enrichment of a total of 14, 6, 2, and 5 biomarkers, respectively. On day 2, the biomarkers included Actinobacteria, Cyanobacteria, Alcaligenaceae, and Idiomarinaceae. On day 30, the biomarkers included Sphingobacteriales, Cytophagales, Marivita, and Donghicola. On day 60, the biomarkers included Bacteroidota. On day 90, the biomarkers included Saccharimonadia and Gammaproteobacteria.

3.4. Temporal Dynamics of Microorganisms in Sediment

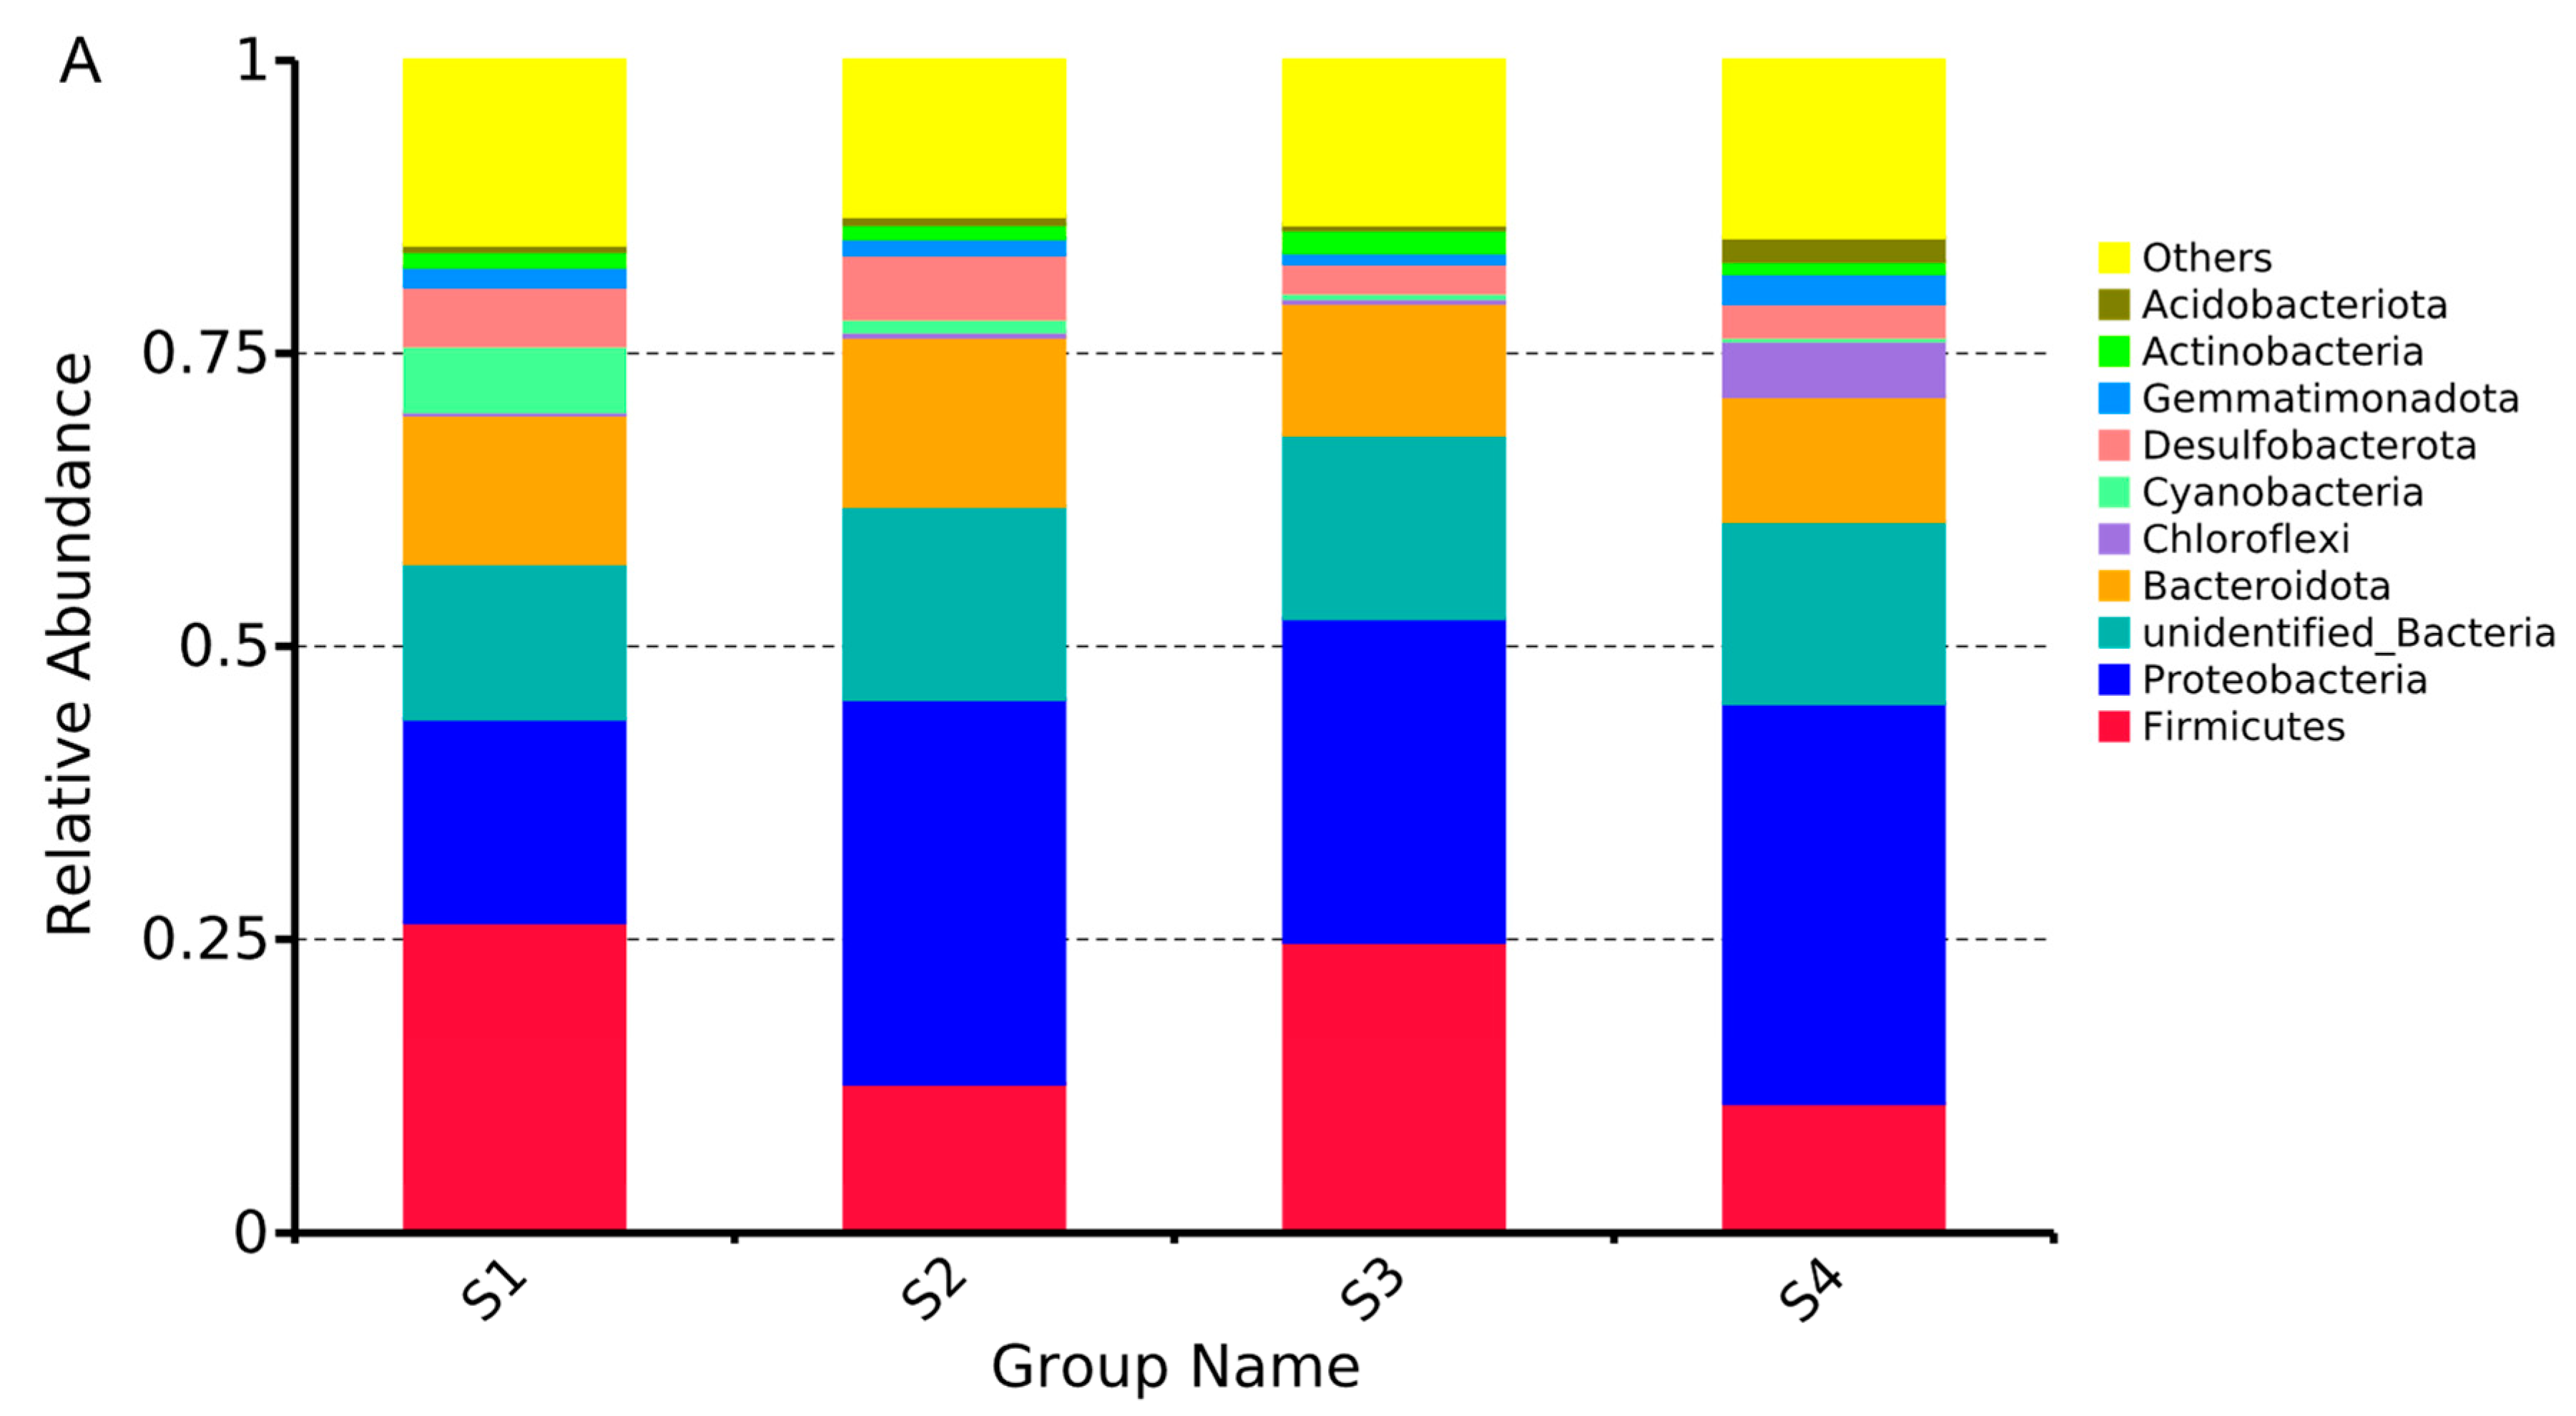
To understand the trends of sediment-dwelling microbial communities of L. vannamei under greenhouse pond culture conditions, the relative abundance of microorganisms at different culture stages was analyzed. The results show that at the phylum level (Figure 4A), the top-ten most dominant phyla in sediment were Firmicutes, Proteobacteria, unidentified Bacteria, Bacteroidota, Chloroflexi, Cyanobacteria, Desulfobacterota, Gemmatimonadota, Actinobacteria, and Acidobacteriota. Among them, Firmicutes and Proteobacteria showed large fluctuations, with abundances ranging from 11.0% to 26.4% and 17.4% to 34.1%, respectively. At the genus level (Figure 4B), on day 30, the most dominant genus shifted from Faecalibacterium (3.0%) to Thioalkalispira sulfurivermis (4.3%), which remained the most abundant phylum from day 60 (5.8%) to 90 (10.0%). The abundances of Marinobacter were found to be higher on days 2 and 30 during the culture, accounting for 2.2% and 9.3%, respectively. However, its abundance subsequently decreased to 0.5% at both the 60-day and 90-day time points. The microbial abundances in the sediments at different sampling times were compared using LefSe analysis. As shown in the figure (Figure 4C), the sediment samples from days 2, 30, 60, and 90 exhibited enrichment of a total of four, three, five, and eight biomarkers, respectively. On day 2, the biomarkers included Cyanobacteria. On day 30, the biomarkers included Marinobacteraceae. On day 60, the biomarkers included Erysipelotrichales, Enterobacterales, and unidentified Gammaproteobacteria. On day 90, the biomarkers included Flavobacteriaceae, Chitinophagales, Listeriaceae, and Gammaproteobacteria.

3.5. Temporal Dynamics of Microorganisms in Gut

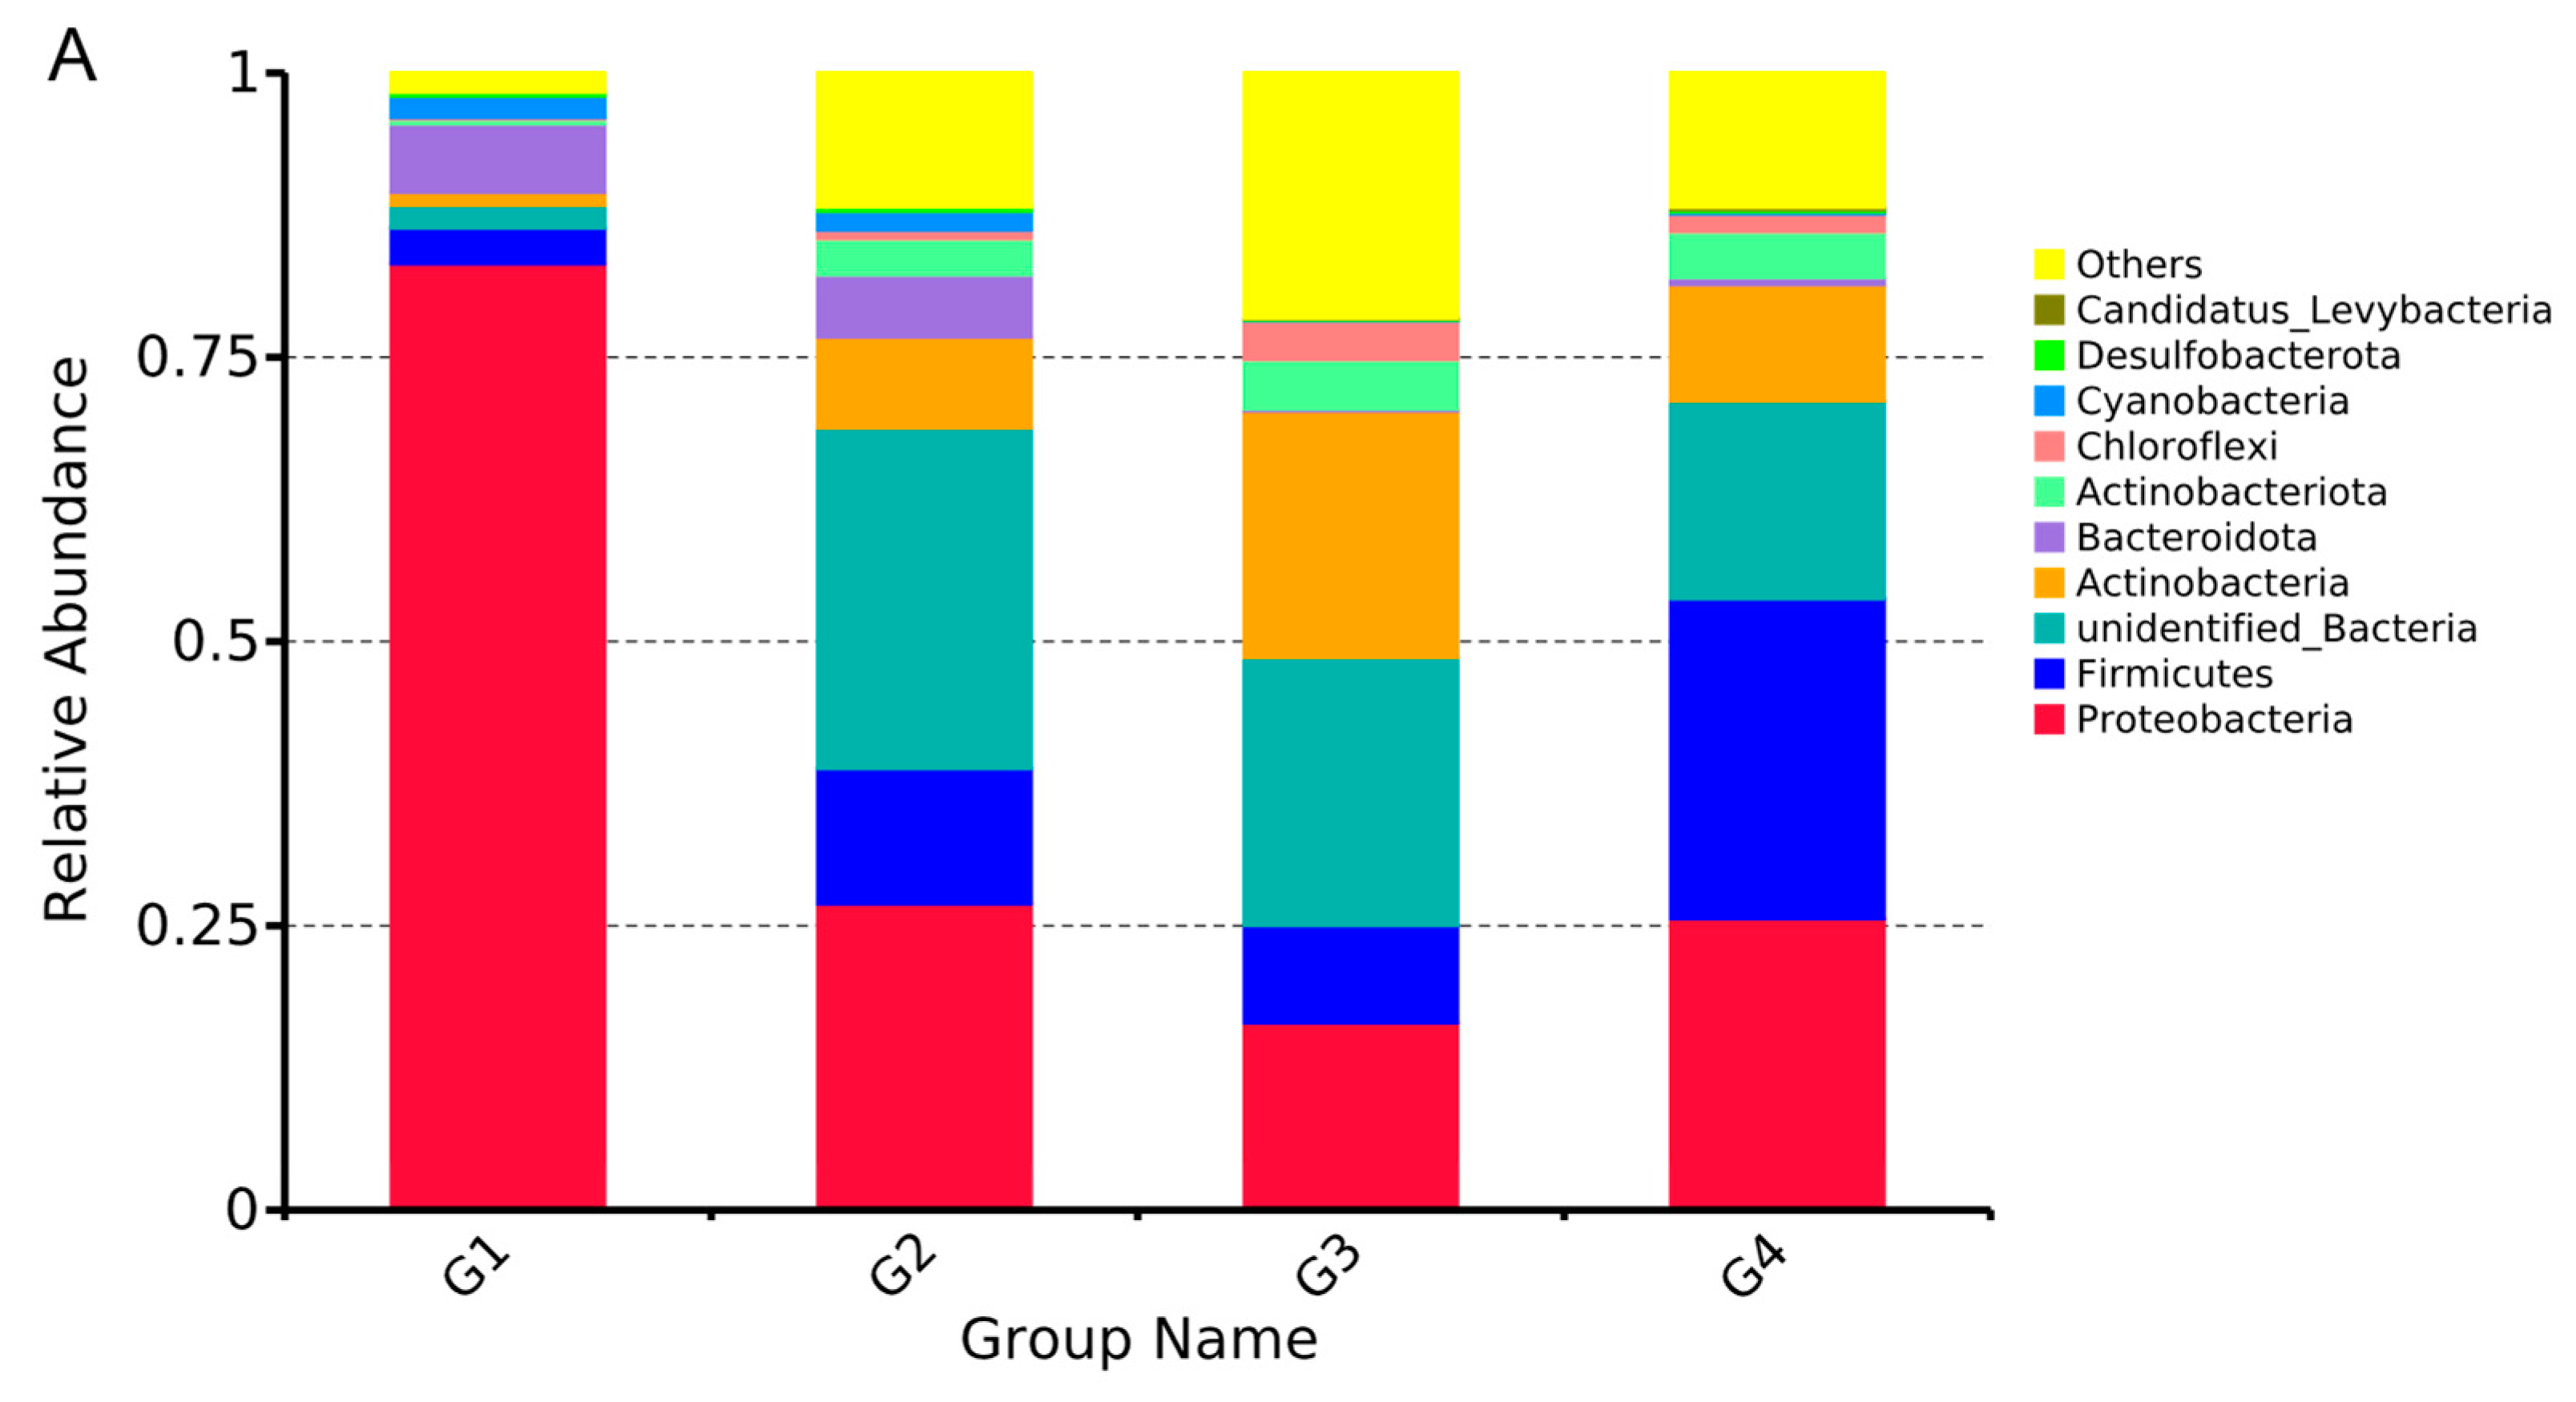
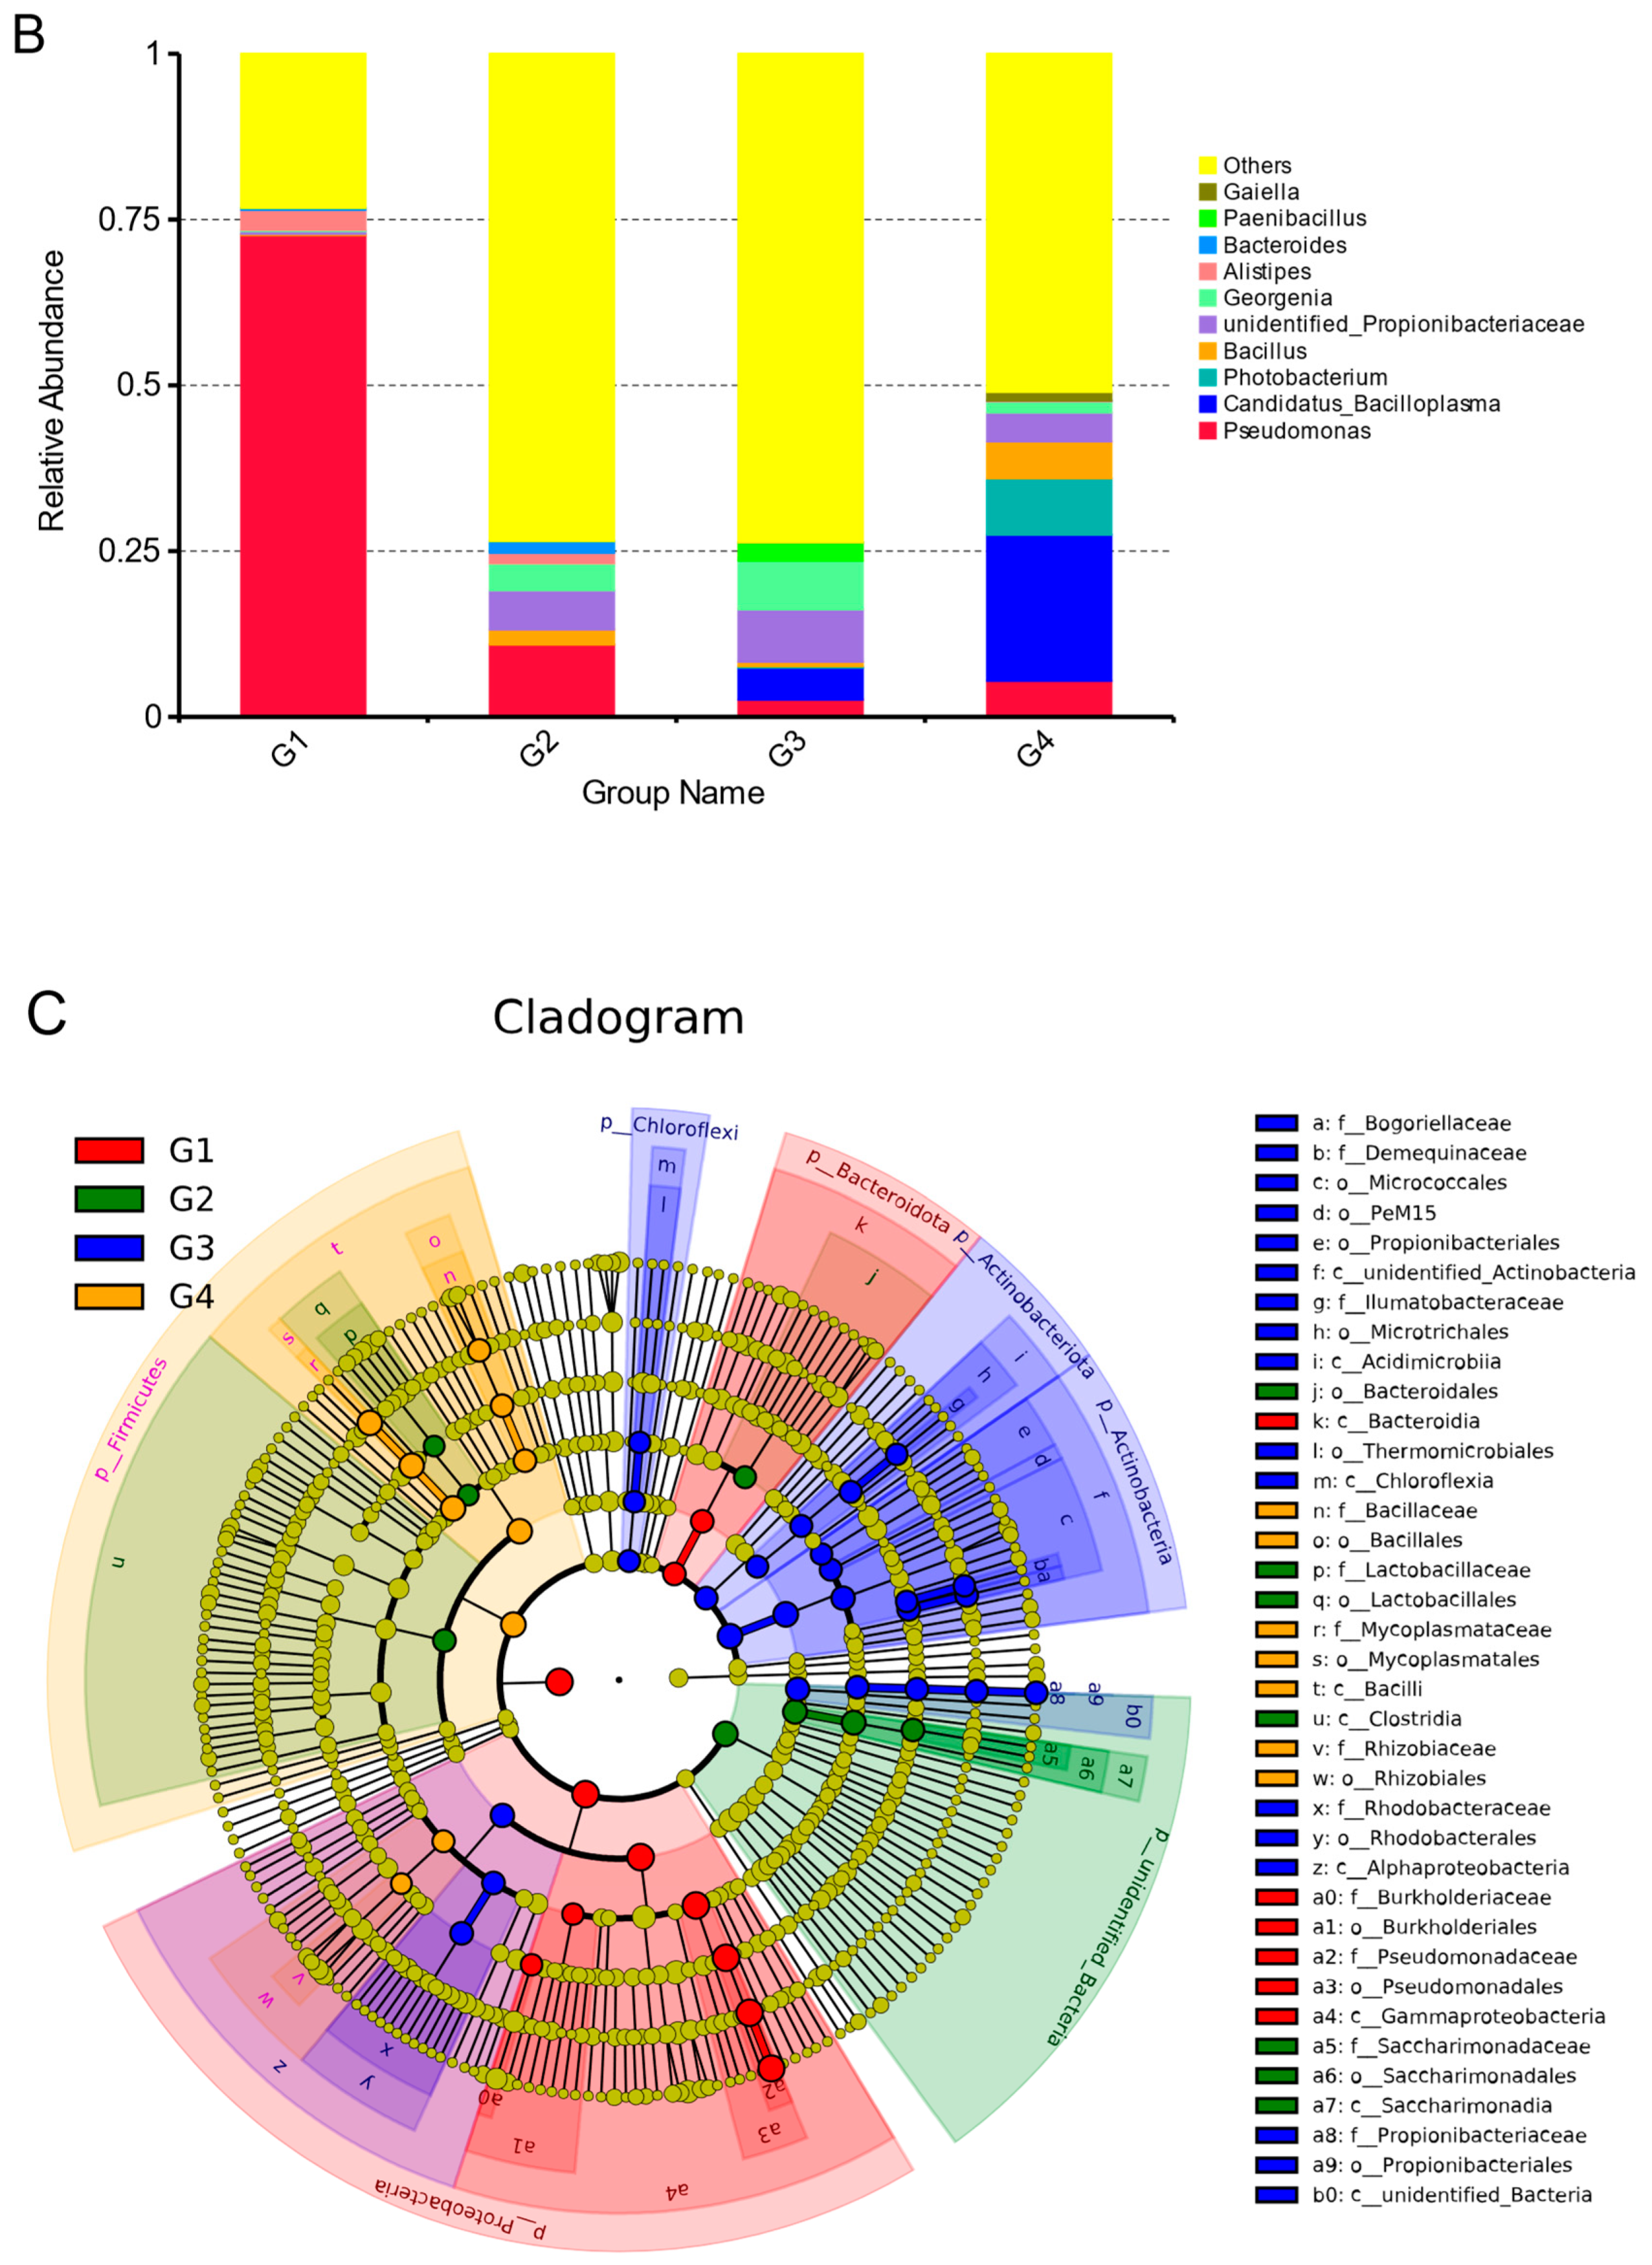
Species annotation analysis was performed on the gut microorganisms of shrimp at the phylum and genus levels. The results show that at the phylum level (Figure 5A), the top-ten most dominant phyla in the gut were Proteobacteria, Firmicutes, unidentified Bacteria, Actinobacteria, Bacteroidota, Actinobacteriota, Chloroflexi, Cyanobacteria, Desulfobacterota, and Candidatus levybacteria. Among them, the abundance of Proteobacteria and Bacteroidota decreased significantly on days 30 and 60, respectively, with abundances ranging from 83.22% to 26.9% and 5.5% to 0.2%. At the genus level (Figure 5B), on days 2 and 30, the most dominant genus was Pseudomonas (72.7% and 10.9%); unidentified Propionibacteriaceae and Gerogenia had higher abundance (7.9% and 7.4%) on day 60, and on day 90, Candidatus bacilloplasma had the highest abundance (22.1%). The abundance of Bacillus increased from 0.2% on day 2 to 5.5% on day 90. Microbial abundance in the gut at different sampling times was analyzed using LEfSe analysis for comparison (Figure 5C). The gut samples from day 2, 30, 60, and 90 exhibited enrichment of a total of 11, 8, 25, and 10 biomarkers, respectively. On day 2, the biomarkers included Proteobacteria and Bacteroidota. On day 30, the biomarkers included Clostridia and Lactobacillales. On day 60, the biomarkers included Actinobacteria, Actinobacteriota, Chloroflexi, and Alphaproteobacteria. On day 90, the biomarkers included Firmicutes and Rhizobiales.

3.6. Correlations between Bacterial Communities and Environmental Factors

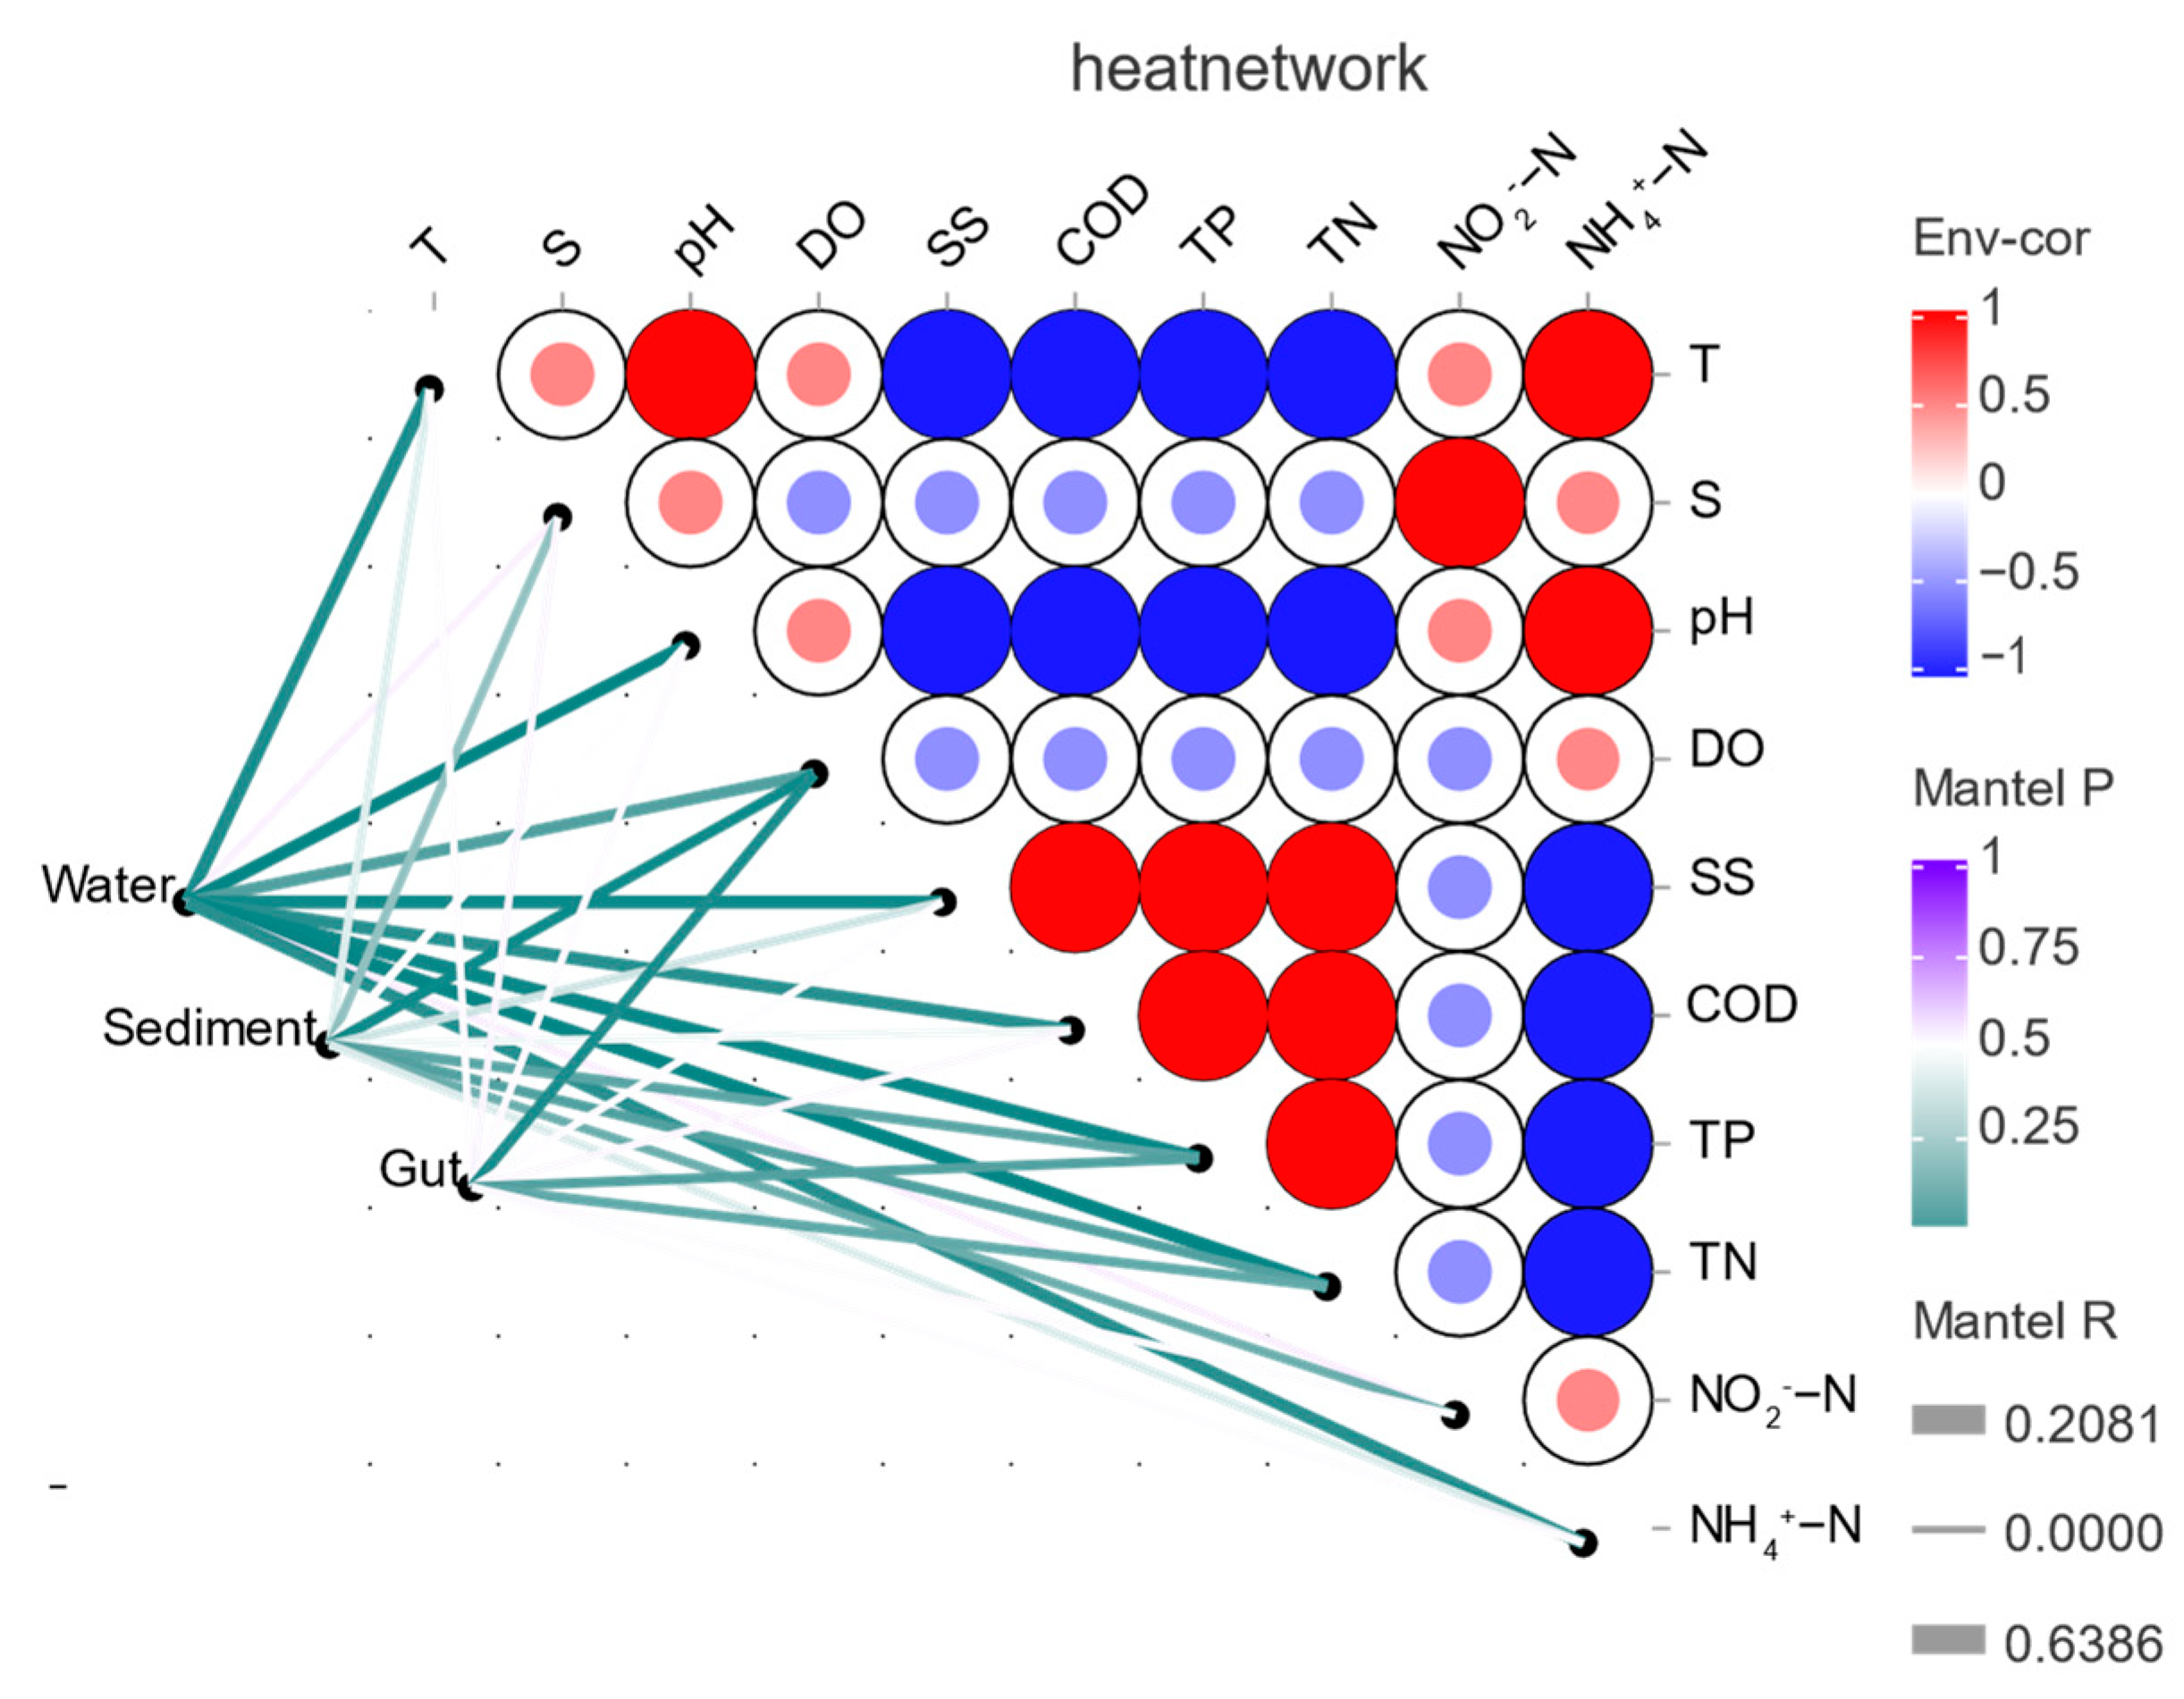
Correlation studies on environmental factors affecting microorganisms in water, sediment, and the gut were carried out using dynamic network heat map analysis (Figure 6). Water, sediment, and gut microorganisms were significantly correlated with T, pH, TP, and TN (p < 0.01). Water microorganisms also correlated highly significantly (p < 0.01) with DO and significantly with COD and NO2-N (p < 0.05). Sediment microorganisms correlated extremely significantly with COD (p < 0.01) and significantly with DO (p < 0.05). Gut microorganisms were also extremely significantly correlated with DO and COD (p < 0.01) and significantly correlated with NH4+-N and NO2-N (p < 0.05).

3.7. Source Tracker Analysis

Microbial sources in the gut at different times were analyzed using Source Tracker (Figure 7). The results show that culture time significantly affected the proportion of water and sediment sources in the microbial composition of the gut. The proportion of microorganisms originating from the water microorganisms increased gradually during the culture process, rising from 0.52% on day 2 to 29.69% on day 90. The proportion of sediment microorganisms increased and then decreased, reaching a maximum value of 8.83% on day 60 and decreasing to 1.0% on day 90.

3.8. Analysis of Community Construction Mechanism

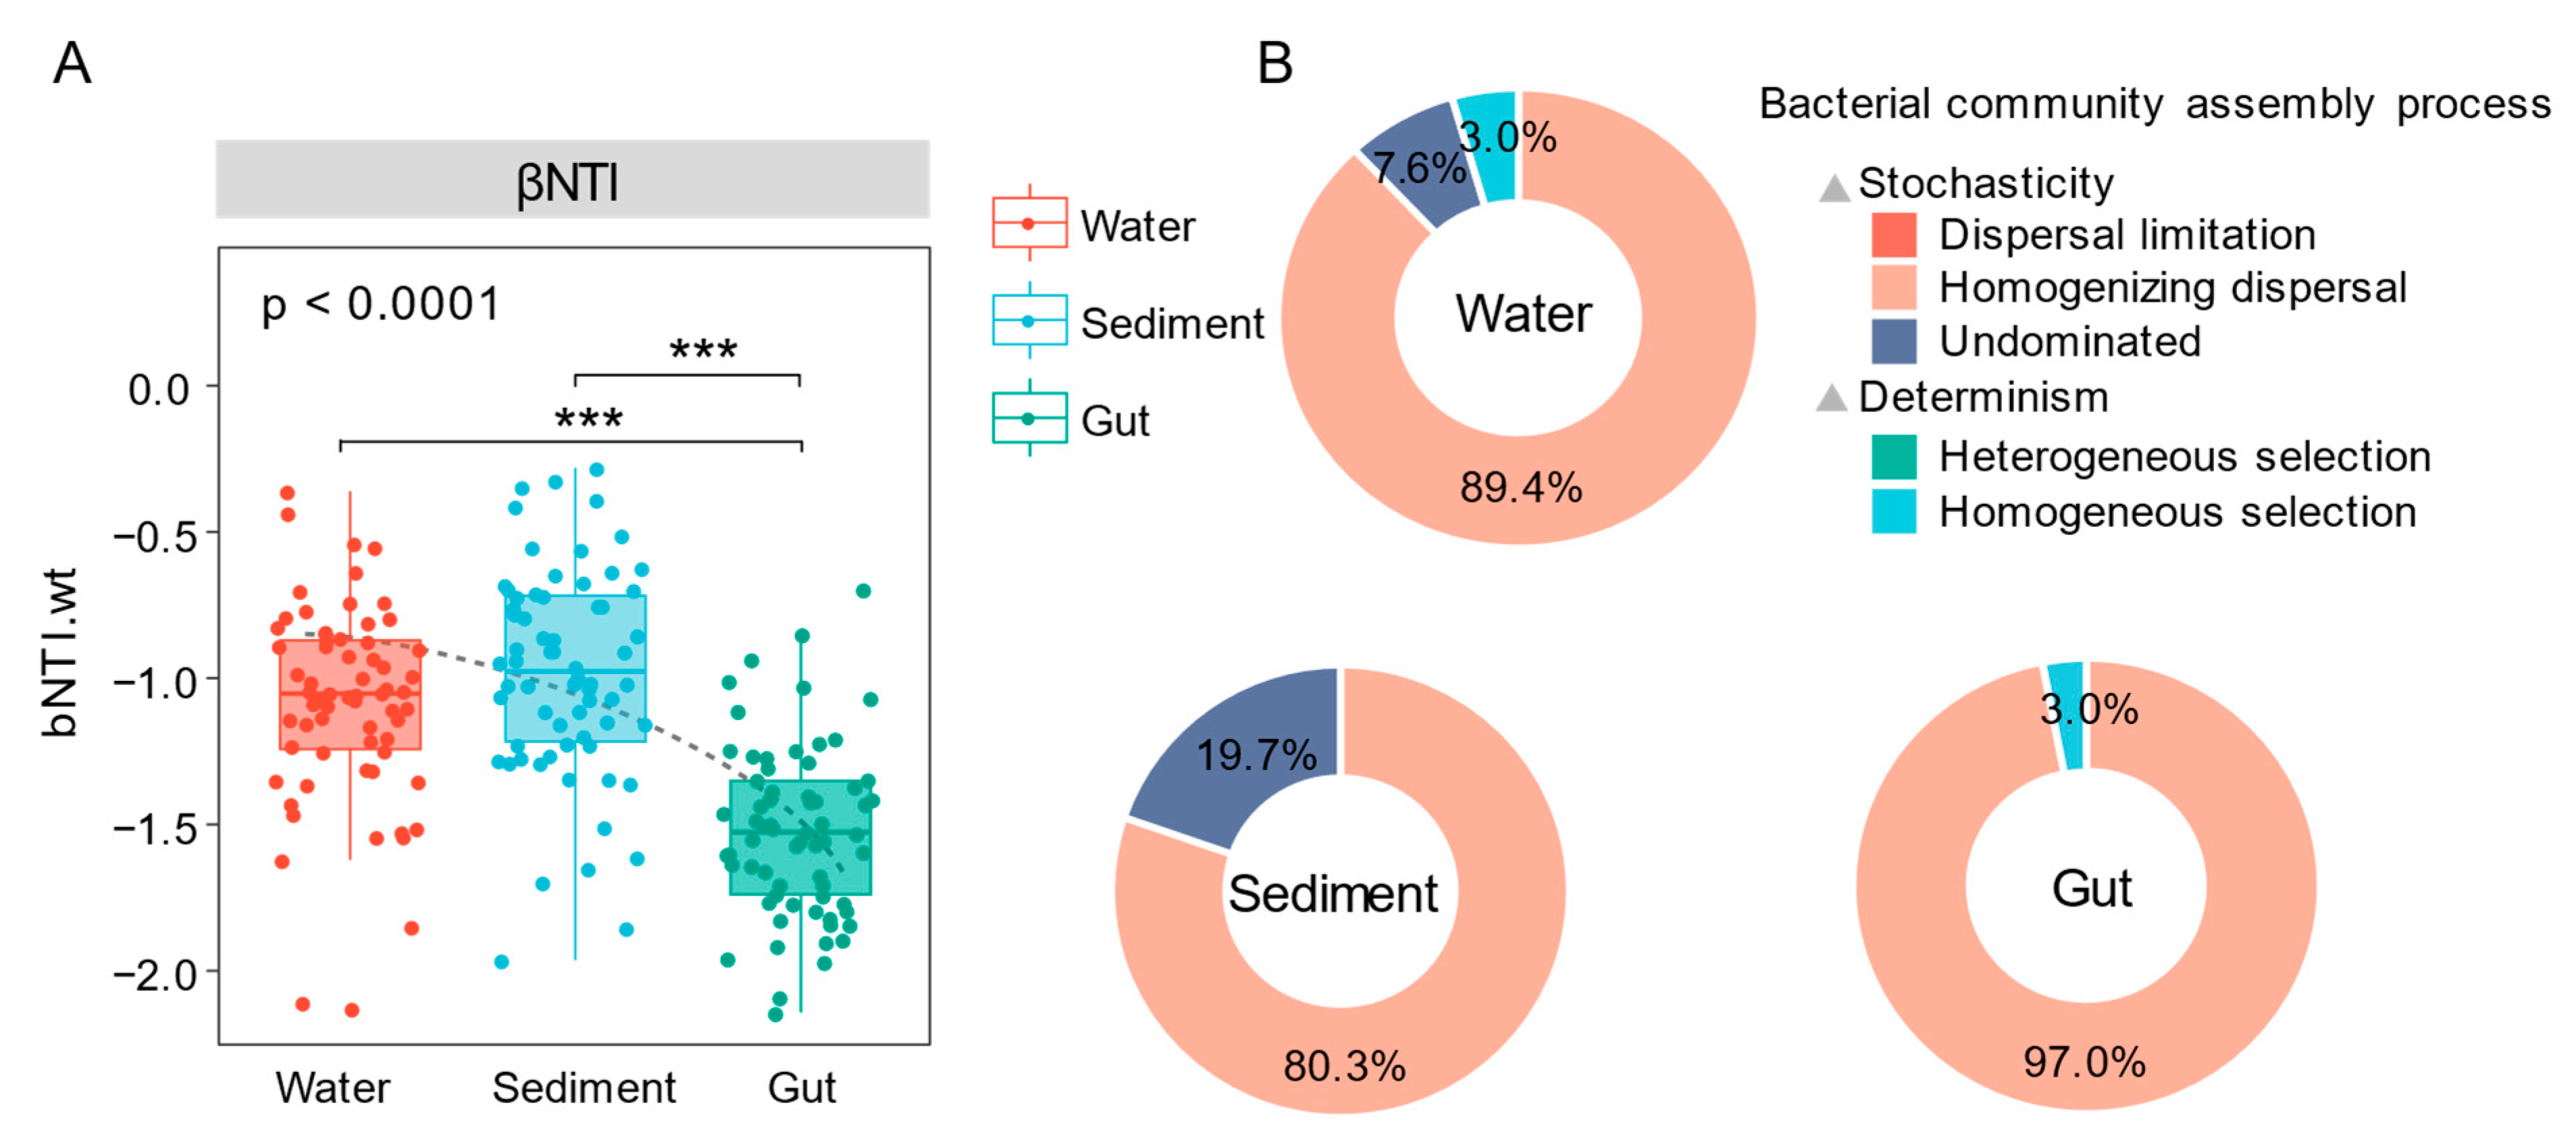
By calculating the values of βNTI and RCbray for the null model (Figure 8), it was found that stochastic processes played a major role in the construction of the bacterial communities of the water, sediment, and gut microorganisms (97%) microbial communities. In the construction of water microbial communities, homogenizing dispersal and undominated stochastic processes accounted for 89.4% and 7.6%, respectively, while homogeneous selection as the deterministic process accounted for only 3%. In the construction of sediment microbial communities, homogenizing dispersal and undominated stochastic processes accounted for 80.3% and 19.7%, respectively. In the construction of gut microbial communities, the homogenizing dispersal of stochastic processes accounted for 97%, while the homogeneous selection of deterministic processes accounted for 3%.

4. Discussion

4.1. Analysis of Dynamic Changes of Gut Microbial Community

Gut microorganisms play an important role in the aquaculture environment, and determining the dynamic changes in gut microbial community structure provides reliable and fundamental data revealing the relationship between bacteria and their hosts [19,20]. In this study, it was found that the gut microbial community in ponds under greenhouse farming conditions showed obvious successional characteristics at the genus level. On days 2 and 30, the most dominant genus was Pseudomonas; unidentified Propionibacteriaceae and Gerogenia had higher abundances on day 60, and on day 90, Candidatus bacilloplasma exhibited the highest abundance. Georgenia is a denitrifying phosphorous-accumulating bacterium that can use nitrate as its sole nitrogen source and utilize carbon sources to remove nitrate and total phosphorus concentrations from the environment, and it is speculated that the increase in abundance may be related to the accumulation of nitrogen compounds in the culture environment [21,22]. Candidatus Bacilloplasma is commonly found in the intestinal tract of crustaceans, and considered one of the beneficial gut bacteria [23]. Its main function may be related to digestion, and it can be used as a potential taxonomic indicator for assessing the health status of L. vannamei, as well as a central hub in the network of multiple crustacean gut microbial interactions. In addition, an increase in its abundance may be associated with an increase in the growth and digestive capacity of shrimp [24,25,26]. Under greenhouse farming conditions, among the gut microorganisms present, there is a substantial abundance of beneficial bacteria, particularly Bacillus, which progressively proliferates throughout the culture process. This augmented abundance of Bacillus can be explained via the integration of dietary factors. Also, this may be due, to some extent, to the fact that greenhouse culture belongs to autotrophic biofloc farming [6,27]. Some studies have found that a similar community composition exists in biofloc culture systems, such as Proteobacteria and Bacillus. Due to its special environmental conditions and mode of operation, the biofloc culture system seems to provide a suitable environment for the growth and reproduction of Bacillus [28]. In the middle and late stages of greenhouse culture, the biomass and activity of shrimps in the pond increased, accompanied by continuous bottom aeration, as a result of which the water was turbidified. Bioflocs are naturally formed in the water, increasing the surface area for beneficial bacteria to attach to. Shrimps ingest bioflocs in the water during growth, allowing bacteria in the environment to enter the gut, which is very beneficial to shrimps. A variety of Bacillus species were found to have the ability to enhance antioxidant components, alleviate oxidative stress, and increase the level of oxidative stress tolerance [29,30]. The substantial colonization of Bacillus in the shrimp gut under greenhouse farming conditions plays a crucial role in enabling shrimp to withstand high nitrogen and nitrite levels. Greenhouse farming potentially creates an environment that is more conducive to the growth and functionality of probiotics, thereby offering advantages in terms of promoting healthy shrimp growth and disease resistance [31,32].

4.2. Analysis of the Influence Factors of the Gut Microorganisms

The microbial ecology in aquaculture systems is complex and dynamic, and there is a close relationship between the gut bacterial community composition and changes in the aquaculture environment and surrounding microorganisms [11]. In this study, the changes in gut microbes were significantly correlated with a variety of environmental factors, such as COD, TN, TP, NO2-N and NH4+-N. These environmental factors are all related to the degree of eutrophication of water [33]. So, these high correlations may be related to the continuous accumulation of nitrogen and phosphorus caused by the continuously high amounts of high-protein feed residues and fecal accumulation in the shrimp ponds [34]. Eutrophication is an important limiting factor in intensive aquaculture systems, with high ammonia and nitrite levels severely affecting the growth and survival of shrimp [35,36]. In this study, the levels of NO2-N and NH4+-N peaked and started to decrease on days 60 and 15, respectively, during shrimp culturing. This may be related to the elevated abundance of Marivita and Pseudomonas in the water at 30 and 90 days. Marivita is associated with the uptake and metabolism of carbon, nitrogen, and phosphorus inorganic or organic compounds, and its increased abundance is usually accompanied by phytoplankton outbreaks or organic-rich environments [37,38]. With the fixation of carbon and nitrogen by microorganisms and phytoplankton, the increase in residual baited feces, and the gradual accumulation of organic matter, the abundance of Marivita gradually increased. As it enters the late exponential stage of microbial growth, Marivita begins to compete with algae for nutrients such as inorganic nitrogen [39]. Pseudomonas plays an important role in the nitrogen cycle and has the ability to remove nitrite nitrogen, among other things [40,41,42]. Zhang et al. [43] found that a Pseudomonas strain had a powerful removal ability in relation to nitrite in a high-nitrite environment, with a removal rate of up to 100%, and the decline in nitrite content observed in the later stage might be related to the increase in Pseudomonas abundance. Microorganisms in the environment have an indirectly positive effect on gut microorganisms and healthy shrimp growth by improving water quality.
Also, changes in gut microbes are directly influenced by environmental microbes. The Source Tracker analysis showed that with the increase in breeding time under greenhouse farming conditions, the proportion of microorganisms from water and sediment in the gut increased significantly. In the process of culturing, the abundance of Cyanobacteria in water and sediment gradually reduced, and the abundance of Cyanobacteria in the gut also decreased, which may be related to temperature and the addition of beneficial bacteria and algae [44]. Cyanobacteria tend to precipitate the deterioration of water quality, the formation of harmful algal blooms, and the production of various toxins posing a serious threat to cultured organisms [45,46]. Reducing Cyanobacteria numbers in water and sediment during greenhouse farming changes the composition of shrimp gut microbes in favor of healthy shrimp growth. The results show that the microorganisms in the shrimp gut could change according to the microorganisms dispersed in the surrounding environment, and this phenomenon was conducive to improving the effect of applying probiotics [47].

4.3. Potential Mechanisms of Community Construction

Investigating the community-building mechanisms of water, sediment, and gut microbes of L. vannamei under greenhouse farming conditions is crucial to understanding the microbiological changes in culture ponds. The results of existing studies suggest that, for most aquatic ecosystems (e.g., lakes), deterministic processes play a major role in shaping the microbial community structure in water or sediment [48]. Yan et al. [48] found that water microorganisms in the eutrophic Lake Donghu in Wuhan were mainly driven by deterministic processes. Wang et al. [49] found that the heterogeneous selection had a more important effect on bacterial community assembly in soil and lake sediments. At the same time, stochastic processes play a dominant role in the composition of microbial communities in the guts of aquatic animals. Burns et al. [15] found that stochastic processes play a decisive role in the guts of zebrafish. In this study, stochastic processes were found to have a significant impact on both environmental and gut microbial communities in ponds under greenhouse farming conditions, contributing 97% to the water and gut microbes, with deterministic processes contributing only 3%. This may be related to the degree of eutrophication of the water or the fact that nutrient enrichment affected the composition of and changes in microorganisms. Most studies have shown that deterministic and stochastic processes respond to the degree of nutrient enrichment of water, with deterministic processes playing a dominant role in the community assembly of microorganisms at low and moderate eutrophication levels [17]. But these processes are replaced mainly by stochastic processes when eutrophication indicators are extremely high [50]. Compared with lakes and other aquatic systems, the aquaculture model involves a higher degree of eutrophication. Stochastic processes provide empty ecological niches for bacteria, increasing the unpredictability of a community [51]. Therefore, attention should be paid to the supplementation of beneficial bacteria in aquaculture activities and reducing eutrophication in water.

5. Conclusions

Through high-throughput sequencing analyses, this study delved into the dynamic patterns of the environmental and gut microorganisms of L. vannamei under greenhouse farming conditions and further investigated the mechanisms of gut microbial community construction. The results show that changes in gut microbes were closely related to changes in eutrophication indicators (e.g., TN, TP, NO2-N, and NH4+-N) as well as environmental microbes (water and sediment). There is a high abundance of beneficial microbiota, such as Bacillus, in the gut of L. vannamei. At the same time, bacteria with nitrogen removal and phosphorus removal capabilities, such as Marivita and Pseudomona, are present in water. They help to maintain the stability of the aquatic environment, further contributing to the healthy growth of shrimp.

Author Contributions

H.L., S.G., L.W., W.S. and X.W. designed the study. Q.J. and L.W. performed the experiment. H.L., S.G., L.W. and X.W. analyzed the data. H.L. and S.G. wrote the manuscript. All authors reviewed the manuscript. All authors have read and agreed to the published version of the manuscript.

Funding

This research was funded by Jiangsu Agricultural Industry Technology System (JATS [2023]154, 380), Jiangsu Agricultural Science and Technology Innovation Fund (CX(22)3083).

Institutional Review Board Statement

All samples and methods used in the present study were conducted in accordance with the Laboratory Animal Management Principles of China. All experimental protocols were approved by The Laboratory Animal Ethic Committee of the Jiangsu Institute of Marine Fisheries (Animal Ethics No. 2022-3-1). All shrimp handling was performed under ice anesthesia.

Informed Consent Statement

Not applicable.

Data Availability Statement

The data presented in this study are available through the first author.

Conflicts of Interest

The authors declare that they have no known competing financial interests or personal relationships that could have appeared to influence the work reported in this paper.

References

  1. He, P.; Wei, P.; Zhang, B.; Zhao, Y.; Li, Q.; Chen, X.; Zeng, D.; Peng, M.; Yang, C.; Peng, J. Identification of microRNAs involved in cold adaptation of Litopenaeus vannamei by high-throughput sequencing. Gene 2018, 677, 24–31. [Google Scholar] [CrossRef]
  2. Liu, H.Y.; Chen, G.F.; Li, L.X.; Lin, Z.X.; Tan, B.P.; Dong, X.H.; Yang, Q.H.; Chi, S.Y.; Zhang, S.; Zhou, X.Q. Supplementing artemisinin positively influences growth, antioxidant capacity, immune response, gut health and disease resistance against Vibrio parahaemolyticus in Litopenaeus vannamei fed cottonseed protein concentrate meal diets. Fish Shellfish Immunol. 2022, 131, 105–118. [Google Scholar] [CrossRef]
  3. FAO. The State of World Fisheries and Aquaculture 2022. Towards Blue Transformation; Food and Agriculture Organization of the United Nations: Rome, Italy, 2022. [Google Scholar]
  4. Ma, Z.; Wan, R.; Song, X.; Gao, L. The effect of three culture methods on intensive culture system of pacific white shrimp (Litopenaeus vannamei). J. Ocean Univ. China 2013, 12, 434–440. [Google Scholar] [CrossRef]
  5. Chang, Z.-Q.; Neori, A.; He, Y.-Y.; Li, J.-T.; Qiao, L.; Preston, S.I.; Liu, P.; Li, J. Development and current state of seawater shrimp farming, with an emphasis on integrated multi-trophic pond aquaculture farms, in China—A review. Rev. Aquac. 2020, 12, 2544–2558. [Google Scholar] [CrossRef]
  6. Dou, Y.; Wen, M.; Shen, H.; Zhang, S.; Jiang, G.; Qiao, Y.; Cheng, J.; Cao, X.; Wan, X.; Sun, X. Intestinal microbiota differences in Litopenaeus vannamei shrimp between greenhouse and aquaponic rearing. Life 2023, 13, 525. [Google Scholar] [CrossRef]
  7. Xu, W.; Cao, Y.; Fan, P.; Hu, X.; Xu, Y.; Su, H.; Yu, W.; Wen, G.; Guangdong, S. Current Situation and Development Direction of Shrimp Engineering Culture in China. Hans J. Agric. Sci. 2019, 9, 938–944. [Google Scholar]
  8. Zhou, L.; Qu, Y.; Qin, J.G.; Chen, L.; Han, F.; Li, E. Deep insight into bacterial community characterization and relationship in the pond water, sediment and the gut of shrimp (Penaeus japonicus). Aquaculture 2021, 539. [Google Scholar] [CrossRef]
  9. Liu, Q.; Gao, Y.; Wang, C.; Zeng, Y.; Lai, Z. Proportions of Pacific white shrimp, Litopenaeus vannamei, gut microbiota from ambient microbiota increased with aquaculture process. J. World Aquac. Soc. 2022, 54, 982–993. [Google Scholar] [CrossRef]
  10. Wu, J.Y.; Yan, M.C.; Sang, Y.; Li, F.; Luo, K.; Hu, L.H. Correlation between intestinal microbiota and growth of white shrimp (Litopenaeus vannamei). Appl. Ecol. Environ. Res. 2021, 19, 4993–5005. [Google Scholar] [CrossRef]
  11. Huang, F.; Pan, L.; Song, M.; Tian, C.; Gao, S. Microbiota assemblages of water, sediment, and intestine and their associations with environmental factors and shrimp physiological health. Appl. Microbiol. Biotechnol. 2018, 102, 8585–8598. [Google Scholar] [CrossRef]
  12. Zhang, M.; Pan, L.; Huang, F.; Gao, S.; Su, C.; Zhang, M.; He, Z. Metagenomic analysis of composition, function and cycling processes of microbial community in water, sediment and effluent of Litopenaeus vannamei farming environments under different culture modes. Aquaculture 2019, 506, 280–293. [Google Scholar] [CrossRef]
  13. Van Der Gast, C.J.; Ager, D.; Lilley, A.K. Temporal scaling of bacterial taxa is influenced by both stochastic and deterministic ecological factors. Environ. Microbiol. 2008, 10, 1411–1418. [Google Scholar] [CrossRef] [PubMed]
  14. Zhou, J.; Ning, D. Stochastic community assembly: Does it matter in microbial ecology? Microbiol. Mol. Biol. Rev. 2017, 81, e00002-17. [Google Scholar] [CrossRef] [PubMed]
  15. Burns, A.R.; Stephens, W.Z.; Stagaman, K.; Wong, S.; Rawls, J.F.; Guillemin, K.; Bohannan, B.J. Contribution of neutral processes to the assembly of gut microbial communities in the zebrafish over host development. ISME J. 2016, 10, 655–664. [Google Scholar] [CrossRef] [PubMed]
  16. Holt, C.C.; van der Giezen, M.; Daniels, C.L.; Stentiford, G.D.; Bass, D. Spatial and temporal axes impact ecology of the gut microbiome in juvenile European lobster (Homarus gammarus). ISME J. 2020, 14, 531–543. [Google Scholar] [CrossRef] [PubMed]
  17. Yang, W.; Zheng, C.; Zheng, Z.; Wei, Y.; Lu, K.; Zhu, J. Nutrient enrichment during shrimp cultivation alters bacterioplankton assemblies and destroys community stability. Ecotoxicol. Environ. Saf. 2018, 156, 366–374. [Google Scholar] [CrossRef] [PubMed]
  18. Fang, Y.; Li, H.; Wang, L.-B.; Wan, X.; Shi, W.-J.; Yang, Z.-Y.; Jiang, Q.; Shen, H.; Hu, R.-H.; Guan, X.-P. Study on bacterial community structure in rearing water in small green-house of Litopenaeus vannamei. South China Fish. Sci. 2023, 19, 29–41. [Google Scholar]
  19. Wang, C.; Zhou, Y.; Lv, D.; Ge, Y.; Li, H.; You, Y. Change in the intestinal bacterial community structure associated with environmental microorganisms during the growth of Eriocheir sinensis. MicrobiologyOpen 2019, 8, e00727. [Google Scholar] [CrossRef] [PubMed]
  20. Angthong, P.; Chaiyapechara, S.; Rungrassamee, W. Shrimp microbiome and immune development in the early life stages. Dev. Comp. Immunol. 2023, 147, 104765. [Google Scholar] [CrossRef]
  21. Kaur, H.; Setia, H.; Bhatia, R. Manoeuvering amid nanoparticle overload: A microbial perspective. Mater. Today Proc. 2023, 78, 804–808. [Google Scholar] [CrossRef]
  22. Rajta, A.; Setia, H.; Shukla, S.; Bhatia, R. Heterotrophic aerobic denitrification by novel bacterium Georgenia daeguensis ARB2 for treatment of nitrate contaminated waters. Int. J. Environ. Sci. Technol. 2022, 19, 3133–3144. [Google Scholar] [CrossRef]
  23. Yang, J.; Zhang, Q.; Zhang, T.; Wang, S.; Hao, J.; Wu, Z.; Li, A. Comparative Analysis of the Symbiotic Microbiota in the Chinese Mitten Crab (Eriocheir sinensis): Microbial Structure, Co-Occurrence Patterns, and Predictive Functions. Microorganisms 2023, 11, 544. [Google Scholar] [CrossRef] [PubMed]
  24. Foysal, M.J.; Fotedar, R.; Tay, C.-Y.; Gupta, S.K. Dietary supplementation of black soldier fly (Hermetica illucens) meal modulates gut microbiota, innate immune response and health status of marron (Cherax cainii, Austin 2002) fed poultry-by-product and fishmeal based diets. PeerJ 2019, 7, e6891. [Google Scholar] [CrossRef] [PubMed]
  25. Chen, W.-Y.; Ng, T.H.; Wu, J.-H.; Chen, J.-W.; Wang, H.-C. Microbiome dynamics in a shrimp grow-out pond with possible outbreak of acute hepatopancreatic necrosis disease. Sci. Rep. 2017, 7, 9395. [Google Scholar] [CrossRef] [PubMed]
  26. Wang, H.; Wan, X.; Xie, G.; Dong, X.; Wang, X.; Huang, J. Insights into the histopathology and microbiome of Pacific white shrimp, Penaeus vannamei, suffering from white feces syndrome. Aquaculture 2020, 527, 735447. [Google Scholar] [CrossRef]
  27. Chen, Z.; Li, J.; Zhai, Q.; Chang, Z.; Li, J. Nitrogen cycling process and application in different prawn culture modes. Rev. Aquac. 2024; early view. [Google Scholar] [CrossRef]
  28. Padeniya, U.; Davis, D.A.; Wells, D.E.; Bruce, T.J. Microbial interactions, growth, and health of aquatic species in biofloc systems. Water 2022, 14, 4019. [Google Scholar] [CrossRef]
  29. Tang, L.; Zeng, Z.; Zhou, Y.; Wang, B.; Zou, P.; Wang, Q.; Ying, J.; Wang, F.; Li, X.; Xu, S. Bacillus amyloliquefaciens SC06 Induced AKT–FOXO signaling pathway-mediated autophagy to alleviate oxidative stress in IPEC-J2 Cells. Antioxidants 2021, 10, 1545. [Google Scholar] [CrossRef]
  30. Tao, X.; He, J.; Lu, J.; Chen, Z.; Jin, M.; Jiao, L.; Masagounder, K.; Liu, W.; Zhou, Q. Effects of Bacillus subtilis DSM 32315 (Gutcare®) on the growth performance, antioxidant status, immune ability and intestinal function for juvenile Litopenaeus vannamei fed with high/low-fishmeal diets. Aquac. Rep. 2022, 26, 101282. [Google Scholar] [CrossRef]
  31. Goh, J.X.H.; Tan, L.T.-H.; Law, J.W.-F.; Khaw, K.-Y.; Zengin, G.; Chan, K.G.; Letchumanan, V.; Lee, L.-H.; Goh, B.-H. Probiotics: Comprehensive Exploration of the Growth Promotion Mechanisms in Shrimps. Prog. Microbes Mol. Biol. 2023, 6. [Google Scholar] [CrossRef]
  32. Amiin, M.K.; Lahay, A.F.; Putriani, R.B.; Reza, M.; Putri, S.M.E.; Sumon, M.A.A.; Jamal, M.T.; Santanumurti, M.B. The role of probiotics in vannamei shrimp aquaculture performance—A review. Vet. World 2023, 16, 638. [Google Scholar] [CrossRef]
  33. Su, J.; Ji, D.; Lin, M.; Chen, Y.; Sun, Y.; Huo, S.; Zhu, J.; Xi, B. Developing surface water quality standards in China. Resour. Conserv. Recycl. 2017, 117, 294–303. [Google Scholar] [CrossRef]
  34. Sabilu, K.; Supriyono, E.; Nirmala, K.; Jusadi, D.; Widanarni, W. Sedimentary waste nutrients, water quality and production profiles of intensive Penaeus vannamei culture reared in low salinities. Aquac. Aquar. Conserv. Legis. 2021, 14, 683–694. [Google Scholar]
  35. Junda, M. Development of intensive shrimp farming, Litopenaeus vannamei in land-based ponds: Production and management. J. Phys. Conf. Ser. 2018, 1028, 012020. [Google Scholar] [CrossRef]
  36. Han, S.; Wang, B.; Wang, M.; Liu, Q.; Zhao, W.; Wang, L. Effects of ammonia and nitrite accumulation on the survival and growth performance of white shrimp Litopenaeus vannamei. Invertebr. Surviv. J. 2017, 14, 221–232. [Google Scholar]
  37. Wei, X.; Shi, F.; Chen, Z.; Feng, J.; Zhu, L. Response of bacterial communities (Marivita, Marinobacter, and Oceanicaulis) in the phycosphere to the growth of Phaeodactylum tricornutum in different inorganic nitrogen sources. Front. Mar. Sci. 2023, 10, 1086166. [Google Scholar] [CrossRef]
  38. Lin, G.; Sun, F.; Wang, C.; Zhang, L.; Zhang, X. Assessment of the effect of Enteromorpha prolifera on bacterial community structures in aquaculture environment. PLoS ONE 2017, 12, e0179792. [Google Scholar] [CrossRef]
  39. Zheng, Q.; Lu, J.; Wang, Y.; Jiao, N. Genomic reconstructions and potential metabolic strategies of generalist and specialist heterotrophic bacteria associated with an estuary Synechococcus culture. FEMS Microbiol. Ecol. 2019, 95, fiz017. [Google Scholar] [CrossRef]
  40. He, T.; Li, Z.; Sun, Q.; Xu, Y.; Ye, Q. Heterotrophic nitrification and aerobic denitrification by Pseudomonas tolaasii Y-11 without nitrite accumulation during nitrogen conversion. Bioresour. Technol. 2016, 200, 493–499. [Google Scholar] [CrossRef]
  41. Ruan, Y.; Taherzadeh, M.J.; Kong, D.; Lu, H.; Zhao, H.; Xu, X.; Liu, Y.; Cai, L. Nitrogen removal performance and metabolic pathways analysis of a novel aerobic denitrifying halotolerant Pseudomonas balearica strain RAD-17. Microorganisms 2020, 8, 72. [Google Scholar] [CrossRef]
  42. Zhang, M.; Li, A.; Yao, Q.; Wu, Q.; Zhu, H. Nitrogen removal characteristics of a versatile heterotrophic nitrifying-aerobic denitrifying bacterium, Pseudomonas bauzanensis DN13-1, isolated from deep-sea sediment. Bioresour. Technol. 2020, 305, 122626. [Google Scholar] [CrossRef] [PubMed]
  43. Zhang, X.; Xia, Y.; Zeng, Y.; Sun, X.; Tao, R.; Mei, Y.; Qu, M. Simultaneous nitrification and denitrification by Pseudomonas sp. Y-5 in a high nitrogen environment. Environ. Sci. Pollut. Res. 2022, 29, 69491–69501. [Google Scholar] [CrossRef]
  44. Zhang, Z.; Fan, X.; Peijnenburg, W.; Zhang, M.; Sun, L.; Zhai, Y.; Yu, Q.; Wu, J.; Lu, T.; Qian, H. Alteration of dominant cyanobacteria in different bloom periods caused by abiotic factors and species interactions. J. Environ. Sci. 2021, 99, 1–9. [Google Scholar] [CrossRef] [PubMed]
  45. Sultana, S.; Awal, S.; Shaika, N.A.; Khan, S. Cyanobacterial blooms in earthen aquaculture ponds and their impact on fisheries and human health in Bangladesh. Aquac. Res. 2022, 53, 5129–5141. [Google Scholar] [CrossRef]
  46. Merel, S.; Walker, D.; Chicana, R.; Snyder, S.; Baures, E.; Thomas, O. State of knowledge and concerns on cyanobacterial blooms and cyanotoxins. Environ. Int. 2013, 59, 303–327. [Google Scholar] [CrossRef] [PubMed]
  47. Xiong, J.; Dai, W.; Li, C. Advances, challenges, and directions in shrimp disease control: The guidelines from an ecological perspective. Appl. Microbiol. Biotechnol. 2016, 100, 6947–6954. [Google Scholar] [CrossRef]
  48. Yan, Q.; Stegen, J.C.; Yu, Y.; Deng, Y.; Li, X.; Wu, S.; Dai, L.; Zhang, X.; Li, J.; Wang, C.; et al. Nearly a decade-long repeatable seasonal diversity patterns of bacterioplankton communities in the eutrophic Lake Donghu (Wuhan, China). Mol. Ecol. 2017, 26, 3839–3850. [Google Scholar] [CrossRef]
  49. Wang, X.; Ren, Y.; Yu, Z.; Shen, G.; Cheng, H.; Tao, S. Effects of environmental factors on the distribution of microbial communities across soils and lake sediments in the Hoh Xil Nature Reserve of the Qinghai-Tibetan Plateau. Sci. Total Environ. 2022, 838, 156148. [Google Scholar] [CrossRef]
  50. Zhou, J.; Deng, Y.; Zhang, P.; Xue, K.; Liang, Y.; Van Nostrand, J.D.; Yang, Y.; He, Z.; Wu, L.; Stahl, D.A. Stochasticity, succession, and environmental perturbations in a fluidic ecosystem. Proc. Natl. Acad. Sci. USA 2014, 111, E836–E845. [Google Scholar] [CrossRef] [PubMed]
  51. De Schryver, P.; Defoirdt, T.; Sorgeloos, P. Early mortality syndrome outbreaks: A microbial management issue in shrimp farming? PLoS Pathog. 2014, 10, e1003919. [Google Scholar] [CrossRef]
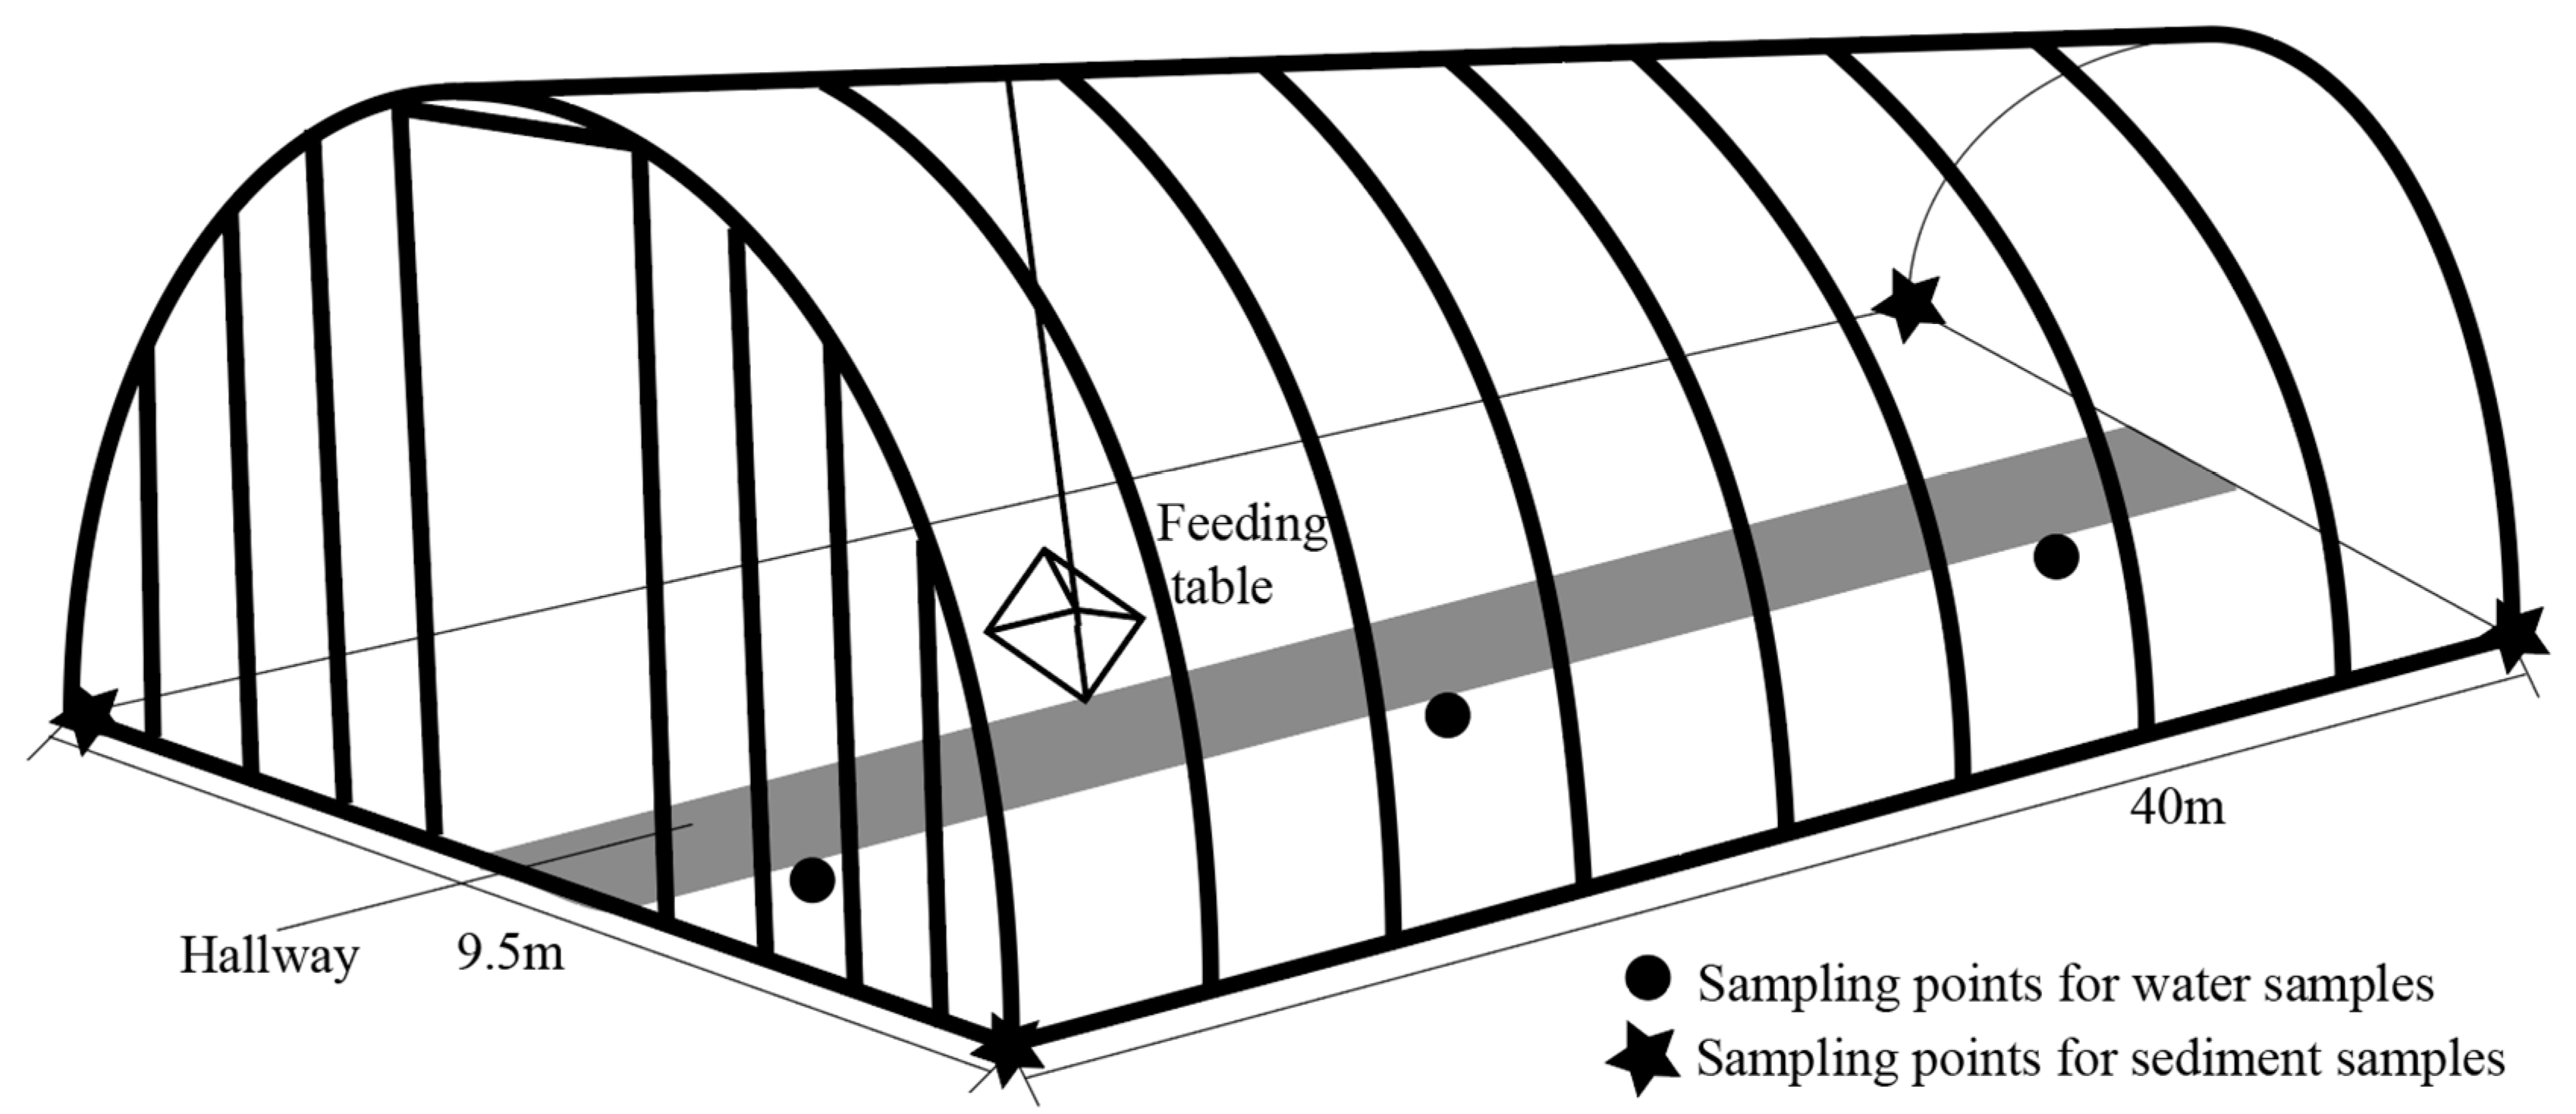
Figure 1. Sampling sites for water samples.
Fishes 09 00155 g001
Figure 2. Changes of the water quality in water of the greenhouse ponds.
Fishes 09 00155 g002
Figure 3. (A) Relative abundance of major taxa at the phylum level in water samples across different sampling times. (B) Relative abundance of major taxa at the genus level in water samples across different sampling times. (C) LEfSe analysis (LDA > 4.0) displaying the differences in water microbial communities at different sampling times. Note: W—water; 1, 2, 3, 4 represent the samples of breeding period at 2, 30, 60 and 90 days; the same below.
Fishes 09 00155 g003aFishes 09 00155 g003b
Figure 4. (A) Relative abundance of major taxa at the phylum level in sediment samples across different sampling times. (B) Relative abundance of major taxa at the genus level in sediment samples across different sampling times. (C) LEfSe analysis (LDA > 4.0) displaying the differences in sediment microbial communities at different sampling times. Note: S—sediment.
Fishes 09 00155 g004aFishes 09 00155 g004b
Figure 5. (A) Relative abundance of major taxa at the phylum level in gut samples across different sampling times. (B) Relative abundance of major taxa at the genus level in gut samples across different sampling times. (C) LEfSe analysis (LDA > 4.0) displaying the differences in gut microbial communities at different sampling times. Note: G—gut.
Fishes 09 00155 g005aFishes 09 00155 g005b
Figure 6. Environmental drivers of microbial water, sediment and gut community. Notes: The colors of the colored blocks in each box indicate the positive and negative correlation coefficients between the environmental factors, and the sizes of the colored blocks indicate the sizes of the absolute values of the correlation coefficients. The thickness of the line indicates the strength of the correlation and the color of the line indicates the degree of significance.
Fishes 09 00155 g006
Figure 7. Source Tracker analysis of contributions of water, sediment and unknown to gut communities.
Fishes 09 00155 g007
Figure 8. Null model of water, sediment and gut microorganisms. (A) |βNTI| < 2, stochastic process; |βNTI| > 2, deterministic process. (B) Proportions of stochastic and deterministic processes in different samples.
Fishes 09 00155 g008
Table 1. Sample number.
Sample NumberSample PropertiesSampling Time
W1-1, W1-2, W1-3WaterDay 2
W2-1, W2-2, W2-3WaterDay 30
W3-1, W3-2, W3-3WaterDay 60
W4-1, W4-2, W4-3WaterDay 90
S1-1, S1-2, S1-3SedimentDay 2
S2-1, S2-2, S2-3SedimentDay 30
S3-1, S3-2, S3-3SedimentDay 60
S4-1, S4-2, S4-3SedimentDay 90
G1-1, G1-2, G1-3GutDay 2
G2-1, G2-2, G2-3GutDay 30
G3-1, G3-2, G3-3GutDay 60
G4-1, G4-2, G4-3GutDay 90
Disclaimer/Publisher’s Note: The statements, opinions and data contained in all publications are solely those of the individual author(s) and contributor(s) and not of MDPI and/or the editor(s). MDPI and/or the editor(s) disclaim responsibility for any injury to people or property resulting from any ideas, methods, instructions or products referred to in the content.