Article

Growth Performance and Environmental Quality Indices and Biomarkers in a Co-Culture of the European Sea Bass with Filter and Deposit Feeders: A Case Study of an IMTA System

by
Efthimia Cotou
1,*,
Helen Miliou
2,
Evanthia Chatzoglou
2,
Eirini Schoina
3,
Nektarios Politakis
1,
Dimitra Kogiannou
1,
Eleni Fountoulaki
1,
Afrodite Androni
4,
Aggeliki Konstantinopoulou
4,
Georgia Assimakopoulou
4 and
Cosmas Nathanailides
5,6,*
1
Institute of Marine Biology, Biotechnology & Aquaculture (IMBBC), Hellenic Centre for Marine Research (HCMR), 46.7 km Athinon-Souniou Ave., P.O. Box 712, 19013 Anavyssos, Greece
2
Laboratory of Applied Hydrobiology, Faculty of Animal Science and Aquaculture, Agricultural University of Athens, 75 Iera Odos, 11855 Athens, Greece
3
Laboratory of Microbiology and Biotechnology of Foods, Department of Food Science and Human Nutrition, School of Food and Nutritional Sciences, Agricultural University of Athens, 75 Iera Odos, 11855 Athens, Greece
4
Institute of Oceanography, Hellenic Centre for Marine Research (HCMR), 46.7 km, Athinon-Souniou Ave., P.O. Box 712, 19013 Anavyssos, Greece
5
Department of Agriculture, University of Ioannina, 47100 Arta, Greece
6
Institute of Environment and Sustainable Development (IESD), University Research Center of Ioannina (URCI), 45110 Ioannina, Greece
*
Authors to whom correspondence should be addressed.
Fishes 2024, 9(2), 69; https://doi.org/10.3390/fishes9020069
Submission received: 21 December 2023 / Revised: 1 February 2024 / Accepted: 2 February 2024 / Published: 8 February 2024
(This article belongs to the Section Environment and Climate Change)

Abstract

:
This study aimed to evaluate the efficiency of an integrated multi-trophic aquaculture (IMTA) system comprising co-cultured fed fish and organic extractive species representing three distinct trophic levels as well as the impact and potential utilization of two commercially available fish feeds made up of 35% fish meal (FM) and 20% fish meal (LFM) ingredients, using a multi-indicator assessment approach. Significant alterations were observed in growth performance indicators (GPIs), water and sediment quality indices, toxicity tests and biomarkers within the IMTA system. The fish survival, weight gain (WG), and specific growth rate (SGR) were higher in the IMTA system with significantly lower feed conversion ratios (FCRs) and higher feed efficiency (FE) in comparison to the fed fish monoculture system. Yet, organic filter feeders displayed 100% survival, and increased shell growth, while deposit feeders exhibited successful survival and significant weight gain. In the comparison between FM-IMTA and LFM-IMTA, fed fish in FM-IMTA showed higher WG, SGR, and FE with lower FCR. Environmental parameters like temperature, oxygen, and nutrient concentrations fluctuated but generally improved in the IMTA system, indicating lower mesotrophic conditions. Sediment fatty acid profiles differed between systems and toxicity assessments, which suggested a lower impact in IMTA and FM-IMTA systems. The sediment microbial community displayed high similarity within IMTA systems and between FM-IMTA and LFM-IMTA. These findings underscore the potential of IMTA systems for sustainable aquaculture, emphasizing improved growth performance and reduced environmental impact, particularly when using fish meal feeds.
Key Contribution: This study demonstrates that integrated multi-trophic aquaculture (IMTA) systems that employ fish meal feed can achieve enhanced production performance and environmental sustainability compared to traditional aquaculture methods. This approach holds promise for reducing the environmental impact of aquaculture while simultaneously boosting production yields.

1. Introduction

One of the major global challenges for mankind is how to sustainably meet the demand for food and livelihoods to support the expected growing population of 9.7 billion people in 2030 [1] while facing the impacts of environmental degradation and climate change [2]. Meanwhile, the demand for fish consumption has globally increased, and aquaculture production has progressively grown [3,4]. Nowadays, aquaculture produces more fish than wild captured fishes; worldwide, aquatic species production available for human consumption constitutes 56% of the market share with an estimation to expand 14% more by 2030 [5]. It is reasonable, therefore, that aquaculture has been considered as a promising solution to support the increasing world population through the provision of food and nutrition, employment and livelihoods, and incomes from the trade of fish and seafood products [2,6,7]. In the European Union (EU), however, aquaculture production has not followed similar growth as in other parts of the world since it only accounts less than 2% of the world production [8]. In the EU, particularly in the Mediterranean, mariculture production is of substantial economic importance and has exhibited progressive growth regarding the transitional rearing of marine finfish in net cages in the last few decades. Almost 70% of mariculture production comes from Spain, France, Italy and Greece. The main culture species are the gilthead seabream (Sparus aurata) and the European sea bass (Dicentrarchous labrax), which constitutes 95% of the total finfish production in the Mediterranean [9].
However, long-established mariculture has frequently occurred at the expense of the environment, producing many environmental impacts and socioeconomic concerns that can affect its sustainability [10,11]. One of the main recognized impacts is nutrient enrichment of the water column and sediment, near and under cages, which can produce unfavorable biological and geochemical alterations [12,13,14]. These effects originate mainly from uneaten feeds, fish metabolic waste and fish fecal waste [15]. Furthermore, the quality and quantity of fish fecal waste is altered by the type of the culture system and the fish feed composition [16,17]. Hence, these unfavorable ecological consequences have prompted policy, science and industry to search for new, more eco-friendly methods and technologies for a sustainable mariculture. Since 2002, the EU fisheries policy on aquaculture has aimed to increase the production and the diversification of species as well as the product quality in order to improve the competitive position of the sector and to promote environmental, economic and social sustainability [18]. Notable progress has been made in species selection, feed composition and the development of integrated circular systems. For instance, to mitigate the environmental impacts and achieve the aims of ecosystem services, an ecosystem-responsible aquaculture practice, the integrated multi-trophic aquaculture (IMTA) concept, has been suggested as an innovative method for sustainable aquaculture development and ecosystem services [19,20,21,22,23].
In the broader context of global food security and the growing demand for seafood, IMTA emerges as a promising approach to meet these needs while minimizing the industry’s environmental impact. By adopting IMTA practices, aquaculture can play a more sustainable role in feeding the world while preserving aquatic ecosystems. IMTA integrates the co-cultivation of feeding finfish species with a balanced combination of organic components (such as suspension filter and deposit feeders) and inorganic extractive species (such as seaweed). This harmonious assembly establishes systems that offer a trifecta of benefits, encompassing environmental sustainability through biocontrol and biomitigation, economic stability via product diversification and risk reduction, and improved social acceptance through enhanced management operations [24].
In most IMTA systems, fish represent the only fed component and the only human-provided input of nutrient energy to the system. Within an IMTA system, in their role, fish provide dissolved and particulate nutrients and oxidation reduction potential, degrading compounds to the other co-cultured organisms and thus improving the income to the farmer. But the quantity and form of these nutrients depend, among other factors, on the fish species, rearing density and feed composition [16,17]. Feed composition provides probably the most obvious route of fish waste modification for the extractive organisms; conversely, other trends in the aquafeeds industry may impact the fish waste quality of an IMTA system. Formulated feed that is lost in a culture system has a great effect on water quality through decomposition [25,26] and still, fish feed contains starch and proteins that have a first-order decomposition rate of about 0.8/day [27]. This increases bioavailable nitrogenous and phosphorus compounds and CO2 concentration, while it decreases the dissolved oxygen levels and pH, resulting in lower alkalinity values of the seawater. Alkalinity is a major component of salinity in seawater as total alkalinity is positively correlated with salinity [28]. Then, the bioavailable nitrogen and phosphorus compounds along with CO2 enhance photosynthesis and in turn the production of natural food (phytoplankton). Next, organic extractive species such as the filter-feeding bivalves cultured adjacent to net fish cages reduce nutrient loadings by filtering and assimilating particulate wastes and any phytoplankton production stimulated by introduced dissolved nutrient wastes. Thus, waste nutrients rather than being lost to the environment, as in traditional monoculture, are removed upon harvest of the cultured filter-feeding bivalves.
Suspension filter feeders such as mussels and oysters (bivalves) can be included in IMTA systems. The farming of bivalves is a major activity in Europe [29]. Largely, the Mediterranean mussel Mytilus galloprovincialis continues to be the main species farmed in the Mediterranean, while the flat oyster Ostrea edulis and the Pacific oyster Crassostrea gigas have undergone a moderate development. O. edulis is a native species in the Mediterranean, while C. gigas was introduced in the European aquaculture in the late 1960s. Successful commercial suspension maricultures of those species operate in Spain, France, Greece and Italy. Bivalves’ growth and the effectiveness of the management actions for their production are monitored based on indicators such as their shell growth, weight of soft tissue and condition index (CI) [30,31]. The CI, defined as the ratio between the soft tissue dry weight and the shell dry weight, is commonly used to assess the health and the quality of bivalves for scientific and commercial purposes [30,32,33]. CI is particularly important for the quality assessment and marketing value of bivalves because the higher the proportion of tissue, the better the commercial value [34]. Therefore, farmers widely use CI as an economic indicator of market product [35]. Yet, CI is mentioned in government and industry datasets providing an ideal and cost-effective ecological indicator of bivalves’ culture performance and the selection of a suitable area for shellfish aquaculture development [36]. Studies have shown a significant correlation of CI with food availability in the site selection of bivalves farming [36,37,38,39]. Although the main food for bivalves is phytoplankton followed by bacteria, zooplankton and detritus [40,41], laboratory and field studies using stable isotopes and fatty acids as biomarkers have shown that Mediterranean mussels can ingest and assimilate organic waste from fish farms [42]. Nonetheless, some studies mention that mussels and oysters grow faster when adjusted to fish cages, while others show no or an insignificant increase in growth [43]. In the past, some researchers had ascribed these differences to the different environmental conditions and culture systems designs, while others had concluded, on the basis of models, that ambient seston concentration was the major reason for these discrepancies [44]. Later, the effectiveness of bivalves as organic extractive components in open water IMTA systems has been subjected to several constraints including current velocity, ambient seston concentration, and the organic content and concentration of particulate organic fish waste [45].
On the other hand, organic extractive species such as sea cucumbers cultivated below finfish and shellfish cultures are responsible for a significant removal of the particulate organic carbon loading to the bottom, reducing the gross load by up to 86% for finfish culture and 99% for shellfish culture [46]. The effectiveness of these extractive species in mitigating organic loadings underscores their importance in the system’s overall sustainability. This removal process, however, introduces a dynamic element to the sediment environment, influencing the fatty acid profile. Any variations in fatty acid profile of sediment between different IMTA systems may reflect differences in the organic matter and detritus from uneaten feed, feces, and decaying biomass, providing insights into nutrient cycling and recycling within an aquatic ecosystem [47,48].
Over the past decade, studies have convincingly demonstrated the multifaceted benefits of integrated multi-trophic aquaculture (IMTA), showcasing its positive impact on ecological sustainability, economic viability, and social accessibility [23,49,50]. Recognized as a viable solution to address the global challenge of feeding a growing population sustainably [51,52], IMTA has garnered attention, particularly in North America and North/Western Europe. Despite this recognition, effective implementation has been limited to a few farms in Canada and north Europe, where culture densities remain too low for an easy quantification of environmental benefits [53]. The potential of IMTA in the oligotrophic Mediterranean Sea has been explored in studies related to remediation and mussel production near fish farms or laboratory remediation for European sea bass waste and sea cucumber [54,55,56,57]. However, commercial-scale IMTA development faces challenges due to factors such as a lack of knowledge and expertise, complexity in system management, insufficient reference data, and the need for optimal species compatibility. Therefore, it becomes evident that the present work is situated within a context where the concept of IMTA requires establishment and confirmation in various system configurations, aligning with the need to address existing challenges and propel IMTA toward broader adoption and understanding.
There are two main objectives of the present work: (i) to evaluate the efficiency of an integrated multi-trophic aquaculture (IMTA) system comprising of three components with species from three trophic levels: a feeding fish, the European sea bass co-cultivated with organic extractive suspension filters feeders (Mytilus galloprovincialis, Ostrea edulis, Crassostrea gigas) and deposit feeders (Holothuria sanctori, Holothuria polii, Holothuria tubulosa) and (ii) to assess the impact and utilization potential, within this IMTA system, of two commercially available fish feeds with high and low fish meal ingredients by using a multi-indicator assessment approach including growth performance and environmental quality indices, biomarkers and toxicity tests.

2. Materials and Methods

2.1. Experimental Setup

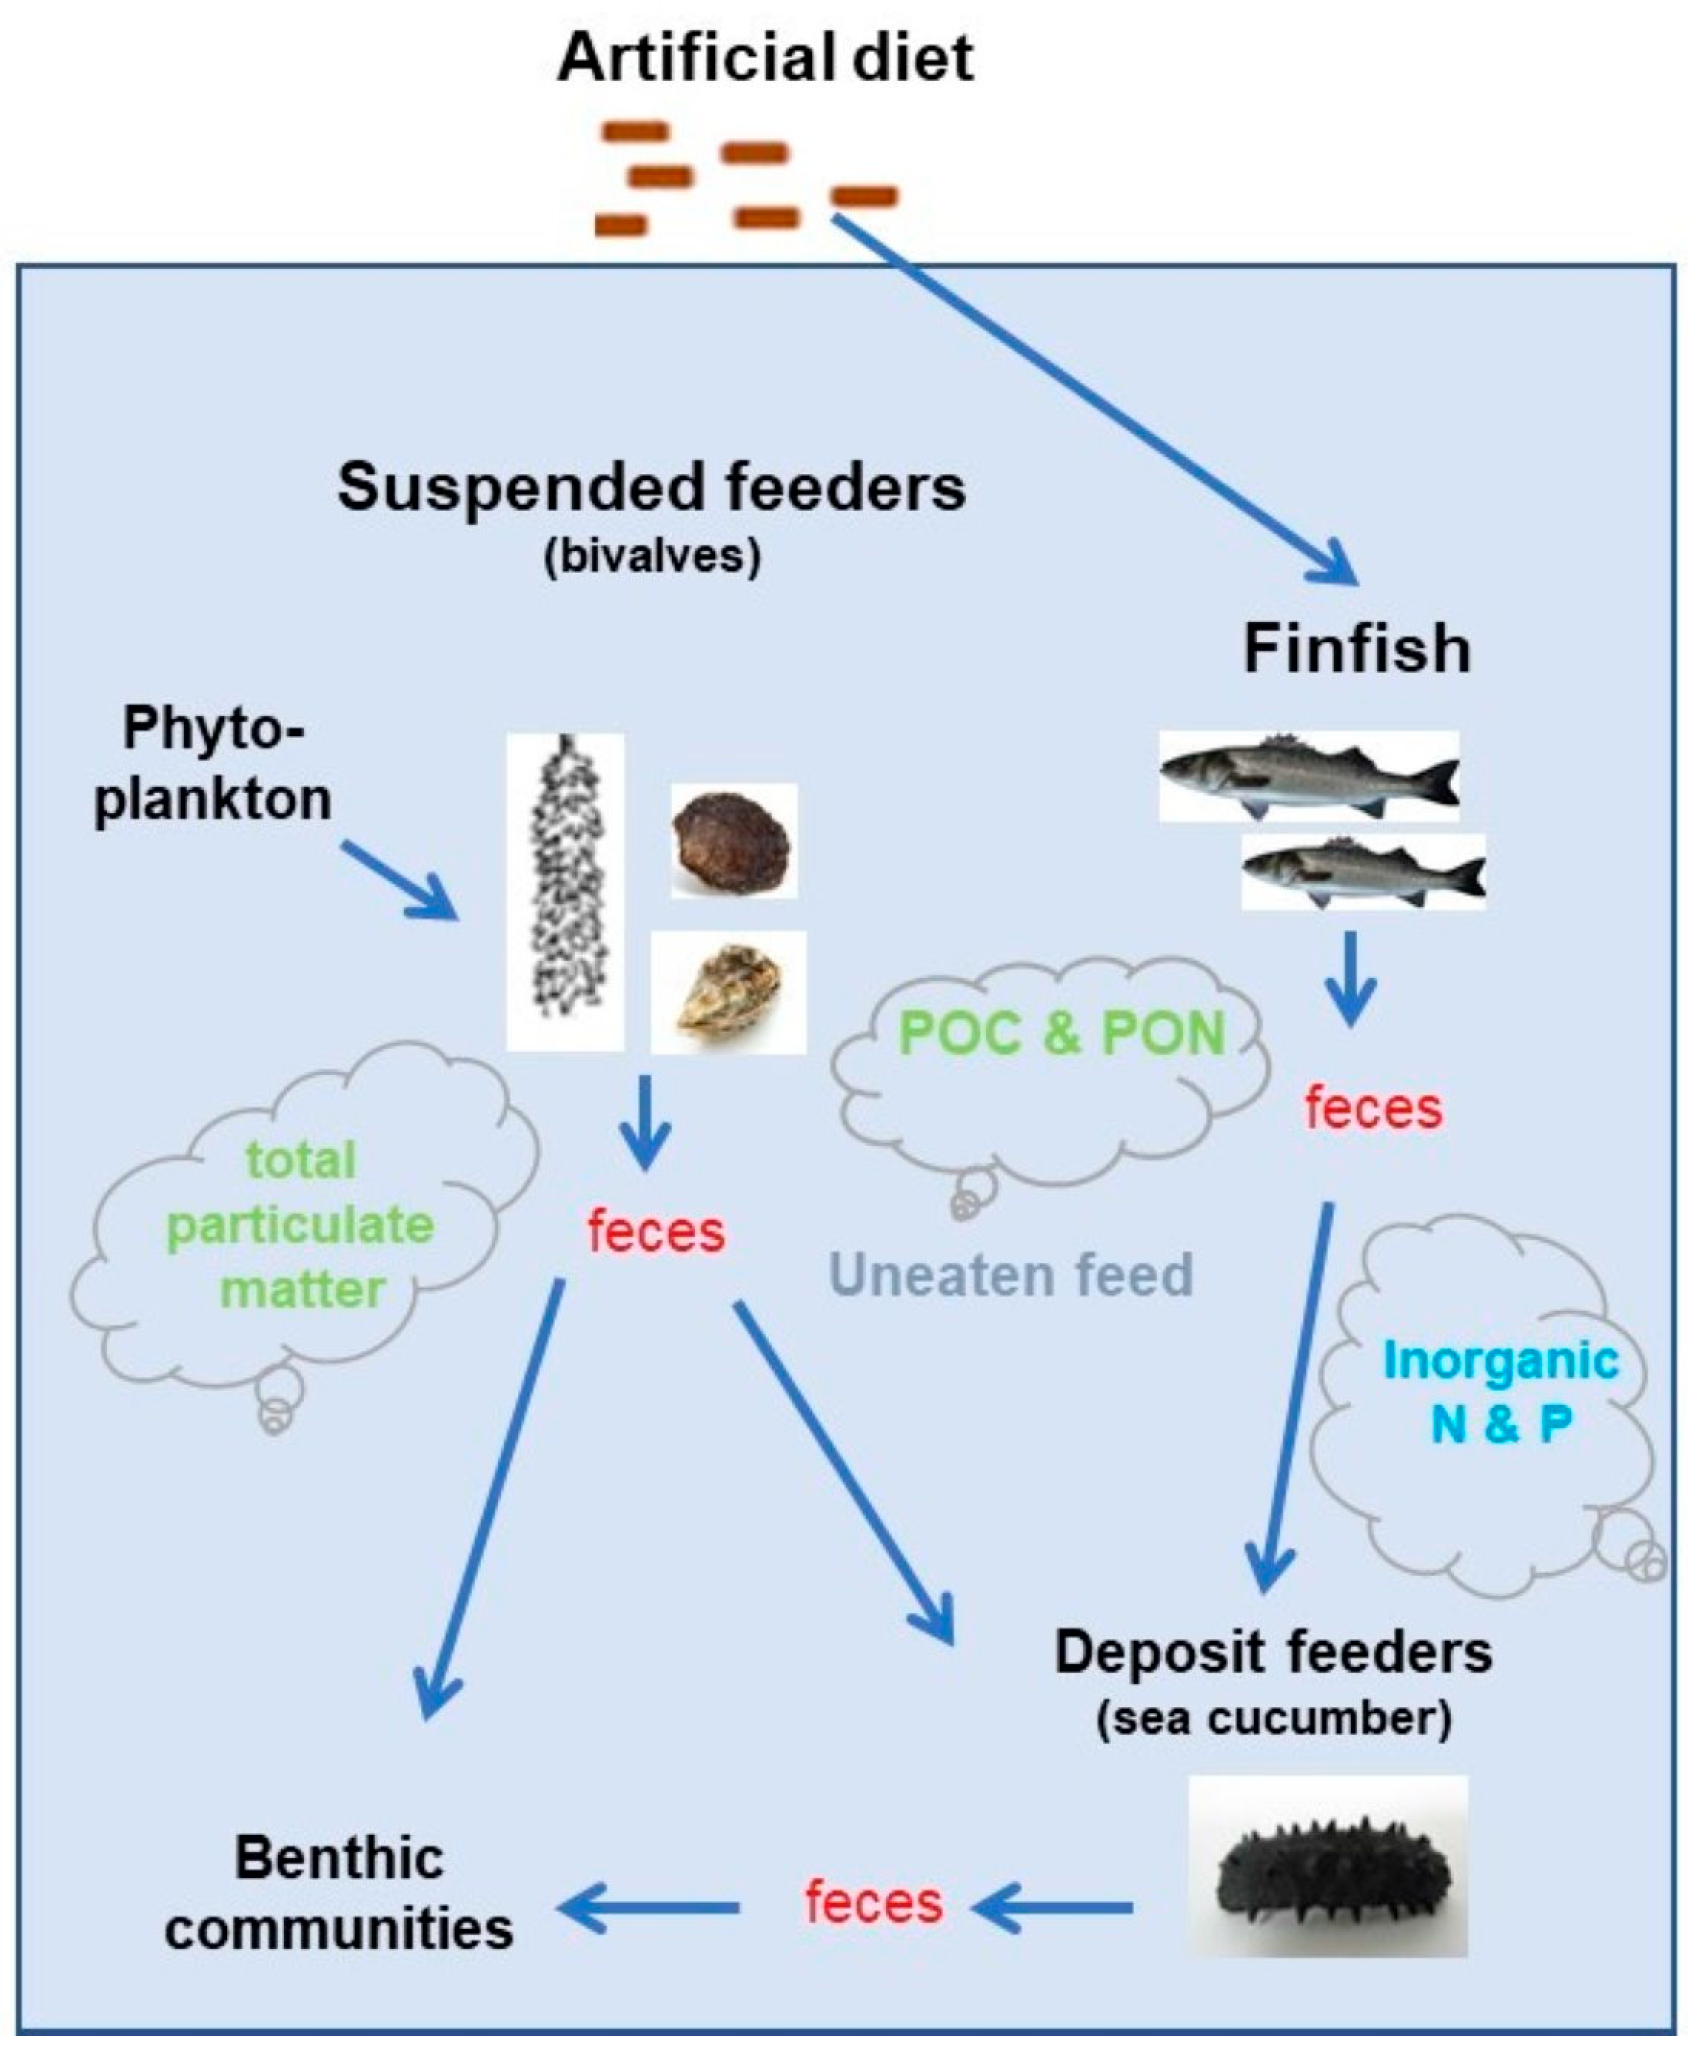
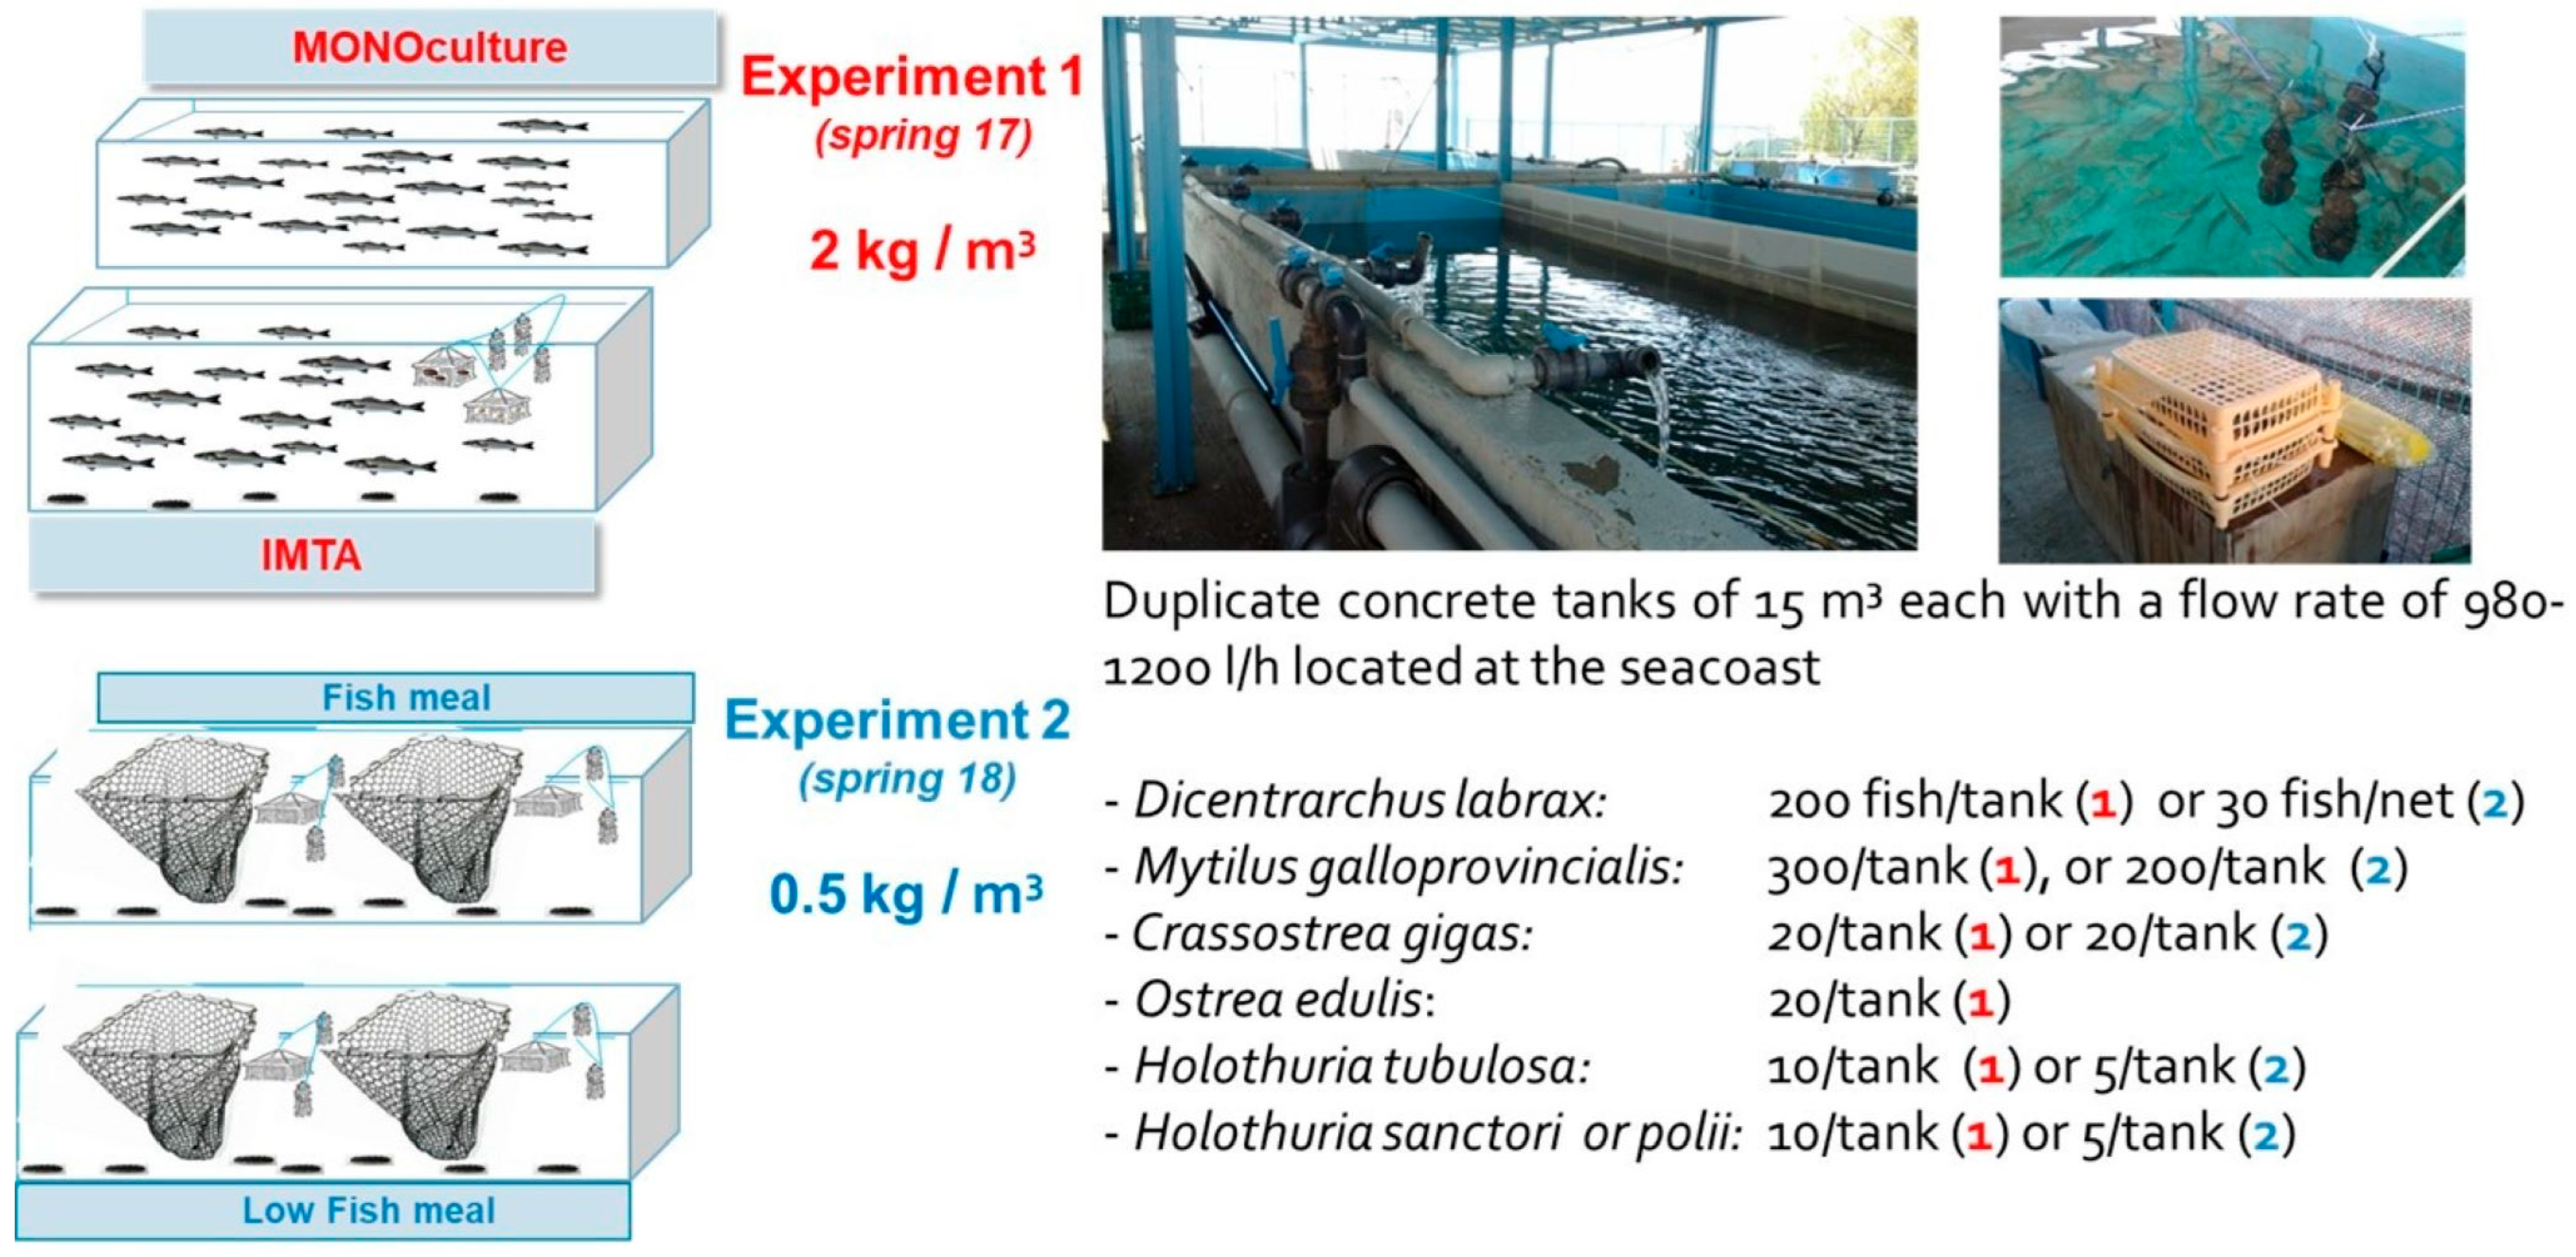
The conceptual approach of the proposed IMTA-like system is displayed in Figure 1, and a synoptic illustration of the experimental designs is presented in Figure 2.
All species were purchased alive from commercial farms in Greece except for the cucumbers, which were collected from the bottom of the sea by HCMR divers. Two separate experiments were set up and were performed in concrete tanks located at the seacoast with an open flow seawater system (flow rate ~980–1200 L/h and 15 m3 water capacity/tank) at the rearing facilities of the IMBBC-HCMR located at Agios Kosmas, Athens (Greece) in the spring of 2017 (March to May) and in the spring of 2018 (March to May), respectively. In the first experiment, an IMTA system was compared with a MONO-culture. Duplicate tanks were used for each system. The IMTA system was composed of the European sea bass Dicentrachus labrax and organic extractive species from two trophic levels: (i) suspension filter feeders (the mussel Mytilus galloprovincialis and the oysters Ostrea edulis and Crassostrea gigas) and (ii) deposit feeders (the sea cucumber Holothuria sanctori). The Monoculture was composed only of D. labrax. The fish in both systems were fed daily with a commercial feed composed of 35% fish meal and 15% fish oil (total 45% protein and total 17% lipids). The daily feeding was based on fish size (weight and number of alive) and water temperature. The initial total biomass in the monoculture was approximately 30 kg (2 kg/m3), whereas in the IMTA system, it was 50 kg (i.e., the fish biomass in each tank was 30 kg fish (2 kg/m3), 10 kg mussels M. galloprovincialis, 4.5 kg O. edulis, 4.5 kg C. gigas and 1.2 kg H. sanctori). The mussels were hanged and suspended with mesh bags (3 bags per tank for mussels, 100 individuals/bag) and plastic boxed frames (4 boxed frames per tank for oysters, 10 individuals/plastic box). The deposit feeders were placed at the bottom of each IMTA tank (10 individuals/tank).
The second experiment was set up to evaluate two similar IMTA systems in which the fish were fed on two commercial fish feeds with unlike ingredients (Table 1). Their main differences were in the amount of fish meal and fish oil and the sources and levels of proteins and lipids. Briefly, feed A was composed of 35% fish meal and 15% fish oil (45% in protein and 17% in lipids), which was named Fish Meal (FM), while feed B consisted of 20% fish meal plus 14% sunflower and 11% fish oil plus 6% soya oil (38% in protein and 21% in lipids), which was named Low Fish Meal (LFM). The two feeds were iso-energetic (21 MJ/kg). In the second experiment, both FM-IMTA and LFM-IMTA contained the species of D. labrax, M. galloprovincialis, C. gigas, H. tubulosa and H. polii. The initial total biomass in each system was 20 kg (i.e., fish biomass 7 kg (0.5 kg/m3) with 6 kg M. galloprovincialis, 3.7 kg C. gigas and 0.5 kg H. tubulosa + 0.5 kg H. polii). The fish were kept in nets (30 fish/net) in each tank (15 m3 water capacity), while filter feeders were hanged and suspended with mesh bags (4 bags/tank for mussels) and plastic boxed frames (2 boxed frames/tank for oysters). The deposit feeders were placed at the bottom of each IMTA tank (5 individuals of each species/tank). The daily feeding of D. labrax was based on fish size (weight and number of alive) and the water temperature.

2.2. Growth Performance Indicators

Fish, mussels, oysters and sea cucumbers were monitored closely. Fish and sea cucumbers survival was assessed every day, and mussels and oysters survival was assessed every month. Temperature, pH and oxygen levels were monitored every day at the same time (at noon). The biometric measures of all organisms including the initial and final body weight and length of each individual were taken at the start and at the end in all experiments except for the bivalves of the first experiment, where extra measures were taken in the middle of the experimental period. Standard indicators and formulas were used to assess sea bass survival, weight gain (WG), specific growth rate (SGR), feed conversion ratio (FCR), feed efficiency (FE) and condition factor (K).
Formulas for fish growth
Survival (%) = 100 × (final number of fish/initial number of fish)
Weight gain (WG, g/fish) = Weight final − Weight initial
Specific growth rate (SGR, %/day) = 100 × [ln(Weight final) − ln(Weight initial)]/90 days
Feed conversion ratio (FCR) = total feed given (g)/WG (g)
Feed efficiency (FE %) = 100 × (WG/total feed given)
Condition factor (K %) = 100 × (body weight, g/body length−3, cm)
The growth of bivalves was assessed based on survival, total weight gain (WG) (WGfinal − WG initial), total length gain (LG) (LGfinal − LGinitial), specific growth rate (SGR) (100 × [ln (Weight final) – ln (Weight initial)]/90 days) and condition index (CI). For the CI, the body tissues and the shells were dried separately at 110 °C for 24 h. The dry shell weight (DWshell) and dry tissue weight (DWtissue) were determined to calculate the CI [30]; CI = 100 × (DWtissue/DWshell). Also, the DWtissue/DWshell length ratio was calculated. The growth of sea cucumbers was estimated based on survival (number of individuals at the end/number of individuals at the start) × 100, wet weight gain (WG) and specific growth rate (SGR).

2.3. Environmental Quality Indices and Biomarkers

Water Samples

Water samples were collected in the water column in order to estimate the concentration of chlorophyll a (Chl-a), particulate organic carbon (POC), particulate organic nitrogen (PON) and suspended particulate matter (TPM). Chl-a was determined according to Holm-Hansen et al. [58]. In brief, water samples of 2 L were collected and agitated until each sample became homogeneous and were filtrated onto filters (Whatman GF/F, 47 mm). The filters were extracted in 90% acetone for 24 h, and Chl-a was determined using a TD700 laboratory fluorometer. The detection limit was ±0.01 μg Chl-α/L in a solution of 90% acetone. POC and PON were determined according to Hedges and Stern [59]. Water samples of 1 L were collected, respectively, and were agitated until each sample became homogeneous. Then, they were filtrated onto pre-combusted glass microfiber filters (Whatman GF/C, 25 mm, at 450 °C), and the filters were analyzed by means of a FLASH 2000 CHNS analyzer (Thermo Scientific, Waltham, MA, USA). TPM was determined by collecting 2 L of water and filtering in pre-weight filters (Whatman GF/F, 47 mm filters). Then, the filters were dried at 80 °C for 24 h and weighed again.

2.4. Sediment Samples

Sediment samples were sucked with a vacuum pipe from the bottom of each tank. Then, they were passed through a nylon net (200 μm) to remove the extra water and were kept at −20 °C until analysis for total organic carbon (TOC), proteins, lipids, fatty acids (FAs), toxicity assays and screening changes in the microbial community. TOC was determined by means of a FLASH 2000 CHNS analyzer using the protocol as described in Hedges and Stern [59]. Proteins (N × 6.25) were measured according to the Kjeldahl method (AOAC, Method number 988.05) [60]. Total lipids were determined by the phosphovanillin method [61]. FAs were determined as fatty acid methyl esters (FAMEs) after extraction and direct trans-esterification in a methanol-toluene (3:2) and a freshly prepared acetyl chloride-methanol solution 1:20 (v/v) [62]. Crude FAMEs were then purified by high-performance thin layer chromatography (HPTLC) on a 10 × 10 cm glass plate pre-coated with silica gel 60 and developed in a solution of hexane: diethyl ether: acetic acid (80:20:2, v/v). After scraping the silica gel containing FAMEs, they were recovered by adding 1 mL of hexane containing 0.05% BHT. FAMEs separation was conducted by gas chromatography with a flame ionization detector (GC-FID) (Varian 3300, Walnut Creek, CA, USA) on a flexible fused silica Megabore column (30 m × 0.32 mm × 1 μm) with a CP-WAX bonded stationary phase. Helium (purity 99.999%) was used as the carrier gas. The identification of FAMEs was based on a comparison of the sample retention time with those of the Supelco 37 Component FAME Mix standard (Supelco, Bellefonte, PA, USA), while the quantification of FAME was carried out using methyl nonadecanoate (98% purity, Sigma-Aldrich chemicals, St. Louis, MO, USA) as an internal standard.

2.5. Toxicity Assays

Toxicity was assessed in fish feeds and sediment samples. The biotest Microtox® Solid-Phase Test (SPT) with the bioluminescence marine bacterium Vibrio fischeri (NRRL B-11177) was used to quantify fish feeds and sediments toxicity. The biotest is based on bioluminescence, which is a bio-mechanism of the bacterium; since bioluminescence is related to bacteria metabolism, a reduction in the sample quality is reflected in the decrease in the quantity of light emitted. Hence, the effect concentration of a sample that provokes a 50% inhibition (EC50) of the light emitted by the bacteria provides the information about the toxicity of the sample. The Microtox® SPT test was performed according to a standardized SPT protocol [63]. Freeze-dried bacteria of V. fischeri and all materials and reagents were purchased from Strategic Diagnostis Inc., (Newark, DE, USA). Briefly, 7 g of fish feed or sediment samples was mixed with 35 mL of solid-phase diluent, stirred for 10 min, and then used to make up 13 dilutions of feed or sediment in test tubes held in a water bath at 15 ± 0.1 °C. Bacteria were exposed to each one of the dilutions for 20 min at 15 °C. At the end of the exposure period, a column filter was inserted in the tubes in order to separate the liquid phase from the solids, and the light output of the liquid phase containing the exposed bacteria was measured in a Microtox® 500 analyzer (Azur Environmental, Carlsbad, CA, USA). Each feed or sediment dilution was tested in duplicate. The Microtox Omni® Software (version 4.2) was used to calculate the EC50s expressed as concentration (mg/L). As toxicity criteria have not been established yet for similar samples, the toxicity, at least, for the sediment samples was based on the limit of 1000 mg/L that is used for monitoring environmental samples contaminated with chemical compounds [64,65].

2.6. Screening Changes in the Structure of the Sediment Microbial Community

Changes in the structure of the sediment microbial community were analyzed by polymerase chain reaction–denaturing gradient gel electrophoresis (PCR-DGGE). In brief, microbial DNA was extracted from 10 g of the sediment samples using the DNeasy PowerMax® Soil Kit (QIAGEN GmbH, Hilden, Germany). The 16S rDNA was amplified using a touchdown PCR, whose thermal cycling condition was as follows: initial denaturation of 95 °C for 1 min, 19 cycles of denaturation at 95 °C for 1 min, annealing at 62 °C for 1 min with decreasing temperature of 0.8 °C at every cycle and extension at 72 °C for 1 min, followed by 9 cycles of 95 °C for 1 min, 57 °C for 1 min and 72 °C for 1 min and the final extension of 72 °C for 10 min. The PCR primers used were −357F (5′-CCTACGGGAGGCAGCAG-3′) with a GC clamp [66] and 907R (5′-CCGTCAATTCCTTTGAGTTT-3′) [67]. Each PCR was run in a total of 250 μL prepared in five tubes of 50 μL [68]. PCR products were purified using the PCR and DNA cleanup Monarch® kit (New England BioLabs Inc., Ipswish, MA, USA). The amplified and purified 16S rDNA fragments were run for DGGE in the D-Code System (Bio-Rad, Hercules, CA, USA) according to Santander et al. [66] after modifications. Briefly, approximately 10 μL of the purified DNA was applied to 6% polyacrylamide gel with urea and formamide, whose concentrations were 7 to 4.2 mol/L and 30% to 60%, respectively. Electrophoresis was run at 60 °C with 140 V for 5 min and then at 60 °C with 200 V for 5 h. Gels were stained with SYBR Gold (Invitrogen, Carlsbad, CA, USA), and band presence/absence was checked and counted with the Image LabTM software 5.1 on a blue light trans illuminator (Gel Doc EZ Imager, Biorad, Hercules, CA, USA). Similarities of the band profiles were estimated using Sørensen’s similarity index [69] expressed as Cs = 2j/(a + b), where j is the number of bands commonly found in both samples, and a and b are the number of bands found in the respective samples compared. Furthermore, selected DGGE bands were excised from the gel, and they were eluted in 20 μL of sterile distilled water at 4 °C overnight. Concerning bands with the same distance from wells in different lanes, only one band was cut representing the same bacterial V3–V5 region of 16S rDNA. Afterwards, 4 μL of the eluted DNA was used as a template in a PCR with the same primers and conditions as described above, and the electrophoretic mobility of re-amplified bands was checked on a new DGGE gel so as to confirm that it migrated as a single band to the same position. PCR products with correct mobility were purified and sequenced. Purification was performed using 3 M sodium acetate and ethanol and incubating at −80 °C overnight. Sequencing was performed by Eurofins (Wolverhampton, UK) using the reverse primer 907R, and sequencing data were aligned to the closest relative in the database using the BLAST algorithm optimized for highly similar sequences (blastn) (www.ncbi.nlm.nih.gov/blast, accessed on 15 April 2021). Sequences with 97% or higher identity were considered to represent the same species.

2.7. Statistical Analysis

Statistical analyses were performed using SPSS software (version 26) for Windows. Comparison of means was conducted by an independent samples t-test or one-way ANOVA when appropriate. When one-way ANOVA was performed, data were subjected to Duncan’s multiple range test for significant differences at p < 0.05 after being tested for homogeneity of variance by the Levene’s test. The compliance of data with normal distribution was tested using the Kolmogorov–Smirnov test, and in the cases where the data were non-normal, a nonparametric test (Kruskal–Wallis) was performed or data were log transformed prior to statistical analysis. All data are reported as mean ± standard deviation (SD).

3. Results

3.1. Proximate Analysis of Feeds and Growth Performance Indicators (GPIs)

The results of the proximate analysis of the commercial feeds, so-called Fish Meal (Feed A) and Low Fish Meal (Feed B), are shown in Table 1. The two feeds were iso-energetic but not iso-lipidic or iso-proteinic. Significantly higher proteins and lower lipids and total fibers were found in Fish Meal than in Low Fish Meal.
The GPIs of all co-cultured species in monoculture and an IMTA system are indicated in Table 2 (fed fish, D. labrax), Table 3 (suspension filter feeders, M. galloprovincialis, O. edulis, C. gigas) and Table 4 (deposit feeders, H. sanctori).
A 100% survival was indicated for all filter feeders. Their total WGs and shell lengths were increased, but their CIs were decreased. These changes, however, were not significant in comparison to their initial state (Table 3). The survival of deposit feeders was successful (100%), and their total weights at the end of the experiment displayed a significant increase; every individual gained approximately 16.78 ± 3.68 g (Table 4).
Fish survival was higher in the IMTA system (98.2 ± 1.34%) than in the monoculture (91.9 ± 3.95%) but without any significant difference (p = 0.135). Likewise, WG and SGR values were higher in the IMTA system but did not differ significantly compared to those in the monoculture (Table 2). Conversely, a significantly lower FCR and higher FE ratios were observed in the IMTA system in comparison to the monoculture (p = 0.002), highlighting a notably higher feed efficiency in the IMTA system. The FCR was 1.66 and 1.47 in the monoculture and in the IMTA system, respectively, whereas the FE was 60.4% in the monoculture and 68.1% in the IMTA. Fatty acid analysis revealed significant differences of the fatty acid profile in sediments from the three rearing systems (initial, monoculture, and IMTA system) and showed significant variations in saturated (SAT), monounsaturated (MUFA), and n-3 fatty acids. Table 5 provides a summary of the fatty acid profile in the sediments of the three rearing systems.
The GPIs values for all co-cultured species in the FM-IMTA and LFM-IMTA systems are displayed in Table 6 (fish), Table 7 (oyster, C. gigas), Table 8 (mussel) and Table 9 (deposit feeders, H. tubulosa, H. polii). Fish survival and K were similar in both systems (86.7% and 1.17%, respectively). However, the final weight, WG, SGR and FE indicators were significantly higher in FM-IMTA compared to those in LFM-IMTA (Table 6). In contrast, the FCR was significantly lower in FM-IMTA (2.16) than in LFM-IMTA (2.39).
A 100% survival was indicated for C. gigas in both systems. Its final total weight and final shell length were significantly increased compared to its initial state, but there were not significant differences between the FM-IMTA and LFM-IMTA systems (Table 7). Also, the total WG, length gain and SGR for C. gigas were higher in the LFM-IMTA than in the FM-IMTA but not significantly different. The C. gigas soft tissue weight decreased at the end of the experimental period in both systems in comparison to the initial state. However, the final soft tissue weight and CIs values were higher in the LFM-IMTA but did not differ significantly with those in the FM-IMTA. As in oysters, a 100% survival was indicated also for the mussels in both systems. The total WG, length gain and SGR values were higher in the LFM-IMTA but did not differ significantly from those in the FM-IMTA (Table 8).
The survival of deposit feeders (H. tubulosa and H. polii) was successful (100%) in both systems. Both species increased their weights in both systems. However, the final weight of H. tubulosa was significantly higher compared to its initial state in the FM system. Yet, WG and SGR values for H. tubulosa were higher in the FM-IMTA, and SGR particularly was significantly higher than in the LFM-IMTA. Moreover, the final weight, WG and SGR values of H. polii were similar either within or between the systems.

3.2. Environmental Quality Parameters and Biomarkers

In the MONOculture and IMTA system, the temperature and dissolved oxygen levels varied during the experimental period. In the first month, the temperature ranged from 14.3 to 16.3 °C, and the dissolved oxygen ranged from 8.53 to 9.09 mg/L. In the second month, the temperature fluctuated from 15.4 to 19.5 °C and the dissolved oxygen fluctuated from 5.36 to 7.56 mg/L, while in the third month, the temperature ranged from 18.2 to 21.5 °C and the dissolved oxygen ranged from 3.85 to 6.53 mg/L. Nitrogen levels in the water measured as total ammonia (TAN), nitrite (N-NO22−) and nitrate (N-NO31−) fluctuated during the experimental period (0.25–0.5 mg/L, 0.00–0.02 mg/L, and 0.62–0.64 mg/L, respectively) and were similar in both systems.
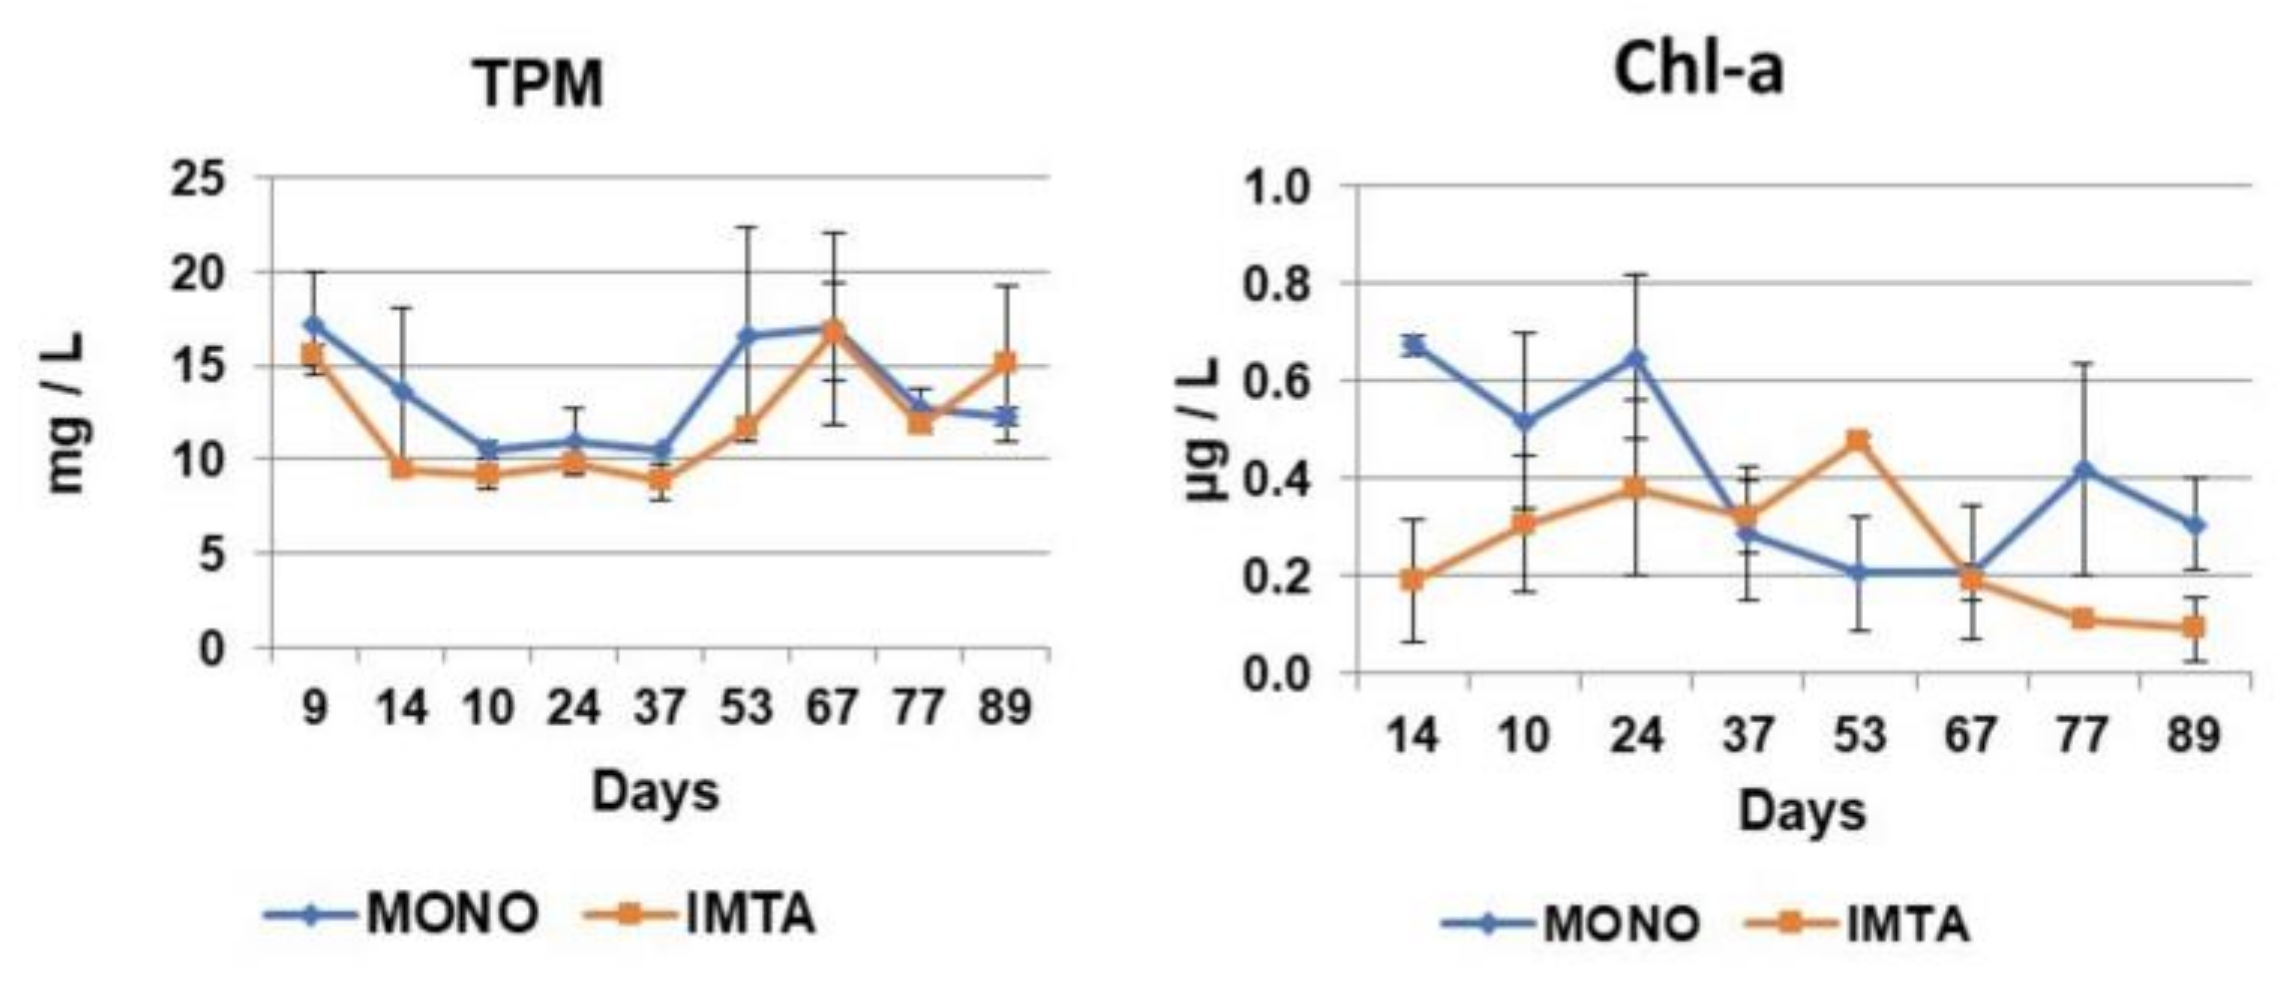
Fluctuations in the levels of TPM and Chl-a in the water column were similar in the IMTA system and MONOculture (Figure 3). TPM values ranged between 10.5 and 17.25 mg/L in the MONOculture and between 8.8 and 16.8 mg/L in the IMTA system. Chl-a concentration fluctuated from 0.1 to 0.47 μg/L in the IMTA system and from 0.21 μg/L to 0.66 μg/L in the MONOculture. These values indicate a lower mesotrophic (0.1 to 0.6 μg/L) environment [70]. POC and PON concentrations decreased significantly in the IMTA system compared to the monoculture (Figure 4). POC ranged from 87 to 152 μmol/L in the monoculture and from 48 to 71.5 μmol/L in the IMTA system. Moreover, PON ranged from 1.75 to 13 μmol/L in the monoculture and from 2.17 to 4.26 μmol/L in the IMTA system.
The profiles of FAMEs in sediment indicated the presence of some FAs in the monoculture and IMTA system that were not found in the sediment at the initial state of the experiment (during the preparation of tanks when only seawater was entering the system and the presence of fish, filter and deposit feeders was absent in the tanks) (Table 4). Furthermore, significantly lower concentrations of saturated FAs, MUFAs and n-6 PUFAs, but not n-3 PUFAs were registered in the IMTA system compared to the monoculture. In particular, the levels of FAs 14:0, 16:0, 18:0, 22:0, 24:0, 16:1n-7, 18:1n-9, 18:1n-7, 20:1n-9, 22:1n-11, 24:1n-9, 22:6n-3 and 18:2n-6 found in the IMTA system were significantly lower than those found in the monoculture (Table 5).
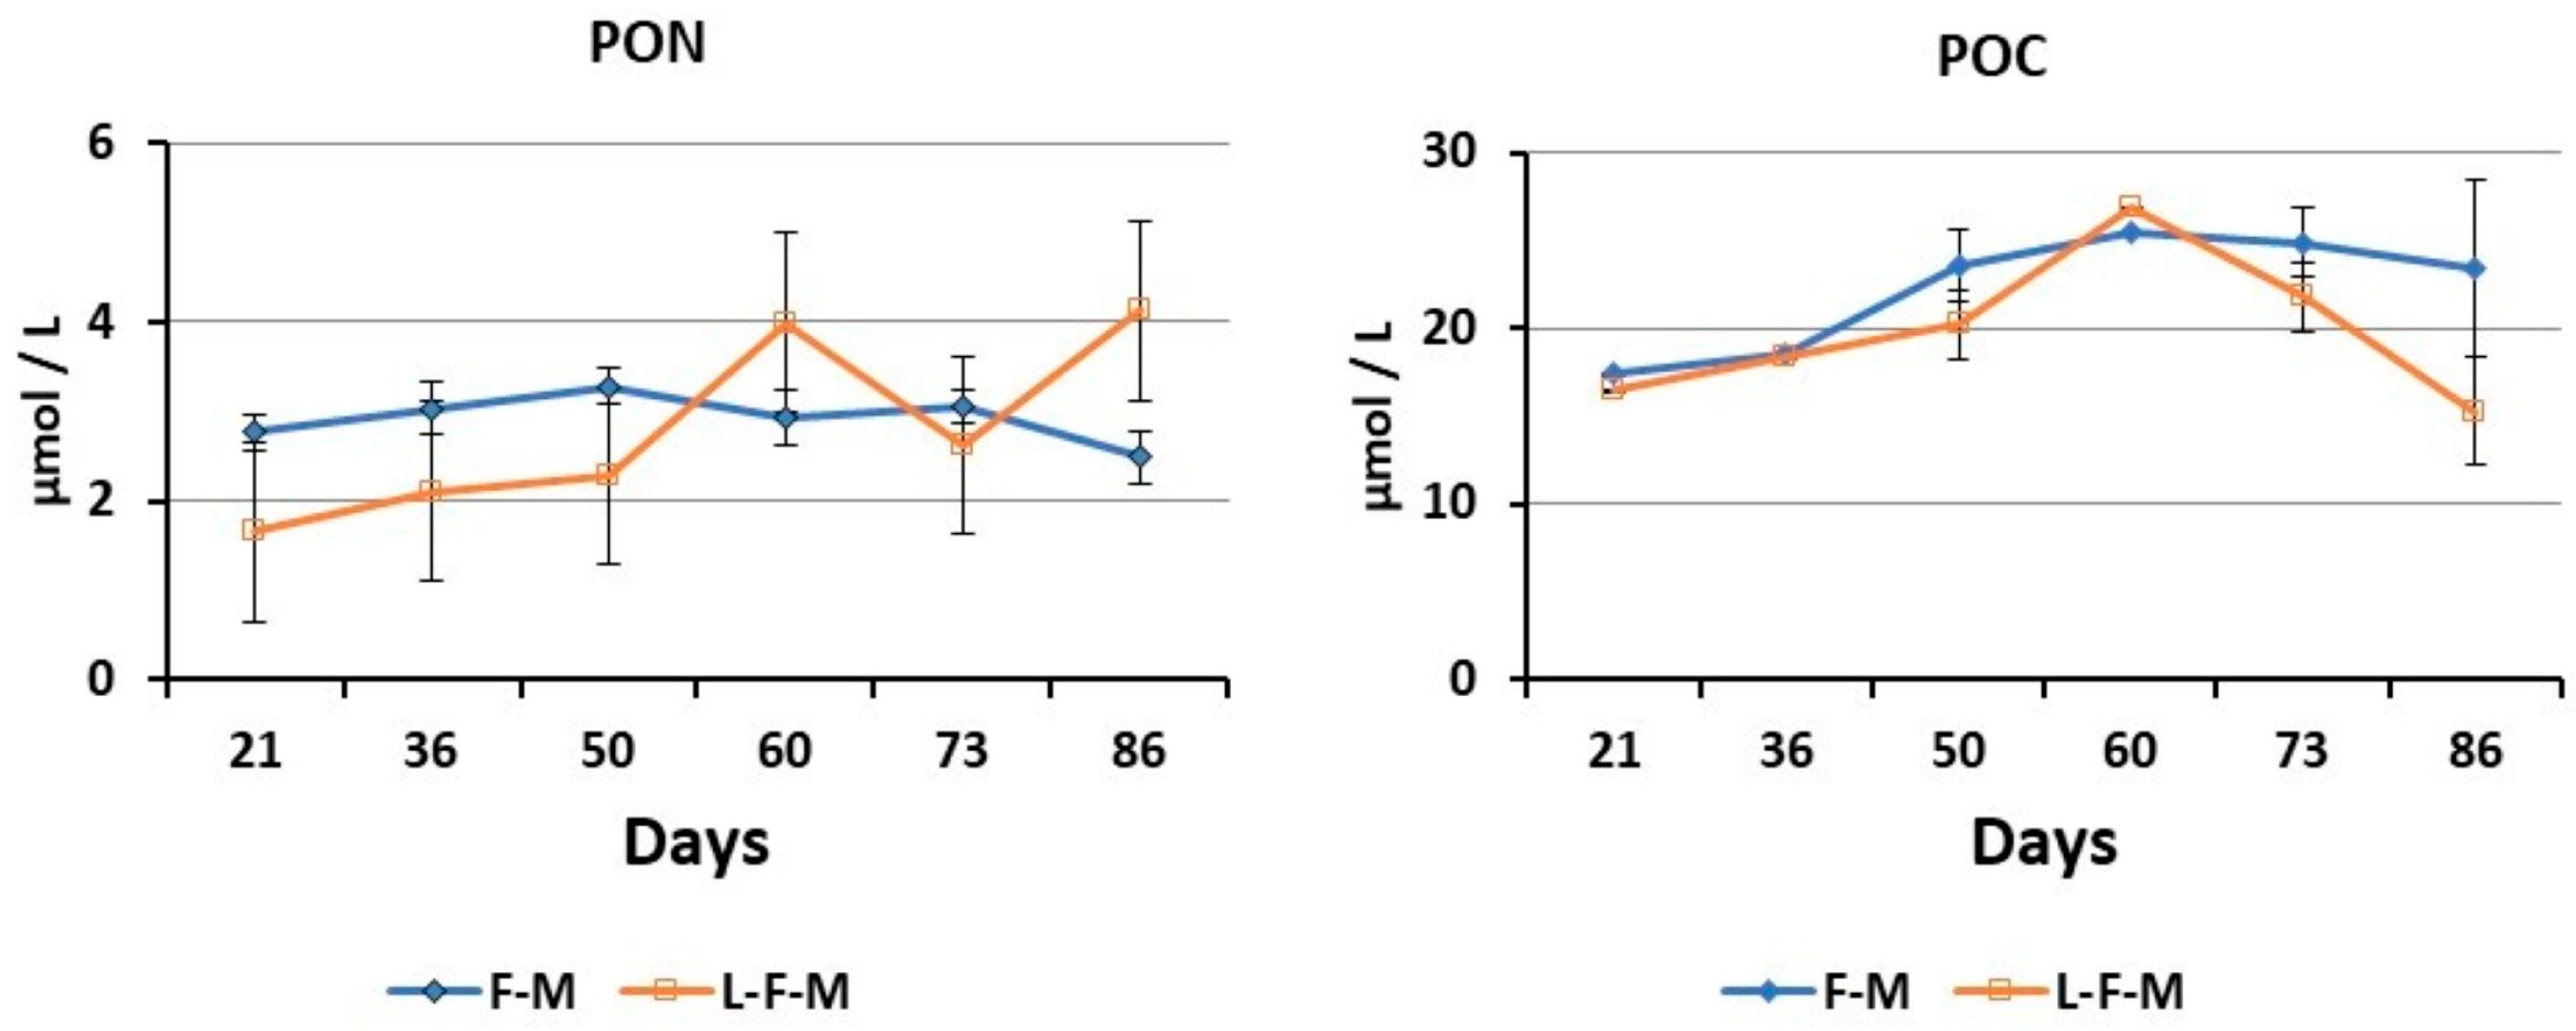
In the FM-IMTA and the LFM-IMTA systems, the temperature and dissolved oxygen levels varied during the experimental period but were similar between the systems. In the first month, the temperature fluctuated from 15.5 to 17 °C and the dissolved oxygen fluctuated from 6.83 to 7.60 mg/L. In the second month, the temperature fluctuated from 6 to 21 °C and the dissolved oxygen fluctuated from 6 to 8.38 mg/L, while in the third month, the temperature fluctuated from 21 to 28 °C and the dissolved oxygen fluctuated from 5 to 6 mg/L. Nitrogen levels in the water measured as total ammonia (TAN), nitrite (N-NO22−) and nitrate (N-NO31−) fluctuated during the experimental period (0.2–0.3 mg/L, 0.00–0.01 mg/L, and 0.60–0.62 mg/L, respectively) and were similar in both systems. TPM and Chl-a concentrations were comparable in the FM-IMTA and the LFM-IMTA systems (Figure 5). In FM-IMTA, the TPM oscillated from 4.9 to 9.8 mg/L, while in the LFM-IMTA, it oscillated from 2.7 to 7.3 mg/L. Chl-a concentration fluctuated from 0.12 to 0.35 μg/L and from 0.02 to 0.16 μg/L in the FM-IMTA and LFM-IMTA, respectively. These values indicate lower mesotrophic (0.1 to 0.6 μg/L) and oligotrophic (<0.1 μg/L) environments, respectively [70]. Likewise, the POC and PON values were analogous as well (Figure 6). POC fluctuated from 17.4 to 23.4 μmol/L in FM-IMTA and from 15.3 to 26.8 μmol/L in LFM-IMTA. Yet, PON fluctuated from 2.5 to 3.1 μmol/L and from 1.6 to 4.1 μmol/L in the FM-IMTA and in the LFM-IMTA, respectively.
The profile of the FAs in sediments showed significantly higher quantities of saturated FAs, MUFAs and n-6 PUFAs, but not n-3 PUFAs, in the LFM-IMTA system compared with the FM-IMTA system (Table 10). In particular, the concentrations of 14:0, 16:0, 16:1n-7, 18:1n-9, 18:1n-7 and 18:2n-6 FAs noticed in the LFM-IMTA system were significantly higher than those in the FM-IMTA system (Table 10).

3.3. Toxicity of Fish Feeds and Sediments

The EC50s of fish feeds were significantly lower in the L-Fish Meal (232.69 mg/L) than in the Fish Meal feed (6623.65 mg/L) (Figure 7). The EC50s of sediments were significantly lower in the monoculture (2147.30 mg/L) than in the IMTA system (2327.93 mg/L) but above the limit of 1000 mg/L. The EC50s of sediments were significantly lower in the LFM-IMTA (538.32 mg/L) than in the FM-IMTA system (605.32 mg/L) and below the limit of the 1000 mg/L (Figure 8).

3.4. Organic Loads in the Sediments

The concentration levels of total proteins, lipids and TOC in sediments were significantly lower in the IMTA system compared to the monoculture (Table 11). Likewise, concentrations of the same biomarkers were significantly higher in LFM-IMTA than in FM-IMTA (Table 11).

3.5. Screening Changes in the Structure of Sediment Microbial Community

The analysis of the abundance and diversity of bacteria in the sediment samples using Denaturing Gradient Gel Electrophoresis (DGGE) gave a number of weak bands and a few more dominant bands among the three systems (Figure 9). The number of bands in each system indicated the extent of bacterial diversity [71]. Furthermore, Sørensen’s similarity index (Cs) revealed a 66.7% similarity of the band profiles between the initial and IMTA systems and an 85.7% similarity of the band profiles between the monoculture and IMTA systems, meaning that more similar species were present between the monoculture and IMTA systems than between the initial and IMTA systems (Table 12).
A 100% similarity was indicated between the FM-IMTA and LFM-IMTA systems, meaning that exactly the same species were found between the two systems (Table 13). Results based on sequences affiliated to Bacteriodetes (Flaviramulus basaltis), γ-Proteobacteria (Chromatiaceae bacterium) and δ-Proteobacteria (Desulfobacteriaceae bacterium).

4. Discussion

IMTA is considered a sustainable and eco-friendly mariculture system [43,72]. In an IMTA system, the selection of suitable species and their biomass (population density) are crucial factors. In the overall design of an IMTA system, two kinds of organisms are considered: fed and extractive. Fed organisms produce wastes (uneaten feed, feces etc.), whereas extractive organisms convert these wastes into fertilizer, food and energy [24]. Yet, the utilization of suitable indicators is a key component in the process to determine the efficiency of an IMTA system.
In this study, a multi-indicator assessment approach was applied to evaluate the efficiency and the environmental impact of an IMTA system consisting of species from three trophic levels (i.e., feeding European sea bass D. labrax with suspension feeders (the mussel M. galloprovincialis, the oysters O. edulis and C. gigas) and deposit feeders (the sea cucumbers H. sanctori, H. polii and H. tubulosa)) co-cultured in concrete tanks at the seacoast. Multiple indicators of species growth performance along with environmental quality indices and specific biomarkers were utilized to evaluate the growth of these co-cultured species and to estimate particular impacts on the quality status of the water and sediment in the system.
European sea bass was selected as the feeding component, because it is one of the most important and profitable marine farmed species in Europe, especially in the Mediterranean Sea [29]. Its growth, however, is a complex trait that is very important to fish farmers. Generally, the growth of fish farmed in traditional monocultures is influenced by many factors, including the rearing population density, the quality and quantity of food, the type of culture system, rearing conditions and management practice [73,74]. In order to evaluate its growth performance, critical indicators such as the survival rate, body weight gain (WG), specific growth rate (SGR), feed conversion ratio (FCR) and feed efficiency ratio (FE) are considered appropriate and used by many stakeholders (e.g., farmers, scientists, policymakers, legislators). The survival rate is a reliable indicator of fish growth performance as it ensues from several other important factors including development stage, stress in a given rearing condition and disease resistance. Yet, survival rate is correlated also with the economic value of the fish biomass produced. Our results indicated a successful and higher survival in the IMTA system compared to the MONOculture and similar survivals in the two other IMTA systems in which fish were fed on the two commercial diets of different composition. FCR is defined as the units of feed needed to yield one unit of fish biomass. It is therefore the conventional measure of fish production efficiency and a well-established crucial indicator commonly used by fish farmers and scientists; the smaller the FCR ratio, the greater the FE ratio. The FE ratio is defined as the amount of body weight gain for a given total feed consumed. Hence, FE is the inverse of the FCR; the larger the FE, the greater the efficiency of feed consumed. A low FCR is crucial for aquaculture systems as it is associated with reduced uneaten fish feeds and fish wastes entering the culture system, leading to lower feed requirements and reduced feeding costs.
Depending upon the feed type and its composition, the species, the rearing density, the feeding practices, the water quality and the culture system, the FCR ratio can diverge from 1.0 to 2.4 [75]. Lower FCR values denote that feed is efficiently converted into fish body weight gain, while in overfeeding or underfeeding, the ratio can increase. The FCR ratio of European sea bass farmed in net cage monocultures in the Mediterranean can vary from 1.77 to 1.9 [76,77]. The results of our first experiment indicated lower FCR values in both the monoculture and IMTA system than those mentioned in the literature, but a significantly lower FCR ratio was displayed in the IMTA system (1.47) compared to that in the monoculture (1.66). However, despite the significantly lower FCR and the higher FE ratios in the IMTA system, the final fish body weight was similar in the two systems, and the WG in the IMTA system was not significantly high. It was concluded thus that perhaps the feed consumed was probably not alike in the systems. Studies mention that the feed consumed is influenced by many factors such as the management practices, environmental conditions, feed quality and physiological condition of the fish [78]. In our case, we assumed that the different environmental conditions present in the two systems must have influenced the physiological condition of the fish and the amount of the feed they consumed. In contrast, higher FCR ratios were indicated in our second experiment in both IMTA systems (FM- and LFM-IMTA) than those mentioned in the literature, but FCR was significantly lower in the FM-IMTA system (2.16) than in the LFM-IMTA system (2.39). Yet, both the final fish body weight WG and FE were significantly higher in the FM-IMTA than in LFM-IMTA system. Hence, it was concluded that fish in the FM-IMTA system had better growth performance than those in LFM-IMTA, since they had higher FE and lower FCR ratios. These results can be attributed to the composition of FM (Fish Meal), which consisted of higher amounts of fish meal and fish oil compared to LFM (Low Fish Meal). This is in agreement with Kousoulaki and co-authors [79], who noted that the optimal performance of European sea bass in traditional monocultures was achieved when the fish were fed with feeds consisting of high fish meal and fish oil. In our study, bivalves exhibited growth only in their shells and not in their soft tissues in all the IMTA systems we tested. Initial and final CI ratios were similar in the IMTA system, and final CI ratios in FM-IMTA and LFM-IMTA did not differ. As CI ratios have been linked to the trophic condition of the farming area [80], the absence of changes in the CI ratios may be indicative of the fact that the seston quality was low in our systems (the incoming sea water in the tanks and the flow rate) and/or that feeds and fish fecal waste levels were insufficient due to the low fish density in our systems (fish biomass at the start of the experiments was 2 kg/m3 and 0.5 kg/m3).
In fact, the aquaculture of bivalves does not thrive in oligotrophic areas, but it does in eutrophic areas where nutrients are in higher levels [35,41,42]. In turn, the level of nutrients can be associated with phytoplankton growth. Chl-a is an indicator of primary production (amount of phytoplankton growing in a water body) in response to nutrients and a key indicator to assess marine water quality and to classify the trophic condition of the water body. Based on trophic classification ranges [70], levels of Chl-a obtained in our experiments reflected a lower mesotrophic character (0.1 to 0.6 μg/L) in the monoculture and IMTA system and an oligotrophic (<0.1 μg/L) and lower mesotrophic (0.1 to 0.6 μg/L) character in the LFM-IMTA and the FM-IMTA systems, respectively. Furthermore, POC and PON levels were lower in the IMTA system (highest values 71.5 μmol/L for POC, 4.3 μmol/L for PON) compared to the monoculture (highest values 152.2 μmol/L for POC, 13.1 μmol/L PON), whereas their levels in FM-IMTA and LFM-IMTA were very low (<4 μmol/L for PON and <25 μmol/L for POC). These low values of PON and POC together with the oligotrophic-mesotrophic conditions in the water bodies of our systems appeared to affect the growth of the soft tissues of bivalves. Therefore, although filter feeders indicated an increase in their total weight and shell length, the CI ratios showed low values because their soft tissue did not increase either in the IMTA system or in the FM-IMTA and LFM-IMTA. This is another confirmation that bivalves CI are dependent on trophic conditions [30]. However, it is essential to highlight the notable reduction in PON (particulate organic nitrogen) and POC (particulate organic carbon) concentrations in the IMTA system. This decrease strongly suggests a bio-mitigation of organic nutrients within the water column of the IMTA system.
The settlement of uneaten feed pellets and fish fecal wastes as well as bivalves’ feces can lead to waste particles and organic enrichment of the sediments [15]. However, nutrients enrichment with organic loads such as proteins, lipids and fatty acids can be reduced with the contribution of deposit feeders like sea cucumbers [50]. Therefore, we integrated the sea cucumbers H. sanctori, H. polii and H. tubulosa in our IMTA system. Sea cucumbers decrease organic loads and redistribute surface sediment, while the inorganic nutrients (P and N) they excrete enhance the benthic habitat [30]. Hence, they are considered as excellent bioremediators and ideal candidates for IMTA systems due to their high market value and their ability to feed on the particulate waste generated by other co-culture species [81]. Usually, sea cucumbers are eaten as a food, medicinal supplements or extracts and tonics in Asian countries, whereas lately, they have also been utilized as nutraceuticals in western markets [81]. The first attempts to integrate sea cucumbers with fish were made in Canada for fouling mitigation in coastal salmon sea cage systems [82]. Since then, concerns to integrate them in feeding finfish and filter feeders bivalves farming activities has grown not only for their economic benefits but also for reducing the overall environmental impact of the farming activities. However, there are only a few studies available regarding the co-culture of Mediterranean Sea cucumbers in mussel farms [83,84] or in finfish farms [50,85,86,87].
A positive increase on the growth of sea cucumbers was indicated in this study with a concurrent decrease on the levels of organic loads (proteins, lipids, TOC) and saturated, monounsaturated and polyunsaturated fatty acids concentrations in the IMTA system and the FM-IMTA in comparison to the monoculture and LFM-IMTA, respectively. These showed a higher involvement of feces and uneaten feed in the settled particles in the MONOculture and LFM-IMTA and the contribution of sea cucumbers for bio-mitigating fecal wastes and uneaten feeds in all of our IMTA systems. The fatty acids profile in sediments, particularly, long-chain fatty acids, has been used as a biomarker for the presence of organic waste originated from farmed fish activities [87]. Moreover, organic carbon, nitrogen and phosphorus loads can alter sediment characteristics beneath and close to the fish cages [88]. This, in turn, stimulates bacterial activity, which may result in benthic oxygen depletion [89] causing long-term changes in the structure of the benthic assemblages by reducing density and biodiversity [90,91,92]. In our experiments, bacterial diversity in sediments based on DGGE bands was similar either in MONOculture and IMTA or in FM-IMTA and LFM-IMTA systems compared to the initial stage conditions. In addition, the Sørensen index (Cs) showed very high similarity (100%) between the FM-IMTA and LFM-IMTA systems and high similarity (0.89%) between the IMTA system and MONOculture. However, due to the system design of our IMTA, a direct comparison with results from the literature could not be performed.
Previous studies have used bioassays with marine luminescent bacteria (Vibrio fischeri) to characterize fish feeds and fish fecal toxicity [93] and the toxicity of sediment [94,95]. Our results found higher toxicities in the MONOculture and in the LFM-IMTA system than in the IMTA and the FM-IMTA, respectively. Moreover, the toxicity of feeds was higher in the LFM feed compared to the FM feed. Researchers have attributed the toxic effects to the fats and vegetable oils present in feeds and sediments. Campo et al. [96] indicated that toxic effects are linked to the chemical composition of fat and vegetable triacylglycerols that consist of glycerol molecules esterified with three long-chain fatty acids. The three most abundant fatty acids found in triacylglycerols are the unsaturated 18:1 (oleic), 18:2 (linoleic) and 18:3 (linolenic) oils, particularly corresponding to, prominently and to a lesser extent corresponding to saturated fatty acids 14:0 (myristic), 16:0 (palmitic) and 18:0 (steatic). The fatty acids profiles in the sediments of our first experiment indicated higher values of these fatty acids in the monoculture compared to the IMTA system, while the same fatty acids were lower in the FM-IMTA system than in the LFM-IMTA system. These findings could explain the different EC50s found in our sediment samples among all the systems.
5. Conclusions

The results indicate that IMTA systems that use fish meal feed can achieve improved production performance and environmental sustainability compared to conventional aquaculture systems that do not incorporate IMTA practices. This approach holds promise for reducing the environmental footprint of aquaculture while simultaneously increasing production yields. The multi-indicator assessment approach provided a more holistic vision of the benefits and effectiveness of our IMTA system. A better understanding of the growth potential of the different species reared together related to the species selection and species density of each component was realized. Species selection based on their nutritional traits and functions in the system in order to maximize the use of system solids was successful. The utilization of growth performance indicators, along with water and sediment quality assessments, toxicity assays, and biomarkers, facilitated a deeper understanding of organism-environment interactions. It was evident that fish feed composition significantly influences IMTA system dynamics, similar to its impact on traditional monoculture systems.

Author Contributions

Conceptualization, E.C. (Efthimia Cotou); methodology, E.C. (Efthimia Cotou) and H.M.; validation, E.C. (Efthimia Cotou) and H.M.; formal analysis, E.C. (Efthimia Cotou), H.M., E.C. (Evanthia Chatzoglou), E.S., N.P., D.K., E.F., A.A., A.K. and G.A.; investigation, E.C. (Efthimia Cotou) and H.M.; writing—original draft preparation, E.C. (Efthimia Cotou), H.M. and C.N.; data curation, E.C. (Efthimia Cotou), H.M., E.S., D.K. and G.A.; writing—review and editing, E.C. (Efthimia Cotou), H.M. and C.N.; visualization, E.C. (Efthimia Cotou) and H.M.; supervision, E.C. (Efthimia Cotou); funding acquisition, E.C. (Efthimia Cotou) and H.M.; project administration, E.C. (Efthimia Cotou). All authors have read and agreed to the published version of the manuscript.

Funding

This study was conducted within the framework of the IMTA-EFFECT project of the COFASP ERA-NETs program, with financial support from the General Secretariat of Research and Technology (GSRT) of Greece (project code: T3EPA-00045).

Institutional Review Board Statement

The fish-holding facilities used were certified (EL-25-BIO-037) from the Greek Veterinary authorities for the breeding and use of animals for scientific investigations. All animal handling and sampling procedures were conducted in strict adherence to Greek (PD 56/2013) and EU (Directive 63/2010) regulations governing the welfare of animals used for scientific purposes.

Data Availability Statement

Data are available upon request.

Conflicts of Interest

The authors declare no conflicts of interest.

References

  1. UN DESA. World Population Prospects 2019: Highlights. 2019. Available online: https://www.un.org/development/desa/publications/world-population-prospects-2019-highlights.html (accessed on 20 December 2020).
  2. Duarte, C.M.; Holmer, M.; Olsen, Y.; Soto, D.; Marbà, N.; Guiu, J.; Black, K.; Karakassis, I. Will the Oceans Help Feed Humanity? BioScience 2009, 59, 967–976. [Google Scholar] [CrossRef]
  3. Food and Agriculture Organization. The State of World Fisheries and Aquaculture 2018. Meeting the Sustainable Development Goals. 2018. Available online: http://www.fao.org/documents/card/zh/c/I9540EN/ (accessed on 5 October 2023).
  4. Food and Agriculture Organization. The State of World Fisheries and Aquaculture 2020: Sustainability in Action; FAO: Rome, Italy, 2020. [Google Scholar]
  5. Food and Agriculture Organization. The State of World Fisheries and Aquaculture 2022; Towards Blue Transformation; FAO: Rome, Italy, 2022. [Google Scholar] [CrossRef]
  6. Godfray, H.C.J.; Beddington, J.R.; Crute, I.R.; Haddad, L.; Lawrence, D.; Muir, J.F.; Pretty, J.; Robinson, S.; Thomas, S.M.; Toulmin, C. Food security: The challenge of feeding 9 billion people. Science 2010, 327, 812–818. [Google Scholar] [CrossRef] [PubMed]
  7. Costello, C.; Cao, L.; Gelcich, S.; Cisneros, M.; Free, C.; Froehlich, H. (Eds.) The Future of Food from the Sea; World Resources Institute: Washington, DC, USA, 2019. [Google Scholar]
  8. European Commission, Directorate-General for Maritime Affairs and Fisheries. A New Strategic Vision for Sustainable Aquaculture Production and Consumption in the European Union—Blue Farming in the European Green Deal. Publications Office of the European Union. 2021. Available online: https://data.europa.eu/doi/10.2771/961425 (accessed on 6 December 2023).
  9. Federation of Greek Maricultures (FGM). Annual Report, Aquaculture in Greece; FGM: Athens, Greece, 2019. [Google Scholar]
  10. Massa, F.; Onofri, L.; Fezzardi, D. Aquaculture in the Mediterranean and the Black Sea: A Blue Growth perspective. In Handbook on the Economics and Management of Sustainable Oceans; Edward Elgar Publishing: Cheltenham, UK, 2017; pp. 93–123. [Google Scholar]
  11. Mavraganis, T.; Constantina, C.; Kolygas, M.; Vidalis, K.; Nathanailides, C. Environmental issues of aquaculture development. Egypt. J. Aquat. Biol. Fish. 2020, 24, 441–450. [Google Scholar] [CrossRef]
  12. Kalantzi, I.; Karakassis, I. Benthic impacts of fish farming: Meta-analysis of community and geochemical data. Mar. Pollut. Bull. 2006, 52, 484–493. [Google Scholar] [CrossRef] [PubMed]
  13. Pitta, P.; Tsapakis, M.; Apostolaki, E.T.; Tsagaraki, T.; Holmer, M.; Karakassis, I. Ghost nutrients’ from fish farms are transferred up the food web by phytoplankton grazers. Mar. Ecol. Prog. Ser. 2009, 374, 1–6. [Google Scholar] [CrossRef]
  14. Pageorgiou, N.; Kalantzi, I.; Karakassis, I. Effects of fish farming on the biological and geochemical properties of muddy and sandy sediments in the Mediterranean Sea. Mar. Environ. Res. 2010, 69, 326–336. [Google Scholar] [CrossRef] [PubMed]
  15. Carballeira Braña, C.B.; Cerbule, K.; Senff, P.; Stolz, I.K. Towards environmental sustainability in marine finfish aquaculture. Front. Mar. Sci. 2021, 8, 666662. [Google Scholar] [CrossRef]
  16. Kokou, F.; Fountoulaki, E. Aquaculture waste production associated with antinutrient presence in common fish feed plant ingredients. Aquaculture 2018, 495, 295–310. [Google Scholar] [CrossRef]
  17. Fountoulaki, E.; Vasilaki, A.; Nikolopoulou, D.; Schrama, J.; Kaushik, P.; Prabu, A.J. Faecal waste production, characteristics and recovery in European seabass (Dicentrarchus labrax) is affected by dietary ingredient composition. Aquaculture 2022, 548, 737582. [Google Scholar] [CrossRef]
  18. CEC. COM 511-Communication from the Commission to the Council and the European Parliament: A Strategy for the Sustainable Development of European Aquaculture, Commission of the European Communities (CEC), Brussels. 2002. Available online: https://eur-lex.europa.eu/LexUriServ/LexUriServ.do?uri=COM:2002:0511:FIN:EN:PDF (accessed on 18 September 2023).
  19. Chopin, T. Aquaculture, integrated multi-trophic (IMTA). In Encyclopedia of Sustainability Science and Technology; Springer: Dordrecht, The Netherlands, 2013; Volume 12, pp. 542–564. [Google Scholar]
  20. Klaoudatos, D.S.; Nathanailides, C.; Conides, A.; Klaoudatos, S.D. How green can aquaculture be? In Proceedings of the 1st International Congress of Applied Ichthyology & Aquatic Environment, HydroMedit 2014, Volos, Greece, 13–15 November 2014; pp. 83–85. [Google Scholar]
  21. Park, M.; Shin, S.K.; Do, Y.H.; Yarish, C.; Kim, J.K. Application of open water integrated multi-trophic aquaculture to intensive monoculture: A review of the current status and challenges in Korea. Aquaculture 2018, 497, 174–183. [Google Scholar] [CrossRef]
  22. Mansour, A.T.; Ashour, M.; Alprol, A.E.; Alsaqufi, A.S. Aquatic Plants and Aquatic Animals in the Context of Sustainability: Cultivation Techniques, Integration, and Blue Revolution. Sustainability 2022, 14, 3257. [Google Scholar] [CrossRef]
  23. Papageorgiou, N.; Dimitriou, P.D.; Chatzivasileiou, D.; Tsapalis, M.; Karakassis, I. Can IMTA provide added ecosystem value services in the fish farms of Greece? Front. Mar. Sci. 2023, 9, 1083099. [Google Scholar] [CrossRef]
  24. Barrington, K.; Chopin, T.; Robinson, S. Integrated multi-trophic aquaculture (IMTA) in marine temperate waters. In Integrated Mariculture: A Global Review; Soto, D., Ed.; FAO Fisheries and Aquaculture Technical Paper; FAO: Rome, Italy, 2009; Volume 529, pp. 7–46. [Google Scholar]
  25. Horner, G.H.; Rosenthal, H.; Kruner, G. Fluctuation of water quality during the experimental rearing of juvenile Sarotherodon galilaeus. J. Aquacult. Trop. 1987, 2, 273–276. [Google Scholar]
  26. Poxton, M.G.; Allouse, S.B. Cyclical fluctuations of ammonia and nitrite nitrogen resulting from feeding of turbot, Scophthalmus maximus (L.) in recirculating systems. Aquacult. Eng. 1987, 6, 301–322. [Google Scholar] [CrossRef]
  27. van Keulen, H.; Seligman, N.G. Simulation of Water Use, Nitrogen Nutrition and Growth of Spring Wheat Crop; Pudoc: Wageningen, The Netherlands, 1987; 310p. [Google Scholar]
  28. Lee, K.; Tong, L.T.; Millero, F.J.; Sabine, C.L.; Dickson, A.G.; Goyet, C.; Park, G.-H.; Wanninkhof, R.; Feely, R.; Key, R.M. Global relationships of total alkalinity with salinity and temperature in surface waters of the world’s oceans. Geophys. Res. Lett. 2006, 33, L19605. [Google Scholar] [CrossRef]
  29. European Commission, Joint Research Centre, Scientific, Technical and Economic Committee for Fisheries. Economic Report on the EU Aquaculture (STECF-22-17); Guillen, J., Virtanen, J., Nielsen, R., Eds.; Publications Office of the European Union: Luxembourg, 2023; Available online: https://data.europa.eu/doi/10.2760/51391 (accessed on 19 December 2023).
  30. Loucas, A.; Beninger, P.G. The use of physiological condition indices in marine bivalve aquaculture. Aquaculture 1985, 44, 187–200. [Google Scholar] [CrossRef]
  31. Rainer, J.S.; Mann, R. A comparison of methods for calculating condition index in eastern oysters, Crassostrea virginica (GMELIN, 1791). J. Shellfish Res. 1992, 11, 55–58. [Google Scholar]
  32. Yildiz, H.; Mustafa, P.; Musa, B. Condition indices of Mediterranean Mussels (Mytilus galloprovincialis L. 1819) growing on suspended ropes in Dardanelles. J. Food Technol. 2006, 4, 221–224. [Google Scholar]
  33. Peharda, M.; Zupan, I.; Bavcevic, L.; Frankic, A.; Klanjscek, T. Growth and condition index of mussel Mytilus galloprovincialis in experimental integrated aquaculture. Aquac. Res. 2007, 38, 1714–1720. [Google Scholar] [CrossRef]
  34. Župan, I.; Šaric, T. Growth and condition index—Two important factors in mussel farming. Meso Prvi Hrvat. Èasopis O Mesu. 2014, 16, 255–259. [Google Scholar]
  35. Orban, E.; Di Lena, G.; Nevigato, T.; Casini, I.; Marzetti, A.; Caproni, R. Seasonal changes in meat content, condition index and chemical composition of mussels (Mytilus galloprovincialis) cultured in two different Italian sites. Food Chem. 2002, 77, 57–65. [Google Scholar] [CrossRef]
  36. Sasikumar, G.; Krishnakumar, P.K. Aquaculture planning for suspended bivalve farming systems. The integration of physiological response of green mussel with environmental variability in site selection. Ecol. Indic. 2011, 11, 734–740. [Google Scholar] [CrossRef]
  37. Hickman, R.W.; Illingworth, J. Condition cycle of the green-lipped mussel Perna canaliculus in New Zealand. Mar. Biol. 1980, 60, 27–38. [Google Scholar] [CrossRef]
  38. Pérez-Camacho, A.; Labarta, U.; Vinseiro, V.; Fernández-Reiriz, M.J. Mussel Production Management: Raft Culture without Thinning-out. Aquaculture 2013, 406–407, 172–179. [Google Scholar] [CrossRef]
  39. Jesus, F.; Mesquita, F.; Virumbrales Aldama, E.; Marques, A.; Gonçalves, A.M.M.; Magalhães, L.; Nogueira, A.J.A.; Ré, A.; Campos, I.; Pereira, J.L.; et al. Do Freshwater and Marine Bivalves Differ in Their Response to Wildfire Ash? Effects on the Antioxidant Defense System and Metal Body Burden. Int. J. Environ. Res. Public Health 2023, 20, 1326. [Google Scholar] [CrossRef] [PubMed]
  40. Ezgeta-Balic, D.; Najdek, M.; Peharda, M.; Blazina, M. Seasonal fatty acid profile analysis to trace origin of food sources of four commercially important bivalves. Aquaculture 2012, 334–337, 89–100. [Google Scholar] [CrossRef]
  41. Haoujar, I.; Haoujar, M.; Altemimi, A.B.; Essafi, A.; Cacciola, F. Nutritional, sustainable source of aqua feed and food from microalgae: A mini review. Int. Aquat. Res. 2022, 14, 157–167. [Google Scholar]
  42. Mazzola, A.; Sarà, G. The effect of fish farming organic waste on food availability for bivalve molluscs (Gaeta Gulf, Central Tyrrhenian, MED): Stable carbon isotopic analysis. Aquaculture 2001, 192, 361–379. [Google Scholar] [CrossRef]
  43. Troell, M.; Joyce, A.; Chopin, T.; Neori, A.; Buschmann, A.H.; Fang, J.-G. Ecological engineering in aquaculture—Potential for integrated multi-trophic aquaculture (IMTA) in marine offshore systems. Aquaculture 2009, 297, 1–9. [Google Scholar] [CrossRef]
  44. Troell, M.; Norberg, J. Modelling output and retention of suspended solids in an integrated salmon–mussel culture. Ecol. Model. 1998, 110, 65–77. [Google Scholar] [CrossRef]
  45. Cranford, P.J.; Reid, G.K.; Robinson Shawn, M.C. Open water integrated multi-trophic aquaculture: Constraints on the effectiveness of mussels as an organic extractive component. Aquac. Environ. Interact. 2013, 4, 163–173. [Google Scholar] [CrossRef]
  46. Cubillo, A.M.; Ferreira, G.; Robinson, S.M.C.; Pearce, C.M.; Corner, R.A.; Johansen, J. Role of deposit feeders in Integrated Multi-Trophic Aquaculture—A model analysis. Aquaculture 2016, 453, 54–66. [Google Scholar] [CrossRef]
  47. Cutajar, K.; Falconer, L.; Massa-Gallucci, A.; Cox, R.E.; Schenke, L.; Bardócz, T.; Sharman, A.; Deguara, S.; Telfer, T.C. Culturing the Sea Cucumber Holothuria poli in Open-Water Integrated Multi-Trophic Aquaculture at a Coastal Mediterranean Fish Farm. Aquaculture 2022, 550, 737881. [Google Scholar] [CrossRef]
  48. Cutajar, K.; Falconer, L.; Massa-Gallucci, A.; Cox, R.E.; Schenke, L.; Bardocz, T.; Andolina, C.; Signa, G.; Vizzini, S.; Sprague, M.; et al. Stable isotope and fatty acid analysis reveal the ability of sea cucumbers to use fish farm waste in integrated multi-trophic aquaculture. J. Environ. Manag. 2022, 318, 115511. [Google Scholar] [CrossRef] [PubMed]
  49. Hossain, A.; Senff, P.; Glaser, M. Lessons for coastal applications of IMTA as a way towards sustainable development: A review. Appl. Sci. 2022, 12, 11920. [Google Scholar] [CrossRef]
  50. Neofitou, N.; Lolas, A.; Ballios, I.; Skordas, K.; Tziantziou, L.; Vafidis, D. Contribution of sea cucumber Holothuria tubulosa on organic load reduction from fish farming operation. Aquaculture 2019, 501, 97–103. [Google Scholar] [CrossRef]
  51. Naylor, R.L.; Hardy, R.W.; Buschmann, A.H.; Bush, S.R.; Cao, L.; Klinger, D.H.; Little, D.C.; Lubchenco, J.; Shumway, S.E.; Troell, M. A 20-year retrospective review of global aquaculture. Nature 2021, 591, 551–563. [Google Scholar] [CrossRef]
  52. Thomas, M.; Pasquet, A.; Aubin, J.; Nahon, S.; Lecocq, T. When more is more: Taking advantage of species diversity to move towards sustainable aquaculture. Biol. Rev. 2021, 96, 767–784. [Google Scholar] [CrossRef]
  53. Ferreira, J.G.; Saurel, C.; Ferreira, J.M. Cultivation of gilthead bream in monoculture and integrated multi-trophic aquaculture. Analysis of production and environmental effects by means of the farm model. Aquaculture 2012, 358–359, 23–24. [Google Scholar] [CrossRef]
  54. Sarà, G.; Zenone, A.; Tomasello, A. Growth of Mytilus galloprovincialis (mollusca, bivalvia) close to fish farms: A case of integrated multi-trophic aquaculture within the Tyrrhenian Sea. Hydrobiologia 2009, 636, 129–136. [Google Scholar] [CrossRef]
  55. Sara, G.; Reid, G.K.; Rinaldi, A.; Palmeri, V.; Troell, M.; Kooijman, S.A.L.M. Growth and reproductive simulation of candidate shellfish species at fish cages in the Southern Mediterranean: Dynamic Energy Budget (DEB) modeling for integrated multi-trophhic aquaculture. Aquaculture 2012, 324–325, 259–266. [Google Scholar] [CrossRef]
  56. Arduini, D.; Portassi, G.; Giangrande, A.; Acquaviva, M.I.; Borghese, J.; Calabrese, C.; Giandomenico, S.; Quarta, E.; Stabili, L. Growth performance of Mytilus galloprovincialis Lamark, 1819, under an Innovative Integrated Multi-Trophic Aquaculture System (IMTA) in the Mar Grande of Taranto (Mediterranean Sea, Italy). Water 2023, 15, 1922. [Google Scholar] [CrossRef]
  57. MacDonald, C.L.E.; Stead, S.M.; Slater, M.J. Consumption and remediation of European seabass (Dicentrarchus labrax) waste by the sea cucumber Holothuria forskali. Aquacult. Int. 2013, 21, 1279–1290. [Google Scholar] [CrossRef]
  58. Holm-Hansen, O.; Lorenzen, O.C.J.; Holmes, R.W.; Strickland, J.D. Fluorometric determination of chlorophyll. J. Cons. Cons. Int. Explor. Mer. 1965, 30, 3–15. [Google Scholar] [CrossRef]
  59. Hedges, J.I.; Stern, J.H. Carbon and nitrogen determinations of carbonate-containing solids1. Limnol. Oceanogr. 1984, 29, 657–663. [Google Scholar] [CrossRef]
  60. Association of Official Analytical Chemists. Official Methods of Analysis of AOAC International; AOAC International: Gaithersburg, MD, USA, 2005. [Google Scholar]
  61. Nengas, I.; Alexis, M.N.; Davies, S.J.; Petichakis, G. Investigation to determine digestibility coefficients of various raw materials in diets for gilthead sea bream, Sparus auratus L. Aquac. Res. 1995, 26, 185–194. [Google Scholar] [CrossRef]
  62. Lepage, G.; Roy, C.C. Improved recovery of fatty acid through direct transesterification without prior extraction or purification. J. Lipid Res. 1984, 25, 1391–1396. [Google Scholar] [CrossRef] [PubMed]
  63. Azur Environmental. Microtox Omnio Manual; Azur Environmental: Carlsbad, CA, USA, 1998. [Google Scholar]
  64. Bombardier, M.; Bermingham, N. The SED-TOX index: Toxicity directed management tool to assess and rank sediments based on their hazard—Concept and application. Environ. Toxicol. Chem. 1999, 18, 685–698. [Google Scholar]
  65. Environment Canada. Biological Test Method: Reference Method for Determining the Toxicity of Sediment Using Luminescent Bacteria in a Solid-Phase Test; Report EPS 1/RM/42; Environmental Protection Service: Ottawa, ON, Canada, 2002. [Google Scholar]
  66. Muyzer, G.; De Waal, E.C.; Uitterlinden, A.G. Profiling of complex microbial populations by denaturing gradient gel electrophoresis analysis of polymerase chain reaction-amplified genes coding for 16S rRNA. Appl. Environ. Microbiol. 1993, 59, 695–700. [Google Scholar] [CrossRef]
  67. Yu, Z.; Morrison, M. Comparisons of Different Hypervariable Regions of rrs Genes for Use in Fingerprinting of Microbial Communities by PCR-Denaturing Gradient Gel Electrophoresis. Appl. Environ. Microbiol. 2004, 70, 4800–4806. [Google Scholar] [CrossRef]
  68. Santander-de Leon, S.M.S.; Nuñal, S.N.; Wei, H.; Yoshikawa, T.; Maeda, H. Bacterial community composition shifts in sediments influenced by fish feeds. Aquac. Res. 2017, 48, 4380–4389. [Google Scholar] [CrossRef]
  69. Sørensen, T. A method of establishing groups of equal amplitude in plant sociology based on similarity of species and its application to analyses of the vegetation on Danish commons. Biol. Skr. 1957, 5, 1–34. [Google Scholar]
  70. Pagou, K.; Siokou-Frangou, I.; Papathanassiou, E. Nutrients and their ratios in relation to eutrophication and HAB occurrence. The case of Eastern Mediterranean coastal waters. In Proceedings of the Second Workshop on Thresholds of Environmental Sustainability: The Case of Nutrients, Brussels, Belgium, 18–19 June 2002. [Google Scholar]
  71. Torsvik, V.; Daae, F.L.; Sandaa, R.A.; Ovreas, L. Novel techniques for analyzing microbial diversity in natural and perturbed environments. J. Biotechnol. 1998, 64, 53–62. [Google Scholar] [CrossRef] [PubMed]
  72. Chopin, T.; Cooper, J.A.; Reid, G.; Cross, S.; Moore, C. Open-water integrated multi-trophic aquaculture: Environmental biomitigation and economic diversification of fed aquaculture by extractive aquaculture. Rev. Aquac. 2012, 4, 209–220. [Google Scholar] [CrossRef]
  73. Samaras, A.; Pavlidis, M.; Lika, K.; Theodoridi, A.; Papandroulakis, N. Scale matters: Performance of European sea bass, Dicentrarchus labrax, L. (1758), reared in cages of different volumes. Aquac. Res. 2017, 48, 990–1005. [Google Scholar]
  74. Cheyadmi, S.; Chadli, H.; El Yamlahi, B.; El Maadoudi, M.; Cacciola, F.; Kounnoun, A.; Nhhala, H.; Chairi, H. Physiological stress responses of European sea bass Dicentrarchus labrax related to changing operations of floating net cages in intensive farming conditions at the Moroccan M’diq Bay. J. Fish. Biol. 2023, 103, 1190–1198. [Google Scholar] [CrossRef] [PubMed]
  75. Fry, J.P.; A Mailloux, N.; Love, D.C.; Milli, M.C.; Cao, L. Feed conversion efficiency in aquaculture: Do we measure it correctly? Environ. Res. Lett. 2018, 13, 024017. [Google Scholar] [CrossRef]
  76. Aubin, J.; Papatryphon, E.; van der Werf, H.M.G.; Chatzifotis, S. Assessment of the environmental impact of carnivorous finfish production systems using life cycle assessment. J. Clean. Prod. 2009, 17, 354–361. [Google Scholar] [CrossRef]
  77. García García, B.; Rosique Jiménez, C.; Aguado-Giménez, F.; García García, J. Life Cycle Assessment of Seabass (Dicentrarchus labrax) Produced in Offshore Fish Farms: Variability and Multiple Regression Analysis. Sustainability 2019, 11, 3523. [Google Scholar] [CrossRef]
  78. Eriegha, O.J.; Ekokotu, P.A. Factors affecting feed intake in cultured fish species: A review. Anim. Res. Int. 2017, 14, 2697–2709. [Google Scholar]
  79. Kousoulaki, K.; Saether, B.-S.; Albrektsen, S.; Noble, C.; Sæther, B. Review on European sea bass (Dicentrarchus labrax, Linnaeus, 1758) nutrition and feed management: A practical guide for optimizing feed formulation and farming protocols. Aquac. Nutr. 2015, 21, 129–151. [Google Scholar] [CrossRef]
  80. Chatzivasileiou, D.; Dimitriou, P.D.; Theodorou, J.; Kalantzi, I.; Magiopoulos, I.; Papageorgiou, N.; Pitta, P.; Tsapakis, M.; Karakassis, I. An IMTA in Greece: Co-Culture of Fish, Bivalves, and Holothurians. J. Mar. Sci. Eng. 2022, 10, 776. [Google Scholar] [CrossRef]
  81. Purcell, S.W.; Conand, C.; Uthicke, S.; Byrne, M. Ecological Roles of Exploited Sea Cucumbers. Oceanogr. Mar. Biol. Annu. Rev. 2016, 54, 367–386. [Google Scholar]
  82. Zamora, L.N.; Yuan, X.; Carton, A.G.; Slater, M.J. Role of deposit-feeding sea cucumbers in integrated multitrophic aquaculture: Progress, problems, potential and future challenges. Rev. Aquac. 2018, 10, 57–74. [Google Scholar] [CrossRef]
  83. Ahlgren, M.O. Consumption and Assimilation of Salmon Net Pen Fouling Debris by the Red Sea Cucumber Parastichopus californicus: Implications for Polyculture. J. World Aquac. Soc. 1998, 29, 133–139. [Google Scholar] [CrossRef]
  84. Grosso, L.; Rakaj, A.; Fianchini, A.; Morroni, L.; Cataudella, S.; Scardi, M. Integrated Multi-trophic Aquaculture (IMTA) System Combining the Sea Urchin Paracentrotus Lividus, as Primary Species, and the Sea Cucumber Holothuria Tubulosa as Extractive Species. Aquaculture 2021, 534, 736268. [Google Scholar] [CrossRef]
  85. Grosso, G.; Rampacci, M.; Pensa, D.; Fianchini, A.; Batır, E.; Aydin, İ.; Ciriminna, L.; Felix, P.M.; Pombo, A.; Lovatelli, A. Evaluating sea cucumbers as extractive species for benthic bioremediation in mussel farms. Sci. Rep. 2023, 13, 1457. [Google Scholar] [CrossRef] [PubMed]
  86. Tolon, M.T.; Emiroğlu, D.; Günay, D.; Özgül, A. Sea Cucumber (holothuria Tubulosa Gmelin, 1790) Culture Under Marine Fish Net Cages for Potential Use in Integrated Multi-trophic Aquaculture (IMTA). Indian J. Geo Marine Sci. 2017, 46, 749–756. [Google Scholar]
  87. Sadoul, B.; Caprioli, J.-P.; Barrier-Loiseau, C.; Cimiterra, N.; Laugier, T.; Lagarde, F.; Chary, K.; Callier, M.D.; Guillermard, M.-O.; Roque D’Orbcastel, E. Is Holothuria Tubulosa the Golden Goose of Ecological Aquaculture in the Mediterranean Sea? Aquaculture 2022, 5544, 738149. [Google Scholar] [CrossRef]
  88. Van Biesen, G.; Parrish, C.C. Long-chain Monounsaturated Fatty Acids as Biomarkers for the Dispersal of Organic Waste from a Fish Enclosure. Mar. Environ. Res. 2005, 60, 375–388. [Google Scholar] [CrossRef]
  89. Vita, R.; Marín, A.; Madrid, J.A.; Jiménez-Brinquis, B.; Cesar, A.; Marín-Guirao, L. Effects of Wild Fishes on Waste Exportation from a Mediterranean Fish Farm. Mar. Ecol. Prog. Ser. 2004, 277, 253–261. [Google Scholar] [CrossRef]
  90. Brooks, K.M.; Mahnken, C.V.W. Interactions of Atlantic salmon in the Pacific northwest environment II. Organic wastes. Fish. Res. 2003, 62, 255–293. [Google Scholar] [CrossRef]
  91. Weston, D. Quantitative Examination of Macrobenthic Community Changes Along an Organic Enrichment Gradient. Mar. Ecol. Prog. Ser. 1990, 61, 233–244. [Google Scholar] [CrossRef]
  92. Karakassis, I.; Tsapakis, M.; Hatziyanni, E.; Papadopoulou, K.-N.; Plaiti, W. Impact of Cage Farming of Fish on the Seabed in Three Mediterranean Coastal Areas. ICES J. Mar. Sci. 2000, 57, 1462–1471. [Google Scholar] [CrossRef]
  93. Cotou, E.; Fountoulaki, Ε.; Henry, Μ. Screening the toxicity of “alternative” fish-feeds and fish fecal waste with a rapid, cost effective biotest. In Proceedings of the Aquaculture Europe, Edinburgh, Scotland, 20–23 September 2016; p. 227. [Google Scholar]
  94. Cotou, E.; Grémare, A.; Charles, F.; Hatzianestis, I.; Sklivagou, E. Potential toxicity of resuspended particulate matter and sediments: Environmental samples from the Bay of Banyuls-sur-Mer and Thermaikos Gulf. Cont. Shelf Res. 2005, 25, 2526–2531. [Google Scholar] [CrossRef]
  95. Burga Perez, K.F.; Charlatchka, R.; Sahli, L.; Ferard, J.-F. New methodological improvements in the Microtox® solid phase assay. Chemosphere 2012, 86, 105–110. [Google Scholar] [CrossRef]
  96. Campo, P.; Zhao, Y.; Suidan, M.T.; Venosa, A.D.; Sorial, G.A. Biodegradation kinetics and toxicity of vegetable oil triacylglycerols under aerobic conditions. Chemosphere 2007, 68, 2054–2062. [Google Scholar] [CrossRef]
Figure 1. The conceptual approach of the IMTA system consisted of finfish, filter and deposit feeders all reared together in the same unit.
Fishes 09 00069 g001
Figure 2. Synoptic illustration of the experimental design (concrete tanks, selected species, density of mass and other rearing conditions) for the IMTA systems.
Fishes 09 00069 g002
Figure 3. Temporal variation of total particulate matter (TPM) and Chl-a concentrations in the monoculture and in the IMTA system. Vertical lines indicate the SD.
Fishes 09 00069 g003
Figure 4. Temporal variation of particulate organic nitrogen (PON) and particulate organic carbon (POC) in monoculture and IMTA systems. Vertical lines indicate the SD; red circles indicate significant differences between the two rearing systems).
Fishes 09 00069 g004
Figure 5. Temporal variation of total particulate matter (TPM) and Chl-a concentrations in two IMTA systems where fish were fed on different commercial diets (F-M and L-F-M).
Fishes 09 00069 g005
Figure 6. Temporal variation of particulate organic nitrogen (PON) and carbon (POC) in two IMTA systems where fish fed on different commercial fish feeds, a 35% fish meal feed (FM group) and a 20% fish meal feed (LFM group).
Fishes 09 00069 g006
Figure 7. Toxicity of two commercially available fish feeds. Effective concentration (EC50) values of the 35% fish meal feed (FM group) and the 20% fish meal feed (L-Fish Meal, LFM group). Vertical bars indicate the SD. The asterisk indicates significant difference (p < 0.05).
Fishes 09 00069 g007
Figure 8. Toxicity of sediments. Effective concentration (EC50) values of sediments in the monoculture and IMTA systems and 35% fish meal (FM-IMTA) and 20% low fish meal (LFM-IMTA). Vertical bars indicate the SD. The asterisk indicates significant difference (p < 0.05).
Fishes 09 00069 g008
Figure 9. Screening changes in sediment bacterial community.
Fishes 09 00069 g009
Table 1. Composition and proximate analysis of the two commercially available fish feeds used in the experiments (in % dry weight means ± sd, * significant, p < 0.05).
ConcentrationFM—Fish Meal (Feed A)LFM—Low Fish Meal (Feed B)
Ingredients (%)
Fish meal3520
Fish oil1511
Hemoglobin-5
Soy1010
Soy protein concentrate12-
Sunflower514
Corn gluten205
Guar flour-10
Wheat-14
Soya oil-6
Minerals/Vitamins35
Proximate analysis
Moisture (%)8.25 ± 0.047.89 ± 0.12
Ash (%)8. 65 ± 0.028.20 ± 0.05
Total fibers (%)2.60 ± 0.02 *5.74 ± 0.08
Lipids (%)16. 83 ± 0.20 *19.50 ± 0.21
Proteins (%)45.23 ± 0.17 *38.52 ± 0.09
Phosphorus (%)1.1 ± 0.020.9 ± 0.09
Carbohydrates (%)22.45 ± 0.3022.12 ± 0.25
Table 2. Growth indicators of finfish (Dicentrarchous labrax) in the first experiment (# significant different between initial and final weight and * significant different between the systems, p < 0.05).
MonocultureIMTA Systemp Value (Comparison between the Systems)
Initial weight (g)146.52 ± 33.24146.52 ± 33.240.500
Final weight (g)201.00 ± 1.81 #202.86 ± 0.42 #0.212
Survival (%)91.90 ± 3.9598.22 ± 1.340.135
WG (g/fish)54.48 ± 1.8156.34 ± 0.420.212
SGR (%/day)0.58 ± 0.090.68 ± 0.030.199
FCR1.66 ± 0.011.47 ± 0.010.002 *
FE (%)60.38 ± 0.2468.10 ± 0.460.002 *
Condition factor, K (%)1.17 ± 0.021.16 ± 0.010.279
Table 3. Growth indicators of filter feeders in IMTA system.
O. edulisC. gigasM. galloprovincialis
Survival (%)100100100
Initial weight (g)74.41 ± 0.4598.79 ± 0.0529.70 ± 0.39
Middle (g)76.56 ± 0.38101.42 ± 1.9231.14 ± 0.30
Final weight (g)77.02 ± 0.22115.38 ± 5.8032.09 ± 1.22
WG (g)2.61 ± 06816.58 ± 5.852.39 ± 1.62
SGR (%/day)0.057 ± 0.0150.257 ± 0.0850.212 ± 0.002
Length (cm)
O. edulisC. gigasM. galloprovincialis
Initial length (cm)7.66 ± 0.029.80 ± 0.047.55 ± 0.00
Middle (cm)7.81 ± 0.1510.43 ± 0.157.62 ± 0.00
Final length (cm)7.87 ± 0.1310.60 ± 0.157.79 ± 0.12
Length gain (cm)0.21 ± 0140.80 ± 0.190.24 ± 0.12
SGR (%/day)0.044 ± 0.0300.104 ± 0.0300.052 ± 0.026
Condition Index (%)
O. edulisC. gigasM. galloprovincialis
Initial (DW tissue/DW shell)14.07 ± 3.8516.72 ± 2.8651.76 ± 16.02
Final (DW tissue/DW shell)11.76 ± 5.3115.13 ± 3.0348.50 ± 15.44
t-test (p > 0.05)0.1450.0970.233
Initial (DW tissue/L shell)9.41 ± 2.0310.55 ± 1.726.93 ± 1.76
Final (DW tissue/L shell)8.97 ± 3.329.67 ± 2.606.83 ± 2.19
t-test (p > 0.05)0.3640.1780.369
Table 4. Growth indicators of Holothuria sanctori (* significant different between initial and final wet weight, p < 0.05).
Survival (%)100
Initial (g)116.81 ± 2.87
Final (g)132.55 ± 2.58 *
WG (g/individual)16.78 ± 3.68
SGR (%/day)0.24 ± 0.04
Table 5. Fatty acids profile in sediments (mg/g) (ND = not detected; small letters indicate significant difference among the systems, p < 0.05).
InitialMonocultureIMTA System
SATURATED
14:00.19 ± 0.05 a0.69 ± 0.05 b0.37 ± 0.10 c
15:0ND0.09 ± 0.020.06 ± 0.01
16:00.60 ± 0.09 a2.84 ± 0.31 b1.55 ± 0.36
17:0ND0.05 ± 0.010.06 ± 0.03
18:00.11 ± 0.03 a0.67 ± 0.02 b0.36 ± 0.08 c
20:0ND0.10 ± 0.020.04 ± 0.01
22:00.04 ± 0.00 a0.12 ± 0.02 b0.07 ± 0.01 c
24:0ND0.13 ± 0.01 b0.09 ± 0.02 c
Sum SAT0.94 ± 0.12 a4.69 ± 0.46 b2.62 ± 0.60 c
MUFA
16:1n-90.07 ± 0.010.04 ± 0.020.02 ± 0.01
16:1n-70.35 ± 0.14 a0.78 ± 0.04 b0.41 ± 0.05 c
17:1n-90.04 ± 0.020.00 ± 0.000.00 ± 0.00
18:1n-90.10 ± 0.02 a2.53 ± 0.58 b0.63 ± 0.03 c
18:1n-70.11 ± 0.00 a0.91 ± 0.27 b0.49 ± 0.11 c
20:1n-11ND0.05 ± 0.030.04 ± 0.03
20:1n-9ND0.48 ± 0.17 b0.10 ± 0.01 c
20:1n-7ND0.03 ± 0.010.02 ± 0.00
22:1n-11ND0.64 ± 0.27 b0.10 ± 0.00 c
22:1n-9ND0.08 ± 0.050.01 ± 0.00
24:1n-9ND0.14 ± 0.04 b0.03 ± 0.00 c
Sum MUFA0.66 ± 0.14 a5.69 ± 1.47 b1.84 ± 0.15 c
n-3
18:3n-3ND0.22 ± 0.020.21 ± 0.14
18:4n-3ND0.08 ± 0.030.05 ± 0.03
20:5n-3 (EPA)0.13 ± 0.030.27 ± 0.100.27 ± 0.17
22:6n-3 (DHA)0.02 ± 0.00 a0.16 ± 0.03 b0.06 ± 0.03 c
Sum n-30.14 ± 0.04 a0.73 ± 0.17 b0.59 ± 0.37 b
n-6
18:2n-6ND1.06 ± 0.10 b0.35 ± 0.06 c
20:4n-6 (ARA)0.04 ± 0.010.11 ± 0.040.17 ± 0.11
Sum n-60.04 ± 0.01 a1.17 ± 0.06 b0.52 ± 0.17 c
Table 6. Growth indicators of Dicentrarchous labrax fed on different diets in two MTA systems (asterisks indicate significant difference between LFM and FM, p < 0.05).
LFM-IMTAFM-IMTAp-Value
Initial weight (g)120.64 ± 0.64118.94 ± 2.040.255
Final weight (g)166.98 ± 0.67171.6 ± 1.090.034 *
Survival (%)86.67 ± 10.0086.67 ± 0.000.500
WG (g/fish)46.34 ± 0.0352.66 ± 0.950.011 *
SGR (%/day)0.36 ± 0.0010.41 ± 0.0120.031 *
FCR2.39 ± 0.042.16 ± 0.060.040 *
FE (%)41.81 ± 0.6546.38 ± 1.280.043 *
Condition factor, K (%)1.17 ± 0.021.17 ± 0.010.446
Table 7. Growth indicators of the filter feeder Crassostrea gigas.
LFM-IMTAFM-IMTAp-Value
(between LFM and FM)
Survival (%)100100
Initial total weight (g)94.78 ± 1.8593.71 ± 0.790.324
Final total weight (g)99.63 ± 1.8198.12 ± 1.290.253
Total weight gain (g/indiv)4.85 ± 0.044.40 ± 0.500.235
Initial length (mm)99.84 ± 2.4899.40 ± 1.980.451
Final length (mm)103.95 ± 2.14102.36 ± 1.790.313
Length gain (mm)4.11 ± 0.352.96 ± 0.190.051
SGR (%/day)0.055 ± 0.0020.051 ± 0.0050.249
Initial soft tissue weight (g)8.05 ± 1.30
Final soft tissue weight (g)5.69 ± 1.675.34 ± 1.770.303
Final CI (%) tissue/shell length0.548 ± 0.0410.519 ± 0.0360.324
Final CI (%) tissue/shell weight5.722 ± 0.4125.410 ± 0.2130.286
Table 8. Growth indicators of the filter feeder Mytilus galloprovincialis.
LFM-IMTAFM-IMTAp-Value (between LFM and FM)
Survival (%)100100
Initial total weight (g)29.25 ± 0.0330.89 ± 0.200.057
Final total weight (g)30.53 ± 0.6531.81 ± 0.050.095
Total weight gain (g/individual)1.28 ± 0.620.92 ± 0.150.316
Initial length (mm)72.82 ± 0.0675.39 ± 0.120.061
Final length (mm)73.64 ± 0.3375.90 ± 0.140.052
Length gain (mm)0.82 ± 0.400.50 ± 0.030.254
SGR (%/day)0.05 ± 0.020.03 ± 0.010.297
Initial soft tissue weight (g)5.87 ± 1.70
Final soft tissue weight (g)3.50 ± 0.973.44 ± 0.820.268
Final CI (%) tissue/shell length4.77 ± 0.124.53 ± 0.140.166
Final CI (%) tissue/shell weight11.51 ± 0.4910.81 ± 0.350.180
Table 9. Growth indicators of the deposit feeders Holothuria tubulosa and Holothuria polii (# indicates significant difference between initial and final weight and * indicates significant difference between the systems, p < 0.05).
LFM-IMTAFM-IMTAp-Value (between LFM and FM)
H. tubulosa
Survival (%)100100
Initial weight (g)150.32 ± 17.67160.78 ± 16.920.243
Final weight (g)169.25 ± 10.61204.90 ± 31.41 #0.056
WG (g/individual)22.56 ± 15.4144.12 ± 17.570.081
SGR (%/day)0.11 ± 0.060.26 ± 0.080.046 *
H. polii
Survival (%)100100
Initial weight (g)92.83 ± 20.2993.05 ± 12.890.494
Final weight (g)102.34 ± 36.71103.52 ± 19.580.479
WG (g/individual)9.51 ± 9.9710.47 ± 4.080.445
SGR (%/day)0.09 ± 0.080.11 ± 0.080.320
Table 10. Fatty acids in sediments (mg/g) (* indicate significant difference between the systems, p < 0.05).
LFM-IMTAFM-IMTA
SATURATED
14:00.16 ± 0.01 *0.07 ± 0.01
15:00.06 ± 0.000.03 ± 0.00
16:00.91 ± 0.01 *0.57 ± 0.00
17:00.04 ± 0.010.02 ± 0.01
18:00.44 ± 0.010.39 ± 0.03
20:00.04 ± 0.000.02 ± 0.00
22:00.04 ± 0.010.02 ± 0.01
24:00.03 ± 0.000.03 ± 0.00
Sum SAT1.72 ± 0.01 *1.14 ± 0.01
MUFA
16:1n-90.03 ± 0.000.01 ± 0.00
16:1n-70.26 ± 0.01 *0.11 ± 0.01
17:1n-90.06 ± 0.010.06 ± 0.01
18:1n-90.54 ± 0.01 *0.18 ± 0.02
18:1n-70.25 ± 0.01 *0.13 ± 0.01
20:1n-110.05 ± 0.010.02 ± 0.01
20:1n-90.06 ± 0.010.03 ± 0.01
20:1n-70.01 ± 0.000.03 ± 0.01
22:1n-110.06 ± 0.010.04 ± 0.01
22:1n-90.01 ± 0.000.03 ± 0.01
24:1n-90.01 ± 0.000.00 ± 0.00
Sum MUFA1.34 ± 0.01 *0.63 ± 0.01
n-3
18:3n-30.03 ± 0.000.01 ± 0.00
18:4n-30.05 ± 0.000.06 ± 0.00
20:5n-3 (EPA)0.02 ± 0.000.01 ± 0.00
22:6n-3 (DHA)0.00 ± 0.000.01 ± 0.00
Sum n-30.11 ± 0.010.09 ± 0.00
n-6
18:2n-60.32 ± 0.01 *0.05 ± 0.01
20:4n-6 (ARA)0.02 ± 0.000.02 ± 0.01
Sum n-60.34 ± 0.01 *0.07 ± 0.02
Table 11. Concentration levels of organic loads in the sediments (* significant difference between systems, p < 0.05).
Total Proteins %Total Lipids (%)TOC %
MONOculture21.97 ± 0.101.23 ± 0.0419.99 ± 1.00
IMTA system18.88 ± 0.32 *0.56 ± 0.02 *16.40 ± 3.11 *
FM-IMTA system7.37 ± 0.180.27 ± 0.018.65 ± 0.06
LFM-IMTA system10.71 ± 0.42 *0.42 ± 0.01 *10.90 ± 0.03 *
Table 12. Sørensen similarity indices in sediment microbial communities (DGGE band profiles obtained from the monoculture (MONO) and IMTA samples).
Jaba + bCs IndexCs Coefficient
Initial vs. MONO22350.80080%
Initial vs. IMTA22460.66766.7%
MONO vs. IMTA33470.85785.7%
Table 13. Sørensen similarity indices in sediment microbial communities. (DGGE band profiles obtained from FM-IMTA and LFM-IMTA samples).
Jaba + bCs IndexCs Coefficient
Initial vs. FM-IMTA22460.66766.7%
Initial vs. LFM-IMTA22460.66766.7%
FM-IMTA vs. LFM-IMTA44481100%
Disclaimer/Publisher’s Note: The statements, opinions and data contained in all publications are solely those of the individual author(s) and contributor(s) and not of MDPI and/or the editor(s). MDPI and/or the editor(s) disclaim responsibility for any injury to people or property resulting from any ideas, methods, instructions or products referred to in the content.