Article

Estimating Cognitive Ability in the Wild: Validation of a Detour Test Paradigm Using a Cichlid Fish (Neolamprologus pulcher)

1
Department of Interdisciplinary Life Sciences, Konrad Lorenz Institute of Ethology, University of Veterinary Medicine Vienna, Savoyenstrasse 1, 1160 Vienna, Austria
2
Behavioural Evolution Lab, Max Planck Institute of Animal Behavior, 78467 Konstanz, Germany
3
Centre for the Advanced Study of Collective Behaviour, University of Konstanz, 78464 Konstanz, Germany
4
Department of Behavioral and Cognitive Biology, University of Vienna, Djerassiplatz 1, 1030 Vienna, Austria
*
Author to whom correspondence should be addressed.
Fishes 2024, 9(2), 50; https://doi.org/10.3390/fishes9020050
Submission received: 5 December 2023 / Revised: 29 December 2023 / Accepted: 17 January 2024 / Published: 27 January 2024
(This article belongs to the Special Issue Causes and Consequences of Cognitive Variation in Fishes)

Abstract

:
Cognitive abilities vary within and among species, and several hypotheses have been proposed to explain this variation. Two of the most prominent hypotheses regarding the evolution of cognition link increased social and habitat complexity with advanced cognitive abilities. Several studies have tested predictions derived from these two hypotheses, but these were rarely conducted under natural conditions with wild animals. However, this is of particular importance if we aim to link cognitive abilities with fitness-relevant factors to better understand the evolution of cognition. The biggest hurdle to assessing cognition in the wild is to find a suitable setup that is easy to use under field conditions. Here, we set out to evaluate an extremely simple test of cognitive ability for use with a broad range of aquatic animals in their natural habitat. We did so by developing a detour test paradigm in which fish had to detour a clear obstacle to reach a food reward. By altering the difficulty of the task, we confirmed that this setup is a valid test of cognitive abilities in wild groups of a Lake Tanganyika cichlid, Neolamprologus pulcher. Subsequently, we probed specific predictions from the two major hypotheses regarding cognitive evolution using the most difficult test configuration. Specifically, we tested the variation in cognitive abilities among groups of different sizes occupying habitats of varying complexity. We find mixed support for both hypotheses, but we hope that our work inspires future investigations on the evolution of cognition in Lake Tanganyika cichlids.
Key Contribution: Using a cichlid fish from Lake Tanganyika, this study evaluates, for the first time, a simple test of cognitive ability for use with a broad range of aquatic animals in their natural habitat. We found mixed support for specific predictions of two major hypotheses regarding cognitive evolution, but we hope that this study inspires future investigations on the evolution of cognition.

1. Introduction

Cognitive abilities vary widely across the animal kingdom [1]. The quest to explain this variation, together with the wish to better understand the roots of our own cognitive evolution [2] and explain the more astonishing examples of animal cognition (e.g., spatial memory [3] or communal hunting [4]), has inspired a large body of work [5]. From this literature, certain factors are indicated as interacting with the evolution and development of cognitive abilities [6]. Across species, ecological factors are emphasised [7,8], particularly sociality [9,10], habitat complexity [11], and diet [12]. Within species, early-life effects, particularly those relating to the social environment, and an individual’s current condition have received special attention in studies of cognitive ability [13,14,15,16]. Together, these intra- and interspecific studies suggest general trade-offs between the costs (e.g., the development and maintenance of a larger brain [17]) and benefits (e.g., increased success in contests [18]) of enhanced cognitive abilities [1].
Despite the consensus that cognitive ability is an evolved trait worth studying [19], there exists a wide range of approaches on how to actually do so [1,20]. A key issue in this regard is the fact that ‘cognitive ability’ is differentially expressed in different species [21]. It may, for example, be shown by enhanced spatial memory [3], improved group coordination [4], or sophisticated tool use [22]. It is, thus, not trivial to compare the cognitive abilities of species with very different ecologies and phylogenetic histories [23]. One suggestion for unifying the different ways of estimating cognitive ability is to use ‘behavioural flexibility’ as a general expression of cognition [24]. In this view, the exact form that cognitive ability takes is not important, but the fact that one species (or individual) is more behaviourally flexible than another is an indicator of its greater cognitive ability (by virtue of showing more different and/or more appropriate behaviours in a given context [24]). A paradigm that has proven useful in this regard is the ‘detour task’, a behavioural assessment of an animal’s ability to circumvent a (partly) invisible barrier that blocks the direct route to a reward [25]. This ability is then typically interpreted as a form of ‘inhibitory control’, itself a form of ‘behavioural flexibility’, which signifies greater cognitive ability in those animals that are better at detouring [25,26,27].
A second issue in the study of cognitive ability across the tree of life pertains to taxonomic biases in the taxa under investigation [23]. Much of the now classic work in animal cognition has focused on birds and mammals, with other taxa being relatively under-represented [5,8,20,28]. This is now rapidly changing as the literature on the cognitive abilities of nonavian and nonmammalian systems is steadily growing, especially for aquatic organisms (for recent reviews, see [29,30,31,32,33,34]). What this brings with it, however, is an increased need to resolve the above issue of making cognitive research ‘comparable’. In other words, we require new ways of assessing cognitive ability in ecologically relevant contexts that allow for comparisons not just within a given species (or small set of species with similar ecologies) but across a wide range of species and ecologies [23] and that are, ideally, compatible with past work [21]. Researchers working on birds and mammals have long identified this issue and, thus, have made progress in that direction (e.g., [8,22,35]), but cognition studies of other animals are somewhat lagging behind in this regard. For example, feeding tasks have been used to great success to study cleaner fish cognition with regard to the variation among related species [36], in comparison to other vertebrates [37], and to unravel the neurological and ecological underpinnings of the variation in cognitive ability [38]. However, it is difficult to translate such tests for studying organisms with different feeding ecologies, e.g., those feeding on plankton or grazing on algae.
Here, we set out to develop an extremely simple test of cognitive ability for use with a broad range of aquatic animals in their natural habitat. We did so by using the aforementioned paradigms of detour behaviour as a test of behavioural flexibility [25], and behavioural flexibility, in turn, as an indicator of general cognitive ability [24]. Our current work focuses on using this test to study variation in cognitive ability in response to differences in the social and structural environments of the cooperatively breeding Lake Tanganyika cichlid Neolamprologus pulcher. These fish offer great opportunities for studying cognition; this is because they are part of a large radiation of closely related species comprising a wide range of ecologies [39], they themselves constitute the pinnacle of fish sociality [40], and there already exists a large body of literature on their behavioural and cognitive responses to environmental stimuli ([15,41,42]; see Section 2 (Methods) for additional details on the study species and why it is a suitable subject for our work). In addition, our test requires low monetary and logistic investments, it can be used to target specific focal animals (provided they show sufficient site fidelity) or as an ad libitum test station offered to a range of species and individuals at a given location, and it is functional with any type of food that may serve as motivation for animals to interact with the test. As such, we believe that we here present an easy-to-adapt cognitive test for use in aquatic field work.
To prove the suitability of this approach, we conducted field experiments to probe two specific hypotheses about cognitive evolution that have previously found some support in studies of cichlids: First, the sociality and cognition hypothesis posits that animals that experience a more complex social environment show enhanced cognitive abilities [9]. While there is currently no indication that more social cichlid species have larger brains [43] or are better learners [44], effects of social rearing conditions [15,42] and current social status [45] on cognitive ability have been suggested in cichlids. In other taxa, the sociality and cognition hypothesis is also discussed controversially [12,46,47], with support coming from comparative work on primates and ungulates [9,48]. Many studies use group size as a proxy for social complexity, with the idea that cognitive demands increase with the number of group members [49,50]. In this regard most fish species are believed to be unsuitable study systems, because most fish shoals are considered a product of selection for predator avoidance (risk dilution, safety in numbers, predator confusion, etc.) without the need for direct interactions among shoal mates and, thus, no selection for higher cognitive abilities [51]. Nevertheless, there are studies in fish finding support for links between group size (or local density) and cognition [38,52]. Cichlids, particularly those from Lake Tanganyika, with their complex social behaviours, are an ideal taxon to test predictions derived from the sociality and cognition hypothesis [53]. We tested whether N. pulcher differed in their performance in our detour test in relation to their social environment, predicting that individuals from large groups would do better.
Second, the habitat complexity and cognition hypothesis states that animals that experience a more complex habitat show enhanced cognitive abilities [11]. There is comparative evidence that the structural environment shapes the brains and behaviour of cichlids [54], and other work suggests the role of changes to the environment during development in shaping the cognitive abilities of these fish [55]. In general, fish have a highly plastic brain, even as adults, and environmental factors are known to determine brain morphology and cognitive abilities in many fish species [56,57]. We tested whether N. pulcher differed in their performance in our detour test in relation to the structural complexity of their habitat, predicting that individuals from rockier locations would do better. Together, this study, thus, provides guidance on how to potentially test the cognitive abilities of aquatic organisms from a wide range of species and ecosystems and uses this setup to test two popular hypotheses about the evolution of cognitive ability.

2. Methods

2.1. Study Species

N. pulcher is a small (<10 cm maximum standard length) cichlid fish endemic to Lake Tanganyika, where it inhabits rocky habitats [58]. It is notable for its social system, being one of only a handful of fish species that exhibit truly cooperative brood care [40]. Both ecological constraints (in the form of predation [59]) and benefits of philopatry (in the form of enhanced survival and reproduction [60]) have been shown to select for the obligate sociality of this species [58]. Within each cooperative group, fish are organised in a size-based hierarchy [61] with the largest individuals of either sex largely monopolising reproduction [62]. As such, the benefits of sociality are size-specific: large individuals mainly profit from group-size effects on reproduction [63], while small individuals benefit from enhanced survival [59]. However, to reap these benefits, individuals are in a constant negotiation process over group membership and cooperative investment, the outcome of which is, at least partly, impacted by broader social and ecological factors [64,65,66,67]. These fish, thus, live very socially complex lives [53], making them a prime target for investigating the link between sociality and cognition [51,68]. In addition, the fish have a wide distribution across Lake Tanganyika [69], facing habitats of diverging complexity with regard to physical structure, predation risk, and competition [67,70]. N. pulcher groups can be found in habitats with a complete rock cover, including crevices in and between massive boulders, and in areas mostly covered by sand with sparse rock cover [67]. The fish use crevices and holes as shelters for breeding and hiding and will actively build such structures by digging where sand is plentiful. This makes them also highly suitable for investigations of the links between habitat complexity and cognition [11].

2.2. Field Work

We conducted field work from 15 April 2022 to 2 May 2022 in two distinct localities in southern Lake Tanganyika: one located at the eastern shore of Mutondwe (Crocodile) Island, in front of Chikonde village (locality 1, at approximately 8°42′43″ S, 31°07′33″ E), and one located at the southwestern tip of Kumbula (Mbita) Island (locality 2, at approximately 8°45′15″ S, 31°05′06″ E). We did not observe any major differences in visibility among the localities, but visibility varies daily in Lake Tanganyika. However, the visibility conditions were unlikely to affect the detection of the food reward, because the experimental setups were placed within territorial boundaries (see below). At both localities, groups of N. pulcher could readily be found. We subsequently identified 5 m × 5 m plots of different structural complexities in each locality [70] and marked them with a grid of thin nylon threads. The plots in locality 1 were located at 11 m (Plot 1A) and 5 m (Plot 1B) depths and those in locality 2 at 7 m (Plot 2A) and 8 m (Plot 2B). Note that these plots were chosen on the basis of our subjective assessment of the structural complexity during field work, and we aimed to select areas that differed substantially in structural complexity (but that also included sufficiently large numbers of N. pulcher groups). However, the actual measurement of this was conducted later in silico (see below), and some plots (particularly in locality 2) proved to be more similar in structural complexity than we had assumed during our initial subjective assessment of the habitat (see Figure 1). This underlines the importance of using an objective measure of habitat complexity, ideally during the selection of field sites. Following the realisation that our plots were more similar than we had aimed for them to be, we decided not to group the plots into low- and high-complexity habitats and instead we chose to statistically compare the observed behaviours among all plots individually. Although we can confirm that the chosen plots differed in several characteristics simultaneously, comparing plots individually still allowed us to present the differences in cognitive performances among the plots which might have been influenced by habitat complexity. In and around these plots, we then sought groups of N. pulcher of varying sizes, aiming for those at the extremes of the group-size distribution at either locality (on average 10 (min–max: 3–21) group members). To be able to revisit the experimental groups, we placed numbered stones within their territory. In total, we tested 24 groups: 10 at the first locality and 14 at the second locality. One group was only tested twice (with the Petri dish and the long cylinder; see below) reducing the overall number of trials to 71. For each plot, we also conducted a single survey of the cichlid community found within, focusing on species with ecological relevance for N. pulcher groups. We, thus, counted potential space competitors (Eretmodus cyanostictus, Julidochromis ornatus, Neolamprologus pulcher, Telmatochromis temporalis, and Variabilichromis moorii) and predators (Altolamprologus compressiceps and Lepidiolamprologus elongatus [70]).

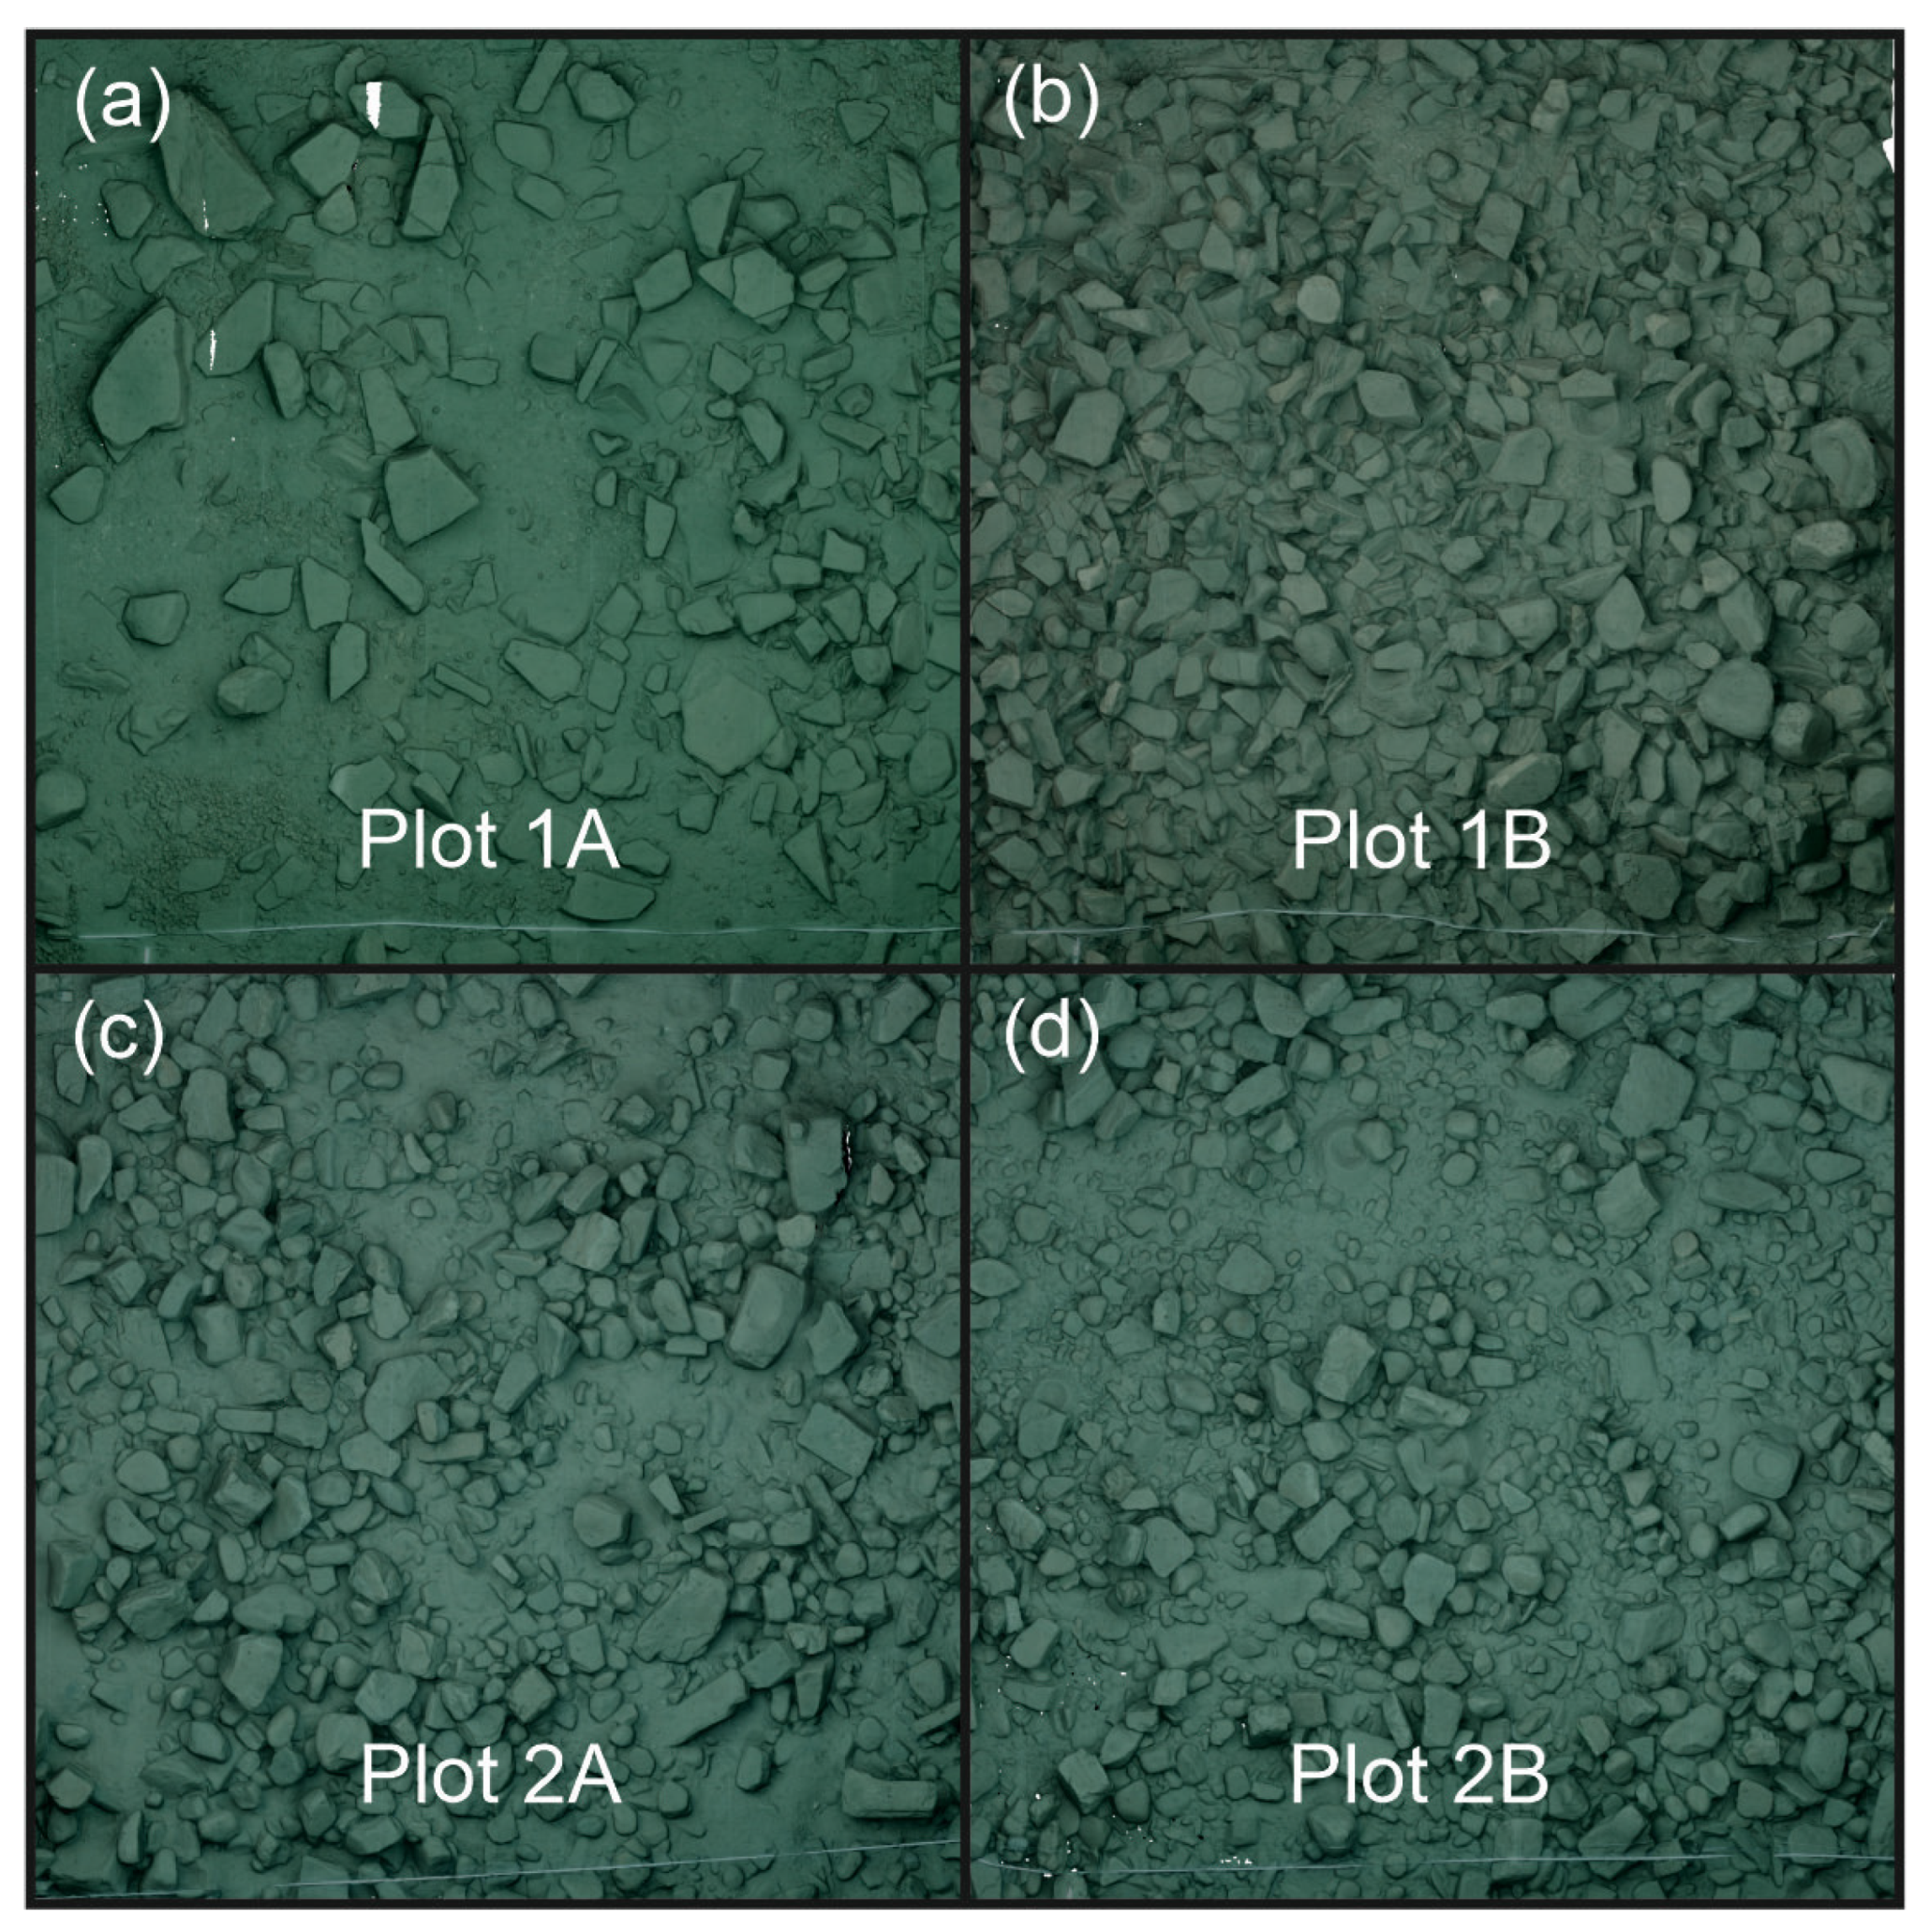
2.3. Video Analyses (Structural Complexity)

Using a structure from motion approach (SfM) [71], we produced 3D reconstructions of the lake bottom for a small area at each plot (6 m × 6 m, i.e., extending by 0.5 m in each direction past the grid), representative of the structural make-up in the area (Figure 1). For the full details see [70], but, in brief, we swam slowly across each grid, pointing a camera (GoPro Hero 5) downwards at a distance of approximately 0.5 m from the ground, ensuring that the whole area was filmed. We then extracted overlapping video frames at a rate of 1.5 Hz. These images were used to obtain a high-resolution 3D mesh for each plot with Meshroom (version 2023.1.0, [72]), an open-source 3D reconstruction software program. Subsequently, we imported the 3D meshes into Blender (version 3.6 [73]), where we cropped the reconstructions to the 6 m × 6 m squares. Finally, we calculated the rugosity of these areas as the surface area divided by the surface area of a flat plane of the same size.

2.4. Experimental Setup

To test the detour ability of wild N. pulcher, we used white tiles (14 cm × 14 cm) that were placed next to a target group. Each group was exposed sequentially in the same order to three experimental conditions that varied in the difficulty to reach the reward, which was either placed on a Petri dish, inside a long cylinder, or inside a short cylinder (see below). The rational for the three experimental conditions was to initially use a control condition to test the motivation of fish to consume an easily accessible food reward followed by two inhibitory control conditions to test the ability to detour two obstacles with different difficulties to reach the reward. We chose to present the inhibitory control conditions always in the same sequence because we did not know beforehand if fish would find the food reward attractive enough to detour the cylinder and, if so, whether repeated testing of the same groups would be possible. This way we hoped to ensure the largest possible sample size for at least one of the test conditions. For all groups, we aimed to place the tile as close to the territory centre as possible without blocking access to any shelters. Once we had determined such a spot for a given group, the tile was always placed at that same location for that group. For this, we drew a sketch of the territory including the positions of all stones together with the location of the breeding shelter used by the dominant breeder pair. This allowed us to place the tile at the same location for each of the following visits.
During the first visit, the tile was equipped with a Petri dish containing one commercially available food tablet (River aqua food, Ground Tabs). At the same time, an underwater camera (GPro (San Mateo, CA, USA), Akaso Action Cam (Frederick, MD, USA)) was mounted on a tripod and placed facing towards the tile at a distance and angle that allowed for recording all activity on and close to the tile. After starting the recordings, the observer placed the food reward on the Petri dish and quickly left the group. The group was left undisturbed for 1 h, and, upon return, the observer collected the setup, as well as the camera.
During the second visit (on average 17 h (min–max: 2.5–264 h) later), we presented a tile containing a Petri dish with a long cylinder (14 cm × 12 cm (height × diameter); inhibitory control condition: long cylinder) placed on top. The cylinder was arranged in a way that fish could only enter the inside from the top. This contrasts with the ‘standard’ detour paradigm [25], in which cylinders are arranged with the openings on each side. Arranging the cylinder with the opening on top ensured that fish could not accidentally enter the cylinder. A few pilot trials at the Konrad Lorenz Institute of Ethology showed that cylinders with the openings on the sides did not prove difficult enough for the fish, and they easily accessed (sometimes seemingly accidentally) the reward. The observer placed the tile at the same location, arranged the camera, and inserted a food tablet inside the Petri dish. Again, the group was left undisturbed for 1 h, and, upon return, the observer collected the setup and the camera.
During the third visit (on average 51 h [4–264 h] after the second visit), we presented a tile with a Petri dish and a short cylinder (7 cm × 12 cm (height × diameter); inhibitory control condition: short cylinder) placed on top. Again, the cylinder was arranged with the opening on top. After placing the tile at the same location and starting the recordings, the group was left undisturbed for 1 h, at the end of which all equipment was again retrieved.

2.5. Video Analyses (Behavioural)

From the behavioural videos we recorded three timestamps: the timestamp when the food was placed on the Petri dish or inside the cylinder (i.e., start timestamp); the timestamp when the first N. pulcher interacted with the setup (i.e., interacting timestamp); and the timestamp when the first N. pulcher fed on the reward (i.e., feeding timestamp). An interaction with the setup consisted of either (i) physical contact between a fish and the apparatus or (ii) the full immersion of a fish inside the cylinder. With these timestamps, we could calculate the latency to interact (i.e., interacting timestamp minus start timestamp) and the latency to feed (i.e., feeding timestamp minus start timestamp), as well as the difference, in seconds, between the first interaction and the first successful feeding (i.e., feeding timestamp minus interacting timestamp). Furthermore, we recorded the number of individual N. pulcher interacting with the setup and the number of individual N. pulcher successfully feeding on the reward. In the two inhibitory control conditions we also recorded every failed attempt when a N. pulcher tried to reach the reward directly and touched the cylinder, i.e., when it failed to detour the obstacle. We stopped recording behaviours after 45 min had passed since the food had been placed on the Petri dish, except in one trial (control condition) where we stopped recording behaviours earlier because the food was entirely depleted after 22 min.

2.6. Statistical Analysis

Statistical analyses were conducted using R 4.3.1 [74] with the packages lme4 [75] and afex [76]. To analyse whether the experimental setup created a cognitive challenge, we used linear mixed models (LMMs) and generalised linear mixed models (GLMMs) with a binomial error distribution. To quantify the motivation of fish, we used the latency to interact, and to quantify the ability of fish to solve the cognitive challenge, we used the latency to feed after the first interaction with the setup. To compare both in terms of the inhibitory control conditions, we used a LMM and included the factor ‘Inhibitory control condition’, with two levels, ‘long cylinder’ and ‘short cylinder’, as an independent variable and ‘Group ID’ as a random effect to control for repeatedly using the same groups in different conditions. To analyse the number of individuals feeding on the reward relative to the number of individuals interacting with the setup, we included the total counts of the number of individuals feeding on the reward and the number of individuals interacting with the setup as the dependent variable in a GLMM with ‘Inhibitory control condition’ as the independent variable and ‘Group ID’ as a random effect.
To analyse whether habitat complexity or group size determined the performance of individuals during the control or the inhibitory control conditions, we used linear models (LMs) and generalised linear models (GLMs) with a binomial error distribution.
To analyse the latency to feed in the control condition, the latency to feed after the first interaction with the setup, and the number of failed attempts, we used LMs and included the factor ‘Location’ with four levels—‘1A’, ‘1B’, ‘2A’, and ‘2B’—and the continuous variable ‘Group size’ as the independent variables. To analyse the number of individuals feeding on the reward relative to the number of individuals interacting, we included the total counts of the number of individuals feeding on the reward and the number of individuals interacting with the setup as the dependent variable in a GLM with ‘Location’ and ‘Group size’ as the independent variables.
The residuals and Q/Q plots of all LMs and LMMs were visually inspected, and the distributions of the residuals were compared to a normal distribution using Kolmogorov–Smirnov and Shapiro tests. If the residuals were non-normally distributed, a log transformation was applied and the residuals, again, checked. All GLMs and GLMMs were checked for overdispersion, but none required a correction.
To obtain p-values, we used the drop1() function to perform a type II ANOVA, and the reported p-values in the tables refer to the full models.

3. Results

3.1. Does the Setup Pose a Cognitive Challenge to the Fish?

3.1.1. Control Condition

In 19 out of 24 groups, at least one N. pulcher reached the reward and successfully fed within 45 min in the control condition (groups in which no fish fed in the control condition: plot 1A—two groups (group sizes: 3 and 7); plot 1B—one group (group size: 4); and plot 2B—two groups (group sizes: 20 and 6)). The first fish reached the reward between 2.8 and 38 min (average: 20.2 min), and there were always between 1 and 5 (average: 2.4) individual N. pulcher feeding on the reward. Only those 19 groups that successfully reached the reward in the control condition were used for the analyses of the inhibitory control conditions.

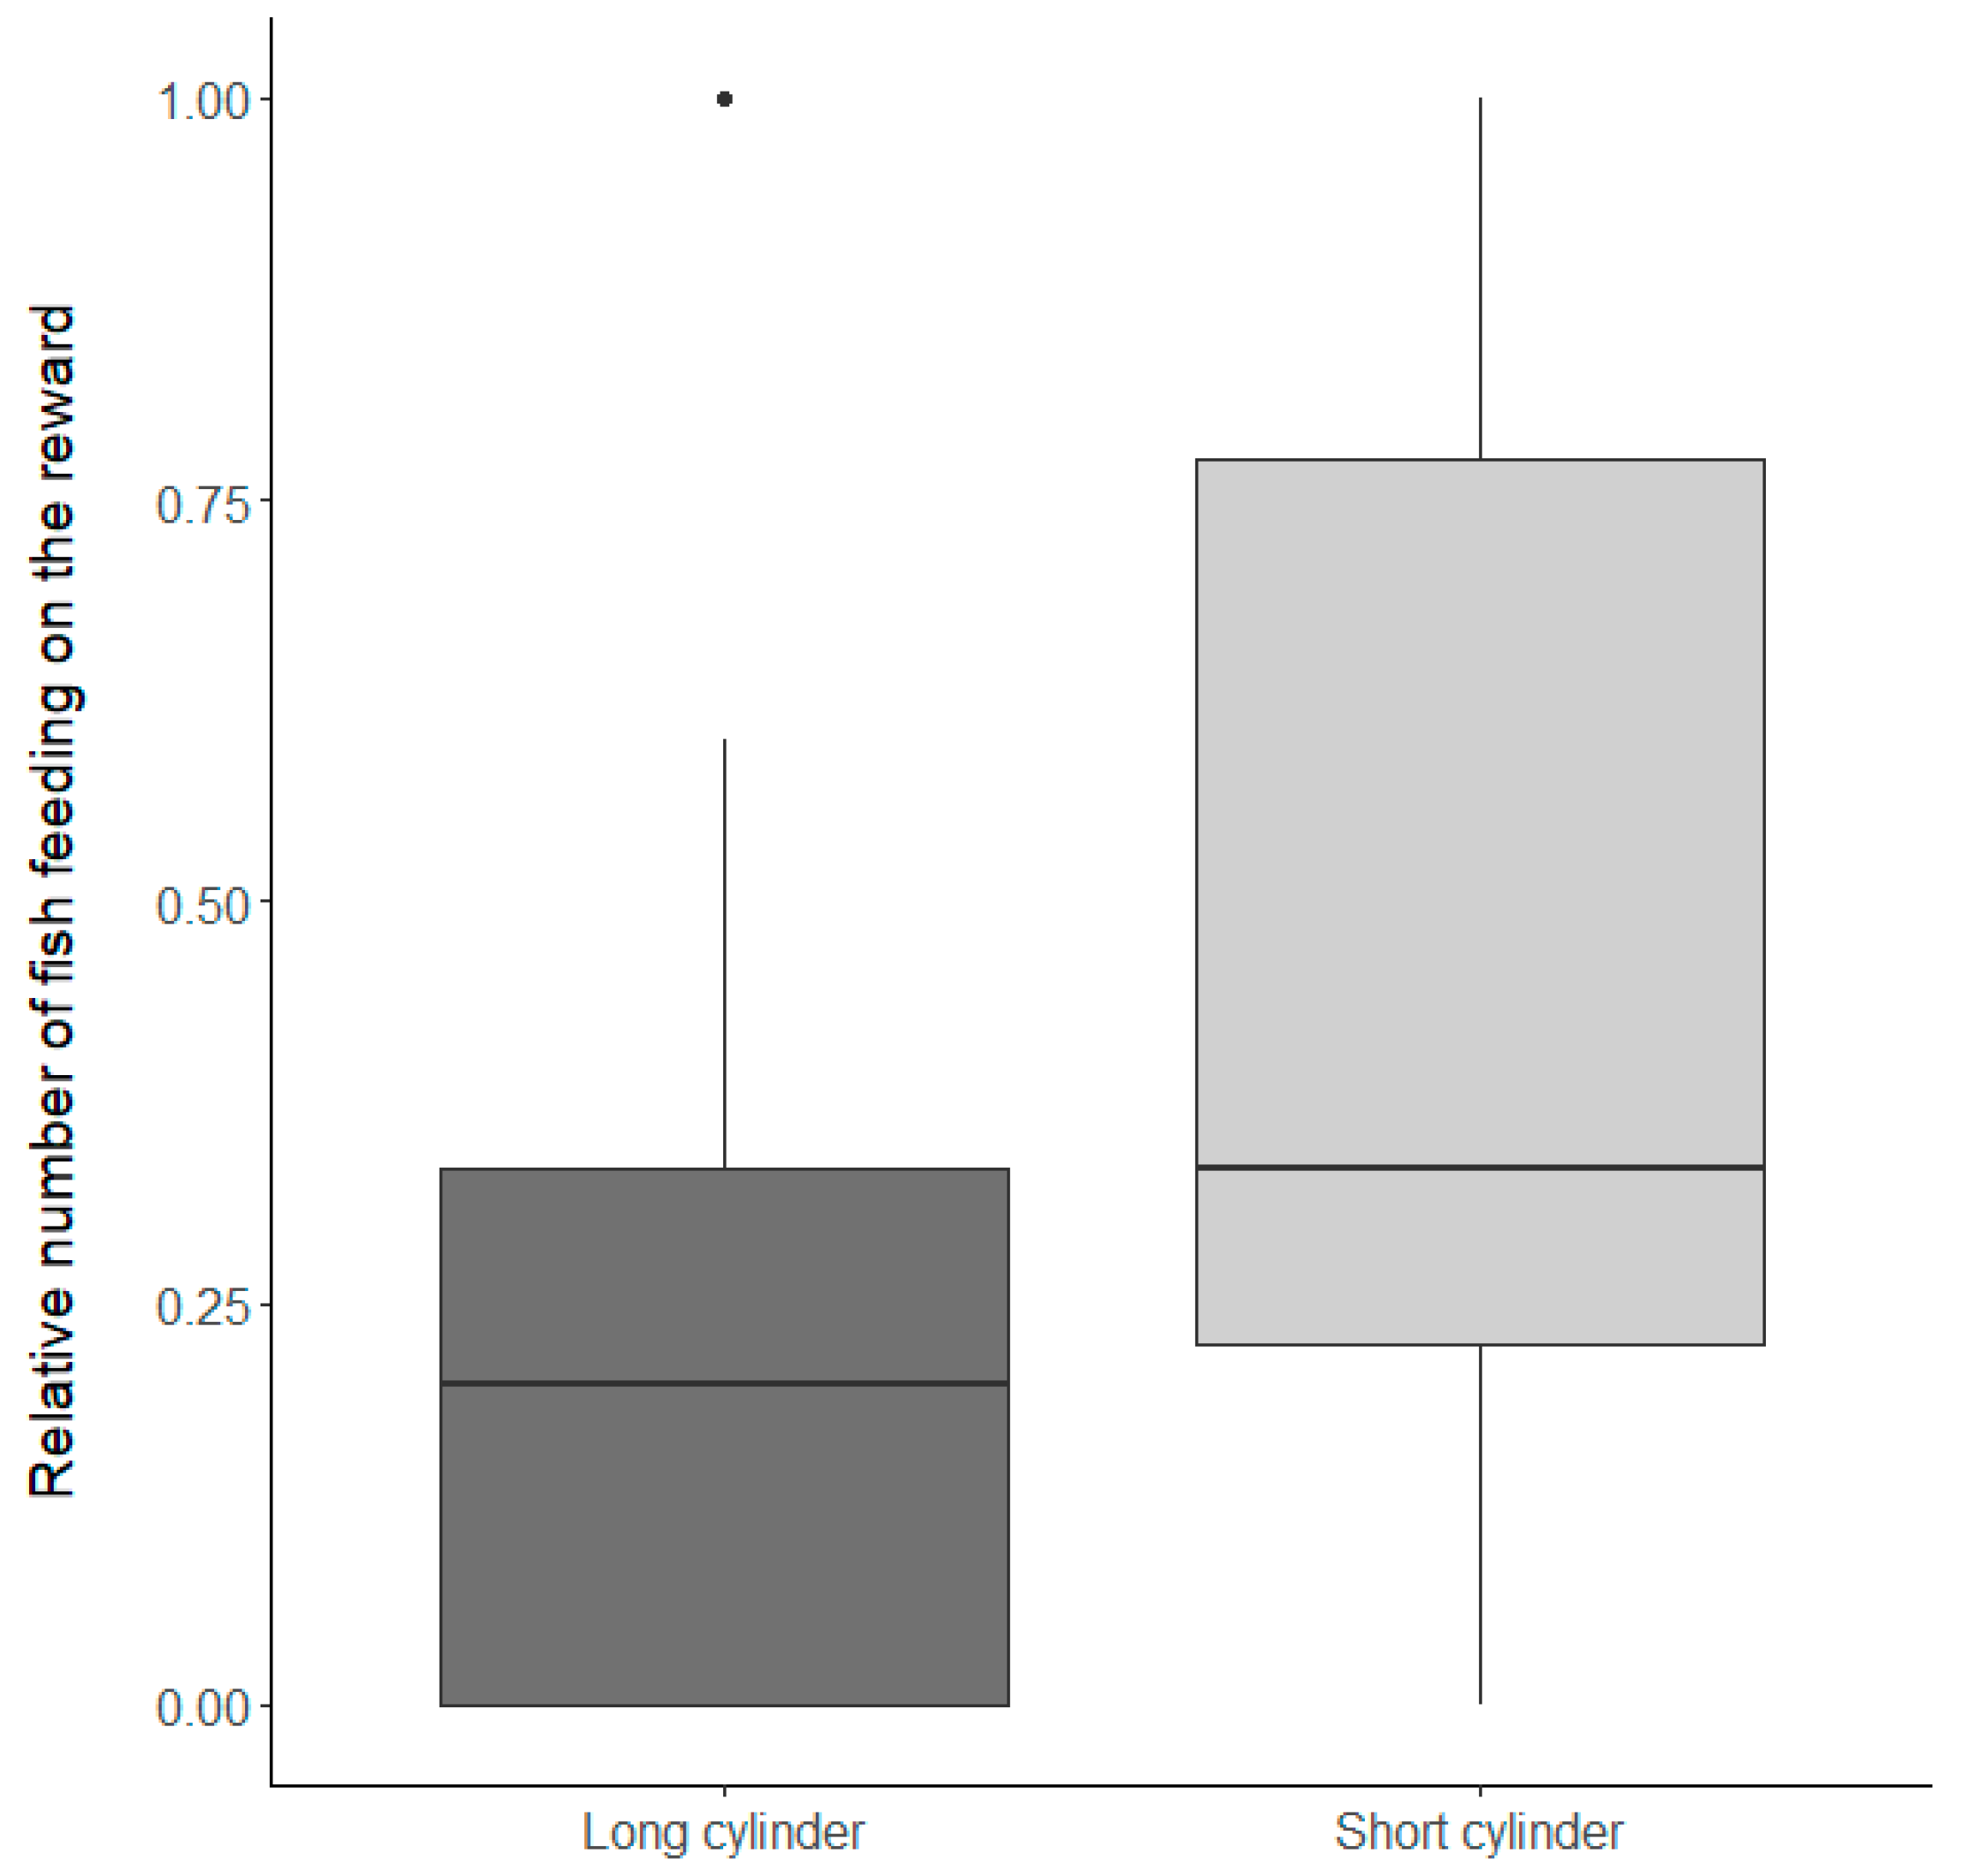
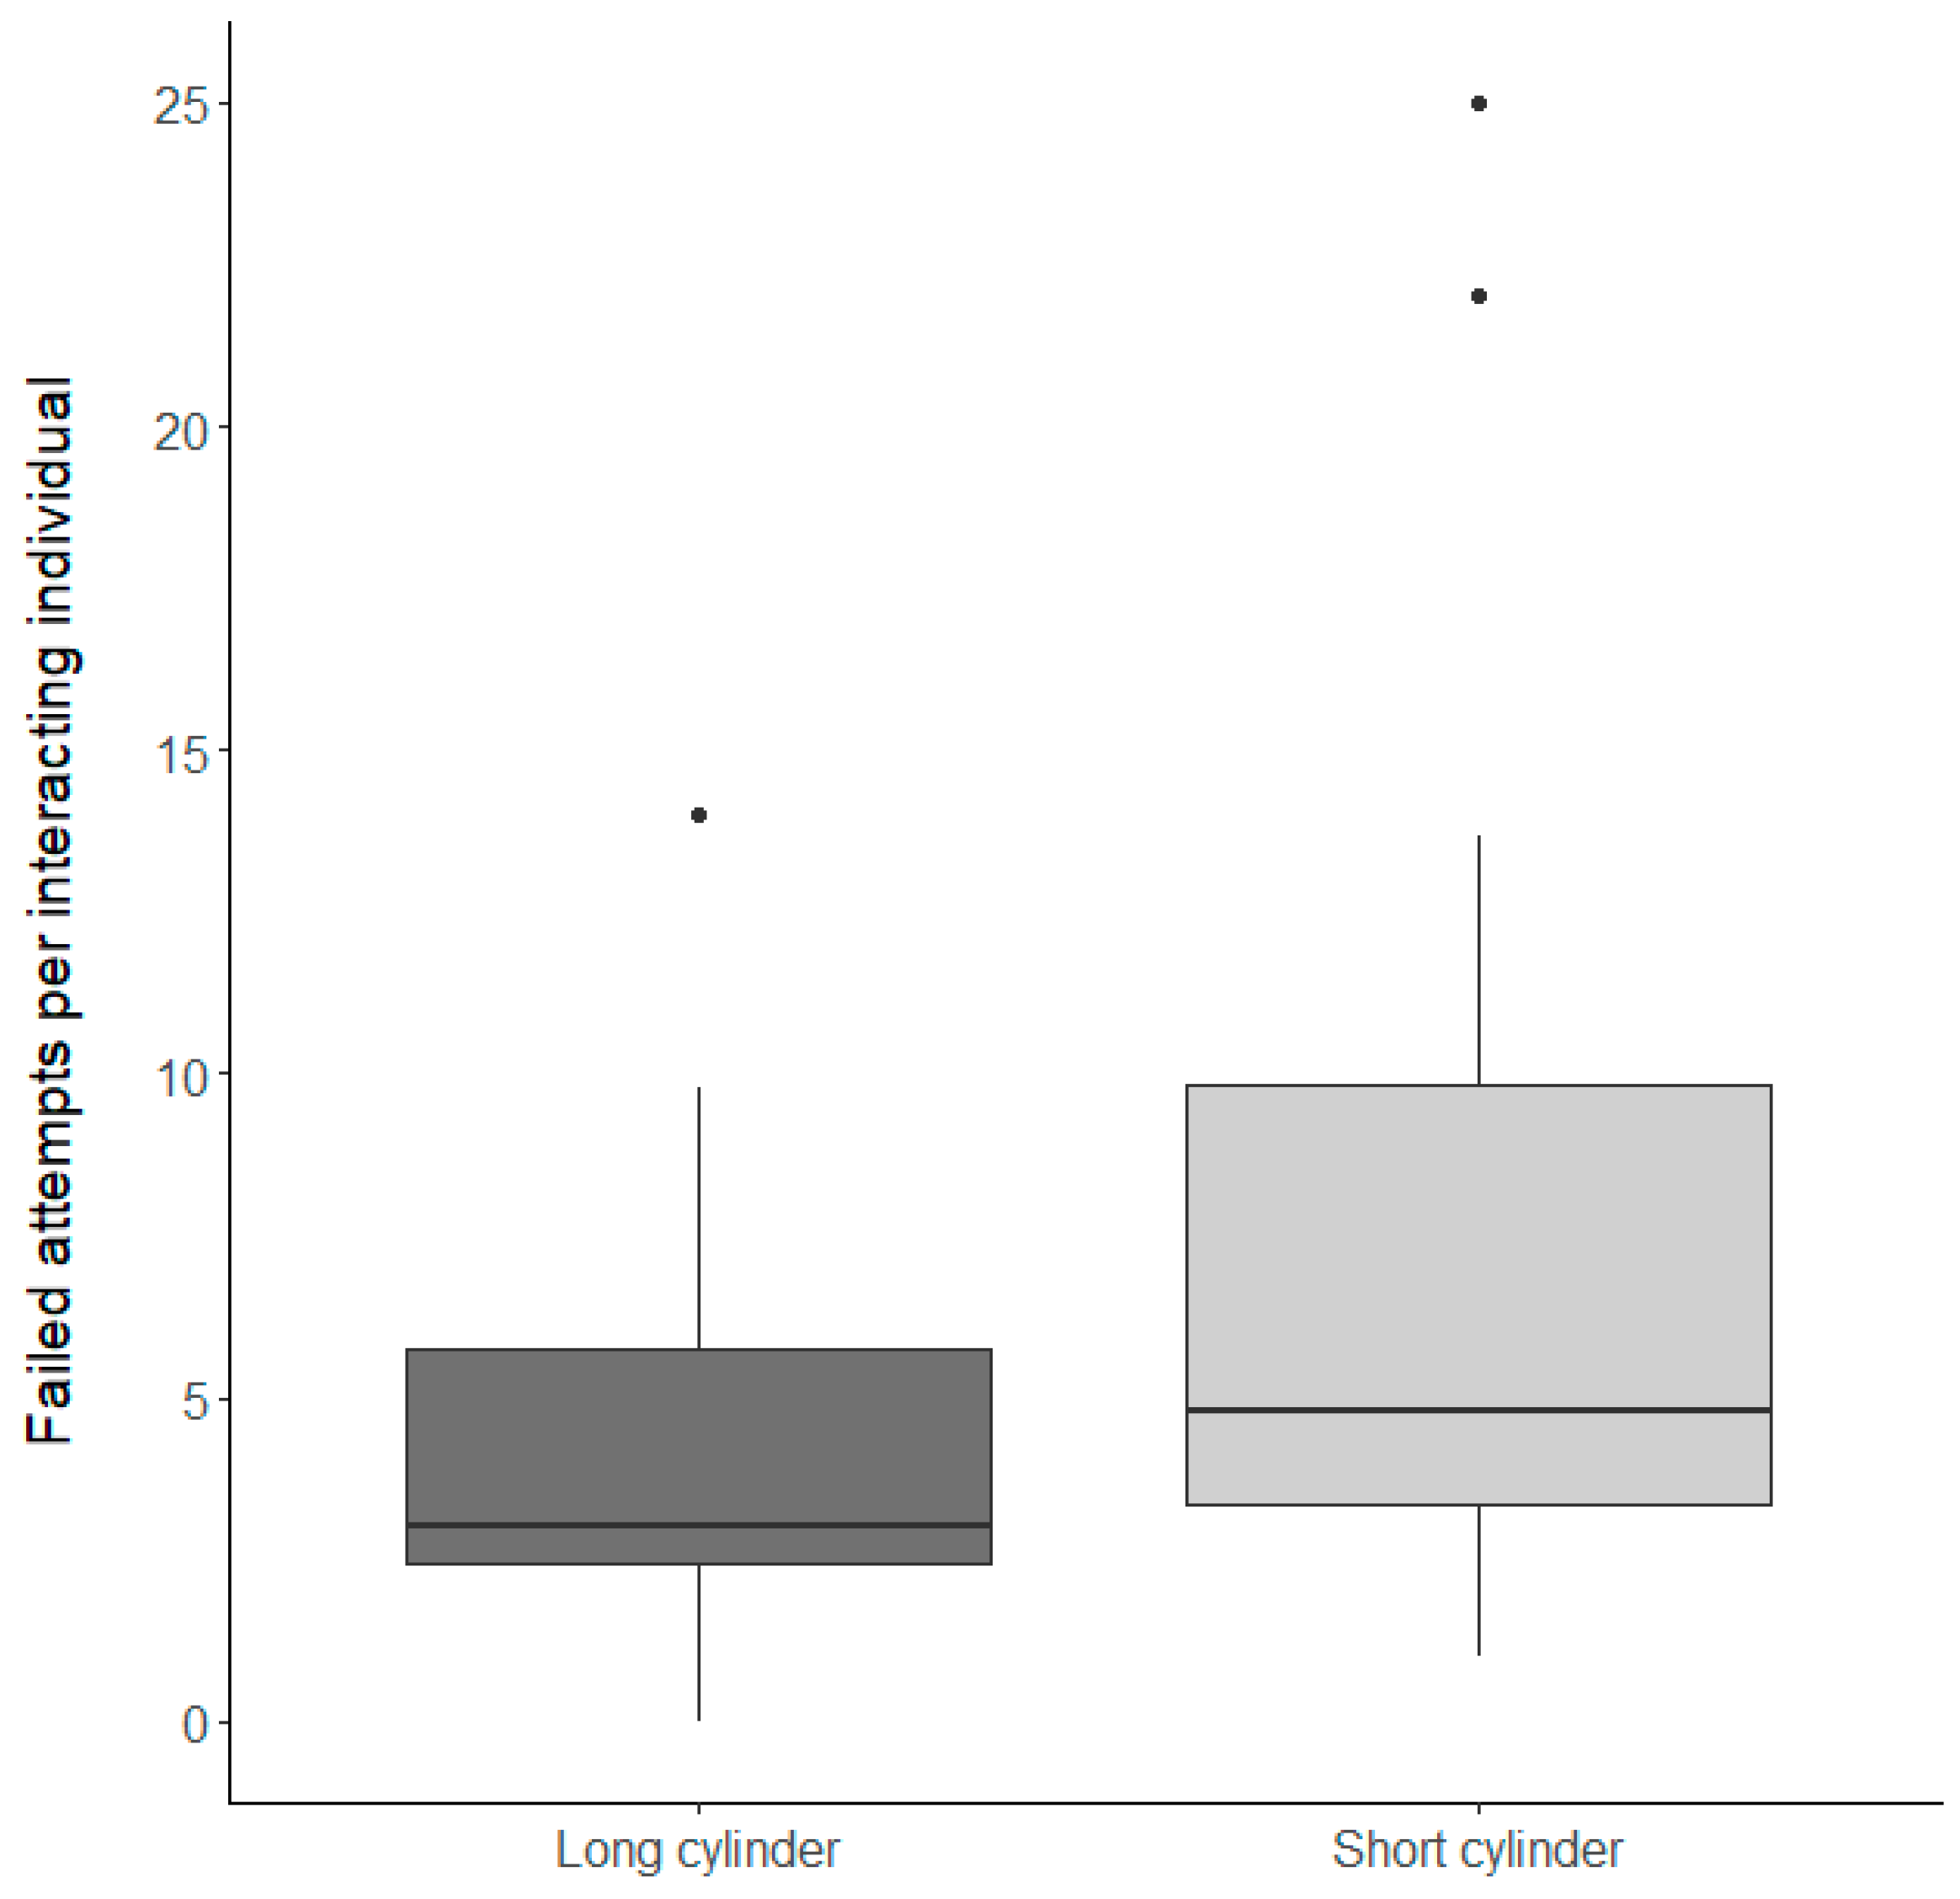
3.1.2. Inhibitory Control Conditions

Overall, N. pulcher were similarly motivated to interact with the experimental setup, and there was no significant difference in the latency to interact with the short or long cylinder in the inhibitory control conditions (Table 1a, factor ‘Inhibitory control conditions’ (F1,18 = 1 × 10⁻³, p = 0.97)). Nevertheless, N. pulcher were faster at reaching the reward after the first interaction with the experimental setup when the food was placed inside the short cylinder (Table 1b, factor ‘Inhibitory control conditions’ (F1,18 = 14.91, p < 0.01), Figure 2). Furthermore, the number of fish feeding from the reward relative to the number of fish interacting with the setup was significantly higher when the food was placed inside the short cylinder (Table 2, factor ‘Inhibitory control condition’ (χ2 = 8.81, p < 0.01), Figure 3). Surprisingly, although more individual N. pulcher successfully reached the reward when the food was placed in the short cylinder, they also showed more failed attempts on an individual basis (Table 1c, factor ‘Inhibitory control condition’ (F1,18 = 4.9, p = 0.04), Figure 4).

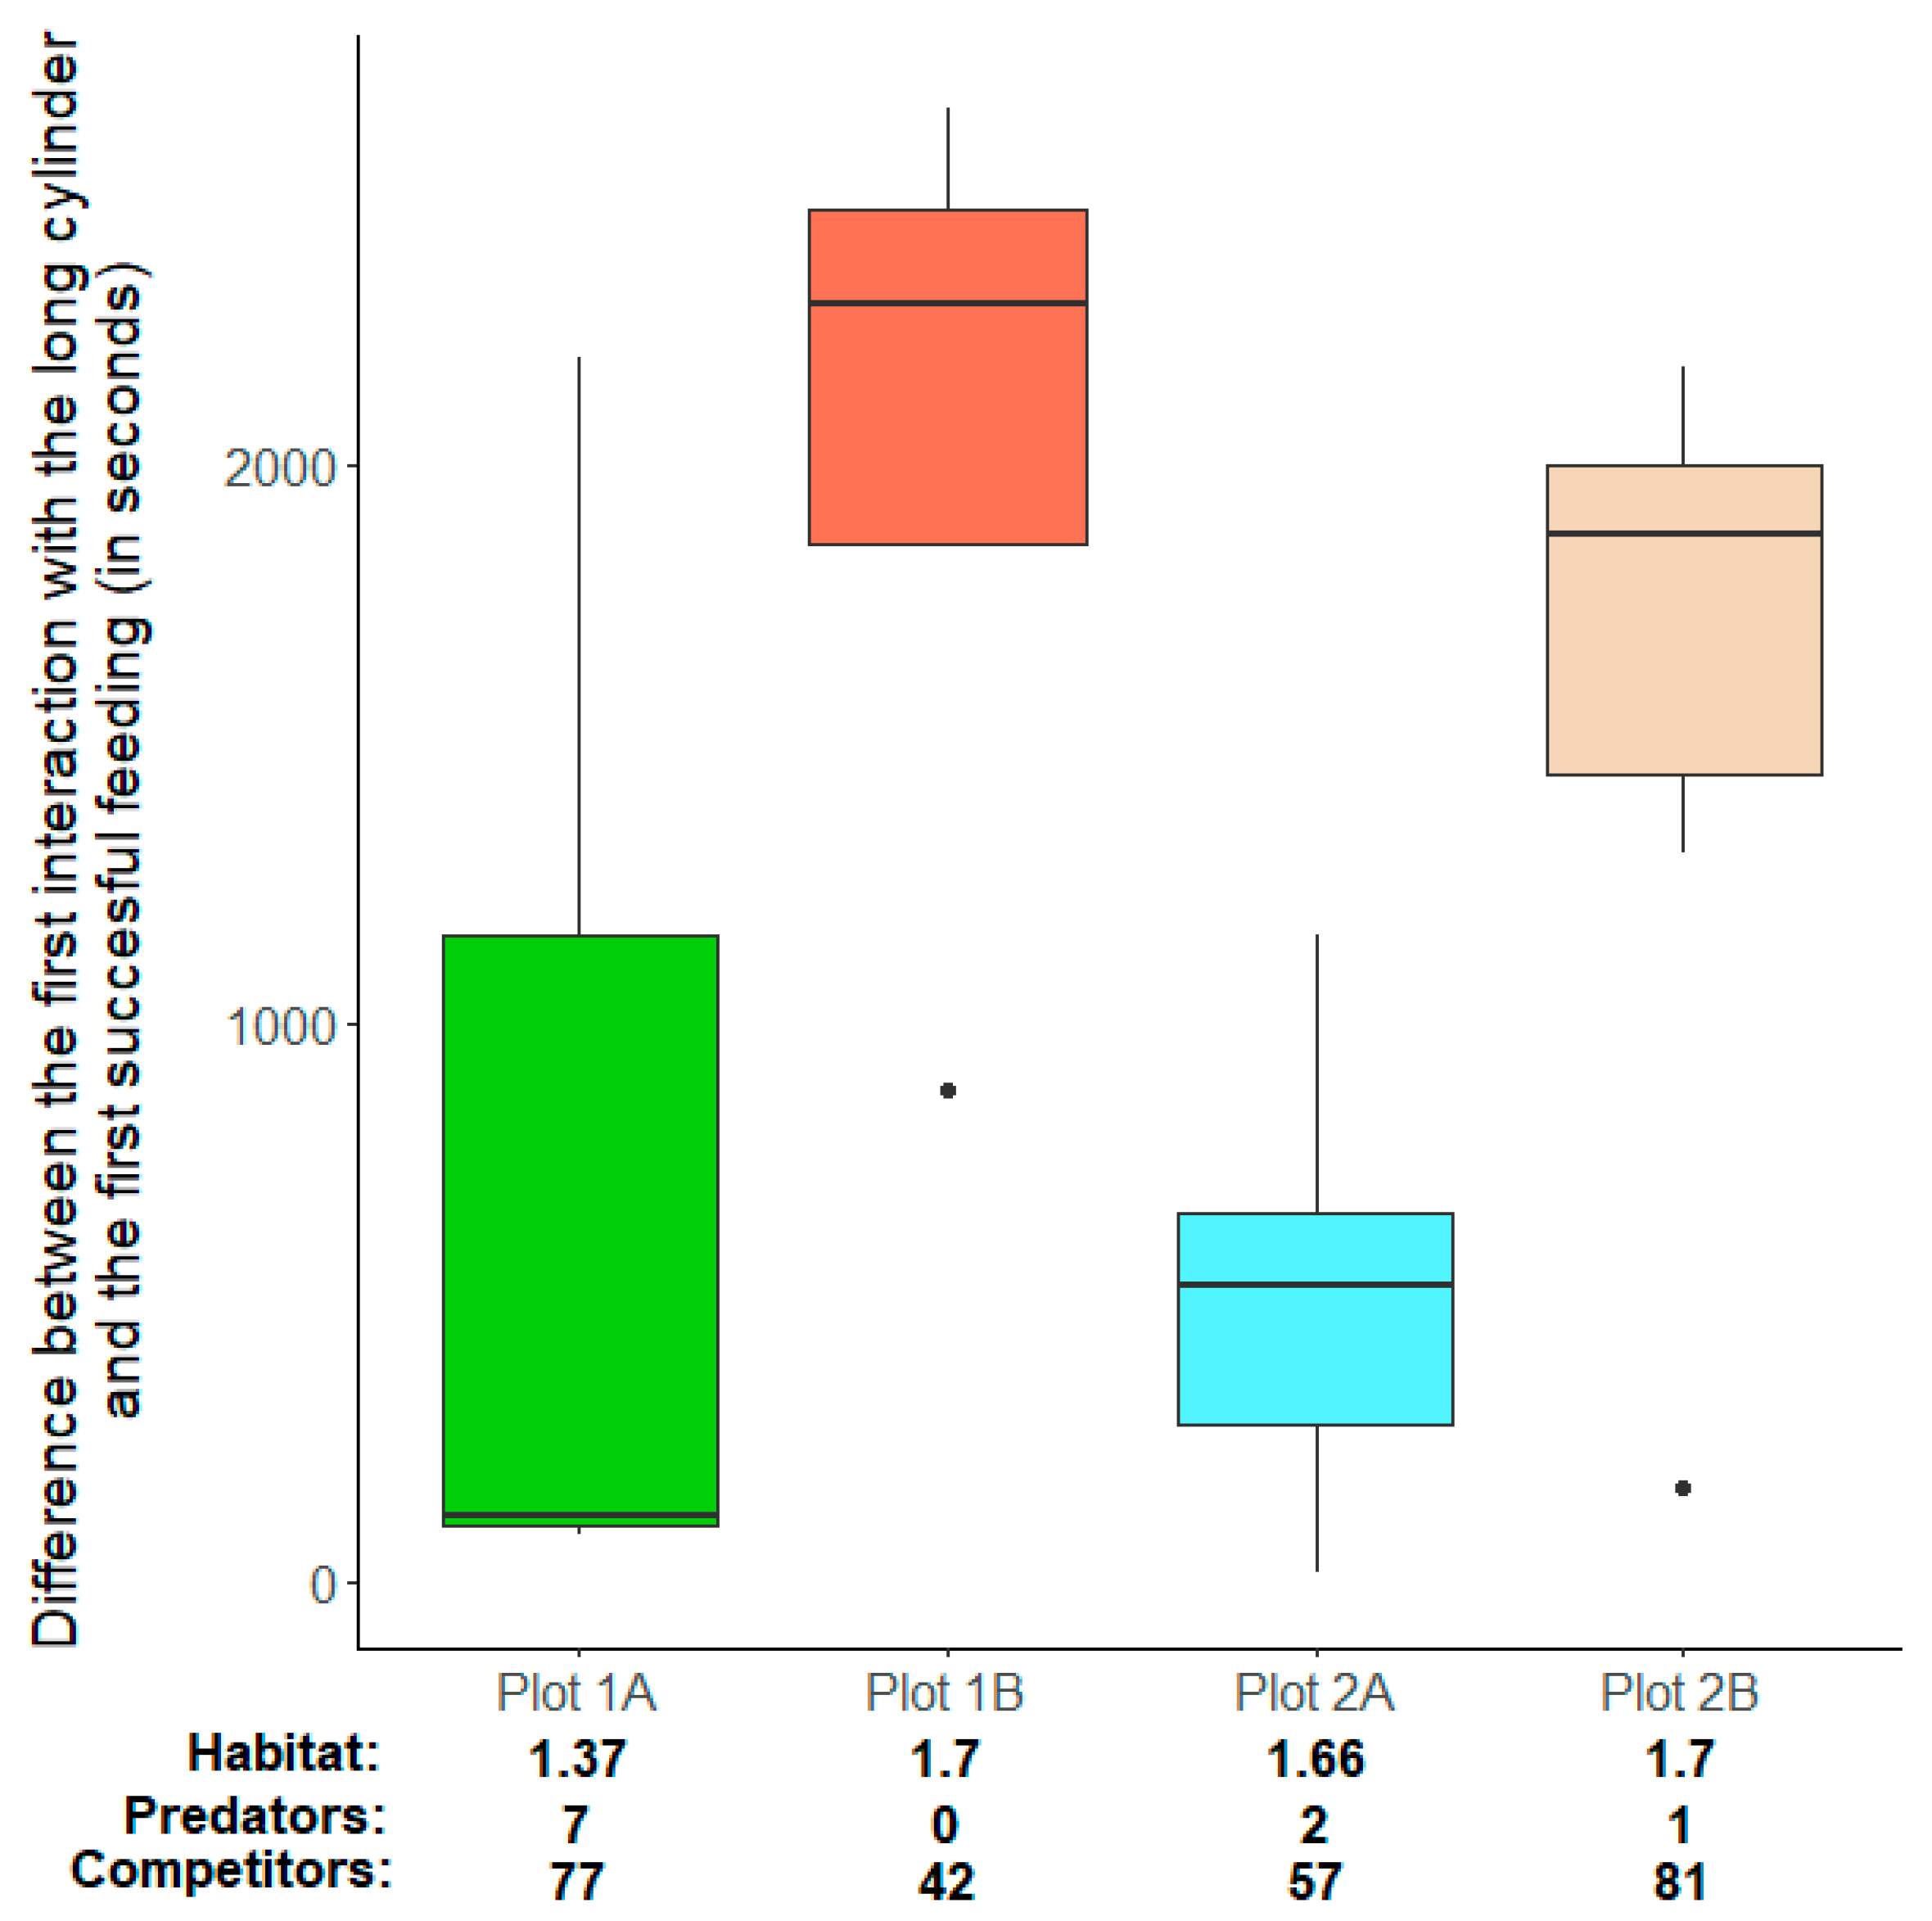
3.2. Do Habitat Complexity and/or Group Size Influence the Motivation to Find Food and the Ability to Solve a Cognitive Challenge?

The location and group size did not influence the latency to reach the reward in the control condition (Table 3a, factor ‘Location’ (F3,19 = 0.01, p = 0.99); factor ‘Group size’ (F1,19 = 3.33, p = 0.08)).
When food was presented inside the more challenging long cylinder, location had a significant influence on the latency to feed on the reward after the first interaction with the cylinder (Table 3b, factor ‘Location’ (F3,14 = 5.88, p < 0.01), Figure 5). Here a post hoc analysis using orthogonal contrasts revealed that the latency to feed on the reward after the first interaction with the setup was not different between the two locations (Table 4a, factor ‘(Plot 1A, Plot 1B) vs. (Plot 2A, Plot 2B)’ (t = −1.25, p = 0.23)) but differed among plots in each of the two localities. Within locality 1, groups in ‘Plot 1B’ had a significantly longer latency to feed compared to groups in ‘Plot 1A’ (Table 4b, factor ‘Plot 1A vs. Plot 1B’ (t = 3.02, p = 0.01)). In contrast, within locality 2, groups in ‘Plot 2A’ did not have a significantly different latency than groups in ‘Plot 2A (Table 4c, factor ‘Plot 2A vs. Plot 2B’ (t = 1.95, p = 0.07)).
In contrast, group size did not influence the latency to feed on the reward after the first interaction with the setup (Table 3b, factor ‘Group size’ (F1,14 = 3.67, p = 0.07)). Location and group size did not determine the number of fish feeding relative to the number of fish interacting when food was presented in the long cylinder (see Table 5a, factor ‘Location’ (χ2 = 5.53, p = 0.15); factor ‘Group size’ (χ2 = 0.09, p = 0.76)).
When food was presented inside the less challenging short cylinder, location and group size did not influence the latency to feed on the reward after the first interaction with the cylinder (Table 3c, factor ‘Location’ (F3,13 = 0.28, p = 0.84) or the number of fish feeding on the reward relative to the number of fish interacting with the cylinder (Table 5b, factor ‘Location’ (χ2 = 1.33, p = 0.72).

4. Discussion

The results of our field experiment using wild N. pulcher groups show that the detour paradigm is a valid concept to test behavioural flexibility in wild cichlid fish. We show that the difficulty of the task was influenced by the length of the obstacle that needed to be detoured, with the shorter cylinder allowing for faster times to successfully feed and more individuals doing so (Figure 2 and Figure 3) but also resulting in more mistakes made (Figure 4). This suggests that the setup indeed poses a cognitive challenge and opens the possibility of adjusting the difficulty to fit a given research question’s needs. In our case, most of the interesting variations among the groups from different locations were observed when using the long cylinder, indicating that using a more difficult setup is likely to be most beneficial for such broad comparisons.
We used this experimental paradigm to test predictions derived from two major hypotheses that link sociality, habitat complexity, and cognition. We find no strong statistical evidence that larger groups showed improved behavioural flexibility (Table 3), which would support the sociality and cognition hypothesis (see below). In contrast, we do find that habitat features influenced behavioural flexibility, but the direction of this effect was dependent on the habitat’s locality (Table 4, Figure 5).
The sociality and cognition hypothesis predicts enhanced cognitive abilities for individuals that live in a more complex social environment, such as larger groups or fission–fusion societies [9]. Individuals living in more complex social environments are predicted to be in need of more advanced cognitive abilities to navigate their daily social lives. This line of argument is also used to explain the advanced cognitive abilities in humans who have sophisticated social relationships compared to most other taxa [77]. Evidence in support of this hypothesis has come largely from primate studies, whereas in other animal groups support for the sociality and cognition hypothesis has been mixed [9]. Specifically, comparative studies using fish found no evidence that more social species have larger brains (as a proxy of advanced cognition) or are better learners [43,44]. The results of our study also provide no clear evidence in support of the sociality and cognition hypothesis. On a broader geographical scale, N. pulcher groups are organised in colonies [63] and other indices of social complexity, such as the group’s nearest neighbour distance or the location of the group within the colony, could have played a role in determining cognitive performances, but assessing broadscale social complexity was beyond the scope of the current study. Of course, working under field conditions comes with certain trade-offs, especially as we first had to validate a novel test paradigm before we were able to assess predictions from the sociality and cognition hypothesis. As such, we only tested a limited number of groups that varied in their number of group members, and we were not able to assess individual performances within each group. Using visible implant elastomer markings [78] would allow for the tracking of individual performances and would also allow for the incorporation of potentially confounding variables in the analysis, such as social rank, body size, or the sex of the individual [79]. Additionally, although we found that reaching the food inside the long cylinder was more challenging, this level of difficulty might still have been too simple to reveal the fine-graded cognitive differences between individuals living in large and small groups. Nevertheless, our results are in line with other studies finding little support for the sociality and cognition hypothesis in fishes [43,44,80].
The habitat complexity and cognition hypothesis predicts enhanced cognitive abilities for individuals that live in more complex environments [11]. The underlying idea is similar to the one concerning sociality: a more complex habitat requires individuals to process a wider range of stimuli and produce a greater number of corresponding responses, which, in turn, necessitates more flexibility in and finetuning of their behaviour, resulting in greater cognitive abilities in general [8]. Our comparisons among groups found in different localities (and plots within localities) yielded a somewhat complicated picture: while groups from the two localities did not differ from one another in their ability to solve the task, differences within each locality exist (Table 4, Figure 5). In other words, we did not observe variation across large geographical distances (both localities are more than 6 km apart) but rather across small distances (plots within each locality are less than 100 m apart). This suggests that cognitive abilities are, indeed, more shaped by local conditions than by broad geographical proximity [11], a pattern already observed in the social structure of N. pulcher [67]. This view is further supported by the fact that dispersal would theoretically be possible for these fish among plots within a locality, but is extremely unlikely between the localities [60]. Our sample size of four different plots (and the differences between them; Figure 5) is too small to truly statistically probe which differences between the habitats best explain the differences in fish behaviour we observed. Nevertheless, it is striking that the pattern is such that in each locality the groups in the less structurally complex plot with more potential predators outperformed the ones in the more complex, less threatening plot (Figure 5). Habitat complexity alone is thus unlikely to explain intraspecific cognitive differences in cichlids (in contrasts to interspecific observations in this taxon [11]).
In line with previous work, we employed a detour test as a means to test cognitive ability by measuring behavioural flexibility and, by extension, cognitive ability [25]. Behavioural flexibility generally refers to adaptive changes in behaviour in response to environmental changes [81]. The flexible adjustment of behaviour is thought to involve several cognitively demanding components including the ability to seek alternative solutions [82]. Inhibitory control, the ability to control and supress a predisposition for a behavioural response to show a more appropriate behaviour, is a core executive function that allows animals to successfully seek alternative solutions in a changing environment [83]. Detour tests have been used since the early 20th century to test inhibitory control [25] and have been applied in several species to assess behavioural flexibility [84,85,86,87], including fish [79,88]; see [89] for a critical assessment of the relationship between inhibitory control and behavioural flexibility). Most studies assessing behavioural flexibility have been conducted in laboratory conditions [90], and this is particularly true for work on fish [79,88,91]. This makes it harder to draw general conclusions about the underlying evolutionary drivers of the observed variability in behavioural flexibility. To link behavioural flexibility (and cognitive abilities more broadly) to actually fitness-relevant factors, it has to be assessed under natural conditions [92]. However, there is still a lack of studies trying to tackle this [34]. Notable exceptions come from the bird literature [93,94,95,96] and, very recently, also from a study using a cichlid fish from Lake Tanganyika [97]. This latter study highlights the difficulties that come with field work and with the undertaking to assess cognitive abilities in the wild.
In the present study we used a modified version of the classic detour test paradigm where the reward could only be accessed by detouring an upright cylinder, thus accessing the reward from the top and not from the sides. On the basis of pilot experiments, we believe that this is more appropriate for our study species, but it can be easily adapted to other fish species in Lake Tanganyika, and we have no reason to believe that results would not be comparable. Our study confirms, for the first time in a fish species, that (i) inhibitory control can be measured under field conditions using a simple and easily adaptable test paradigm and (ii) the performance in solving the cognitively more challenging setup can be used to probe specific predictions about cognitive evolution. A caveat about our experimental design is the fact that we always presented the short cylinder after the long cylinder to the groups. This might have caused a habituation effect resulting in shorter times to approach the cylinder and more individuals reaching the reward (Table 1). However, we did not find that the motivation to interact with the setup was different between the short and the long cylinders, which is in contrast to what would be expected if fish showed signs of habituation (Table 1a). Nevertheless, to truly rule out any habituation effects in our experiment, further investigations are needed that vary the sequence of presenting the short and the long cylinder to the groups. Surprisingly, although individuals were faster at reaching the reward, with more individuals doing so, when food was placed in the short cylinder, they also had more failed attempts. There are several nonmutually exclusive explanations for this: (1) When food was placed in the short cylinder, individuals might have shown a more persistent response to swim against the cylinder until finding the opening by chance and reaching the reward. This could be a successful strategy for the short cylinder but might have proven difficult when food was placed in the long cylinder. (2) Because of the fact that we always presented the short cylinder after the long cylinder, individuals might have been more motivated to reach the reward and, thus, experienced more failed attempts, as they had already associated the setup with an attractive reward. (3) Individuals might have smelled the food more when placed in the short cylinder compared to the long cylinder, making them more prone to failed attempts. Sensory cues to solve a task are an important confounding variable when trying to estimate cognitive abilities within or among species [27] and might have also played a role in our experimental setup. Controlling for these possible causes of variation in the fish’s ability to complete the task will be necessary in future uses of the setup.

5. Conclusions

In summary, our study validated, for the first time in a fish species, a detour test paradigm, which can be used under natural conditions with wild groups or individuals, using one cichlid species from Lake Tanganyika. The simple setup and the minimal logistic requirements make this an ideal cognitive test for a range of species, particularly in Lake Tanganyika. We used this setup to probe two major hypotheses about cognitive evolution that link habitat and social complexity to improved cognition. Our results show mixed support for the predictions derived from both hypotheses, but we hope to have inspired future investigations on the evolution of cognition in Lake Tanganyika cichlids. Lake Tanganyika represents an ideal place to use this setup and probe several other hypotheses about the evolution of cognition because many species are territorial and show site fidelity, and they are closely related but differ in key aspects of their ecology or sociality. Thus, we believe that our setup opens up a whole avenue of research questions that will, ultimately, help to better understand the evolution of cognitive abilities in the wild.

Author Contributions

A.J., Conceptualisation, funding acquisition, investigation, writing—original draft preparation, and writing—review and editing; A.H., Investigation and writing—review and editing; P.N., Data analysis and writing—review and editing; S.F., Conceptualisation, funding acquisition, investigation, data analysis, writing—original draft preparation, and writing—review and editing (categories based on Contributor Role Taxonomy (CRediT)). All authors have read and agreed to the published version of the manuscript.

Funding

This study was supported by a research grant from the Association of the Study of Animal Behaviour (ASAB). S.F. was also financially supported by the Vienna Science and Technology Fund (awarded to Sabine Tebbich, CS18-042).

Institutional Review Board Statement

All field work reported here complied with local regulations for the work with wild animals and was conducted under the Memorandum of Understanding between the Department of Fisheries in the Ministry of Fisheries and Livestock of the Republic of Zambia; the Department of Biological Sciences of the University of Lusaka, Zambia; the Institute of Biology of the University of Graz, Austria; the Department of Behavioural Ecology of the University of Bern, Switzerland; and the Zoological Institute of the University of Basel, Switzerland, for the timeframe of January 2019 to December 2023.

Data Availability Statement

Data will be made available in a timely manner by the authors upon request.

Acknowledgments

We thank the Jordan lab field team 2022 and Kelvin Ntaswila Mukuka and his staff at the Lake Tanganyika Research Unit of the Department of Fisheries, Zambia, for logistical support.

Conflicts of Interest

The authors declare no conflict of interest.

References

  1. Kaufman, A.B.; Call, J.; Kaufman, J.C. (Eds.) The Cambridge Handbook of Animal Cognition, 1st ed.; Cambridge University Press: Cambridge, UK, 2021; ISBN 978-1-108-42674-9. [Google Scholar]
  2. Maclean, E.L. Unraveling the Evolution of Uniquely Human Cognition. Proc. Natl. Acad. Sci. USA 2016, 113, 6348–6354. [Google Scholar] [CrossRef]
  3. Pravosudov, V.V.; Roth, T.C., II. Cognitive Ecology of Food Hoarding: The Evolution of Spatial Memory and the Hippocampus. Annu. Rev. Ecol. Evol. Syst. 2013, 44, 173–193. [Google Scholar] [CrossRef]
  4. Berghänel, A.; Lazzaroni, M.; Cimarelli, G.; Marshall-Pescini, S.; Range, F. Cooperation and Cognition in Wild Canids. Curr. Opin. Behav. Sci. 2022, 46, 101173. [Google Scholar] [CrossRef]
  5. Healy, S.D. The Face of Animal Cognition. Integr. Zool. 2019, 14, 132–144. [Google Scholar] [CrossRef] [PubMed]
  6. van Horik, J.; Emery, N.J. Evolution of Cognition. Wiley Interdiscip. Rev. Cogn. Sci. 2011, 2, 621–633. [Google Scholar] [CrossRef] [PubMed]
  7. Mettke-Hofmann, C. Cognitive Ecology: Ecological Factors, Life-Styles, and Cognition. WIREs Cogn. Sci. 2014, 5, 345–360. [Google Scholar] [CrossRef] [PubMed]
  8. Henke-von der Malsburg, J.; Kappeler, P.M.; Fichtel, C. Linking Ecology and Cognition: Does Ecological Specialisation Predict Cognitive Test Performance? Behav. Ecol. Sociobiol. 2020, 74, 154. [Google Scholar] [CrossRef]
  9. Dunbar, R.I.M.; Shultz, S. Evolution in the Social Brain. Science 2007, 317, 1344–1348. [Google Scholar] [CrossRef] [PubMed]
  10. Sewall, K.B. Social Complexity as a Driver of Communication and Cognition. Integr. Comp. Biol. 2015, 55, 384–395. [Google Scholar] [CrossRef]
  11. Shumway, C.A. Habitat Complexity, Brain, and Behavior. Brain. Behav. Evol. 2008, 72, 123–134. [Google Scholar] [CrossRef]
  12. DeCasien, A.R.; Williams, S.A.; Higham, J.P. Primate Brain Size Is Predicted by Diet but Not Sociality. Nat. Ecol. Evol. 2017, 1, 1–7. [Google Scholar] [CrossRef]
  13. Sandi, C. Stress and Cognition. Wiley Interdiscip. Rev. Cogn. Sci. 2013, 4, 245–261. [Google Scholar] [CrossRef]
  14. Griffin, A.S.; Guillette, L.M.; Healy, S.D. Cognition and Personality: An Analysis of an Emerging Field. Trends Ecol. Evol. 2015, 30, 207–214. [Google Scholar] [CrossRef]
  15. Fischer, S.; Balshine, S.; Hadolt, M.C.; Schaedelin, F.C. Siblings Matter: Family Heterogeneity Improves Associative Learning Later in Life. Ethology 2021, 127, 897–907. [Google Scholar] [CrossRef]
  16. Alves, J.; de Sá Couto-Pereira, N.; Merscher Sobreira de Lima, R.; Quillfeldt, J.A.; Dalmaz, C. Effects of Early Life Adversities upon Memory Processes and Cognition in Rodent Models. Neuroscience 2022, 497, 282–307. [Google Scholar] [CrossRef] [PubMed]
  17. Heldstab, S.A.; Isler, K.; Graber, S.M.; Schuppli, C.; van Schaik, C.P. The Economics of Brain Size Evolution in Vertebrates. Curr. Biol. 2022, 32, R697–R708. [Google Scholar] [CrossRef] [PubMed]
  18. Reichert, M.S.; Quinn, J.L. Cognition in Contests: Mechanisms, Ecology, and Evolution. Trends Ecol. Evol. 2017, 32, 773–785. [Google Scholar] [CrossRef] [PubMed]
  19. Dukas, R. Evolutionary Biology of Animal Cognition. Annu. Rev. Ecol. Evol. Syst. 2004, 35, 347–374. [Google Scholar] [CrossRef]
  20. Beran, M.J.; Parrish, A.E.; Perdue, B.M.; Washburn, D.A. Comparative Cognition: Past, Present, and Future. Int. J. Comp. Psychol. 2014, 27, 1. [Google Scholar] [CrossRef]
  21. Bräuer, J.; Hanus, D.; Pika, S.; Gray, R.; Uomini, N. Old and New Approaches to Animal Cognition: There Is Not “One Cognition”. J. Intell. 2020, 8, 28. [Google Scholar] [CrossRef] [PubMed]
  22. McGrew, W.C. Is Primate Tool Use Special? Chimpanzee and New Caledonian Crow Compared. Philos. Trans. R. Soc. B Biol. Sci. 2013, 368, 20120422. [Google Scholar] [CrossRef]
  23. Krasheninnikova, A.; Chow, P.K.Y.; von Bayern, A.M.P. Comparative Cognition: Practical Shortcomings and Some Potential Ways Forward. Can. J. Exp. Psychol. Can. Psychol. Expérimentale 2020, 74, 160–169. [Google Scholar] [CrossRef]
  24. Mikhalevich, I.; Powell, R.; Logan, C. Is Behavioural Flexibility Evidence of Cognitive Complexity? How Evolution Can Inform Comparative Cognition. Interface Focus 2017, 7, 20160121. [Google Scholar] [CrossRef]
  25. Kabadayi, C.; Bobrowicz, K.; Osvath, M. The Detour Paradigm in Animal Cognition. Anim. Cogn. 2018, 21, 21–35. [Google Scholar] [CrossRef]
  26. MacLean, E.L.; Hare, B.; Nun, C.L.; Addess, E.; Amic, F.; Anderson, R.C.; Aureli, F.; Baker, J.M.; Bania, A.E.; Barnard, A.M.; et al. The Evolution of Self-Control. Proc. Natl. Acad. Sci. USA 2014, 111, E2140–E2148. [Google Scholar] [CrossRef]
  27. Santacà, M.; Busatta, M.; Lucon-Xiccato, T.; Bisazza, A. Sensory Differences Mediate Species Variation in Detour Task Performance. Anim. Behav. 2019, 155, 153–162. [Google Scholar] [CrossRef]
  28. Shaw, R.C.; Schmelz, M. Cognitive Test Batteries in Animal Cognition Research: Evaluating the Past, Present and Future of Comparative Psychometrics. Anim. Cogn. 2017, 20, 1003–1018. [Google Scholar] [CrossRef] [PubMed]
  29. Salena, M.G.; Turko, A.J.; Singh, A.; Pathak, A.; Hughes, E.; Brown, C.; Balshine, S. Understanding Fish Cognition: A Review and Appraisal of Current Practices. Anim. Cogn. 2021, 24, 395–406. [Google Scholar] [CrossRef] [PubMed]
  30. Bshary, R.; Triki, Z. Fish Ecology and Cognition: Insights from Studies on Wild and Wild-Caught Teleost Fishes. Curr. Opin. Behav. Sci. 2022, 46, 101174. [Google Scholar] [CrossRef]
  31. Vila Pouca, C.; Brown, C. Contemporary Topics in Fish Cognition and Behaviour. Curr. Opin. Behav. Sci. 2017, 16, 46–52. [Google Scholar] [CrossRef]
  32. Healy, S.D.; Patton, B.W. It Began in Ponds and Rivers: Charting the Beginnings of the Ecology of Fish Cognition. Front. Vet. Sci. 2022, 9, 823143. [Google Scholar] [CrossRef] [PubMed]
  33. Schnell, A.K.; Amodio, P.; Boeckle, M.; Clayton, N.S. How Intelligent Is a Cephalopod? Lessons from Comparative Cognition. Biol. Rev. 2021, 96, 162–178. [Google Scholar] [CrossRef]
  34. Braga Goncalves, I.; Ashton, B.J.; Fischer, S. Causes and Consequences of Cognitive Variation in Fishes. Fishes 2023, 8, 277. [Google Scholar] [CrossRef]
  35. Herrmann, E.; Call, J.; Hernández-Lloreda, M.V.; Hare, B.; Tomasello, M. Humans Have Evolved Specialized Skills of Social Cognition: The Cultural Intelligence Hypothesis. Science 2007, 317, 1360–1366. [Google Scholar] [CrossRef]
  36. Gingins, S.; Bshary, R. The Cleaner Wrasse Outperforms Other Labrids in Ecologically Relevant Contexts, but Not in Spatial Discrimination. Anim. Behav. 2016, 115, 145–155. [Google Scholar] [CrossRef]
  37. Salwiczek, L.H.; Prétôt, L.; Demarta, L.; Proctor, D.; Essler, J.; Pinto, A.I.; Wismer, S.; Stoinski, T.; Brosnan, S.F.; Bshary, R. Adult Cleaner Wrasse Outperform Capuchin Monkeys, Chimpanzees and Orang-Utans in a Complex Foraging Task Derived from Cleaner—Client Reef Fish Cooperation. PLoS ONE 2012, 7, e49068. [Google Scholar] [CrossRef]
  38. Triki, Z.; Emery, Y.; Teles, M.C.; Oliveira, R.F.; Bshary, R. Brain Morphology Predicts Social Intelligence in Wild Cleaner Fish. Nat. Commun. 2020, 11, 6423. [Google Scholar] [CrossRef]
  39. Ronco, F.; Matschiner, M.; Böhne, A.; Boila, A.; Büscher, H.H.; Indermaur, A.; El Taher, A.; Malinsky, M.; Ricci, V.; Kahmen, A.; et al. Drivers and Dynamics of a Massive Adaptive Radiation in African Cichlid Fish. Nature 2021, 589, 76–81. [Google Scholar] [CrossRef] [PubMed]
  40. Taborsky, M.; Wong, M.Y.L. Sociality in Fishes. In Comparative Social Evolution; Rubenstein, D.R., Abbot, P., Eds.; Cambridge University Press: Cambridge, UK, 2017; pp. 354–389. ISBN 9781107338319. [Google Scholar]
  41. Fischer, S.; Bohn, L.; Oberhummer, E.; Nyman, C.; Taborsky, B. Divergence of Developmental Trajectories Is Triggered Interactively by Early Social and Ecological Experience in a Cooperative Breeder. Proc. Natl. Acad. Sci. USA 2017, 114, E9300–E9307. [Google Scholar] [CrossRef]
  42. Fischer, S.; Bessert-Nettelbeck, M.; Kotrschal, A.; Taborsky, B. Rearing-Group Size Determines Social Competence and Brain Structure in a Cooperatively Breeding Cichlid. Am. Nat. 2015, 186, 123–140. [Google Scholar] [CrossRef] [PubMed]
  43. Reddon, A.R.; O’Connor, C.M.; Ligocki, I.Y.; Hellmann, J.K.; Marsh-rollo, S.E.; Hamilton, I.M.; Balshine, S. No Evidence for Larger Brains in Cooperatively Breeding Cichlid Fishes. Can. J. Zool. 2016, 94, 373–378. [Google Scholar] [CrossRef]
  44. Salena, M.G.; Singh, A.; Weller, O.; Fang, X.X.; Balshine, S. Rapid Spatial Learning in Cooperative and Non-Cooperative Cichlids. Behav. Process. 2022, 194, 104550. [Google Scholar] [CrossRef]
  45. Wallace, K.J.; Choudhary, K.D.; Kutty, L.A.; Le, D.H.; Lee, M.T.; Wu, K.; Hofmann, H.A. Social Ascent Changes Cognition, Behaviour and Physiology in a Highly Social Cichlid Fish. Philos. Trans. R. Soc. B Biol. Sci. 2022, 377, 20200448. [Google Scholar] [CrossRef] [PubMed]
  46. Lindenfors, P.; Wartel, A.; Lind, J. “Dunbar’s Number” Deconstructed. Biol. Lett. 2021, 17, 20210158. [Google Scholar] [CrossRef] [PubMed]
  47. Powell, L.E.; Isler, K.; Barton, R.A. Re-Evaluating the Link between Brain Size and Behavioural Ecology in Primates. Proc. R. Soc. B Biol. Sci. 2017, 284, 1–8. [Google Scholar] [CrossRef] [PubMed]
  48. Shultz, S.; Dunbar, R.I.M. Both Social and Ecological Factors Predict Ungulate Brain Size. Proc. R. Soc. B Biol. Sci. 2006, 273, 207–215. [Google Scholar] [CrossRef] [PubMed]
  49. Bergman, T.J.; Beehner, J.C. Measuring Social Complexity. Anim. Behav. 2015, 103, 203–209. [Google Scholar] [CrossRef]
  50. Kappeler, P.M. A Framework for Studying Social Complexity. Behav. Ecol. Sociobiol. 2019, 73, 13. [Google Scholar] [CrossRef]
  51. Byrne, R.W.; Bates, L.A. Sociality, Evolution and Cognition. Curr. Biol. 2007, 17, 714–723. [Google Scholar] [CrossRef]
  52. Chapman, B.B.; Ward, A.J.W.; Krause, J. Schooling and Learning: Early Social Environment Predicts Social Learning Ability in the Guppy, Poecilia reticulata. Anim. Behav. 2008, 76, 923–929. [Google Scholar] [CrossRef]
  53. Jordan, L.A.; Taborsky, B.; Taborsky, M. Cichlids as a Model System for Studying Social Behaviour and Evolution. In The Behaviour, Ecology, and Evolution of Cichlid Fishes: A Contemporary Modern Synthesis; Abate, M.E., Noakes, D.L.G., Eds.; Springer: Berlin/Heidelberg, Germany, 2021; pp. 587–635. [Google Scholar]
  54. Shumway, C.A. The Evolution of Complex Brains and Behaviors in African Cichlid Fishes. Curr. Zool. 2010, 56, 144–156. [Google Scholar] [CrossRef]
  55. Kotrschal, A.; Taborsky, B. Environmental Change Enhances Cognitive Abilities in Fish. PLoS Biol. 2010, 8, e1000351. [Google Scholar] [CrossRef] [PubMed]
  56. Brown, C.; Laland, K.N. Social Learning in Fishes: A Review. Fish Fish. 2003, 4, 280–288. [Google Scholar] [CrossRef]
  57. Näslund, J.; Johnsson, J.I. Environmental Enrichment for Fish in Captive Environments: Effects of Physical Structures and Substrates. Fish Fish. 2016, 17, 1–30. [Google Scholar] [CrossRef]
  58. Taborsky, M. Cichlid Fishes: A Model for the Integrative Study of Social Behavior. In Cooperative Breeding in Vertebrates: Studies of Ecology, Evolution and Behavior; Koenig, W.D., Dickinson, J.L., Eds.; Cambridge University Press: Cambridge, UK, 2016; pp. 272–293. [Google Scholar]
  59. Heg, D.; Bachar, Z.; Brouwer, L.; Taborsky, M. Predation Risk Is an Ecological Constraint for Helper Dispersal in a Cooperatively Breeding Cichlid. Proc. R. Soc. B Biol. Sci. 2004, 271, 2367–2374. [Google Scholar] [CrossRef] [PubMed]
  60. Jungwirth, A.; Zöttl, M.; Bonfils, D.; Josi, D.; Frommen, J.G.; Taborsky, M. Philopatry Yields Higher Fitness than Dispersal in a Cooperative Breeder with Sex-Specific Life History Trajectories. Sci. Adv. 2023, 9, eadd2146. [Google Scholar] [CrossRef] [PubMed]
  61. Dey, C.J.; Reddon, A.R.; O’Connor, C.M.; Balshine, S. Network Structure Is Related to Social Conflict in a Cooperatively Breeding Fish. Anim. Behav. 2013, 85, 395–402. [Google Scholar] [CrossRef]
  62. Hellmann, J.K.; Ligocki, I.Y.; O’Connor, C.M.; Reddon, A.R.; Garvy, K.A.; Marsh-Rollo, S.E.; Gibbs, H.L.; Balshine, S.; Hamilton, I.M. Reproductive Sharing in Relation to Group and Colony-Level Attributes in a Cooperative Breeding Fish. Proc. R. Soc. B Biol. Sci. 2015, 282, 20150954. [Google Scholar] [CrossRef]
  63. Jungwirth, A.; Taborsky, M. First- and Second-Order Sociality Determine Survival and Reproduction in Cooperative Cichlids. Proc. R. Soc. B Biol. Sci. 2015, 282, 20151971. [Google Scholar] [CrossRef]
  64. Zöttl, M.; Frommen, J.G.; Taborsky, M. Group Size Adjustment to Ecological Demand in a Cooperative Breeder. Proc. R. Soc. B Biol. Sci. 2013, 280, 20122772. [Google Scholar] [CrossRef]
  65. Fischer, S.; Zöttl, M.; Groenewoud, F.; Taborsky, B. Group-Size-Dependent Punishment of Idle Subordinates in a Cooperative Breeder Where Helpers Pay to Stay. Proc. R. Soc. B Biol. Sci. 2014, 281, 20140184. [Google Scholar] [CrossRef] [PubMed]
  66. Jungwirth, A.; Walker, J.; Taborsky, M. Prospecting Precedes Dispersal and Increases Survival Chances in Cooperatively Breeding Cichlids. Anim. Behav. 2015, 106, 107–114. [Google Scholar] [CrossRef]
  67. Groenewoud, F.; Frommen, J.G.; Josi, D.; Tanaka, H.; Jungwirth, A.; Taborsky, M. Predation Risk Drives Social Complexity in Cooperative Breeders. Proc. Natl. Acad. Sci. USA 2016, 113, 4104–4109. [Google Scholar] [CrossRef] [PubMed]
  68. Lein, E.; Jordan, A. Studying the Evolution of Social Behaviour in One of Darwin’s Dreamponds: A Case for the Lamprologine Shell-Dwelling Cichlids. Hydrobiologia 2021, 848, 3699–3726. [Google Scholar] [CrossRef]
  69. Duftner, N.; Sefc, K.M.; Koblmüller, S.; Salzburger, W.; Taborsky, M.; Sturmbauer, C. Parallel Evolution of Facial Stripe Patterns in the Neolamprologus brichardi/pulcher Species Complex Endemic to Lake Tanganyika. Mol. Phylogenet. Evol. 2007, 45, 706–715. [Google Scholar] [CrossRef] [PubMed]
  70. Jungwirth, A.; Nührenberg, P.; Jordan, A. On the Importance of Defendable Resources for Social Evolution: Applying New Techniques to a Long-Standing Question. Ethology 2021, 127, 872–885. [Google Scholar] [CrossRef]
  71. Hartley, R.; Zisserman, A. Multiple View Geometry in Computer Vision, 2nd ed.; Cambridge University Press: Cambridge, UK, 2004; ISBN 978-0-521-54051-3. [Google Scholar]
  72. Griwodz, C.; Gasparini, S.; Calvet, L.; Gurdjos, P.; Castan, F.; Maujean, B.; De Lillo, G.; Lanthony, Y. AliceVision Meshroom: An Open-Source 3D Reconstruction Pipeline. In Proceedings of the MMSys ’21: 12th ACM Multimedia Systems Conference, Istanbul, Turkey, 28 September–1 October 2021; pp. 241–247. [Google Scholar]
  73. Blender Online Community. Blender—A 3D Modelling and Rendering Package; Blender Foundation, Stichting Blender Foundation: Amsterdam, The Netherlands, 2018. [Google Scholar]
  74. R Development Core Team. R: A Language and Environment for Statistical Computing; R Foundation for Statistical Computing: Vienna, Austria, 2013. [Google Scholar]
  75. Bates, D.; Maechler, M.; Bolker, B.M.; Walker, S. Fitting Linear Mixed-Effects Models Using lme4. J. Stat. Softw. 2015, 67, 1–48. [Google Scholar] [CrossRef]
  76. Singmann, H.; Bolker, B.; Westfall, J.; Aust, F.; Ben-Sachar, M.S.; Højsgaard, S.; Fox, J.; Lawrence, M.A.; Mertens, U.; Love, J.; et al. Afex: Analysis of Factorial Experiments. 2023. Available online: https://CRAN.R-project.org/package=afex (accessed on 20 November 2023).
  77. Dunbar, R.I.M. The Social Brain Hypothesis and Human Evolution. Oxford Res. Encycl. Psychol. 2016. [Google Scholar] [CrossRef]
  78. Jungwirth, A.; Balzarini, V.; Zöttl, M.; Salzmann, A.; Taborsky, M.; Frommen, J.G. Long-Term Individual Marking of Small Freshwater Fish: The Utility of Visual Implant Elastomer Tags. Behav. Ecol. Sociobiol. 2019, 73, 49. [Google Scholar] [CrossRef]
  79. Lucon-Xiccato, T.; Bisazza, A. Sex Differences in Spatial Abilities and Cognitive Flexibility in the Guppy. Anim. Behav. 2017, 123, 53–60. [Google Scholar] [CrossRef]
  80. Fischer, S.; Jungwirth, A. The Costs and Benefits of Larger Brains in Fishes. J. Evol. Biol. 2022, 35, 973–985. [Google Scholar] [CrossRef]
  81. Brown, V.J.; Tait, D.S. Behavioral Flexibility: Attentional Shifting, Rule Switching, and Response Reversal. In Encyclopedia of Psychopharmacology; Stoleman, I.P., Price, L.H., Eds.; Springer: Berlin/Heidelberg, Germany, 2014. [Google Scholar]
  82. Tebbich, S.; Stereln, K.; Teschke, I. The Tale of the Finch: Adaptive Radiation and Behavioural Flexibility. Philos. Trans. R. Soc. B Biol. Sci. 2010, 365, 1099–1109. [Google Scholar] [CrossRef] [PubMed]
  83. Diamond, A. Executive Functions. Annu. Rev. Psychol. 2013, 64, 135–168. [Google Scholar] [CrossRef] [PubMed]
  84. Amici, F.; Aureli, F.; Call, J. Fission-Fusion Dynamics, Behavioral Flexibility, and Inhibitory Control in Primates. Curr. Biol. 2008, 18, 1415–1419. [Google Scholar] [CrossRef] [PubMed]
  85. Santos, L.R.; Ericson, B.N.; Hauser, M.D. Constraints on Problem Solving and Inhibition: Object Retrieval in Cotton-Top Tamarins (Saguinus oedipus oedipus). J. Comp. Psychol. 1999, 113, 186–193. [Google Scholar] [CrossRef]
  86. Brucks, D.; Marshall-Pescini, S.; Range, F. Dogs and Wolves Do Not Differ in Their Inhibitory Control Abilities in a Non-Social Test Battery. Anim. Cogn. 2019, 22, 1–15. [Google Scholar] [CrossRef] [PubMed]
  87. Johnson-Ulrich, L.; Holekamp, K.E. Group Size and Social Rank Predict Inhibitory Control in Spotted Hyaenas. Anim. Behav. 2020, 160, 157–168. [Google Scholar] [CrossRef]
  88. Lucon-Xiccato, T.; Montalbano, G.; Reddon, A.R.; Bertolucci, C. Social Environment Affects Inhibitory Control via Developmental Plasticity in a Fish. Anim. Behav. 2022, 183, 69–76. [Google Scholar] [CrossRef]
  89. Logan, C.J.; McCune, K.B.; MacPherson, M.; Johnson-Ulrich, Z.; Rowney, C.; Seitz, B.; Blaisdell, A.P.; Deffner, D.; Wascher, C.A.F. Are the More Flexible Individuals Also Better at Inhibition? Anim. Behav. Cogn. 2022, 9, 14–36. [Google Scholar] [CrossRef]
  90. Izquierdo, A.; Brigman, J.L.; Radke, A.K.; Rudebeck, P.H.; Holmes, A. The Neural Basis of Reversal Learning: An Updated Perspective. Neuroscience 2017, 345, 12–26. [Google Scholar] [CrossRef]
  91. Schluessel, V.; Leo, V.; Bawolt, M.; Kreuter, N. When the Penny Drops: Sharks Outsmart Cichlids in Serial Reversal Learning. Behaviour 2023, 160, 1259–1281. [Google Scholar] [CrossRef]
  92. Boogert, N.J.; Fawcett, T.W.; Lefebvre, L. Mate Choice for Cognitive Traits: A Review of the Evidence in Nonhuman Vertebrates. Behav. Ecol. 2011, 22, 447–459. [Google Scholar] [CrossRef]
  93. Ashton, B.; Ridley, A.R.; Edwards, E.K.; Thornton, A. Cognitive Performance Is Linked to Group Size and Affects Fitness in Australian Magpies. Nature 2018, 554, 364–367. [Google Scholar] [CrossRef]
  94. Bebus, S.E.; Small, T.W.; Jones, B.C.; Elderbrock, E.K.; Schoech, S.J. Associative Learning Is Inversely Related to Reversal Learning and Varies with Nestling Corticosterone Exposure. Anim. Behav. 2016, 111, 251–260. [Google Scholar] [CrossRef]
  95. Boogert, N.J.; Monceau, K.; Lefebvre, L. A Field Test of Behavioural Flexibility in Zenaida Doves (Zenaida aurita). Behav. Process. 2010, 85, 135–141. [Google Scholar] [CrossRef] [PubMed]
  96. Cauchoix, M.; Hermer, E.; Chaine, A.S.; Morand-Ferron, J. Cognition in the Field: Comparison of Reversal Learning Performance in Captive and Wild Passerines. Sci. Rep. 2017, 7, 12945. [Google Scholar] [CrossRef] [PubMed]
  97. Tomasek, M.; Stark, M.; Dufour, V.; Jordan, A. Cognitive Flexibility in a Tanganyikan Bower-Building Cichlid, Aulonocranus dewindti. Anim. Cogn. 2023, 26, 1959–1971. [Google Scholar] [CrossRef] [PubMed]
Figure 1. Pictures of the 3D reconstructed habitats of the four different plots used in locality 1 (a,b) and in locality 2 (c,d). Plots in locality 1 were in front of Chikonde village (approximately at 8°42′43″ S, 31°07′33″ E) and plots in locality 2 were at the southwestern tip of Kumbula (Mbita) Island (approximately at 8°45′15″ S, 31°05′06″ E).
Fishes 09 00050 g001
Figure 2. The difference between the first interaction with the setup and the first successful feeding when groups were presented with food placed inside the long or the short cylinder. Shown are groups that successfully fed on the reward during the control condition. Each box represents data for 19 groups presented with either the long cylinder (dark grey) or the short cylinder (light grey). Thick horizontal lines indicate the median, boxes span the interquartile range, whiskers extend to the minimum and maximum values, and dots represent outliers.
Fishes 09 00050 g002
Figure 3. The number of fish feeding on the reward relative to the number of fish interacting with the setup. Shown is the relative number of fish feeding on the reward, with values ranging from 0 to 1, where a number closer to 1 indicates that most (or all) fish interacting with the setup also successfully reached the reward. Presented are groups that successfully fed on the reward during the control condition and each box represents data for 19 groups presented either with a long cylinder (dark grey) or with a short cylinder (light grey). Thick horizontal lines indicate the median, boxes span the interquartile range, whiskers extend to the minimum and maximum values, and dots represent outliers.
Fishes 09 00050 g003
Figure 4. The number of failed attempts per interacting individual. Shown is the total number of failed attempts divided by the number of interacting individuals. Presented are groups that successfully fed on the reward during the control condition and each box represents data for 19 groups presented either with the long cylinder (dark grey) or the short cylinder (light grey). Thick horizontal lines indicate the median, boxes span the interquartile range, whiskers extend to the minimum and maximum values and dots represent outliers.
Fishes 09 00050 g004
Figure 5. The difference between the first interaction with the long cylinder and the first successful feeding. Shown are the differences, in seconds, for each plot (see Section 2—Methods). Presented are groups that successfully fed on the reward during the control condition, and each box represents data for 19 groups in ‘Plot 1A’ (green, N = 3), ‘Plot 1B’ (red, N = 4), ‘Plot 2A’ (light blue, N = 6), and ‘Plot 2B’ (light orange, N = 6). Thick horizontal lines indicate the median, boxes span the interquartile range, whiskers extend to the minimum and maximum values, and dots represent outliers. For each plot, three habitat characteristics are presented below the x-axis labels. Habitat: a plot’s rugosity, i.e., its total surface area as calculated on the basis of the SfM reconstructions (see Section 2—Methods) divided by the surface area of a flat plane of the same size. Predators: a count of predatory species found in the plot during our survey (see Section 2—Methods). Competitors: a count of space competitors found in the plot during our survey (see Section 2—Methods).
Fishes 09 00050 g005
Table 1. Comparisons of behaviours for the two inhibitory control conditions. (a) The latency to interact, (b) the latency to feed on the reward after the first interaction with the setup, and (c) the number of failed attempts of N. pulcher when presented with food placed inside the long or the short cylinder. All groups used in this analysis successfully fed on the reward in the control condition. Estimates are on a log scale and presented as the difference from the reference level ‘Long cylinder’ for factor ‘Inhibitory control condition’. F-values and p-values refer to comparisons of models with or without the factor of interest. To obtain normally distributed residuals, the dependent variables of all models were log transformed. N = 38 observations in 19 groups; p-values < 0.05 are highlighted in bold.
FactorsEstimate ± SENum. D.F.Den. D.F.F-Valuep-Value
(a) Latency to interact
Intercept5.28 ± 0.24----
Inhibitory control condition0.01 ± 0.211181 × 10−30.97
(b) Latency to feed on the reward after the first interaction with the setup
Intercept6.54 ± 0.40---
Inhibitory control condition−1.84 ± 0.4811814.91<0.01
(c) Failed attempts
Intercept1.45 ± 0.16
Inhibitory control condition0.44 ± 0.21184.90.04
Table 2. Comparison of the number of fish feeding on the reward relative to the number of fish interacting with the setup in the inhibitory control condition. Estimates are on a logit scale and presented as the difference from the reference level ‘Long cylinder’ for factor ‘Inhibitory control condition’. F-values and p-values refer to comparisons of models with or without the factor of interest. N = 38 observations in 19 groups; p-values < 0.05 are highlighted in bold.
FactorsEstimate ± SEΧ2-Valuep-Value
Intercept1.67 ± 0.23--
Inhibitory control condition−0.92 ± 0.318.81<0.01
Table 3. Comparisons of the behaviours shown by N. pulcher to test whether the location of the group or total group size determined the performances during the control or the inhibitory control conditions. Estimates are shown on a log scale (a) and as the difference from the reference level ‘Plot 1A’ for factor ‘Location’ (ac). F-values and p-values refer to comparisons of the models with or without the factor of interest. (a) N = 24 groups; (b,c) N = 19 groups; p-values < 0.05 are highlighted in bold.
FactorsEstimate ± SENum. D.F.Den. D.F.F-Valuep-Value
(a) Latency to feed on the reward in the control condition
Intercept7.56 ± 0.42----
Location-3190.010.99
      Plot 1B0.05 ± 0.46----
      Plot 2A−5 × 10⁻³ ± 0.41----
      Plot 2B0.04 ± 0.38----
Group size−0.05 ± 0.021193.330.08
(b) Latency to feed on the reward after the first interaction with the long cylinder
Intercept−219.59 ± 662.68---
Location-3145.88<0.01
      Plot 1B1977.75 ± 655.71----
      Plot 2A170.60 ± 539.15----
      Plot 2B982.17 ± 498.20----
Group size62.201143.670.07
(c) Latency to feed on the reward after the first interaction with the short cylinder
Intercept170.52 ± 711.77----
Location-3130.280.84
      Plot 1B446.08 ± 701.58----
      Plot 2A−8.21 ± 581.73----
      Plot 2B198.78 ± 530.78----
Group size14.68 ± 35.061130.180.68
Table 4. The latency to feed on the reward after the first interaction with the long cylinder. Orthogonal contrasts are presented, which were performed after confirming that the factor ‘Location’ in Table 3b was significant. The intercept estimate represents the grand mean of all treatments. First, we set the contrast of the model to compare the mean of both plots in locality 1 to the mean of both plots in locality 2 ((a); (Plot 1A, Plot 1B) vs. (Plot 2A, Plot 2B)). Second, we compared the two plots in locality 1 ((b); Plot 1A vs. Plot 1B), and third, we compared the two plots in locality 2 ((c); Plot 2A vs. Plot 2B). Note that the mean values of the treatments, presented in round brackets, were used in the comparisons. The direction of the comparison within a contrast is left to right, and the estimate value always refers to the location(s) to the right. N = 19 groups; p-values < 0.05 are highlighted in bold. Further details on the statistical analysis are provided in Section 2 (Methods).
ContrastEstimate ± SEt-Valuep-Value
Intercept563.03 ± 384.211.470.16
(a) Comparison among plots in locality 1 versus plots in locality 2
(Plot 1A, Plot 1B) vs. (Plot 2A, Plot 2B)−206.25 ± 165.11−1.250.23
(b) Comparison among plots within locality 1
Plot 1A vs. Plot 1B988.87 ± 327.863.020.01
(c) Comparison among plots within locality 2
Plot 2A vs. Plot 2B405.78 ± 208.061.950.07
Table 5. Comparisons of the number of fish feeding on the reward relative to the number of fish interacting with the (a) long or the (b) short cylinder. Estimates are shown on a logit scale and as the difference from the reference level ‘Plot1A’ for factor ‘Location’. F-values and p-values refer to comparisons of models with or without the factor of interest. N = 19 groups.
FactorsEstimate ± SEΧ2-Valuep-Value
(a) Number of fish feeding relative to the number of fish interacting (long cylinder)
Intercept2.27 ± 0.82--
Location-5.350.15
      Plot 1B0.74 ± 1.22
      Plot 2A−0.94 ± 0.59
      Plot 2B−0.58 ± 0.68
Group size−0.01 ± 0.050.090.76
(b) Number of fish feeding relative to the number of fish interacting (short cylinder)
Intercept1.49 ± 0.91--
Location-1.330.72
      Plot 1B−0.07 ± 0.93--
      Plot 2A−0.52 ± 0.66--
      Plot 2B−0.57 ± 0.65--
Group size−0.04 ± 0.050.580.44
Disclaimer/Publisher’s Note: The statements, opinions and data contained in all publications are solely those of the individual author(s) and contributor(s) and not of MDPI and/or the editor(s). MDPI and/or the editor(s) disclaim responsibility for any injury to people or property resulting from any ideas, methods, instructions or products referred to in the content.

