Article

Age- and Size- Based Reproductive Potential of Gray Snapper (Lutjanus griseus) in the Eastern Gulf of Mexico

School of Forest, Fisheries and Geomatics Sciences, University of Florida, 7922 Northwest 71st Street, Gainesville, FL 32653, USA
*
Authors to whom correspondence should be addressed.
Current address: School of Marine and Atmospheric Sciences, Stony Brook University, Stony Brook, NY 11794, USA.
Fishes 2024, 9(12), 513; https://doi.org/10.3390/fishes9120513
Submission received: 12 November 2024 / Revised: 11 December 2024 / Accepted: 13 December 2024 / Published: 15 December 2024

Abstract

:
Relatively little is known about size- and age-based reproductive characteristics of Gray Snapper (Lutjanus griseus) despite a large recreational fishery along the west coast of Florida in the Southeastern U.S.A. The purpose of this study was therefore to determine the spawning parameters of Gray Snapper and to quantify female reproductive potential on an age- and size-basis. From 2022 to 2023, 4563 Gray Snapper were collected off the west coast of Florida. Gray Snapper were observed to be actively spawning from late May to early September; however, the percent of females spawning in May and September were both <3%. Batch fecundity for 12 hydrated females showed a hyperallometric relationship with size and age. The spawning fraction also increased disproportionately with female length and age, suggesting older, larger females spawn in greater proportions and more often than younger, smaller females. For females, the length and age at 50% physiological maturity was 292 mm total length (TL) and 2.9 years, and those at 50% functional maturity was 301 mm TL and 3.2 years. Male Gray Snapper reached 50% sexual maturity at 259 mm TL and 1.8 years. The minimum size limit of 10 inches (254 mm) TL in Florida state waters appears to be too low to protect maturing females in particular. These new spawning metrics should be incorporated into future stock assessments to improve estimates of Gray Snapper reproductive output, stock status, and management.
Key Contribution: Female Gray Snapper in the eastern Gulf of Mexico (GOM) showed BOFFF (Big Old Fat Fecund Female) characteristics, where fecundity increased disproportionately with body size, and larger, older females spawned more often throughout the season than younger, smaller females. Females, in particular, also reached sexual maturity at a larger size than the minimum length limit regulated for inshore waters of Florida in the GOM.

1. Introduction

Gray Snapper (Lutjanus griseus) is valued socioeconomically and is important in recreational and commercial fisheries in the United States, most notably in the Gulf of Mexico (GOM). In the GOM, over 90% of Gray Snapper landings are made by the recreational sector with the majority occurring off the west coast of Florida [1,2]. The GOM stock is currently not over-exploited; however, the spawning stock biomass overall has been decreasing since the mid-1970s [2,3]. As fishing regulations become more restrictive on other higher-profile reef fish species, such as Gag Grouper (Mycteroperca microlepis) and Red Snapper (Lutjanus campechanus), fishing pressure would be expected to increase on Gray Snapper in the near future. In fact, in 2024, the GOM Gray Snapper quota (annual catch limit) increased from 2.23 to 5.73 million pounds [4]. To effectively manage a reef fish species, such as Gray Snapper, it is critical to incorporate their reproductive biology, including fecundity, sexual maturity, and spatiotemporal dynamics of spawning, into their stock assessments to be able to estimate recruitment and avoid over-exploitation of the stock [5,6]. However, there is a general lack of detailed information on the reproductive biology of Gray Snapper from the west coast of Florida in the eastern GOM.
Female Gray Snapper are indeterminate batch spawners [7] where oocytes are continuously recruited and spawned in multiple batches over the spawning season [8]. The spawning duration, interval (days between batches), frequency (total number of batches released over a spawning season), and batch fecundity (the number of eggs a female releases in each spawning event) are all needed to estimate total annual fecundity [6]. When these reproductive parameters are unknown or limited, such as with GOM Gray Snapper, female spawning stock biomass (SSB) is used as a proxy for fecundity in the stock assessments [2]. This method assumes an isometric relationship between body weight and fecundity [9,10]. However, across many fish species, there is a disproportionate increase in fecundity per unit body mass with female size and age [11,12]. These fish are commonly referred to as Big Old Fat Fecund Females (BOFFFs), and they often spawn for a longer duration and release batches of eggs more frequently than younger, smaller females, thus directly impacting estimates of total annual fecundity [5,10,13,14]. BOFFFs, in addition to greater reproductive output, typically have larger and higher quality eggs that can lead to increased survival of their larvae [5,15].
The only reproductive parameter used in calculating SSB is sexual maturity [16]. However, accurately estimating the proportion at length or age when a population reaches maturity is highly influenced by the classification of oocyte stages that are considered to be immature versus mature [17]. This has resulted in varying estimates of sexual maturity for Gray Snapper, depending on whether females are classified as physiologically mature when cortical alveolar (CA) oocytes are present or functionally mature with the appearance of vitellogenic oocytes [18,19,20,21]. The differences between these two methods can shift the length and age estimates of sexual maturity and therefore reproductive output of the stock if using methods such as SSB [6]. Maturity definitions can also impact minimum size limit regulations since length and age at physiological maturity can be significantly lower than functional maturity metrics in some species [22].
In addition to fecundity and sexual maturity, behavioral and exogenous cues contribute to reproductive success. Gray Snapper undergo seasonal or permanent movement offshore with ontogeny, presumably for reproductive purposes [23,24,25,26]. In many lutjanids, spawning initiation includes exogenous cues (temperature and photoperiod [27]) and the formation of spawning aggregations around lunar phases, such as with Mutton Snapper (Lutjanus analis) [28] and Cubera Snapper (L. cyanopterus) [29]. In the Southeastern U.S. Atlantic, Gray Snapper are known to form spawning aggregations in the summer at Western Dry Rocks, which is ~16 km southwest of Key West in the Florida Keys reef tract [30]. In the GOM, however, spawning aggregation sites for Gray Snapper off the west coast of Florida are not publicized but are most likely in the Florida Middle Grounds located ~130 km off the coast (i.e., high catches of large fish in the summer, but spawning has not been confirmed) (pers. obs., D. Murie). In addition, various studies have indicated that Gray Snapper spawn on the full moon [23,31] and new moon [24,32] or have no spawning periodicity related to the lunar cycle [33]. As with other snappers, predictability in spawning aggregating behavior in time and place could further make them susceptible to fishing pressure and over-exploitation [34].
Along with the behavioral demands of spawning in fishes (i.e., migration to spawning grounds), energy is required to progress through vitellogenesis and spermatogenesis [24]. Lipid reserves are often observed as an increase in gonad and visceral fat stores pre-spawning with decreases immediately during and after spawning [35]. For example, this has been noted in the Bluespine Unicornfish (Naso unicornis) and other surgeonfishes where large fat deposits form immediately preceding peak spawning to sequester energy for gonad development and decline during peak spawning [36,37].
Reproductive characteristics of Gray Snapper, such as overall spawning season and sexual maturity, have been studied throughout the GOM [18,19], the northern GOM [20], the southern GOM [21], and the Florida Keys [23,24]. However, knowledge of their fecundity and age- and size-based reproductive potential, in particular, is not available for Gray Snapper from the west coast of Florida. The overall goals of this study were therefore as follows: (1) to estimate the spawning duration and frequency on an age- and size-specific basis; (2) to model the batch and total annual fecundity of female Gray Snapper; (3) to assess lunar periodicity in spawning activity; (4) to determine if lipid stores cycle with spawning activity; and (5) to estimate sexual maturity using both physiological and functional maturity criteria. These metrics will allow for a more cohesive understanding of the reproductive biology of Gray Snapper, which can be used in future stock assessments to ensure sustainability of the stock.

2. Materials and Methods

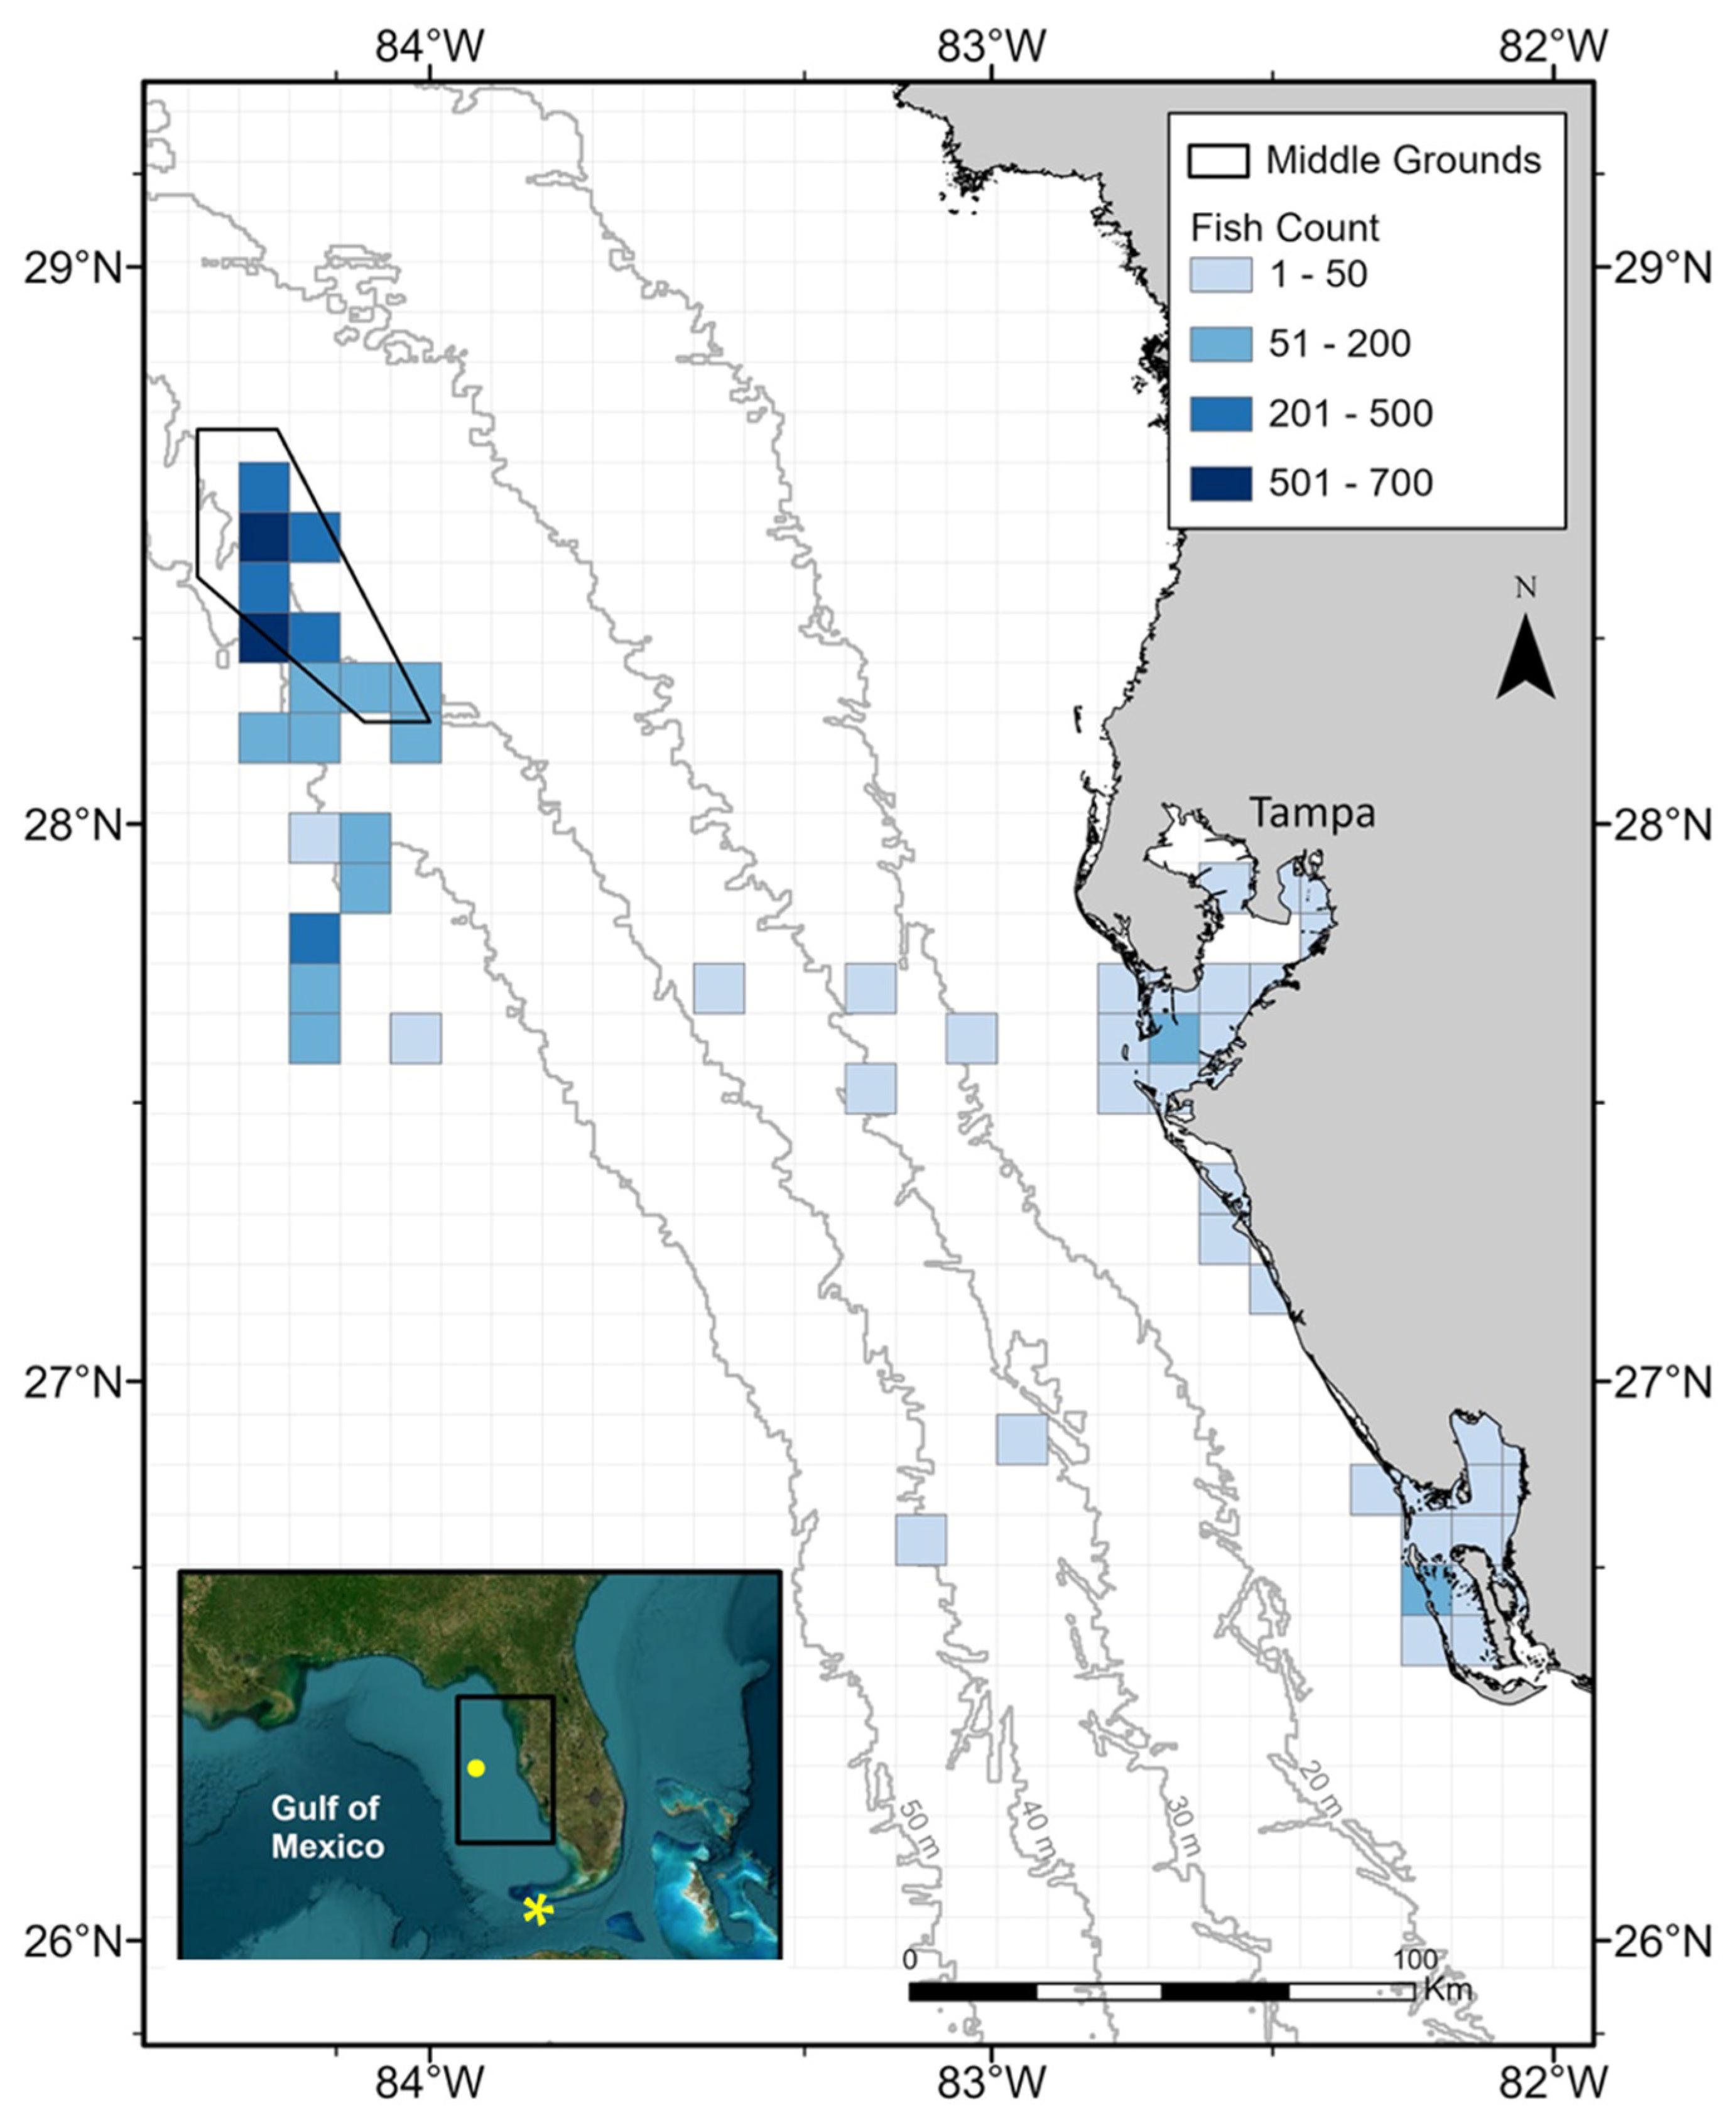
2.1. Sample Collection

Gray Snapper were sampled from the west coast of Florida for two consecutive years from March 2022 to December 2023. Sampling was focused over the summer months during the presumed spawning season as well as over the moon phases to address lunar periodicity in spawning. The majority of fish were collected from headboats using hook-and-line gear and fishing offshore (~40–160 km) within and near the Florida Middle Grounds (FMG), which is a high-relief, live-bottom area considered a ‘habitat area of particular concern’ [38] (Figure 1). Fish were also sampled in inshore areas using hook-and-line fishing on private research charters to collect smaller, presumably mostly immature fish for the sexual maturity analysis. Additional inshore samples were also obtained from the Fisheries-Independent Monitoring (FIM) program of the Florida Fish and Wildlife Research Institute (FWRI) in Tampa Bay and Port Charlotte (Figure 1). The FWRI sampled fish throughout nearshore areas between Tampa Bay and Port Charlotte using a stratified-random sampling design and used a combination of gears, including a 21.3 m seine, a 6.1 m otter trawl, and a 183 m haul seine. For each sampling event, the date, time, and location (latitude and longitude when possible) were recorded.
Fish were measured for fork length (FL, mm), total length (TL, mm), and weighed whole (WT, g). Fish sampled as carcasses from headboats were converted to FL, TL, and WT using linear regressions developed from a subsample of Gray Snapper that were measured and weighed prior to being filleted. Total weight was regressed as a power function of total length:
WT = α TL b
where α is the intercept and b is the allometric exponent. Weight as a function of total length, the covariate, was tested for interactions between years or between sexes using an Analysis of Covariance (ANCOVA). Weight and length data were log10-transformed to meet assumptions of normality and homogeneity of variance. Data were pooled when the interaction was not significantly different between sexes or years. All analyses were computed using the R Statistical Software (version 4.4.1) [39].
Sagittal otoliths were extracted, cleaned and stored dry until aged (see Section 2.2). Gonads were removed from the body cavity, and all gonadal fat stores were removed from the gonads before weighing both separately. For fish samples recovered as filleted carcasses, if only one gonad was intact, then the fat stores removed from the one gonad was multiplied by two to get a total weight of gonadal fat, because gonads in Gray Snapper are bilaterally symmetrical. Visceral fat stores were removed from the surface of the stomach, intestines, and mesenteries in the abdominal cavity and weighed.

2.2. Otolith Preparation and Aging

Gray Snapper were aged using the left sagittal otolith following the protocol of the Gulf States Marine Fisheries Commission’s Otolith Working Group [40]. In brief, the core was marked, and the otolith was embedded in Alraldite epoxy and mounted to a fully-frosted slide. Two cross-sections were taken through the core (0.5 mm width) using a Buehler® (Lake Bluff, IL, USA) variable high-speed digital sectioning saw using three 76 mm blades with 0.5 mm spacers. Sections were mounted on a labelled slide using a permanent cover slip (Flotexx®, Thermo Scientific, Kalamazoo, MI, USA) to increase optical clarity. Otolith sections were viewed using a compound microscope (20–100×) for aging. Following VanderKooy et al. [40], fish were assigned into an age class based on the number of opaque zones, the amount of translucent growth on the margin with respect to their collection date, and the time of opaque zone deposition relative to 1 January. In the GOM, Gray Snapper have an accepted birthdate of 1 July [24,33] and the opaque growth zone forms in April/May [41]. The age class of fish with the opaque zone on the edge or a narrow translucent zone (code of 1 or 2, respectively) that were collected between 1 January and 30 June was the same as the number of enumerated opaque zones. Fish with a wide translucent zone (code of 3 or 4) that were caught during the same time period had their age advanced by one year to ensure that they were assigned into an appropriate age class that kept cohorts together. Fish with an opaque zone on the edge or any amount of translucent zone that were caught after 30 June were assigned an age class equal to the number of opaque zones. These ages were then incorporated into all analyses that were based on age-specific parameters. Otoliths were aged twice by two of three independent readers. Aging precision was assessed by calculating the average percent error (APE) based on the Gray Snapper aging reference set circulated by the Gulf States Marine Fisheries Commission Otolith Working Group (J. Carroll, pers. comm) [42]. This was to ensure that ages assigned met the aging accuracy expected for use in stock assessments (<5% APE).

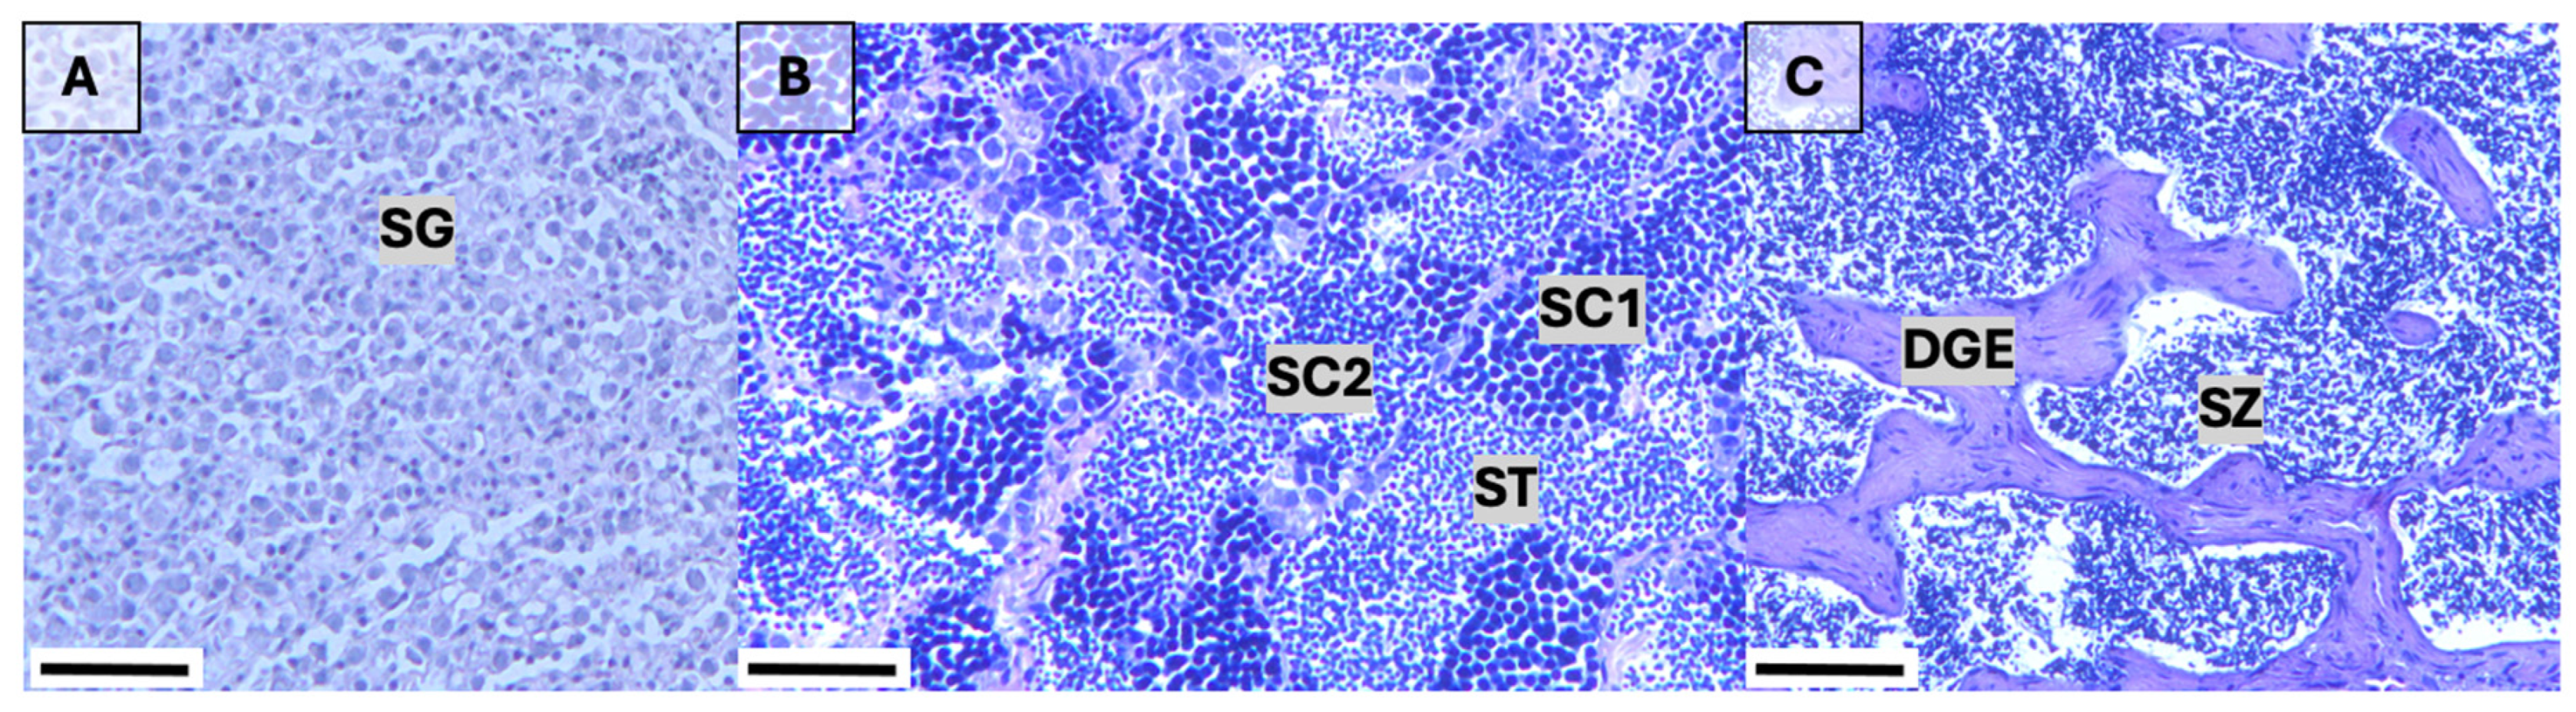
2.3. Histological Preparation and Reproductive Staging

An approximately 1–2 cm subsection from the medial portion of either the right or left ovary (included ovarian lumen and wall) was taken for histology to examine the most advanced gamete stage (MAGS) in the ovary. Samples were fixed for a minimum of 2 weeks in 10% neutral buffered seawater formalin and later placed in a labelled histology cassette (approximately 2 cm × 2 cm × 0.5 cm cross-section slice) for histological processing (Saffron Scientific Histology Services, Carbondale, IL, USA). Gonad sections were dehydrated in alcohol, trimmed and embedded in paraffin wax, and the blocks were then sectioned at 5 μm using a microtome. Gonad sections were mounted on glass slides, which were then stained with hematoxylin and counter-stained with eosin-Y [43].
Fish were reproductively staged using pre-determined criteria modified from Brown-Peterson et al. [44] and Lowerre-Barbieri et al. [16] (Tables S1 and S2). All females were histologically assessed and assigned to a reproductive phase based on the most advanced oocytes present. Reproductive staging provides the foundation for defining spawning seasonality and duration, as well as sexual maturity, and it is therefore important to precisely define each phase. Immature females were defined by only having primary growth oocytes (chromatin nucleolar and perinucleolar); for some very small fish, oogonial nests were evident. To determine if fish were virgin developers (maturing for the first time) versus repeat spawners, females were assessed for indicators of prior spawning (IPS). IPS can include some or all of the following: a thick ovarian wall, large muscle bundles/cords, large blood vessels, open lumen, and phagocytes [22]. Females in the early-developing phase were characterized by the appearance of cortical alveolar (CA) oocytes, whereas females in a later developing stage could have primary (Vtg1) and secondary (Vtg2) vitellogenic oocytes. These females were beginning to develop ovaries in preparation for the upcoming spawning season but were not yet ready to spawn. Spawning-capable females had tertiary vitellogenic oocytes (Vtg3). Females in the actively spawning subphase of the spawning-capable phase had oocytes undergoing final oocyte maturation (OM), which could include germinal vesical migration (GVM), germinal vesicle breakdown (GVBD), hydration (H), and the presence of post-ovulatory follicles (POFs). POFs observed in Gray Snapper were classified as either early or late. Early POFs had both the theca and granulosa cell layers visible, as well as a visible lumen, whereas late-POFs were starting to degenerate with the cell layers collapsing and the lumen no longer open; very old POFs became smaller and triangular in appearance with the cell layers not distinguishable (modified from [9]). The presence of early- or late-POFs in Gray Snapper was assumed to indicate very recent (<24 h) spawning following Red Snapper, which also spawn offshore in the GOM in similar water temperatures [45]. Regression, or the cessation of spawning activity, was identified histologically by oocyte atresia, where oocytes begin to breakdown and become reabsorbed [8]. Females were classified as regressing when the majority of oocytes were atretic; however, a few residual vitellogenic oocytes could still be present during regression. Females in the regenerating phase were distinguished by a thick ovarian wall, large muscle bundles and/or blood vessels, and only primary growth oocytes and/or residual cortical alveolar oocytes [44].
All male testes were macroscopically staged (Table S2) and checked for milt expression and the degree of spermatogenesis. Briefly, milt was noted as free-flowing or being able to be expressed by gentle pressure on the central sperm duct during dissection. Males were identified as mature and actively spawning if milt was released and spermatogenesis (milt) was visually evident throughout the cross-section of one of the testes. A small subsample of males were processed for histology using the same methods as for females; these males were chosen to validate macroscopic staging and, in particular, to stage males that were unidentifiable as immature or regenerating via macroscopic staging. Histologically, immature males were characterized by only having spermatogonia (Sg) and no lumens in the lobules. Developing males were in all stages of spermatogenesis, including spermatogonia, primary and secondary spermatocytes (Sc1 and Sc2), and spermatids (St), but did not have spermatozoa (Sz) in the lumens of the lobules or in the sperm duct. Males were classified as actively spawning when spermatozoa were present in the lumens of the lobules along with the macroscopic observation of milt in the central sperm duct or free-flowing. Males in a regressing phase may have some residual spermatozoa in the sperm duct (not easily expressed) but no spermatogenesis obvious in the cross-section of the testis. Regenerating males had spermatogonia throughout the testes, which then progressed to the developing phase in readiness of the next spawning season. The percentages of the reproductive phases among mature females and males were plotted by month to determine the timing in the development of the spawning season.

2.4. Spawning Seasonality and Condition in Relation to Spawning

The duration and peak of the reproductive season for Gray Snapper were assessed overall and on an age- and size-specific basis by the following: (1) a gross indication of spawning using gonadosomatic indices (GSIs); and (2) histological analysis using reproductive phases. The gonadosomatic index (GSI) was calculated as:
GSI   % = GW GFWT × 100
where GW was gonad weight (g) and GFWT was gonad-free body weight (whole body weight minus gonad weight). To test for significant differences in mean GSI among months and sampling years, a generalized linear model (GLM) with a beta-distribution and logit-link was used given that the GSI, in ratio form, is bound by 0 and 1 and fails to meet normality. Pairwise comparisons were made using the Tukey adjustment on the estimated marginal means calculated with the ‘emmeans’ function (R package version 1.10.0) [46]. The GSI was compared for all mature males and functionally mature females (i.e., MAGS of at least Vtg1 or IPS) to eliminate any biases from virgin fish that may have been developing for the first time (MAGS of CA and no IPS) (i.e., presumed to not be spawning in the current season).
To assess the seasonal condition of mature fish during the spawning cycle, a relative fat index was calculated for each functionally mature female and mature male as:
Fat   % = total   fat body   weight total   fat × 100
where total fat (g) was the weight of the fat deposits from both the gonads and the viscera combined. Mean % fat and mean % GSI were both plotted as a function of month to examine whether visceral fat deposits decreased over the spawning season.
The total spawning season duration for female Gray Snapper from reproductive staging was based on the first and last dates of females caught in the actively spawning subphase [17]. Spawning duration was also calculated on an age- and size-specific basis for females, and regression analysis was used to test whether there was a significant increase in spawning season duration with increasing age and size. For all age- and size-specific analyses, females were placed into 25 mm TL-size bins and individual age groups.

2.5. Spawning Fraction, Interval, and Frequency

The spawning fraction (SF) was estimated by the POF method [9] as:
SF   = females   with   POFs total   number   of   mature   females
This method uses the incidence of females with post-ovulatory follicles that are less than 24 h old to represent the probability of mature females spawning on a daily basis. Mature females used in the spawning fraction calculations were functionally mature females since it was assumed that females with a MAGS of only CA (i.e., physiologically mature females) would not actually be spawning within the current spawning season.
The spawning interval (SI) was calculated by taking the inverse of the spawning fraction (i.e., 1/SF) and represents the average number of days between batches (i.e., spawning events). The overall spawning frequency, or the total number of batches to be spawned during the spawning season (regardless of age or size), was equal to the length of the spawning season divided by the spawning interval. Spawning frequency on an age- and size-specific basis was calculated by dividing the duration of the spawning season for that age or size group by their age/size-specific spawning interval (inverse of their age/size specific spawning fraction). This resulted in an estimate of the expected number of spawns (batches of eggs) per female per annual spawning season on an age- or size-specific basis [47]. Age- and size-specific spawning fractions were also examined for each sampling month to determine finer-scale temporal trends.

2.6. Fecundity

Batch fecundity (BF) estimates were determined using the hydrated oocyte method on a gravimetric basis [8]. In brief, the number of hydrated oocytes in a weighed subsample of ovarian tissue was extrapolated to the whole ovary weight for each female:
BF   = number   of   hydrated   oocytes subsample   wt   g ×   whole   ovary   weight   g
The number of hydrated oocytes was estimated by removing ~0.075 g of preserved ovary tissue from multiple locations, from the periphery to the core, and blotting it on a Kimwipe until the residual fluid was removed. This subsample of ovary was then weighed precisely (0.0001 g) and placed in a solution of 33% glycerin and water for 2–4 days. Hydrated oocytes were enumerated using a Borogov zooplankton counting chamber under a stereomicroscope. BF was also estimated for fish in OM, which included oocytes in germinal vesicle migration, germinal vesicle breakdown, and yolk coalescence, when these stages were prevalent in their histology slides. Females identified with early-POFs were not used in the BF estimates, for either the OM or hydrated counts, as this would underestimate their counts [8]. Two independent BF estimates were taken for each female and then averaged; if the two estimates for any individual female differed by more than 10%, then a third BF estimate was performed. To increase the sample size, additional ovarian samples from hydrated females (also without early POFs) were obtained from the NOAA Fisheries Panama City Laboratory, Panama City, FL, USA, along with their collection data on date, length, weight, gonad weight, and age. These fish were captured offshore of Panama City, ~400 km northwest of Tampa (Figure 1). UF personnel estimated batch fecundity for these females using the same protocol as the other samples so that the data could be seamlessly combined.
Batch fecundity (BF) was modelled as a function of female age and length (TL) using the allometric (power) function:
BF = α X b
where X is TL or age, b is the scaling exponent, and a is a coefficient. These models were used to test the “BOFFFs” hypothesis that fecundity increases disproportionately with female age and length [10,48]. When the allometric scaling exponent b is >1, then the relationship shows hyperallometric scaling rather than proportional or isometric (i.e., linear) scaling (i.e., b = 1). For the allometric relationship of fecundity as a function of length, the scaling exponent was compared relative to b from the allometric function for the weight−length relationship because weight itself is an allometric function of length. If b was greater for fecundity as a function of length compared to weight as a function of length, then fecundity was determined to increase disproportionately relative to fish length [49]. BF estimates as a function of female length and age were modeled and tested for significance using linear least squares regression on log-log transformed data.
Total potential annual fecundity was calculated for each female by multiplying her batch fecundity by the spawning frequency (regardless of age or size), which was calculated from the pooled spawning season duration. Total annual fecundity was also estimated by multiplying the BF for each female by the appropriate age- and size-specific parameter estimates for her age or size group for the spawning duration, fraction, interval, and thus frequency. For comparative purposes, annual fecundity calculated using the age- and length-based parameters was compared to an annual fecundity calculated from the pooled spawning frequency, regardless of female age and size.

2.7. Lunar Periodicity

To determine if female Gray Snapper spawn in accordance with the lunar cycle, potential differences in the number of functionally mature females with POFs or OM were compared relative to moon phases using a chi-square test [50]. Data were aggregated within ±3 days around the new, first-quarter, full, and last-quarter moons [50]. The lunar analysis only used data from 2023 because sampling occurred consistently around all moon phases.

2.8. Sexual Maturity

Sexual maturity of females was estimated based on both physiological and functional maturity criteria. Physiological maturity included females with cortical alveolar oocytes and oocyte stages beyond CA (including regenerating and regressing stages), regardless of the presence of IPS (i.e., a thick ovarian wall, large muscle bundles, and large blood vessels). Functional maturity included females with Vtg1 oocytes and beyond, as well as females with a MAGS of CA with IPS (i.e., females not developing for the first time were classified as mature). Maturity of males was based on all males in the developing, spawning-capable, regressing, and regenerating phases from macroscopic staging and males containing primary spermatocytes and beyond for males assessed histologically [16]. The length and age at 50% sexual maturity (L50 and A50, respectively) for each maturity criterion were derived using a GLM with a binomial error distribution and a logit link function in R 4.3.2 [39] and with the ‘sizeMat’ (R package version 1.1.2) [51]. A two-parameter logistic curve was fit to the proportional frequencies:
p = 1 1 + e α + β X
where p is the predicted proportion of mature individuals at a given length ( X ; TL mm) or age ( X ; years), and a (intercept) and β (slope) are estimated parameters [22,52]. The fitted values for the logistic regression and the 95% confidence intervals were estimated using 999 Metropolis−Hastings bootstrap iterations. Both models included fish only captured during the reproductive season to prevent the potential misclassification of regenerating females and males as immature.

3. Results

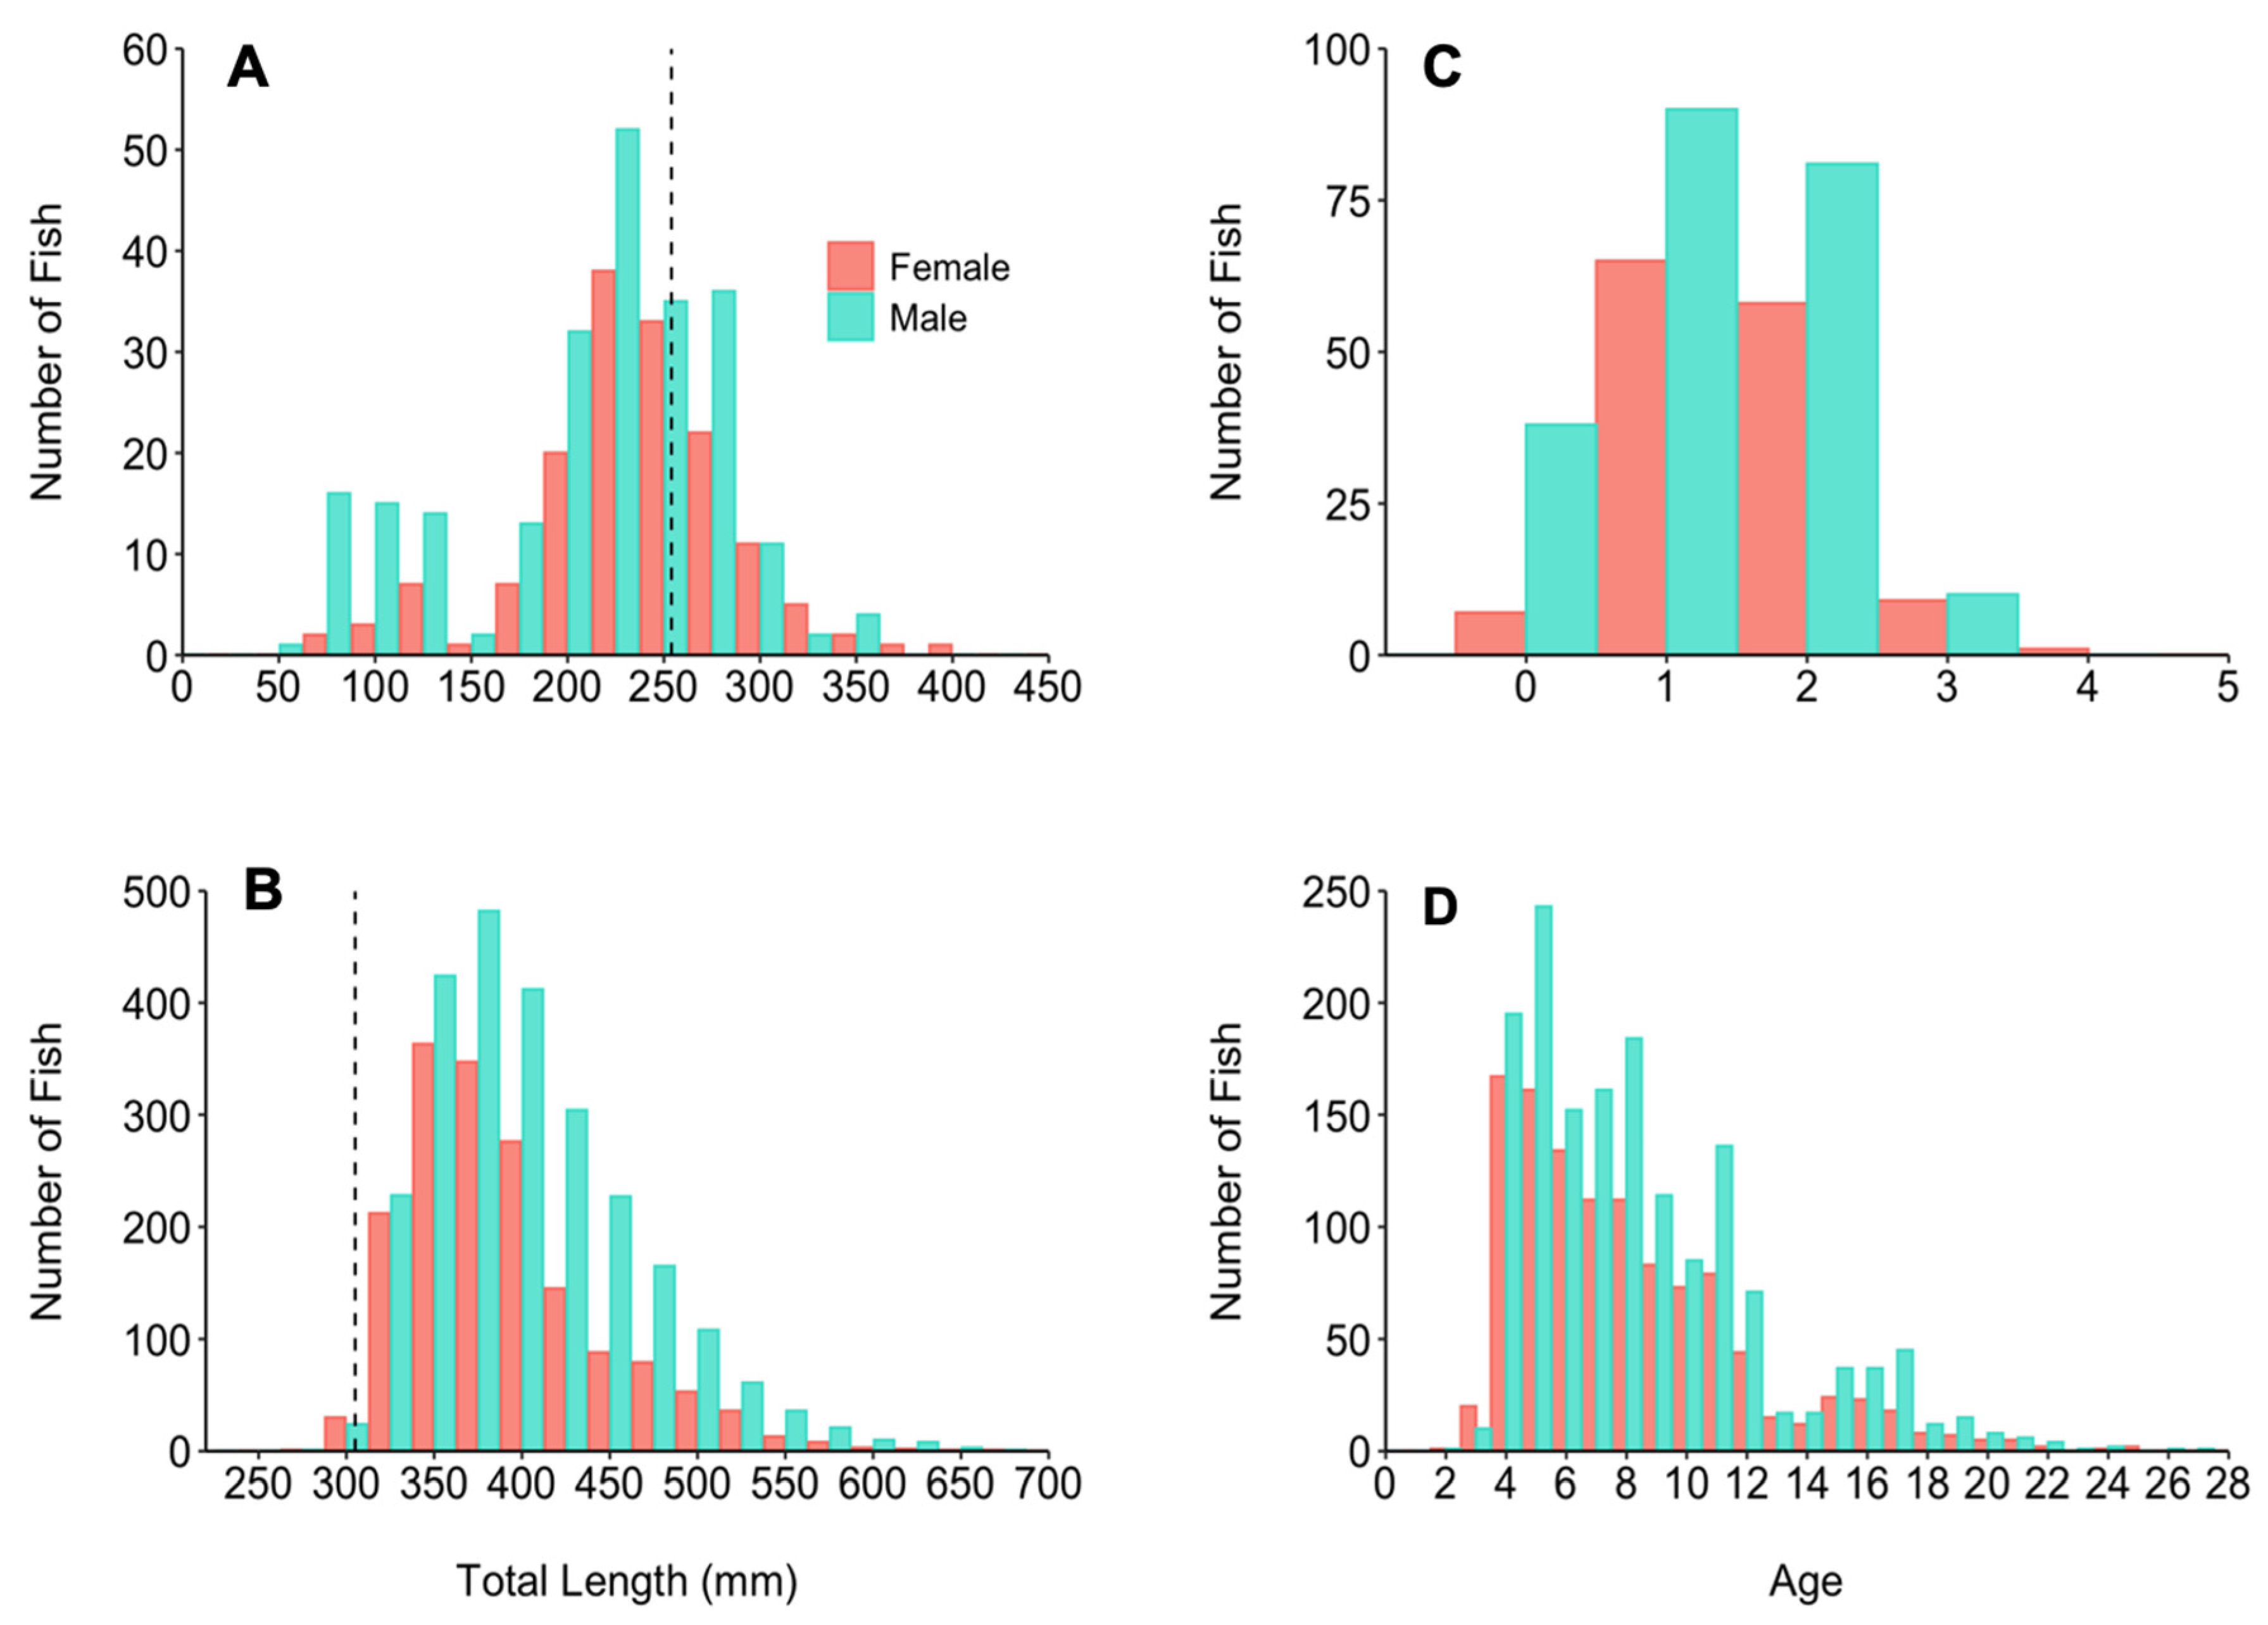
3.1. Sample Collection

A total of 4563 Gray Snapper were collected from March 2022 to December 2023; 1659 females and 2518 males were collected offshore, and 152 females and 234 males were caught inshore. The overall sex ratio of the offshore fish was skewed towards males (F:M ratio = 0.66:1; χ2 = 176.65; df = 1; p < 0.001), as was the sex ratio of the inshore fish (0.65:1; χ2 = 17.42; df = 1; p < 0.001). Inshore female Gray Snapper ranged in size from 80 mm TL to 402 mm TL, and males ranged in size from 55 mm TL to 350 mm TL (Figure 2A). Offshore female Gray Snapper ranged in size from 280 mm TL to 679 mm TL, and males ranged in size from 276 mm TL to 698 mm TL (Figure 2B).
Weight as a function of length between males and females showed no significant interaction (ANCOVA: F1,692 = 0.843; p = 0.359), and the main effect of sex was not significant (ANCOVA: F1,692 = 2.082; p = 0.150). Males and females were therefore pooled, and the overall allometric relationship of weight as a function of length (p < 0.0001; R2 = 0.994; n = 1060) was given by:
WT   = 0.00004153 TL 2.797
For fish that were sampled as carcasses, gonad-free body weight (GFWT) (used in GSI calculation in Section 3.2.1) as a function of total length (p < 0.0001; R2 = 0.993; n = 964) was estimated as:
GFWT   = 0.00004717 TL 2.775
A total of 1239 female and 1772 male Gray Snapper were aged that were caught during the spawning season from May to September (see Section 3.2). The APE of the primary reader (AW) was 0.66%, that of the secondary reader (DJM) was 0.22%, and that of the tertiary reader (EB) was 0.94%. Inshore females (n = 122) ranged from 0 to 4 years old, and males (n = 183) ranged from ages 0 to 3 (Figure 2C). Offshore females (n = 1117) ranged from ages 2 to 25, and males (n = 1589) ranged in ages from 2 to 27 (Figure 2D).

3.2. Spawning Seasonality

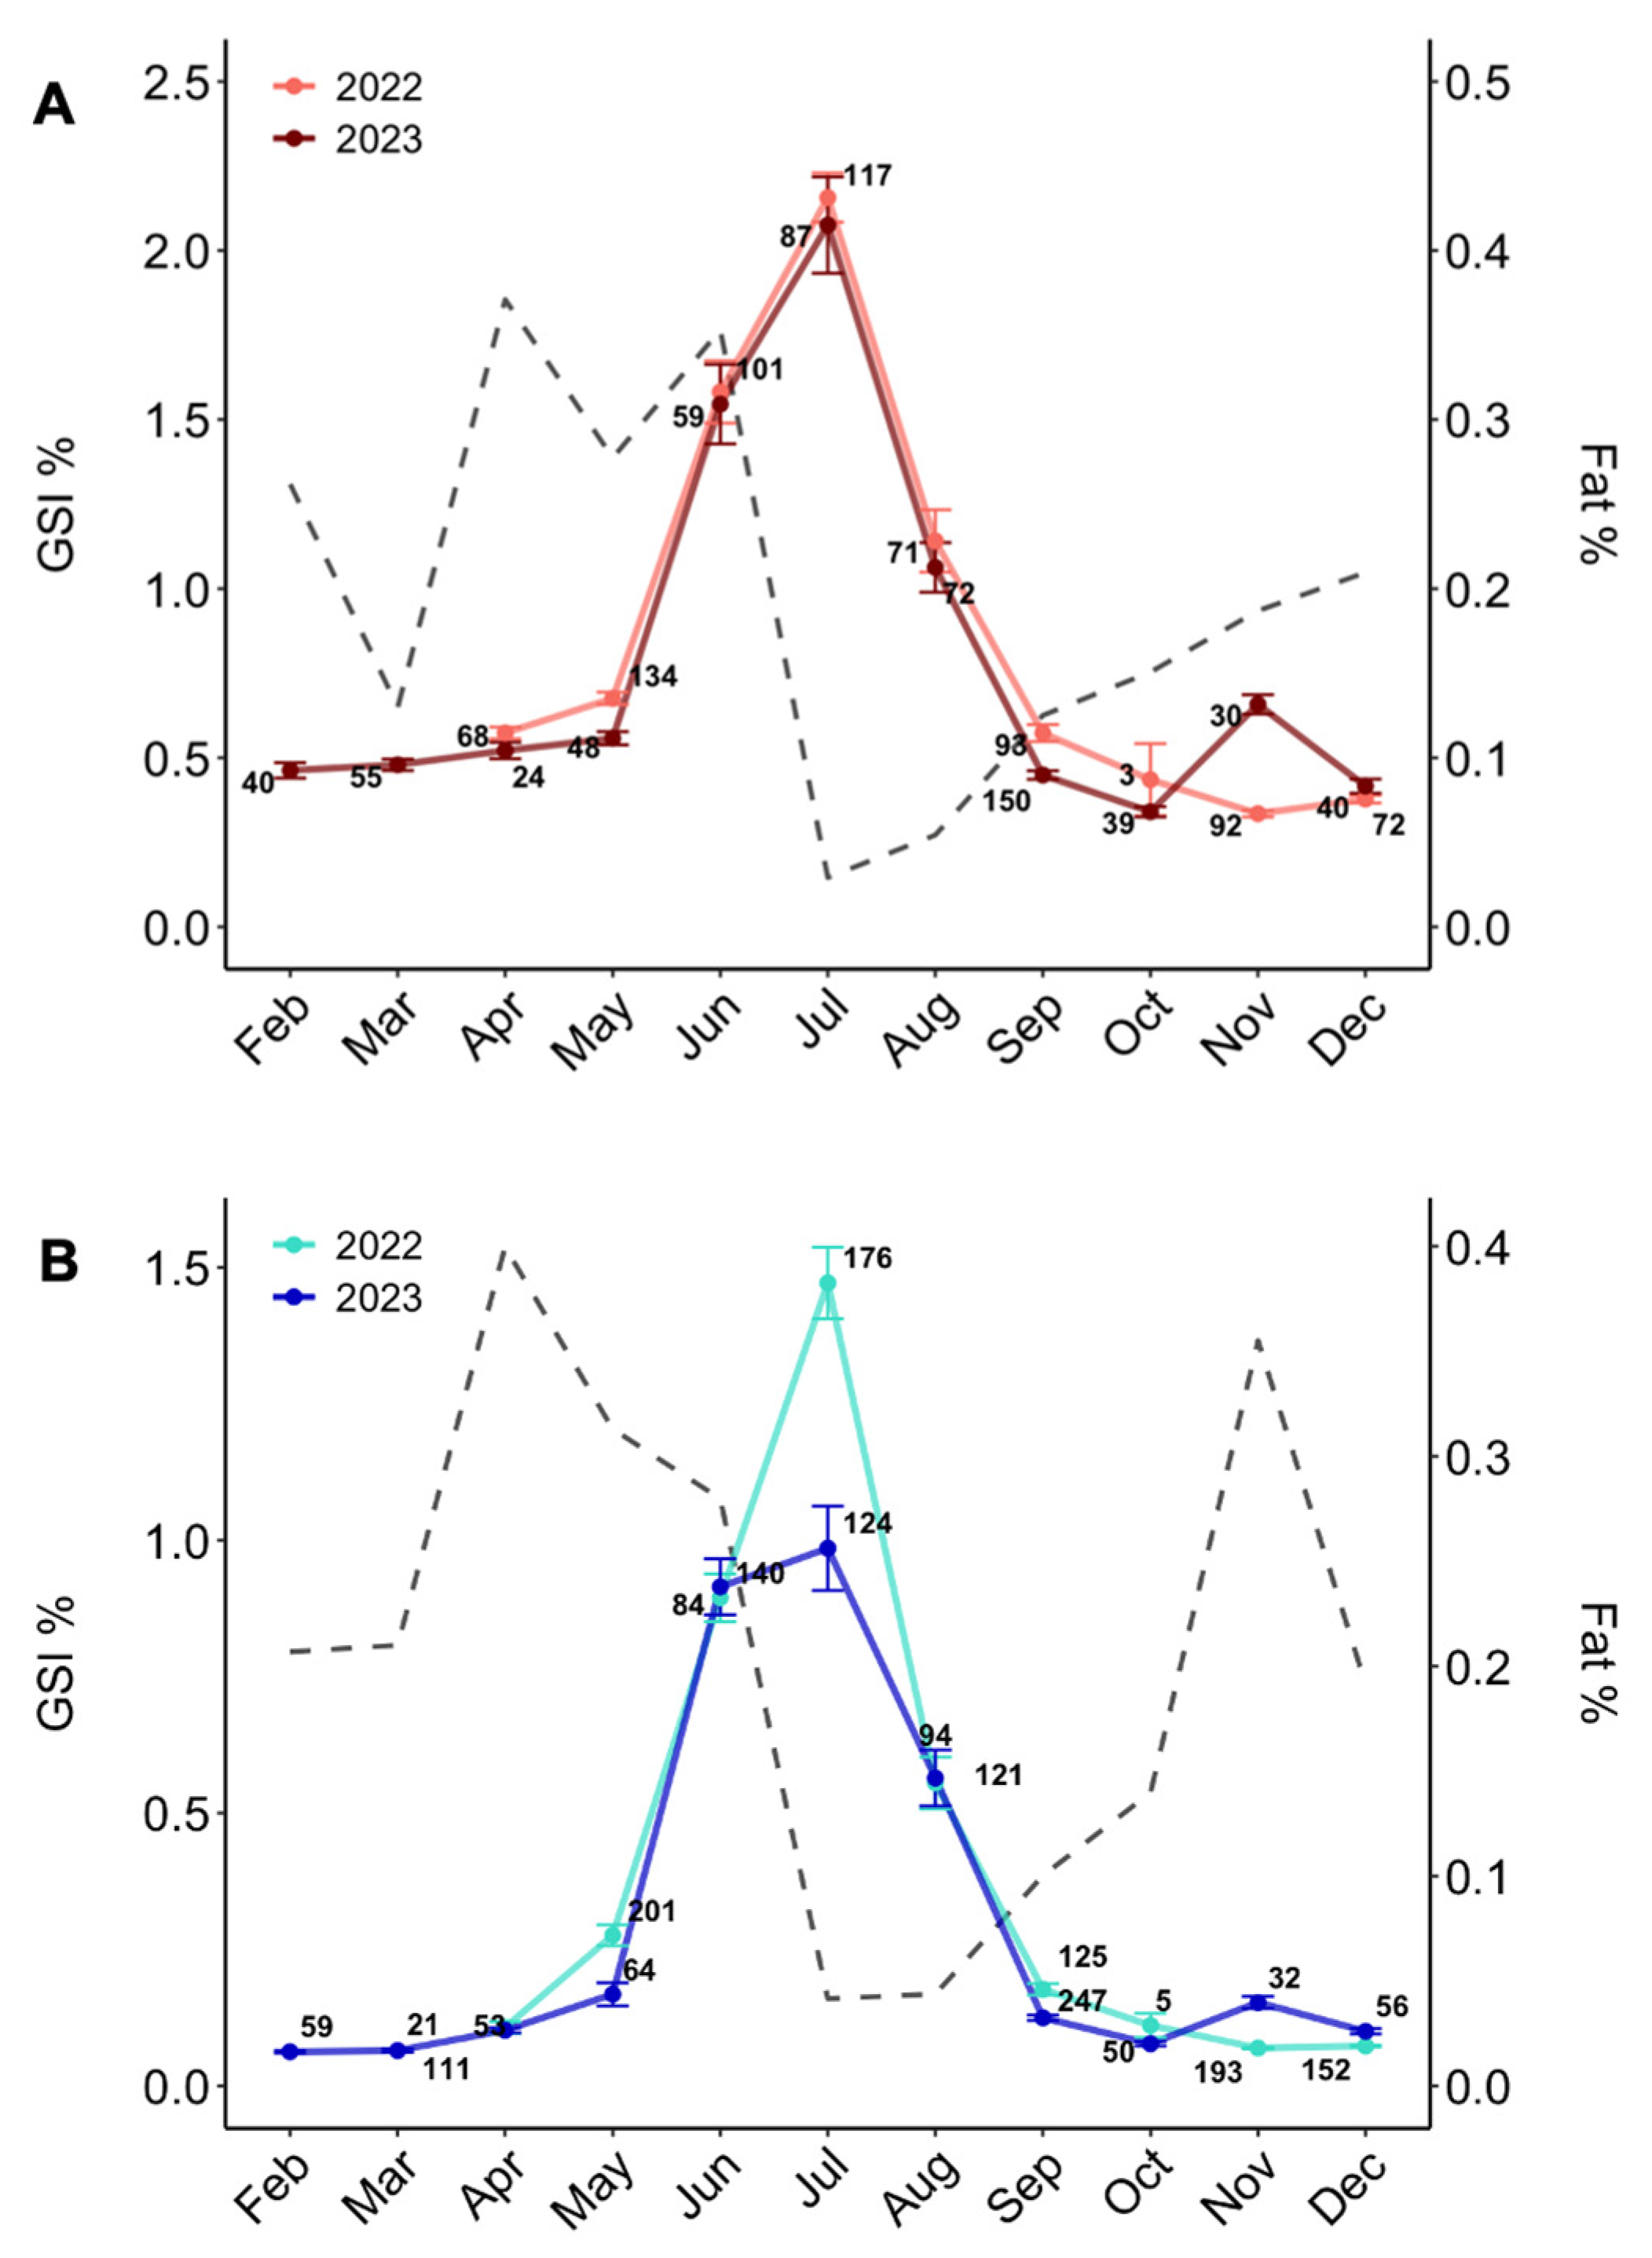
3.2.1. Gonadosomatic Index

For both 2022 and 2023, there was a significant difference in mean female GSI as a function of month (GLM; both p < 0.0001), and the GSIs in June, July, and August were significantly greater than in all the other months (Tukey; all p ≤ 0.0001). For females, the peak GSI occurred in July (Figure 3A); however, there was no significant difference between mean GSIs in June and July in 2023 (p = 0.173). The mean GSI in November of 2023 was almost double that of 2022 (0.65% and 0.33%, respectively); however, this may be due to the fish in 2023 being collected from a single trip and with a lower sample size. Overall, for both years combined, the mean GSIs for functionally mature female Gray Snapper indicated a spawning season duration from June to August with spawning activity peaking in July (Figure 3A). Beyond the spawning months of June to August, the mean GSIs were greatest in April, May, and September, an indication of pre-spawning development and cessation of the spawning season, respectively.
For males in both 2022 and 2023, the GSI was significantly different among months (GLM; both p < 0.0001), and the GSIs in June, July, and August were significantly greater than in all the other months (Tukey; all p < 0.0001) (Figure 3B). Peak spawning occurred in July; however, there was no significant difference between mean GSIs in June and July in 2023 (p = 1.00). GSIs of male Gray Snapper indicated a spawning duration concurrent with females, from June to August, with peak spawning occurring in July.

3.2.2. Condition in Relation to Spawning

The amount of fat around the gonads and viscera of Gray Snapper as a function of month was variable but showed a general increase in fat storage prior to the spawning season, followed by a decrease from June to August (Figure 3). The largest difference between % GSI and % fat occurred in July, which was during peak spawning.

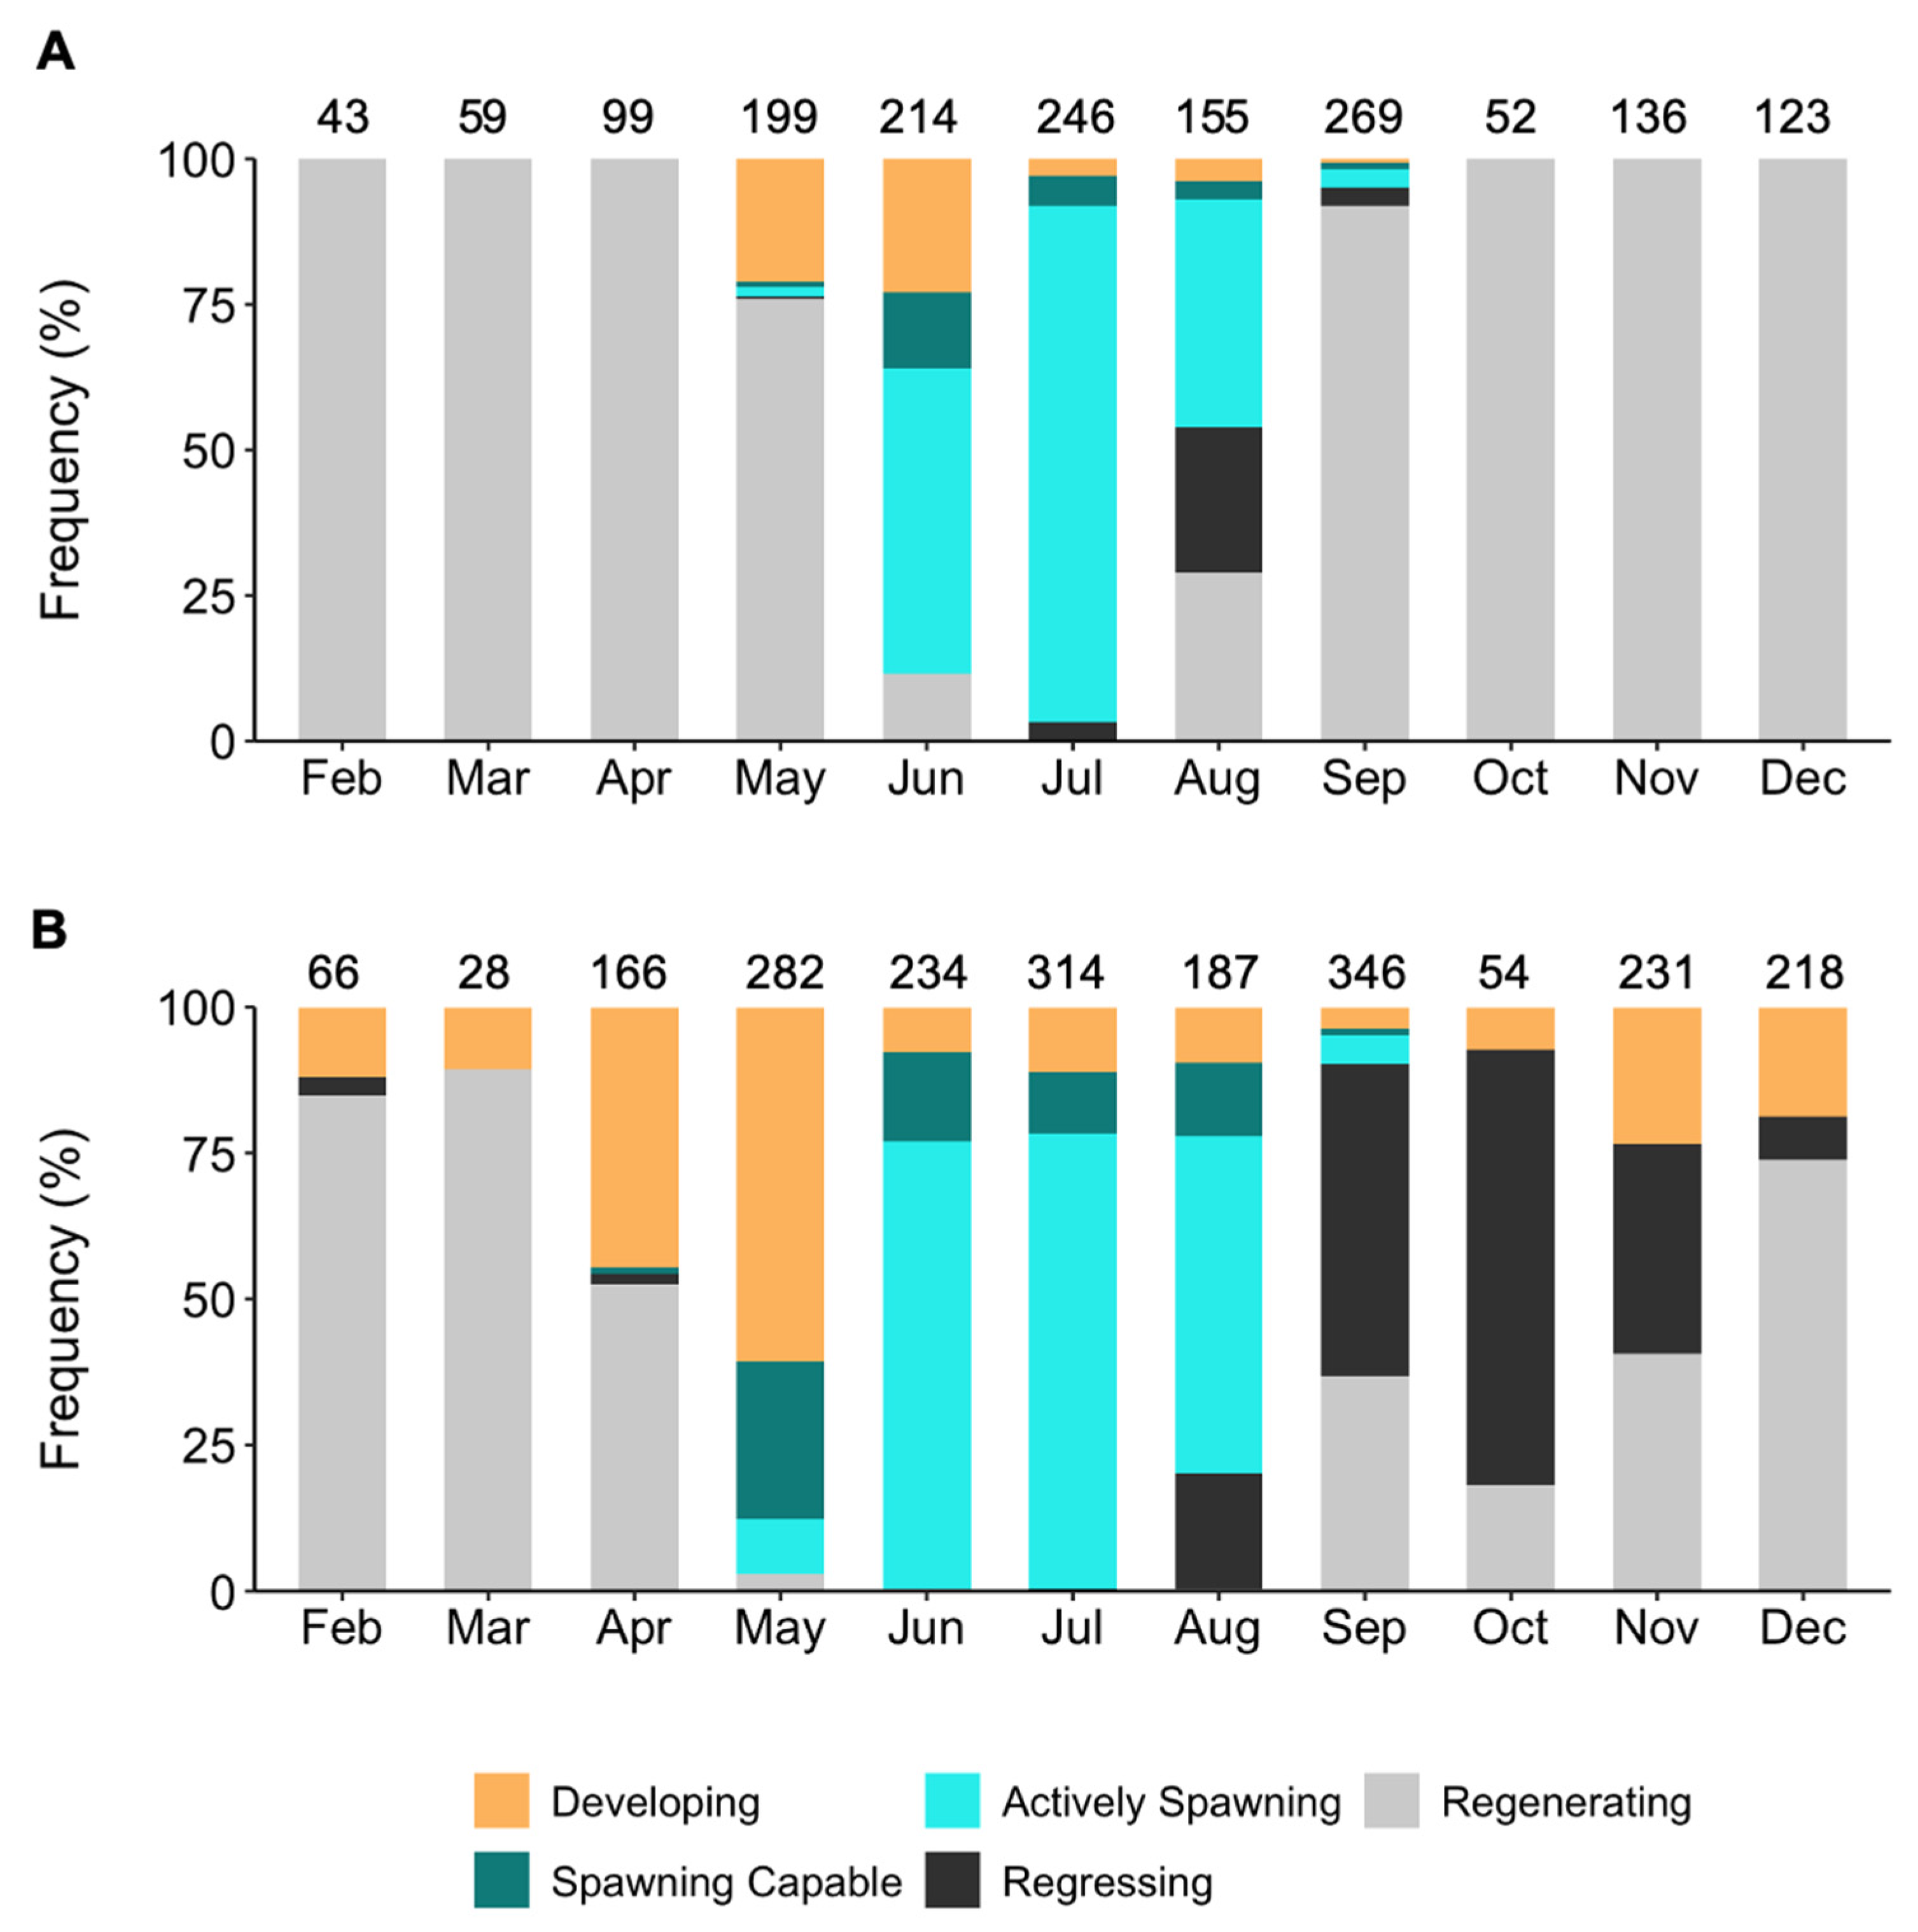
3.2.3. Reproductive Stages and Spawning Duration

From histological processing, 1745 females were assigned to reproductive phases (Figure 4). The monthly percent occurrence of females in each reproductive phase indicated that the majority of females in July (89%) were actively spawning, with less spawning activity in June (52%) and August (39%) (Figure 5A). Only 1.5% and 3.0% of females in May and September, respectively, were actively spawning.
In total, 2634 male Gray Snapper were macroscopically staged, and 80 were histologically staged (Figure 6). The majority of males were actively spawning in July (78%), followed by June (76%) and August (58%); less than 10% of males were actively spawning in May and September (Figure 5B).
In 2022, females were actively spawning from 13 May to 2 September for a total of 113 days. In 2023, no actively spawning females were caught in May or September, and the spawning duration was 82 days (2 June to 22 August). From the two sampling seasons combined, actively spawning females had an estimated spawning season duration of 97.5 days on average.
The smallest female with actively spawning markers had a 303 mm TL, and therefore, the spawning duration was assessed starting with the 300 mm TL bin; fish ranging from 425 to 499 mm in TL were grouped together, and fish with ≥500 mm TLs were pooled together due to the low sample size. Actively spawning females with ≥500 mm TLs had the longest spawning season duration (113 days), followed by both fish in the 350–374 mm TL and the 375–399 mm TL size groups (106 days). Overall, the spawning season duration was variable among size groups and ranged between 82 and 113 days (Table S3).
Only four age-3 fish were actively spawning in July and August, and therefore spawning duration was assessed starting from age 4 to age 8 but were grouped into 9–10, 11–12, 13–15, and ≥16 years due to the small sample size. There was no increase in spawning duration with increasing fish age. The duration was variable, and for most age groups ranged between 82 and 102 days (Table S4). The duration decreased to 69 days for the 13–15 age group, which could in part be due to the smaller sample size of these fish.

3.3. Spawning Fraction, Interval, and Frequency

3.3.1. All Females Pooled
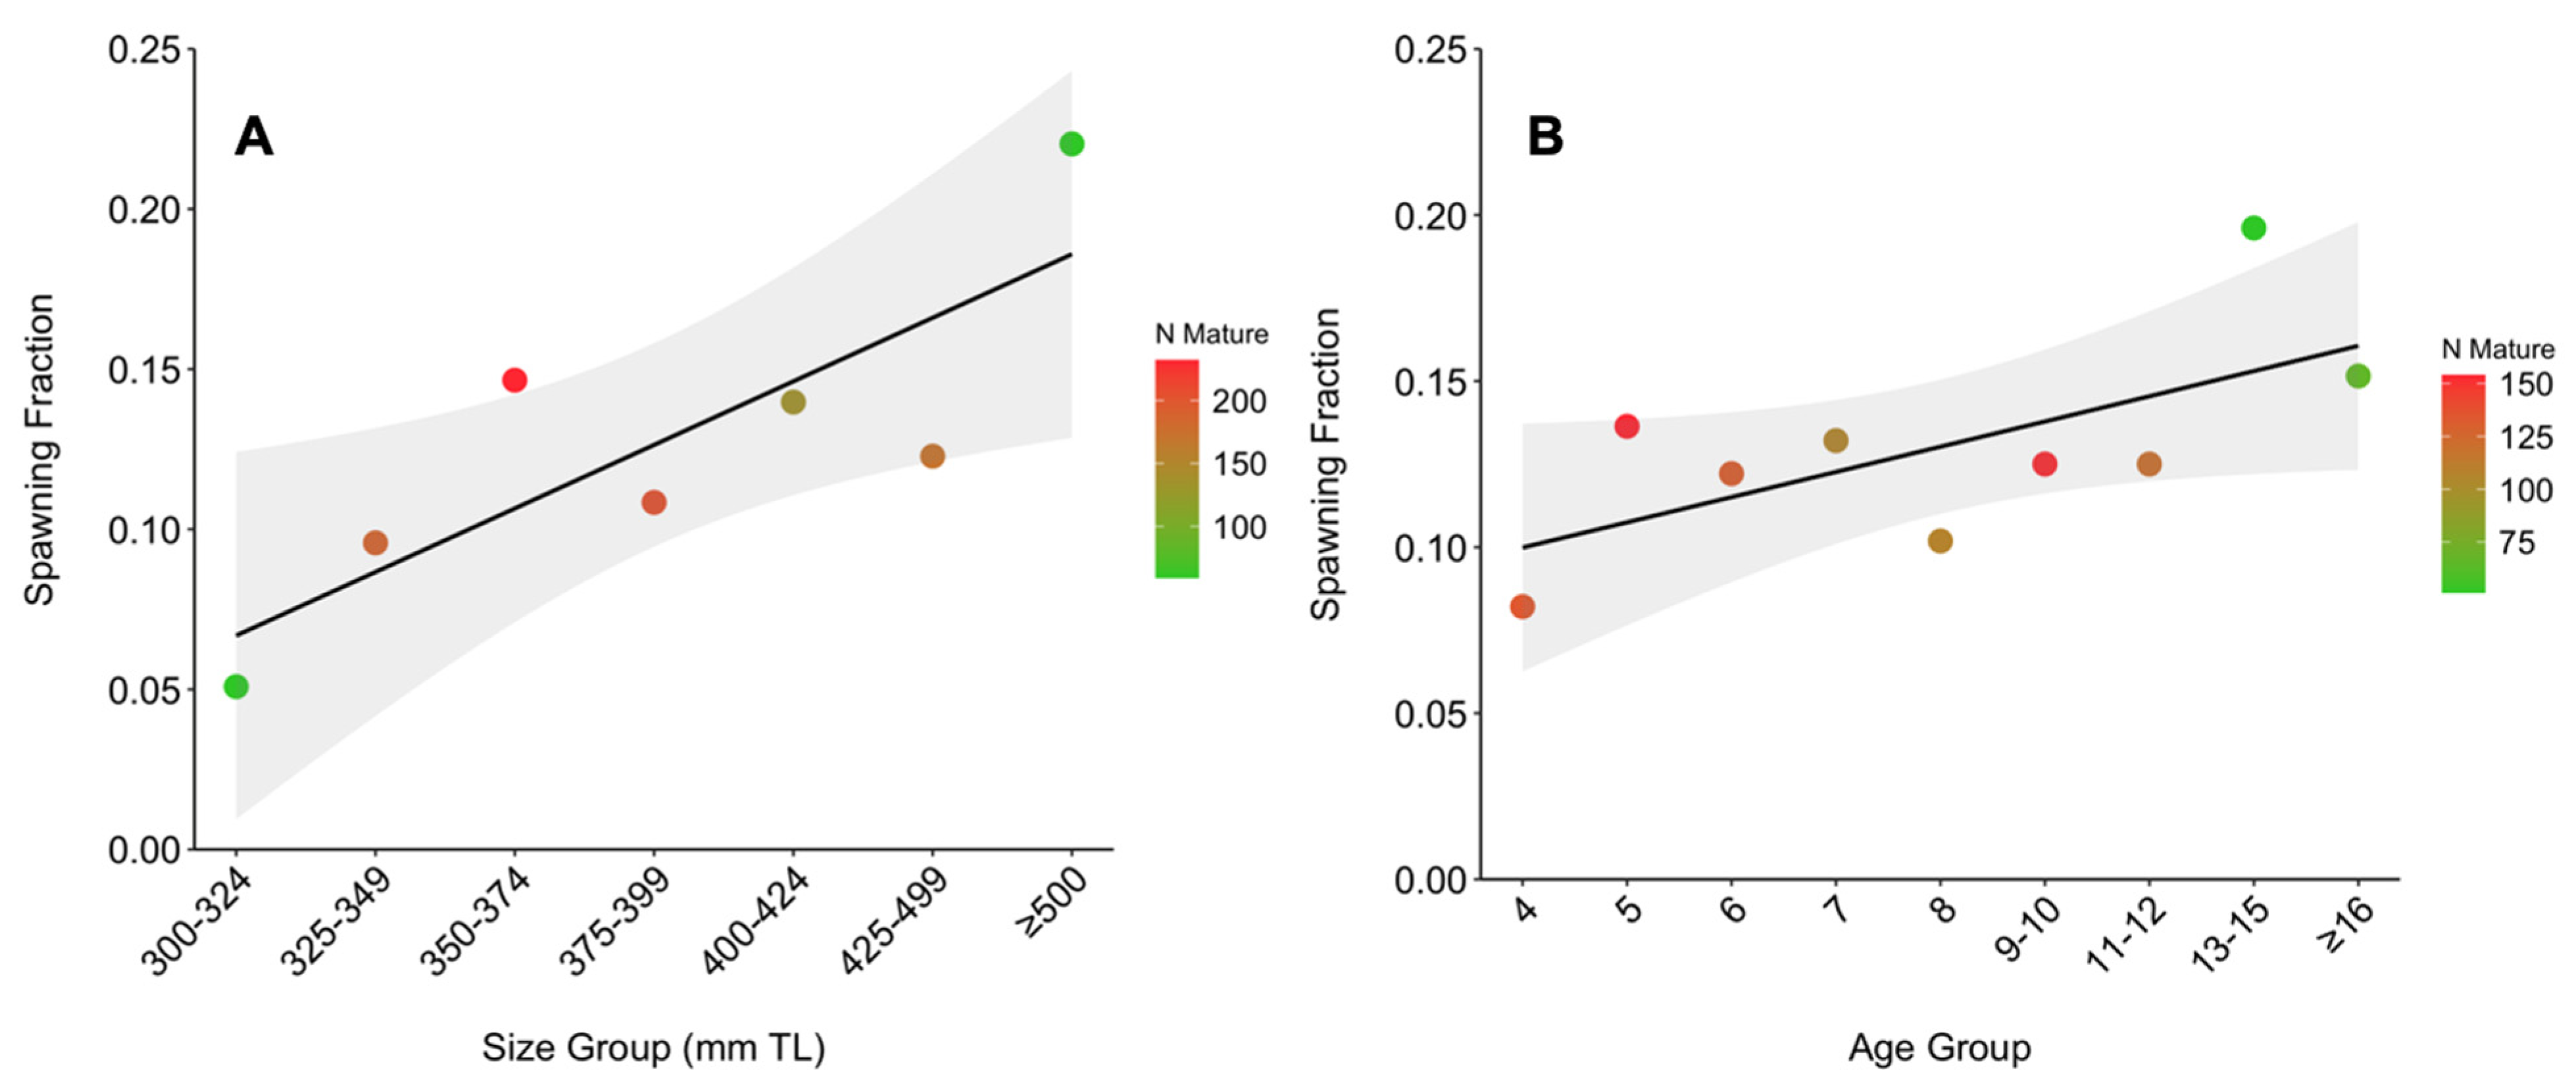
The pooled spawning fraction from all months in the reproductive season (May–September) for females with POFs was 0.124, resulting in a spawning interval (SI) of every 8.09 days (Table 1). Incorporating the SI into an overall 97.5 d spawning season resulted in a potential spawning frequency of 12.1 total spawning events (i.e., batches) per season. For individual months, the daily spawning fraction was highest in July (37%) followed by August (17%) and June (6%). The spawning intervals for these months were 2.7 days, 5.9 days, and 16.2 days, respectively. The spawning fraction was very low in both May and September (0.5% and 1.1%), with spawning intervals of 197 and 89 days. These estimated SIs were equal to or greater than the estimated spawning season duration and therefore indicated that virtually no spawning took place in May and September.

3.3.2. Size-Based

The spawning fraction increased as a function of increasing size of fish (t = 3.2; p = 0.02; R2 = 0.67) (Figure 7A), indicating that larger females spawn in higher proportions than smaller females during the pooled spawning season. Fish with a 300–324 mm TL range had a spawning fraction of 5% (SI = 19.7 days) whereas fish with ≥500 mm TLs had a spawning fraction of 22% (SI = 4.5 days) (Table 2). When incorporated into their size-specific spawning duration, the spawning frequency changed from 4.2 batches for the smallest size group to 24.9 batches for the largest size group.
The increase in spawning fraction with female body size was particularly emphasized in the peak spawning month of July (Figure S1). The proportion of females with ≥500 mm TLs spawning in July (64%) was more than triple that of the smallest size group in July (18%). The smallest size group (300–324 mm TL) was observed to only spawn in July, indicating that in addition to having a lower spawning fraction, their spawning was temporally restricted compared to that of larger females.

3.3.3. Age-Based

Overall, the spawning fraction increased as a function of female age (Figure 7B), which suggested that older females spawn in higher proportions than younger females during the spawning season. However, the relationship was more variable and marginally insignificant (t = 2.3; p = 0.06; R2 = 0.43). Females aged 4 had a spawning fraction of 8% (SI = 12.2 days), whereas females aged 13–15 had a spawning fraction of 20% (SI = 5.1 days), and females aged ≥16 years had a spawning fraction of 15% (SI = 6.6 days) (Table 3). When incorporated into their age-specific spawning duration, the spawning frequency changed from 7.0 batches for 4-year-olds to 13.5 batches for females aged 13–15. The increase in the daily probability of spawning with age was most apparent in July (Figure S2). In July, the spawning fraction was greatest for ages 7 (55%) and 13–15 (53%), which were almost double that of 4-year-olds (28%). Additionally, the only age group with POF spawning markers in May were females aged 13–15, suggesting that older females were in spawning condition earlier than younger females.

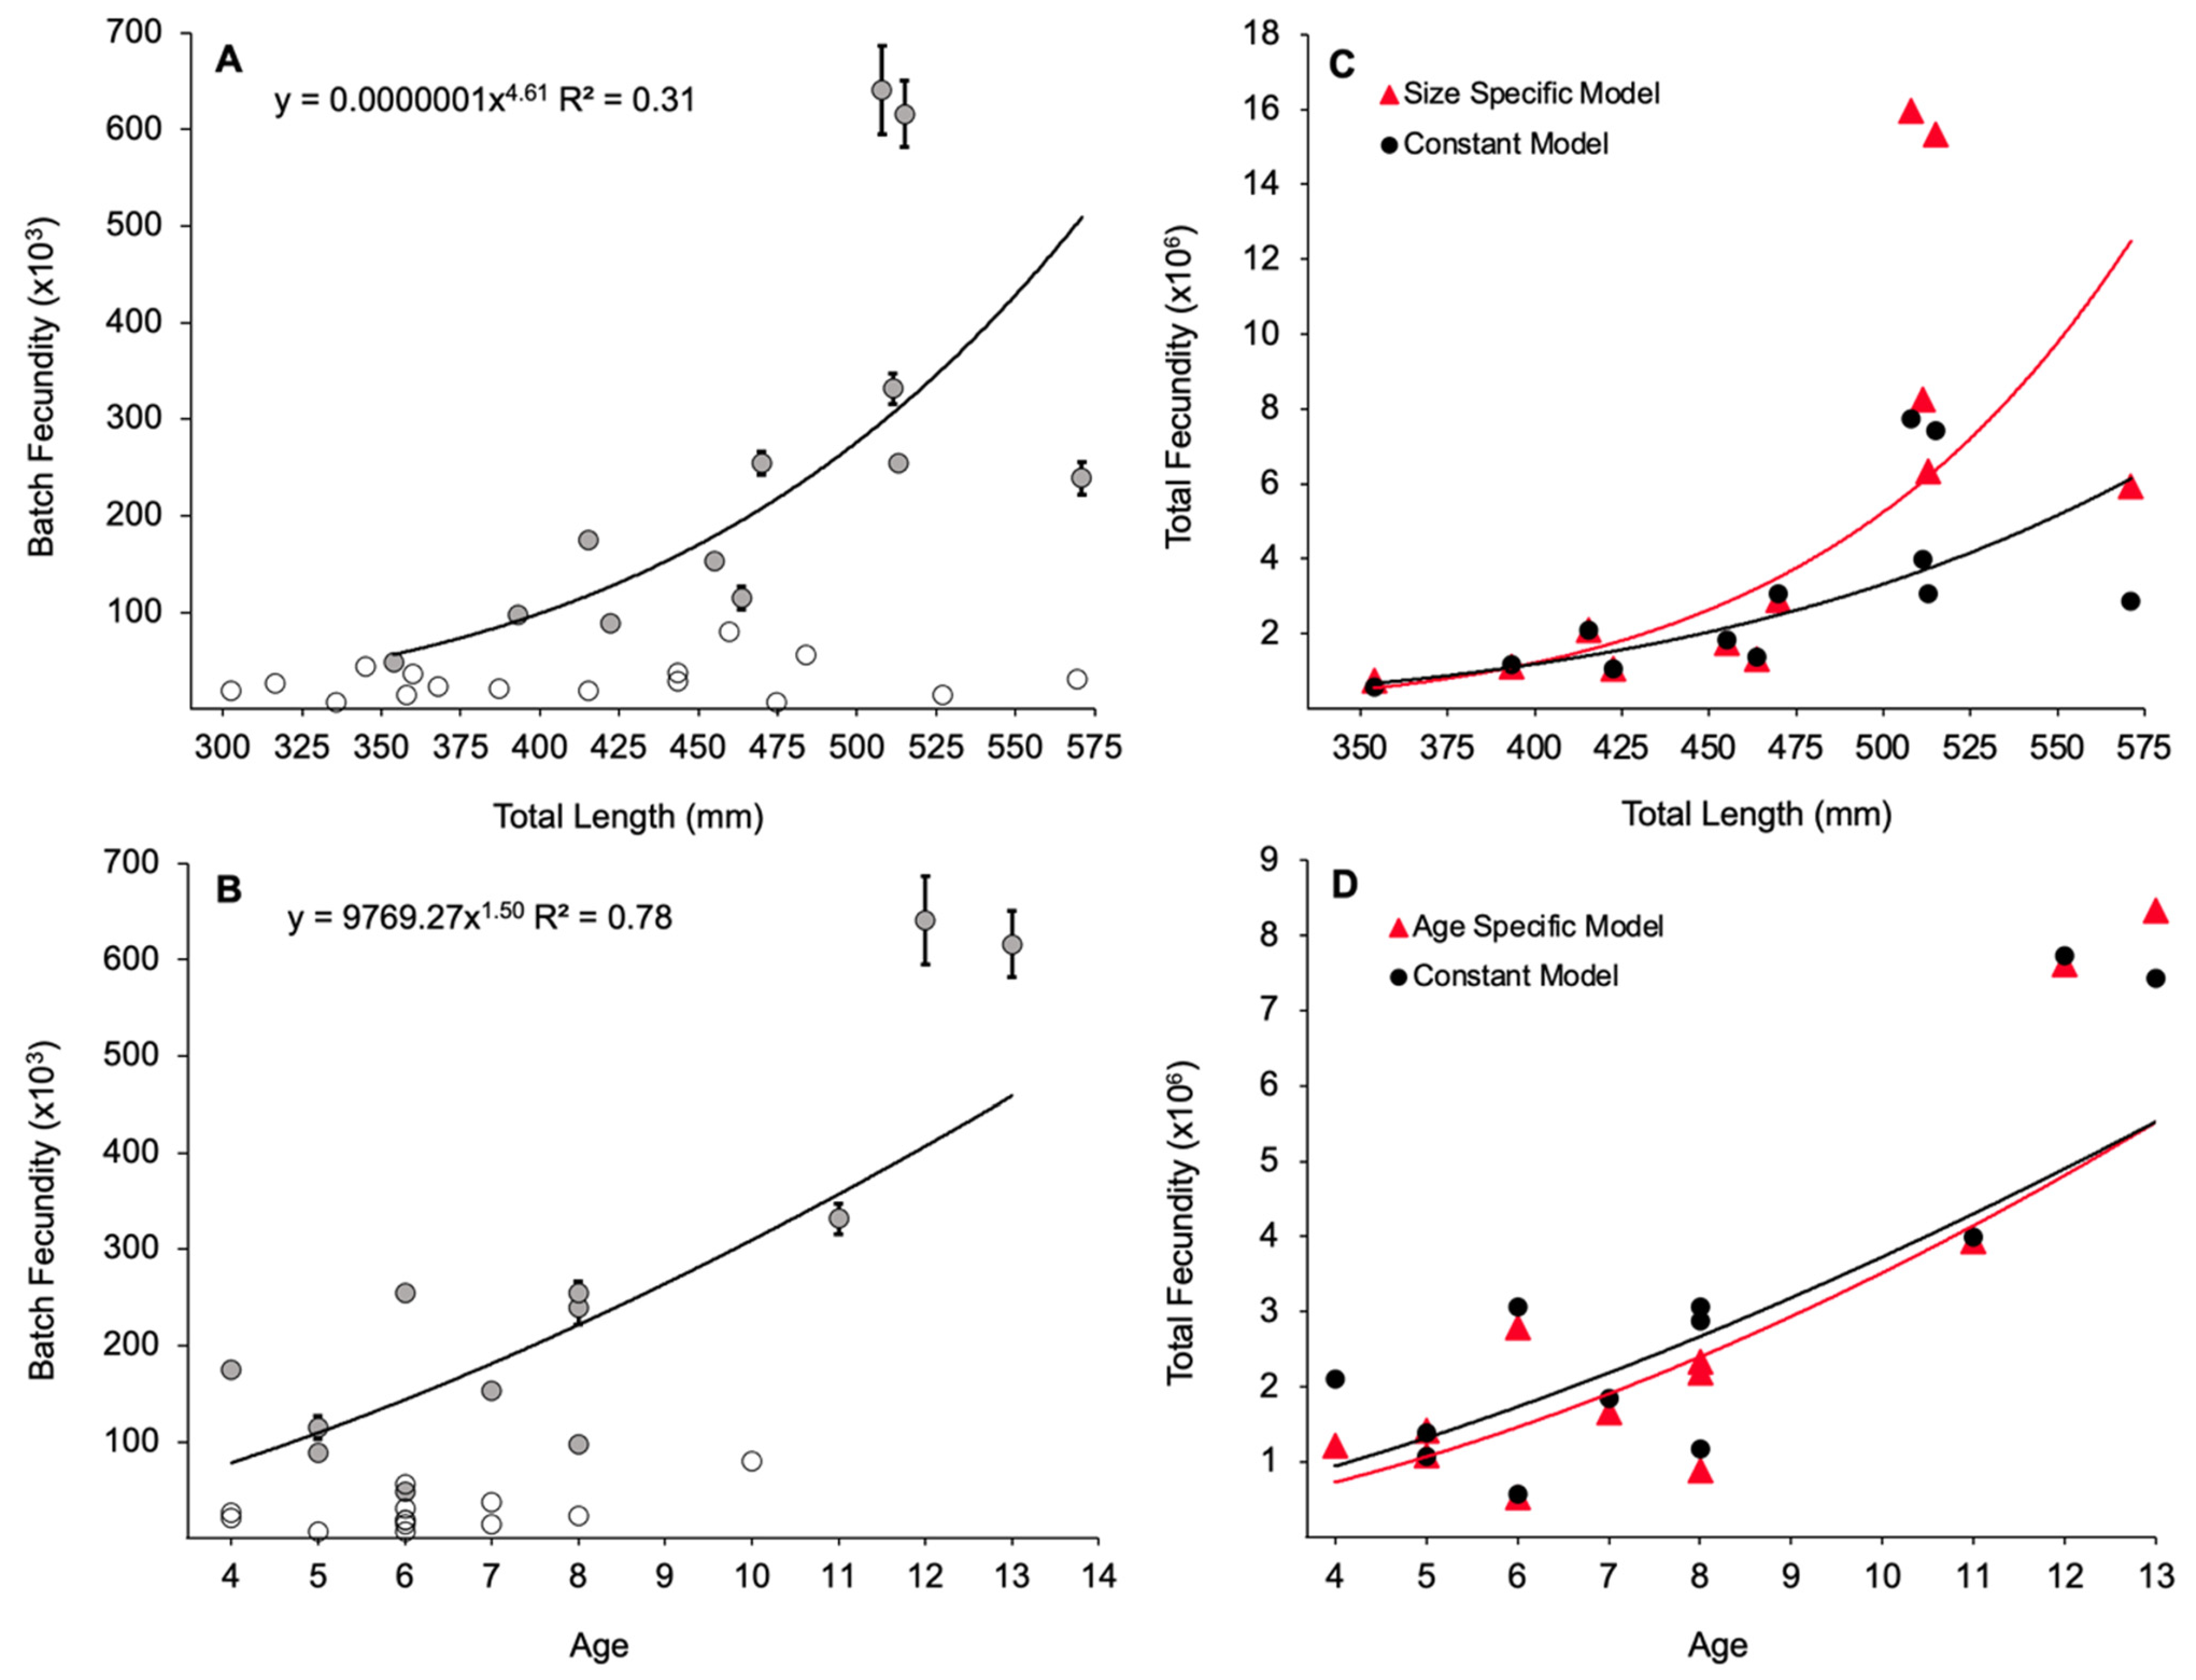
3.4. Batch Fecundity

Only six females (three in July and three in August) were found to have hydrated oocytes during the study, none of which had early POFs, and they could therefore be used for batch fecundity estimates. Six additional hydrated females without POFs were obtained from the NOAA Fisheries Panama City Laboratory and were captured in June, July, and August. Batch fecundity estimates ranged from 47,749 to 641,372 for the 12 hydrated fish that ranged in size from 354 to 571 mm TL and showed a significant positive allometric relationship (p = 0.002; R2 = 0.31) (Figure 8A). Additionally, the allometric scaling exponent b was greater for fecundity at length ( b = 4.61) compared to weight at length ( b = 2.80), which indicated that batch fecundity increased disproportionately relative to body size (i.e., hyperallometric). Batch fecundity as a function of age was significant (p = 0.01; R2 = 0.78) for fish aged 4 to 13 (Figure 8B). The allometric exponent was 1.50, which indicated hyperallometric scaling and suggested that BF increased disproportionately with female age. Fecundity based on hydrated females was greater than for fish of similar size and age where fecundity was estimated based on OM alone, indicating that females in oocyte maturation cannot be used as a proxy for hydrated females when estimating fecundity (Figure 8A,B).

3.5. Total Annual Fecundity

Total annual fecundity estimated using a constant spawning duration, fraction, interval, and frequency (i.e., not size- or age-specific) ranged from 575,473 eggs from the smallest fish with a 354 mm TL (age 6) to 7,729,772 eggs from a female with a 508 mm TL (age 12) (Figure 8C,D). Total annual fecundity estimates based on size-specific parameters were similar for smaller fish; however, they were much greater (~double) for females with >500 mm TLs (Figure 8C). Total annual fecundity estimates based on age using constant parameters were similar or only slightly greater than total annual fecundity estimates based on age-specific parameters (Figure 8D). The exception was for a 13-year-old female where the constant model estimated a lower fecundity than the age-specific model. Total annual fecundity as a function of total length or age was significant for the constant, size-specific, and age-specific models (all p < 0.05).

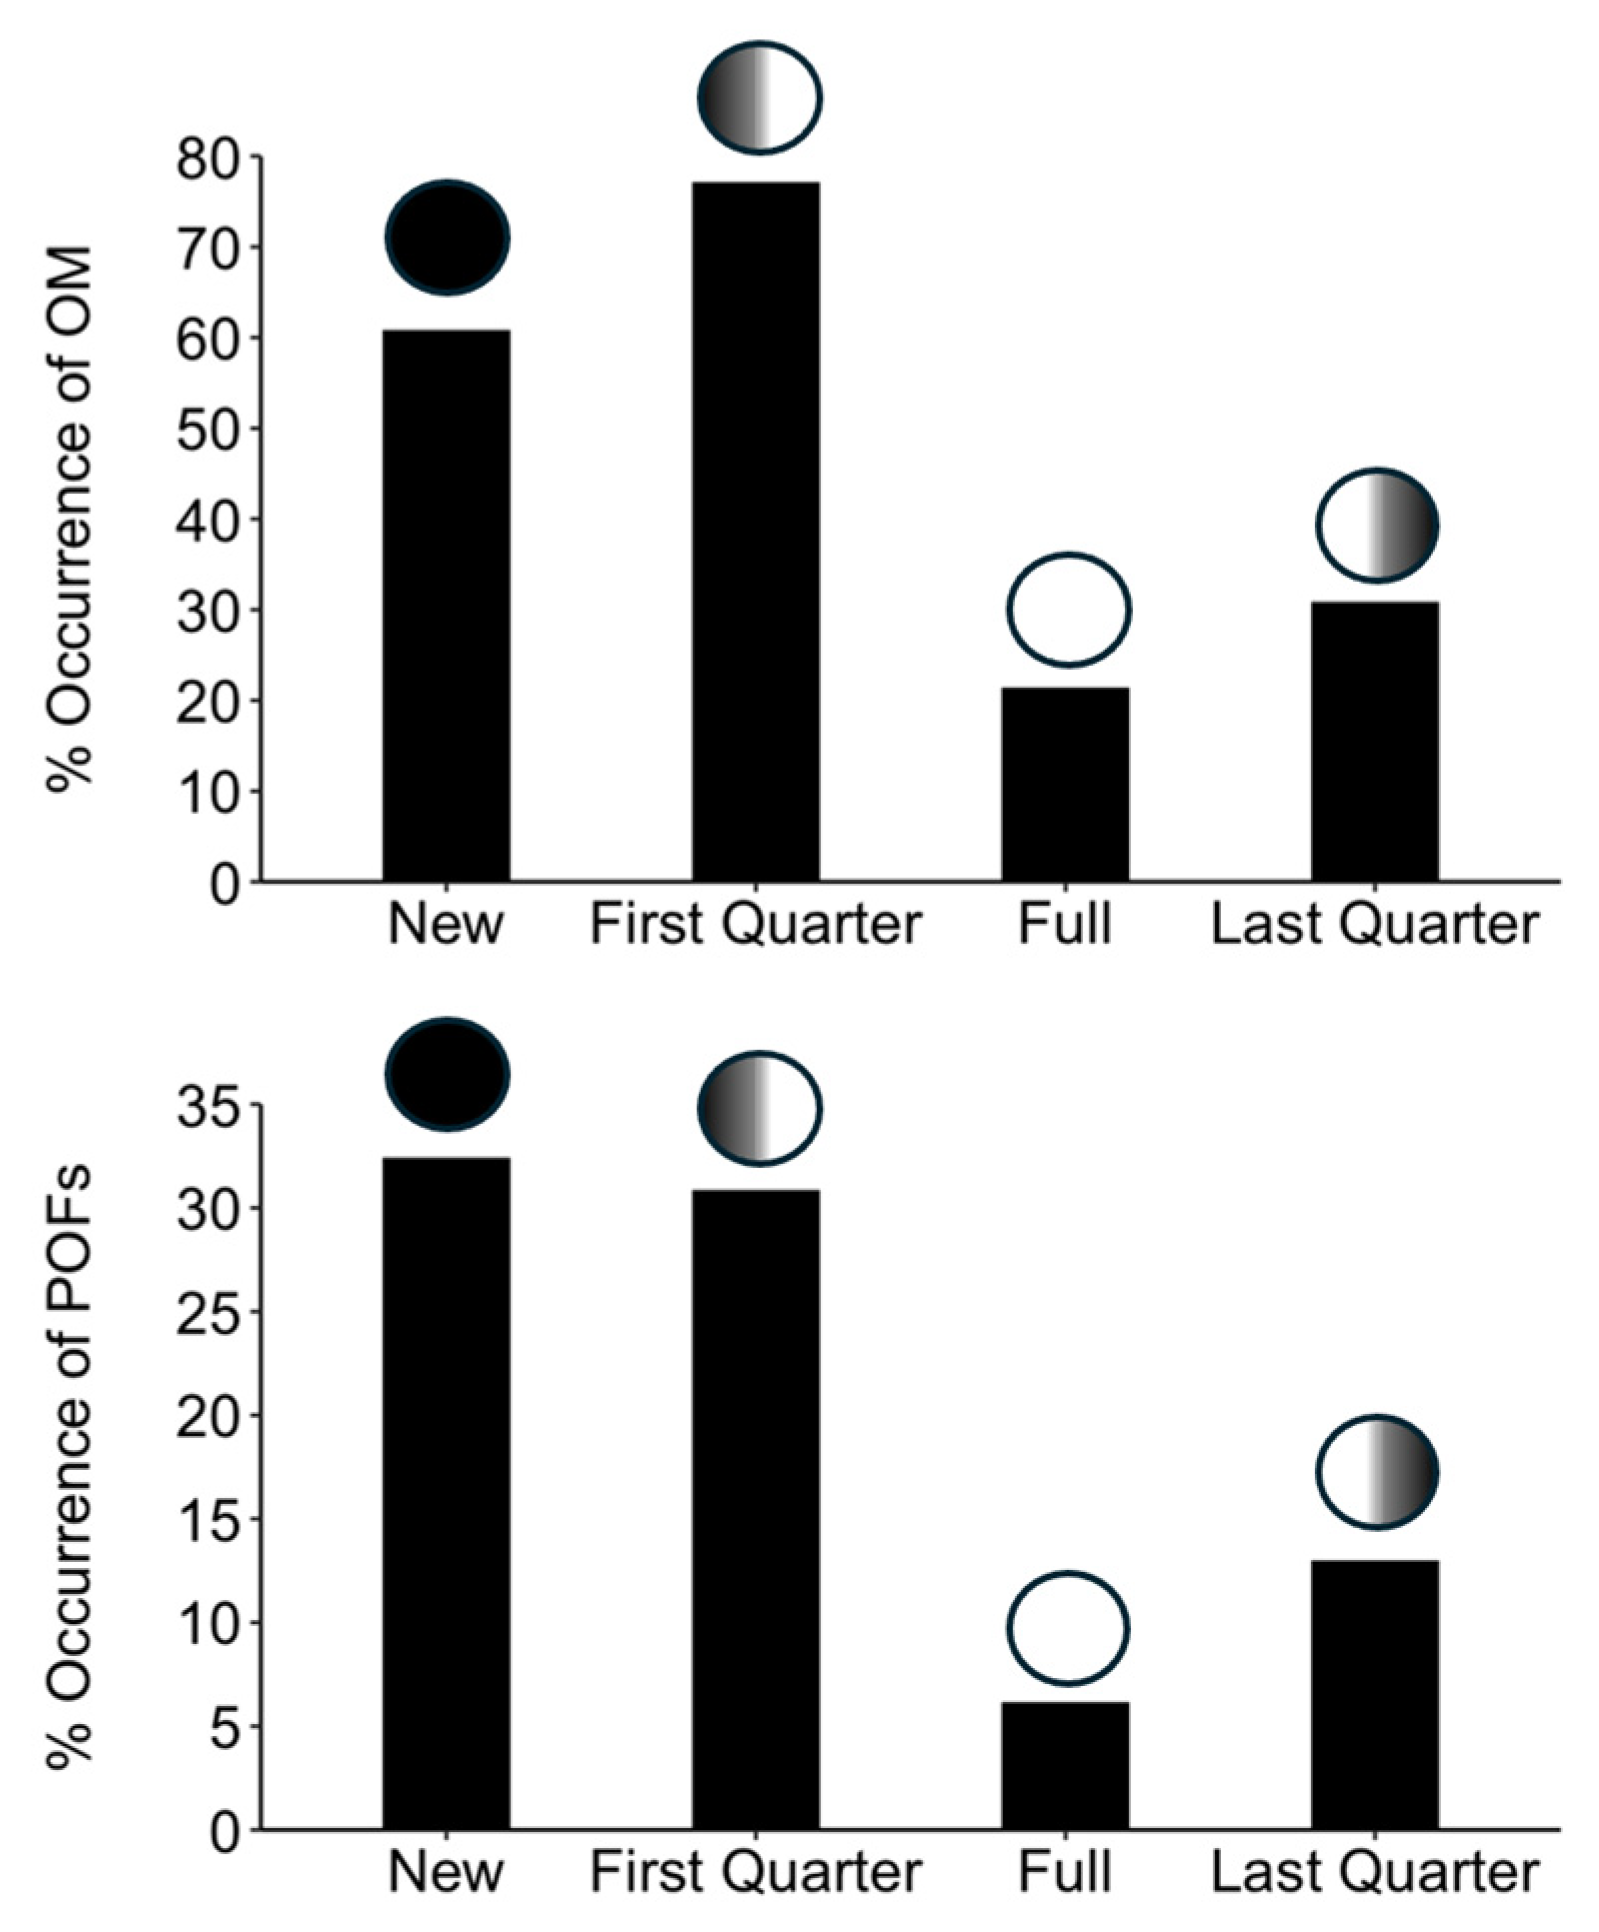
3.6. Lunar Periodicity

There was a significant difference among lunar phases in the occurrence of both OM (χ2 = 28.9; df = 3; p < 0.05) and POFs (χ2 = 19.5; df = 3; p < 0.05). The occurrence of OM was greatest in the first-quarter (77%) and new moons (61%) and lowest in the last-quarter (31%) and full moons (21%) (Figure 9). The occurrence of POFs was similarly highest for the new (32%) and first-quarter moons (31%) and lowest for the last-quarter (13%) and full moon (6%). This suggests that females are in the imminent stages of spawning (OM) or have just spawned (POFs) in greater proportions around the new and first-quarter moons compared to the last-quarter and full moons.

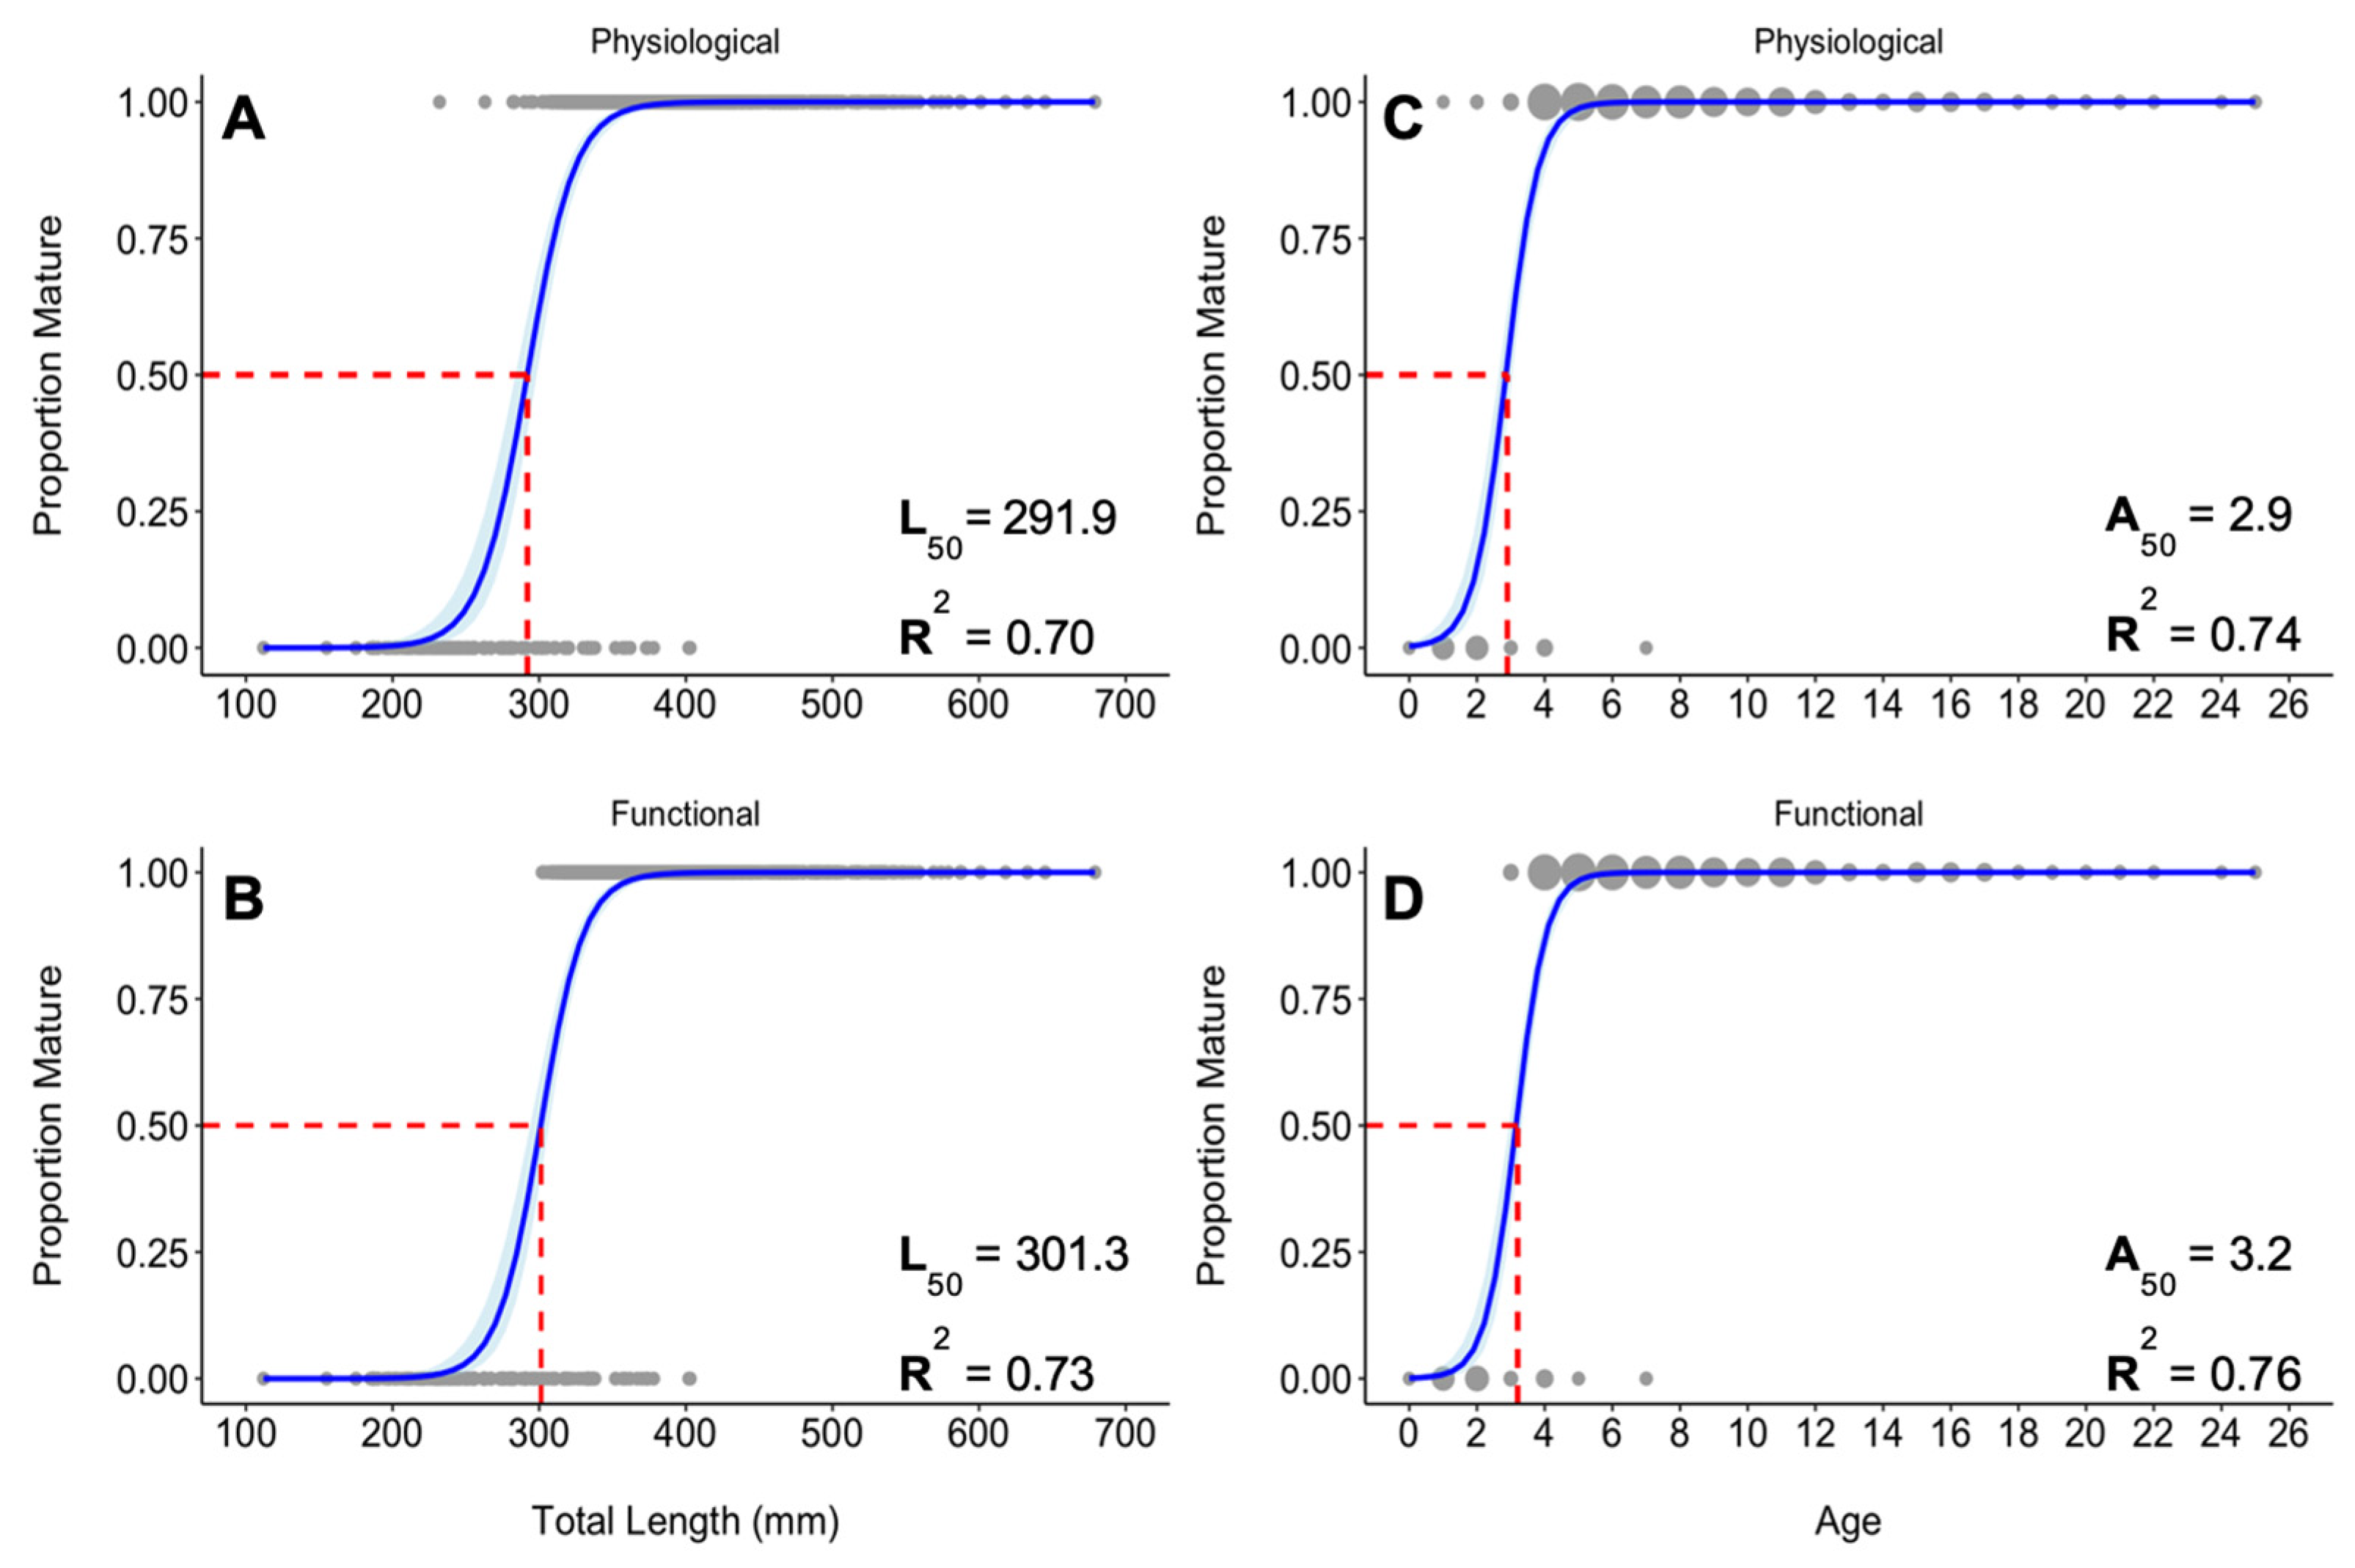
3.7. Sexual Maturity

During the spawning season, 117 females were immature and 1081 were mature based on the criteria for physiological maturity. The length at 50% physiological maturity (L50) for females was estimated at 292 mm TL (i.e., 11.5 inches) (95% CI = 285–298 mm TL) (Figure 10A). For functional maturity, 132 females were immature whereas 1048 were classified as mature. Female functional maturity was slightly greater than physiological maturity, and the length at 50% functional maturity (L50) for females was 301 mm TL (i.e., 11.9 inches) (95% CI = 296–306 mm TL) (Figure 10B). The age at 50% maturity (A50) for physiologically mature females was 2.9 years (95% CI = 2.7–3.1) (113 immature and 1066 mature females) (Figure 10C). Functional maturity was slightly older at an estimated 3.2 years (95% CI = 3.0–3.3) (128 immature and 1034 mature females) (Figure 10D).
For male Gray Snapper, during the spawning season, 1596 were mature, and 161 were immature. Based on length, the L50 for males was estimated as 258.9 mm TL (i.e., 10.2 inches) (95% CI = 250–267 mm) (Figure 11A). Based on age, the A50 was 1.8 years (95% CI = 1.5–2.1) (Figure 11B). Comparatively, male Gray Snapper reached sexual maturity at a smaller size and younger age than female Gray Snapper.

4. Discussion

Gray Snapper is an important recreational species in the eastern GOM, and this study provides the first comprehensive examination of their reproductive biology and age- and -size specific spawning metrics for females. This information, along with updated sexual maturity estimates, will lead to a more robust understanding of their reproductive output, which is invaluable information for its stock assessments and sustainable fisheries management.

4.1. Spawning Seasonality

Overall, the summer spawning season for Gray Snapper off the west coast of Florida appeared to have a shorter duration than those previously reported. The majority of Gray Snapper spawning was observed from June to August, with peak spawning in July, which was evident by the increase in GSI and the highest spawning fractions. Prior studies have quantified spawning from May to September [18,19,20,23,24]; however, less than 3% of females and 10% of males were spawning in the months of May and September in the present study. Males become spawning-capable earlier than females, which may contribute to the reports of a more extended spawning season. For example, Domeier et al. [24] observed males to be ready for spawning as early as March off Key West, although they did not observe females ready to spawn until mid-June. Gray Snapper spawning duration may also be related to warmer water temperatures, with spawning more drawn out in shallower or warm temperate/subtropical areas of South Florida compared to the offshore waters of the Florida Middle Grounds.
Gonadal fat was synchronously tied to the reproductive cycle for both males and females having an inverse relationship with the GSI. Having the highest amount of lipid stores around the gonads or viscera, or as fat deposits in the liver, immediately prior to spawning with a concomitant decrease during/after spawning has been observed in various other fishes, including Yellowtail Rockfish (Sebastes flavidus) [53], Southern Flounder (Paralichthys lethostigma) [54], and White-ear Damselfish (Parma microlepis) [35]. Energy reserves are therefore thought to be mobilized for vitellogenesis and spermatogenesis during the production of oocytes and spermatocysts [24].

4.2. Spawning Fraction, Interval, and Frequency

Several other species have shown a positive relationship between spawning fraction and frequency with female body size and/or age, for example, Tautog (Tautoga onitis) [55], Spotted Seatrout (Cynoscion nebulosus) [56], Ballyhoo (Hemiramphus brasiliensis) [57], and Red Snapper [58]. The BOFFFs hypothesis was supported for older and larger female Gray Snapper as evidenced by the increase in daily spawning probabilities with increasing length and age. The spawning fraction increased with fish length from 5% for fish with 300–324 mm TLs to 22% for fish with a size greater than 500 mm TL and increased with age from 8% to 20% for 4-year-olds and females aged 13–15, respectively. Kim [20] noted a similar trend for Gray Snapper sampled in the northern GOM off Alabama and Mississippi where the spawning fraction increased from 14% (300–399 mm TL) to 30% (600–699 mm TL) and from 17% (age 3–5) to 31% (age 16–25). Fitzhugh et al. [18] estimated the spawning fraction at 37% for females with around 330–370 mm TLs and ~60% for fish with ≥500 mm TLs, which was more than double the estimates provided in our study and by Kim [20].
Importantly, the method of calculating spawning fraction differs in our study (due to the lack of hydrated females). We used the POF method solely instead of combining hydration and POFs [58]; both Fitzhugh et al. [18] and Kim [20] used a combination of those spawning biomarkers despite a low sample size of hydrated females. Spawning fraction plays a critical role in calculating total fecundity because its inverse is used to determine the number of days between spawning events, which is then used to determine the number of batches spawned over the entire spawning season. As such, it acts as a multiplier in the calculation of total fecundity and is extremely sensitive to any source of sampling bias. A limitation of this study was the lack of hydrated females, and therefore, spawning fraction calculated from the POF method could not be compared to the hydrated oocyte method [9]. However, a benefit of using the POF method is that it minimizes the aggregation effect from hydrated fish because POFs are visible for longer (24 h; [45]), which allows fish to disperse and can result in a more accurate proportion of daily spawning activity [59].

4.3. Batch Fecundity

Batch fecundity estimates as a function of fish length supported that larger females release disproportionately more eggs than smaller females, as evidenced by the increased hyperallometric scaling in relation to body weight [49]. Batch fecundity as a function of age also suggested a hyperallometric relationship. These relationships could be potentially improved with further sampling of females that were in hydration, which were limited in this study as well as for Fitzhugh et al. [18]. Fitzhugh et al. [18] calculated greater batch fecundity estimates for an additional six females; however, those samples were from the 1990s. The difficulty, in part, of obtaining females in hydration may be explained by the rapid maturation process of oocytes before ovulation in warm-water, indeterminate species [44]. In Red Snapper, for example, Jackson et al. [45] found that it took 5 h for oocytes to progress from early hydration to being fully hydrated and ovulation occurred within 5 h after attaining hydration, thus leading to a 10 h timeframe during which hydrated oocytes would be visible in the ovaries. It is therefore possible that females in hydration are temporally limited or that the hydration process may be quicker for Gray Snapper; however, the timing of this process is currently unknown for Gray Snapper. The large number of females observed to be in germinal vesicle migration, but relatively few in germinal vesicle breakdown, yolk coalescence, or hydration in this study may further suggest that final oocyte maturation leading to hydration is a rapid process or that GVM may arrest in the ovaries for longer than anticipated.
While fecundity counts were attempted from females in stages prior to hydration, these batch fecundity estimates were much lower for similar-sized fish based on hydrated oocytes, which indicated that oocytes in GVM cannot be used as a proxy for hydrated oocytes. Additionally, distinguishing between oocytes in GVM and Vtg3 oocytes was difficult in Gray Snapper and could result in greater staging uncertainty, which has also been noted by NOAA personnel with expertise in fecundity estimations (pers. comm, H. Moncrief-Cox).

4.4. Total Annual Fecundity

Total annual fecundity estimates from the size invariant model were lower for larger fish as this model did not account for the disproportionate increase from BOFFFs, therefore underestimating total fecundity for larger females. It is therefore important to account for the increase in spawning frequency with size, which will change the estimates of total annual fecundity or the reproductive output of a stock. In fact, Fitzhugh et al. [18] found that when an age- or size-specific model falsely assumes invariant parameters, then the models tend to overestimate biological reference points (i.e., SPR or MSY) that are used by managers to set harvest rates. Previous assessments for Gray Snapper that have assumed size and age invariance in such parameters (i.e., duration, interval, and frequency) that directly affect total annual fecundity may therefore have consequences for appropriate management. Despite no apparent increase in spawning duration with size for Gray Snapper, the increases in spawning fraction and frequency do support that these metrics are integral in predicting total reproductive output.
The age-invariant model for Gray Snapper in the present study showed similar or slightly higher total fecundity estimates for most ages compared to age-specific estimates. Compared to size, there was a weaker trend of increasing spawning fraction and therefore a decreasing spawning interval with female age. Given that there were no hydrated females beyond age 13, more samples are necessary to define total fecundity and the relationship with increasing age in Gray Snapper.

4.5. Lunar Periodicity

Many fishes spawn in accordance to lunar cycles for a variety of reasons. Lunar phases may act as an initiation for large spawning aggregations to form. For example, Mutton Snapper congregate at Riley’s Hump off the Dry Tortugas, one of the most notable lutjanid spawning habitats in South Florida. The aggregation forms on the full moon, and ovulation occurs 1–5 days thereafter [28]. Information on the timing and movement of Gray Snapper into spawning aggregations is unknown, and more research is needed to determine their fine-scale movements during the spawning season and whether aggregation abundance increases with any particular lunar period. Fish have also been hypothesized to spawn during the darkness of the new moon to reduce predation on eggs and larvae [50], or on the brightness of the full moon to reduce predation on the spawning adults by large, crepuscular/night-time predators (i.e., sharks) [60]. Female Gray Snapper in this study showed increases in OM and POFs around the new and first-quarter moons. This was similar to the findings of Domeier et al. [24] for Gray Snapper off Key West where they determined that Gray Snapper spawn on the new moon based on the GSI pattern and back-calculated spawning dates for juvenile Gray Snapper. Denit and Sponaugle [32] also estimated that spawning on the southeastern coast of Florida occurred during the new and first-quarter moons based on back-calculated spawning dates from young-of-the-year Gray Snapper. Starck and Schroeder [23], however, suggested that Gray Snapper in the Florida Keys spawn on the full moon, based on their observation of spent females shortly after the full moon in September. However, Domeier et al. [24] suggested that this may have actually represented spent females at the end of the spawning season. In the present study, OM and POFs had the lowest occurrence during the full moon phase, indicating that Gray Snapper off the west coast of Florida do not appear to spawn in greater proportions on the full moon.

4.6. Sexual Maturity

Physiological maturity is defined by the presence of CA oocytes, based on the start of the gonadotropin development stage [17,61]. However, the presence of CA oocytes alone is not indicative of spawning capability because fish displaying CA as the most advanced oocyte during the spawning season have been known to undergo atresia and may recruit CA oocytes years in advance or develop CA oocytes and then skip spawn [44,62,63]. In contrast, females under the functional maturity criteria are defined by the presence of vitellogenic oocytes (Vtg1) and would be presumed to spawn in the upcoming/current spawning season, especially for warm-water species [17]. In some species, there can be a relatively large differences in the maturity estimates based on physiological versus functional maturity. For example, for Hawaiian Snapper (Etelis coruscans), the estimate of functional maturity was 9 cm larger than that estimated based on physiological maturity, which represented 9% of the maximum size of the fish [64].
For Gray Snapper, the size at 50% sexual maturity for females was estimated to be slightly greater for functional maturity (301 mm TL, 11.9 inches) compared to for physiological maturity (292 mm TL, 11.5 inches). Additionally, both physiological and functional maturity estimates were greater in this study compared to those in prior studies in the U.S. GOM. Physiological maturity has been estimated at 253 mm FL (272 mm TL) [18] and 273 mm TL [20]; Garner et al. [19] estimated functional maturity to be 270 mm FL (290 mm TL, 11.4 inches). Macal-López et al. [21] observed a much larger size at sexual maturity for Gray Snapper from Campeche Bank in the southern GOM (Mexico) at 322 mm FL (~341 mm TL).
The current minimum length limit for Gray Snapper in Florida state waters (<9 nm from the coast in the Gulf of Mexico) is 254 mm TL (10 inches) and in federal waters (>9 nm offshore) is 305 mm TL (12 inches). Although our sampling primarily focused on mature female Gray Snapper in spawning aggregations offshore, there was no indication from our inshore sampling that females collected in state waters were sexually mature when <300 mm in TL (functional maturity). Given that 50% of the population of female Gray Snapper are not sexually mature until they reach a 301 mm TL (11.9 inches), it may be necessary to adjust the minimum length limit in Florida state waters to ensure that an appropriate proportion of females inshore have the chance to mature and make the ontogenetic movement offshore for reproduction prior to potential harvest.
Additionally, of 20 3-year-old females caught offshore, 4 were immature, 4 were physiologically mature, and 12 were functionally mature. It is likely that females around the age of 50% maturity (2.9 and 3.2 years for physiological and functional maturity, respectively) that have made their ontogenetic shift offshore join the spawning population but contribute very little to the stock. In Spotted Seatrout, for example, first-time spawners can even recruit to the spawning population during the season and thus can have a very reduced spawning period and contribution [56]. More information regarding the spatial distribution of Gray Snapper is needed to determine the age and timing of migration offshore and if it coincides with sexual maturity.
For both the inshore and offshore collections, the sex ratio found in this study was not 1:1, and there was a greater proportion of males to females. The sex ratio of a stock is an important metric for calculating the size of the stock and hence the reproductive contribution of females. Previous accounts of a nearly 1:1 ratio include Starck and Schroeder [23], Domeier et al. [24], and Kim [20] and therefore warrants further investigation to determine if spatially distinct areas of the population are sex-skewed.

5. Conclusions

This study provided the first estimates of the age- and size-specific reproductive parameters that effect total fecundity for Gray Snapper in the eastern GOM. It also provided evidence that Big Old Fat Fecund Females (BOFFFs) had a disproportionately higher total annual fecundity by spawning in higher proportions during the spawning season and by spawning more often than smaller, younger females. It would be critical to understand whether BOFFFs contribute more to the absolute total egg production since these females may make up a relatively low proportion of the stock. If future stock assessments continue to use SSB, which assumes constant age- and size-reproductive parameters and therefore an isometric rather than hyperallometric relationship to fecundity, the reproductive potential and thus stock status of Gray Snapper may be inaccurate. It is thus important that future stock assessments consider the various size- and age-based parameters for Gray Snapper, along with the new estimates of spawning duration and sexual maturity that may represent their reproductive potential more accurately.

Supplementary Materials

The following supporting information can be downloaded at: https://www.mdpi.com/article/10.3390/fishes9120513/s1, Figure S1: The fractions of functionally mature females with POFs by size group and month collected in 2022 and 2023; Figure S2: The fractions of functionally mature females with POFs by age group and month collected in 2022 and 2023; Table S1: Macroscopic and histological (microscopic) descriptions of the reproductive phases of female Gray Snapper; Table S2: Macroscopic and histological (microscopic) descriptions of the phases in the reproductive cycle of male Gray Snapper; Table S3: Spawning durations (days) by size group calculated from the first and last dates when actively spawning female Gray Snapper were captured and histologically confirmed by oocytes in OM (GVM, GVBD, H, and POFs), in 2022 and 2023 combined; Table S4: Spawning durations (days) by age group calculated from the first and last dates when actively spawning female Gray Snapper were captured and histologically confirmed by oocytes in OM (GVM, GVBD, H, and POFs) in 2022 and 2023 combined.

Author Contributions

Conceptualization, D.J.M.; methodology, D.J.M. and A.W.; formal analysis, A.W.; data curation, A.W., D.J.M. and E.B.; investigation, A.W., D.J.M. and E.B.; writing—original draft preparation, A.W.; writing—review and editing, A.W., D.J.M. and E.B.; visualization, A.W.; supervision, D.J.M.; funding acquisition, D.J.M. All authors have read and agreed to the published version of the manuscript.

Funding

This research was funded by a National Oceanic and Atmospheric Administration (NOAA) Marine Fisheries Initiative (MARFIN), #NA21NMF4330508. A.W. and E.B. were funded by College of Agriculture and Life Sciences Matching Assistantships at the University of Florida.

Institutional Review Board Statement

The animal study protocol was approved by the Institutional Animal Care and Use Committee (IACUC) of the University of Florida (IACUC Study: #202111499).

Informed Consent Statement

Not applicable.

Data Availability Statement

The data presented in this study are available on request from the corresponding author due to the grant being currently in progress.

Acknowledgments

We thank Dylan Hubbard and the crew at Hubbard’s Marina for their assistance with our offshore sampling and retaining fish carcasses. We also thank the Florida Fish and Wildlife Research Institute and NOAA’s Panama City Laboratory for providing additional fish and gonad samples. We appreciated the assistance of various interns and volunteers throughout the study, especially Kaitlyn Doyscher and Andrew Foley for offshore field sampling and processing of fish in the lab, Daryl Parkyn for inshore fishing trips, Mack Leverock for processing of otoliths for aging, and Brooke Dekle and Peyton Kerry for assistance in the lab. Special thanks are given to Robert Allman and Michael Allen for comments on previous versions of the manuscript.

Conflicts of Interest

The authors declare no conflicts of interest.

References

  1. GMFMC (Gulf of Mexico Fishery Management Council). Final Amendment 51 to the Fishery Management Plan for the Reef Fish Resources of the Gulf of Mexico: Establish Gray Snapper Status Determination Criteria and Modify Annual Catch Limits; Gulf of Mexico Fishery Management Council: Tampa, FL, USA, 2019; 122p.
  2. SEDAR (Southeast Data Assessment and Review). SEDAR 75 Stock Assessment Report: Gulf of Mexico Gray Snapper; SouthEast Data, Assessment, and Review: North Charleston, SC, USA, 2022; 255p. [Google Scholar]
  3. SEDAR (Southeast Data Assessment and Review). SEDAR 51 Stock Assessment Report: Gulf of Mexico Gray Snapper; SouthEast Data, Assessment, and Review: North Charleston, SC, USA, 2018; 428p. [Google Scholar]
  4. NOAA. Fisheries of the Caribbean, Gulf of Mexico, and South Atlantic; Reef Fish Fishery of the Gulf of Mexico; Red Snapper Data Calibrations and Gray Snapper Harvest Levels; Federal Register, Vol. 89, No. 94, May 14, 2024; NOAA: Silver Spring, MD, USA, 2024.
  5. Berkeley, S.A.; Chapman, C.; Sogard, S.M. Maternal age as a determinant of larval growth and survival in a marine fish, Sebastes melanops. Ecology 2004, 85, 1258–1264. [Google Scholar] [CrossRef]
  6. Lowerre-Barbieri, S.K.; Brown-Peterson, N.J.; Murua, H.; Tomkiewicz, J.; Wyanski, D.M.; Saborido-Rey, F. Emerging issues and methodological advances in fisheries reproductive biology. Mar. Coast. Fish. 2011, 3, 32–51. [Google Scholar] [CrossRef]
  7. Macal, K.; Brulé, T.; Torres, R.; Montero-Muñoz, J. Oocyte distribution, ovarian organization, and spawning pattern in Lutjanus griseus. Cybium 2023, 47, 111–114. [Google Scholar] [CrossRef]
  8. Hunter, J.R.; Lo, N.C.H.; Leong, R.J.H. Batch Fecundity in Multiple Spawning Fishes; NOAA Technical Report National Marine Fisheries Service 36; NOAA: La Jolla, CA, USA, 1985; pp. 67–77.
  9. Hunter, J.R.; Macewicz, B.J. Measurement of Spawning Frequency in Multiple Spawning Fishes; NOAA Technical Report National Marine Fisheries Service 36; NOAA: La Jolla, CA, USA, 1985; pp. 79–94.
  10. Fitzhugh, G.R.; Shertzer, K.; Kellison, G.; Wyanski, D. Review of size- and age-dependence in batch spawning: Implications for stock assessment of fish species exhibiting indeterminate fecundity. Fish. Bull. 2012, 110, 413–425. [Google Scholar]
  11. Barneche, D.R.; Robertson, D.R.; White, C.R.; Marshall, D.J. Fish reproductive-energy output increases disproportionately with body size. Science 2018, 360, 642–645. [Google Scholar] [CrossRef]
  12. Marshall, D.; Bode, M.; Mangel, M.; Arlinghaus, R.; Dick, E. Reproductive hyperallometry and managing the world’s fisheries. Proc. Natl. Acad. Sci. USA 2021, 118, e2100695118. [Google Scholar] [CrossRef]
  13. Hixon, M.; Johnson, D.; Sogard, S. BOFFFFs: On the importance of conserving old-growth age structure in fishery populations. ICES J. Mar. Sci. 2014, 71, 2171–2185. [Google Scholar] [CrossRef]
  14. Marshall, D.J.; Barneche, D.R.; White, C.R. How does spawning frequency scale with body size in marine fishes? Fish Fish. 2022, 23, 316–323. [Google Scholar] [CrossRef]
  15. Larson, R.J. Seasonal cycles of reserves in relation to reproduction in Sebastes. Environ. Biol. Fish. 1991, 30, 57–70. [Google Scholar] [CrossRef]
  16. Lowerre-Barbieri, S.K.; Brown-Peterson, N.J.; Wyanski, D.M.; Moncrief-Cox, H.E.; Kolmos, K.J.; Menendez, H.S.; Barnett, B.K.; Friess, C. A unified framework and terminology for reproductive traits integral to understanding fish population productivity. Mar. Coast. Fish. 2023, 15, e10276. [Google Scholar] [CrossRef]
  17. Lowerre-Barbieri, S.K.; Ganias, K.; Saborido-Rey, F.; Murua, H.; Hunter, J.R. Reproductive timing in marine fishes: Variability, temporal scales, and methods. Mar. Coast. Fish. 2011, 3, 71–91. [Google Scholar] [CrossRef]
  18. Fitzhugh, G.R.; Beech, V.C.; Lyon, H.M.; Colson, P. Reproductive Parameters for the Gulf of Mexico Gray Snapper, Lutjanus griseus, 1991–2015. SEDAR51-DW-06; SEDAR: North Charleston, SC, USA, 2017; 9p. [Google Scholar]
  19. Garner, S.; Thornton, L.; Moncrief-Cox, H.; Allman, R. Life History Data for SEDAR 75 Gulf of Mexico Gray Snapper. SEDAR75-WP-05; SEDAR: North Charleston, SC, USA, 2022; 16p. [Google Scholar]
  20. Kim, E.S.M. Characterizing Gray Snapper (Lutjanus griseus) Life History in the Northcentral Gulf of Mexico: Age and Growth, Mortality, and Reproduction. Master’s Thesis, University of South Alabama, Mobile, AL, USA, 2022; 121p. [Google Scholar]
  21. Macal-López, K.d.C.; Brulé, T.; Torres-Villegas, J.R.; Colás-Marrufo, T.; Noh-Quiñones, V.E. Reproduction of grey snapper (Teleostei: Lutjanidae) in the southern Gulf of Mexico. Sci. Mar. 2022, 86, e047. [Google Scholar] [CrossRef]
  22. Pacicco, A.E.; Brown-Peterson, N.J.; Murie, D.J.; Allman, R.J.; Snodgrass, D.; Franks, J.S. Reproductive biology of yellowfin tuna (Thunnus albacares) in the northcentral U.S. Gulf of Mexico. Fish. Res. 2023, 261, 106620. [Google Scholar] [CrossRef]
  23. Starck, W.A.; Schroeder, R.E. Investigations on the Gray Snapper, Lutjanus griseus; Studies in Tropical Oceanography, University of Miami Press: Coral Gables, FL, USA, 1971; 224p. [Google Scholar]
  24. Domeier, M.L.; Koenig, C.; Coleman, F. Reproductive biology of the Gray Snapper (Lutjanus griseus), with notes on spawning for other western Atlantic snappers (Lutjanidae). In Biology and Culture of Tropical Groupers and Snappers; Arreguín-Sánchez, F., Munro, J.L., Balgos, M.C., Pauly, D., Eds.; ICLARM: Manila, Philippines, 1996; Volume ICLARM Conference Proceedings 48, pp. 189–201. [Google Scholar]
  25. Luo, J.; Serafy, J.E.; Sponaugle, S.; Teare, P.B.; Kieckbusch, D. Movement of gray snapper Lutjanus griseus among subtropical seagrass, mangrove, and coral reef habitats. Mar. Ecol. Prog. Ser. 2009, 380, 255–269. [Google Scholar] [CrossRef]
  26. Anderson, J.; McDonald, D.; Getz, E.; Weixelman, R.; Grubbs, F.; Ferguson, J. Distribution, maturity, age and growth of Gray Snapper (Lutjanus griseus) in the northwestern Gulf of Mexico. Gulf Caribb. Res. 2022, 33, 14–37. [Google Scholar] [CrossRef]
  27. Arnold, C.R.; Wakeman, J.M.; Williams, T.D.; Treece, G.D. Spawning of red snapper (Lutjanus campechanus) in captivity. Aquaculture 1978, 15, 301–302. [Google Scholar] [CrossRef]
  28. Feeley, M.; Morley, D.; Acosta, A.; Barbera, P.; Hunt, J.; Switzer, T.; Burton, M. Spawning migration movements of mutton snapper in Tortugas, Florida: Spatial dynamics within a marine reserve network. Fish. Res. 2018, 204, 209–223. [Google Scholar] [CrossRef]
  29. Heyman, W.D.; Kjerfve, B.; Graham, R.T.; Rhodes, K.L.; Garbutt, L. Spawning aggregations of Lutjanus cyanopterus (Cuvier) on the Belize Barrier Reef over a 6 year period. J. Fish Biol. 2005, 67, 83–101. [Google Scholar] [CrossRef]
  30. FWC (Florida Fish Wildlife Conservation Commission). FWC Protects Multi-Species Fish Spawning Aggregations Near Western Dry Rocks; FWC: Tallahassee, FL, USA, 26 February 2021.
  31. Claro, R.; Lindeman, K.C. Spawning aggregation sites of snapper and grouper species (Lutjanidae and Serranidae) on the insular shelf of Cuba. Gulf Caribb. Res. 2003, 14, 91–106. [Google Scholar] [CrossRef]
  32. Denit, K.; Sponaugle, S. Growth variation, settlement, and spawning of gray snapper across a latitudinal gradient. Trans. Am. Fish. Soc. 2004, 133, 1339–1355. [Google Scholar] [CrossRef]
  33. Allman, R.; Grimes, C. Temporal and spatial dynamics of spawning, settlement, and growth of gray snapper (Lutjanus griseus) from the West Florida shelf as determined from otolith microstructures. Fish. Bull. 2002, 100, 391–403. [Google Scholar]
  34. Sadovy, Y.; Domeier, M. Are aggregation-fisheries sustainable? Reef fish fisheries as a case study. Coral Reefs 2005, 24, 254–262. [Google Scholar] [CrossRef]
  35. Tzioumis, V.; Kingsford, M.J. Reproductive biology and growth of the temperate damselfish Parma microlepis. Copeia 1999, 1999, 348–361. Available online: https://www.jstor.org/stable/1447480. [CrossRef]
  36. Montgomery, W.L.; Galzin, R. Seasonality in gonads, fat deposits and condition of tropical surgeonfishes (Teleostei: Acanthuridae). Mar. Biol. 1993, 115, 529–536. [Google Scholar] [CrossRef]
  37. DeMartini, E.E.; Langston, R.C.; Eble, J.A. Spawning seasonality and body sizes at sexual maturity in the bluespine unicornfish, Naso unicornis (Acanthuridae). Ichthyol. Res. 2014, 61, 243–251. [Google Scholar] [CrossRef]
  38. Dobrzynski, T.; Johnson, K. Regional Council Approaches to the Identification and Protection of Habitat Areas of Particular Concern; NOAA/National Marine Fisheries Service, Office of Habitat Conservation: Silver Spring, MD, USA, 2001; p. 17.
  39. R Core Team. R: A Language and Environment for Statistical Computing; R Foundation for Statistical Computing: Vienna, Austria, 2022. [Google Scholar]
  40. Vanderkooy, S.; Carroll, J.; Elzey, S.; Branscome, J.; Kipp, J. A Practical Handbook for Determining the Ages of Gulf of Mexico and Atlantic Coast Fishes, 3rd ed.; Gulf States Marine Fisheries Commission and Atlantic States Marine Fisheries Commission: Ocean Springs, MS, USA, 2020; GSMFC No. 300; 294p. [Google Scholar]
  41. Fischer, A.; Baker, M.S.; Wilson, C.; Nieland, D. Age, growth, mortality, and radiometric age validation of gray snapper (Lutjanus griseus) from Louisiana. Fish. Bull. 2005, 103, 307–319. [Google Scholar]
  42. Beamish, R.J.; Fournier, D.A. A method for comparing the precision of a set of age determinations. Can. J. Fish. Aquat. Sci. 1981, 38, 982–983. Available online: https://cdnsciencepub.com/doi/abs/10.1139/f81-132. [CrossRef]
  43. Hinton, D.E. Histological techniques. In Methods for Fish Biology; Schreck, C.B., Moyle, P.B., Eds.; American Fisheries Society Special Publications Series; American Fisheries Society: Bethesda, MD, USA, 1990; pp. 191–209. [Google Scholar]
  44. Brown-Peterson, N.J.; Wyanski, D.M.; Saborido-Rey, F.; Macewicz, B.J.; Lowerre-Barbieri, S.K. A standardized terminology for describing reproductive development in fishes. Mar. Coast. Fish. 2011, 3, 52–70. [Google Scholar] [CrossRef]
  45. Jackson, M.; Nieland, D.; Cowan, J. Diel spawning periodicity of red snapper Lutjanus campechanus in the northern Gulf of Mexico. J. Fish Biol. 2006, 68, 695–706. [Google Scholar] [CrossRef]
  46. Length, R.V.; Bolker, B.; Buerkner, P.; Giné-Vázquez, I.; Herve, M.; Jung, M.; Love, J.; Miguez, F.; Piaskowski, J.; Riebel, H.; et al. Estimated Marginal Means, Aka Least-Squares Means, R Package Version 1.10.2. 2024. Available online: https://cran.r-project.org/web/packages/emmeans/index.html (accessed on 10 June 2024).
  47. Murua, H.; Kraus, G.; Saborido-Rey, F.; Wittames, P.R.; Thorsen, A.T.; Junquera, S. Procedures to estimate fecundity of wild collected marine fish in relation to fish reproductive strategy. J. Northwest Atl. Fish. Sci. 2003, 33, 33–54. [Google Scholar] [CrossRef]
  48. Bobko, S.; Berkeley, S. Maturity, ovarian cycle, fecundity, and age-specific parturition of black rockfish (Sebastes melanops). Fish. Bull. 2004, 102, 418–429. [Google Scholar]
  49. Dick, E.J.; Beyer, S.; Mangel, M.; Ralston, S. A meta-analysis of fecundity in rockfishes (genus Sebastes). Fish. Res. 2017, 187, 73–85. [Google Scholar] [CrossRef]
  50. Koenig, C.; Bueno, L.; Coleman, F.; Cusick, J.; Ellis, R.; Kingon, K.; Locascio, J.; Malinowski, C.; Murie, D.; Stallings, C. Diel, lunar, and seasonal spawning patterns of the Atlantic goliath grouper, Epinephelus itajara, off Florida, United States. Bull. Mar. Sci. 2017, 92, 391–406. [Google Scholar] [CrossRef]
  51. Torrejón-Magallanes, J. ‘sizeMat’: An R Package to Estimate Size at Sexual Maturity. 2020. Available online: https://cran.r-project.org/web/packages/sizeMat/vignettes/sizeMat.html (accessed on 22 March 2024).
  52. Ashton, W.D. The Logit Transformation with Special Reference to Its Uses in Bioassay; Hafner Publishing Company: New York, NY, USA, 1972. [Google Scholar]
  53. MacFarlane, R.B.; Norton, E.C.; Bowers, M.J. Lipid dynamics in relation to the annual reproductive cyle in yellowtail rockfish (Sebastes flavidus). Can. J. Fish. Aquat. Sci. 1993, 50, 391–401. [Google Scholar] [CrossRef]
  54. Grieshaber, C.A.; Midway, S.R.; Scharf, F.S.; Koopman, H.; Luckenbach, J.A.; Middleton, M.A. Seasonal physiological dynamics of maturing female southern flounder (Paralichthys lethostigma). Conserv. Physiol. 2016, 4, cow043. [Google Scholar] [CrossRef]
  55. LaPlante, L.H.; Schultz, E.T. Annual fecundity of tautog in Long Island Sound: Size effects and long-term changes in a harvested population. Trans. Am. Fish. Soc. 2007, 136, 1520–1533. [Google Scholar] [CrossRef]
  56. Lowerre-Barbieri, S.; Henderson, N.; Llopiz, J.; Walters Burnsed, S.; Bickford, J.; Muller, R. Defining a spawning population (spotted seatrout Cynoscion nebulosus) over temporal, spatial, and demographic scales. Mar. Ecol. Prog. Ser. 2009, 394, 231–245. [Google Scholar] [CrossRef]
  57. McBride, R.; Thurman, P. Reproductive biology of Hemiramphus brasiliensis and H. balao (Hemiramphidae): Maturation, spawning frequency, and fecundity. Biol. Bull. 2003, 204, 57–67. [Google Scholar] [CrossRef] [PubMed]
  58. Porch, C.E.; Fitzhugh, G.R.; Lang, E.T.; Lyon, H.M.; Linton, B.C. Estimating the dependence of spawning frequency on size and age in Gulf of Mexico red snapper. Mar. Coast. Fish. 2015, 7, 233–245. [Google Scholar] [CrossRef]
  59. Gonçalves, P.; Costa, A.M.; Murta, A. Estimates of batch fecundity and spawning fraction for the southern stock of horse mackerel (Trachurus trachurus) in ICES Division IXa. ICES J. Mar. Sci. 2009, 66, 617–622. [Google Scholar] [CrossRef]
  60. Taylor, M.H. Lunar synchronization of fish reproduction. Trans. Am. Fish. Soc. 1984, 113, 484–493. [Google Scholar] [CrossRef]
  61. Wright, P.J. Understanding the maturation process for field investigations of fisheries-induced evolution. Mar. Ecol. Prog. Ser. 2007, 335, 279–284. Available online: https://www.jstor.org/stable/24870967. [CrossRef]
  62. Junquera, S.; Román, E.; Morgan, M.; Sainza, M.; Ramilo, G. Time scale of ovarian maturation in Greenland halibut (Reinhardtius hippoglossoides, Walbaum). ICES J. Mar. Sci. 2003, 60, 767–773. [Google Scholar] [CrossRef]
  63. Rideout, R.M.; Rose, G.A.; Burton, M.P.M. Skipped spawning in female iteroparous fishes. Fish Fish. 2005, 6, 50–72. [Google Scholar] [CrossRef]
  64. Reed, E.; Brown-Peterson, N.; DeMartini, E.; Andrews, A. Reproductive Characteristics of Longtailed Red Snapper (Onaga, Etelis Coruscans) in the Main Hawaiian Islands; Pacific Islands Fisheries Science Center Administrative Report H-21-02; NOAA: Honolulu, HI, USA, 2021; 29p.
Figure 1. Heat map of general capture locations of Gray Snapper caught off the west coast of Florida. Total n = 4563. The inset shows the general location of sampling off the west coast of Florida (black outline), as well as the location of a known spawning aggregation of Gray Snapper at Western Dry Rocks (*) and presumed spawning aggregation at the Florida Middle Grounds (•).
Fishes 09 00513 g001
Figure 2. Length distributions of Gray Snapper collected off the west coast of Florida from inshore waters (A), where the dashed line represents the minimum size limit of 254 mm (10 inches) in state waters (<9 nm in the Gulf of Mexico), and offshore waters (B), where the dashed line represents the minimum size limit of 305 mm (12 inches) in federal waters (>9 nm offshore). Age distributions for inshore fish (C) and offshore fish (D).
Fishes 09 00513 g002
Figure 3. Monthly gonadosomatic index (mean ± 1 SE) (left axis) and % fat (right axis) for functionally mature female (A) and male (B) Gray Snapper by sampling years, 2022 and 2023. Numbers indicate monthly sample sizes of the gonadosomatic index. The fat index is for both years pooled.
Fishes 09 00513 g003
Figure 4. Gray Snapper reproductive phases based on oocyte development including the following: (A) immature, with primary growth (PG) oocytes; (B) developing, with cortical alveolar (CA) oocyte and primary vitellogenic oocyte (Vtg1); (C) spawning-capable, with tertiary vitellogenic oocytes (Vtg3); actively spawning (in final oocyte maturation), including germinal vesicle migration (GV) (D) and hydration (H) (E); and (F) early post-ovulatory follicles (POFs); (G) regressing, with alpha atresia (a) and phagocytes (P); and (H) regenerating, with primary growth oocytes, a thick ovarian wall (OW), large blood vessels (BV), and large muscle bundles (M).
Fishes 09 00513 g004
Figure 5. Monthly frequency of the reproductive phases of mature female (A) and male (B) Gray Snapper for both years combined. Female reproductive phases were assigned from microscopic staging whereas males were analyzed macroscopically with a small subset from histology. The numbers above bars represent the total numbers of mature fish sampled in those months.
Fishes 09 00513 g005
Figure 6. Male Gray Snapper reproductive phases based on histological classification, including the following: (A) immature phase showing only spermatogonia (SG) and no visible lumens; (B) developing phase with spermatocytes (SC1 and SC2) and spermatids (ST); and (C) actively spawning subphase with spermatozoa (SZ) abundant in the lumens of the lobules and anastomosing lobules with discontinuous germinal epithelium (DGE). The black line represents the scale bar of 0.5 mm.
Fishes 09 00513 g006
Figure 7. The fractions of functionally mature female Gray Snapper with POFs by size (A) and age (B) groups collected from May to September in 2022 and 2023. The total number of functionally mature fish in each group is shown as a color gradient.
Fishes 09 00513 g007
Figure 8. Batch fecundity estimates as a function of total length (A) and age (B) for female Gray Snapper in hydration (n = 12); and total annual fecundity estimates as a function of total length (C) and age (D). Open circles are counts for oocytes in OM (GVM and GVBD). Vertical bars are ± 1 SE for the duplicate fecundity estimates for each female.
Fishes 09 00513 g008
Figure 9. Percent occurrence (%) of oocytes in final maturation (OM) and post-ovulatory follicles (POFs) relative to the moon phase for functionally mature females collected in May–September in 2023. Collection dates were aggregated ± 3 days around each lunar phase. The numbers of functionally mature females included by moon phase were n = 263 for the full moon, n = 98 for the new moon, n = 62 for the last-quarter moon, and n = 37 for the first-quarter moon.
Fishes 09 00513 g009
Figure 10. Length and age at 50% sexual maturity (L50 and A50 indicated by dashed red line) for female Gray Snapper based on physiological and functional maturity criteria from females sampled during the spawning season (May–September): (A) physiological L50 (n = 1198); (B) functional L50 (n = 1180); (C) physiological A50 (n = 1179); and (D) functional A50 (n = 1162). The data point size represents the sample size for each age class in (C,D). Confidence limits are indicated by blue ribbons around the modeled relationship.
Fishes 09 00513 g010
Figure 11. Sexual maturity of male Gray Snapper sampled during the spawning season (May–September) based on length (L50; n = 1754) (A) and age (A50; n = 1740) (B) represented by the dashed red lines. The data point size represents the sample size for each age class in (B), and confidence limits are indicated by blue ribbons around the modeled relationships.
Fishes 09 00513 g011
Table 1. Spawning fraction and interval for mature female Gray Snapper by month collected in 2022 and 2023. Estimates were derived from females with POFs. n = total number of functionally mature females; npof = number with POFs.
MonthnnpofSpawning
Fraction
Spawning Interval (Days)
May19710.005197.00
June194120.06216.17
July240880.3672.73
August153260.1705.88
September26830.01189.33
Pooled (May–September)10521300.1248.09
Peak spawning (June–August)5871260.2154.66
Table 2. Spawning fraction and interval by size group of mature female Gray Snapper collected during May–September in 2022 and 2023. Estimates were derived from females with POFs. n = total number of functionally mature females; npof = number with POFs.
Size Group
(TL, mm)
nnpofSpawning
Fraction
Spawning Interval (Days)Spawning Frequency
300–3245930.05119.674.17
325–349188180.09610.448.91
350–374232340.1476.8215.54
375–399203220.1089.2311.48
400–424136190.1407.1612.01
425–499171210.1238.1411.43
≥50059130.2204.5424.89
Table 3. Spawning fractions and intervals by age group for mature female Gray Snapper collected during May–September in 2022 and 2023. Estimates were derived from females with POFs. n = total number of functionally mature females; npof = number with POFs.
Age Group
(Years)
nnpofSpawning
Fraction
Spawning Interval (Days)Spawning Frequency
31200.000.000
4134110.08212.186.98
5154210.1367.3312.28
6131160.1228.1910.99
7106140.1327.5710.83
8108110.1029.829.16
9–10152190.1258.0012.75
11–12120150.1258.0011.88
13–1551100.1965.1013.53
≥1666100.1526.6013.18
Disclaimer/Publisher’s Note: The statements, opinions and data contained in all publications are solely those of the individual author(s) and contributor(s) and not of MDPI and/or the editor(s). MDPI and/or the editor(s) disclaim responsibility for any injury to people or property resulting from any ideas, methods, instructions or products referred to in the content.

