Article

Toward Classification of Fish Meat Using Fluorescence Excitation–Emission Matrix and Multivariate Statistics

by
Md. Mizanur Rahman
1,2,
Mario Shibata
1,*,
Mst. Nazira Akhter Rithu
3 and
Emiko Okazaki
4
1
Department of Food Science and Technology, Tokyo University of Marine Science and Technology, 4-5-7 Konan, Minato, Tokyo 108-8477, Japan
2
Department of Fisheries Technology, Patuakhali Science and Technology University, Dumki, Patuakhali 8602, Bangladesh
3
Department of Ocean Science, Tokyo University of Marine Science and Technology, 4-5-7 Konan, Minato, Tokyo 108-8477, Japan
4
Industry–Academia/Regional Collaboration Promotion Organization, Tokyo University of Marine Science and Technology, 4-5-7 Konan, Minato, Tokyo 108-8477, Japan
*
Author to whom correspondence should be addressed.
Fishes 2024, 9(12), 500; https://doi.org/10.3390/fishes9120500
Submission received: 31 October 2024 / Revised: 4 December 2024 / Accepted: 6 December 2024 / Published: 7 December 2024

Abstract

Frequent intentional mislabeling of particular fish and fish products, such as the sale of frozen and thawed fish instead of fresh fish, occurs on all continents. Therefore, two studies were conducted to classify fish meat using excitation–emission matrix (EEM) nondestructively. The first study assessed EEM for differentiation between fresh and frozen–thawed spotted mackerel fillets. Fresh fillets were yielded with different post-mortem freshness variations (ice storage for 0–40 h). The right-side fillets were used as fresh fillets, whereas the left-side fillets were frozen and stored at −30 °C for three months, then thawed at 4 °C. Subsequently, EEM acquisition and chemical analyses were performed. Results of principal component analysis (PCA) of EEM spectra showed clear discrimination between fresh and frozen–thawed meat of fish fillet. In the second study, post-mortem freshness variations in four fish species (horse mackerel, spotted mackerel, cod, and flounder) were simulated by ice storage (0–48 h) and subsequent freezing. PCA of the EEM demonstrated a clear distinction among the fish meat categories, which was also revealed from the freshness data of chemical analysis. Results show that this novel method can be used to monitor fishery product authenticity.
Key Contribution: Fresh and frozen–thawed fillets and meat of different species were successfully discriminated by EEM spectra with multivariate analysis.

1. Introduction

Fish and fish products are important sources of food protein for human beings. Freezing is a conventional method to maintain the shelf life of fishery products during processing, distribution, and marketing because of the perishable nature of fish. Temperature abuse, such as multiple freezing and thawing, strongly affects fish quality: unfrozen or newly harvested fish are desired by consumers. However, mislabeling of fishery products, such as labeling of frozen–thawed fish fillets as fresh fillets, has become a major concern recently because of complex supply chains and unfair trading competition [1,2].
Japan is the world’s largest consumer of high-value fish, such as bluefin tuna, and the third largest seafood importer after the European Union (EU) and the United States of America (USA). Reportedly, Japan imported an estimated USD 1.6–2.4 billion worth of seafood from mislabeled and unreported sources in 2015 [3]. Because fish and some seafood species are difficult to distinguish after they have been killed, filleted, and processed, mislabeling can occur unintentionally. Furthermore, identifying fish species can often lead to errors, particularly due to the use of varying vernacular names across regions for the same species. However, in some cases, intentional substitution is likely, especially for species or products with differing economic values. Fraud commonly occurs at various stages of the supply chain, where high-value species are replaced with lower-cost alternatives [4]. Therefore, to protect consumer rights, the need exists for methods to verify the accuracy of traceability information.
Several physical, chemical, biochemical, microbiological, enzymatic, and sensory techniques have been proposed in the literature for the evaluation of fish freshness and differentiation between fresh and frozen–thawed fish [4,5,6]. DNA barcoding is widely regarded as the leading technique for identifying seafood muscle tissue [7,8,9]. Other approaches, such as immunological assays like enzyme-linked immunosorbent assay (ELISA), also serve as alternatives to DNA barcoding [10]. However, these methods often require significant time and financial resources, as well as the expertise of highly trained personnel. To address the need for a faster, non-invasive classification method for fish muscle tissue, we chose to utilize a fluorescence excitation–emission matrix (EEM), commonly referred to as fluorescence fingerprinting (FF).
Few studies have specifically examined the application of fluorescence EEM to fish and seafood freshness monitoring, which have different raw quality before freezing [11,12,13,14]. Shrimp were classified according to their origin and species using multidimensional EEM [15]. There are several reports describing the potential for front-face fluorescence spectroscopy (FFFS) to differentiate between fresh and frozen–thawed fish meat [16]. However, there is no report for fish meat classification using EEM. Therefore, the objectives of this study were to differentiate fresh spotted mackerel fillets from those previously frozen and thawed and then to classify fish meat samples from four species.

2. Materials and Methods

2.1. Sample Preparation

  • Experiment 1. Differentiation between fresh and frozen–thawed fish fillets:
Live spotted mackerel (Scomber australasicus) with an average weight of 309.8 ± 90.2 g and length of 30.3 ± 5.2 cm were collected. Subsequently, after the fish were killed instantly by neck breaking, they were kept in iced water for 30 min for exsanguination. All fish samples were then stored in ice for 0, 6, 12, 24, or 40 h to simulate different freshness conditions. Three replicates were used for each condition. Then, the fish were eviscerated and filleted. The right-side fillets were used as fresh fillets, whereas the left-side fillets were frozen and stored at −30 °C for three months. Before EEM measurements, the frozen samples were thawed for 18 h at 4 °C. The EEM of fresh and frozen–thawed samples was measured using fluorescence spectrometry and was then frozen at −60 °C to maintain the original condition until chemical analysis of the sample.
  • Experiment 2. Classification of fish species:
Four species were selected based on different muscle properties, such as red meat and white meat species. They were horse mackerel (Trachurus japonicus), spotted mackerel (Scomber australasicus), Pacific cod (Gadus macrocephalus), and blackfin flounder (Glyptocephalus stelleri). Live fish were killed instantly and were then stored in ice for 0, 6, 12, 24, and 48 h to prepare samples with different freshness conditions (n = 3). After each storage period, they were filleted and then frozen in an air blast freezer at −30 °C. They were stored at −60 °C until EEM measurements to maintain their original condition.

2.2. EEM Acquisition

Measurements using EEM for the fillet samples were taken using a fluorescence spectrophotometer (F-7100; Hitachi High-Tech Science Corp., Tokyo, Japan) equipped with an external Y-type fiber optic probe. The sample was placed inside a dark chamber. The probe head was set 2 mm above the sample surface. For experiment 1, measurements were taken at 4 °C by keeping the sample on ice. For experiment 2, the frozen fish sample was placed inside a small freezer (SC-DF25; Twinbird Corp., Niigata, Japan) at −30 °C in a dark chamber to prevent stray light. The fluorescence spectra of the samples were recorded by scanning the excitation (Ex.) wavelengths from 250 to 800 nm and the emission (Em.) wavelengths from 250 to 800 nm at 10 nm intervals. Measurements were performed under the conditions of a 10 nm slit width, a scan speed of 30,000 nm/min, and a photomultiplier voltage of 400 V. After collecting the fluorescence spectra, the samples were repacked and stored at −60 °C to preserve their original quality until the preparation of muscle extract.

2.3. Preparation of Muscle Extract and Measurement of ATP-Related Compounds

Muscle extraction for the analysis of adenosine triphosphate (ATP)-related compounds was carried out following the procedure described by Ehira and Uchiyama [17]. After each frozen sample was taken from the pack, fillet subsamples were cut using a saw and sharp knife from the same locations used to acquire FF spectra. Skin and dark meat were removed from the excised subsamples. Then, the subsample was crushed into tiny pieces using a knife, chisel, and hammer. Subsequently, approximately 5 g of crushed frozen muscle tissue was placed in 15 mL of a chilled 10% perchloric acid solution (Wako Pure Chemical Industries Ltd., Osaka, Japan). The sample was immediately homogenized using a rotary homogenizer (Model PT 10–35 GT; Kinematica AG, Lucerne, Switzerland). The resulting homogenate was centrifuged at 4500× g for 3 min at 4 °C using a centrifuge (Suprema 21; Tomy Seiko Co., Ltd., Tokyo, Japan). The supernatant was then collected, and 5% perchloric acid was added to the precipitate. After thorough mixing, the sample was centrifuged again under the same conditions. This extraction process was repeated three times for each sample. The pH of the final supernatant was adjusted to 6.4 by adding 10 M or 1 M potassium hydroxide, and the volume was brought to 50 mL by diluting with ion-exchange water. The resulting extract was frozen and stored at −60 °C until it was analyzed by high-performance liquid chromatography (HPLC). To preserve the quality of the frozen fish meat, all processes involving subsample cutting, weighing, and muscle homogenization were carried out entirely in a cold room maintained at 4.5 °C. Cutting tools were kept at a low temperature on dry ice throughout the procedures.
ATP metabolites such as ATP, adenosine diphosphate (ADP), adenosine monophosphate (AMP), inosinic acid (IMP), inosine (HxR), and hypoxanthine (Hx) were determined from the muscle extracts of frozen fish meat using HPLC (Prominence; Shimadzu Corp., Kyoto, Japan) equipped with a stainless-steel column (Shodex C18M4D; Showa Denko K.K., Isesaki, Japan), as described by Maeda et al. [18]. After the muscle extracts were thawed at 4 °C and then filtered through a syringe filter with a pore size of 0.45 µm, HPLC analysis was performed for the filtrate under the following conditions: 5 μL sample volume; 35 °C column temperature; 260 nm monitor wavelength for UV absorption; 0.8 mL/min flow rate; and eluent—buffer (pH 6.8) composed of 0.13 M triethylamine, 0.20 M acetonitrile, and 0.13 M phosphoric acid. In addition, the K-value was calculated as the freshness index according to the method reported by Saito et al. [19] using the following Formula (1).
K - value   ( % ) = HxR + Hx ATP + ADP + AMP + IMP + HxR + Hx × 100

2.4. pH Measurement of Fresh and Frozen–Thawed Fish Fillets

The pH measurements were taken according to the method described by Rahman et al. [11]. First, after subsamples were cut using a rotary saw from the remaining part of fresh and thawed meat that had been kept frozen after sampling for HPLC analysis, the excised subsamples were broken into small fragments using a knife, chisel, and hammer. Around 3 g of fish meat was collected and homogenized using a polytron homogenizer (PT 10–35 GT; Kinematica AG, Lucerne, Switzerland) at 20,000 rpm with 15 mL of 0.02 M sodium iodoacetate by adding 15 mL of 0.02 M sodium iodoacetate to suppress enzymatic activity. Then, the pH value of the homogenate was measured using a digital pH meter (LAQUA F-72; Horiba Scientific, Kyoto, Japan). To preserve the original quality of the frozen fish, the entire process was carried out in a cold room set at 4.5 °C. The cutting tools were kept cold with the use of dry ice.

2.5. Data Analysis of EEM Spectra

Using the algorithm of MATLAB R2016b (The MathWorks Inc., Natick, MA, USA), non-fluorescence data, including scattered light, were removed from the original EEM data according to earlier reports [20]. Following the masking process, the remaining wavelength ranges were Ex. 250–760 nm and Em. 290–800 nm, resulting in a total of 1054 wavelength combinations (variables). The initially masked EEM data (1054 wavelength pairs) underwent a second masking step, resulting in 403 wavelength pairs. Then, principal component analysis (PCA) was applied to the selected data using software (JMP Pro. 12; SAS Institute Inc., Cary, NC, USA).

3. Results

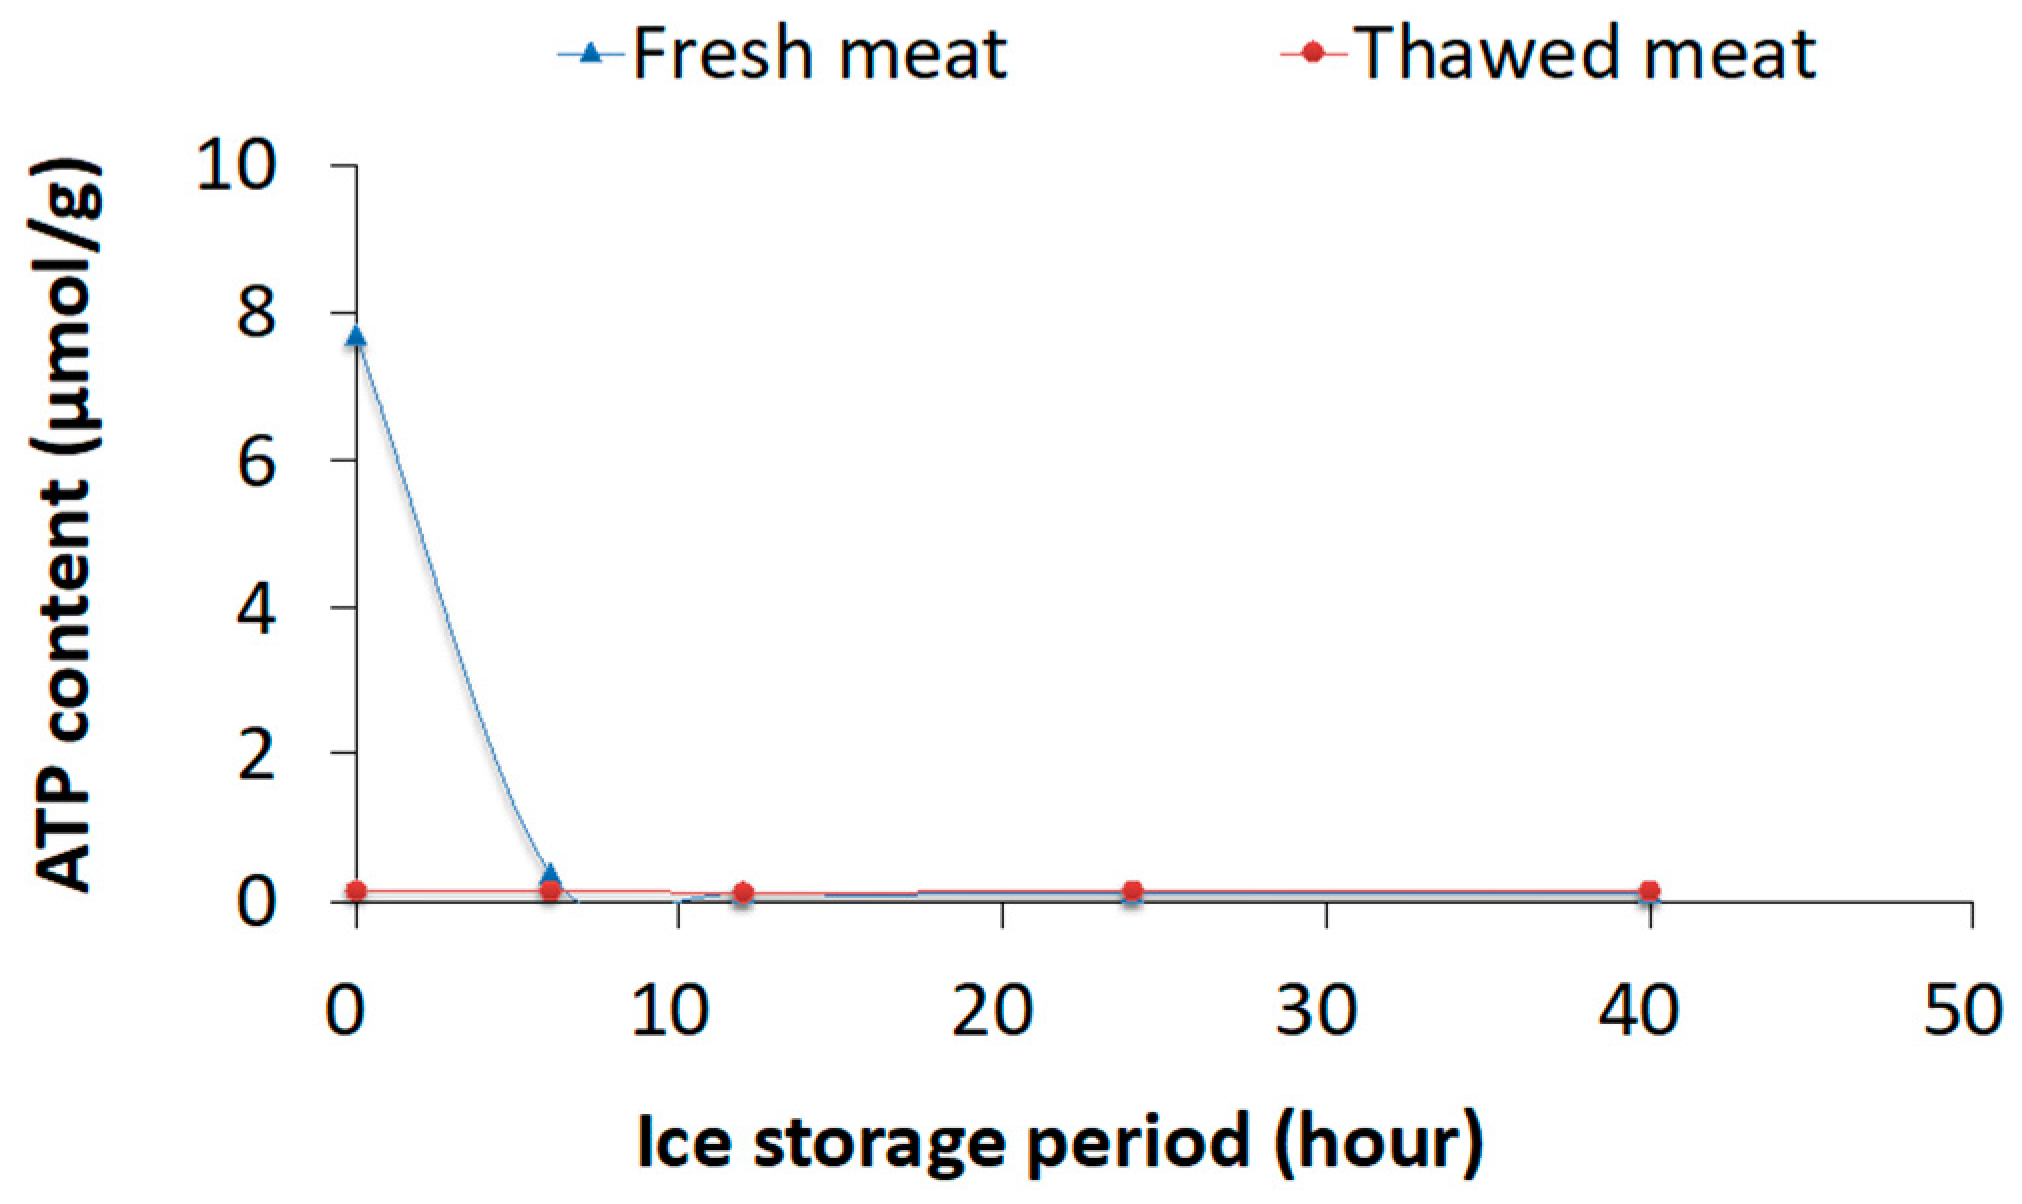
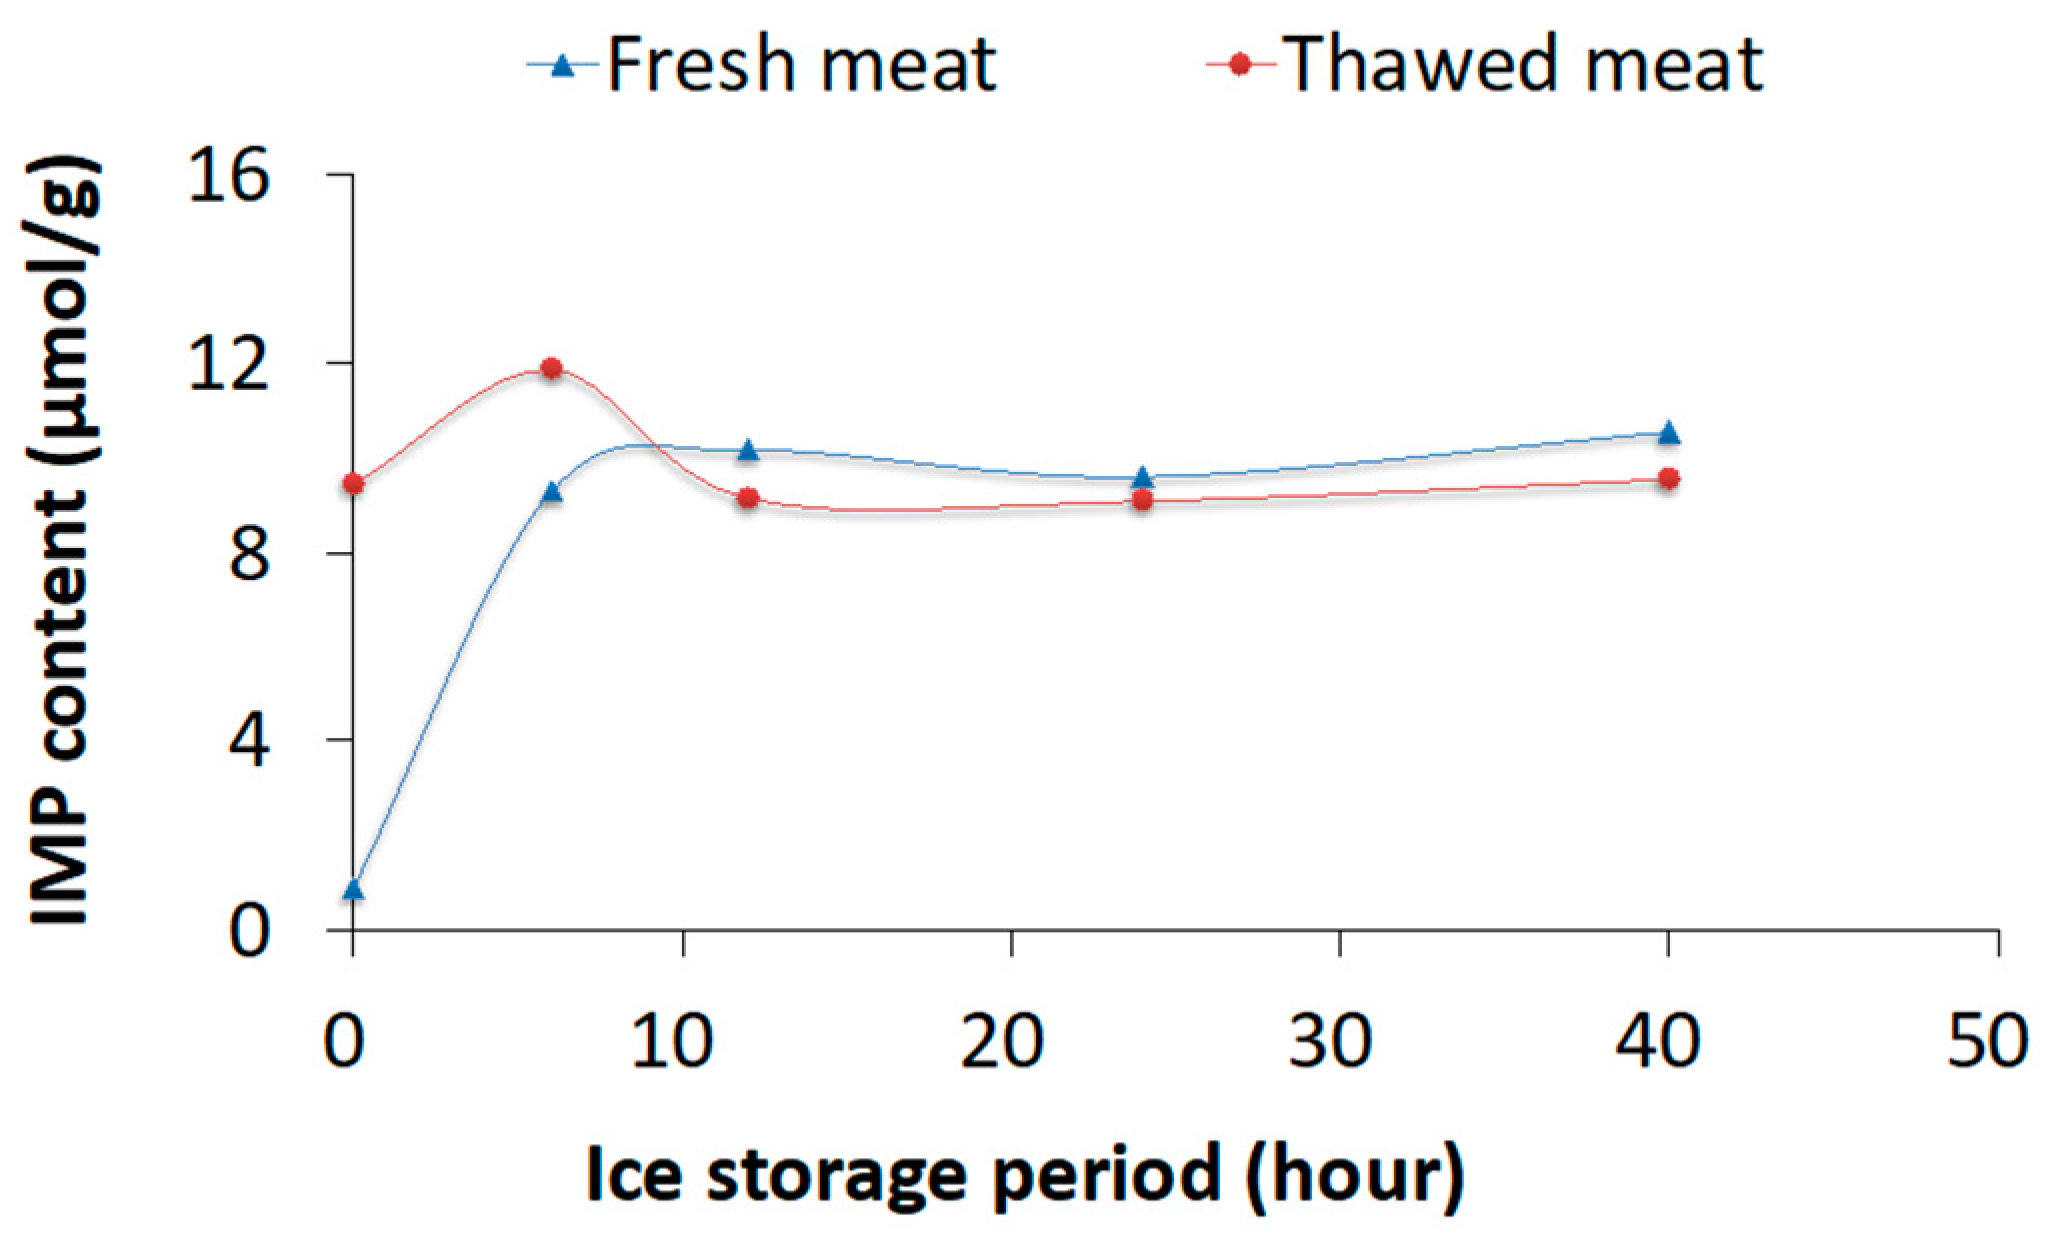
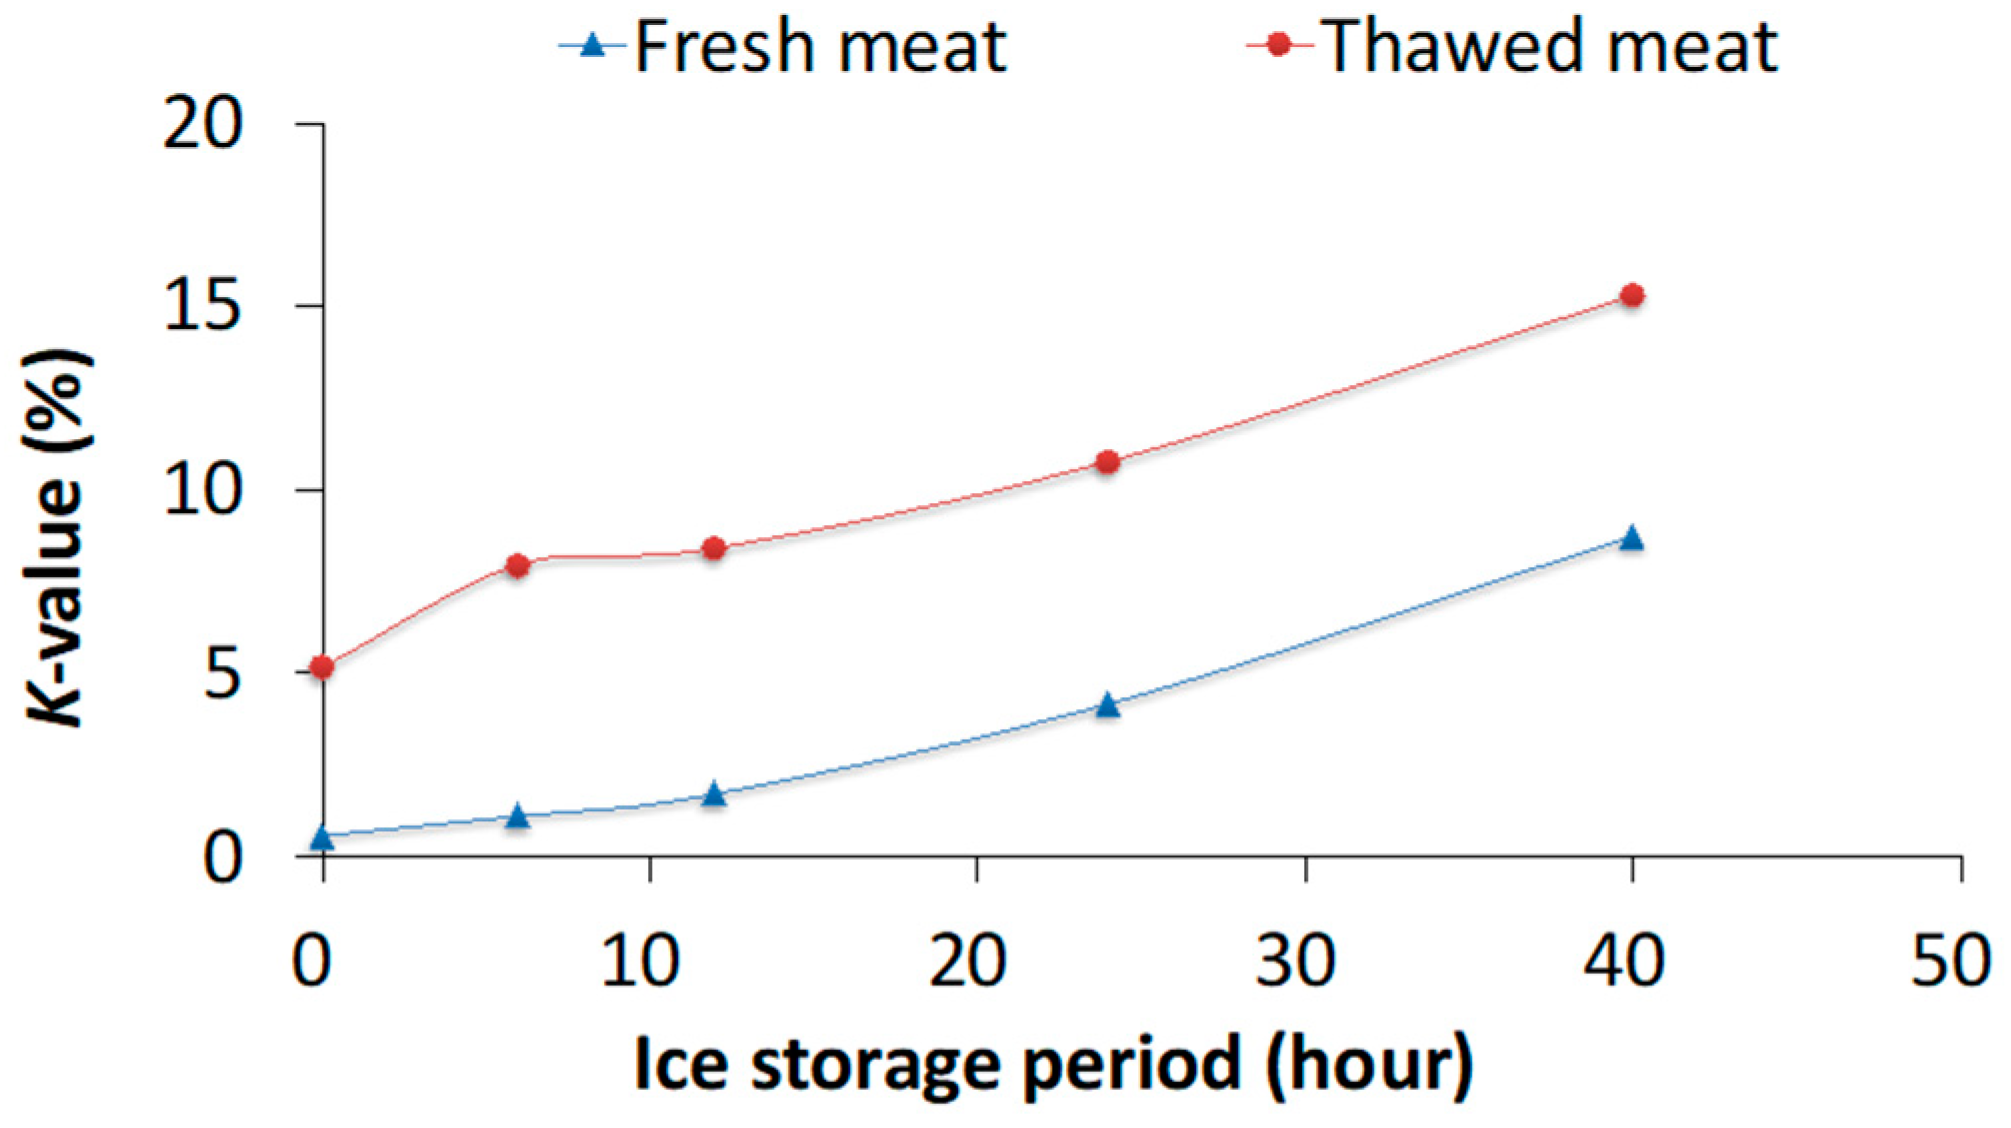
3.1. Experiment 1: Thawing Effects on Freshness of Fish Meat Determined Using Chemical Methods

Figure 1 presents the ATP content in fresh and frozen–thawed meat of spotted mackerel stored in ice for 0–40 h after their death. The initial (0 h) ATP content of fresh meat was markedly higher (7.69 µmol/g) than that of the frozen–thawed meat (0.14 µmol/g). After 6 h of ice storage, ATP content dropped to less than 1 µmol/g for fresh fish meat and remained less than 0.5 µmol/g until the end of the storage period (40 h), indicating that most of ATP was lost in raw fillet after death within a few hours of ice storage.
Figure 2 presents the IMP content in fresh and frozen–thawed meat of spotted mackerel against the ice storage period after the fish had been killed. In fact, IMP is recognized for enhancing the pleasant, fresh flavor of meat by boosting the umami taste, particularly in fish products [20]. The initial IMP content of frozen–thawed meat, however, was much higher (9.43 μmol/g) than that of fresh meat (0.88 μmol/g) and increased gradually for both types of meat (Figure 2). The highest concentration of IMP in fresh fillets was observed (average = 10.55 µmol/g) at the end of the storage period (40 h). By contrast, the highest IMP reached around 11.88 µmol/g in frozen–thawed meat that had been ice-stored for 6 h after death.
Figure 3 depicts K-value changes in fresh and frozen–thawed meat of spotted mackerel that had been stored in ice for 0–40 h. In fresh meat, the K-value gradually increased from 0.56% at 0 h to 1.70% at 12 h. After 40 h of ice storage, it reached approximately 8.71%. By contrast, in frozen–thawed meat, the initial K-value was 5.13%. It increased to 15.29% during 40 hours of ice storage.
Figure 4 presents the pH of fresh and thawed spotted mackerel meat. At the beginning of ice storage, the average pH was around 6.65 for a fresh fillet of spotted mackerel. It then decreased gradually with increasing ice storage period. The initial pH of the fresh fillet was approximately 6.65.
After 6 h of ice storage, the average pH dropped to 6.03, indicating a faster rate of decrease in pH in fresh fillets after fish death, with a continued decrease until the end of the storage period (40 h). After 12–40 h of ice storage, the fresh fillet pH decreased to less than 6.0 (5.91–5.84). A gradual decrease in pH was observed in fresh fillets throughout the storage period.
The lowest pH (average = 5.77) was observed in a frozen–thawed fish fillet that had been frozen immediately after the death of the fish (0 h icing). A slightly increasing trend of pH was observed because of the post-mortem storage period, but the pH remained within 6.06 (Figure 4).

3.2. Discrimination Between Fresh and Frozen–Thawed Fillets by FFs Coupled with PCA

Acquired fluorescence fingerprints of fresh and frozen–thawed meat in spotted mackerel fish (post-mortem ice-stored for 0, 6, 12, 24, and 40 h) were preprocessed, masked, and analyzed using multivariate statistics. Principal component analysis (PCA) was performed on the secondary masked spectra, i.e., a total of 403 wavelength pairs (Ex. 250–420 nm and Em. 290–650 nm) were employed to distinguish fresh meat from frozen–thawed meat spectra.
Figure 5 shows the PC score plot of EEMs for fresh and frozen–thawed meat. Principal component 1 (PC1) differentiated the EEM spectra of fresh and frozen–thawed meat very clearly, with PC1 accounting for 91.4% of the total variance. As for PC1, fresh meat samples had negative values, while frozen–thawed meat samples had positive values.

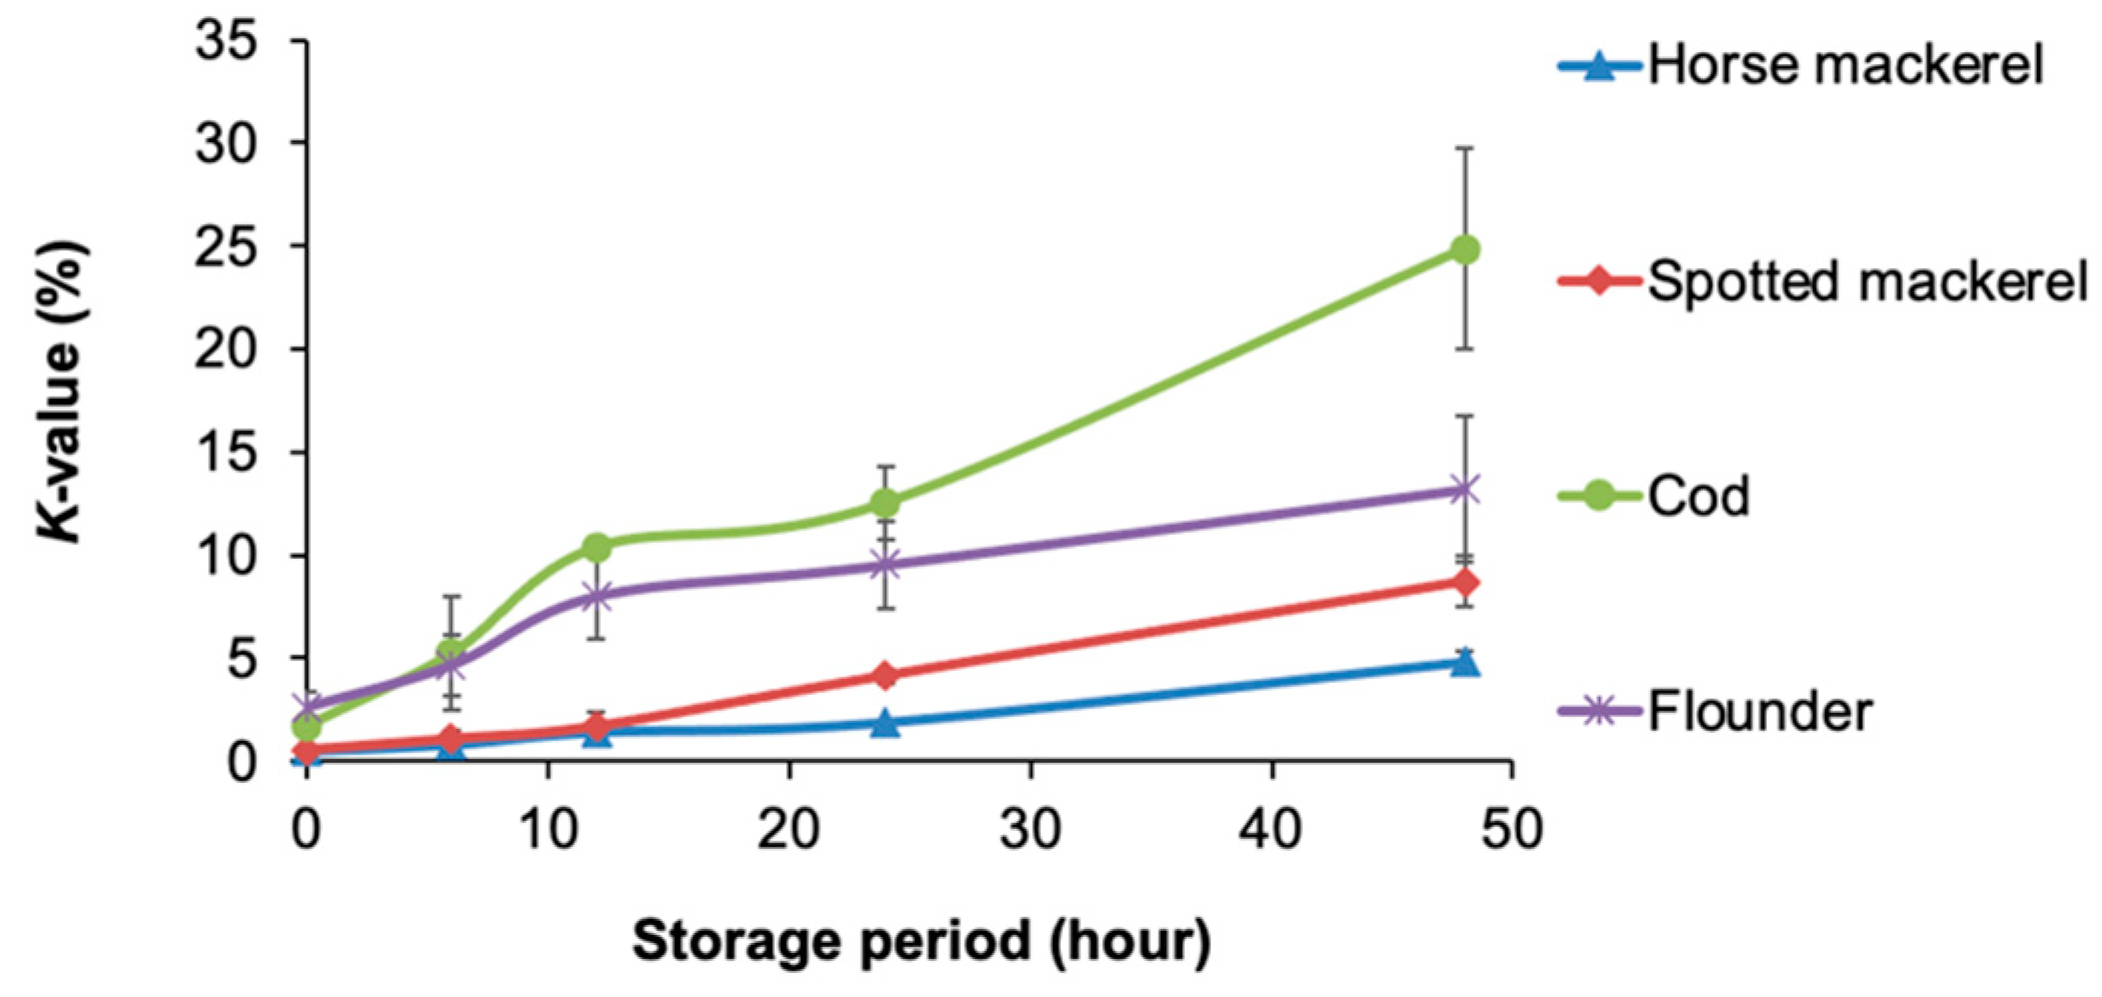
3.3. Experiment 2: Freshness Variations Among Fish Species

Figure 6 presents changes in the K-values of different fish species that had undergone a 48 h ice storage period. In horse mackerel meat, between 0 h and 12 h, the K-value increased gradually (from 0.5% to 1.3%). After 24 h of ice storage, it reached approximately 2%, and by 48 h, it had risen to 4.4%. Therefore, the increase in K-values during the first 48 h post-mortem was minimal.
For spotted mackerel samples, from 0 h to 12 h, the K-value increased slowly, ranging from 0.56% to 1.70%. After 48 h of ice storage, it reached approximately 8.71%. The rate of K-value change in the spotted mackerel samples was slightly higher than that of the horse mackerel sample, which confirms that freshness degradation occurred because of the faster metabolism in spotted mackerel.
The K-value changes of cod and flounder were also observed during the 0–48 h ice storage period. The rate of K-value change in the cod samples was higher than that of the flounder (Figure 6). At the end of ice storage, the K-values reached 24.86 ± 4.89% and 13.21 ± 3.56%, respectively, in cod and flounder meat. Higher K-values observed in cod and flounder fillets might be attributable to the faster decomposition rate of ATP and IMP and rapid accumulation of HxR. Because the K-value rises dependently on IMPase reactions in microorganisms [21], the reactions were inferred as increasing concomitantly with the increasing storage period.

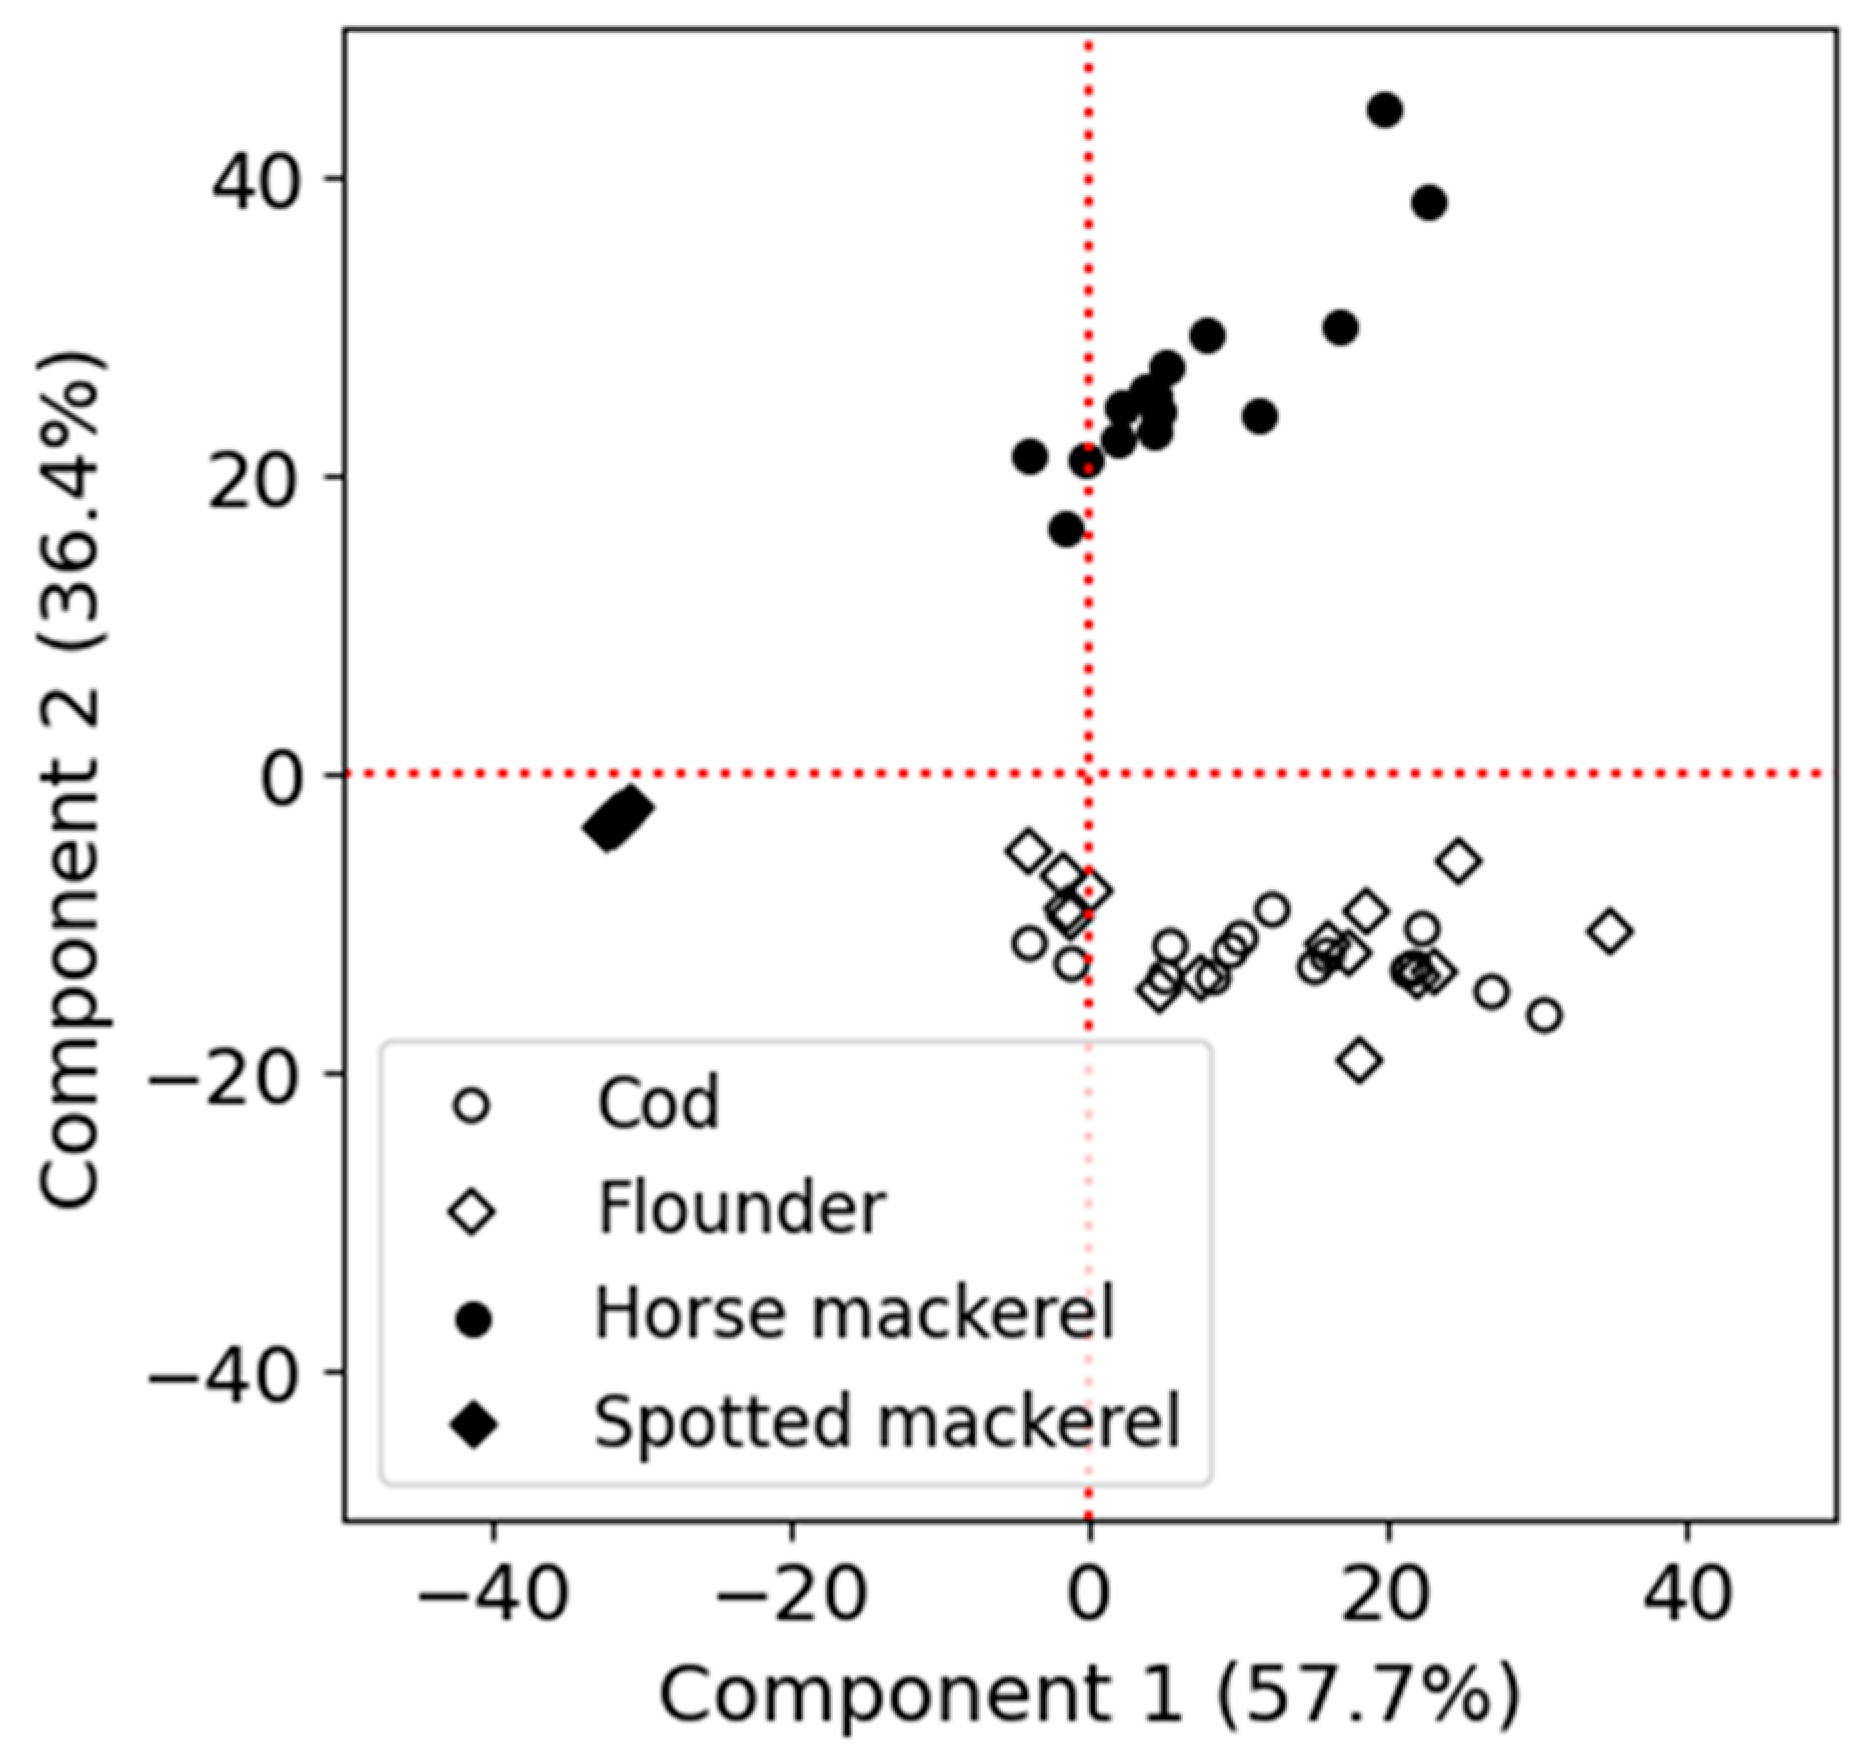
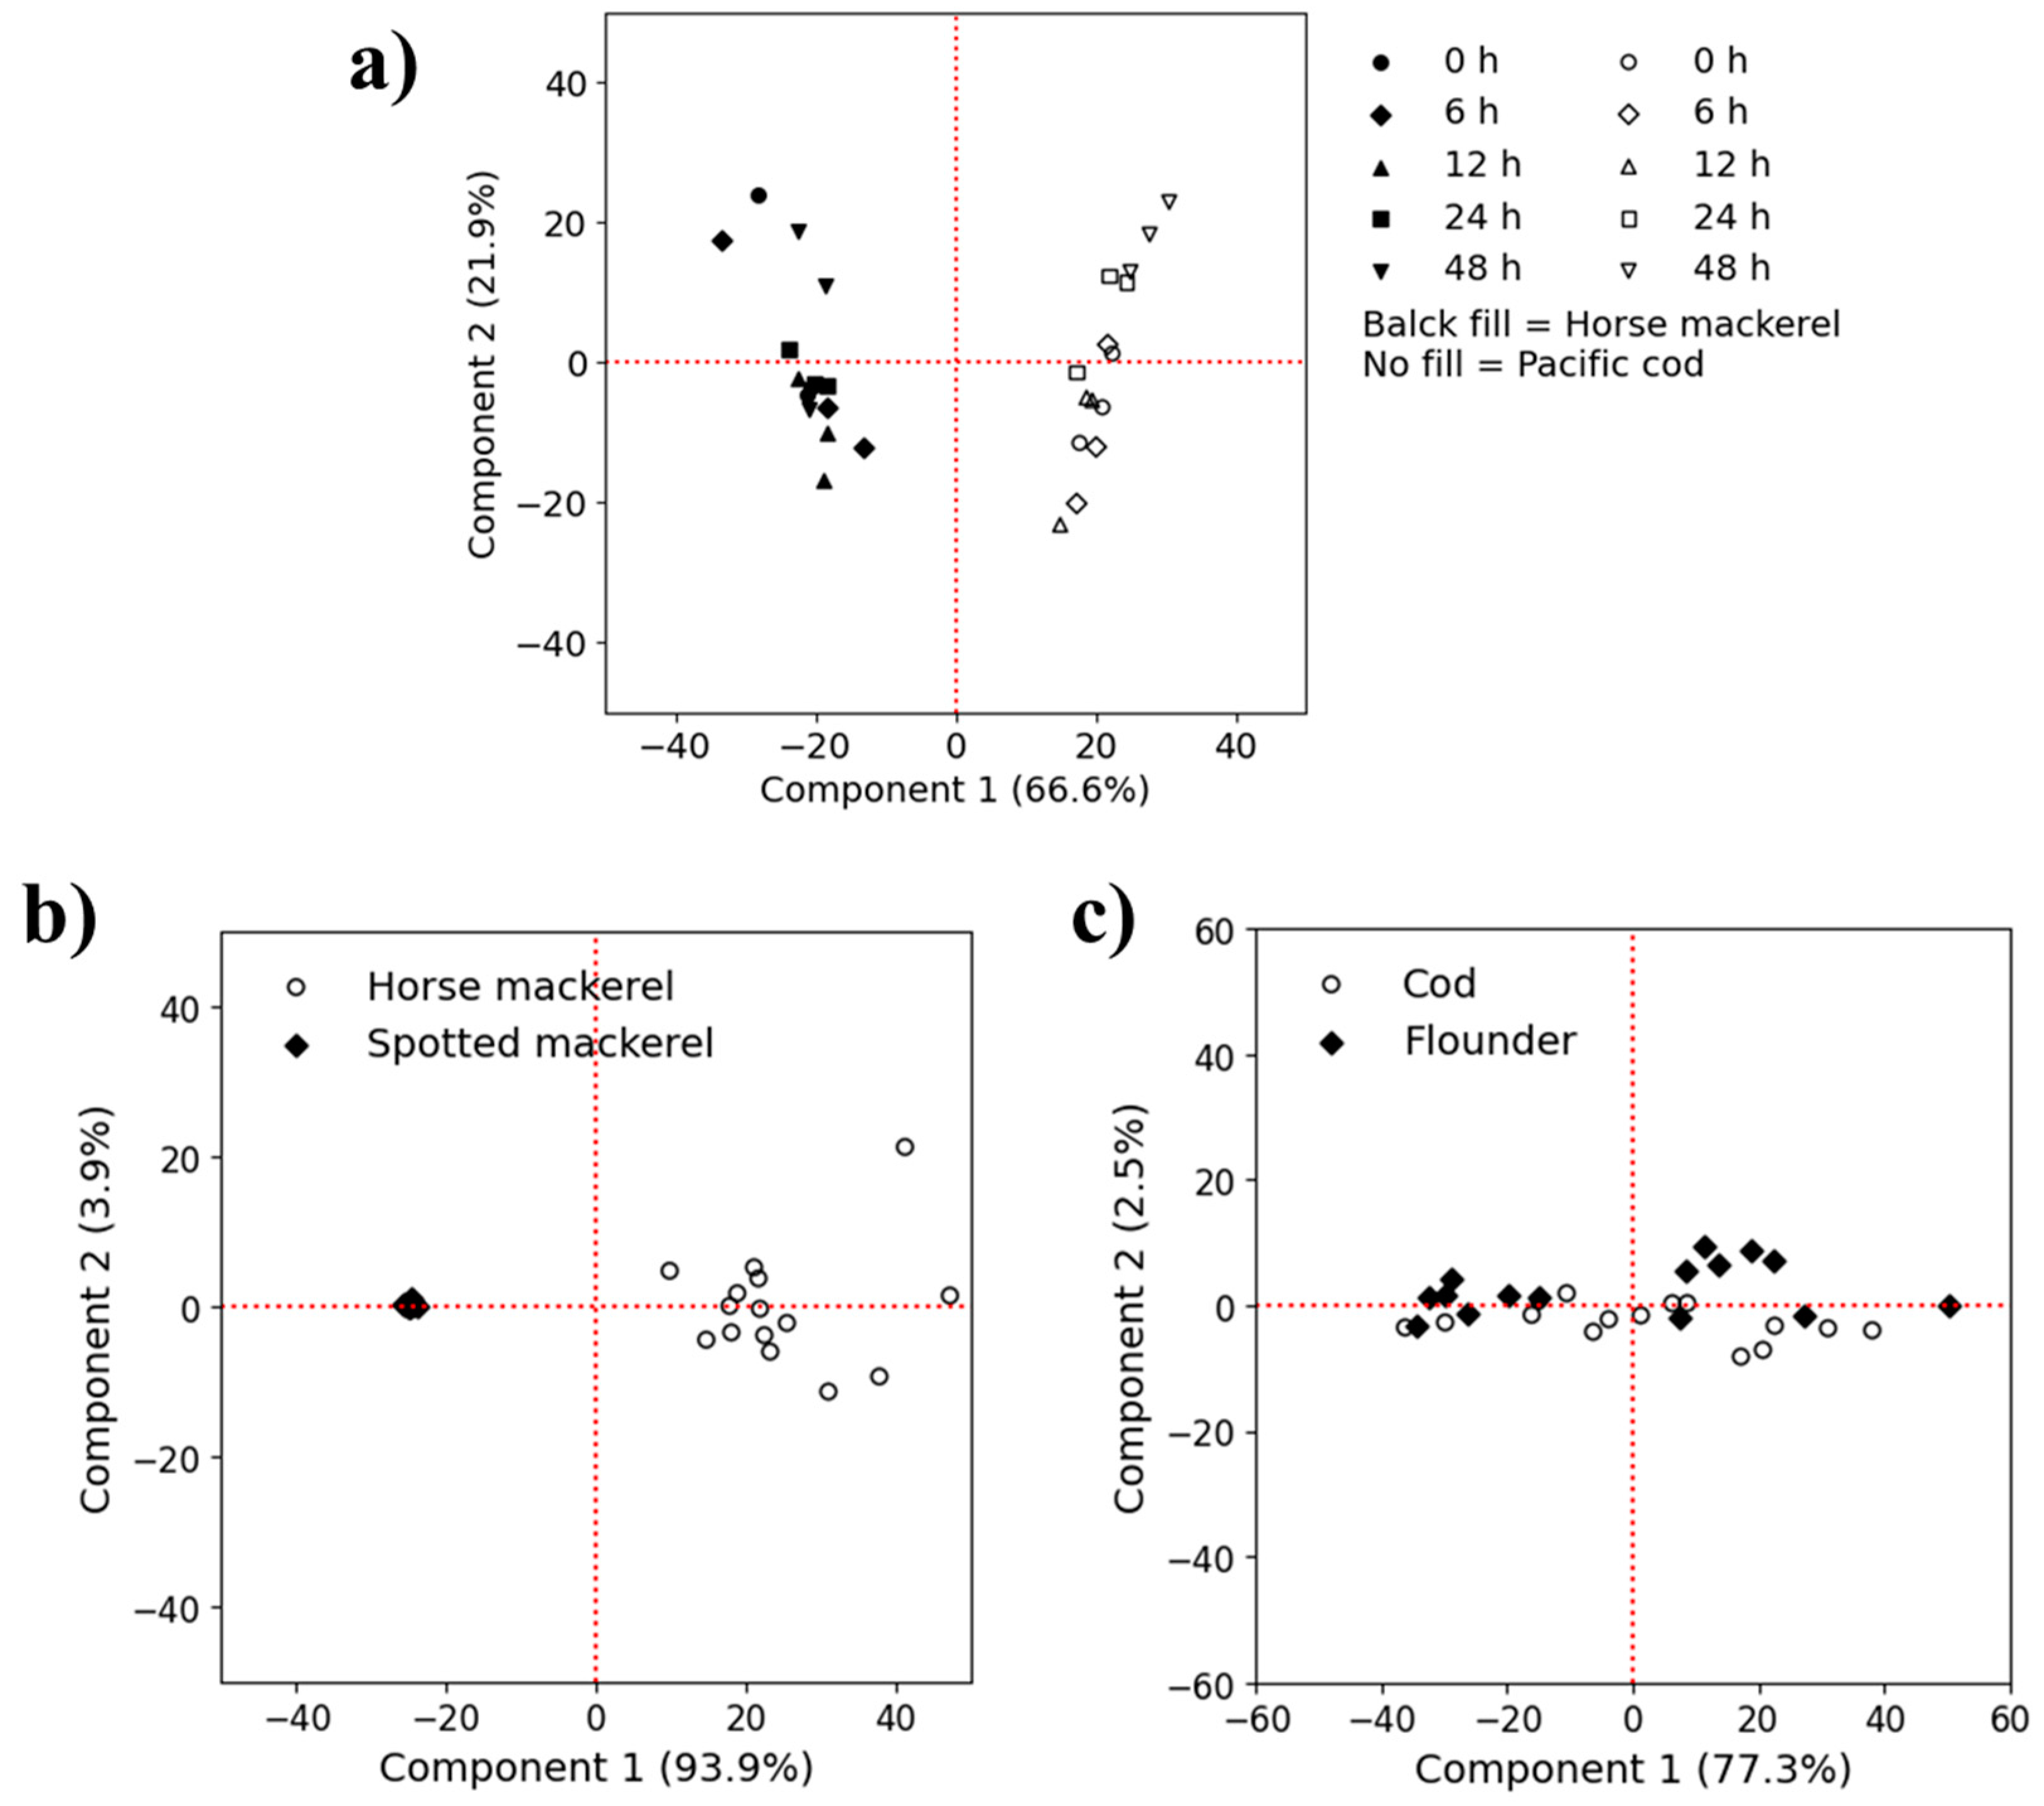
3.4. Classification of Frozen Fish Meat Based on EEM Data

Figure 7 shows the PCA score plot produced from the EEMs of all four frozen fish samples. Principal component 1 (PC1) differentiated the EEM spectra of cod and flounder from spotted mackerel and horse mackerel clearly: PC1 accounted for 57.7% of the variance out of 94.1% total variance (PC1 + PC2); PC2 discriminated horse mackerel samples from spotted mackerel samples.

3.5. Discrimination of Frozen Fish Meat Based on Muscle Properties Using EEM Data

Figure 8a presents the PCA score plots obtained from the EEMs of horse mackerel and Pacific cod samples. Results show that PC1 differentiated the EEM spectra of cod from horse mackerel, accounting for 66.6% of the total variance.
Figure 8b,c depicts discrimination between fish meats that are subjected to camouflage. The PCA score plots produced from the EEMs of two mackerel species exhibit differences, even though they are both red meat fish (Figure 8b). The EEM spectra of two white fish species (flounder and cod) were also differentiated by PCA score plotting, as shown in Figure 8c. Many factors are related to these forms of discrimination, and one of them, the pattern of freshness changes, was revealed through chemical analysis. Consequently, the nondestructive EEM spectra show good potential to authenticate fish meat, even in a frozen state.

4. Discussion

4.1. Experiment 1: Chemical Analysis and PCA for Differentiating Fresh and Frozen–Thawed Spotted Mackerel Meat

ATP content in fresh spotted mackerel meat was initially higher than in frozen–thawed meat but dropped significantly within 6 h of ice storage and remained low throughout the 40-h period, indicating rapid ATP loss shortly after death. These changes occurred in raw meat because of cold shortening by rapid cooling in ice [22]. However, the ATP content was stable at around 0.15 µmol/g for all frozen–thawed meat that had been ice-stored previously for 0–40 h. That stable content is attributable to the progress of rigor mortis during the thawing of the fillet. Because the content of ATP in the fish body is instantly depleted from the fish within a few hours after death [23], its content was used as a good parameter to distinguish newly caught fish from frozen–thawed fish.
IMP content, which enhances umami flavor, was initially higher in frozen–thawed spotted mackerel meat than in fresh meat. IMP levels increased gradually for both, peaking at 10.55 µmol/g in fresh meat after 40 h of ice storage and at 11.88 µmol/g in frozen–thawed meat after 6 h. This finding indicates that IMP accumulation in frozen–thawed meat was higher than in fresh fillets. The IMP degradation occurred more rapidly in frozen–thawed fillets, which revealed a higher accumulation of HxR and Hx.
The K-value, indicating freshness, increased slowly in fresh spotted mackerel meat from 0.56% to 8.71% over 40 h of ice storage. In contrast, the frozen–thawed meat had a higher initial K-value of 5.13%, rising to 15.29% after 40 h. Higher K-values observed in frozen–thawed fillets might be attributable to a faster catabolic rate of ATP and to a rather more rapid decomposition of IMP than in fresh fillets that were stimulated by thawing processes. Furthermore, the higher values were attributable to the degradation of proteins as well as hydrolysis and peroxidation of lipids caused by endogenous enzymes exerted during thawing. Even though the post-mortem ice storage period was short, microbial activity might be generated in frozen–thawed fillets: that microbial activity is presumed to be the main cause of freshness degradation [24]. Consequently, K-values enable clarification of differentiation between fresh and frozen–thawed fish, irrespective of post-mortem ice storage.
The pH of fresh spotted mackerel meat started at around 6.65 and gradually decreased over the ice storage period, which was slightly lower than that reported in a study of the same fish species by Ogata et al. [25]. This difference might have occurred because of the ante-mortem and post-mortem handling of the samples. The variations in the initial pH could be due to multiple factors, including species, season, diet, production system, activity level, and muscle type [5,26].
After 6 h of ice storage, the pH of fresh spotted mackerel fillets dropped to 6.03, continuing to decrease gradually to below 6.0 (5.91–5.84) by 40 h, indicating a consistent decline throughout the storage period, which might be attributed to ATP degradation and lactic acid production and accumulation in fish muscle tissues [27].
The lowest pH of 5.77 was recorded in a frozen–thawed fish fillet stored immediately after death (0 h icing). Although there was a slight increase in pH over time, it remained below 6.06. The average pH of 40 h ice-stored and frozen–thawed fillets reached 5.87. Usually, pH levels rise during storage because of the creation of alkaline compounds such as ammonia and trimethylamine, which are produced by microbial or endogenous enzymatic processes [27]. However, the pH of frozen–thawed fillet of spotted mackerel was less than 6.0, suggesting that the freshness deterioration was triggered because of thawing. Nevertheless, the thawed meat retained good quality. The findings of this study were corroborated by reports of work by Karoui et al. [28].
The PC score plot of EEMs, where principal component 1 (PC1) effectively differentiates fresh from frozen–thawed meat, explained 91.4% of the total variance. Fresh meat samples show negative scores, while frozen–thawed samples have positive scores. This difference might be related to the concentrations of aromatic amino acids and NADH contents [29]. Moreover, the marked freshness variation (K-value) observed between fresh and frozen–thawed fish meat from the chemical analysis supported their discrimination. However, samples with different storage conditions were not differentiated by PC1 and even PC2. Additionally, a larger variation in PC2 was observed in the frozen–thawed samples, whereas no such effect was attributable to ice storage conditions. Although the fresh meat samples with 0 h storage differed from the other samples in terms of ATP, IMP, and pH levels (Figure 1, Figure 2 and Figure 4), they did not show distinct results in the PCA. This suggests that ATP, IMP, and pH were not significantly reflected in the fluorescence fingerprints within the range of the data measured in this study.

4.2. Experiment 2: Differentiation of Four Species by K-Value and PCA

Figure 6 presents changes in the K-values of different fish species that had undergone a 48 h ice storage period. In horse mackerel meat, the K-value increased very slowly from 0 h to 12 h (0.5–1.3%); after 24 h of ice storage, it reached around 2%. After 48 h, the K-value reached 4.4%. Consequently, the increase in K-values observed during the initial 48 h post-mortem was very slight. The loss in freshness during this period was attributable to catabolic reactions in nucleotides followed by protein degradation as well as hydrolysis and peroxidation of lipids caused by endogenous enzymes. During extended storage, microbial activity was inferred as the main cause of freshness degradation [25]. Because the freshness of the fish fillets in this study was monitored for a period of just 48 h of ice storage, the microbial deterioration in fish muscles was not yet triggered. As a result, the K-values recorded during this period were relatively low.
As a result of the PCA for four frozen fish samples, principal component 1 (PC1) clearly distinguished cod and flounder from spotted and horse mackerel, accounting for 57.7% of the variance (Figure 7). Principal component 2 (PC2) further differentiates horse mackerel from spotted mackerel samples. This finding can be attributed to their respective muscle properties and concentrations of ATP-related compounds, aromatic amino acids, and NADH contents [14,29].
In Figure 8, the PCA score plots of EEMs for horse mackerel and Pacific cod, with principal component 1 (PC1) differentiating the two species. This result is attributable to the muscle properties of these two marine species: the horse mackerel is a red meat fish, and the cod is a white meat fish. Therefore, their post-mortem metabolism and freshness conditions are completely different, contributing to the PC1. This phenomenon is supported by a recent study by Rahman et al. [14].

5. Conclusions

From HPLC analysis, the significantly higher K-values observed in frozen–thawed fillets might be attributable to the higher rate of IMP decomposition than that of fresh fillets. Both the ATP and IMP contents and the pH of fresh fillets stored for 0 h in ice, as obtained from chemical analysis, were found to be significantly different from products of other storage conditions. Oppositely, ATP, IMP, and pH of frozen–thawed fillets were not so influenced by the post-mortem ice storage period (0–40 h), but these freshness parameters were affected remarkably by thawing. Chemometric treatment, i.e., PCA of EEM spectra, demonstrated clear discrimination between fresh and frozen–thawed meat of fish fillet contributed. Further classification models of meat from different fish species demonstrated the good potential of EEM to detect species substitution in the fish market. Therefore, this new method could be used to monitor fishery product authenticity in fishery markets.

Author Contributions

Conceptualization, M.M.R., M.S. and E.O.; methodology, M.M.R., M.S. and M.N.A.R.; software, M.M.R. and M.S.; validation, M.M.R. and M.S.; formal analysis: M.M.R. and M.S.; investigation, M.M.R. and M.N.A.R.; resources, M.S. and E.O.; data curation, M.M.R. and M.N.A.R.; writing—original draft preparation, M.M.R. and M.S.; writing—review and editing, M.M.R., M.S. and E.O.; visualization, M.M.R. and M.S.; supervision, M.S. and E.O.; project administration, E.O.; funding acquisition, M.S. and E.O. All authors have read and agreed to the published version of the manuscript.

Funding

This research was funded by grants from the Project of the NARO Bio-oriented Technology.

Institutional Review Board Statement

Ethical review and approval were waived for this study due to the following reasons: The fish study was conducted at the Tokyo University of Marine Science and Technology (TUMSAT) in 2017. However, the TUMSAT regulation on fish experiments was established in March 2020, and there was no particular requirement to apply for fish research approval prior to that date. According to the present regulations, the ethical rules for fish experiments are the same as those for animal experiments, but the application is not obligatory and is voluntary.

Informed Consent Statement

Not applicable.

Data Availability Statement

Data underlying the results presented in this paper are not publicly available at this time but can be obtained from the authors upon reasonable request.

Acknowledgments

The authors would like to acknowledge the Ministry of Education, Culture, Sports, Science, and Technology (Monbukagakusho) of Japan for providing an FY2015 MEXT scholarship to the first author (Md. Mizanur Rahman) for pursuing his study in Japan. The authors are also grateful to Naho Nakazawa, Professor Tomoaki Hagiwara, and Professor Kazufumi Osako from the Tokyo University of Marine Science and Technology for facilitating the study by providing lab equipment.

Conflicts of Interest

The authors declare no conflicts of interest.

References

  1. Alamprese, C.; Casiraghi, E. Application of FT-NIR and FT-IR spectroscopy to fish fillet authentication. LWT 2015, 63, 720–725. [Google Scholar] [CrossRef]
  2. Ottavian, M.; Fasolato, L.; Serva, L.; Facco, P.; Barolo, M. Data Fusion for Food Authentication: Fresh/Frozen–Thawed Discrimination in West African Goatfish (Pseudupeneus prayensis) Fillets. Food Bioprocess Technol. 2014, 7, 1025–1036. [Google Scholar] [CrossRef]
  3. Ganapathiraju, P.; Pitcher, T.J.; Mantha, G. Estimates of illegal and unreported seafood imports to Japan. Mar. Policy 2019, 108, 103439. [Google Scholar] [CrossRef]
  4. Ethuin, P.; Marlard, S.; Delosière, M.; Carapito, C.; Delalande, F.; Van Dorsselaer, A.; Dehaut, A.; Lencel, V.; Duflos, G.; Grard, T. Differentiation between fresh and frozen–thawed sea bass (Dicentrarchus labrax) fillets using two-dimensional gel electrophoresis. Food Chem. 2015, 176, 294–301. [Google Scholar] [CrossRef]
  5. Hong, H.; Luo, Y.; Zhou, Z.; Bao, Y.; Lu, H.; Shen, H. Effects of different freezing treatments on the biogenic amine and quality changes of bighead carp (Aristichthys nobilis) heads during ice storage. Food Chem. 2013, 138, 1476–1482. [Google Scholar] [CrossRef]
  6. Kashikura, H.; Yagi, M.; Nakamura, Y.; Sakai, A.; Takahashi, K.; Hiratsuka, S.; Goto, K. Correlation Between Sensory Characteristics and Physicochemical Properties of Wild and Farmed Frozen Southern Bluefin Tuna (Thunnus maccoyii). Fishes 2024, 9, 473. [Google Scholar] [CrossRef]
  7. Shokralla, S.; Hellberg, R.S.; Handy, S.M.; King, I.; Hajibabaei, M. A DNA Mini-Barcoding System for Authentication of Processed Fish Products. Sci. Rep. 2015, 5, 15894. [Google Scholar] [CrossRef]
  8. Shehata, H.R.; Naaum, A.M.; Garduño, R.A.; Hanner, R. DNA barcoding as a regulatory tool for seafood authentication in Canada. Food Control 2018, 92, 147–153. [Google Scholar] [CrossRef]
  9. Adibah, A.B.; Syazwan, S.; Haniza Hanim, M.Z.; Badrul Munir, M.Z.; Intan Faraha, A.G.; Siti Azizah, M.N. Evaluation of DNA barcoding to facilitate the authentication of processed fish products in the seafood industry. LWT 2020, 129, 109585. [Google Scholar] [CrossRef]
  10. Carrera, E.; Terni, M.; Montero, A.; García, T.; González, I.; Martín, R. ELISA-based detection of mislabeled albacore (Thunnus alalunga) fresh and frozen fish fillets. Food Agric. Immunol. 2014, 25, 569–577. [Google Scholar] [CrossRef]
  11. Rahman, M.M.; Shibata, M.; Nakazawa, N.; Rithu, M.N.A.; Nakauchi, S.; Hagiwara, T.; Osako, K.; Okazaki, E. Non-destructive Approach for the Prediction of pH in Frozen Fish Meat Using Fluorescence Fingerprints in Tandem with Chemometrics. Fishes 2022, 7, 364. [Google Scholar] [CrossRef]
  12. Rahman, M.M.; Nakazawa, N.; Shibata, M.; Nakauchi, S.; Okazaki, E. Prospect of fluorescence fingerprints for the noninvasive sensing of seafood freshness: A review. Fish. Sci. 2024, 90, 339–356. [Google Scholar] [CrossRef]
  13. Liao, Q.; Suzuki, T.; Yasushi, K.; Al Riza, D.F.; Kuramoto, M.; Kondo, N. Monitoring Red Sea Bream Scale Fluorescence as a Freshness Indicator. Fishes 2017, 2, 10. [Google Scholar] [CrossRef]
  14. Rahman, M.M.; Shibata, M.; Nakazawa, N.; Rithu, M.N.A.; Okazaki, E.; Nakauchi, S. Potential of fluorescence fingerprints for fish meat authentication: Differences in freshness evaluation in white and dark meat at frozen state. J. Food Sci. 2023, 88, 5339–5354. [Google Scholar] [CrossRef] [PubMed]
  15. Eaton, J.K.; Alcivar-Warren, A.; Kenny, J.E. Multidimensional Fluorescence Fingerprinting for Classification of Shrimp by Location and Species. Environ. Sci. Technol. 2012, 46, 2276–2282. [Google Scholar] [CrossRef]
  16. Hassoun, A.; Karoui, R. Front-face fluorescence spectroscopy coupled with chemometric tools for monitoring fish freshness stored under different refrigerated conditions. Food Control 2015, 54, 240–249. [Google Scholar] [CrossRef]
  17. Ehira, S.; Uchiyama, H. Determination of fish freshness using K value and comments on some other biochemical changes in relation to freshness. In Sea Food Quality Determination; Kramer, D.E., Liston, J.C., Eds.; Elesevier Science Publisher: Amsterdam, The Netherlands, 1987; pp. 185–207. [Google Scholar]
  18. Maeda, T.; Yuki, A.; Sakurai, H.; Watanabe, K.; Itoh, N.; Inui, E.; Seike, K.; Mizukami, Y.; Fukuda, Y.; Harada, K. Alcohol Brine Freezing of Japanese Horse Mackerel (Trachurus japonicus) for Raw Consumption. Trans. Jpn. Soc. Refrig. Air Cond. Eng. 2007, 24, 323–330. [Google Scholar] [CrossRef]
  19. Saito, T.; Arai, K.; Matsuyoshi, M. A New Method for Estimating the Freshness of Fish. Bull. Jpn. Soc. Sci. Fish. 1959, 24, 749–750. [Google Scholar] [CrossRef]
  20. Howgate, P. Kinetics of degradation of adenosine triphosphate in chill-stored rainbow trout (Oncorhynchus mykiss). Int. J. Food Sci. Technol. 2005, 40, 579–588. [Google Scholar] [CrossRef]
  21. Tomioka, K.; Endo, K. K Value-Increasing Rates and IMP-Degrading Activities in Various Fish Muscles. Nippon. Suisan Gakaishi 1984, 50, 889–892. [Google Scholar] [CrossRef]
  22. Ushio, H.; Watabe, S.; Iwamoto, M.; Hashimoto, K. Ultrastructural Evidence for Temperature-Dependent Ca2+ Release from Fish Sarcoplasmic Reticulum During Rigor Mortis. Food Struct. 1991, 10, 267–275. [Google Scholar]
  23. Korhonen, R.W.; Lanier, T.C.; Giesbrecht, F. An Evaluation of Simple Methods for Following Rigor Development in Fish. J. Food Sci. 1990, 55, 346–348. [Google Scholar] [CrossRef]
  24. Ghaly, A.E.; Dave, D.; Budge, S.; Brooks, M.S. Fish Spoilage Mechanisms and Preservation Techniques: Review. Am. J. Appl. Sci. 2010, 7, 859–877. [Google Scholar] [CrossRef]
  25. Ogata, Y.; Koike, H.; Kimura, I.; Yuan, C. Delaying Post-mortem Changes in the Muscle of Spotted Mackerel Killed by an Instantaneous Way of Neck-breaking and Bleeding. J. FisheriesSciences.com 2016, 10, 83–88. [Google Scholar]
  26. Cai, L.; Wu, X.; Li, X.; Zhong, K.; Li, Y.; Li, J. Effects of different freezing treatments on physicochemical responses and microbial characteristics of Japanese sea bass (Lateolabrax japonicas) fillets during refrigerated storage. LWT 2014, 59, 122–129. [Google Scholar] [CrossRef]
  27. Lougovois, V.P.; Kyranas, E.R.; Kyrana, V.R. Comparison of selected methods of assessing freshness quality and remaining storage life of iced gilthead sea bream (Sparus aurata). Food Res. Int. 2003, 36, 551–560. [Google Scholar] [CrossRef]
  28. Karoui, R.; Hassoun, A.; Ethuin, P. Front face fluorescence spectroscopy enables rapid differentiation of fresh and frozen-thawed sea bass (Dicentrarchus labrax) fillets. J. Food Eng. 2017, 202, 89–98. [Google Scholar] [CrossRef]
  29. Karoui, R.; Thomas, E.; Dufour, E. Utilisation of a rapid technique based on front-face fluorescence spectroscopy for differentiating between fresh and frozen–thawed fish fillets. Food Res. Int. 2006, 39, 349–355. [Google Scholar] [CrossRef]
Figure 1. ATP contents in fresh and frozen–thawed spotted mackerel meat stored in ice for 0–40 h (n = 3).
Fishes 09 00500 g001
Figure 2. IMP contents of fresh and frozen–thawed spotted mackerel meat after storage in ice for 0–40 h (n = 3).
Fishes 09 00500 g002
Figure 3. K-value changes in fresh and frozen–thawed spotted mackerel meat previously stored in ice for 0–40 h (n = 3).
Fishes 09 00500 g003
Figure 4. pH changes in fresh and frozen–thawed spotted mackerel meat stored in ice for 0–40 h (n = 3).
Fishes 09 00500 g004
Figure 5. Principal component score plot for EEMs of fresh and frozen–thawed meat ice stored for 0–40 h. Replicates are represented with equal symbols. Closed and open symbols of the same shape, respectively, represent fresh and frozen–thawed meat with the same ice storage period. Different shapes represent different post-mortem ice storage periods.
Fishes 09 00500 g005
Figure 6. Variations in fish freshness during ice storage periods (0–48 h).
Fishes 09 00500 g006
Figure 7. Principal component analyses (PCA) of EEMs of all four frozen fish species that had been stored in ice for 0–48 h.
Fishes 09 00500 g007
Figure 8. Principal component analyses (PCA) of EEMs of marine fish fillets (frozen) that had been ice-stored for 0–48 h: (a) discrimination between red meat and white meat fish; (b,c) discrimination between species that had been subjected to camouflage.
Fishes 09 00500 g008
Disclaimer/Publisher’s Note: The statements, opinions and data contained in all publications are solely those of the individual author(s) and contributor(s) and not of MDPI and/or the editor(s). MDPI and/or the editor(s) disclaim responsibility for any injury to people or property resulting from any ideas, methods, instructions or products referred to in the content.

