Article

Temporal and Spatial Distribution Characteristics of Fish Resources in a Typical River–Lake Confluence Ecosystem During the Initial Period of Fishing Ban

1
Pearl River Fisheries Research Institute, Chinese Academy of Fishery Sciences, Guangzhou 510380, China
2
Key Laboratory of Aquatic Animal Immune Technology of Guangdong Province, Guangzhou 510380, China
3
Guangzhou Scientific Observing and Experimental Station of National Fisheries Resources and Environment, Guangzhou 510380, China
4
Beijing Central Ring Geyi Technology Consultation Co., Ltd., Beijing 100041, China
5
Fishery Resources and Environmental Science Experimental Station of the Upper-Middle Reaches of Yangtze River, Ministry of Agriculture and Rural Affairs, Yangtze River Fisheries Research Institute, Chinese Academy of Fishery Science, Wuhan 430223, China
6
Department of agriculture and Rural Affairs of Jiangxi Province, Nanchang 330000, China
*
Author to whom correspondence should be addressed.
Fishes 2024, 9(12), 492; https://doi.org/10.3390/fishes9120492
Submission received: 20 September 2024 / Revised: 28 November 2024 / Accepted: 29 November 2024 / Published: 30 November 2024
(This article belongs to the Special Issue Underwater Acoustic Technologies for Sustainable Fisheries)

Abstract

This study provides a comprehensive analysis of the spatio-temporal dynamics of fish resources in the confluence waters of Poyang Lake and the Yangtze River, focusing on the initial phase of a 10-year fishing ban implemented in January 2020. Through hydroacoustic surveys conducted during both high-water (September 2020) and low-water (January 2021) periods, we identified significant variations in fish density and individual size across different sections. During the high water level period, fish concentrations were primarily observed in the confluence area between the Yangtze River and Poyang Lake, exhibiting higher densities compared to other regions. Conversely, fish congregated in the deep-water zones of the main river during the low water level period. The fish population was dominated by small to medium-sized individuals, with mean body lengths of 12.47 cm and 12.62 cm during the high and low water level periods, respectively. Notably, 42 and 33 fish species were recorded during the high-water and low-water surveys, respectively, emphasizing the region’s rich biodiversity. Importantly, the study demonstrates that the fishing ban has resulted in substantial increases in both fish density and mean body length, underscoring its effectiveness in fostering fish population recovery. These findings provide critical baseline data to inform scientific conservation and management strategies in this ecologically sensitive river–lake ecosystem.
Key Contribution: This study provides novel insights into the temporal and spatial distribution of fish resources in a river–lake confluence ecosystem during the initial phase of a fishing ban. The findings reveal significant increases in fish density and average body length, demonstrating the ban’s effectiveness in fostering fish population recovery and underscoring the importance of conservation efforts in such ecologically sensitive areas.

1. Introduction

The confluence of Poyang Lake and the Yangtze River serves as a transition zone between its midstream and downstream [1,2]. This extensive river segment, spanning approximately 151.9 km in length, exemplifies an abundance of water resources and a diverse array of habitats, thereby creating highly conducive ecological conditions for the proliferation and development of aquatic organisms [3]. Naturally connected to Poyang Lake, the confluence area facilitates the completion of fish life cycles by offering various habitats. The main channel serves as a migration route for essential economic fish species such as the four major Chinese carps, and it is also a feeding ground for most settled cyprinid fish species [4,5], and seasonal flooding results in distinct fish distribution patterns between the main channel and the Yangtze River main stream [6]. However, recent years have witnessed increasing human water-related activities, leading to a deteriorating situation of fish resources in the confluence area, which connects the main channel of Poyang Lake and the Yangtze River. These issues include a decline in fish species diversity, a shift towards smaller and younger individuals, and homogenization of the fish community structure [7,8].
In January 2020, the Ministry of Agriculture and Rural Affairs announced the implementation of a “10-year fishing ban” in key water areas of the Yangtze River basin. Rapidly assessing the distribution of fishery resources under this comprehensive fishing ban has become a current research focus. Currently, there is a dearth of research utilizing acoustic techniques to evaluate fish resources in the confluence of Poyang Lake and the Yangtze River. There are only a few studies evaluating the fish resources in a single habitat of Poyang Lake or the Yangtze River, such as the significant recovery of Coilia nasus populations in the Poyang Lake after the fishing ban, and the improvement of miniaturization trends [9,10]. With traditional survey methods facing limitations, acoustic assessment techniques have gradually been adopted in the main stream of the Yangtze River and lakes [11,12]. These methods enable rapid and accurate monitoring of fishery resources without damaging the fish population. Against this backdrop, this study conducted acoustic surveys in the main stream of the Yangtze River in the Jiujiang section and the connecting channel in the Poyang Lake during the initial stages of the fishing ban in September 2020 and January 2021. These surveys analyzed the distribution characteristics of fish resources during both the high and low water level period, aiming to provide baseline data for the implementation of the fishing ban policy and inform scientific conservation and management efforts for fish resources in the confluence of the Poyang Lake and the Yangtze River.

2. Materials and Methods

2.1. Study Area and Procedures

The Jiujiang section of the Yangtze River spans from Fuxingzhou sandbar to Mianchuanzhou sandbar, with a total length of approximately 151.9 km. This section serves as a transition zone between the middle and lower reaches of the Yangtze River. The confluence is naturally connected to Poyang Lake and the Yangtze River, forming a complex ecosystem that integrates rivers and lakes [13]. For the purpose of comprehensively analyzing the temporal and spatial distribution characteristics of fish resources in the confluence of Poyang Lake and the Yangtze River, we divided the hydroacoustic detection area into three distinct regions based on the characteristics of the river sections. Section A covers the stretch from Fuxingzhou sandbar to the entrance of Poyang Lake in the main stream of the Yangtze River, spanning approximately 50 km. Section B extends from the Zhangjiazhou sandbar to the Mianchuan sandbar, with a length of roughly 56 km. Lastly, Section C encompasses the area from the entrance of Poyang Lake in Hukou County to Pingfeng waters, covering approximately 30 km (Figure 1).
In each sampling section, catches were obtained by fishing with various nets. Each evening (18:00–06:00), fixed gillnets that were 20 mm in size were deployed between 15 and 30 m offshore. During the daytime, from 6:00 to 18:00, drift nets that were 50 and 70 mm in size were employed in the deep-water area. Hydroacoustic data were collected, combined with the catch surveying in various sections with different niches (such as backwaters, pools, etc.) using different types of nets. The phylogenetic categorization of fish was completed as Chen [14]. Anesthesia was administered to the fish using MS-222 (Sigma Aldrich Chemical Co., St. Louis, USA), and each species’ body length was measured in millimeters. Fish species safeguarded by the Chinese government and those threatened species on the lUCN (International Union for the Conservation of Nature and Natural Resources) and CITES (Convention on International Trade in Endangered Species of Wild Fauna and Flora) lists were reintroduced back into the water.
In this study, we conducted hydroacoustic surveys during September 2020 and January 2021, along with two different water periods (Figure 1) in the Yangtze River basin using a calibrated SIMRAD EY60 system. The system’s working power was 300 W, its pulse width was 64 μs, and its transducer frequency was 200 kHz with an angle of 7° at −3 dB. The transducer was installed on the front of the boat at a depth of 0.5 m under the water surface, with a navigation speed of 8–10 km/h. The GPS data were gathered using a GPS receiver (Garmin, Taiwan, China), and the instrument was calibrated using a tungsten–copper metal ball with a diameter of 13.7 mm before starting the investigation [15]. Throughout the detection process, the TS threshold was adjusted to −70 dB, representing the minimum setting that effectively minimized noise interference in the echogram. The pulse interval was 5 ping/s. Through observation of the echogram, it was found that the fish density in the survey area was low and most individual echoes did not overlap, thus the echo counting method was adopted. The other parameters are referenced in Supplementary Table S1. All detection activities were conducted during daylight hours, specifically, from 8:30 to 16:30. The degree of coverage values for each study was determined using Formula (1) [16], in which Λ is the coverage value, L represents the total length of acoustic transects, and A is the studied area. The results varied from 12 to 15. These coverage values were above the minimum recommendations noted in the literature [17,18].
Λ = D / A

2.2. Data Processing and Transformation

The dataset incorporated for analysis encompassed the range from 1 m beneath the water surface to 0.5 m above the riverbed. Before processing the data, we first made a judgment based on the overall acoustic characteristics of the fish. We observed that the fish density in the survey area was low, and most individual echoes did not overlap. Therefore, we decided to use the echo counting method in our study. A comprehensive four-step procedure was implemented to identify targets [17]. Initially, file transformation was executed, where raw data files (.raw) were converted into the .uuu format using the converter tool within Sonar5-Pro software (Kongsberg Maritime Inc., Horten, Norway) [18]. Subsequently, bottom detection was carried out using an image analysis detector to delineate the riverbed in each file. Manual adjustments were then made to refine the detected riverbed line. In the third stage, target tracking was performed to detect individual targets, with optimal parameter configurations applied. Lastly, track filtering was applied to the acquired fish-basket dataset to sieve out targets based on specific criteria, and the targets with No. Echoes greater than 4, Max Ping Gap equals 2 pings, and Gating Range equals 0.3 m. The population density of mature individuals was subsequently estimated using the following formula:
Density = target number/survey volume.
Survey volume = 0.5 × (2 × H × tan3.5° × H) × sampling pings × 0.42,
TS = 25.76 Log TL − 105.32,
According to the calculation empirical Formula (2), the number of the target was acquired through the aforementioned procedure. The quantity of water in the investigation was determined by modeling it as a triangular prism, employing the subsequent mathematical expression. According to the calculation empirical Formula (3), where H denotes the mean water depth throughout the sampling duration, the constant value of 0.42 has been derived from the mean vessel velocity of 9 km per hour, signifying the average distance traversed by the vessel in response to a single ping. Since the fish population in Poyang Lake is predominantly composed of carps, we employ the carp-specific regression formula developed by Frouzova et al. as Formula (4) [19], where TL denotes the total length in millimeters.
In this study, the survey routes during both the high and low water level periods were largely consistent, with each being divided into 1 km segments. The fish density in each segment was calculated, and these density values along with their respective coordinate data were imported into ArcGIS. The Inverse Distance Weighting (IDW) method was then used for interpolation to generate a horizontal distribution map of fish density in this river section [20]. When analyzing the spatial distribution characteristics of fish, non-parametric tests were conducted using SPSS to analyze the target strength and density of fish in different river sections and periods.

3. Results

3.1. Fish Target Strength and Spatial Distribution Characteristics

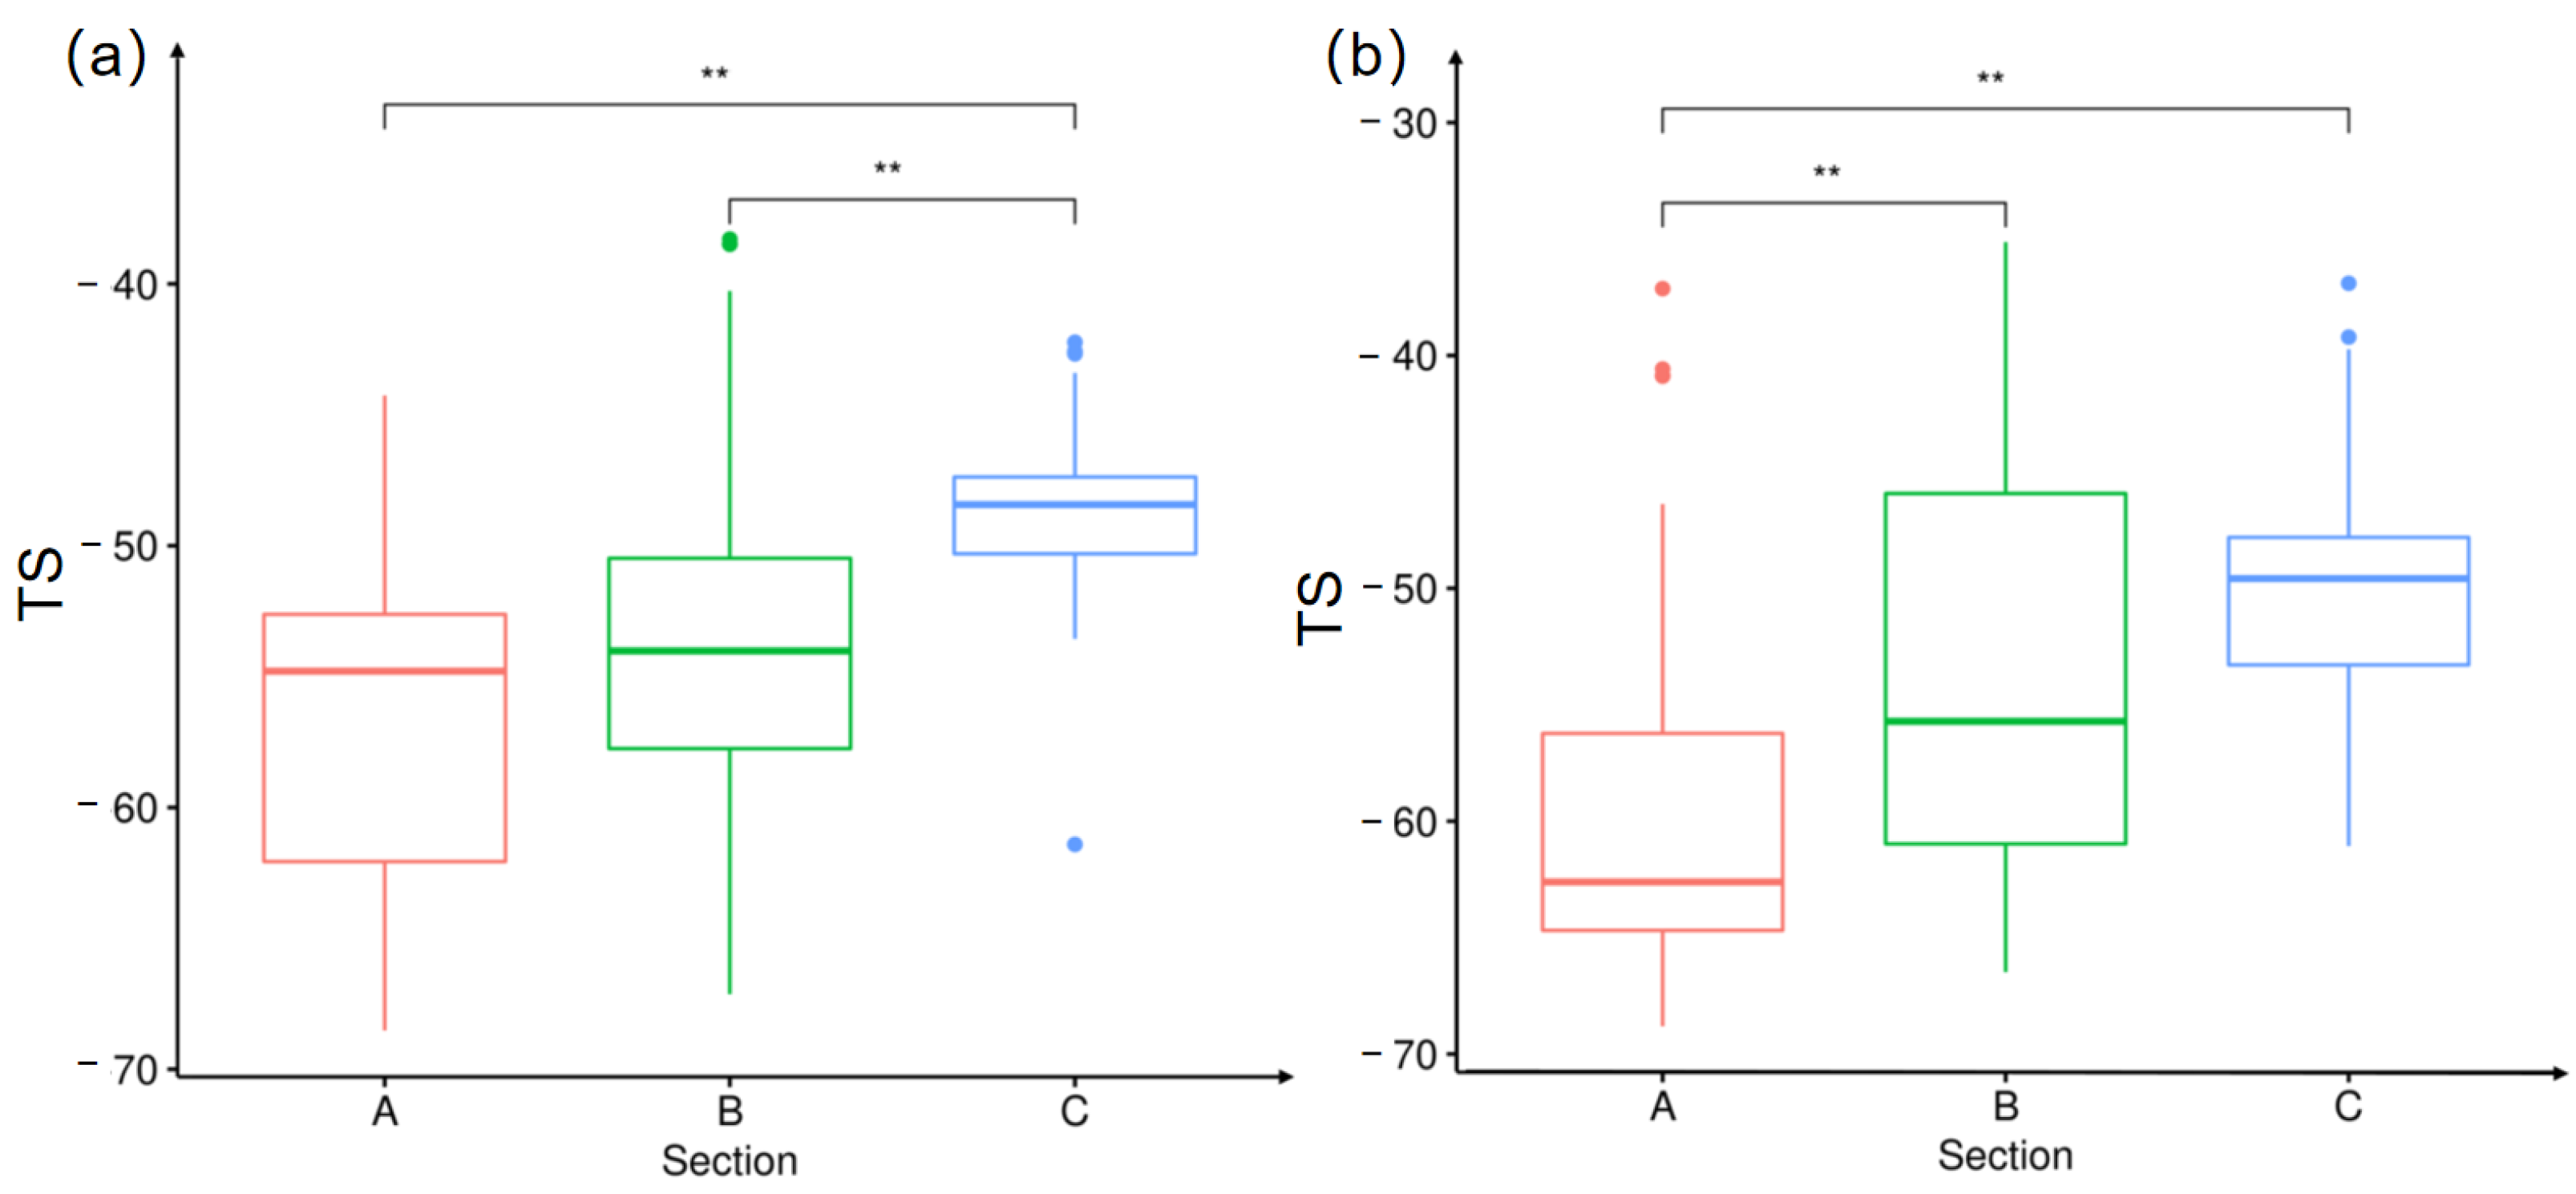
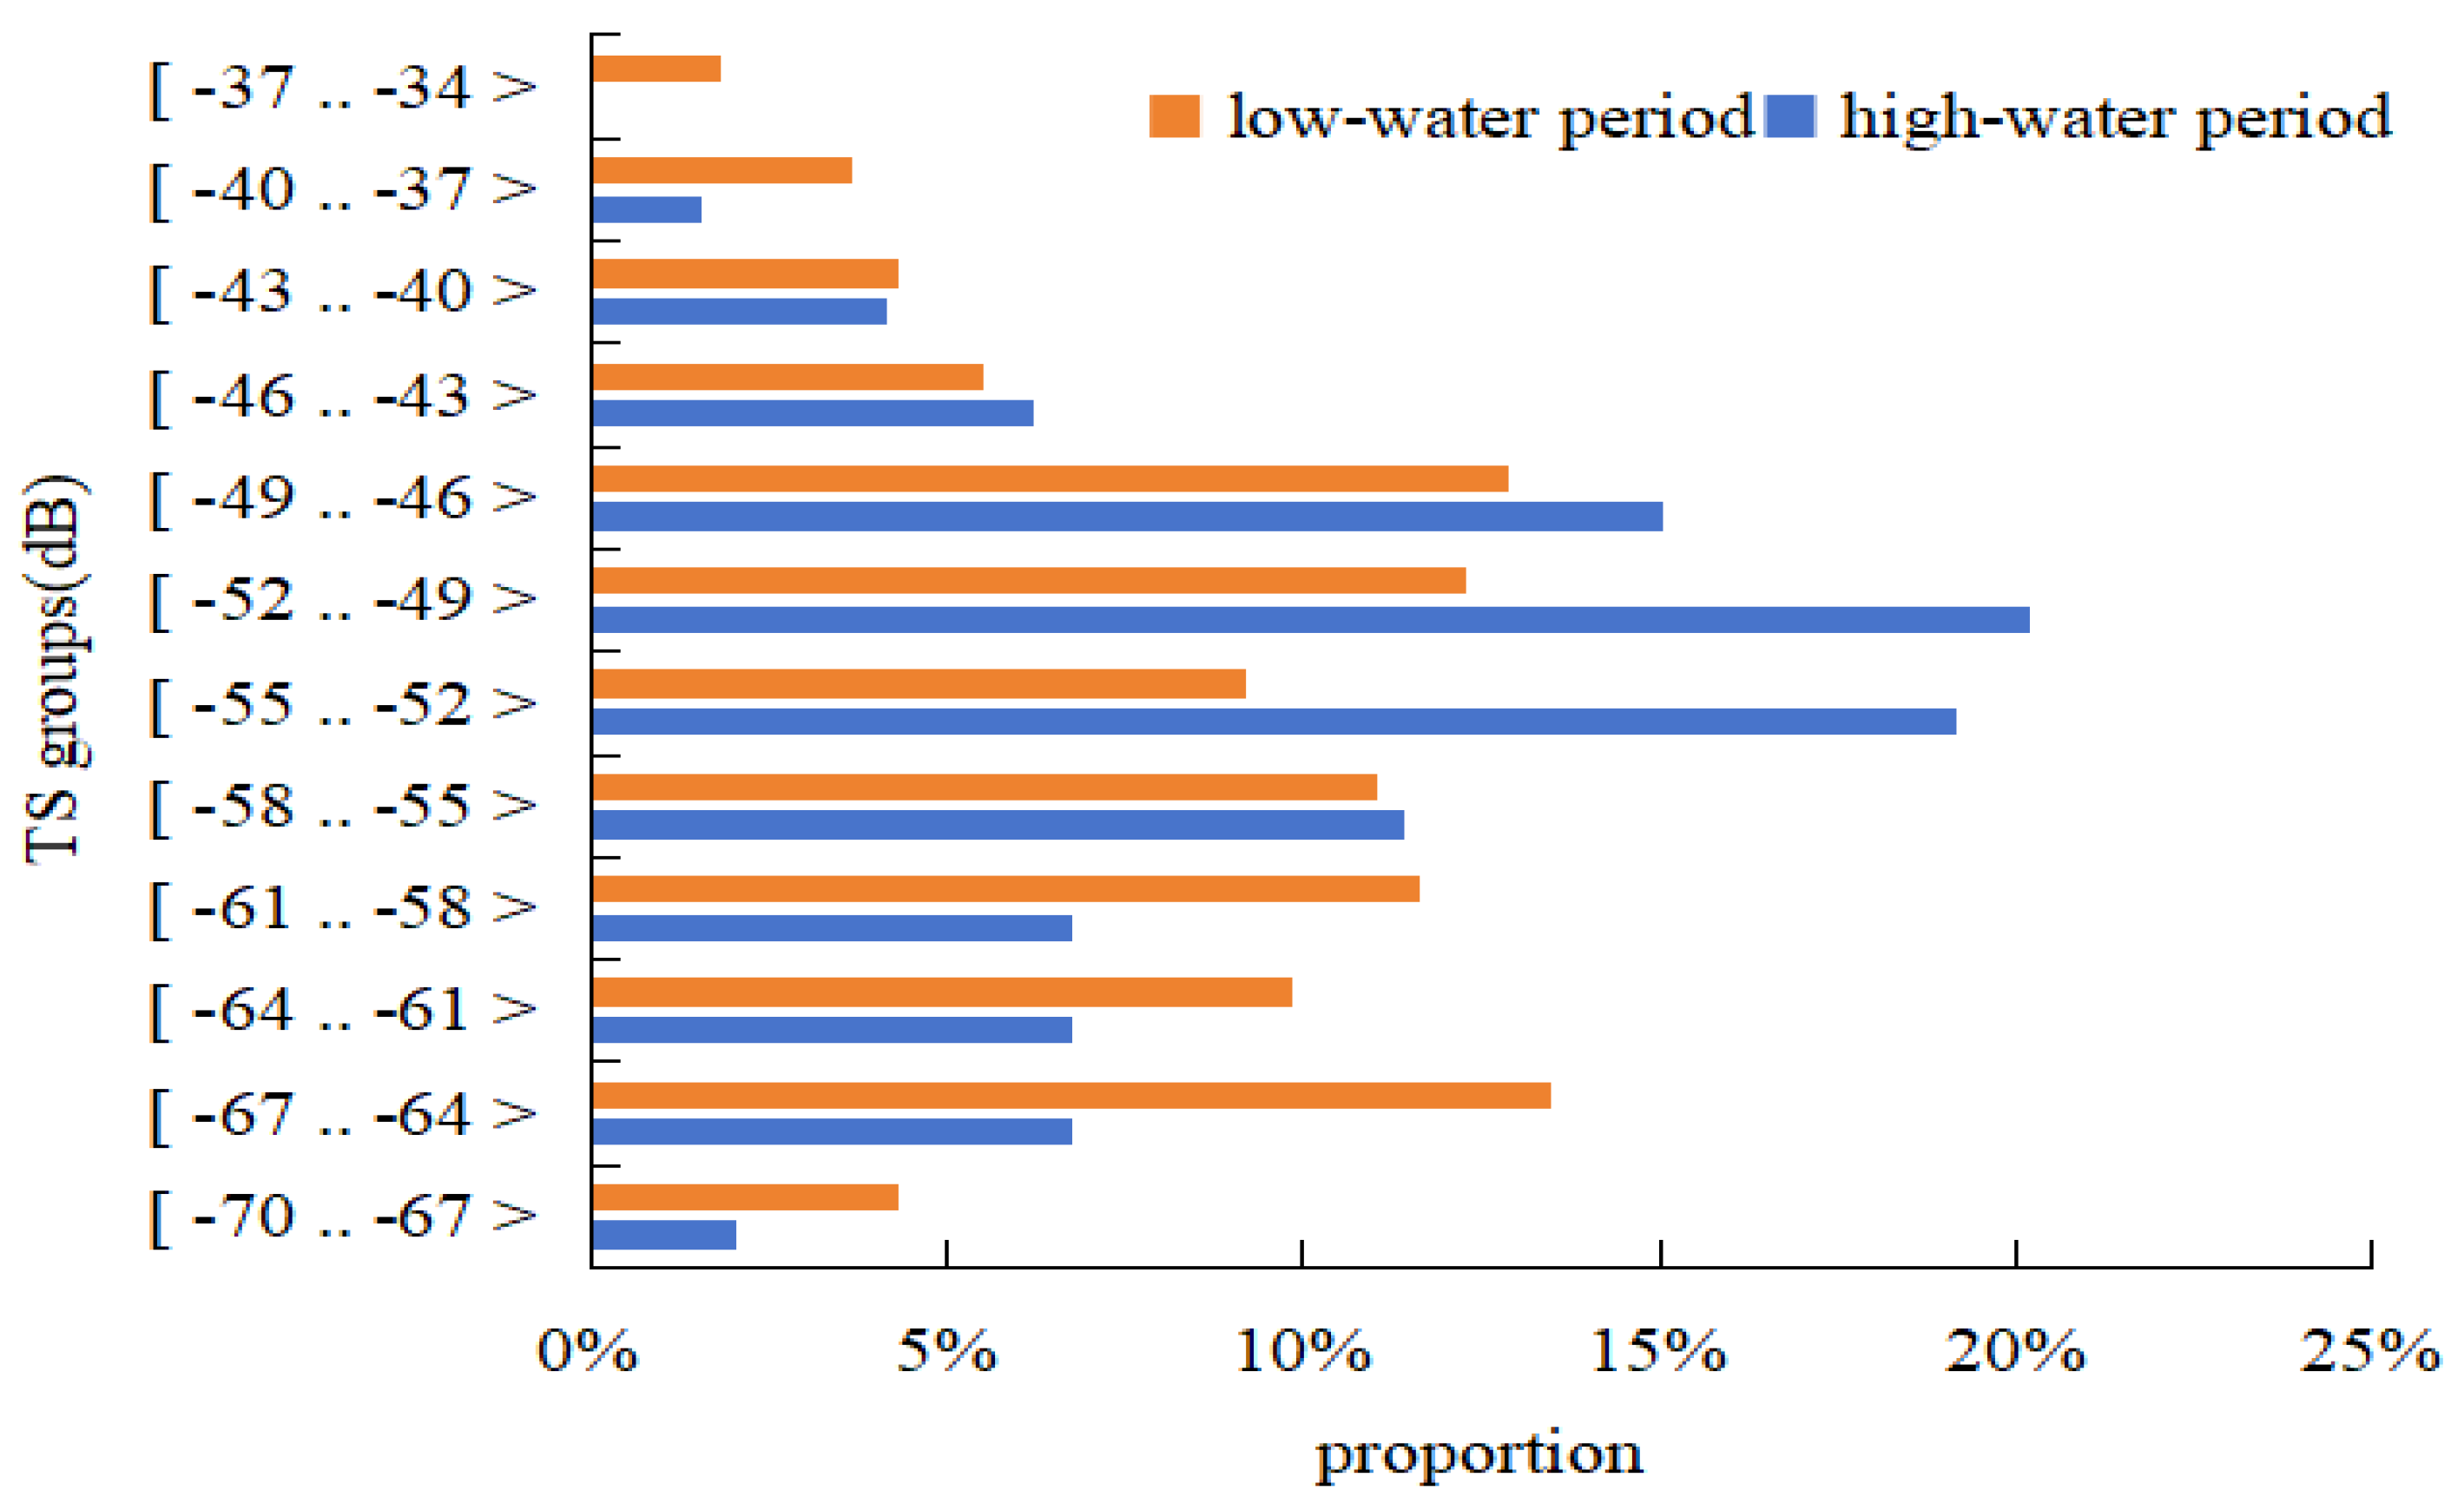
The average target strength (TS) of fish during the high water level stage is −51.32 dB, corresponding to an average total length of 12.47 cm. There are significant differences in TS values between different sections (p < 0.05), with a decreasing trend from section C to section A. In contrast, during low water levels, the average TS is slightly different, at −51.18 dB, corresponding to an average total length of 12.62 cm. The TS value of section A is significantly lower than that of sections B and C (p < 0.05) (Figure 2). During these two periods, the TS values were concentrated between −70 and −43 dB, with a proportion greater than 90%, indicating that small and medium-sized fish were dominant. The proportions in the five intervals of −37 to −34, −40 to −37, and −43 to −40 are all less than 5% (Figure 3). These findings indicate that the overall size distribution of fish remains similar under different water level conditions; however, the distribution proportion of fish varies within a specific target strength range. Especially, the proportion of the maximum fish population recorded during the two water levels varies within different TS ranges, with the maximum proportion occurring between −67 and −64 dB during low water levels and −52 to −49 dB during high water levels.
Based on the total length of fish, they were categorized into four groups: 0–10 cm, 10–20 cm, 20–30 cm, and >30 cm (Figure 4). The analysis revealed that fish within the 0–10 cm length group dominated the study area. During high water levels, the proportions of 0–10 cm fish in sections A, B, and C were 58.06%, 51.32%, and 4.00%, respectively. Notably, section C exhibited higher proportions of fish in the 10–20 cm and 20–30 cm categories compared to sections A and B. Among fish exceeding 30 cm in length, section B had the highest proportion. During low water levels, 0–10 cm fish were primarily distributed in sections A and B, while 10–20 cm fish were concentrated in section C. Fish in the 20–30 cm and >30 cm categories were mainly found in sections B and C. As illustrated in Figure 5, during high water levels, larger fish were primarily concentrated in the upstream area approximately 15 km from Zhangjiazhou to Fuxingzhou in sections C and B. In contrast, during low water levels, they were mainly distributed near the confluence of sections C and B, specifically, at the tail of the sandbar in Zhangjiazhou and the head of the sandbar in Mianchuanzhou.

3.2. Spatial Distribution Characteristics of Fish Density

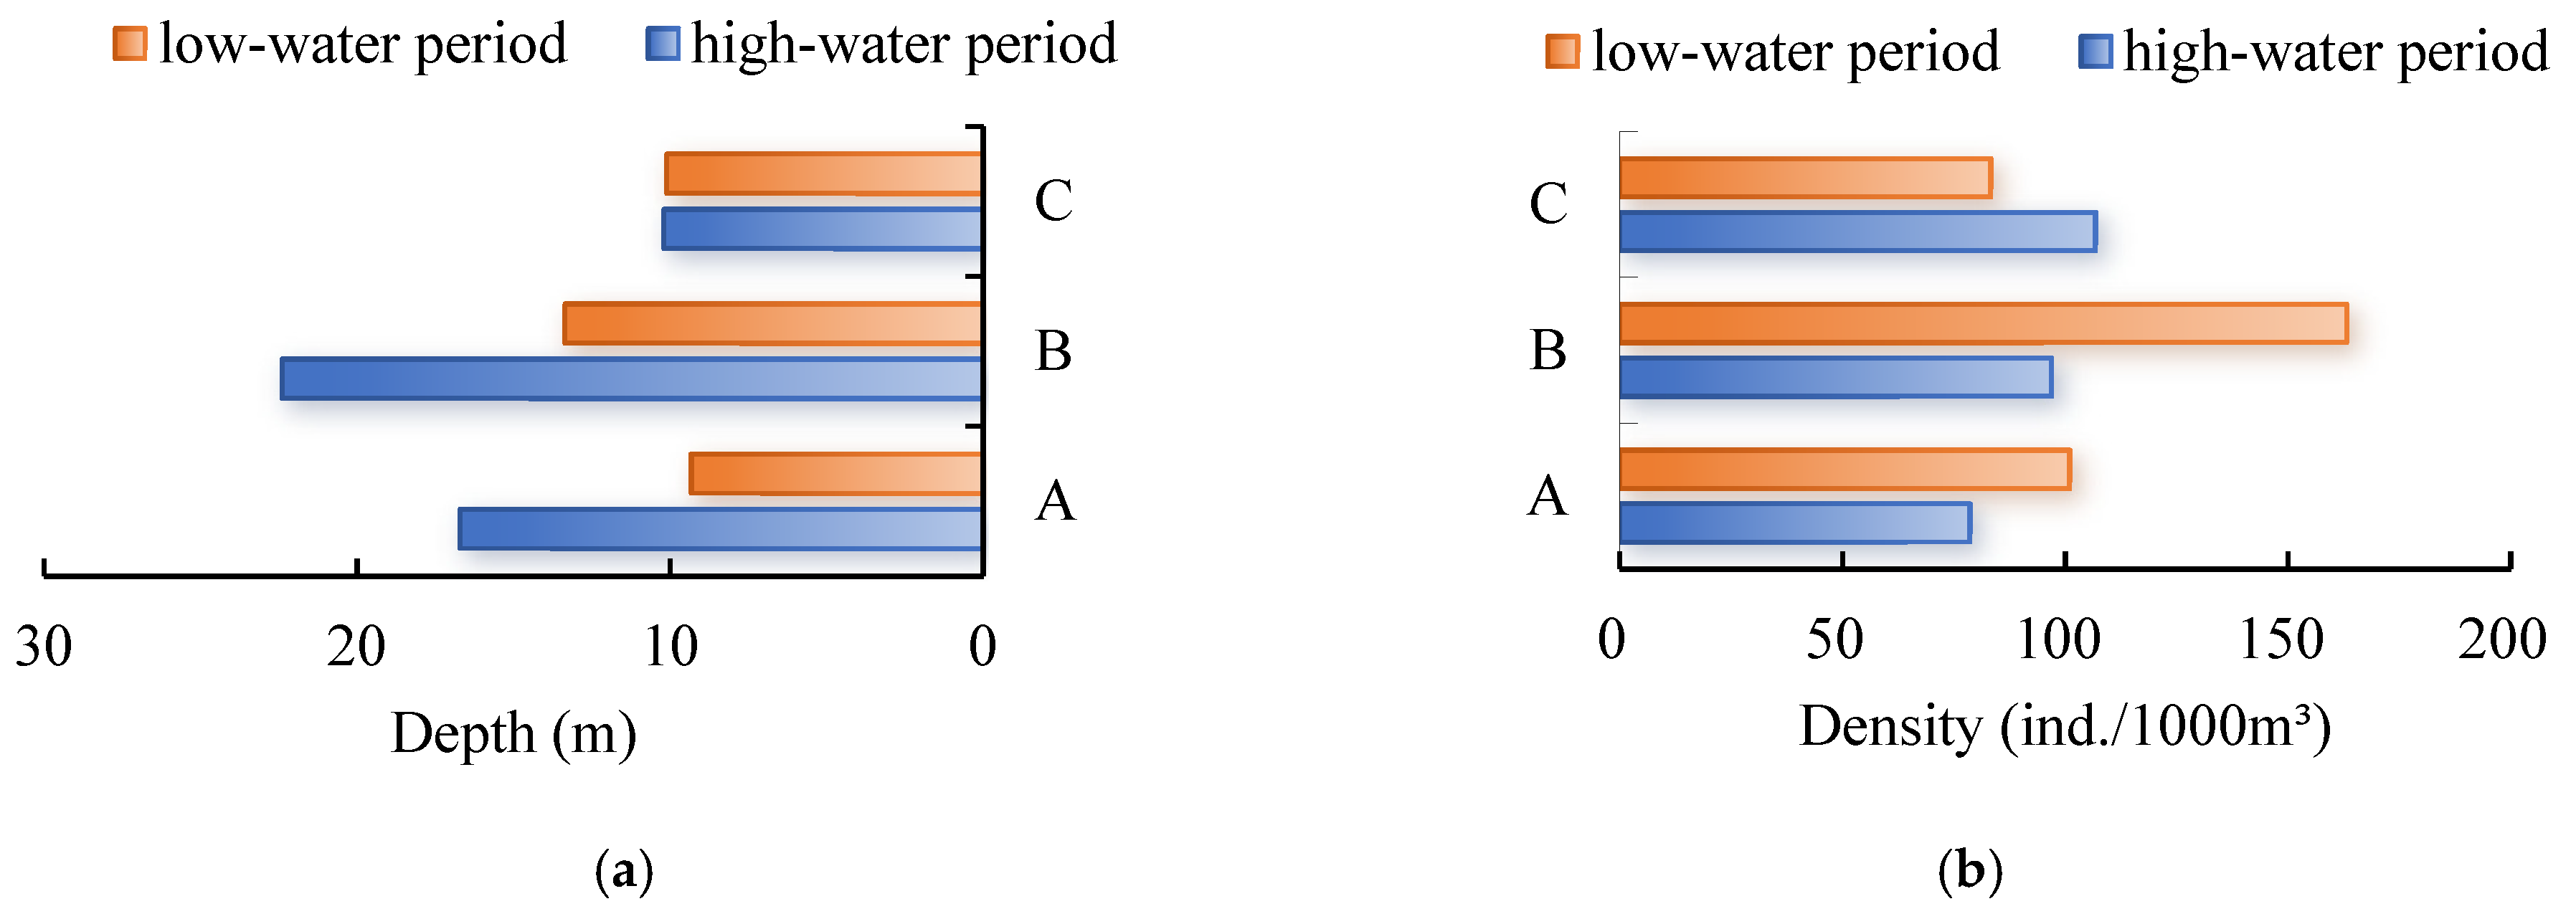
The depth and fish density in the study area varied spatially and temporally (Figure 6). As shown in Figure 6a, the average water depth in the autumn study area is 16.72 ± 4.37 m, with a maximum water depth of 39.12 m and a minimum water depth of 4.3 m. The average water depths of river sections A, B, and C are 16.72 ± 4.37 m, 22.40 ± 7.38 m, and 10.20 ± 2.72 m, respectively. The average water depth in the winter research area is 10.71 ± 4.99 m, with a maximum depth of 33.49 m and a minimum depth of 2.65 m. The average water depths of river sections A, B, and C are 9.33 ± 5.56 m, 13.36 ± 5.97 m, and 10.11 ± 2.23 m, respectively. During the high water level period (September 2020), the average fish density was 93.85 ind./1000 m3, ranging from 0 to 680.61 ind./1000 m3. The fish density in sections A, B, and C were 78.62 ind./1000 m3, 96.93 ind./1000 m3, and 106.78 ind./1000 m3, respectively (Figure 6b). There were no significant differences in fish density among the three sections (p > 0.05). The horizontal distribution map of fish density in Figure 7 showed a patchy aggregation pattern, mainly concentrated from the tail of the sandbar in Zhangjiazhou to the 15 km downstream of the confluence of Poyang Lake with the main stream, with scattered distributions at the head of the sandbar in Mianchuanzhou and the tail of the sandbar in Fuxingzhou.
The average fish density in the study area during the low water level period was 111.17 ind./1000 m3, ranging from 0 to 428.32 ind./1000 m3. The fish density in sections A, B, and C were 101.0 ind./1000 m3, 163.21 ind./1000 m3, and 83.29 ind./1000 m3, respectively. The fish density in section B was significantly greater than that in sections A and C (p < 0.05). The horizontal distribution map of fish density (Figure 7) showed that during the low water level period, fish were mainly distributed from the front and tail of the sandbar in Zhangjiazhou to the 15 km downstream of the confluence of Poyang Lake with the main stream, with scattered distributions at Pingfeng Mountain in the Poyang Lake, the head of the sandbar in Mianchuanzhou, and the tail of the sandbar in Fuxingzhou.

3.3. Composition of Fish Population

During the high water level period of the study area (September 2020), a total of 42 species were collected, belonging to four orders, seven families, and 26 genera. As shown in Table 1, the dominant species are Megalobrama terminalis, Coilia brachygnathus, Carassius auratus, and Hypophthalmichthys molitrix. The fish species with a quantity proportion greater than 1% included Coilia brachygnathus, Megalobrama terminalis, Acheilognathus macropterus, Carassius auratus, Siniperca chuatsi, Hypophthalmichthys molitrix, Saurogobio dabryi, Culter alburnus, Saurogobio dumerili, Culter dabryi, Pelteobaggrus nitidus, Parabramis pekinensis, Megalobrama amblycephala, Aristichthys nobilis, and Xenocypris davidi. The body length of the fish caught in this river section ranged from 3.60 to 83.80 cm, with the arithmetic mean of the body length 20.25 cm.
During the low water level period (January 2021), 33 species of fish were caught, belonging to four orders, six families, and 22 genera. As shown in Table 1, he dominant species were Hypophthalmichthys molitrix, Coilia brachygnathus, Parabramis pekinensis, and Siniperca chuatsi. The fish species with a quantity proportion greater than 1% included Coilia brachygnathus, Culter alburnus, Pseudobrama simoni, Parabramis pekinensis, Hypophthalmichthys molitrix, Acheilognathus macropterus, Siniperca chuatsi, Carassius auratus, Pelteobagrus fulvidraco, Siniperca kneri, Pelteobagrus fulvidraco, Megalobrama terminalis, and Xenocypris argentea. The body length of the fish caught in this river section during the low water level period ranged from 2.00 to 49.20 cm, with the arithmetic mean of the body length 18.56 cm.

4. Discussion

4.1. Spatial and Temporal Characteristics of Fish Density

During the low water level period, the average density of fish in the C area is significantly lower than that in the main stream areas A and B, with the B area of the main stream having the highest average fish density. During the high water level period, the average density of fish is highest in the C section. These changes may be related to seasonal migratory behaviors of fish such as foraging, fattening, and overwintering. During the high water level period, shallow beaches, sandbars, and vegetation near the shore are submerged in the Poyang Lake, providing complex habitats for fish [21,22]. The river channel connecting the lakes in the C section has also become a feeding and breeding ground for various fish, especially a busy migration channel [23]. When the water level drops, fish gather in the deep waters of the river for overwintering [24]. The main stream has more deep-water areas [25,26], and the average water depth in the B section is greater than that in the A section and C section, as described in Section 3.2; this may be the reason for the highest density in the B River section, resulting in the highest density of the B section of the river during the low water level period.
The density distribution of the two water level periods results indicate that the fish are mainly distributed in the Pingfeng Mountain of section C and 15 km below the confluence of section B, with obvious regional characteristics. At the same time, the distribution of fish also shows a characteristic of being close to sandbars, such as the head and tail of sandbars named Mianchuanzhou, Zhangjiazhou, and Fuxingzhou, which are fish gathering areas (Figure 7). As a typical habitat in rivers, sandbars have formed diverse fish habitats due to their complex hydrological environment [27]. At the same time, seasonal water will submerge sandbars, and the submerged plants in the bands on both sides of the sandbars will become habitats and breeding grounds for fish [28].
The Zhangjiazhou area, where fish are mainly distributed, is the only estuary where Poyang Lake flows into the Yangtze River. The ecological ecotone theory suggests that an important feature of this area is high habitat heterogeneity, with high biodiversity and productivity, and the river confluence is beneficial for increasing fish diversity [29,30]. For the sandbar area, seasonal floods inundate the floodplain, providing abundant habitats for fish to inhabit. Due to the temperature gradient and eddies formed at the confluence, nutrients, woody debris, and organic matter gather there, which is conducive to buoyancy and plant growth, providing a rich source of food for fish [31]. As the only intersection connecting the Yangtze River and Poyang Lake, this area can also be seen as an ecological transition zone [7,32]. The continuity and habitat heterogeneity in the time and space of the rivers and lakes are also important reasons for the high density of fish in this area.

4.2. Fish Target Strength

After comparing the average water depth, average TS, and average fish density of three river sections in different water periods, we found that section B has the deepest water depth, followed by section A, and then section C. The average TS value and average density value of fish during high water level periods are lower than those during low water level periods, and the same applies to sections A and B. However, the average TS value and average density value of section C during the high water level are lower than those during low water levels. Further research has found that the distribution pattern is related to physiological habits such as feeding, wintering, and reproduction in fish [24]. Sections A and B are in the Yangtze River, while section C is contained in Poyang Lake. During the low water level period, the water area of the Poyang Lake shrinks, and the C River section becomes the deepest part of the Poyang Lake, making it more suitable for large fish to overwinter here, thus becoming a wintering ground for the fish in the Poyang Lake [33]. The relevant topographic studies conducted in the Poyang Lake area have shown that the water depth of the north channel area (section C) in the Poyang Lake is greater than that in the main lake area and the southern dish lake area [34]. According to the fish catch survey, the main species of fish caught in the C River section are dominated by large, long-bodied fish such as grass carp, silver carp, catfish [35].
The results in Section 3.1 show that the fish assemblage in the study area is predominantly composed of small fish species, with sizes ranging from 1 to 10 cm, accounting for over 45% across all three river sections. This is in accordance with findings reported in previous studies [36,37]. Upon analyzing additional research in Section 3.3, it is evident that the dominant species in this aquatic environment include Megalobrama terminalis, Coilia brachygnathus, Carassius auratus, Hypophthalmichthys molitrix, Parabramis pekinensis, and Siniperca chuatsi, all of which are primarily small fish species. This aligns with the situation depicted in the results of the current hydroacoustic survey. Furthermore, scholarly research has indicated that the average total length of fish caught may be overestimated due to the employment of nets with larger mesh sizes in fishing surveys resulting in inadequate capture of small fish, thereby biasing the catch towards larger individuals [38]. Consequently, future research endeavors should involve the selection of more suitable nets, thereby improving the consistency with the results of underwater acoustic investigations.

4.3. Changes in Fish Resources Before and After the Fishing Ban

A comparison with research results from the waterway connecting Poyang Lake to the Yangtze River prior to the fishing ban (in 2014) [39] reveals that both the average fish density and Target Strength (TS) values are higher after the implementation of the fishing ban (in September 2020). Specifically, the mean TS value of fish after the ban (−48.23 dB) is greater than before (−56.4 dB). Additionally, the proportion of individuals with TS values ranging from −70 to −55 dB (42.59%) is lower after the ban than before (54.6%), while the proportion of individuals with TS values greater than −40 dB (1.23%) is higher than before (0.12%). The average fish density was 106.78 ind./1000 m3, which is higher than the 53.7 ind./1000 m3 before the fishing ban.
These findings suggest that the fishing ban policy has played a positive role in the restoration of fish resources in the Yangtze River basin, with increases in both fish density and individual size, and a mitigation of the trend towards miniaturization in the fish population structure. Reports from other researchers also found the positive effects of the fishing ban policy. For instance, fish in the different sections (Yichang to Chenglingji section, main stream of the upper Yangtze River, Xiangjiaba Reservoir in the lower reaches of Jinsha River, the Dongting Lake) of the Yangtze River basin [40,41,42,43] have shown an increasing trend in size after the ban, and both the number of fish species and diversity indices have increased. These observations further illustrate the beneficial impact of the ten-year fishing ban policy on fish resource conservation.
The implementation of the fishing ban policy, as a pivotal initiative aimed at protecting and restoring aquatic ecosystems, has gradually manifested its profound impact [44]. This policy has not only markedly reduced the fishing intensity targeting adult fish populations, thereby providing invaluable space and time for the natural growth of young fish and subsequently promoting a dual increase in the quantity and size of fish resources, but it has also effectively improved fish habitats through a series of scientific and reasonable environmental protection measures and stringent regulation of human activities. These measures encompass, but are not limited to, water purification, ecological restoration, and the rational planning of fishing activities, all of which collectively act upon the fish ecosystem to significantly enrich the food sources for fish and create favorable conditions for the regeneration and proliferation of fish populations.
However, the restoration of ecosystems is a complex and lengthy process, a fact that is particularly evident in the recovery of fish resources within the two key lakes of the Yangtze River basin: Poyang Lake and Dongting Lake. According to relevant research, achieving a basic balance in fish resources in these two lakes is expected to take a time span of 3 to 5 years [45]. Taking Poyang Lake as an example, despite some progress in fish resource recovery in recent years, the overall situation is still far from full restoration. The current level of recovery, to some extent, is roughly comparable to the state in the 1990s [46], indicating that the road to ecosystem restoration remains long and arduous. More severely, the ecosystem of Poyang Lake remains relatively fragile, with limited resistance to external disturbances.
Therefore, the continuous monitoring and evaluation of fish resource recovery in Poyang Lake are of paramount importance. This necessitates maintaining the continuity and stability of the existing fishing ban policy while flexibly adjusting the specific implementation details of the ban measures based on the actual situation of fish resource recovery and the dynamic characteristics of ecosystem changes. By establishing a comprehensive monitoring system, timely access to firsthand data on fish resource recovery can be obtained, providing robust support for scientific decision making. This, in turn, ensures that the fishing ban policy can more effectively promote the protection and restoration of fish resources, contributing to the ecological security and sustainable development of the Yangtze River basin.

5. Conclusions

We utilized hydroacoustic methodologies to undertake a comprehensive and meticulous examination of the spatial distribution patterns of fish in the confluence zone of the Poyang Lake and the Yangtze River. The primary aim of this investigation was to assess the condition of fish resources in this pivotal aquatic ecosystem during the early stages of the implemented fishing ban. With this survey, we intended to generate robust data that could facilitate subsequent scientific evaluations of the fishing ban’s efficacy and inform effective conservation strategies for fish resources.
Our findings reveal that fish resources in our study area are predominantly clustered within the confluence region and adjacent sandbar waters. This observation carries substantial implications for comprehending fish behavioral patterns and habitat preferences within distinct ecological settings. Following the rigorous enforcement of the fishing ban policy, we documented pronounced alterations in the fish resource status. A comparative analysis of post-ban survey data with prior reports disclosed an increase in both the average fish density and the average target strength (TS). This shift indicates that the fishing ban policy has exerted a favorable influence on reversing the trend of fish population downsizing and fostering an elevation in the abundance of larger fish species, thereby substantially contributing to the recovery of fish resources in the typical river–lake confluence area.
Nonetheless, this study constitutes a preliminary foray into understanding the impact of the fishing ban policy on fish resources in Poyang Lake. In the future, it is acknowledged that the estimation of fish total length from TS remains an approximation, as highlighted by the extensive hydroacoustic literature. To enhance the accuracy of this estimation, exploring and incorporating various existing equations that consider not only the diverse shapes of fish and the size of the swim bladder but also the positional relationship between the fish and the transducer will be crucial. This will necessitate a more comprehensive and nuanced approach to data analysis, potentially involving advanced modeling and simulation techniques. By addressing these complexities, future research endeavors aim to refine the understanding and application of hydroacoustic methods in fish resource assessment, ultimately leading to more precise and reliable estimates of fish size and abundance.

Supplementary Materials

The following supporting information can be downloaded at: https://www.mdpi.com/article/10.3390/fishes9120492/s1, Figure S1: Pictures of field investigation. (a) Lake scenery. (b) Main fish species. (c) Fish collection. (d) Hydroacoustic survey. (e) Data processing. Table S1: Main value setting of parameters.

Author Contributions

Conceptualization, J.L.; Data curation, X.Y., K.W., and J.L.; Formal analysis, H.L. and X.Y.; Funding acquisition, X.D.; Investigation, X.Y.; Methodology, B.W.; Project administration, J.L.; Resources, D.W.; Software, H.L., B.W., and Y.L.; Supervision, S.W.; Validation, L.Y.; Visualization, D.C.; Writing—original draft, H.L. and X.Y.; Writing—review and editing, H.L. and B.W. All authors have read and agreed to the published version of the manuscript.

Funding

This work was supported by Project of innovation team of survey and assessment of the Pearl River fishery resources (2023TD10); The National Key R&D Program of China (2018YFD0900801); The Project of Yangtze Fisheries Resources and Environment Investigation from the MARA, China; and Chinese Three Gorges Corporation (No: 202003229).

Institutional Review Board Statement

In our study, ethical approval was not required as our fishing activities were solely for the purpose of classification and immediate release back into the water, without any dissection or harm to the fish.

Informed Consent Statement

Informed consent was obtained from all subjects involved in the study.

Data Availability Statement

Data are contained within the article and supplementary materials.

Conflicts of Interest

Author X.Y. is employed by the company Beijing Central Ring Guoji Technology Consultation Co., Ltd. The remaining authors declare that the research was conducted in the absence of any commercial or financial relationships that could be construed as potential conflicts of interest.

References

  1. Dronova, I.; Beissinger, S.R.; Burnham, J.W.; Gong, P. Landscape-Level Associations of Wintering Waterbird Diversity and Abundance from Remotely Sensed Wetland Characteristics of Poyang Lake. Remote Sens. 2016, 8, 462. [Google Scholar] [CrossRef]
  2. Xu, G.; Qin, Z. Flood Estimation Methods for Poyang Lake Area. J. Lake Sci. 1998, 10, 31–36. [Google Scholar] [CrossRef]
  3. Feng, L.; Hu, C.; Chen, X.; Li, R.; Tian, L.; Murch, B. MODIS observations of the bottom topography and its inter-annual variability of Poyang Lake. Remote Sens. Environ. 2011, 115, 2729–2741. [Google Scholar] [CrossRef]
  4. Li, Y.; Qian, F.; Silbernagel, J.; Larson, H. Community structure, abundance variation and population trends of waterbirds in relation to water level fluctuation in Poyang Lake. J. Great Lakes Res. 2019, 45, 976–985. [Google Scholar] [CrossRef]
  5. Huang, L.; Wu, Z.; Li, J. Fish fauna, biogeography and conservation of freshwater fish in Poyang Lake Basin, China. Environ. Biol. Fishes 2013, 96, 1229–1243. [Google Scholar] [CrossRef]
  6. Li, Y.; Zhang, Q.; Cai, Y.; Tan, Z.; Wu, H.; Liu, X.; Yao, J. Hydrodynamic investigation of surface hydrological connectivity and its effects on the water quality of seasonal lakes: Insights from a complex floodplain setting (Poyang Lake, China). Sci. Total Environ. 2019, 660, 245–259. [Google Scholar] [CrossRef] [PubMed]
  7. Hu, M. Analysis of Water Level and Water Environmental Characteristics of Poyang Lake and Its Impact on Fish Community and Migration; Nanchang University: Nanchang, China, 2009; pp. 56–89. [Google Scholar]
  8. Wang, S.; Duan, X.; Chen, W. Status and changes of fish resources in the Hukou area of Poyang Lake. Freshw. Fish. 2016, 46, 50–55. [Google Scholar]
  9. Tao, J.; Yang, J.; Xuan, Z. Preliminary Report on the Effects of Resource Recovery on Anadromous Coilia nasus in Poyang Lake Under the National 10-Year Fishing Ban. Process. Fish. Sci. 2022, 43, 7. [Google Scholar] [CrossRef]
  10. Dong, F.; Zhang, H.; Wei, Q. Protection and development after the ten-year fishing ban in the Yangtze River. J. Fish. 2023, 47, 029318. [Google Scholar] [CrossRef]
  11. Lian, Y.; Huan, G.; Godlewska, M.; Li, C.; Zhao, X.; Ye, S.; Li, Z. Hydroacoustic assessment of spatio-temporal distribution and abundance of fish resources in the Xiangxi river. Acta Hydrobiol. Sin. 2015, 39, 920–929. [Google Scholar] [CrossRef]
  12. Tao, J.; Gong, Y.; Tan, X. Spatiotemporal patterns of the fish assemblages downstream of the Gezhouba Dam on the Yangtze River. Sci. Sin. Vitae 2012, 42, 677–688. [Google Scholar] [CrossRef]
  13. Yang, G.; Zhang, Q.; Wan, R.; Lai, X.; Jiang, X.; Li, L.; Dai, H.; Lei, G.; Chen, J.; Lu, Y. Lake hydrology, water quality and ecology impacts of altered river–lake interactions: Advances in research on the middle Yangtze River. Hydrol. Res. 2016, 47 (Suppl. 1), 1–7. [Google Scholar] [CrossRef]
  14. Chen, Y. Fauna Sinica. Osteichthyes, Cypriniformes II; Science Press: Beijing, China, 1998. (In Chinese) [Google Scholar]
  15. Foote, K.G.; Knudsen, H.P.; Vestnes, G.; MacLennan, E.J.; Simmonds, E.J. Calibration of acoustic instruments for fish density estimation: A practical guide. ICES Coop. Res. Rep. 1987, 144, 84. [Google Scholar] [CrossRef]
  16. Aglen, A. Random Errors of Acoustic Fish Abundance Estimates in Relation to The Survey Grid Density Applied. Fao Fish. Report. 1983, 300, 293–298. [Google Scholar]
  17. Zhang, H.; Yang, D.; Wei, Q.; Du, H.; Wang, C. Spatial distribution and spawning stock estimates for adult Chinese sturgeon (Acipenser sinensis Gray, 1835) around the only remaining spawning ground during the trial operation of the newly constructed Three Gorges Project in the Yangtze River. J. Appl. Ichthyol. 2013, 29, 1436–1440. [Google Scholar] [CrossRef]
  18. Balk, H. Sonar4 and Sonar5-Pro Post Processing Systems: Operator Manual, version 6.0.4; Lindem Data Acquisition A/S: Oslo, Norway, 2013. Available online: http://folk.uio.no/hbalk/sonar4_5/ (accessed on 6 October 2018).
  19. Frouzova, J.; Kubecka, J.; Balk, H.; Frouz, J. Target strength of some European fish species and its dependence on fish body parameters. Fish Res. 2005, 75, 86–96. [Google Scholar] [CrossRef]
  20. Gerasimov, Y.V.; Pavlov , D.D.; Strelnikova , A.P.; Shlyapkin, I.V.; Borisenko, E.S. Impacts of the High-Pressure Bratsk Hydroelectric Power Station on Fish Population of the Bratsk Reservoir. J. Ichthyol. 2024, 64, 650–662. [Google Scholar] [CrossRef]
  21. Louca, V.; Lindsay, S.W.; Lucas, M.C. Factors triggering floodplain fish emigration: Importance of fish density and food availability. Ecol. Freshw. Fish 2010, 18, 60–64. [Google Scholar] [CrossRef] [PubMed]
  22. Li, K.; Tang, H.; Yuan, S. A field study of near-junction-apex flow at a large river confluence and its response to the effects of floodplain flow. J. Hydrol. 2022, 610, 127983. [Google Scholar] [CrossRef]
  23. Xia, S.; Liu, Y.; Wang, Y.; Chen, B.; Jia, Y.; Liu, G.; Yu, X.; Wen, L. Wintering waterbirds in a large river floodplain: Hydrological connectivity is the key for reconciling development and conservation. Sci. Total Environ. 2016, 573, 645–660. [Google Scholar] [CrossRef] [PubMed]
  24. Li, H.; Zhang, H.; Yu, L.; Cao, K.; Wang, D.; Duan, X.; Ding, F.; Mao, Z.; Wang, K.; Liu, S.; et al. Managing Water Level for Large Migratory Fish at the Poyang Lake Outlet: Implications Based on Habitat Suitability and Connectivity. Water 2022, 14, 2076. [Google Scholar] [CrossRef]
  25. Qiang, Z.; Ya, F. Geometric properties of river cross sections and associated hydrodynamic implications in Wuhan-Jiujiang River reach, the Yangtze River. J. Geogr. Sci. 2009, 19, 58–66. [Google Scholar] [CrossRef]
  26. Yang, Y.; Li, M.; Liu, W. Relationship between potential waterway depth improvement and evolution of the Jingjiang Reach of the Yangtze River in China. J. Geogr. Sci. 2023, 33, 547–575. [Google Scholar] [CrossRef]
  27. Lanés, L.E.K.; Rolon, A.S.; Stenert, C. Effects of an artificial and annual opening of a natural sandbar on the fish community in a coastal lagoon system: A case study in Lagoa do Peixe floodplains, southern Brazil. J. Appl. Ichthyol. 2015, 31, 321–327. [Google Scholar] [CrossRef]
  28. Chen, M.; Yu, D.; Lian, Y. Population abundance and habitat preference of the Yangtze finless porpoise in the highest density section of the Yangtze River. Aquatic Conservation Marine and Freshwater Ecosystems 2020, 30, 1088–1097. [Google Scholar] [CrossRef]
  29. Fernandes, C.C. Amazonian ecology: Tributaries enhance the diversity of electric fishes. Science 2004, 305, 1960–1962. [Google Scholar] [CrossRef] [PubMed]
  30. Röpke, C.P.; Amadio, S.A.; Winemiller, K.O. Seasonal dynamics of the fish assemblage in a floodplain lake at the confluence of the Negro and Amazon Rivers. J. Fish Biol. 2016, 30, 1088–1097. [Google Scholar] [CrossRef] [PubMed]
  31. Gayoso, A.M.; Podesta, G.P. Surface hydrography and phytoplankton of the Brazil-Malvinas currents confluence. J. Plankton Res. 1996, 18, 941–951. [Google Scholar] [CrossRef]
  32. Jiang, X.; Li, M.; Yang, S.; Lin, P.; Chang, T.; Wang, C.; Zhang, C.; Gao, X. Temporal variation of fish biodiversity in Poyang Lake. Acta Hydrobiol. Sin. 2023, 47, 376–388. [Google Scholar] [CrossRef]
  33. Li, H.; Cao, K.; Wang, D.; Ding, F.; Mao, Z.; Yu, L.; Wang, K.; Duan, X.; Jia, C.; Chen, D.; et al. Habitat suitability analysis of fish community in the channel connecting the Poyang Lake and the Yangtze River in winter. J. Fish. Sci. 2022, 29, 341–354. [Google Scholar]
  34. Tan, Z.; Li, Y.; Zhang, Q.; Liu, X.; Song, Y.; Xue, C.; Lu, J. Assessing effective hydrological connectivity for floodplains with a framework integrating habitat suitability and sediment suspension behavior. Water Res. 2021, 201, 117253. [Google Scholar] [CrossRef] [PubMed]
  35. Zhu, Q. Studies on the Changes of Fish Community Structure in Summer and Autumn in the Tongjiang Waterway of Poyang Lake and the Otolith and Growth of Young the Four Famous Domestic Fishes; Nanchang University: Nanchang, China, 2011. [Google Scholar] [CrossRef]
  36. Li, H.; Wang, K.; Yu, X.; Gao, L.; Jia, C.; Guo, J.; Duan, X.; Wang, S.; Chen, D.; Wang, D.; et al. Hydroacoustic surveys on spatial-temporal distribution of fishes during early fishing ban period in poyang Lake. Acta Hydrobiol. Sin. 2023, 47, 147–155. [Google Scholar] [CrossRef]
  37. Jiang, X.; Li, L.; Yang, S. Study on the structural characteristics and temporal changes of fish assemblages in the Poyang Lake. Resour. Environ. Yangtze River Basin 2022, 31, 588–601. [Google Scholar] [CrossRef]
  38. González-Sansón, G.; Aguilar-Betancourt, C.; Kosonoy-Aceves, D.; Lucano-Ramírez, G.; Ruiz-Ramírez, S.; Flores-Ortega, J.R.; Hinojosa-Larios, Á.; Silva-Bátiz, F.D.A. Species and size composition of fishes in Barra de Navidad lagoon, Mexican central Pacific. Rev. De Biol. Trop. 2014, 62, 142–157. [Google Scholar] [CrossRef]
  39. Chen, W.; He, G.; Wu, B. Spatial distribution and biomass assessment of fish in the channel connecting the Lake Poyang and the Yangtze River. J. Lake Sci. 2017, 29, 923–931. [Google Scholar]
  40. Shi, Y.; Yu, L.; Zhou, X.; Gao, L.; Zhu, F.; Yang, J.; Chen, D.; Wang, K.; Duan, X. Spatial-temporal distribution characteristics of fish resources in Yichang-Chenglingji River section of the Yangtze River in the early period of fishing ban. Acta Hydrobiol. Sin. 2024, 48, 546–557. [Google Scholar] [CrossRef]
  41. Li, X. Spatial and Temporal Distribution Characteristics of Fish in the Mainstream of the Upper Yangtze River Reserve Jiangan-Chongqing Section in the Early Period of Closed Fishing; Southwest University: Chongqing, China, 2022; pp. 23–44. [Google Scholar]
  42. Hu, F.; Zhu, T.; Gong, J. Acoustic study of fish resources in Xiangjiaba Reservoir in the lower reaches of Jinsha River during the early period of ten-year fishing ban. J. Fish. China 2023, 47, 233–244. [Google Scholar]
  43. Jia, C. Hydroacoustic Studies on Fishes in the Middle Yangtze from Yichang to the East Dongting Lake; Ocean University Shanghai: Shanghai, China, 2022; p. 13. [Google Scholar]
  44. Liu, F.; Wang, Z.; Xia, J. Changes in fish resources 5 years after implementation of the 10-year fishing ban in the Chishui River, the first river with a complete fishing ban in the Yangtze River Basin. Ecol. Process. 2023, 12, 51. [Google Scholar] [CrossRef]
  45. Zhang, H.; Kang, M. Rapid change in Yangtze fisheries and its implications for global fresh water ecosystem management. Fish Fish. 2020, 21, 601–620. [Google Scholar] [CrossRef]
  46. Wu, Z.; Zhang, H.; Zhang, G. Study on the growth characteristics and population parameters of Siniperca chuatsi before and after the fishing ban in Poyang Lake. J. Jiangxi Agric. Univ. 2024, 46, 220–231. [Google Scholar]
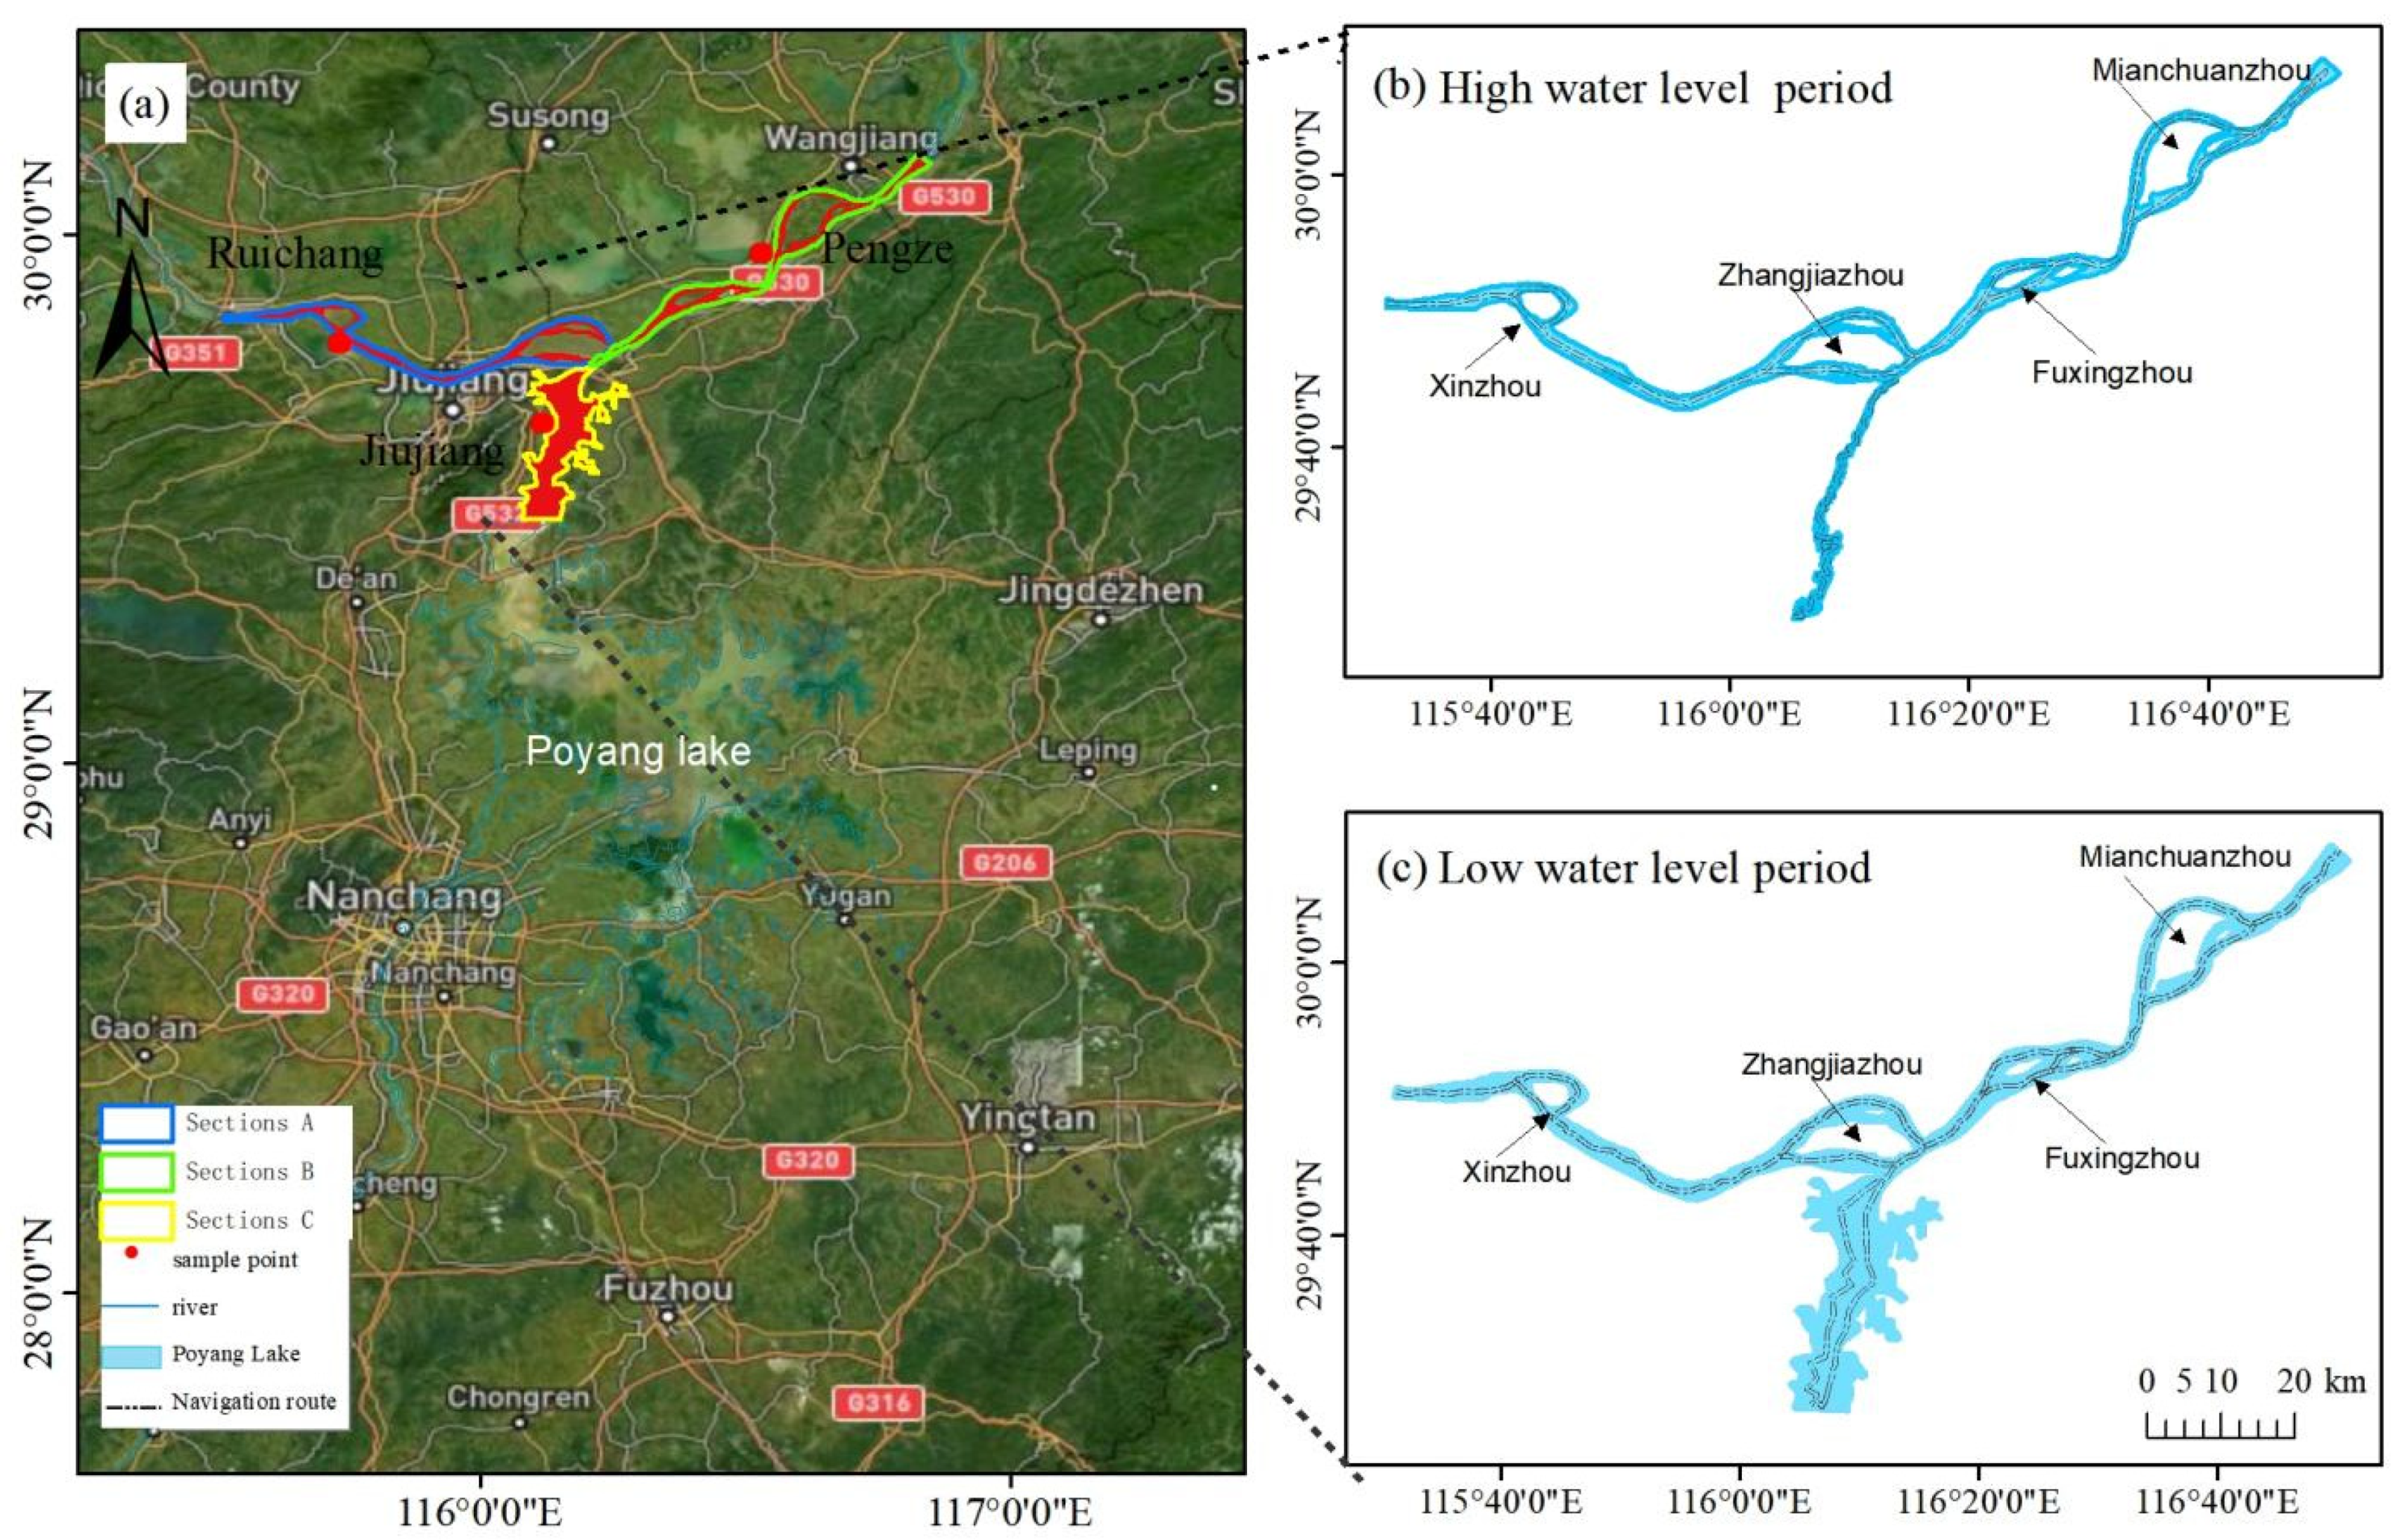
Figure 1. (a) Partition and sampling point distribution. (b) Schematic diagram of hydroacoustic detection area and route in high water level period. (c) Schematic diagram of hydroacoustic detection area and route in low water level period.
Fishes 09 00492 g001
Figure 2. Distribution of the target strengths between different sections during the high (a) and low (b) water level periods. (The box plot illustrates the following statistical measures: the minimum value, the first quartile–25th percentile, the median, the third quartile–75th percentile, and the maximum value. Outliers are marked with points. The horizontal lines connecting the boxes indicate a comparison between the two river sections during these periods. The asterisks above these lines signify the level of significance in the differences observed; ** denotes a highly significant difference with p < 0.01.)
Fishes 09 00492 g002
Figure 3. Distribution of different groups of target strength during the high and low water level periods.
Fishes 09 00492 g003
Figure 4. Distribution of total length during the high (a) and low (b) water level periods (A, B, and C are the codes for different river sections, as shown in Figure 1).
Fishes 09 00492 g004
Figure 5. Distribution map of the fish target strength during the high and low water level periods.
Fishes 09 00492 g005
Figure 6. The water depth (a) and fish density (b) in different sections during the high and low water level period (A, B, and C are the codes for different river sections, as shown in Figure 1).
Fishes 09 00492 g006
Figure 7. Distribution map of fish density during the high and low water level period.
Fishes 09 00492 g007
Table 1. The main characteristics of fish population ratio and body length during the two water periods.
High Water Level PeriodLow Water Level Period
SpeciesProportion (%)Length Range (cm)Average Length (cm)SpeciesProportion (%)Length Range (cm)Average Length (cm)
Coilia brachygnathus20.04%11.30~35.4023.44Coilia brachygnathus16.06%9.50~35.0021.59
Megalobrama terminalis13.89%10.70~37.4024.10Culter alburnus9.28%11.00~30.8021.47
Acheilognathus macropterus11.61%3.60~10.006.11Pseudobrama simoni8.72%9.00~14.0011.63
Carassius auratus8.36%4.50~28.8019.09Parabramis pekinensis6.94%8.30~39.7020.70
Siniperca chuatsi4.70%8.30~48.3021.78Hypophthalmichthys molitrix6.78%13.50~49.2026.91
Hypophthalmichthys molitrix4.08%17.00~83.8034.60Acheilognathus macropterus6.54%2.00~11.508.08
Saurogobio dabryi3.73%6.40~16.6010.05Siniperca chuatsi6.38%10.50~43.3021.38
Culter alburnus3.52%9.30~47.5020.33Carassius auratus6.05%7.40~28.0015.95
Saurogobio dumerili3.32%5.40~13.508.42Pelteobagrus fulvidraco5.33%9.00~35.0013.46
Culter dabryi3.04%6.70~35.2022.75Siniperca kneri3.87%14.40~30.0020.64
Pelteobaggrus nitidus2.49%5.80~24.2013.76Pelteobagrus fulvidraco3.79%8.90~22.0012.29
Parabramis pekinensis2.49%6.40~39.2026.65Megalobrama terminalis3.71%10.90~43.0019.62
Megalobrama amblycephala2.28%9.70~34.3027.17Xenocypris argentea2.18%11.50~21.7015.70
Aristichthys nobilis2.00%16.50~61.0039.62
Xenocypris davidi1.80%7.70~20.8017.18
Disclaimer/Publisher’s Note: The statements, opinions and data contained in all publications are solely those of the individual author(s) and contributor(s) and not of MDPI and/or the editor(s). MDPI and/or the editor(s) disclaim responsibility for any injury to people or property resulting from any ideas, methods, instructions or products referred to in the content.