
Isotopic Turnover and Fractionation of δ15N and δ13C in Captive Pseudopleuronectes americanus (Walbaum)


Abstract
:1. Introduction
2. Materials and Methods
2.1. Diet Selection
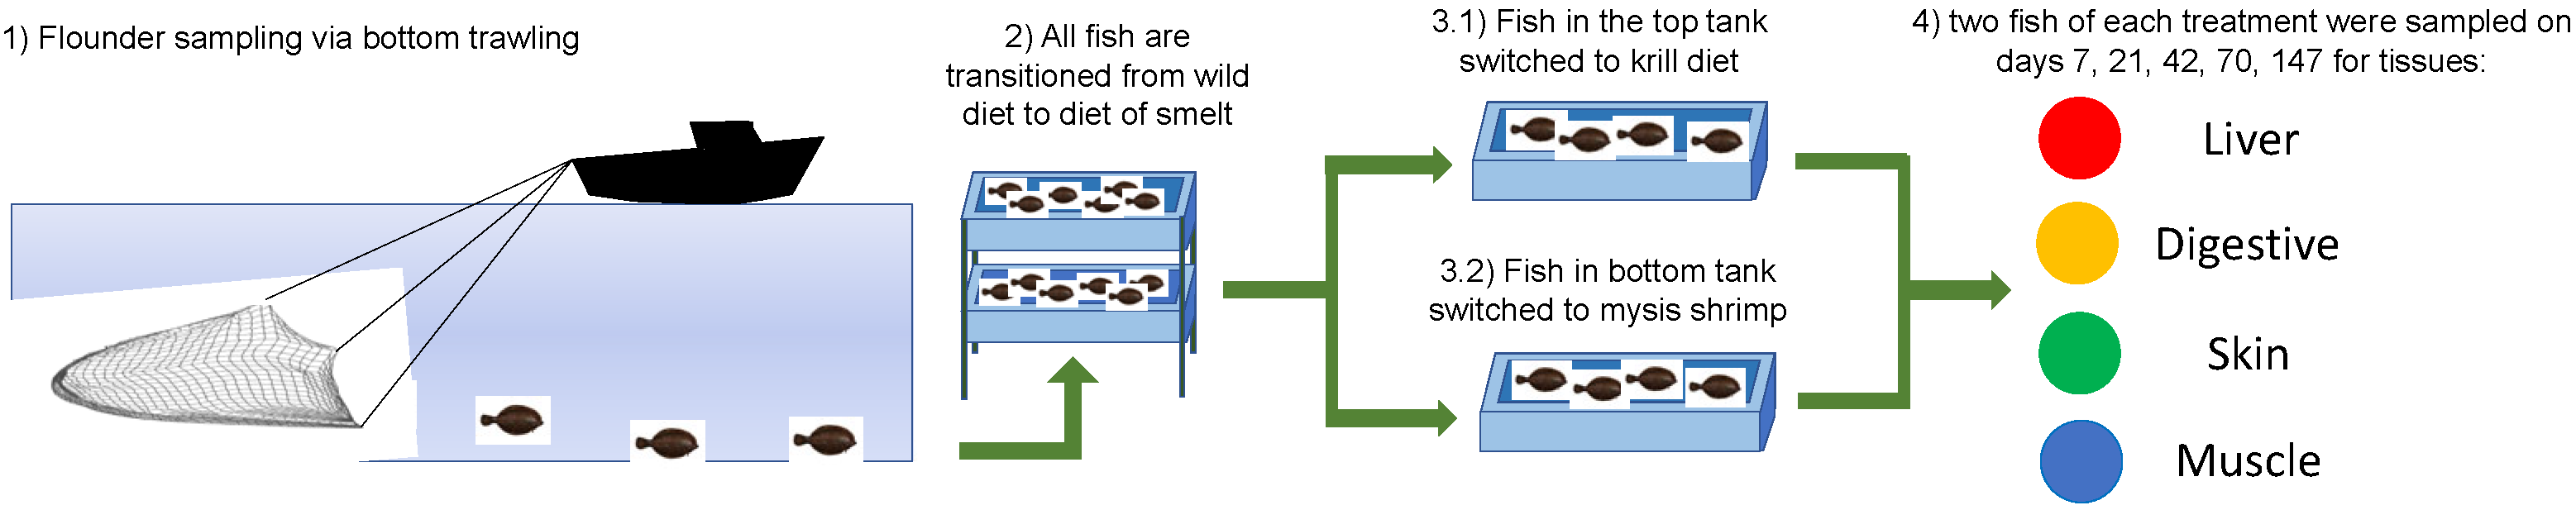
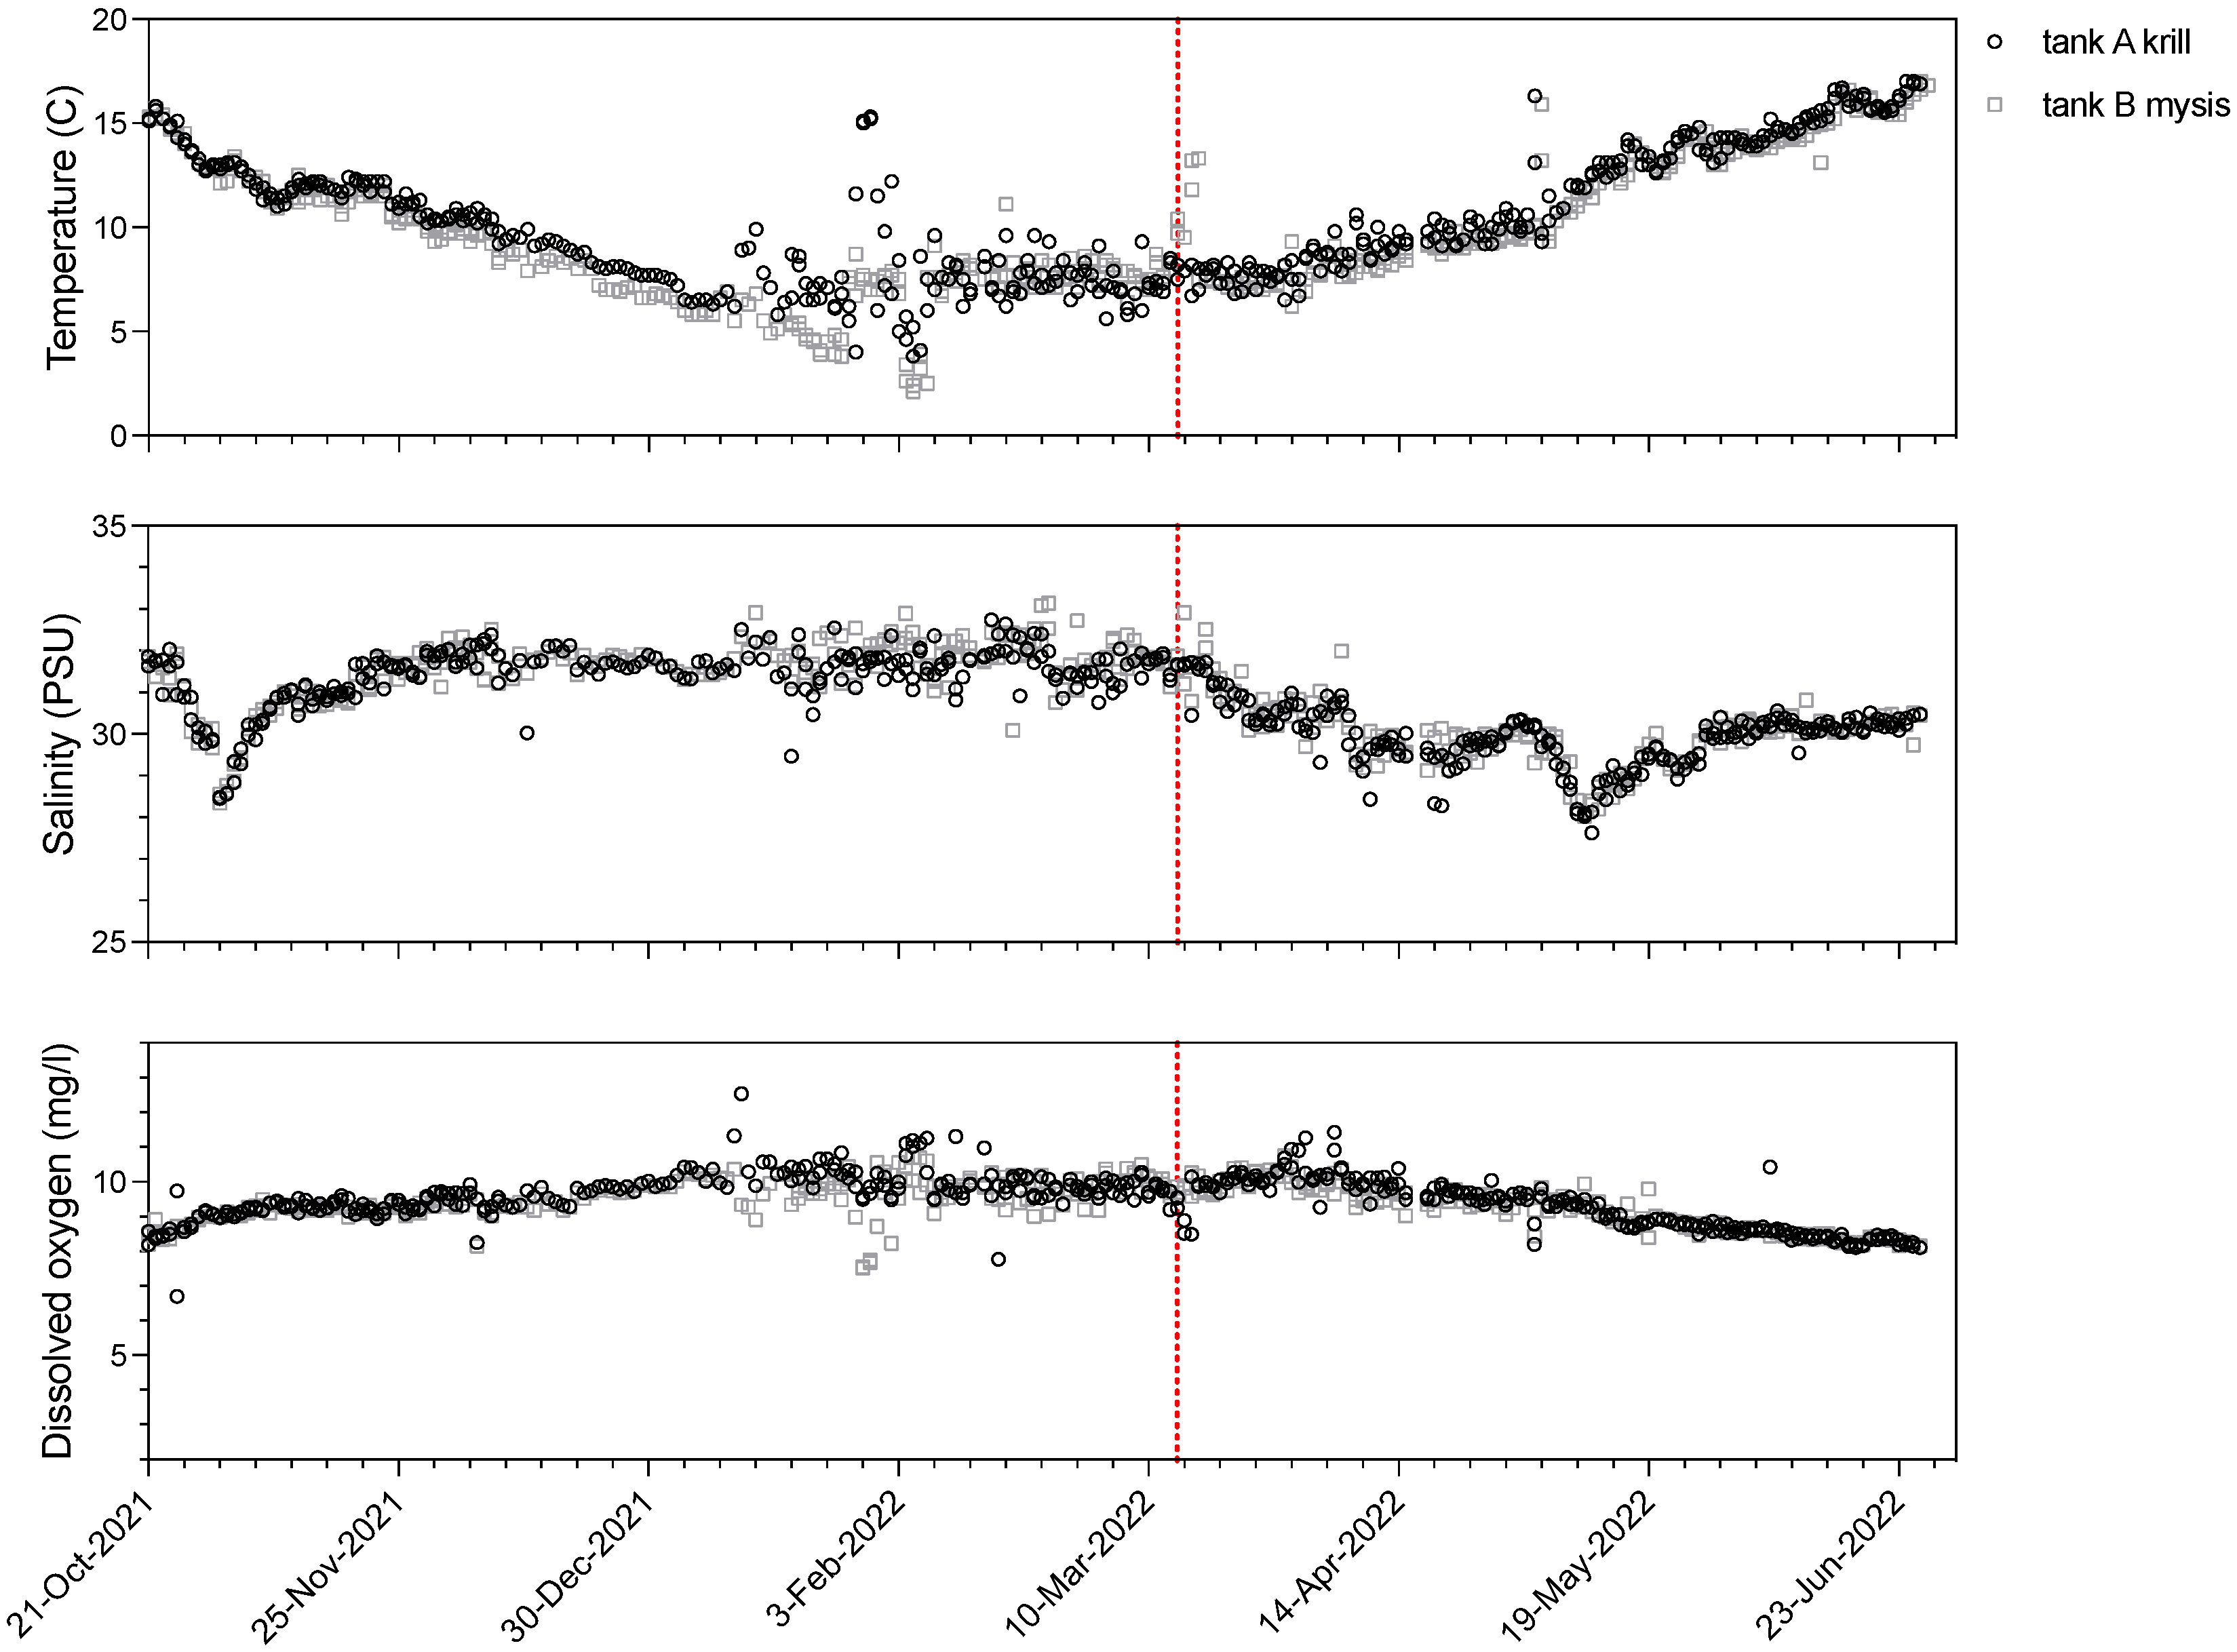
2.2. Experimental Design
2.3. Diet Switch
2.4. Stable Isotope Sample Preparation and Analysis
2.5. Modeling
3. Results
3.1. Experimental Design
3.2. Diet Switch
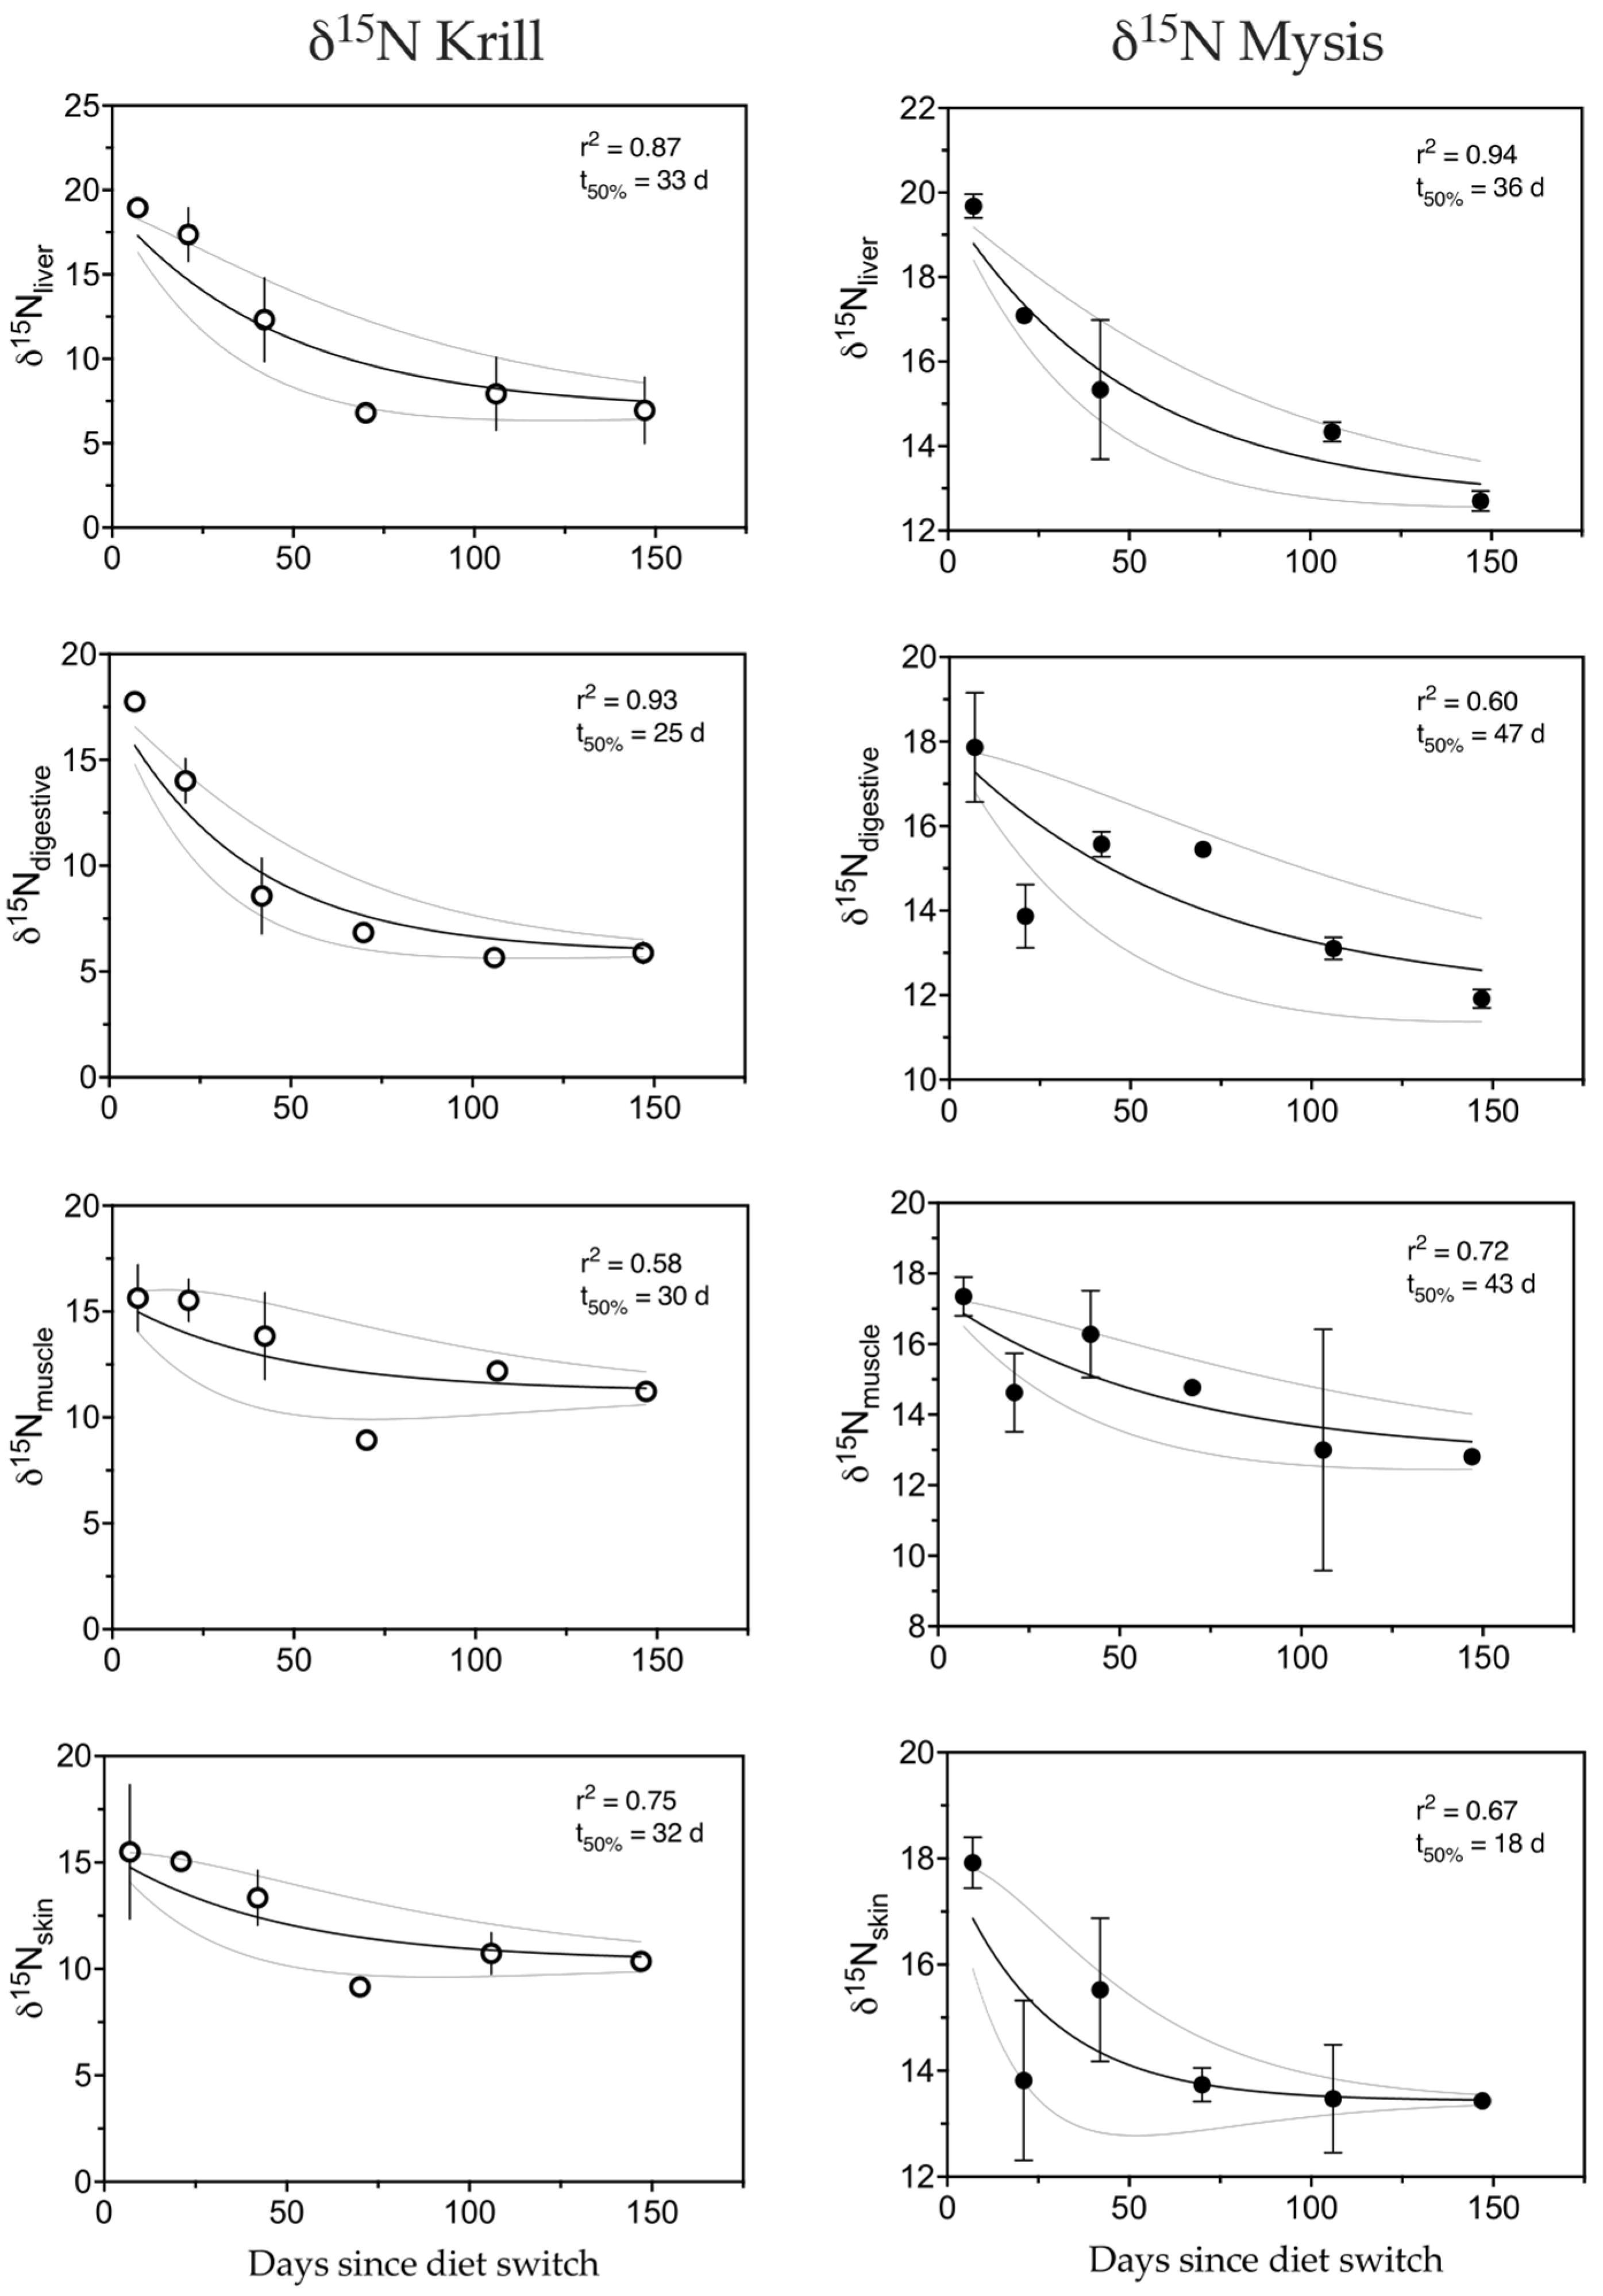
3.3. Modeling
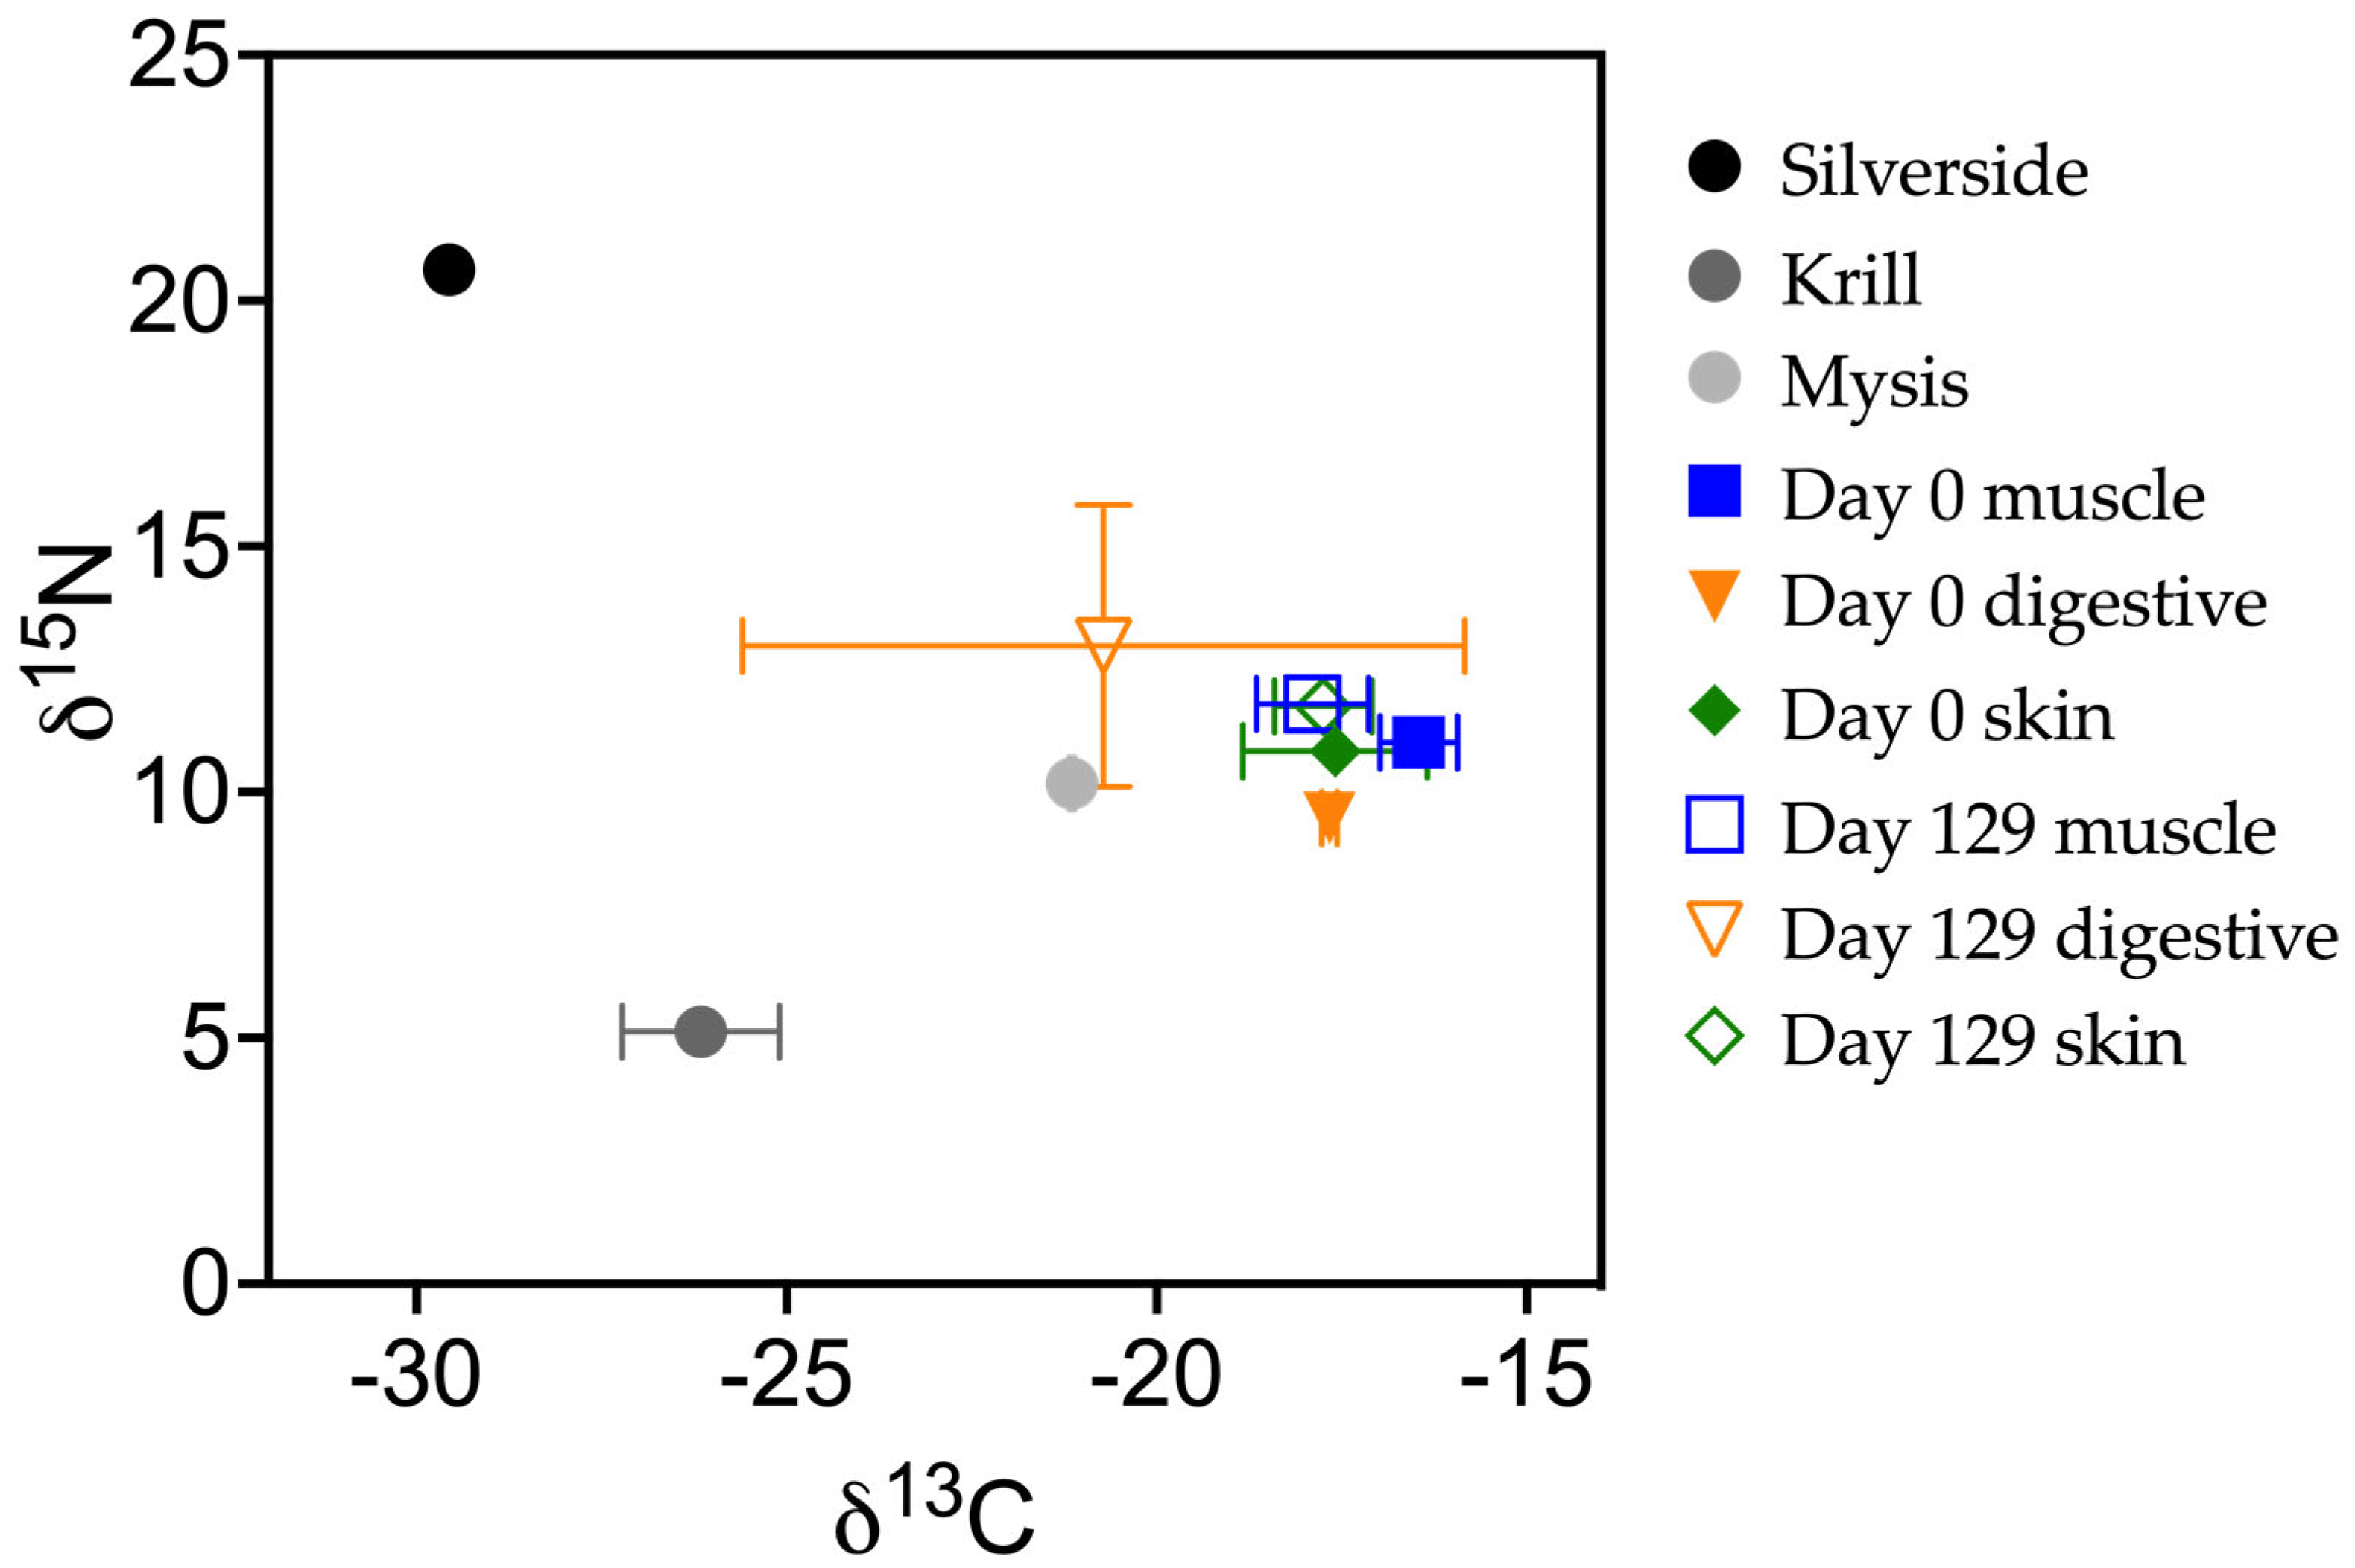
3.4. Nitrogen
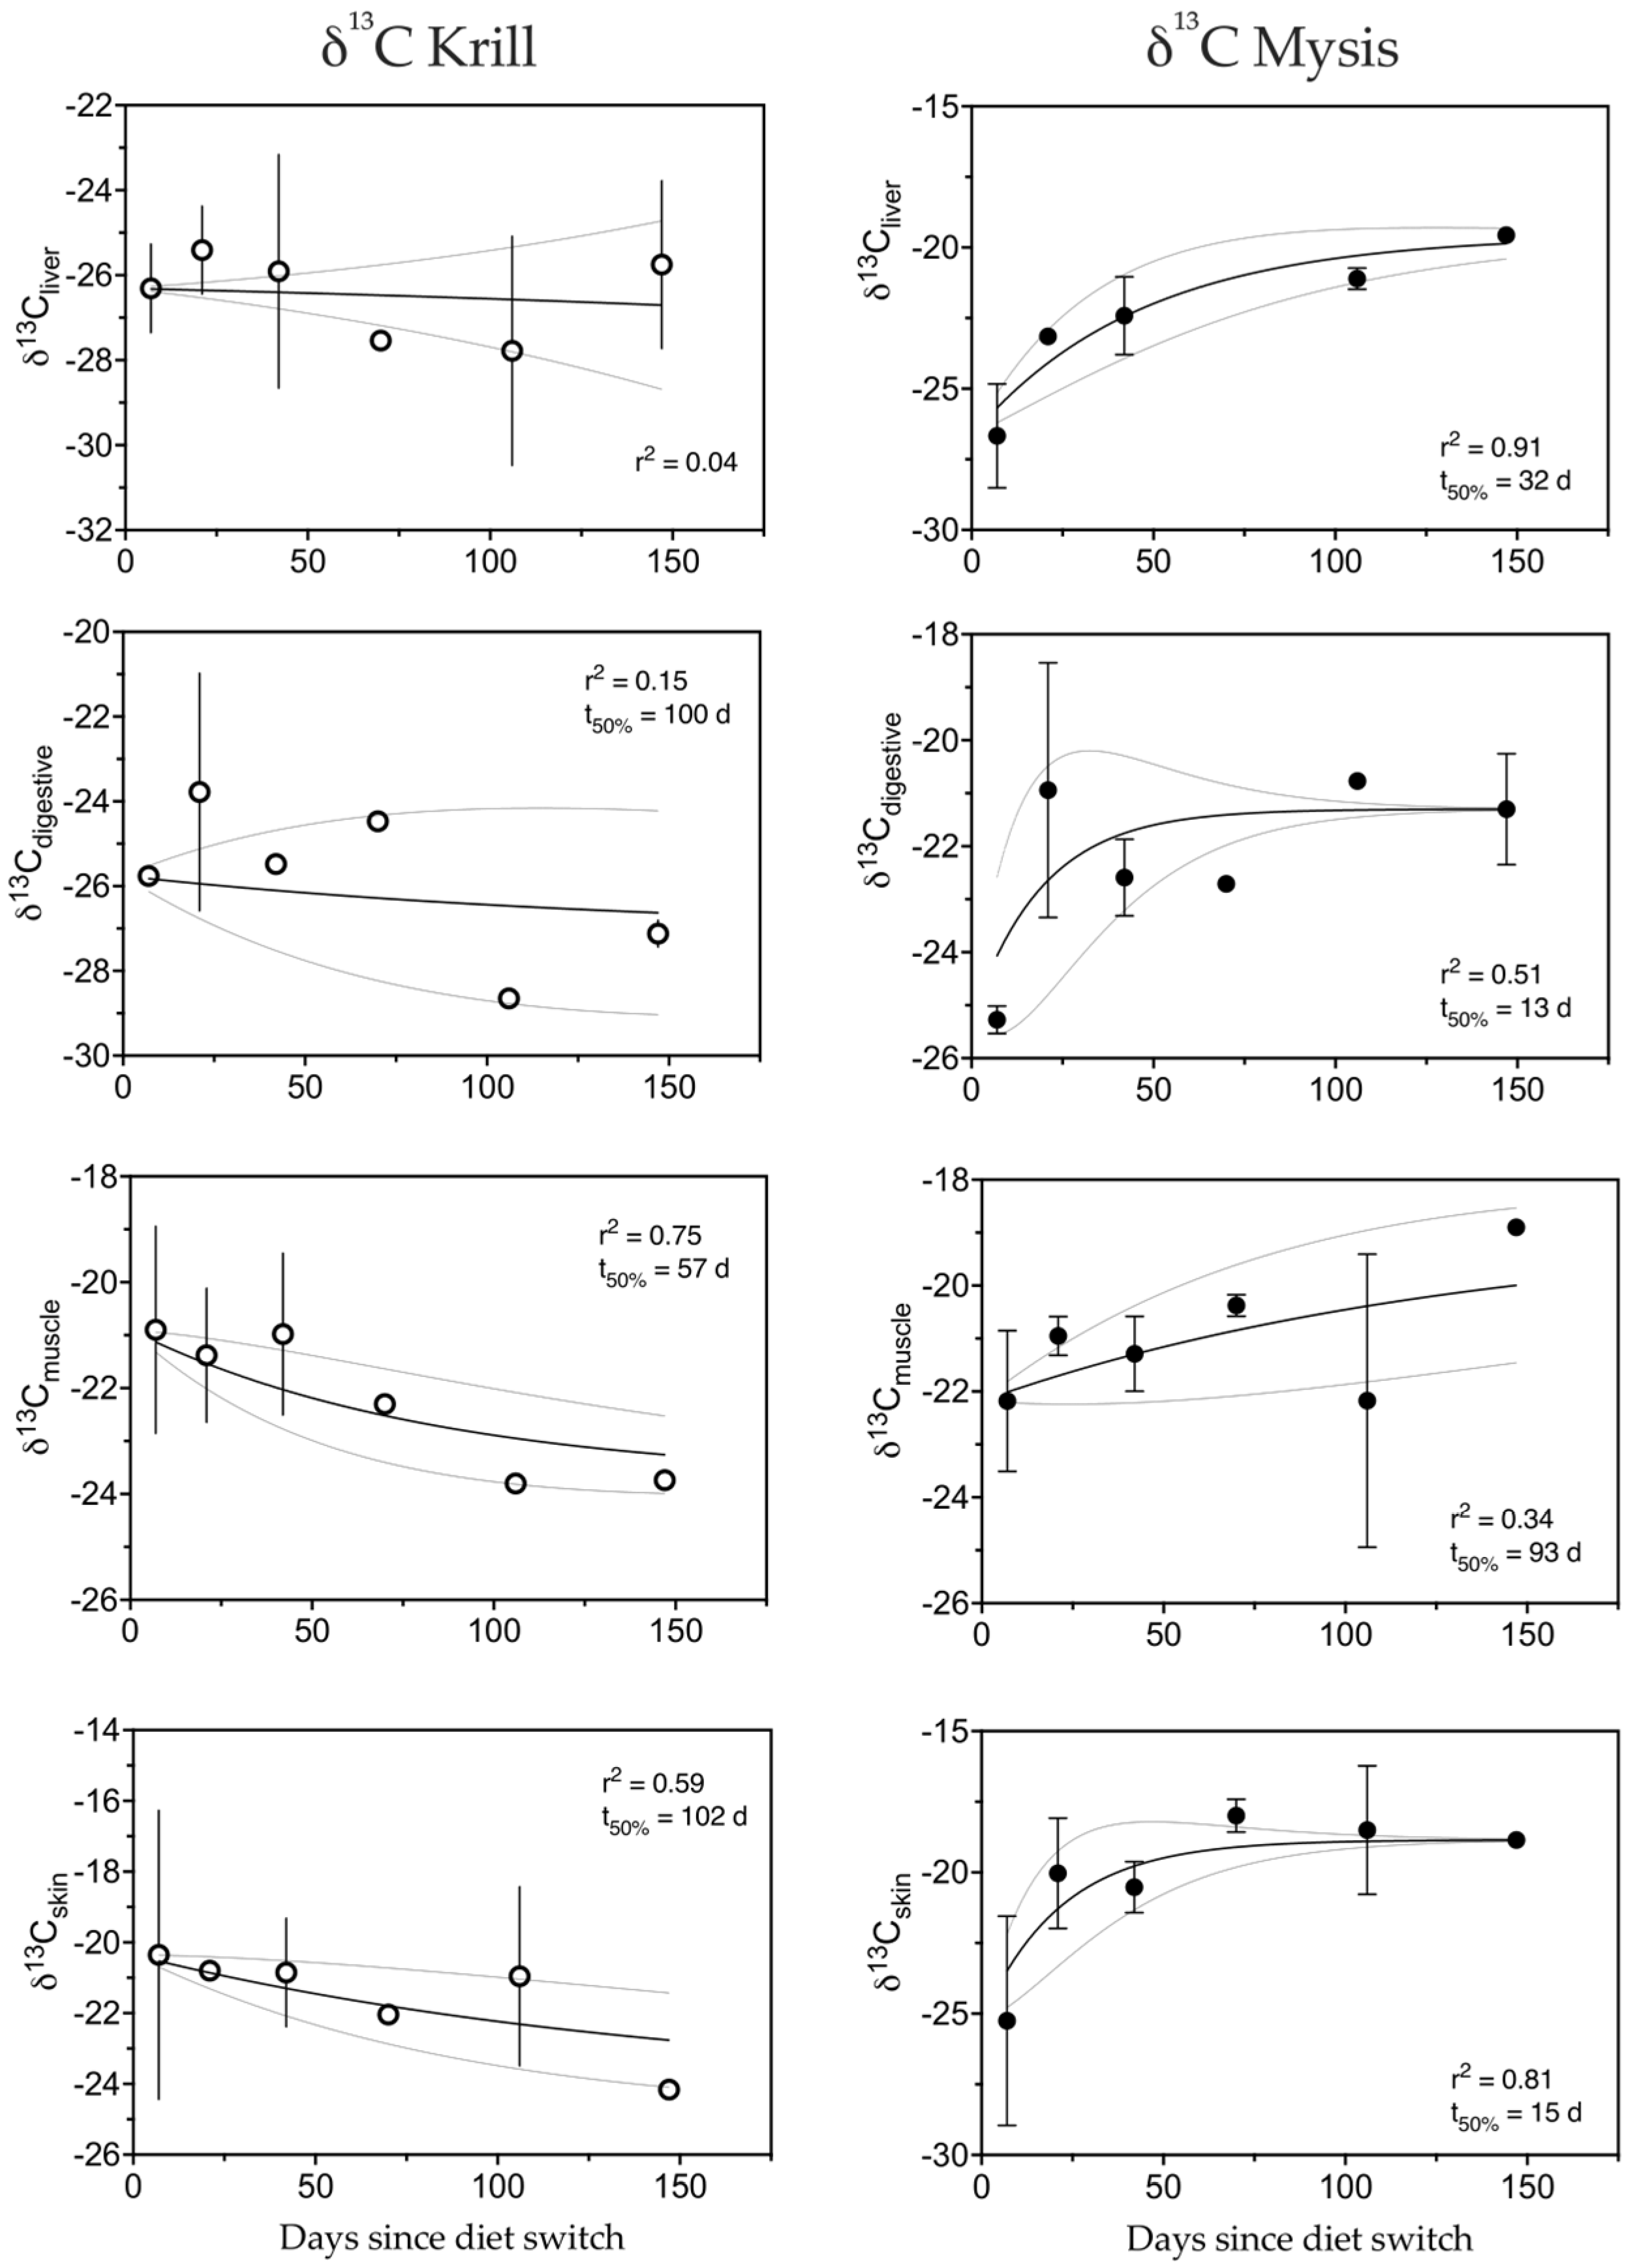
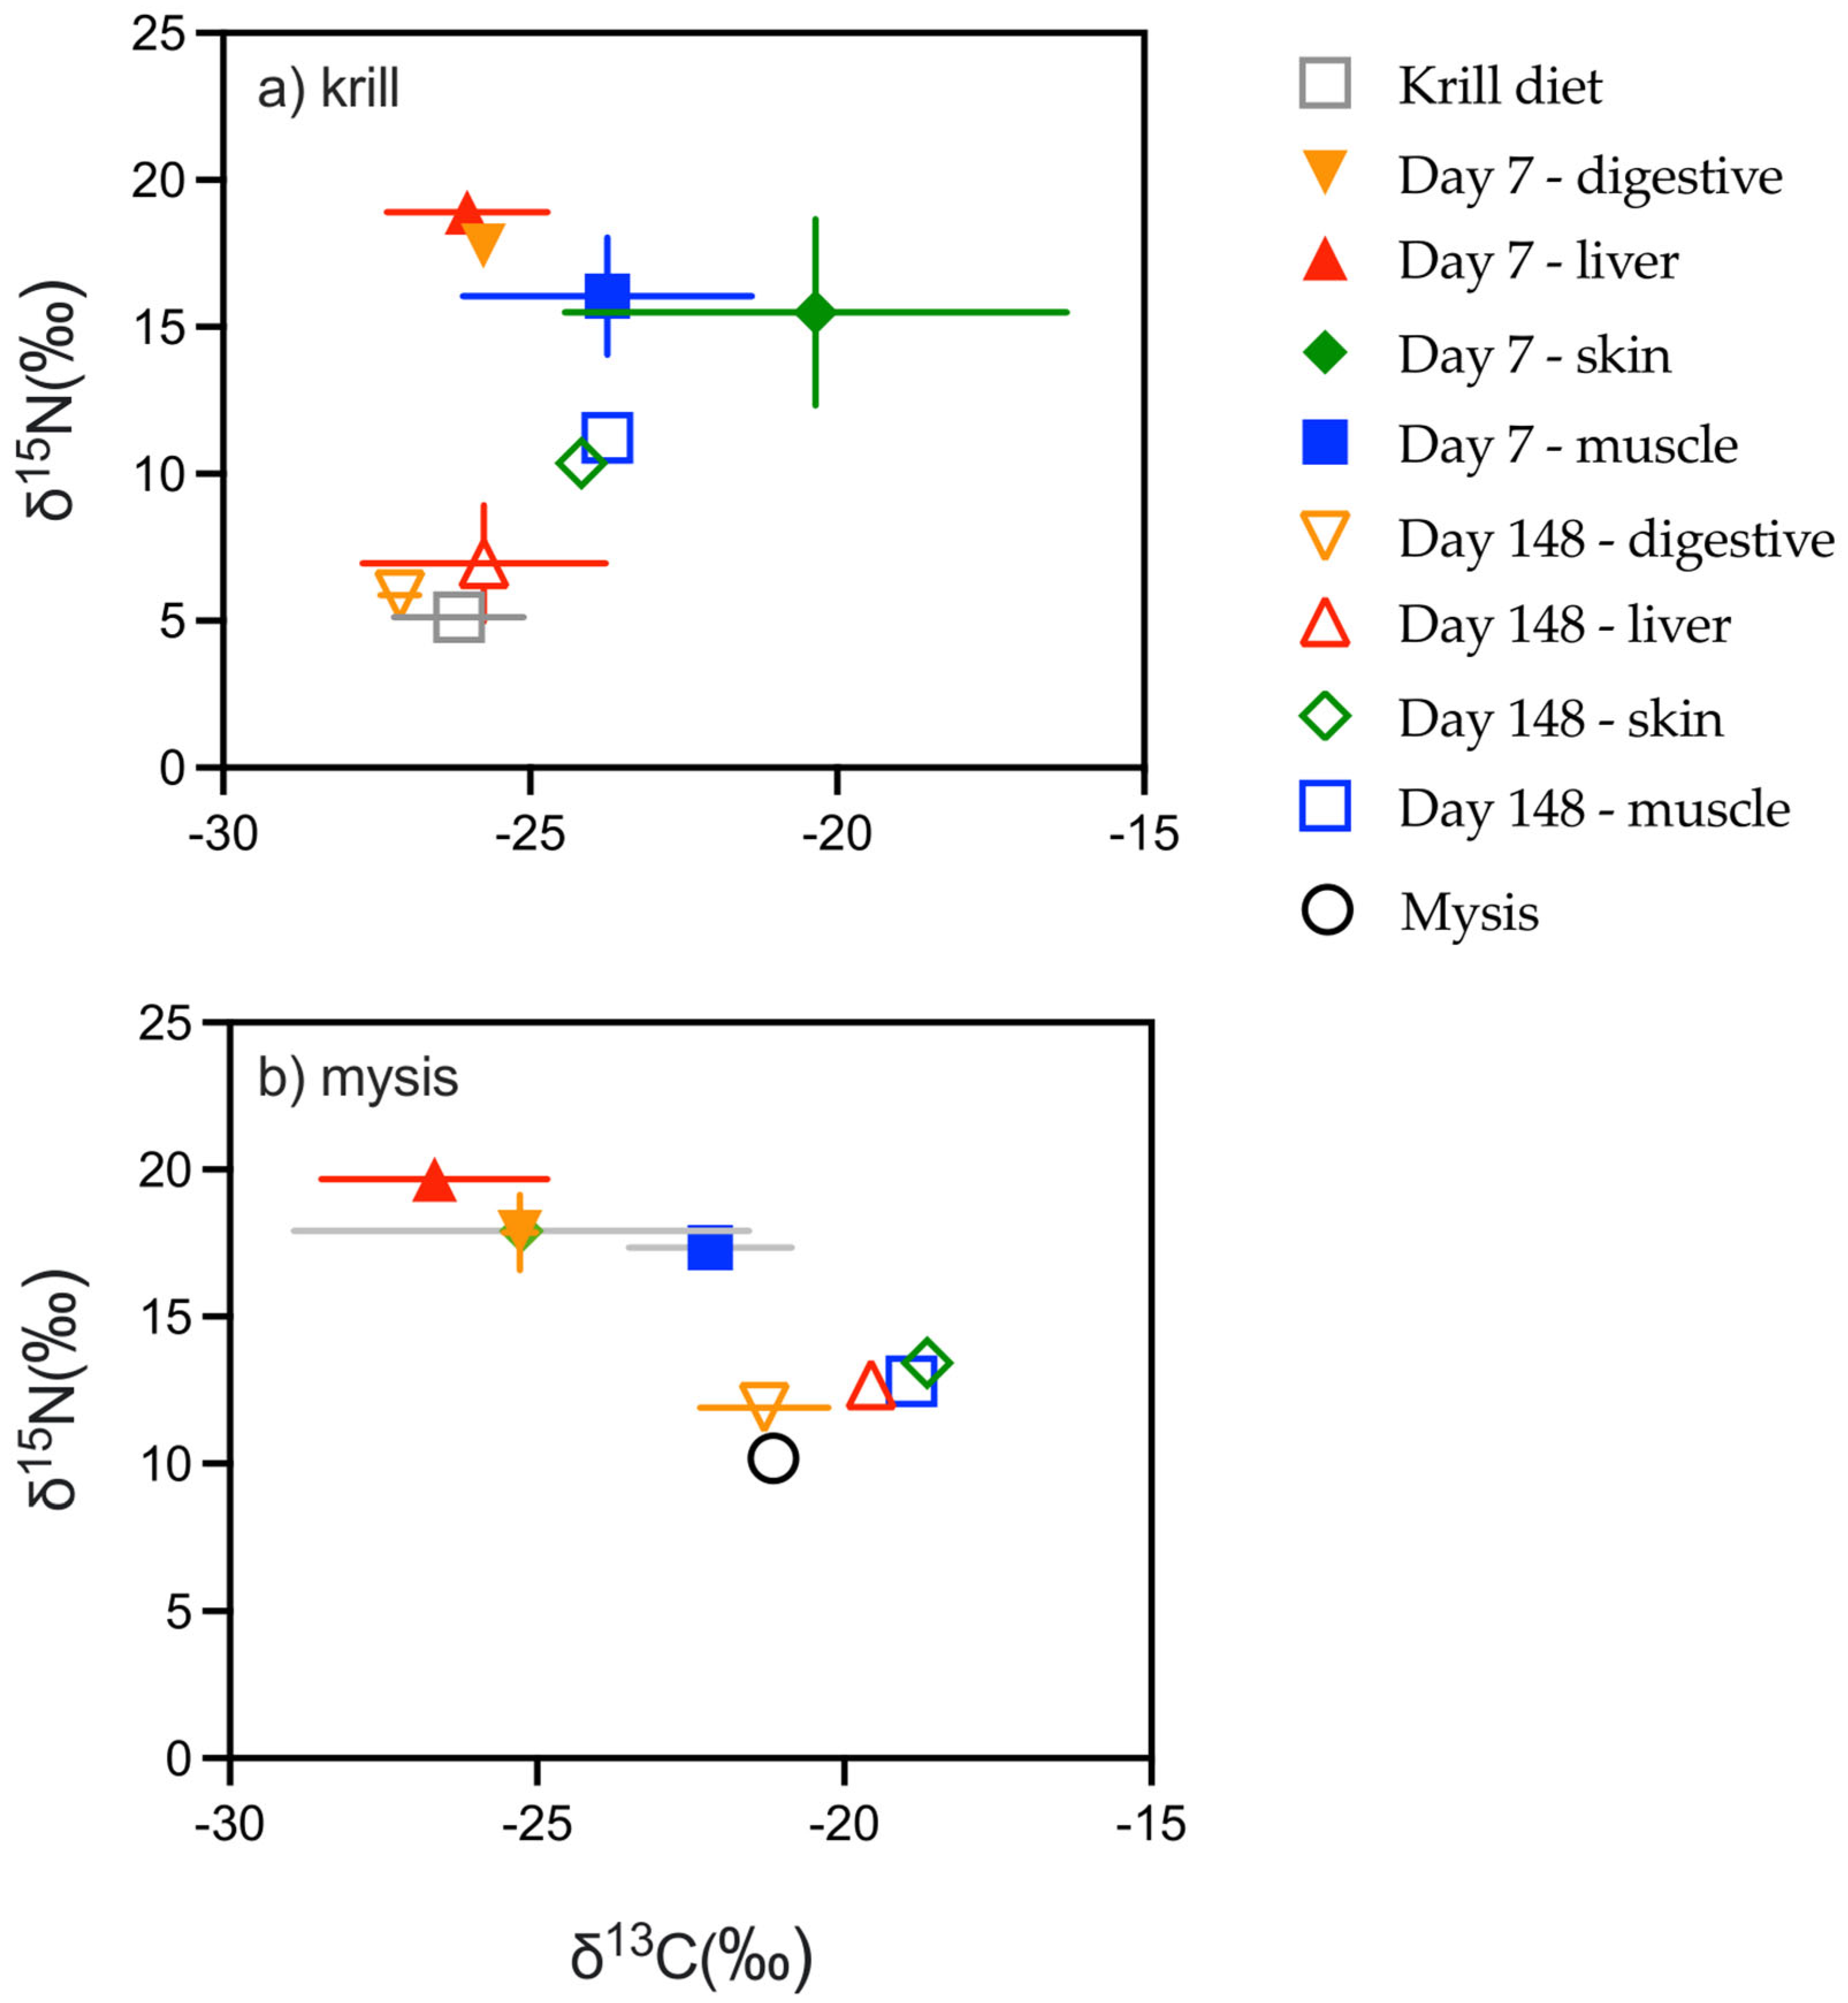
3.5. Carbon
3.6. Tissue Discrimination Factors
4. Discussion
4.1. Tissue Turnover
4.1.1. Nitrogen
4.1.2. Carbon
4.2. TDF
5. Conclusions
Author Contributions
Funding
Institutional Review Board Statement
Data Availability Statement
Acknowledgments
Conflicts of Interest
References
- Fry, B.; Sherr, E.B. δ13C measurements as indicators of carbon flow in marine and freshwater ecosystems. In Stable Isotopes in Ecological Research; Springer: Berlin/Heidelberg, Germany, 1989; pp. 196–229. [Google Scholar]
- Fry, B. Stable Isotope Ecology; Springer: Berlin/Heidelberg, Germany, 2006. [Google Scholar]
- Frédérich, B.; Colleye, O.; Lepoint, G.; Lecchini, D. Mismatch between shape changes and ecological shifts during the post-settlement growth of the surgeonfish, Acanthurus triostegus. Front. Zool. 2012, 9, 1–9. [Google Scholar] [CrossRef]
- Glibert, P.M.; Middelburg, J.J.; McClelland, J.W.; Jake Vander Zanden, M. Stable isotope tracers: Enriching our perspectives and questions on sources, fates, rates, and pathways of major elements in aquatic systems. Limnol. Oceanogr. 2019, 64, 950–981. [Google Scholar] [CrossRef]
- Hobson, K.A.; Wassenaar, L.I.; Taylor, O.R. Stable isotopes (δD and δ 13C) are geographic indicators of natal origins of monarch butterflies in eastern North America. Oecologia 1999, 120, 397–404. [Google Scholar] [CrossRef]
- Peterson, B.J.; Fry, B. Stable isotopes in ecosystem studies. Annu. Rev. Ecol. Syst. 1987, 18, 293–320. [Google Scholar] [CrossRef]
- Schoeninger, M.J.; DeNiro, M.J. Nitrogen and carbon isotopic composition of bone collagen from marine and terrestrial animals. Geochim. Cosmochim. Acta 1984, 48, 625–639. [Google Scholar] [CrossRef]
- DeNiro, M.J.; Epstein, S. Influence of diet on the distribution of carbon isotopes in animals. Geochim. Cosmochim. Acta 1978, 42, 495–506. [Google Scholar] [CrossRef]
- Post, D.M. Using stable isotopes to estimate trophic position: Models, methods, and assumptions. Ecology 2002, 83, 703–718. [Google Scholar] [CrossRef]
- Buchheister, A.; Latour, R.J. Turnover and fractionation of carbon and nitrogen stable isotopes in tissues of a migratory coastal predator, summer flounder (Paralichthys dentatus). Can. J. Fish. Aquat. Sci. 2010, 67, 445–461. [Google Scholar] [CrossRef]
- Herzka, S.Z. Assessing connectivity of estuarine fishes based on stable isotope ratio analysis. Estuar. Coast. Shelf Sci. 2005, 64, 58–69. [Google Scholar] [CrossRef]
- Mohan, J.A.; Smith, S.D.; Connelly, T.L.; Attwood, E.T.; McClelland, J.W.; Herzka, S.Z.; Walther, B.D. Tissue-specific isotope turnover and discrimination factors are affected by diet quality and lipid content in an omnivorous consumer. J. Exp. Mar. Biol. Ecol. 2016, 479, 35–45. [Google Scholar] [CrossRef]
- Hamaoka, H.; Sogabe, A.; Omori, K. Spatial variation of carbon and nitrogen stable isotope ratios in Japanese anchovy, Engraulis japonicus, in the eastern Seto Inland Sea, Japan. Aquac. Sci. 2016, 64, 333–338. [Google Scholar]
- Bosley, K.L.; Witting, D.A.; Chambers, R.C.; Wainright, S.C. Estimating turnover rates of carbon and nitrogen in recently metamorphosed winter flounder Pseudopleuronectes americanus with stable isotopes. Mar. Ecol. Prog. Ser. 2002, 236, 233–240. [Google Scholar] [CrossRef]
- Fry, B.; Arnold, C. Rapid 13 C/12C turnover during growth of brown shrimp (Penaeus aztecus). Oecologia 1982, 54, 200–204. [Google Scholar] [CrossRef]
- Pecquerie, L.; Nisbet, R.M.; Fablet, R.; Lorrain, A.; Kooijman, S.A.L.M. The impact of metabolism on stable isotope dynamics: A theoretical framework. Philos. Trans. R. Soc. B Biol. Sci. 2010, 365, 3455–3468. [Google Scholar] [CrossRef] [PubMed]
- MacAvoy, S.E.; Arneson, L.S.; Bassett, E. Correlation of metabolism with tissue carbon and nitrogen turnover rate in small mammals. Oecologia 2006, 150, 190–201. [Google Scholar] [CrossRef]
- Herzka, S.Z.; Holt, S.A.; Holt, G.J. Documenting the settlement history of individual fish larvae using stable isotope ratios: Model development and validation. J. Exp. Mar. Biol. Ecol. 2001, 265, 49–74. [Google Scholar] [CrossRef]
- Link, J.S.; Bolles, K.; Milliken, C.G. The feeding ecology of flatfish in the Northwest Atlantic. J. Northwest Atl. Fish. Sci. 2002, 30, 1–17. [Google Scholar] [CrossRef]
- Witting, D.A.; Chambers, R.C.; Bosley, K.L.; Wainright, S.C. Experimental evaluation of ontogenetic diet transitions in summer flounder (Paralichthys dentatus), using stable isotopes as diet tracers. Can. J. Fish. Aquat. Sci. 2004, 61, 2069–2084. [Google Scholar] [CrossRef]
- Tominaga, O.; Uno, N.; Seikai, T. Influence of diet shift from formulated feed to live mysids on the carbon and nitrogen stable isotope ratio (δ13C and δ15N) in dorsal muscles of juvenile Japanese flounders, Paralichthys olivaceus. Aquaculture 2003, 218, 265–276. [Google Scholar] [CrossRef]
- Hamaoka, H.; Shoji, J.; Hori, M. Turnover rates of carbon and nitrogen stable isotopes in juvenile marbled flounder Pleuronectes yokohamae estimated by diet switch. Ichthyol. Res. 2016, 63, 201–206. [Google Scholar] [CrossRef]
- Wargo, A.M.; Tilburg, C.E.; Driggers, W.B.; Sulikowski, J.A. Observations on the distribution of ichthyoplankton within the Saco River estuary system. Northeast. Nat. 2009, 16, 647–654. [Google Scholar] [CrossRef]
- Reynolds, W.W.; Casterlin, M.E. Vagile macrofauna and the hydrographic environment of the Saco River Estuary and adjacent waters of the Gulf of Maine. Hydrobiologia 1985, 128, 207–215. [Google Scholar] [CrossRef]
- Pereira, J.J. Essential Fish Habitat Source Document. Winter Flounder, Pseudopleuronectes americanus, Life History and Habitat Characteristics; Diane Publishing: Collingdale, PA, USA, 1999. [Google Scholar]
- Hammer, L.J.; Furey, N.B.; Koh, W.Y.; Sulikowski, J.A. Movements of juvenile Winter Flounder in a southern Maine estuary. Northeast. Nat. 2020, 27, 502–519. [Google Scholar] [CrossRef]
- Furey, N.B.; Sulikowski, J.A. The fish assemblage structure of the Saco River estuary. Northeast. Nat. 2011, 18, 37–44. [Google Scholar] [CrossRef]
- Perry, A.L.; Low, P.J.; Ellis, J.R.; Reynolds, J.D. Climate change and distribution shifts in marine fishes. Science 2005, 308, 1912–1915. [Google Scholar] [CrossRef]
- Hare, J.A.; Morrison, W.E.; Nelson, M.W.; Stachura, M.M.; Teeters, E.J.; Griffis, R.B.; Alexander, M.A.; Scott, J.D.; Alade, L.; Bell, R.J.; et al. A vulnerability assessment of fish and invertebrates to climate change on the Northeast US Continental Shelf. PLoS ONE 2016, 11, e0146756. [Google Scholar] [CrossRef] [PubMed]
- Brierley, A.S.; Kingsford, M.J. Impacts of climate change on marine organisms and ecosystems. Curr. Biol. 2009, 19, R602–R614. [Google Scholar] [CrossRef]
- Watanabe, Y.; Seikai, T.; Tominaga, O. Estimation of growth and food consumption in juvenile Japanese flounder Paralichthys olivaceus using carbon stable isotope ratio δ13C under laboratory conditions. J. Exp. Mar. Biol. Ecol. 2005, 326, 187–198. [Google Scholar] [CrossRef]
- Watanabe, S.; Isshiki, T.; Kudo, T.; Yamada, A.; Katayama, S.; Fukuda, M. Using stable isotope ratios as a tracer of feeding adaptation in released Japanese flounder Paralichthys olivaceus. J. Fish Biol. 2006, 68, 1192–1205. [Google Scholar] [CrossRef]
- Sogard, S.M. Interpretation of otolith microstructure in juvenile winter flounder (Pseudopleuronectes americanus): Ontogenetic development, daily increment validation, and somatic growth relationships. Can. J. Fish Aquat. Sci. 1991, 48, 1862–1871. Available online: http://ci.nii.ac.jp/naid/80006192043/en/ (accessed on 1 March 2022). [CrossRef]
- Coplen, T.B. Guidelines and recommended terms for expression of stable-isotope-ratio and gas-ratio measurement results. Rapid Commun. Mass Spectrom. 2011, 25, 2538–2560. [Google Scholar] [CrossRef] [PubMed]
- Hesslein, R.H.; Hallard, K.A.; Ramlal, P. Replacement of sulfur, carbon, and nitrogen in tissue of growing broad whitefish (Coregonus nasus) in response to a change in diet traced by δ34S, δ13C, and δ15N. Can. J. Fish. Aquat. Sci. 1993, 50, 2071–2076. [Google Scholar] [CrossRef]
- Tieszen, L.L.; Boutton, T.W.; Tesdahl, K.G.; Slade, N.A. Fractionation and turnover of stable carbon isotopes in animal tissues: Implications for δ13C analysis of diet. Oecologia 1983, 57, 32–37. [Google Scholar] [CrossRef] [PubMed]
- Minagawa, M.; Wada, E. Stepwise enrichment of 15N along food chains: Further evidence and the relation between δ15N and animal age. Geochim. Cosmochim. Acta 1984, 48, 1135–1140. [Google Scholar] [CrossRef]
- Matley, J.K.; Fisk, A.T.; Tobin, A.J.; Heupel, M.R.; Simpfendorfer, C.A. Diet-tissue discrimination factors and turnover of carbon and nitrogen stable isotopes in tissues of an adult predatory coral reef fish, Plectropomus leopardus. Rapid Commun. Mass Spectrom. 2016, 30, 29–44. [Google Scholar] [CrossRef]
- Logan, J.; Haas, H.; Deegan, L.; Gaines, E. Turnover rates of nitrogen stable isotopes in the salt marsh mummichog, Fundulus heteroclitus, following a laboratory diet switch. Oecologia 2006, 147, 391–395. [Google Scholar] [CrossRef]
- Ziegler, A.F.; Bluhm, B.A.; Renaud, P.E.; Jørgensen, L.L. Isotopic turnover in polar cod (Boreogadus saida) muscle determined through a controlled feeding experiment. J. Fish Biol. 2023, 102, 1442–1454. [Google Scholar] [CrossRef]
- MacNeil, M.A.; Drouillard, K.G.; Fisk, A.T. Variable uptake and elimination of stable nitrogen isotopes between tissues in fish. Can. J. Fish. Aquat. Sci. 2006, 63, 345–353. [Google Scholar] [CrossRef]
- Busst, G.M.A.; Britton, J.R. Tissue-specific turnover rates of the nitrogen stable isotope as functions of time and growth in a cyprinid fish. Hydrobiologia 2018, 805, 49–60. [Google Scholar] [CrossRef]
- Carleton, S.A.; Del Rio, C.M. Growth and catabolism in isotopic incorporation: A new formulation and experimental data. Funct. Ecol. 2010, 24, 805–812. [Google Scholar] [CrossRef]
- Perga, M.-E.; Gerdeaux, D. ‘Are fish what they eat’all year round? Oecologia 2005, 144, 598–606. [Google Scholar] [CrossRef] [PubMed]
- Bloomfield, A.L.; Elsdon, T.S.; Walther, B.D.; Gier, E.J.; Gillanders, B.M. Temperature and diet affect carbon and nitrogen isotopes of fish muscle: Can amino acid nitrogen isotopes explain effects? J. Exp. Mar. Biol. Ecol. 2011, 399, 48–59. [Google Scholar] [CrossRef]
- Lueders-Dumont, J.A.; Forden, A.G.; Kast, E.R.; Mohan, J.A.; Walther, B.D.; Sigman, D.M.; Ward, B.B. Controls on the nitrogen isotopic composition of fish otolith organic matter: Lessons from a controlled diet switch experiment. Geochim. Cosmochim. Acta 2022, 316, 69–86. [Google Scholar] [CrossRef]
- Seminoff, J.A.; Bjorndal, K.A.; Bolten, A.B. Stable carbon and nitrogen isotope discrimination and turnover in pond sliders Trachemys scripta: Insights for trophic study of freshwater turtles. Copeia 2007, 2007, 534–542. [Google Scholar] [CrossRef]
- Hussey, N.E.; MacNeil, M.A.; Fisk, A.T. The requirement for accurate diet-tissue discrimination factors for interpreting stable isotopes in sharks: Comment on: Stable isotope dynamics in elasmobranch fishes. Hydrobiologia 2010, 654, 1–5. [Google Scholar] [CrossRef]
- Colborne, S.F.; Fisk, A.T.; Johnson, T.B. Tissue-specific turnover and diet-tissue discrimination factors of carbon and nitrogen isotopes of a common forage fish held at two temperatures. Rapid Commun. Mass Spectrom. 2017, 31, 1405–1414. [Google Scholar] [CrossRef]
- Busst, G.M.A.; Britton, J.R. High variability in stable isotope diet–tissue discrimination factors of two omnivorous freshwater fishes in controlled ex situ conditions. J. Exp. Biol. 2016, 219, 1060–1068. [Google Scholar] [CrossRef]
- Suzuki, K.W.; Kasai, A.; Nakayama, K.; Tanaka, M. Differential isotopic enrichment and half-life among tissues in Japanese temperate bass (Lateolabrax japonicus) juveniles: Implications for analyzing migration. Can. J. Fish. Aquat. Sci. 2005, 62, 671–678. [Google Scholar] [CrossRef]
- Sweeting, C.J.; Jennings, S.; Polunin, N.V.C. Variance in isotopic signatures as a descriptor of tissue turnover and degree of omnivory. Funct. Ecol. 2005, 19, 777–784. [Google Scholar] [CrossRef]
- Trueman, C.N.; McGill, R.A.R.; Guyard, P.H. The effect of growth rate on tissue-diet isotopic spacing in rapidly growing animals. An experimental study with Atlantic salmon (Salmo salar). Rapid Commun. Mass Spectrom. Int. J. Devoted Rapid Dissem. Up-to-the-Minute Res. Mass Spectrom. 2005, 19, 3239–3247. [Google Scholar] [CrossRef]


| TLi | TLt | Wi | Wt | WR | t | Tx | |
|---|---|---|---|---|---|---|---|
| P_ame09 | 15 | 15.6 | 46.9 | 42.4 | 0.9 | 7 | krill |
| P_ame10 | 14 | 14.5 | 36.8 | 39.9 | 1.08 | 7 | krill |
| P_ame11 | 15.3 | 15.2 | 47.2 | 46.3 | 0.98 | 7 | mysis |
| P_ame12 | 14 | 14.2 | 35.9 | 33 | 0.92 | 7 | mysis |
| P_ame13 | 17.2 | 16.5 | 65.9 | 59.2 | 0.9 | 21 | krill |
| P_ame14 | 15.4 | 14.7 | 58 | 54.3 | 0.94 | 21 | krill |
| P_ame15 | 15.4 | 15 | 40.7 | 38.4 | 0.94 | 21 | mysis |
| P_ame16 | 15.3 | 15.5 | 46.1 | 44.3 | 0.96 | 21 | mysis |
| P_ame17 | 15 | 13.5 | 47 | 33.5 | 0.71 | 42 | krill |
| P_ame18 | 13.2 | 12.1 | 23.7 | 23.3 | 0.98 | 42 | krill |
| P_ame19 | 14.2 | 14.3 | 36.2 | 33.9 | 0.94 | 42 | mysis |
| P_ame20 | 10.8 | 12 | 16.3 | 16.1 | 0.99 | 42 | mysis |
| P_ame21 | 9.4 | 8.4 | 9.1 | 8.4 | 0.93 | 70 | krill |
| P_ame22 | 13.6 | 13.7 | 19.8 | 39.1 | 1.98 | 70 | krill |
| P_ame23 | 10.1 | 10.7 | 12.3 | 13.7 | 1.11 | 70 | mysis |
| P_ame24 | 12 | 11.8 | 23 | 19.9 | 0.86 | 70 | mysis |
| P_ame25 | 11 | 13.2 | 15.3 | 33.2 | 2.18 | 105 | krill |
| P_ame26 | 10.2 | 11 | 16 | 23.6 | 1.47 | 105 | krill |
| P_ame27 | 10.4 | 10.6 | 12.4 | 12.5 | 1.01 | 105 | mysis |
| P_ame28 | 10.3 | 11.4 | 14 | 17.4 | 1.24 | 105 | mysis |
| P_ame29 | 11.3 | 16.9 | 27.3 | 1.61 | 147 | krill | |
| P_ame30 | 9.2 | 12.51 | 10.1 | 9.9 | 0.99 | 147 | krill |
| P_ame31 | 8.7 | 9.3 | 6.7 | 7.9 | 1.19 | 147 | mysis |
| P_ame32 | 10 | 10.7 | 12.7 | 11.6 | 0.91 | 147 | mysis |
| δ15Ninitial | δ13Cinitial | C:Ninitial | δ15Nfinal | δ13Cfinal | C:Nfinal | ||||
|---|---|---|---|---|---|---|---|---|---|
| Diet | Silverside | 20.6 | −29.6 | 3.6 | Krill | 5.1 | −26.2 | 4 | |
| Winter flounder tissue | Liver | 19 | −26.3 | 4.8 | Winter flounder tissue | Liver | 7 | −25.8 | 4.3 |
| Digestive | 17.8 | −25.8 | 3.7 | Digestive | 5.9 | −27.1 | 5.1 | ||
| Muscle | 15.6 | −20.9 | 3.3 | Muscle | 11.2 | −23.7 | 3.2 | ||
| Skin | 15.5 | −20.4 | 3.2 | Skin | 10.4 | −24.2 | 3.4 |
| δ15Ninitial | δ13Cinitial | C:Ninitial | δ15Nfinal | δ13Cfinal | C:Nfinal | ||||
|---|---|---|---|---|---|---|---|---|---|
| Diet | Silverside | 20.6 | −29.6 | 3.6 | Mysis | 10.18 | −21.145 | 4 | |
| Winter flounder tissue | Liver | 17.4 | −26.7 | 5.6 | Winter flounder tissue | Liver | 12.7 | −19.6 | 3.7 |
| Digestive | 17.9 | −25.3 | 4.2 | Digestive | 11.9 | −21.3 | 4.6 | ||
| Muscle | 17.4 | −22.2 | 3.3 | Muscle | 12.8 | −18.9 | 3.1 | ||
| Skin | 17.9 | −25.3 | 4.8 | Skin | 13.4 | −18.7 | 3.1 |
| Isotope | Diet | Tissue | m | r2 | t50 | t95 | MTO |
|---|---|---|---|---|---|---|---|
| δ15N | Krill | Liver | 0.0200 | 0.87 | 33 | 142 | 0.95 |
| Digestive | 0.0262 | 0.93 | 25 | 110 | 0.96 | ||
| Muscle | 0.0221 | 0.58 | 30 | 130 | 0.96 | ||
| Skin | 0.0206 | 0.75 | 32 | 138 | 0.95 | ||
| Mysis | Liver | 0.0184 | 0.94 | 36 | 154 | 0.95 | |
| Digestive | 0.0138 | 0.6 | 47 | 202 | 0.93 | ||
| Muscle | 0.0152 | 0.72 | 43 | 185 | 0.94 | ||
| Skin | 0.0369 | 0.67 | 18 | 79 | 0.97 | ||
| δ13C | Krill | Liver | −0.0046 | 0.04 | −191 | −827 | 1.28 |
| Digestive | 0.0059 | 0.15 | 100 | 433 | 0.86 | ||
| Muscle | 0.0111 | 0.75 | 57 | 248 | 0.92 | ||
| Skin | 0.0058 | 0.59 | 102 | 439 | 0.85 | ||
| Mysis | Liver | 0.0205 | 0.91 | 32 | 139 | 0.95 | |
| Digestive | 0.0506 | 0.51 | 13 | 58 | 0.98 | ||
| Muscle | 0.0065 | 0.34 | 93 | 401 | 0.87 | ||
| Skin | 0.0450 | 0.81 | 15 | 65 | 0.98 |
| Tissue | Krill | Mysis | ||
|---|---|---|---|---|
| ∆ δ15N | ∆ δ13C | ∆ δ15N | ∆ δ13C | |
| Liver | 1.90 | 0.40 | 2.52 | 1.55 |
| Digestive | 0.80 | −0.90 | 1.72 | −0.15 |
| Muscle | 6.10 | 2.50 | 2.62 | 2.25 |
| Skin | 5.30 | 2.00 | 3.22 | 2.45 |
Disclaimer/Publisher’s Note: The statements, opinions and data contained in all publications are solely those of the individual author(s) and contributor(s) and not of MDPI and/or the editor(s). MDPI and/or the editor(s) disclaim responsibility for any injury to people or property resulting from any ideas, methods, instructions or products referred to in the content. |
© 2023 by the authors. Licensee MDPI, Basel, Switzerland. This article is an open access article distributed under the terms and conditions of the Creative Commons Attribution (CC BY) license (https://creativecommons.org/licenses/by/4.0/).
Share and Cite
Binstock, A.L.; Fox, A.S.; Mohan, J.A. Isotopic Turnover and Fractionation of δ15N and δ13C in Captive Pseudopleuronectes americanus (Walbaum). Fishes 2023, 8, 469. https://doi.org/10.3390/fishes8090469
Binstock AL, Fox AS, Mohan JA. Isotopic Turnover and Fractionation of δ15N and δ13C in Captive Pseudopleuronectes americanus (Walbaum). Fishes. 2023; 8(9):469. https://doi.org/10.3390/fishes8090469
Chicago/Turabian StyleBinstock, Addie L., Audrey S. Fox, and John A. Mohan. 2023. "Isotopic Turnover and Fractionation of δ15N and δ13C in Captive Pseudopleuronectes americanus (Walbaum)" Fishes 8, no. 9: 469. https://doi.org/10.3390/fishes8090469
APA StyleBinstock, A. L., Fox, A. S., & Mohan, J. A. (2023). Isotopic Turnover and Fractionation of δ15N and δ13C in Captive Pseudopleuronectes americanus (Walbaum). Fishes, 8(9), 469. https://doi.org/10.3390/fishes8090469