
Spatial–Temporal Characteristics and Influencing Factors of Marine Fishery Eco-Efficiency in China: Evidence from Coastal Regions

Abstract
:
1. Introduction
2. Theoretical Analysis, Research Methods and Index Construction
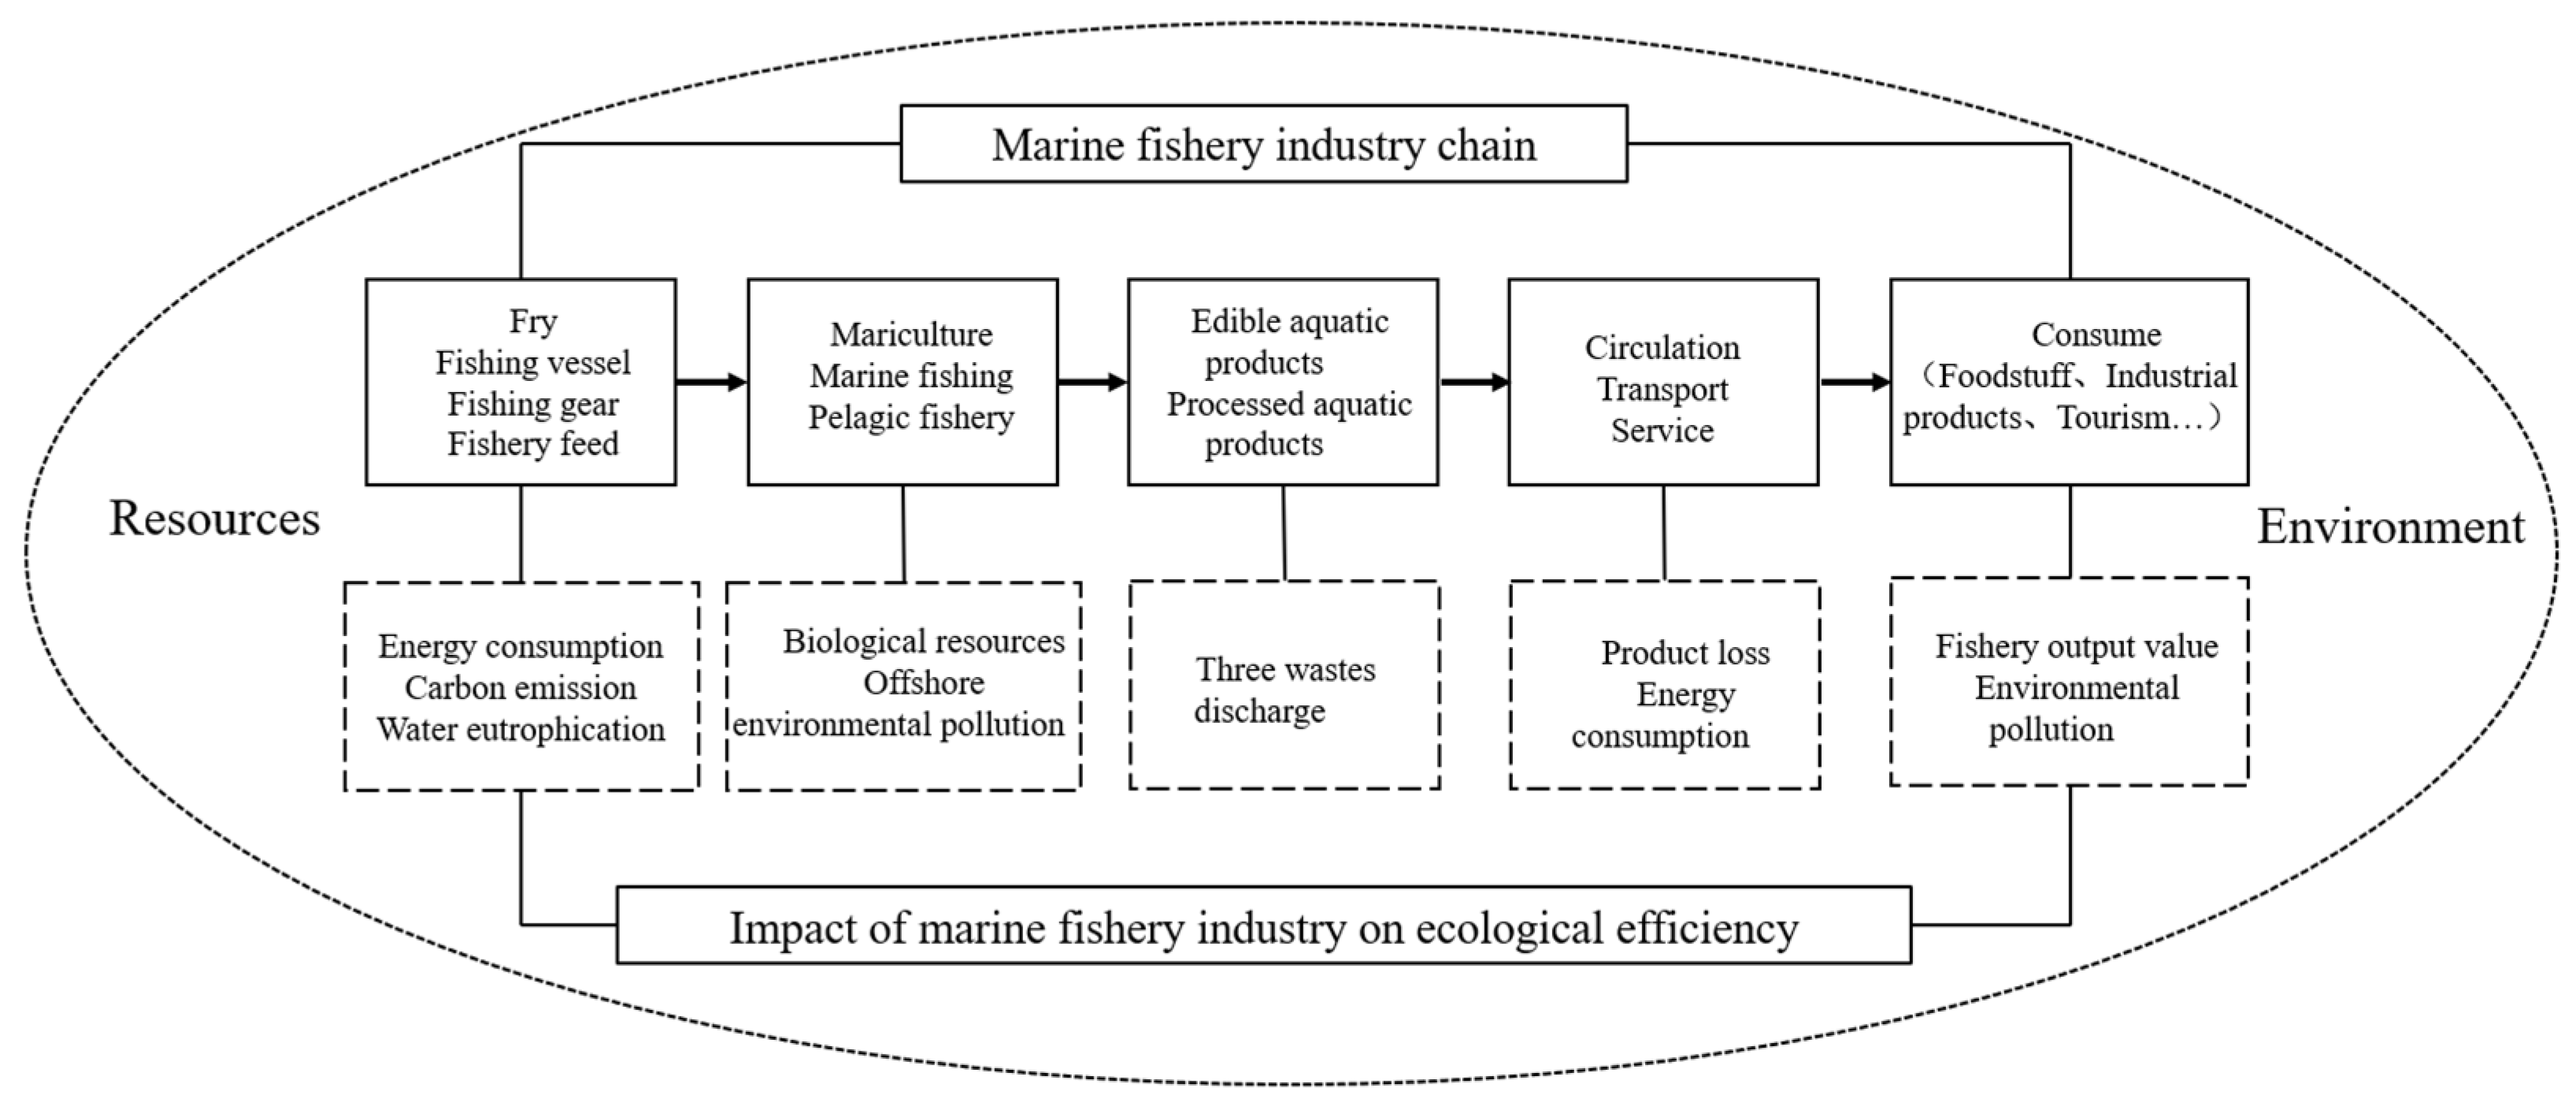
2.1. Theoretical Analysis
2.2. Research Methods
2.2.1. Super-SBM Model
2.2.2. Malmquist Index
2.2.3. Moran’s Index
2.2.4. Tobit Regression Model
2.3. Indicator Selection and Data Sources
2.3.1. Index System Construction
2.3.2. Data Source
3. Empirical Analysis and Results
3.1. Marine Fishery Ecological Efficiency Calculation
3.2. Time Trend of Marine Fishery Eco-Efficiency Change
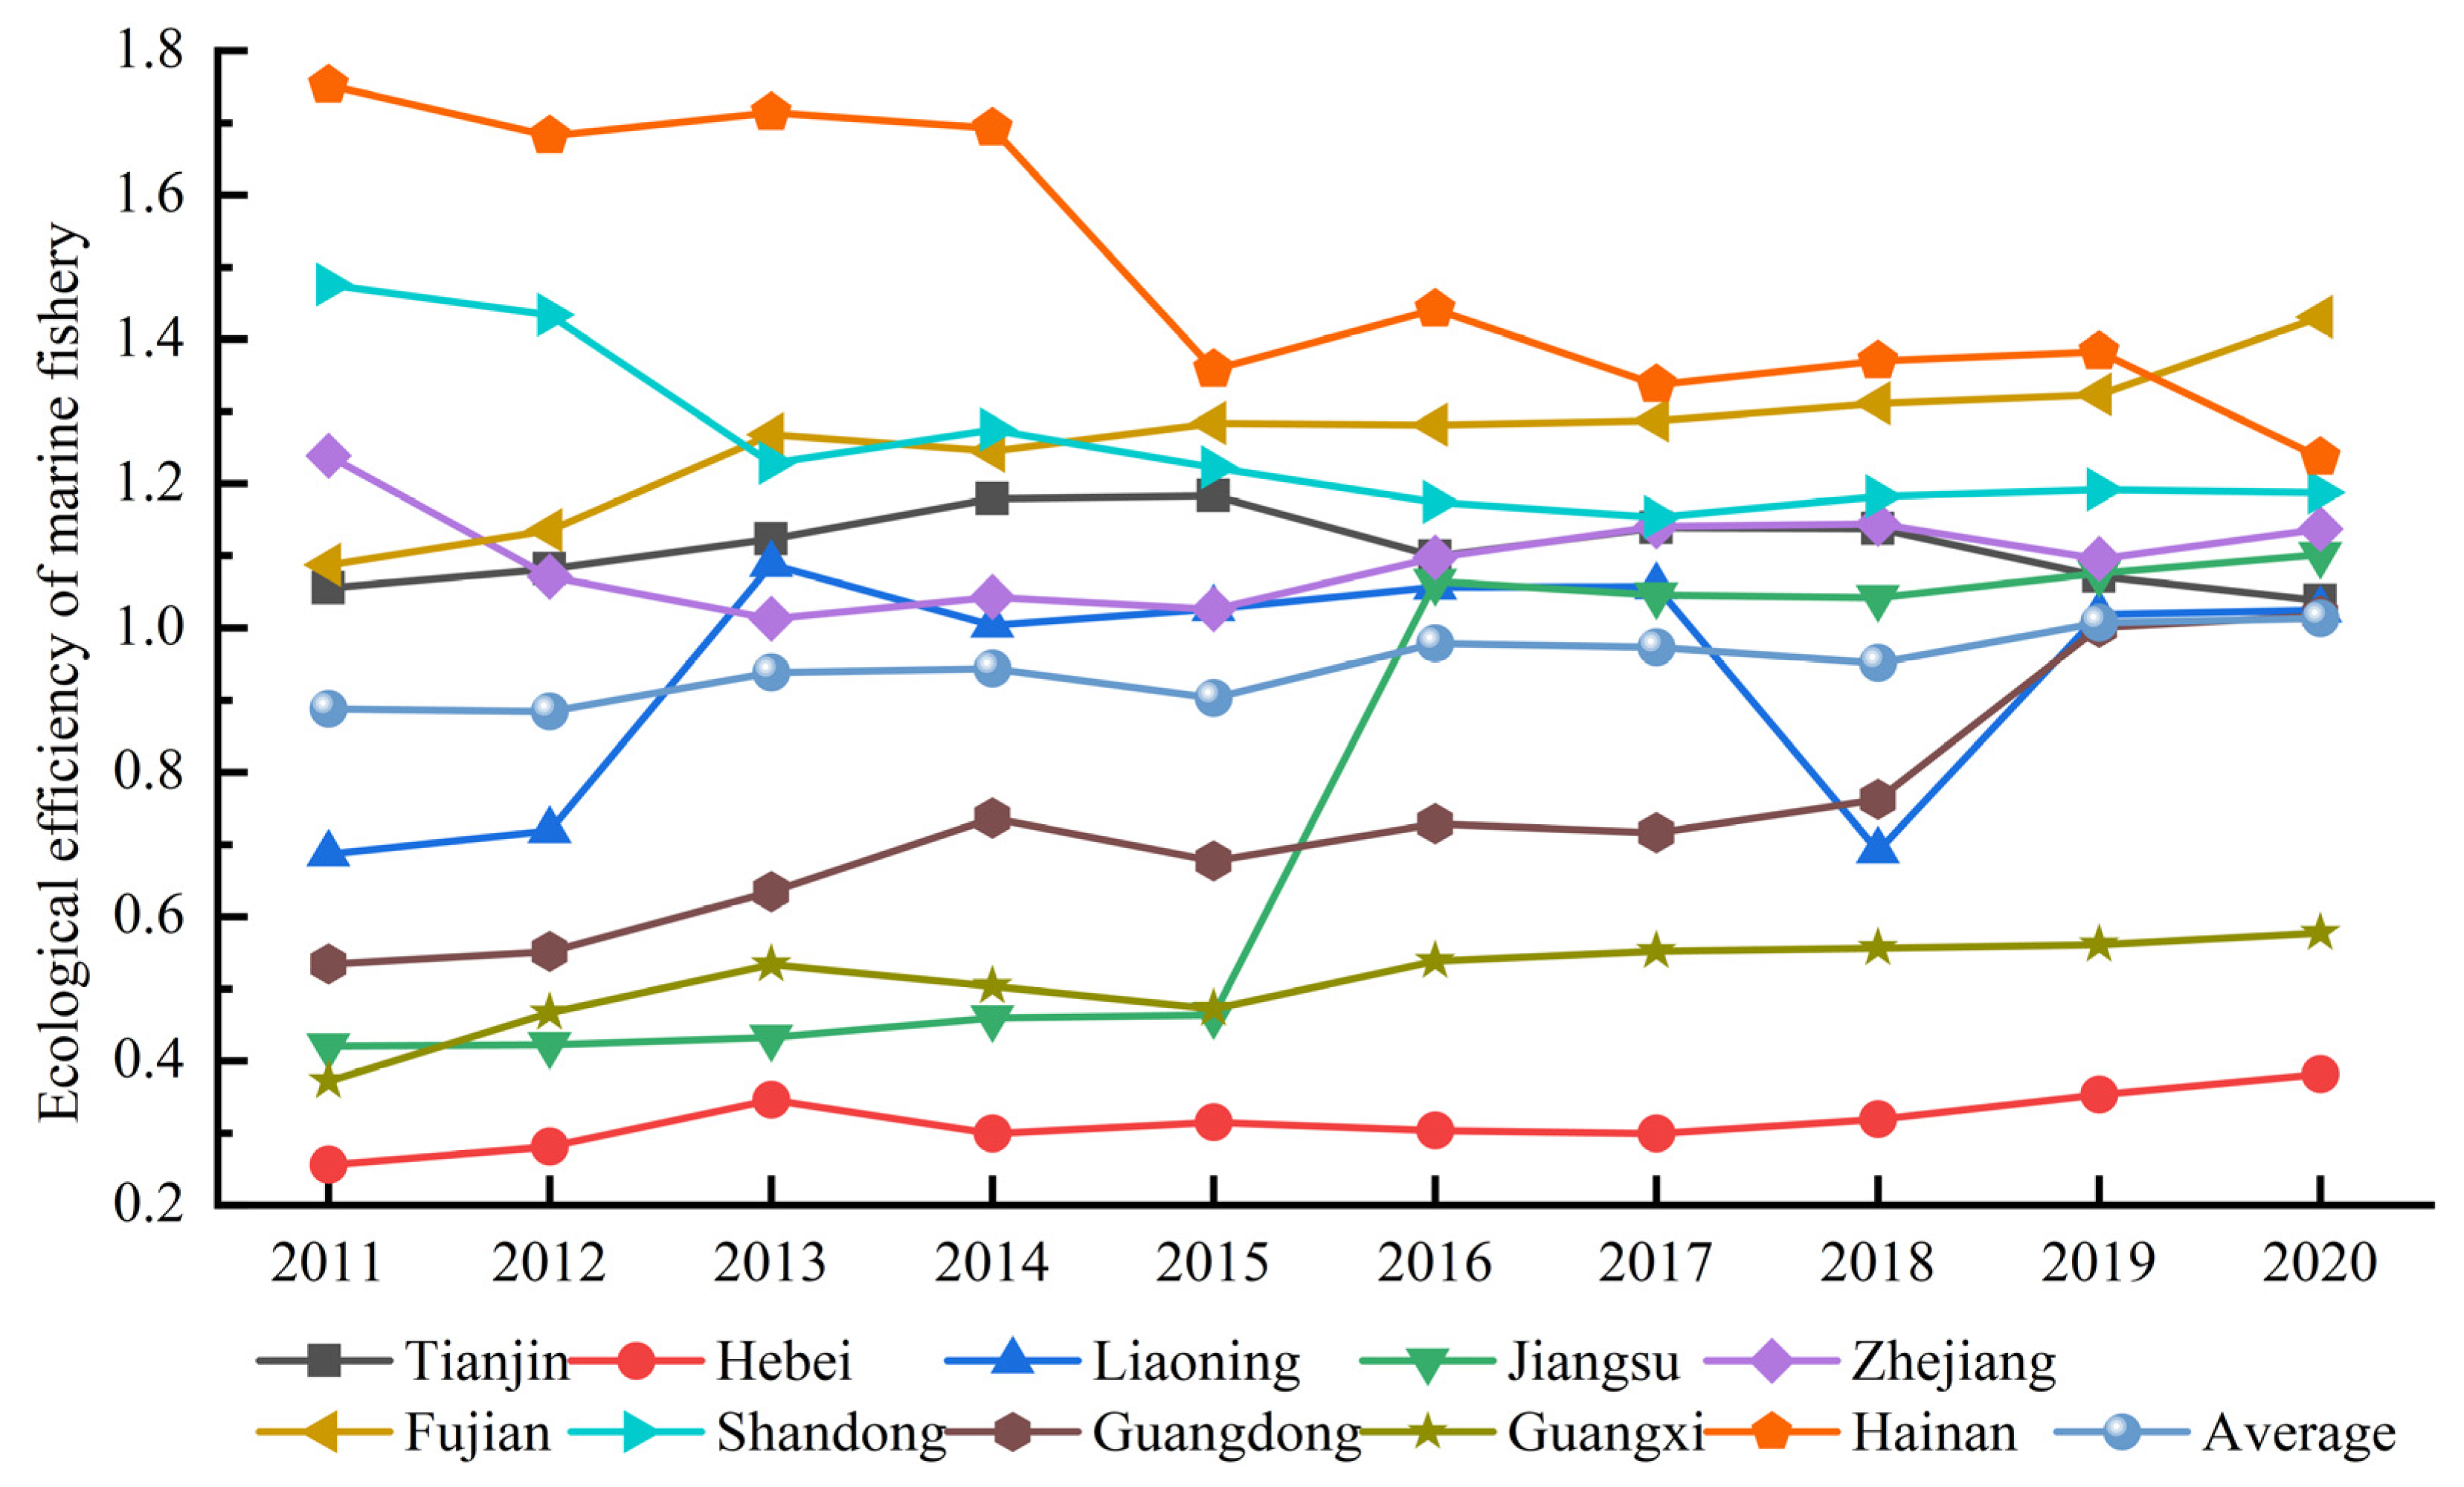
3.2.1. Static Analysis
3.2.2. Dynamic Analysis
3.3. Spatial–Temporal Evolution Characteristics of Marine Fishery Eco-Efficiency
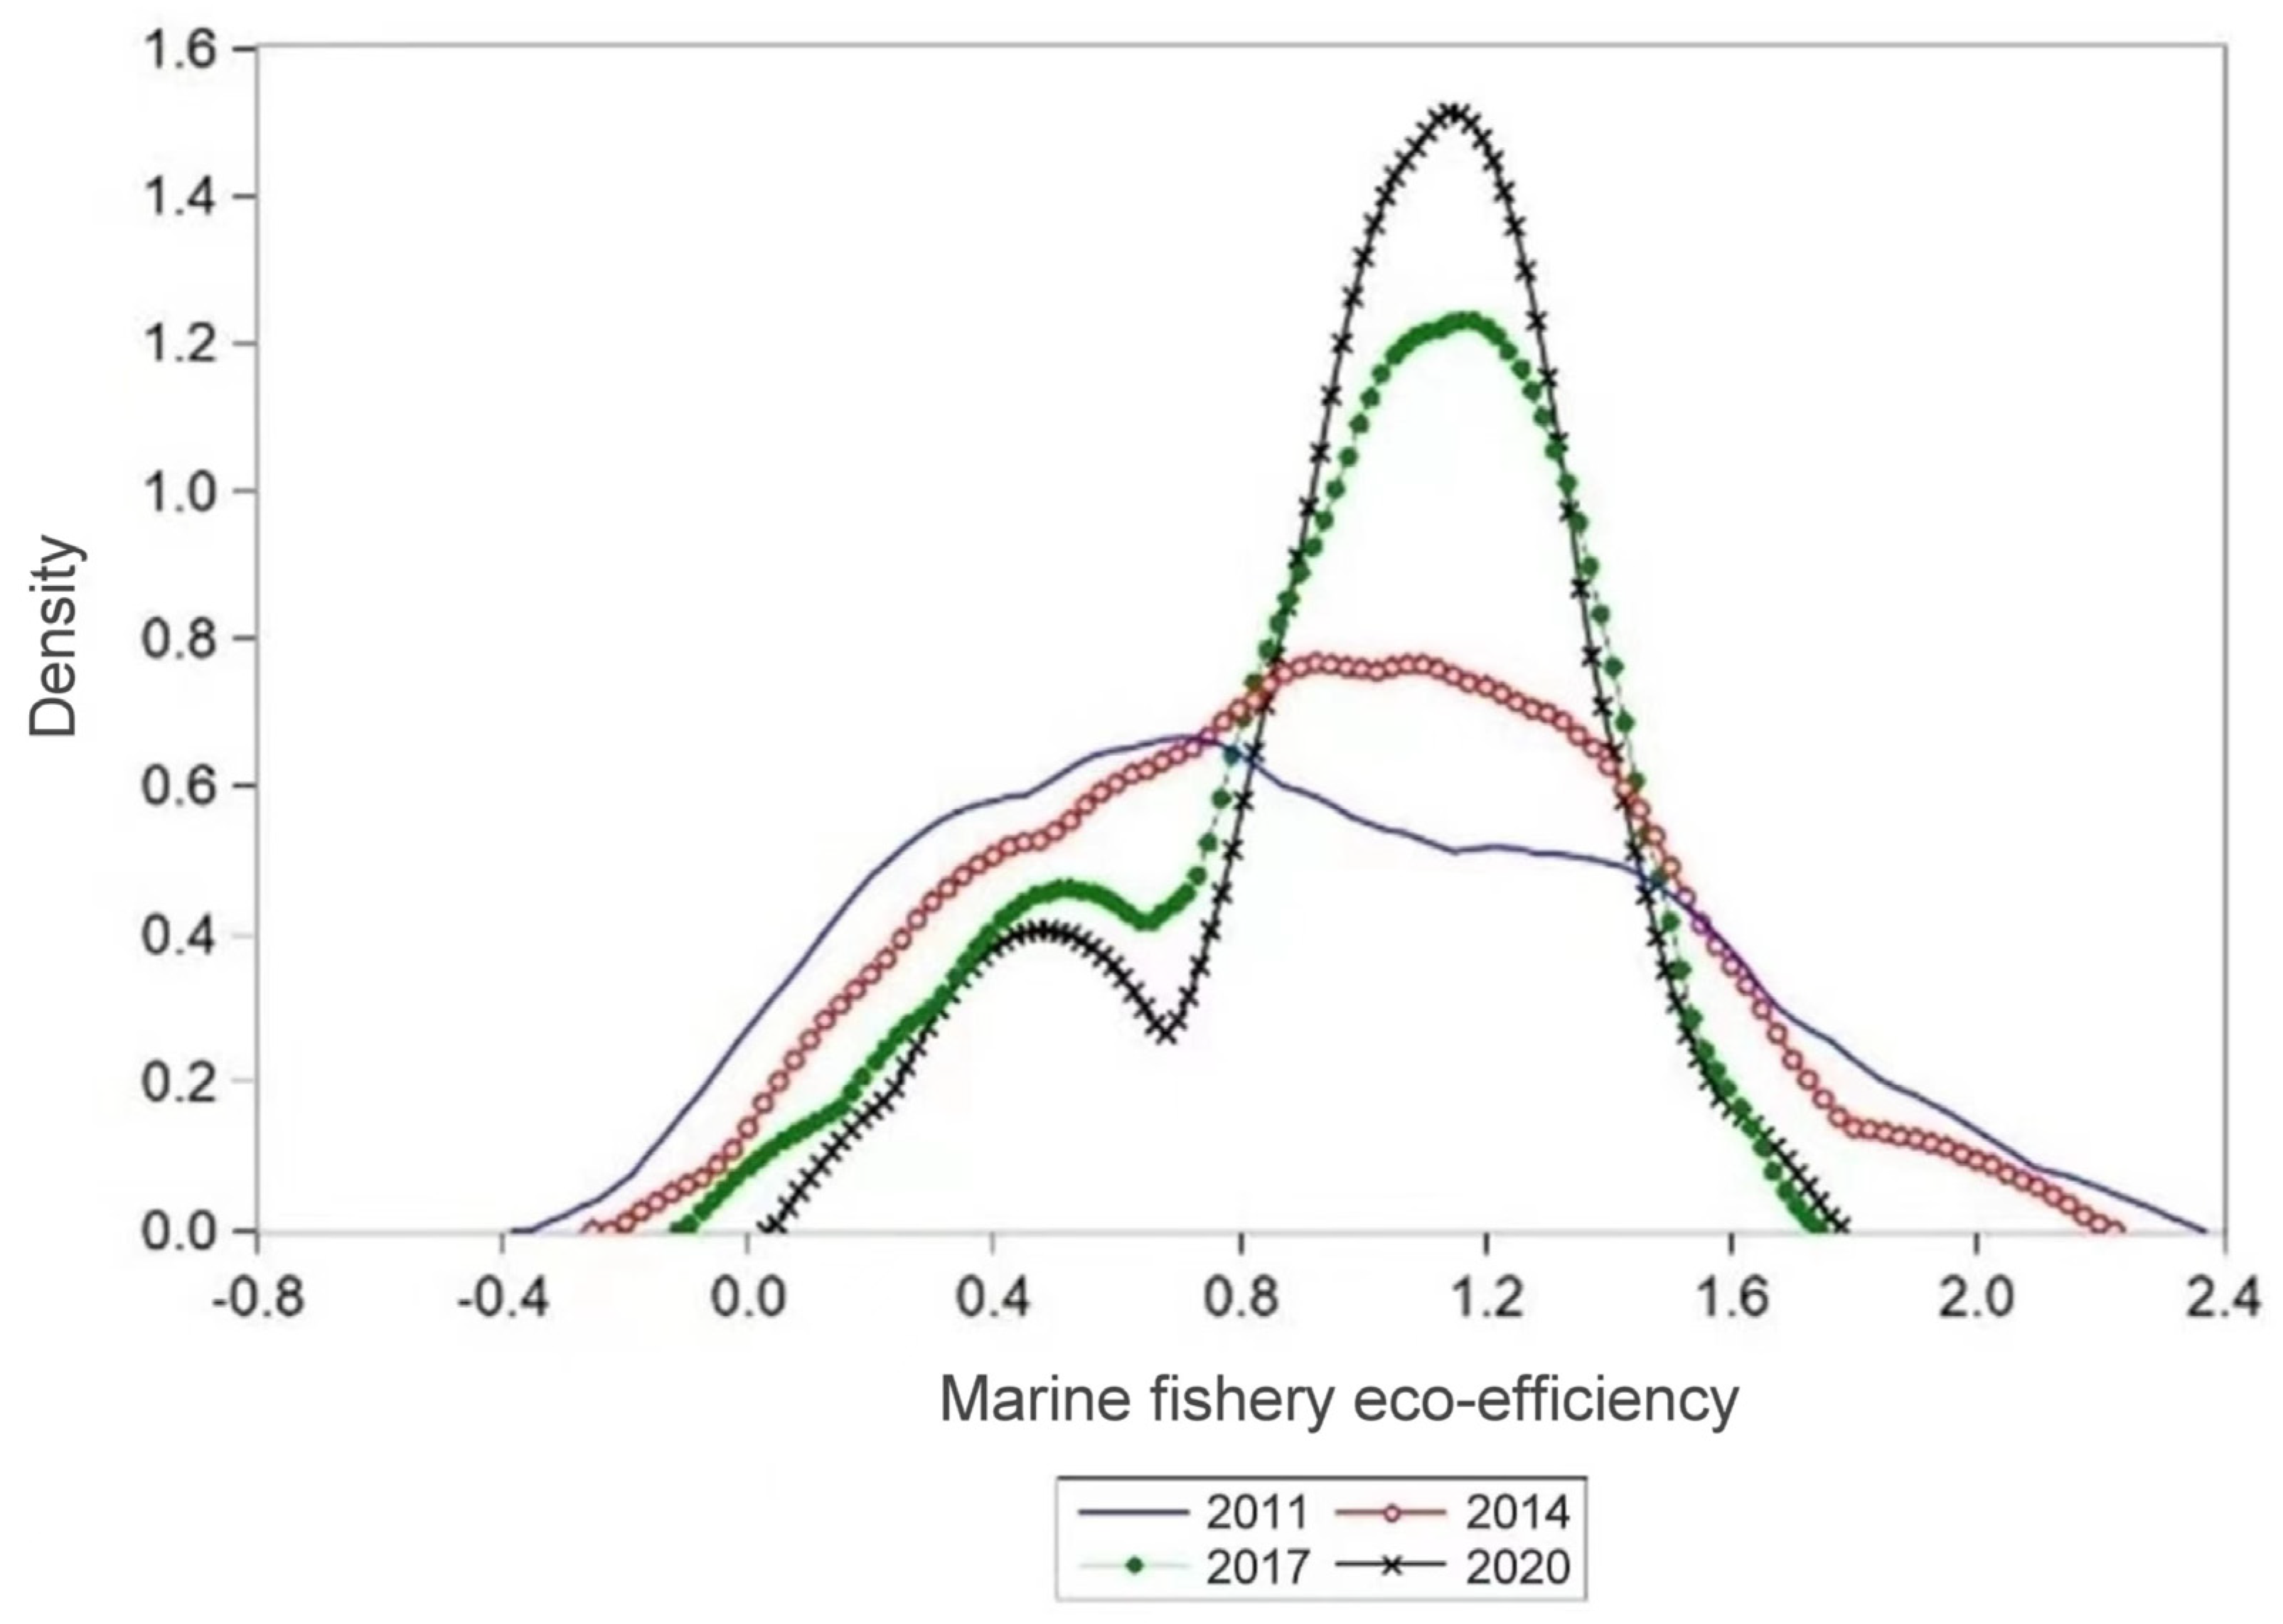
3.3.1. Kernel Density Estimation
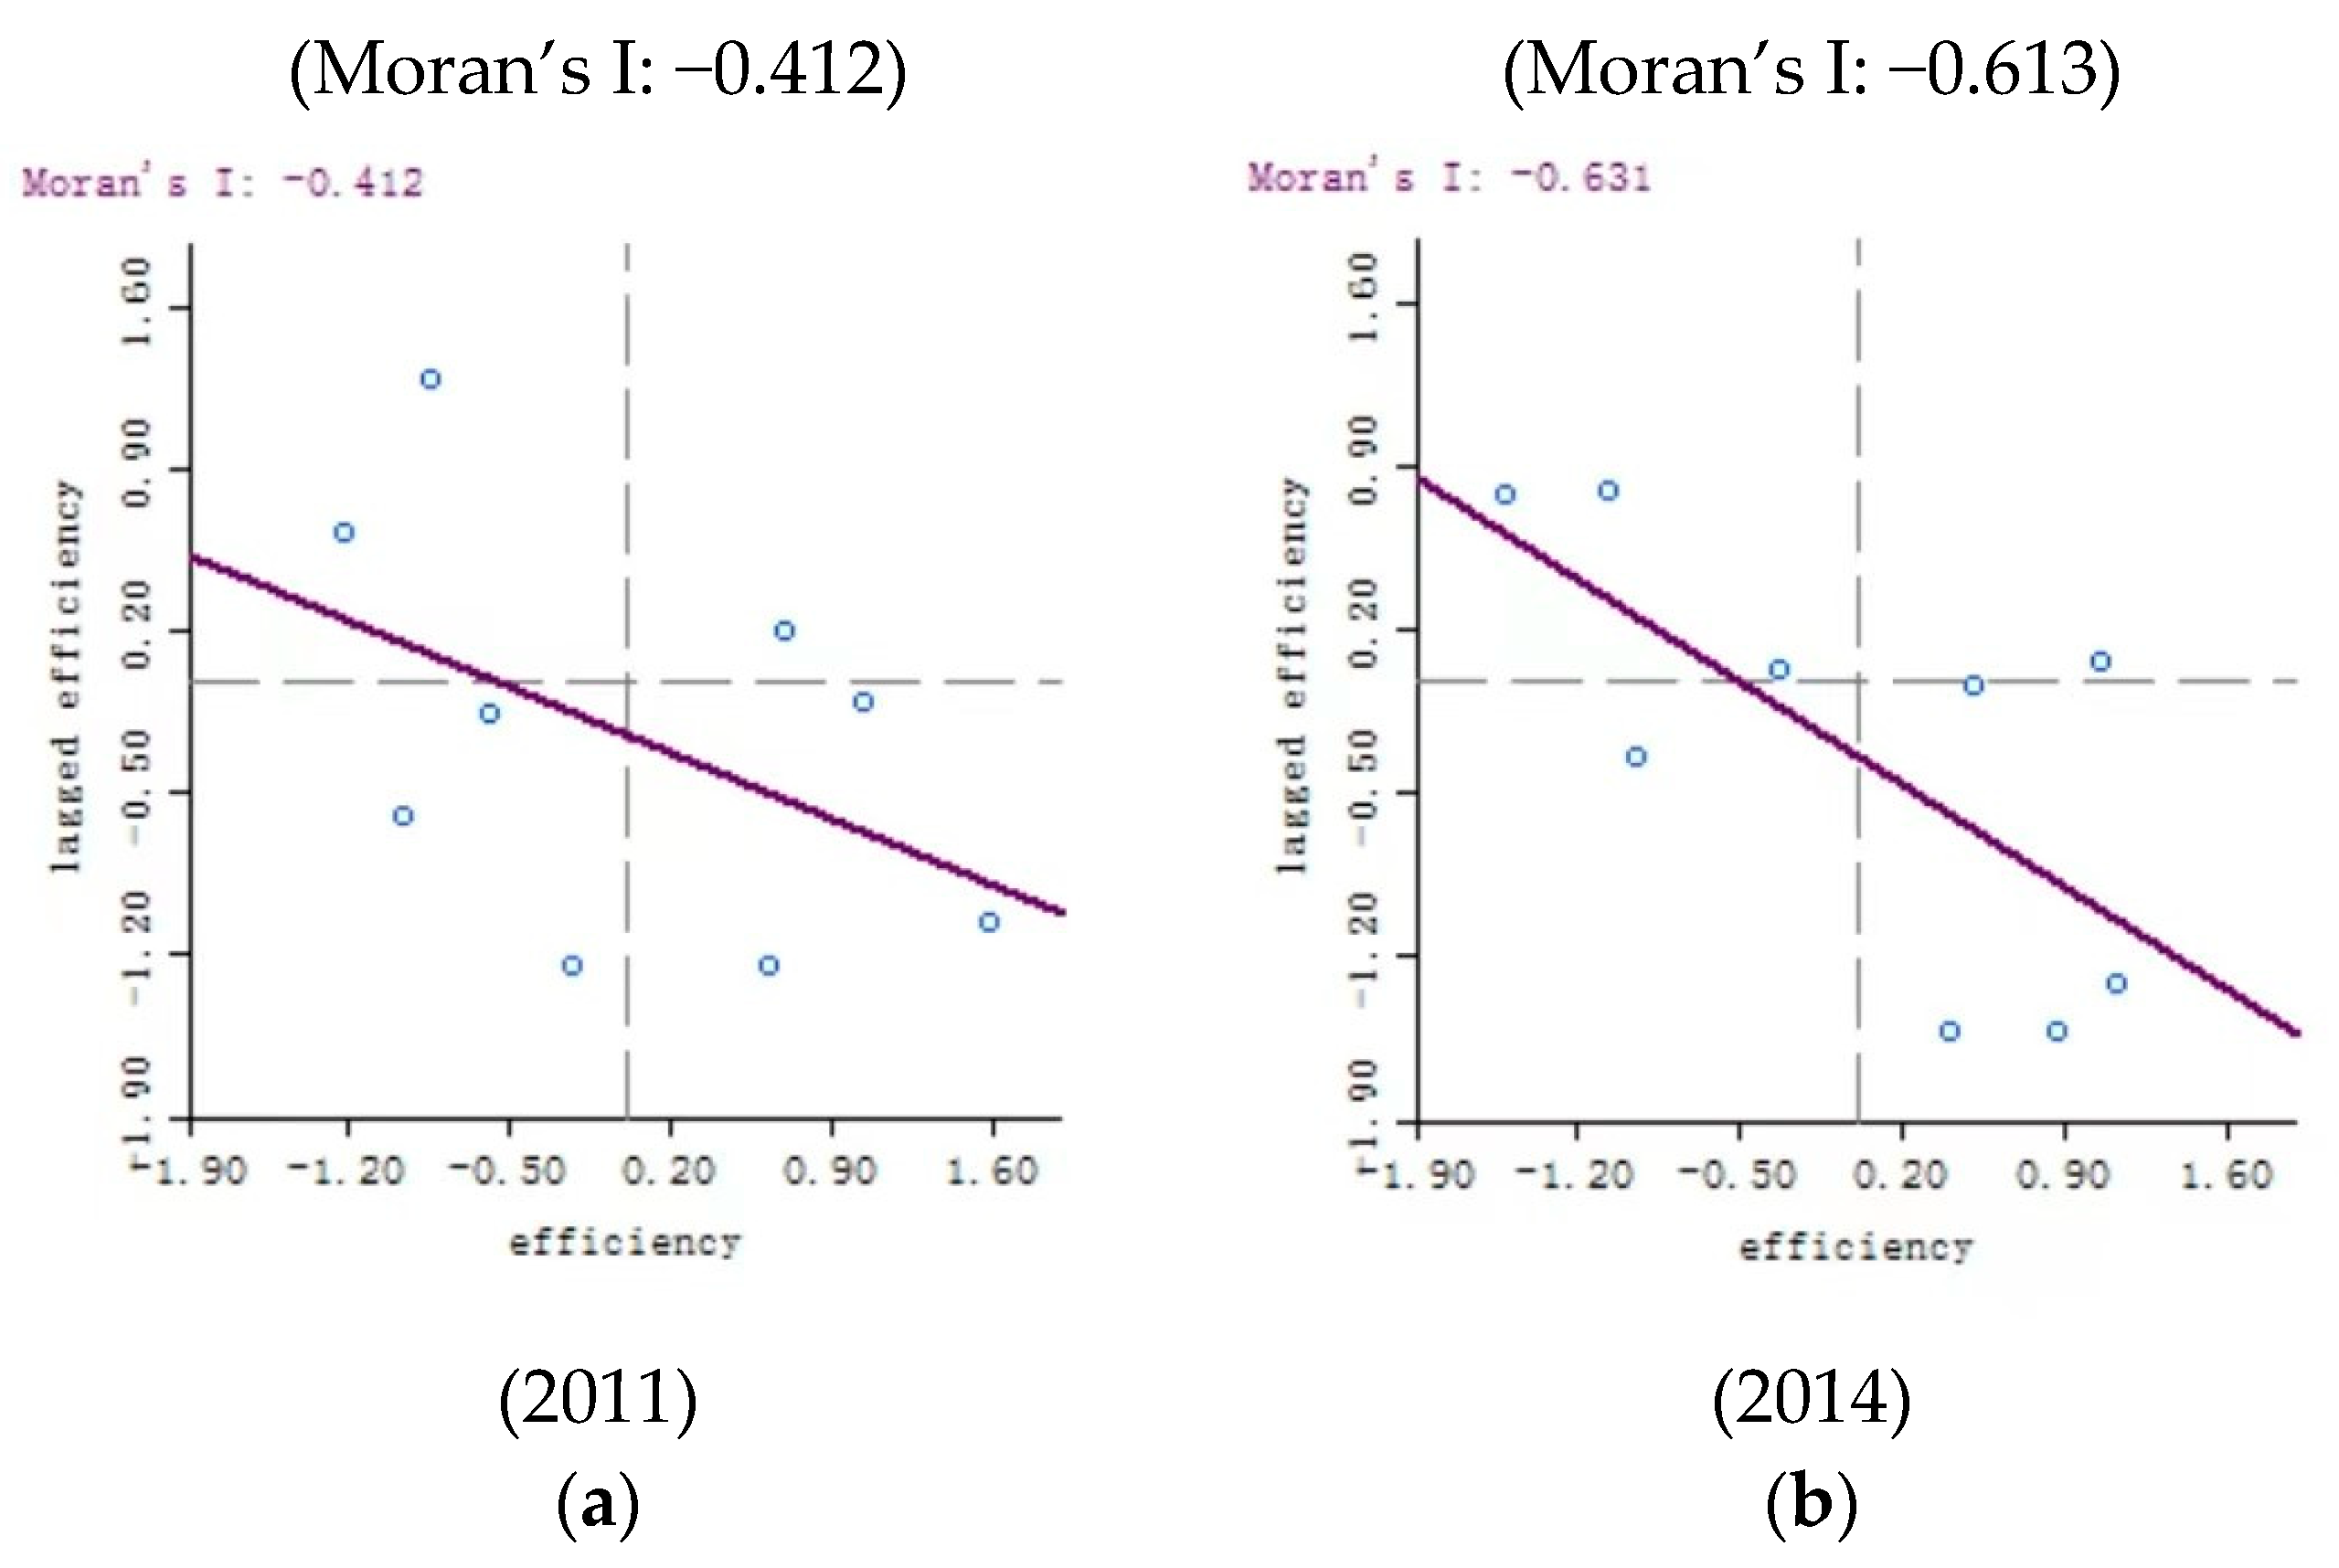
3.3.2. Moran’s Index
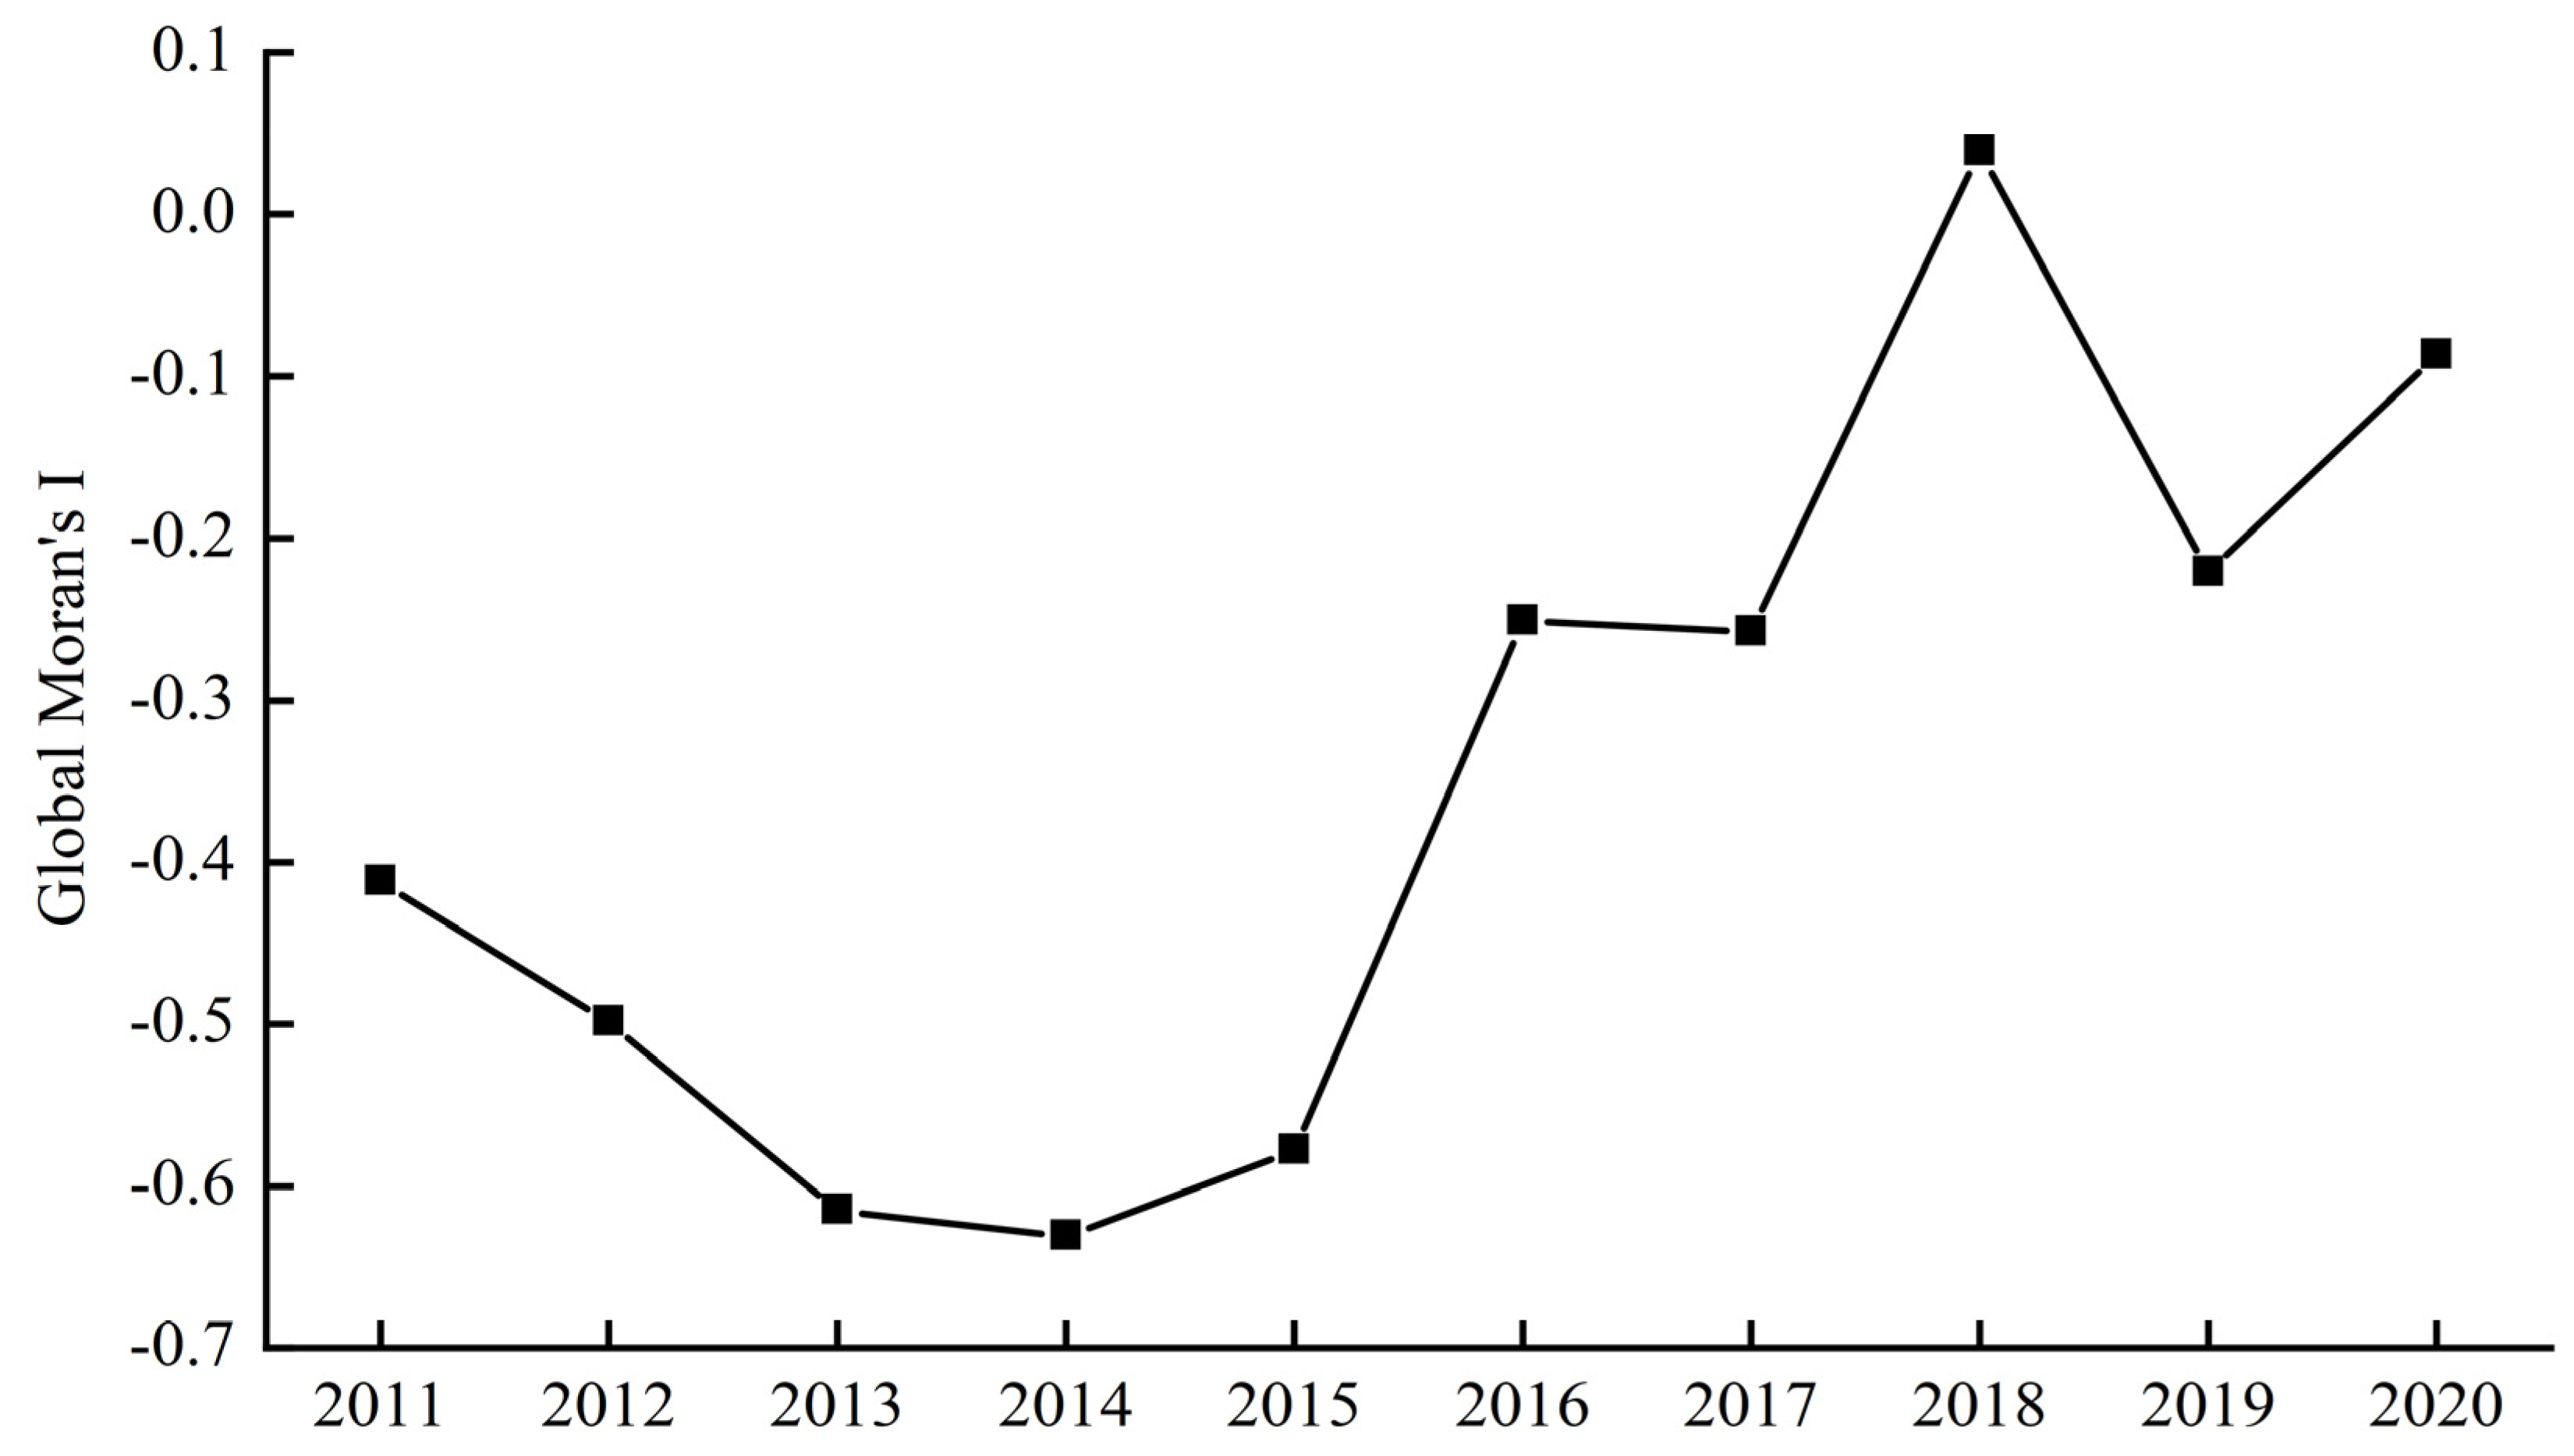
Global Moran Index
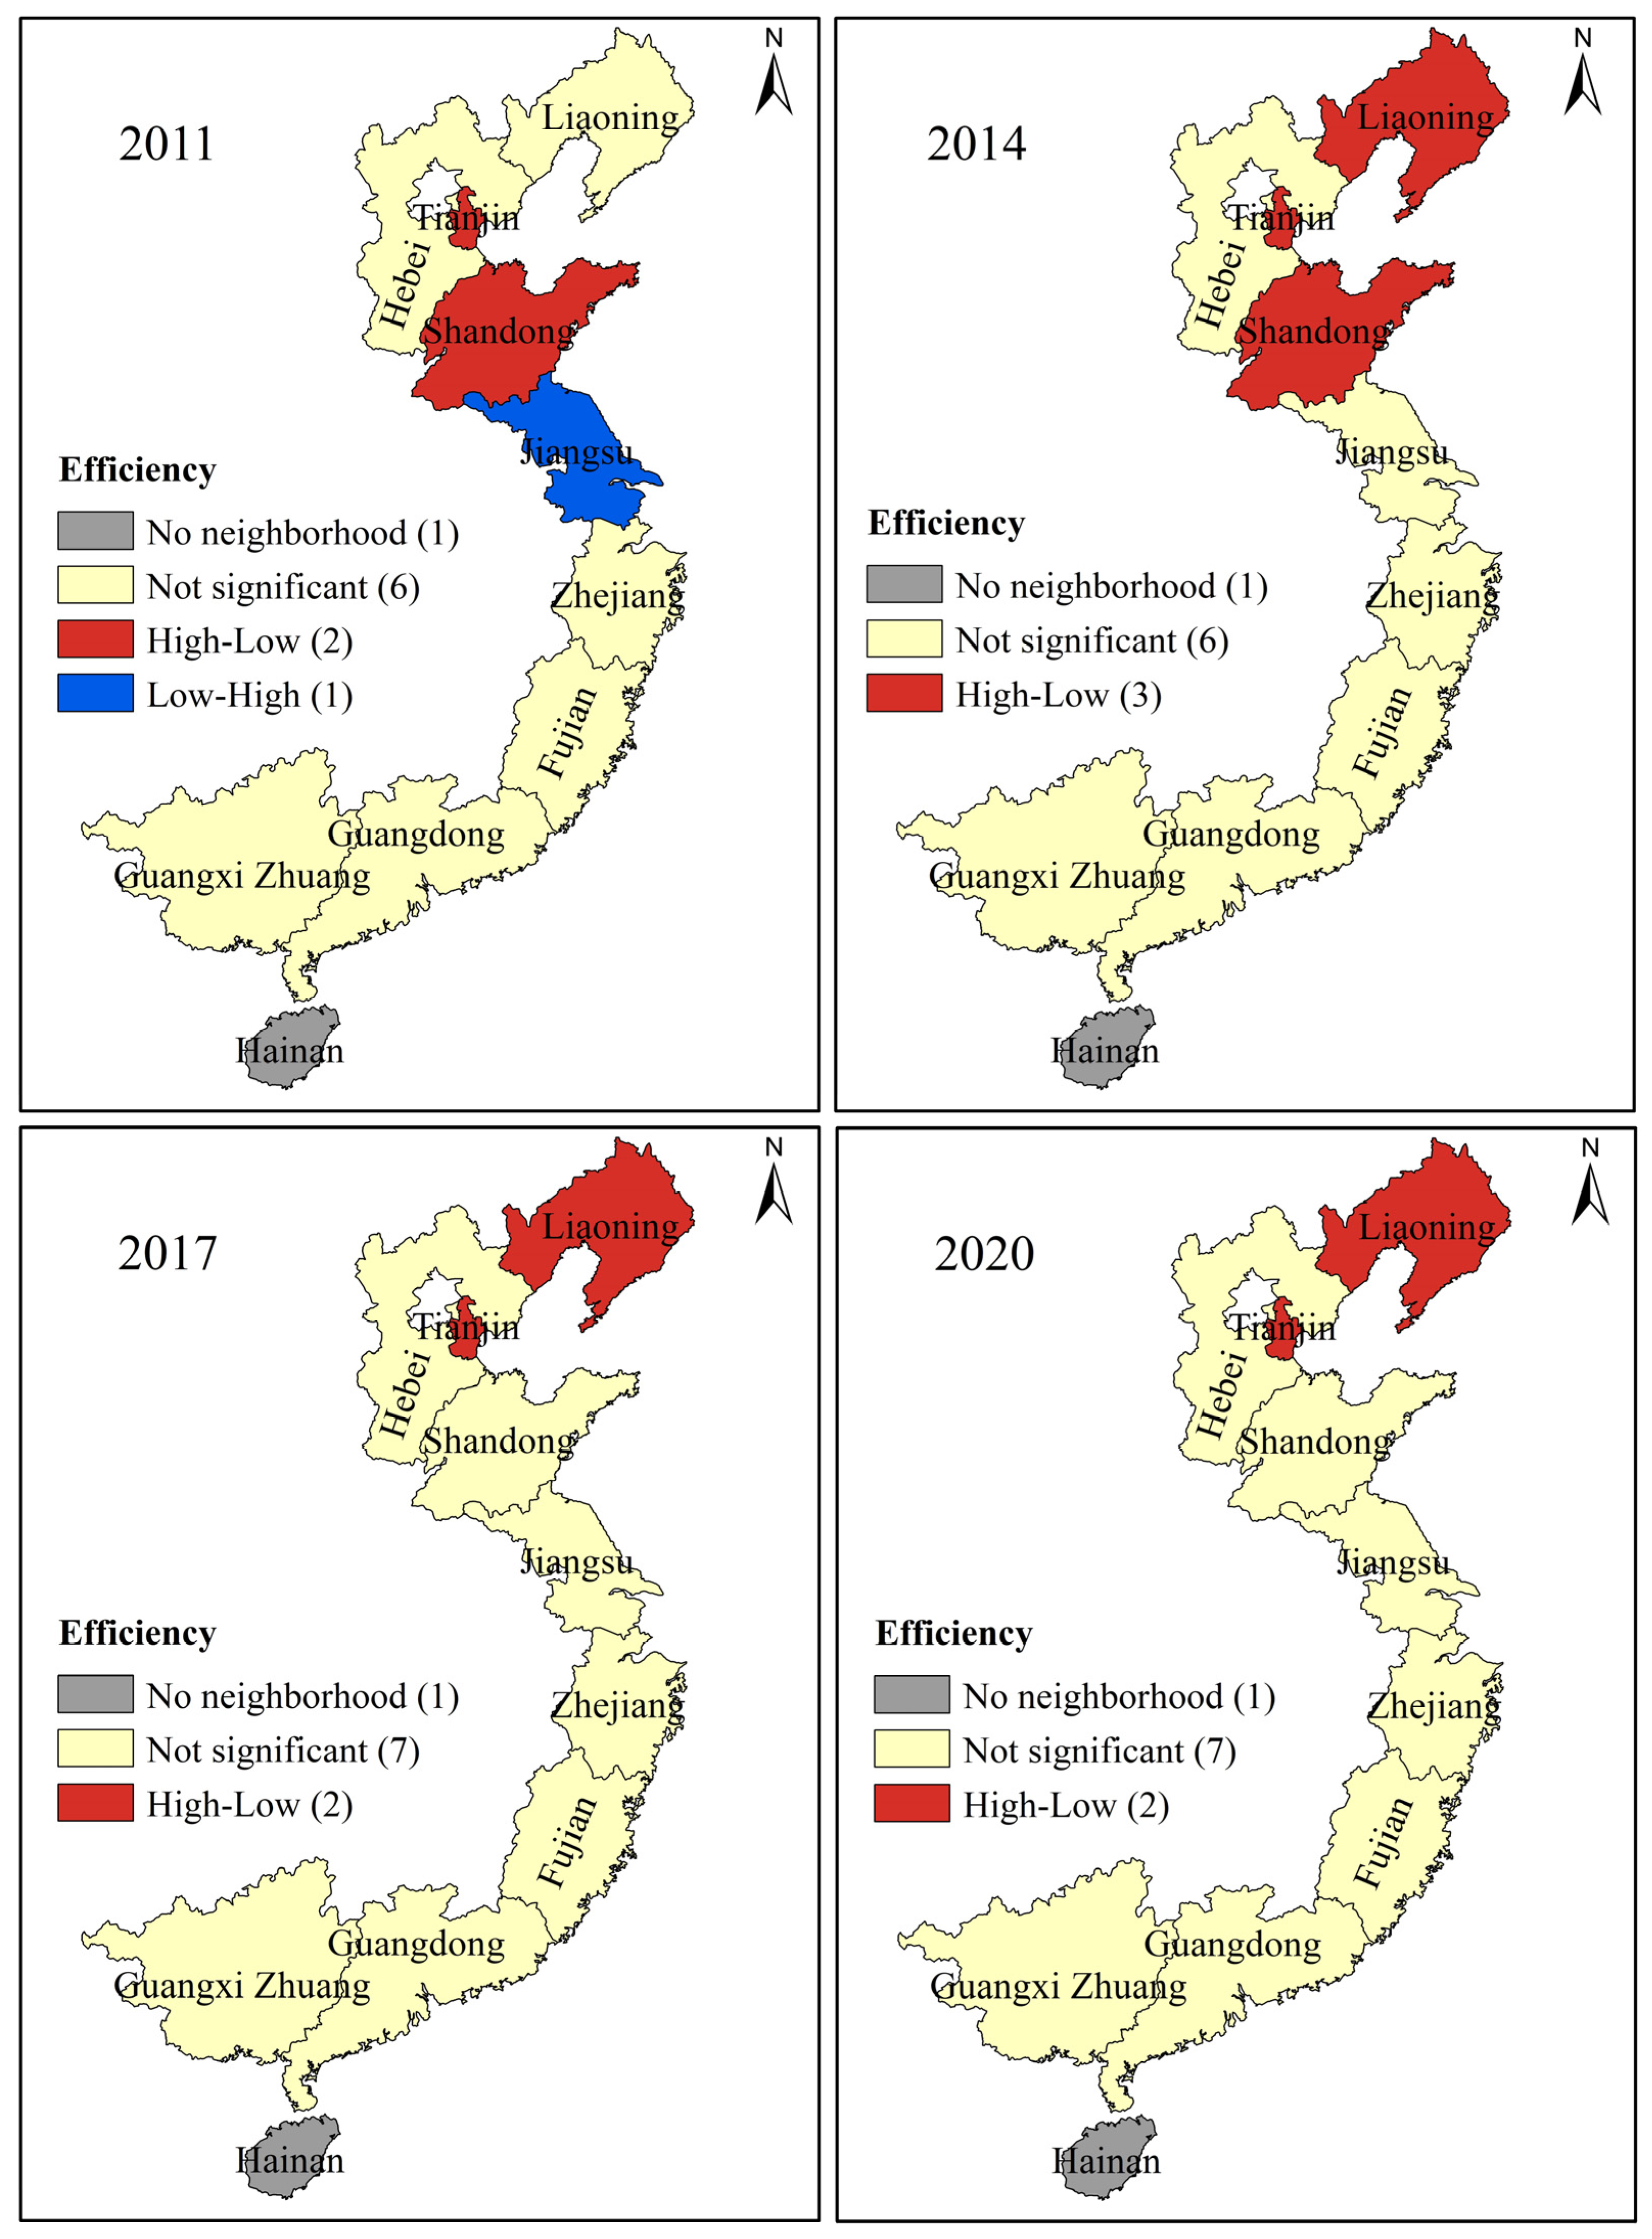
Local Moran Index
4. Analysis of Influencing Factors of Marine Fishery Eco-Efficiency
4.1. Identification of Influencing Factors
4.2. Regression Analysis
5. Discussion
6. Conclusions
Author Contributions
Funding
Institutional Review Board Statement
Data Availability Statement
Acknowledgments
Conflicts of Interest
References
- National Bureau of Statistics of the People’s Republic of China. China Fisheries Yearbook; China Statistics Press: Beijing, China, 2021.
- Liu, G.; Xu, Y.; Ge, W.; Yang, X.; Su, X.; Shen, B.; Ran, Q. How can marine fishery enable low carbon development in China? Based on system dynamics simulation analysis. Ocean Coast. Manag. 2023, 231, 106382. [Google Scholar] [CrossRef]
- Guo, Z.; Tang, S.; Wang, D.; Zhang, J. Spatial distribution and factors influencing ecological efficiency of the Yellow River Basin in China. Front. Environ. Sci. 2022, 10, 235. [Google Scholar] [CrossRef]
- Schaltegger, S.; Sturm, A. Ökologische rationalität: Ansatzpunkte zur ausgestaltung von ökologieorientierten managementinstrumenten. Die Unternehm. 1990, 44, 273–290. [Google Scholar]
- Zhang, J.; Liu, Y.; Chang, Y.; Zhang, L. Industrial eco-efficiency in China: A provincial quantification using three-stage data envelopment analysis. J. Clean. Prod. 2017, 143, 238–249. [Google Scholar] [CrossRef]
- Li, W.; Chen, X.; Wang, Y. Spatiotemporal patterns and influencing factors of industrial ecological efficiency in northeast China. Sustainability 2022, 14, 9691. [Google Scholar] [CrossRef]
- Zhou, X.; Xue, Z.; Seydehmet, J. An empirical study on industrial eco-efficiency in arid resource exploitation region of northwest China. Environ. Sci. Pollut. Res. 2021, 28, 53394–53411. [Google Scholar] [CrossRef]
- Zhang, R.L.; Liu, X.H. Evaluating ecological efficiency of Chinese industrial enterprise. Renew. Energ. 2021, 178, 679–691. [Google Scholar] [CrossRef]
- Tan, R.; Lin, B. The influence of carbon tax on the ecological efficiency of China’s energy intensive industries—A inter-fuel and inter-factor substitution perspective. J. Environ. Manag. 2020, 261, 110252. [Google Scholar] [CrossRef]
- Stanek, W. Thermo-Ecological Cost (TEC)–comparison of energy-ecological efficiency of renewable and non-renewable energy technologies. Energy 2022, 261, 125152. [Google Scholar] [CrossRef]
- Wang, L.; Qiu, X.; Liu, Z.; Chen, S. Ecological efficiency of China’s marine economy: A convergence analysis. J. Coast. Res. 2019, 94, 983–987. [Google Scholar] [CrossRef]
- Du, Y.W.; Jiang, J.; Li, C.H. Ecological efficiency evaluation of marine ranching based on the Super-SBM model: A case study of Shandong. Ecol. Indic. 2021, 131, 108174. [Google Scholar] [CrossRef]
- Xu, Z.; Zhai, S.; Qian, C. The impact of green financial agglomeration on the ecological efficiency of marine economy. J. Coast. Res. 2019, 94, 988–991. [Google Scholar] [CrossRef]
- Zhou, X.; Fang, J.; Shi, S.; Yang, L.; Xie, B.; Huang, L. Ecosystem services of ecosystem approach to mariculture: Providing an unprecedented opportunity for the reform of China’s sustainable aquaculture. Front. Mar. Sci. 2022, 9, 1020. [Google Scholar] [CrossRef]
- Liu, Y.; Cheng, X. Does agro-ecological efficiency contribute to poverty alleviation? An empirical study based on panel data regression. Environ. Sci. Pollut. Res. 2022, 29, 51892–51908. [Google Scholar] [CrossRef]
- Chi, M.; Guo, Q.; Mi, L.; Wang, G.; Song, W. Spatial distribution of agricultural eco-efficiency and agriculture high-quality development in China. Land 2022, 11, 722. [Google Scholar] [CrossRef]
- Lin, L. Research on the spatio-temporal evolution of tourism eco-efficiency by using the ecological footprint model. Fresenius Environ. Bull. 2021, 30, 10665–10674. [Google Scholar]
- Ye, X.L.; Wang, L.; Zhu, Z.F.; Du, J.; Sun, R.H. Study on the ecological efficiency and its temporal dynamic evolution of China’s cruise tourism from the perspective of carbon footprint. Appl. Ecol. Environ. Res. 2019, 17, 13001–13013. [Google Scholar] [CrossRef]
- Zhang, C.; Liu, T.; Li, J.; Xu, M.; Li, X.; Wang, H. Economic growth target, government expenditure behavior, and cities’ ecological efficiency—Evidence from 284 cities in China. Land 2023, 12, 182. [Google Scholar] [CrossRef]
- Zhang, Y.; Zhang, H.; Fu, Y.; Wang, L.; Wang, T. Effects of industrial agglomeration and environmental regulation on urban ecological efficiency: Evidence from 269 cities in China. Environ. Sci. Pollut. Res. 2021, 28, 66389–66408. [Google Scholar] [CrossRef]
- Wang, M.; Li, Y.; Liao, G. Spatial spillover and interaction between high-tech industrial agglomeration and urban ecological efficiency. Front. Environ. Sci. 2022, 10, 829851. [Google Scholar] [CrossRef]
- Wang, D.; Wan, K.; Yang, J. Ecological efficiency of coal cities in China: Evaluation and influence factors. Nat. Hazards. 2019, 95, 363–379. [Google Scholar] [CrossRef]
- Jollands, N.; Lermit, J.; Patterson, M. Aggregate eco-efficiency indices for New Zealand—A principal components analysis. J. Environ. Manag. 2004, 73, 293–305. [Google Scholar] [CrossRef]
- Lin, J.; Li, Y.; Wang, W.; Cui, S.; Wei, X. An eco-efficiency-based urban sustainability assessment method and its application. Int. J. Sustain. Dev. World Ecol. 2010, 17, 356–361. [Google Scholar] [CrossRef]
- Jin, X.; Li, X.; Feng, Z.; Wu, J.; Wu, K. Linking ecological efficiency and the economic agglomeration of China based on the ecological footprint and nighttime light data. Ecol. Indic. 2020, 111, 106035. [Google Scholar] [CrossRef]
- Wang, L.; Zhang, F.; Fu, W.; Tan, Q.; Chen, J. Analysis of temporal and spatial differences and influencing factors of energy eco-efficiency in energy-rich area of the Yellow River Basin. Phys. Chem. Earth 2021, 121, 102976. [Google Scholar] [CrossRef]
- Deng, X.; Gibson, J. Sustainable land use management for improving land eco-efficiency: A case study of Hebei, China. Ann. Oper. Res. 2020, 290, 265–277. [Google Scholar] [CrossRef]
- Sun, X.; Loh, L.; Chen, Z.; Zhou, X. Factor price distortion and ecological efficiency: The role of institutional quality. Environ. Sci. Pollut. Res. 2020, 27, 5293–5304. [Google Scholar] [CrossRef] [PubMed]
- Wang, R.; Wang, Y. Study on the measurement and Influencing factors of regional ecological efficiency in China. Fresenius Environ. Bull. 2018, 27, 4307–4317. [Google Scholar]
- Tone, K. A slacks-based measure of super-efficiency in data envelopment analysis. Eur. J. Oper. Res. 2002, 143, 32–41. [Google Scholar] [CrossRef]
- Guo, L.; Xu, S.Q. Industrial eco-efficiency with the integration super efficiency DEA: The central six provinces 2003–2013 date as an example. Econ. Geogr. 2016, 36, 116–122. [Google Scholar]
- Li, C.Y.; Zhang, S.Q.; Zhang, W. Spatial distribution characteristics and influencing factors of China’s inter provincial industrial eco-efficiency. Sci. Geogr. Sin. 2018, 38, 1970–1978. [Google Scholar]
- Zhang, X.L.; Qiu, F.D.; Tan, J.T.; Wang, C.J. Spatial pattern change and influencing factors of China’s industrial eco- efficiency. Sci. Geogr. Sin. 2020, 40, 335–343. [Google Scholar]
- Kong, F.; Cui, W.; Xi, H. Spatial–temporal variation, decoupling effects and prediction of marine fishery based on modified ecological footprint model: Case study of 11 coastal provinces in China. Ecol. Indic. 2021, 132, 108271. [Google Scholar] [CrossRef]
- Yasmeen, H.; Tan, Q.; Zameer, H.; Tan, J.; Nawaz, K. Exploring the impact of technological innovation, environmental regulations and urbanization on ecological efficiency of China in the context of COP21. J. Environ. Manag. 2020, 274, 111210. [Google Scholar] [CrossRef] [PubMed]
- Wang, S.; Hua, G.; Yang, L. Coordinated development of economic growth and ecological efficiency in Jiangsu, China. Environ. Sci. Pollut. Res. 2020, 27, 36664–36676. [Google Scholar] [CrossRef]
- Wang, C.; Zhang, C.; Hu, F.; Wang, Y.; Yu, L.; Liu, C. Emergy-based ecological efficiency evaluation and optimization method for logistics park. Environ. Sci. Pollut. Res. 2021, 28, 58342–58354. [Google Scholar] [CrossRef] [PubMed]
- He, J.X.; Hu, S. Ecological efficiency and its determining factors in an urban agglomeration in China: The Chengdu-Chongqing urban agglomeration. Urban Clim. 2022, 41, 101071. [Google Scholar] [CrossRef]
- Qin, M.; Sun, M. Effects of marine ranching policies on the ecological efficiency of marine ranching-Based on 25 marine ranching in Shandong Province. Mar. Policy 2021, 134, 104788. [Google Scholar] [CrossRef]
- Adiga, S.M.; Ananthan, P.S.; Divya Kumari, H.V.; Mallikarjun, H. An analysis of long term catch trends in marine fishery resources of Karnataka state, India. Appl. Ecol. Environ. Res. 2016, 14, 201–213. [Google Scholar] [CrossRef]
- Li, B.; Jin, X.M. Spatio-temporal evolution of marine fishery industry ecosystem vulnerability in the Bohai Rim Region. China Geogr. Sci. 2019, 29, 1052–1064. [Google Scholar] [CrossRef]
- Chen, X.; Di, Q.; Hou, Z.; Yu, Z. Measurement of carbon emissions from marine fisheries and system dynamics simulation analysis: China’s northern marine economic zone case. Mar. Policy 2022, 145, 105279. [Google Scholar] [CrossRef]
- Zhou, P.; Ang, B.W.; Han, J.Y. Total factor carbon emission performance: A Malmquist index analysis. Energy Econ. 2010, 32, 194–201. [Google Scholar] [CrossRef]
- Chen, Y.G. New approaches for calculating Moran’s index of spatial autocorrelation. PLoS ONE 2013, 8, e68336. [Google Scholar] [CrossRef] [PubMed]
- Sun, K.; Ji, J.W.; Li, L.D.; Zhang, C.; Liu, J.F.; Fu, M. Marine fishery economic efficiency and its spatio-temporal differences based on undesirable outputs in China. Resour. Sci. 2017, 39, 2040–2051. [Google Scholar]
- Yu, X.; Hu, Q.; Shen, M. Provincial differences and dynamic changes in mariculture efficiency in China: Based on Super-SBM model and global Malmquist index. Biology 2020, 9, 18. [Google Scholar] [CrossRef]
- Qin, H.; Zhang, Y.; Lu, Y.Y. Measurement and analysis of China’s mariculture eco-economic efficiency: Based on SBM model. J. Agrotech. Econ. 2018, 9, 67–79. [Google Scholar]
- Xu, J.; Han, L.; Yin, W. Research on the ecologicalization efficiency of mariculture industry in China and its influencing factors. Mar. Policy 2022, 137, 104935. [Google Scholar] [CrossRef]
- Fu, Q.; Zhu, Y.; Kong, Y.; Sun, J. Spatial analysis and districting of the livestock and poultry breeding in China. J. Geogr. Sci. 2012, 22, 1079–1100. [Google Scholar] [CrossRef]
- Cheng, J.H.; Sun, Q.; Guo, M.J.; Xu, W.Y. Research on regional disparity and dynamic evolution of eco-efficiency in China. China Popul. Resour. Environ. 2014, 24, 47–54. [Google Scholar]


| Target Layer | Criterion Layer | Variable | Indicator Layer |
|---|---|---|---|
| Eco-efficiency of marine fishery | Input indicators | Labor input | Marine fishery practitioners |
| Fixed asset investment | Fixed asset stock of marine fishery | ||
| Current asset investment | Intermediate consumption of marine fishery | ||
| Natural resources input | Area of mariculture | ||
| Environmental pollution input | Economic losses of marine fishery caused by pollution | ||
| Output indicators | Output value | Total economic output value of marine fishery |
| 2011 | 2012 | 2013 | 2014 | 2015 | 2016 | 2017 | 2018 | 2019 | 2020 | Average Value | Ranking | |
|---|---|---|---|---|---|---|---|---|---|---|---|---|
| Tianjin | 1.0551 | 1.0818 | 1.1232 | 1.1789 | 1.1832 | 1.0988 | 1.1389 | 1.1375 | 1.0714 | 1.0380 | 1.1107 | 4 |
| Hebei | 0.2561 | 0.2810 | 0.3460 | 0.2989 | 0.3145 | 0.3034 | 0.2993 | 0.3190 | 0.3532 | 0.3812 | 0.3153 | 10 |
| Liaoning | 0.6867 | 0.7188 | 1.0878 | 1.0035 | 1.0264 | 1.0565 | 1.0571 | 0.6907 | 1.0185 | 1.0248 | 0.9371 | 6 |
| Jiangsu | 0.4205 | 0.4222 | 0.4325 | 0.4593 | 0.4638 | 1.0645 | 1.0454 | 1.0422 | 1.0757 | 1.1015 | 0.7528 | 7 |
| Zhejiang | 1.2387 | 1.0709 | 1.0128 | 1.0426 | 1.0257 | 1.0975 | 1.1403 | 1.1442 | 1.0952 | 1.1368 | 1.1005 | 5 |
| Fujian | 1.0873 | 1.1351 | 1.2681 | 1.2451 | 1.2832 | 1.2812 | 1.2870 | 1.3110 | 1.3232 | 1.4304 | 1.2652 | 2 |
| Shandong | 1.4754 | 1.4336 | 1.2280 | 1.2747 | 1.2223 | 1.1743 | 1.1534 | 1.1818 | 1.1918 | 1.1875 | 1.2523 | 3 |
| Guangdong | 0.5337 | 0.5515 | 0.6343 | 0.7364 | 0.6766 | 0.7288 | 0.7161 | 0.7623 | 1.0006 | 1.0166 | 0.7357 | 8 |
| Guangxi | 0.3715 | 0.4666 | 0.5333 | 0.5033 | 0.4719 | 0.5384 | 0.5522 | 0.5562 | 0.5612 | 0.5773 | 0.5132 | 9 |
| Hainan | 1.7520 | 1.6816 | 1.7141 | 1.6923 | 1.3578 | 1.4412 | 1.3371 | 1.3697 | 1.3823 | 1.2362 | 1.4964 | 1 |
| Area | Comprehensive Technical Efficiency | Technological Progress | Pure Technical Efficiency | Scale Efficiency | Total Factor Productivity |
|---|---|---|---|---|---|
| Tianjin | 1.000 | 1.056 | 1.000 | 1.000 | 1.056 |
| Hebei | 1.039 | 1.000 | 1.034 | 1.006 | 1.039 |
| Liaoning | 1.004 | 1.020 | 1.001 | 1.004 | 1.024 |
| Jiangsu | 1.079 | 1.035 | 1.074 | 1.005 | 1.117 |
| Zhejiang | 1.000 | 1.022 | 1.000 | 1.000 | 1.022 |
| Fujian | 1.000 | 1.062 | 1.000 | 1.000 | 1.062 |
| Shandong | 1.000 | 1.016 | 1.000 | 1.000 | 1.016 |
| Guangdong | 1.042 | 0.987 | 1.041 | 1.001 | 1.029 |
| Guangxi | 1.040 | 0.984 | 1.029 | 1.011 | 1.023 |
| Hainan | 1.000 | 1.023 | 1.000 | 1.000 | 1.023 |
| Average value | 1.020 | 1.020 | 1.017 | 1.003 | 1.041 |
| Time | Comprehensive Technical Efficiency | Technological Progress | Pure Technical Efficiency | Scale Efficiency | Total Factor Productivity |
|---|---|---|---|---|---|
| 2011–2012 | 1.0540 | 0.9480 | 1.0330 | 1.0200 | 0.9990 |
| 2012–2013 | 1.0530 | 0.9380 | 1.0220 | 1.0300 | 0.9880 |
| 2013–2014 | 0.9900 | 1.0510 | 1.0080 | 0.9820 | 1.0410 |
| 2014–2015 | 1.0200 | 1.0710 | 1.0220 | 0.9980 | 1.0920 |
| 2015–2016 | 1.0510 | 1.0970 | 1.0650 | 0.9870 | 1.1540 |
| 2016–2017 | 0.9940 | 1.0300 | 1.0020 | 0.9920 | 1.0240 |
| 2017–2018 | 1.0090 | 1.0160 | 1.0040 | 1.0060 | 1.0260 |
| 2018–2019 | 1.0020 | 0.9910 | 1.0020 | 0.9990 | 0.9920 |
| 2019–2020 | 1.0100 | 1.0510 | 1.0000 | 1.0100 | 1.0610 |
| Average value | 1.0200 | 1.0200 | 1.0170 | 1.0030 | 1.0410 |
| Time | Global Moran Index | Expected Value | Z-Statistic | p-Value |
|---|---|---|---|---|
| 2011 | −0.4122 | −0.1250 | −0.9182 | 0.1940 |
| 2012 | −0.4985 | −0.1250 | −1.1664 | 0.1370 |
| 2013 | −0.6146 | −0.1250 | −1.4424 | 0.0650 |
| 2014 | −0.6308 | −0.1250 | −1.5161 | 0.0560 |
| 2015 | −0.5777 | −0.1250 | −1.3476 | 0.0890 |
| 2016 | −0.2510 | −0.1250 | −0.4006 | 0.3770 |
| 2017 | −0.2583 | −0.1250 | −0.4250 | 0.3590 |
| 2018 | 0.0389 | −0.1250 | 0.4770 | 0.3010 |
| 2019 | −0.2207 | −0.1250 | −0.3383 | 0.3970 |
| 2020 | −0.0868 | −0.1250 | 0.1092 | 0.4430 |
| Variable | Code | Computing Method |
|---|---|---|
| Industrial structure | SYS | Output value of marine fishery secondary industry and tertiary industry/primary industry |
| Scientific support | TEC | Number of marine fishery R&D institutions/Number of fishery R&D institutions |
| Degree of opening-up | OPE | Total imports and exports of aquatic products/GDP of fishery economy |
| Environmental regulation | POL | Investment in marine environmental governance |
| Variable | Regression Coefficient | Z-Statistic |
|---|---|---|
| SYS | 0.2860 *** | 3.10 |
| POL | 0.0463 * | 1.09 |
| TEC | 0.0040 ** | 2.54 |
| OPE | −0.2212 *** | −3.03 |
| Constant term | 1.9712 *** | 3.69 |
Disclaimer/Publisher’s Note: The statements, opinions and data contained in all publications are solely those of the individual author(s) and contributor(s) and not of MDPI and/or the editor(s). MDPI and/or the editor(s) disclaim responsibility for any injury to people or property resulting from any ideas, methods, instructions or products referred to in the content. |
© 2023 by the authors. Licensee MDPI, Basel, Switzerland. This article is an open access article distributed under the terms and conditions of the Creative Commons Attribution (CC BY) license (https://creativecommons.org/licenses/by/4.0/).
Share and Cite
Zhu, W.; Sun, W.; Li, D.; Han, L. Spatial–Temporal Characteristics and Influencing Factors of Marine Fishery Eco-Efficiency in China: Evidence from Coastal Regions. Fishes 2023, 8, 438. https://doi.org/10.3390/fishes8090438
Zhu W, Sun W, Li D, Han L. Spatial–Temporal Characteristics and Influencing Factors of Marine Fishery Eco-Efficiency in China: Evidence from Coastal Regions. Fishes. 2023; 8(9):438. https://doi.org/10.3390/fishes8090438
Chicago/Turabian StyleZhu, Wendong, Wenhui Sun, Dahai Li, and Limin Han. 2023. "Spatial–Temporal Characteristics and Influencing Factors of Marine Fishery Eco-Efficiency in China: Evidence from Coastal Regions" Fishes 8, no. 9: 438. https://doi.org/10.3390/fishes8090438
APA StyleZhu, W., Sun, W., Li, D., & Han, L. (2023). Spatial–Temporal Characteristics and Influencing Factors of Marine Fishery Eco-Efficiency in China: Evidence from Coastal Regions. Fishes, 8(9), 438. https://doi.org/10.3390/fishes8090438