Article

The Effects of Replacing Fish Meal Protein with Black Soldier Fly Meal and Sodium Butyrate Supplementation on the Growth Performance, Lipid Peroxidation, and Intestinal Villi Status of Jade Perch, Scortum barcoo Fingerlings

1
Department of Aquatic Biosciences, National Chiayi University, Chiayi City 600, Taiwan
2
Marine Life Propagation Station, Penghu County, Magong City 880, Taiwan
*
Author to whom correspondence should be addressed.
Fishes 2023, 8(9), 437; https://doi.org/10.3390/fishes8090437
Submission received: 7 August 2023 / Revised: 20 August 2023 / Accepted: 25 August 2023 / Published: 26 August 2023
(This article belongs to the Special Issue Effects of Dietary Nutrient Levels on Aquatic Animals)

Abstract

:
This study investigated the effects of different protein sources and butyric acid contents in aquafeed on the growth, survival rate, lipid peroxidation enzymes, and intestinal villi of 7.3 g jade perch, Scortum barcoo. The experimental treatment groups were the whole fish meal protein (FM) group, the FM + butyric acid (FMB) group, the 50% fish meal protein and 50% black soldier fly meal protein (FBM) group, the FBM + butyric acid (FBMB) group, the whole black soldier fly meal protein (BM) group, and the BM + butyric acid (BMB) group. The experimental results showed that the jade perch fed with the FMB feed had a significantly higher weight gain rate and antioxidant enzyme activity than the other treatment groups. The red blood cell count, hemoglobin concentration, and hematocrit contents in the blood of jade perch were not affected by the protein source, but they increased with the addition of butyric acid. The intestinal villi length of the jade perch that were fed diets containing butyric acid were significantly higher than that of the jade perch that were fed diets without butyric acid supplementation. The results of this study show that the addition of butyric acid to a balanced feed composed of protein can contribute to the growth of jade perch.
Key Contribution: Butyric acid at 1 g/kg of inclusion in the nutritional balance diet improves the feed efficiency and growth performance of fish.

1. Introduction

In intensive and semi-intensive aquaculture management models, the expenditure of artificial feed accounts for 40–60% of the total culture cost [1]. The quality of feed formulas is of great importance to the growth of cultured organisms. For example, protein provides essential amino acids in the growing process, lipids provide essential fatty acids, starch provides energy and acts as a feed adhesive, and vitamins and minerals play an important role in physiological and biochemical metabolic processes. Therefore, the appropriate trophic components of feed, and the nutritional requirements and cost-effectiveness of the cultured species, must be considered in the use of feed [2]. Protein is the costliest component of artificial feed formulas, as well as being a major trophic factor that sustains life and influences the growth performance of aquatic organisms. Ref. [3] indicated that fish meal was used as the main protein source in feeds for carnivorous fishes. As the fish meal had a good amino acid composition, high nutrient digestibility, and low anti-nutritional factor, feeds should be mixed with 50–60% fish meal to meet the nutritional requirements of carnivorous fishes. Ref. [4] suggested that, as global fish production increases rapidly and fishery resources decline, the price of fish meal rises continuously, causing artificial aquaculture costs to escalate. The use of fish meal in the aquatic feed industry often suffers from an unstable supply and price fluctuations. The anchoveta fishery in Peru is the source of the majority of the global fishmeal and fish oil supplies. Overall, 2021 has been a positive year for the fishmeal industry, as the annual production quantity of fishmeal in Peru reached 3.67 million tonnes in 2021, up by 12 percent compared to 2020. Fishmeal prices peaked in 2022, at USD 1600 per tonne (CIF Peru, 65% protein). They have since remained more or less stable [5]. In addition to the cost of fish meal, the cost of soybean, another protein source used for aquatic feed, has increased year by year [6,7]. As the consumption of soybean and fish meal is expected to be limited due to human consumption in the future, the search for alternative protein sources remains a topic of discussion amongst researchers and within the aquatic feed manufacturing industry.
Insect meal protein has recently been increasingly discussed in relation to the nutrition of aquatic and livestock feeds [8]. Insect meal protein is not a new protein source, but as fish meal prices have risen recently, and as vegetable protein is mostly consumed by humans, insect meal protein has provided a new direction for aquatic and livestock feeds [9]. Insects belongs to the Arthropoda family, the largest class of the animal kingdom. Most insects have a short life span and are easy to culture. In terms of human food, insects are regarded as a staple food in a number of Southeast Asian countries [10]. Insects can provide a quality protein source, making them attractive in the application of feed. Aquafeed has a higher protein demand than livestock feed. However, numerous reports indicate that from 7% to as high as 68% of the protein ingested by aquatic organisms are not absorbed [11]. Given this, research on aquafeed is focusing on finding appropriate feed substitutes and improving the nutrient absorption efficiency of aquatic animals. Amongst insect proteins, black soldier fly has several major advantages over other insect species. The species is polyphagous and uses well-defined substrates, producing insects of a defined quality of macro- and micro-nutrients [12]. Fish meal protein can be replaced with 50% and 48% black soldier fly (Hermetia illucens L.) larvae meal protein without adverse effects on the weight gain of European sea bass, Dicentrarchus labrax, and yellow catfish, Pelteobagrus fulvidraco, respectively [13,14]. The partial substitution of dietary fish meal protein with black soldier fly larvae meal protein has also been successfully implicated within various fish species such as rainbow trout, Oncorhynchus mykiss [15]; Atlantic salmon, Salmo salar [16]; Nile tilapia, Oreochromis niloticus [17]; marron, Cherax cainii [18]; and African catfish, Clariass gariepinus [19].
Butyric acid is a type of carboxylic acid with the molecular formula CH3-CH2-CH2-COOH. It is often used in the domain of veterinary medicine, especially with ruminants. In livestock production, butyric acid is used for promoting the growth of cattle [20]. Research on animal nutrition has found that butyric acid can promote microbial fermentation in the colon to digest fibrous matters such as cereal flour, inulin, and psyllium [21]. The effects of butyric acid can be divided into intraintestinal and extraintestinal effects. The intraintestinal effects include regulation of the epithelial transport system, an improvement in the inflammation and oxidative states of the intestinal mucosa, an enhancement in the mucosal barrier, and the regulation of visceral sensitivity and mobility [22,23]. The extraintestinal effects of butyric acid are largely unknown. Butyric acid is a short-chain fatty acid produced by colonic microbes, especially by the microbiota of the proximal end of the colon, and it is one of the main energy sources of colonic cells. Another primary function of butyric acid is to enhance the absorption and anti-secretion capacity of the intestinal mucosa [21].
In the aquaculture process, the overuse of antibiotics to control disease results in a number of problems, such as degraded immunosuppression, the production of antibiotic drug-resistant strains, and excessive antibiotic residue in animal products [24]. Ref. [25] indicated that butyric acid is a short-chain fatty acid and has a remarkable effect on maintaining the intestinal health of organisms. Many researchers have recognized the successful use of synthetic sodium butyrate or butyric acid to promote growth and to stimulate the immune system. For example, Ref. [26] mentioned that the addition of 1% butyric acid glyceride to the feed can significantly enhance the growth and immunoreaction of yellowfin seabream (Acanthopagrus latus) fingerlings. Ref. [27] indicated that the addition of 5 g/kg of diet butyric acid to their feed can significantly enhance the growth and immunity parameters of barramundi (Lates calcarifer). Ref. [26] indicated that the addition of 1% butyric acid glyceride to their feed can significantly enhance the hematological parameters and lipid peroxidation enzymes of yellowfin seabream. These findings show that butyric acid is a promising feed additive in aquaculture. Many studies have indicated that butyric acid, butyric acid glyceride, and sodium butyrate can significantly influence organism growth performance, the efficiency of feed utilization, body composition, intestinal microflora, tissue morphosis of the intestinal villi, digestive enzymes, oxidation resistance, haematogenic immunity, immune gene expression, and the resistance to disease of fishes and shrimps [28,29]. Therefore, this study explored the influence of substituting fish meal protein with insect meal protein and the addition of butyric acid on the growth, immunity, antioxidation, and intestinal villi of jade perch.

2. Materials and Methods

2.1. Experimental Diets

Approximately 210,000 black soldier fly eggs were obtained from Kunyi Biotech (Chiayi City, Taiwan), which were reared at National Chiayi University (NCYU; Chiayi City, Taiwan). The eggs were hatched and grown in empty containers (140 cm × 100 cm × 50 cm) indoors, and the temperature was maintained at 22–25 °C. Three days after hatching, the larvae were fed with soybean meal (crude protein: 38.4% and crude lipid: 17.26%; TTET Union Corporation, Tainan City, Taiwan). For the formulation of the fish’s diet, black soldier flies in the pupal stage were dried and homogenized.
Six isonitrogenous (31% crude protein) and isolipidic (8% crude lipid) diets were formulated to replace 0% (FM), 50% (FBM) and 100% (BMB) of fish meal protein with the protein from the black soldier fly meal. The treatment groups were mixed with 0% and 1% sodium butyrate, respectively. The dry matter of the experimental feed was mechanically pulverized and mixed. The dry feed was then mixed with 30% distilled water and made into feed pellets with a diameter of 2.5 mm using an automatic extruder. The feed pellets were dried in an oven at 60 ℃ until the moisture content was at about 10% and then stored in a refrigerated chamber at −40 ℃. The experimental feed composition is shown in Table 1.
Table 2 shows the main fatty acid and amino acid compositions of the experimental feed. The main fatty acids of the different treatment groups were C16:0, C18:2 n-6, and C20:4 n-6. The n-3 highly unsaturated fatty acid proportion of the FM and FMB groups was 18.44%; the n-3 highly unsaturated fatty acid content of the FBM and FBMB groups was 11.03%; the n-3 highly unsaturated fatty acid content of the BM and BM + butyric acid (BMB) groups was 3.62%. In terms of amino acid composition, the FM, FMB, FBM, and FBMB groups have higher leucine, lysine, and arginine contents. The BM and BMB groups had a higher methionine content. The essential amino acid content in the experimental feed decreased as the substitution amount of fish meal increased in the fish feed.

2.2. Experimental Fish

The fingerling jade perch used in this experiment were provided by the fish hatchery in Pingtung County. The fries were packaged in the hatchery in the morning and transported in a truck to the experimental greenhouse of the Department of Aquatic Biology at Chiayi University. After the fries adapted to the water temperature of the experimental site, they were placed in a 300 L fiberglass-reinforced plastic (FRP) bucket. All the animal experiments conformed to the principles of the use and care of experimental animals of National Chiayi University’s Biosafety Committee (approval no. NCYU-IACUC-11101). In the raising period, the fries were fed with commercial feed (Marine fish larvae feed No. 3, Shye Yih Feeding Co., Ltd., Kaohsiung city, Taiwan) once per day for one week. At the beginning and end of the experiment, the feeding of the experimental fish was stopped for 24 h, during which time the fish digested the feed and excreted the waste from their digestive tracts. The individuals were then weighed after the body surface water was removed. The experiment was divided into six treatment groups, and each treatment group had three tank replicates. At the beginning of the experiment, juvenile jade perch weighing 7.3 g on average were selected and randomly allocated to 18 FRP buckets (57 × 35 × 30 cm), with a count of 20 fish per bucket. The fish were fed manually twice per day (09:00 and 15:00), and the feed quantity was 5% of the body weight. The fish were weighed once every two weeks, and the daily feed quantity was modified according to the individual weights. The experiment lasted for eight weeks. The experiment was performed in natural light. During the experimental period, the water quality parameters were maintained at a temperature of 26–28 °C, a pH of 7.5–7.6, NH3-N ≤ 0.05 mg·L−1, and dissolved oxygen ≥ 6.0 mg·L−1. The weight gain percentage (WG), protein efficiency ratio (PER), feed conversion ratio (FCR) and survival rate were calculated according to the following equations: WG (%) = 100 × (Wt − W0)/W0, PER = body weight gain/crude protein intake, FCR = feed intake (g)/weight gain (g), Feed intake (g/fish) = dry feed (g) given/number of fish, and survival (%) = 100 × (final number of fish/initial number of fish), where W0 is the initial mean body weight (g), Wt is the final mean body weight (g), and t (day) is the feeding period.

2.3. Sampling

At the end of trial, the feeding of all fish was stopped for 24 h to prepare the fish for the taking of muscle, intestinal tract, and blood samples. Three individuals were taken from each bucket (nine in each group) and anesthetized with 1% tricaine methane sulfonate (MS222, Sigma-Aldrich, St. Louis, MO 68178, USA). Afterwards, blood was collected from the caudal vein without using an anticoagulant, stored at room temperature for 30 min, and centrifuged (5000× g, 15 min) to separate the serum. The serum samples were stored in a refrigerated chamber at −20 °C before their biochemical indexes were analyzed. After the blood sampling, the hepatic and muscle tissues were sampled and stored at −80 °C directly before the composition analysis. The intestinal tract was taken out carefully, and the anterior intestinal tract was sampled and stored in formalin solution (10% Formalin solution, neutral buffered, Sigma-Aldrich) to evaluate its histomorphology.

2.4. Biochemical Measurement of the Serum

The alanine aminotransferase (ALT (mU/mL)) was analyzed using a reagent kit (Alanine Aminotransferase (ALT) Activity Assay Kit (Colorimetric) MET-5123, Cell Biolabs, Inc. Arjons Drive, San Diego, CA 92126, USA). For the analytic procedure, 50 μL of the sample, 50 μL of the diluted pyruvate standard, and 100 μL of a mixed reagent (147 μL ALT enzyme mix + 250 μL ALT substrate mix + 5 μL horseradish peroxidase) (100 μL of the prepared reaction reagent) were put in a 96-well microtiter plate in turn. The samples were determined using a spectrophotometric microplate reader with the setting of an absorbance value of 540–570 nm. The aspartate aminotransferase (AST) activity was analyzed using a reagent kit (Aspartate Aminotransferase (AST) Activity Assay Kit, MAK055, Sigma-Aldrich). For the analytic procedure, 50 μL of the sample and 100 μL of a reaction standard solution (80 μL AST assay buffer + 2 μL AST enzyme mix + 8 μL AST Developer + 10 μL AST substrate) were put in a 96-well microtiter plate in turn, reacted at 37 °C for two to three minutes, and determined using a spectrophotometric microplate reader with the setting of an absorbance value of 450 nm.

2.5. Lipid Peroxidation Enzyme Activity Analysis

A 2 g liver sample was placed in liquid nitrogen and immediately stored in a refrigerator at −80 °C for subsequent analyses. The superoxide dismutase (SOD) was analyzed in accordance with methods of [30]. The glutathione peroxidase (GPx) was determined using a colorimetry determination reagent kit (ab102530). A 100 mg tissue sample was added with a phosphate buffer solution (PBS), reaction mix solution, and cumene hydroperoxide solution, sequentially. The absorbance value was determined using a microplate reader with 340 nm being set as the measurement standard. The catalase (CAT) was analyzed using a commercially available Catalase Assay Kit (No. 707002, Cayman Chemical, East Ellsworth Road Ann Arbor, Michigan 48108, USA). A 20 mg tissue sample was mixed with 100 μL of an assay buffer, 30 μL of methanol, 20 μL of a diluted hydrogen peroxide solution, 30 μL of potassium hydroxide and 30 μL of catalase purpald, sequentially. The absorbance value was determined using a microplate reader, using a standard of 540 nm. Thiobarbituric acid-reactive substances (TBARS) in the tissues were measured using a modified version of the method of [31]. In brief, tissues were homogenized with a 20% trichloroacetic acid extracting solution containing 1% butylated hydroxytoluene (BHT) and incubated with 50 mM of thiobarbituric acid (TBA). The samples were then placed in a boiling water bath for 10 min and centrifuged at 4000 rpm. The optical density of the solution was then measured at 532 nm. TBARS were expressed as a micromole of malondialdehyde (MDA) per gram of tissue using a molar extinction coefficient of 1.56 × 10⁵ M−1 cm−1.

2.6. Hematological Analysis

After the experiment was completed, three individuals were removed from each of the three buckets (nine fish each group) for hematological analysis. Blood was collected from the caudal vein, and eighteen tubes of about 1 mL of whole blood for each tube were collected from each group and examined using a blood analyzer (Sysmex XP-300, San Tung Instrument Co., Ltd., 651-0073 Hyogo Prefecture Shingo City, Japan). The investigated items included the RBC count, HGB, and Hct content; these three variables were used to calculate the mean corpuscular volume (MCV), mean corpuscular hemoglobin (MCH) content, and mean corpuscular hemoglobin concentration (MCHC).

2.7. Intestinal Tract Section

For the fixing process, the fish intestinal tract was taken from the fish body and divided into three equal parts (the anterior, intermediate, and posterior intestines) according to the total length. These parts were then soaked in a 10% neutral formalin (10% Formalin solution, neutral buffered, Sigma-Aldrich) fixing solution for 24 h. The parts were embedded in an embedding box after dehydration and cut up into pieces sized 3–5 mm, after which they were put in an embedding box and dehydrated according to the alcohol concentration gradient (50, 60, 70, 80, 90, 95, 100%). The xylene and paraffin solutions were changed in the order of the following ratios (all xylene, 2:1, 1:1, 1:2, and all paraffin). After the dehydration process was finished, the embedding box was opened, and the intestinal tract tissue was taken out. The intestinal tract tissue was put in a paper folded mold; afterwards, it was placed to stand in the embedding box vertically, filled with paraffin liquid and cooled to form a solid paraffin block. The section was stained after embedding, and the paraffin block with the embedded tissue was trimmed. The microtome section was 5 μm thick. The sectioned tissue wax strip was unfolded in a 42 °C distilled water bath, taken out using a microscope slide and dried in an incubator at 37 °C. After staining, an appropriate amount of Canada balsam (Sigma-Aldrich) was dripped onto the slide. A coverslip was picked up using a pair of forceps and dipped in xylene before being placed over the slide. Afterwards, the slide covered with the coverslip was air-dried and placed under a microscope (CX23RTFS2, Olympus, Yuan Li Instrument Co., Ltd. Yang-Guang St. 114 Taipei, Taiwan) for observation. The length and width of the villi were calculated using the built-in software of the camera (OCCA, HUSL2.0).

2.8. Fatty Acid Composition (% Total Fatty Acids) Analysis

The fatty acid composition was analyzed using gas–liquid chromatography (HP5890II plus). The chromatographic column used is an HP-INNOWax capillary column measuring 30 m × 0.247 mm × 0.5 μm, made in the USA, and hydrogen was used as the transport gas. The flow velocity was 2 mL/min, the split ratio was 12:1, and the temperature rose from 150 °C to 240 °C at a rate of 2 °C/min. The injector and detector temperatures remained at 250 °C and 260 °C, respectively. For the fatty acid identification, the retention time (RT) of the samples was compared with the retention time of the fatty acid methyl ester standard (Nu-Check Merck Ltd., Tiding Blvd. Neihu District. Taipei 11493, Taiwan).

2.9. Amino Acid Analysis

The sample was freeze-dried and defatted, after which 19.5 mg of the sample was put in a sample bottle, mixed with 1 mL of a 6N-HCl solution containing 1% phenol, charged with nitrogen for about one minute to remove air, and then quickly covered with aluminum foil. The bottle mouth was sealed with fire immediately, after which the sample bottle was kept in an oven for 24 h at 105 °C for acid hydrolysis. Afterwards, the bottle was taken out and cooled at room temperature, the seal was broken off, and the contents were dried in a vacuum drying dish at 70 °C. A 1 mL amount of 0.01 N was put in the sample bottle for redissolution and then filtered with a 0.22 μm syringe filter into a test tube. The sample was diluted 1000 times. The diluted sample and o-phythalaldehyde (OPA) were added at a ratio of 1:1 at room temperature and vibrated for 30 s, after which the amino acid content was analyzed using high-performance liquid chromatography (HPLC).

2.10. Statistical Analysis

The experiment data were tested using the one-way analysis of variance and the Statistical Analysis System (SAS-Windows 10) software to check whether there were significant differences among the experimental groups. When there was a difference in the average value (p < 0.05), the significance of the intergroup difference was analyzed using Duncan’s new multiple range test.

3. Results

3.1. Growth Performance

Table 3 presents the results of the final weight, the percentage of weight gain, the protein efficiency ratio, and the survival rate. The FMB group’s final weight and percentage of weight gain were 66.2 g and 806.5%, respectively, which were significantly higher than those of the FBM, FBMB, BM, and BMB groups, but not significantly different from those of the FM group. The feed conversion ratio and protein efficiency ratio decreased with increases in the amount of protein substituted with black soldier fly meal. The feed conversion ratio and protein efficiency ratio of the FMB group were 1.3% and 2.5%, respectively, which significantly outperformed those of the other experimental treatment groups (p < 0.05). The BM group had the least favorable feed conversion ratio and protein efficiency ratio among all the experimental groups, namely 2.7% and 1.2%, respectively; however, the differences with the FBM and BMB groups were not significant (p > 0.05). Furthermore, adding butyric acid to the feeds increased the feed efficiency (p < 0.05) regardless of whether the feeds contained fish meal as the sole protein source (FM and FMB groups), both fish meal and black soldier fly meal as protein sources (FBM and FBMB groups), or proteins that came entirely from black soldier fly meal (BM and BMB groups). Multifactor analyses were conducted to determine how the interaction between the feeds’ protein source compositions and butyric acid contents influenced the growth of the jade perch fingerlings and the feed efficiency. The results revealed that the interaction between the protein sources and butyric acid content in the feeds significantly influenced the jade perch fingerlings’ final weight, the percentage of weight gain, the feed conversion ratio, and the protein efficiency ratio (p < 0.05) but had no significant influence on the amount of feed intake (p > 0.05). The survival rate of the jade perch fingerlings was 100% for all treatment groups at the end of the experiment.

3.2. Blood Chemistry Test

Table 4 illustrates the blood chemistry test results. The RBC count was the highest in the FMB group, at 3.1 × 10⁶/µL, which was significantly higher than those of the FM (2.2 × 10⁶/µL), FBM (2.2 × 10⁶/µL), and BM (2.1 × 10⁶/µL) groups (p < 0.05). However, the FMB group’s RBC count was not significantly different to those of the FBMB (3.1 × 10⁶/µL) or BMB (3.0 × 10⁶/µL) groups (p > 0.05). In addition, the FMB group had the highest HGB concentration, at 9.4 g/dL, which was significantly higher than those of the FM (7.7 g/dL), FBM (7.5 g/dL), and BM (7.2 g/dL) groups (p < 0.05) but not significantly different to those of the FBMB (8.6 g/dL) or BMB (8.3 g/dL) groups (p > 0.05). The highest Hct was observed in the FMB group, at 32.5%, which was significantly higher than those of the FM (29.2%), FBM (25.0%), and BM (24.6%) groups (p < 0.05) but not significantly different from those of the FBMB (31.2%) or BMB (30.8%) groups (p > 0.05). The FM group had the highest MCV, at 36.1 fL, which was significantly higher than those of the FMB (30.3 fL), FMBM (27.9 fL), and BMB (28.1 fL) groups (p < 0.05) but not significantly different from those of the FBM (34.8 fL) or BM (34.3 fL) groups (p > 0.05). In addition, the FM group’s MCH (136.9 pg) was the highest among all the treatment groups (p < 0.05). By contrast, the MCH of the FBM group was the lowest among all the treatment groups (104.3 pg) but was not significantly different from those of the FMB, FBM, FBMB, or BM groups (p > 0.05). For the MCHC, the FBM group had the highest concentration, at 29.9 g/dL, which was significantly higher than those of the FM and BMB groups (p < 0.05) but not significantly different from those of the FMB, FBMB, or BM groups (p > 0.05).
A multifactor analysis was conducted to investigate how the proteins and the butyric acid content in the feeds influenced the blood chemistry test parameters. The results revealed that RBC, MCV, and MCH were not influenced by the composition of the protein sources in the feeds but were influenced significantly by the contents of butyric acid. HGB was not influenced by the protein sources or the butyric acid contents. Hct and MCHC were not influenced by the butyric acid contents but were significantly influenced by the feeds’ protein source compositions. All the parameters in the blood chemistry test were influenced significantly by the interactions between the feeds’ protein source composition and butyric acid content.

3.3. Body Composition Analysis

Table 5 reveals the influences of the feeds’ protein sources and butyric acid contents on the body composition of the jade perch fingerlings. The BMB group had a 77.6% water content in the muscle, which was significantly lower than those of the FM and FBM groups (p < 0.05) but not significantly different from those of the FMB, FBMB, or BM groups (p > 0.05). The crude protein content in the muscle of the FMB group (88.4%) was the highest (p < 0.05), followed by the FBMB group (86.3%), with the BM group having the lowest crude protein content (84.1%). The FM group had the highest crude lipid content in the muscle (15.7%; p < 0.05), followed by the FMB group (14.2%); the BMB group had the lowest crude lipid content (13.2%). The groups exhibited no significant differences regarding the ash contents in the muscles, which ranged from 4.4% to 4.5%. The multifactor analysis revealed that the interaction between the feeds’ protein source compositions and the butyric acid contents had significant influences on the crude protein contents and crude lipid contents in the muscles of the jade perch fingerlings (p < 0.05). However, no such influence was observed in the water or ash contents in the fingerlings’ muscles (p > 0.05).

3.4. Analysis of Antioxidant Enzyme Activity

Table 6 presents the influences of the feeds’ protein source compositions and butyric acid contents on the antioxidant enzyme activity in the jade perch fingerlings. At the end of the feeding experiment, the jade perch fingerlings in the FMB group exhibited the highest enzyme activity in the hepatic tissues (p < 0.05), with 14.5 U/mg protein for SOD, 13.8 U/mg protein for CAT, and 16.2 U/mg protein for GPx. By contrast, the BM group had the lowest antioxidant enzyme activity (p < 0.05), with 8.2 U/mg protein for SOD, 7.5 U/mg protein for CAT, and 8.8 U/mg protein for GPx. A multifactor analysis was conducted to determine how the interaction between the feeds’ protein source compositions and butyric acid contents influenced the antioxidant enzyme activity in the jade perch fingerlings. The results revealed that said activity was influenced significantly by both the protein source compositions and the butyric acid contents. The jade perch fingerlings in the FMB group had the lowest MDA content in the hepatic tissues (1.0 μmole/g tissue; p < 0.05). By contrast, the highest MDA content was noted in the BM group (p < 0.05). A multifactor analysis revealed that the MDA content was significantly influenced by both the protein source compositions and the butyric acid contents.
Regarding serum enzyme activity, the jade perch fingerlings in the FBMB group exhibited significantly higher ALT activity in the hepatic tissues (27.3 IU/L) than did those in the FM (19.8 IU/L), FBM (19.8 IU/L), and BM (19.9 IU/L) groups (p < 0.05). However, this activity differed only nonsignificantly from the ALT activity in the FMB group (27.2 IU/L) and BMB group (26.8 IU/L (p > 0.05). In a multifactor analysis on how the interaction between the feeds’ protein source compositions and butyric acid contents influenced the ALT activity of the jade perch fingerlings, there was demonstrated to be a significant influence of the butyric acid content but only a nonsignificant influence of the protein source composition on ALT activity.
The jade perch fingerlings in the BMB group had the highest AST activity in the hepatic tissues, namely 28.6 IU/L, which was significantly higher than those in the FM (20.8 IU/L), FBM (20.7 IU/L), and BM (20.7 IU/L) groups (p < 0.05) but differed only nonsignificantly from those in the FMB (28.5 IU/L) and FBMB (28.5 IU/L) groups (p > 0.05). A multifactor analysis was performed to examine the influence of the interaction between the feeds’ protein source compositions and butyric acid contents on the fingerlings’ AST activity. The results revealed a significant influence of the butyric acid content but only a nonsignificant influence of the protein source composition on AST activity.

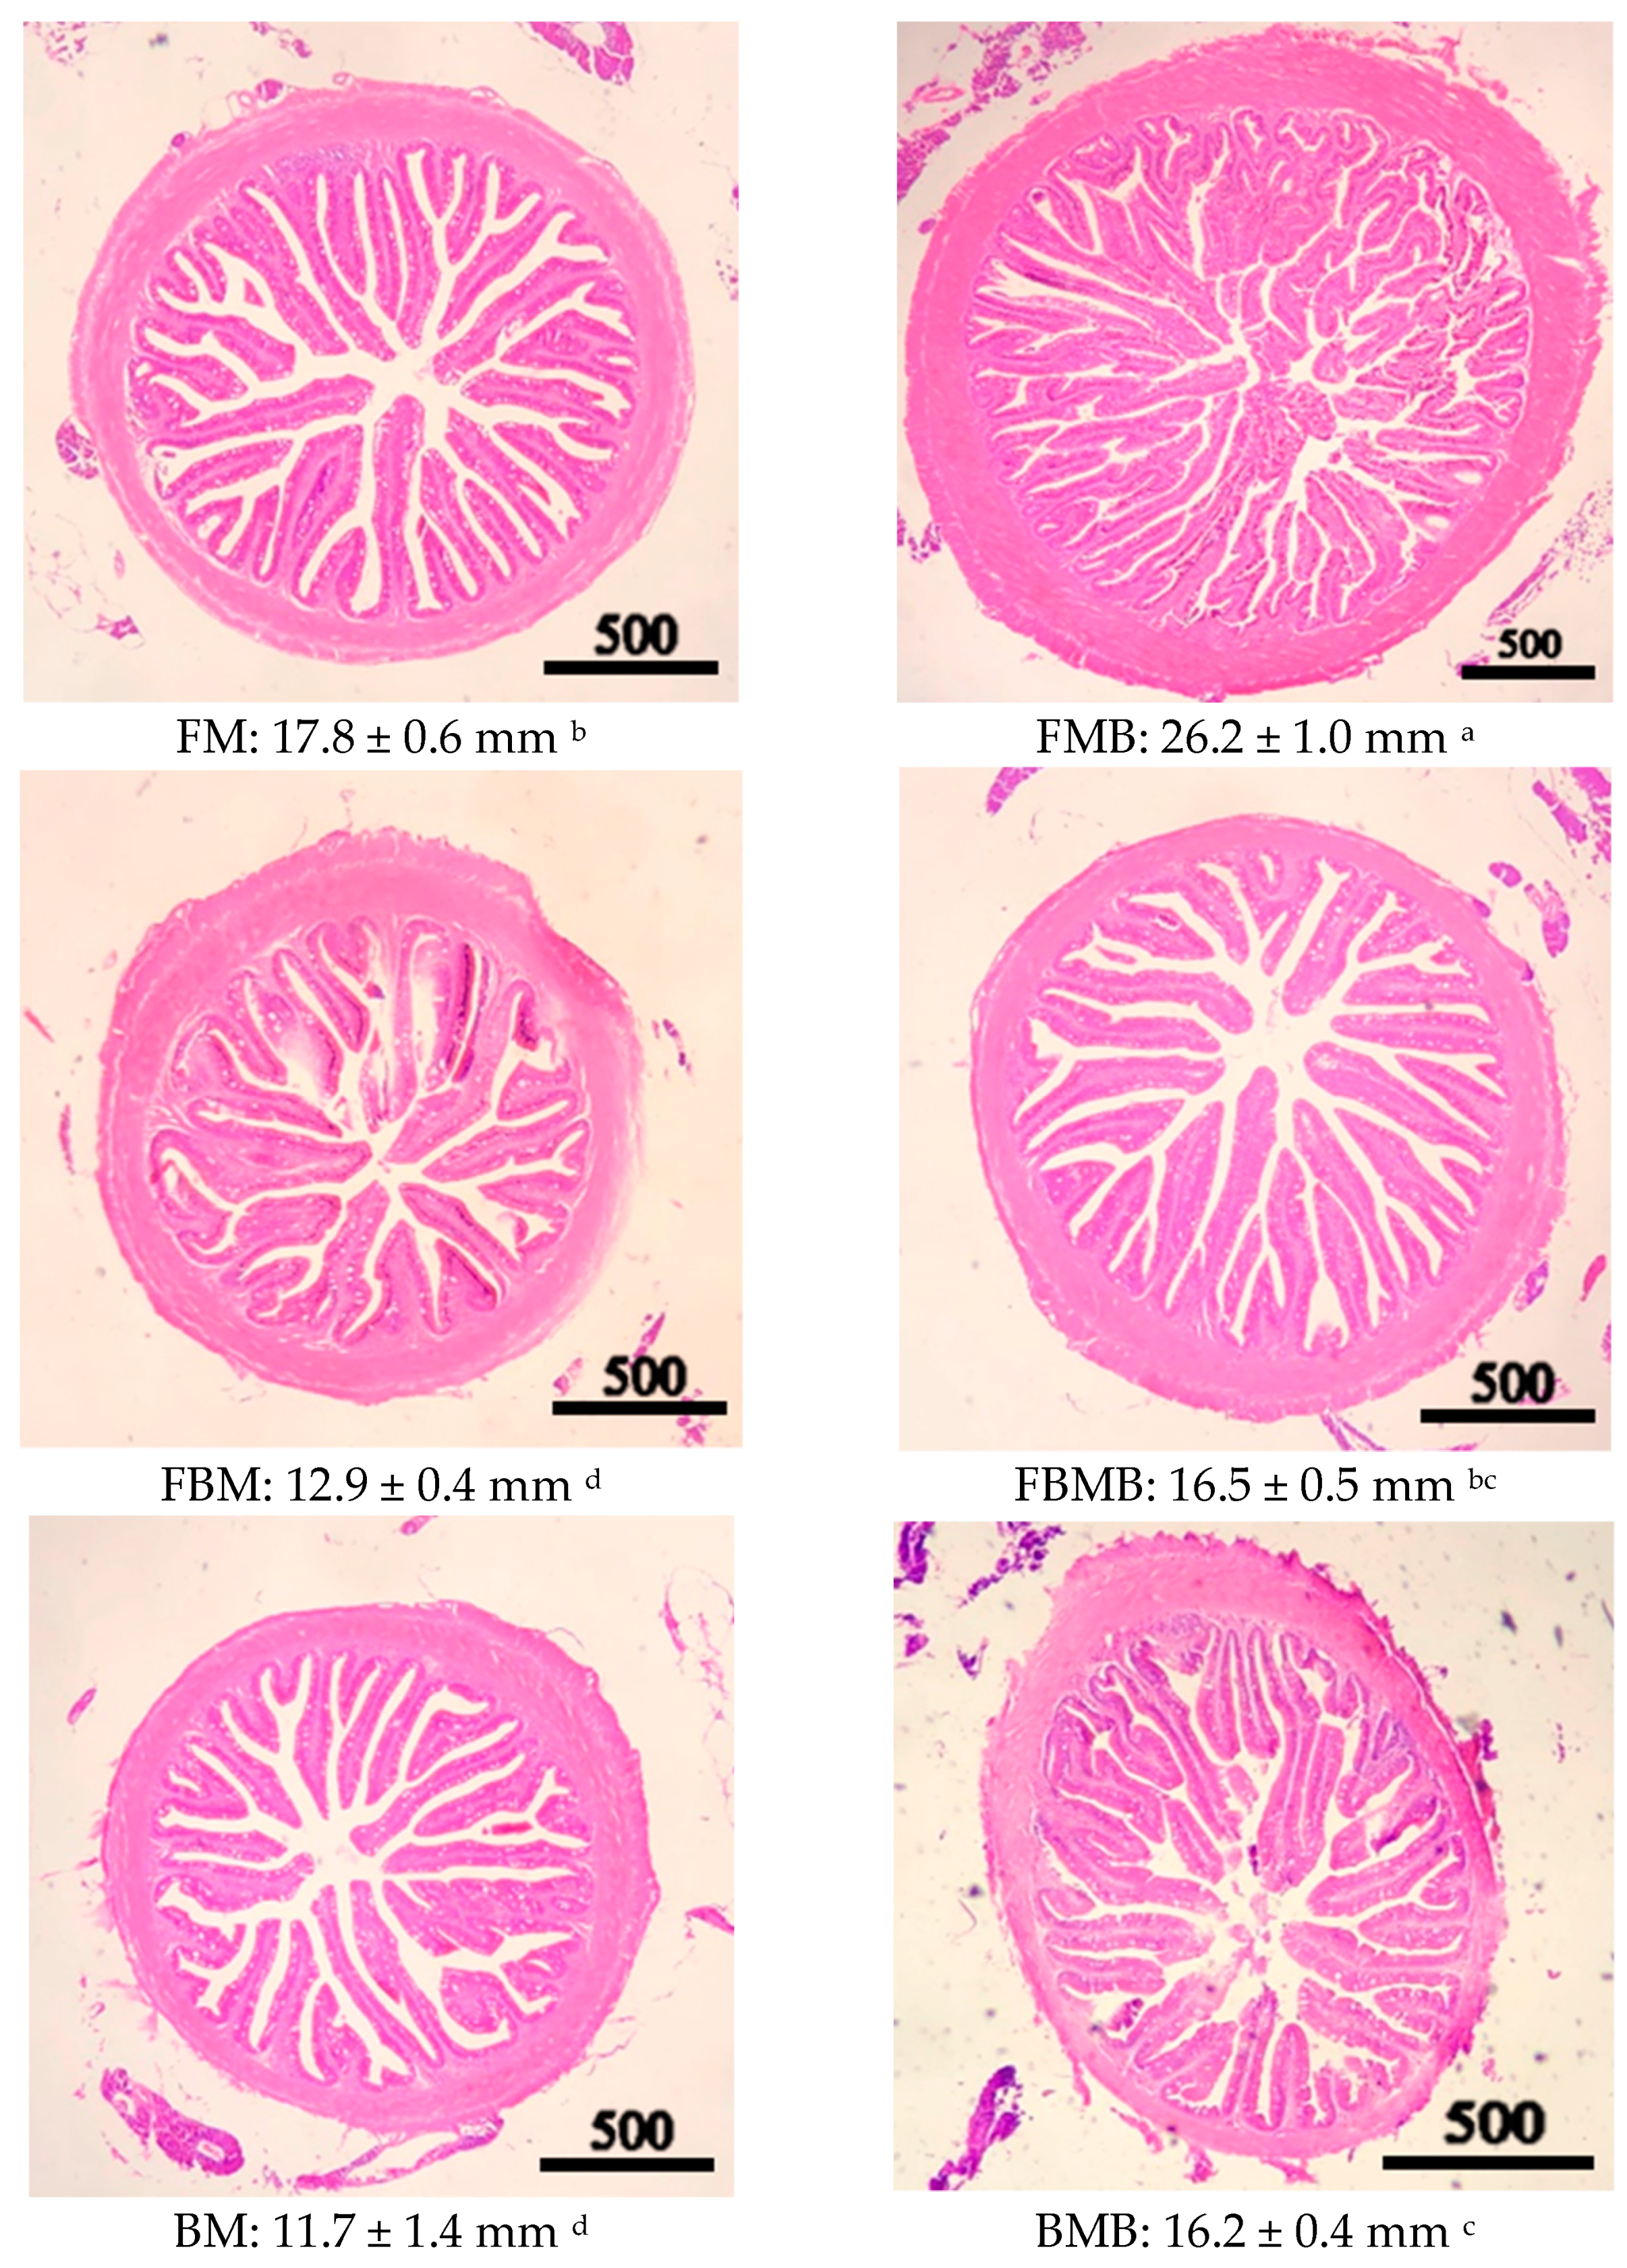
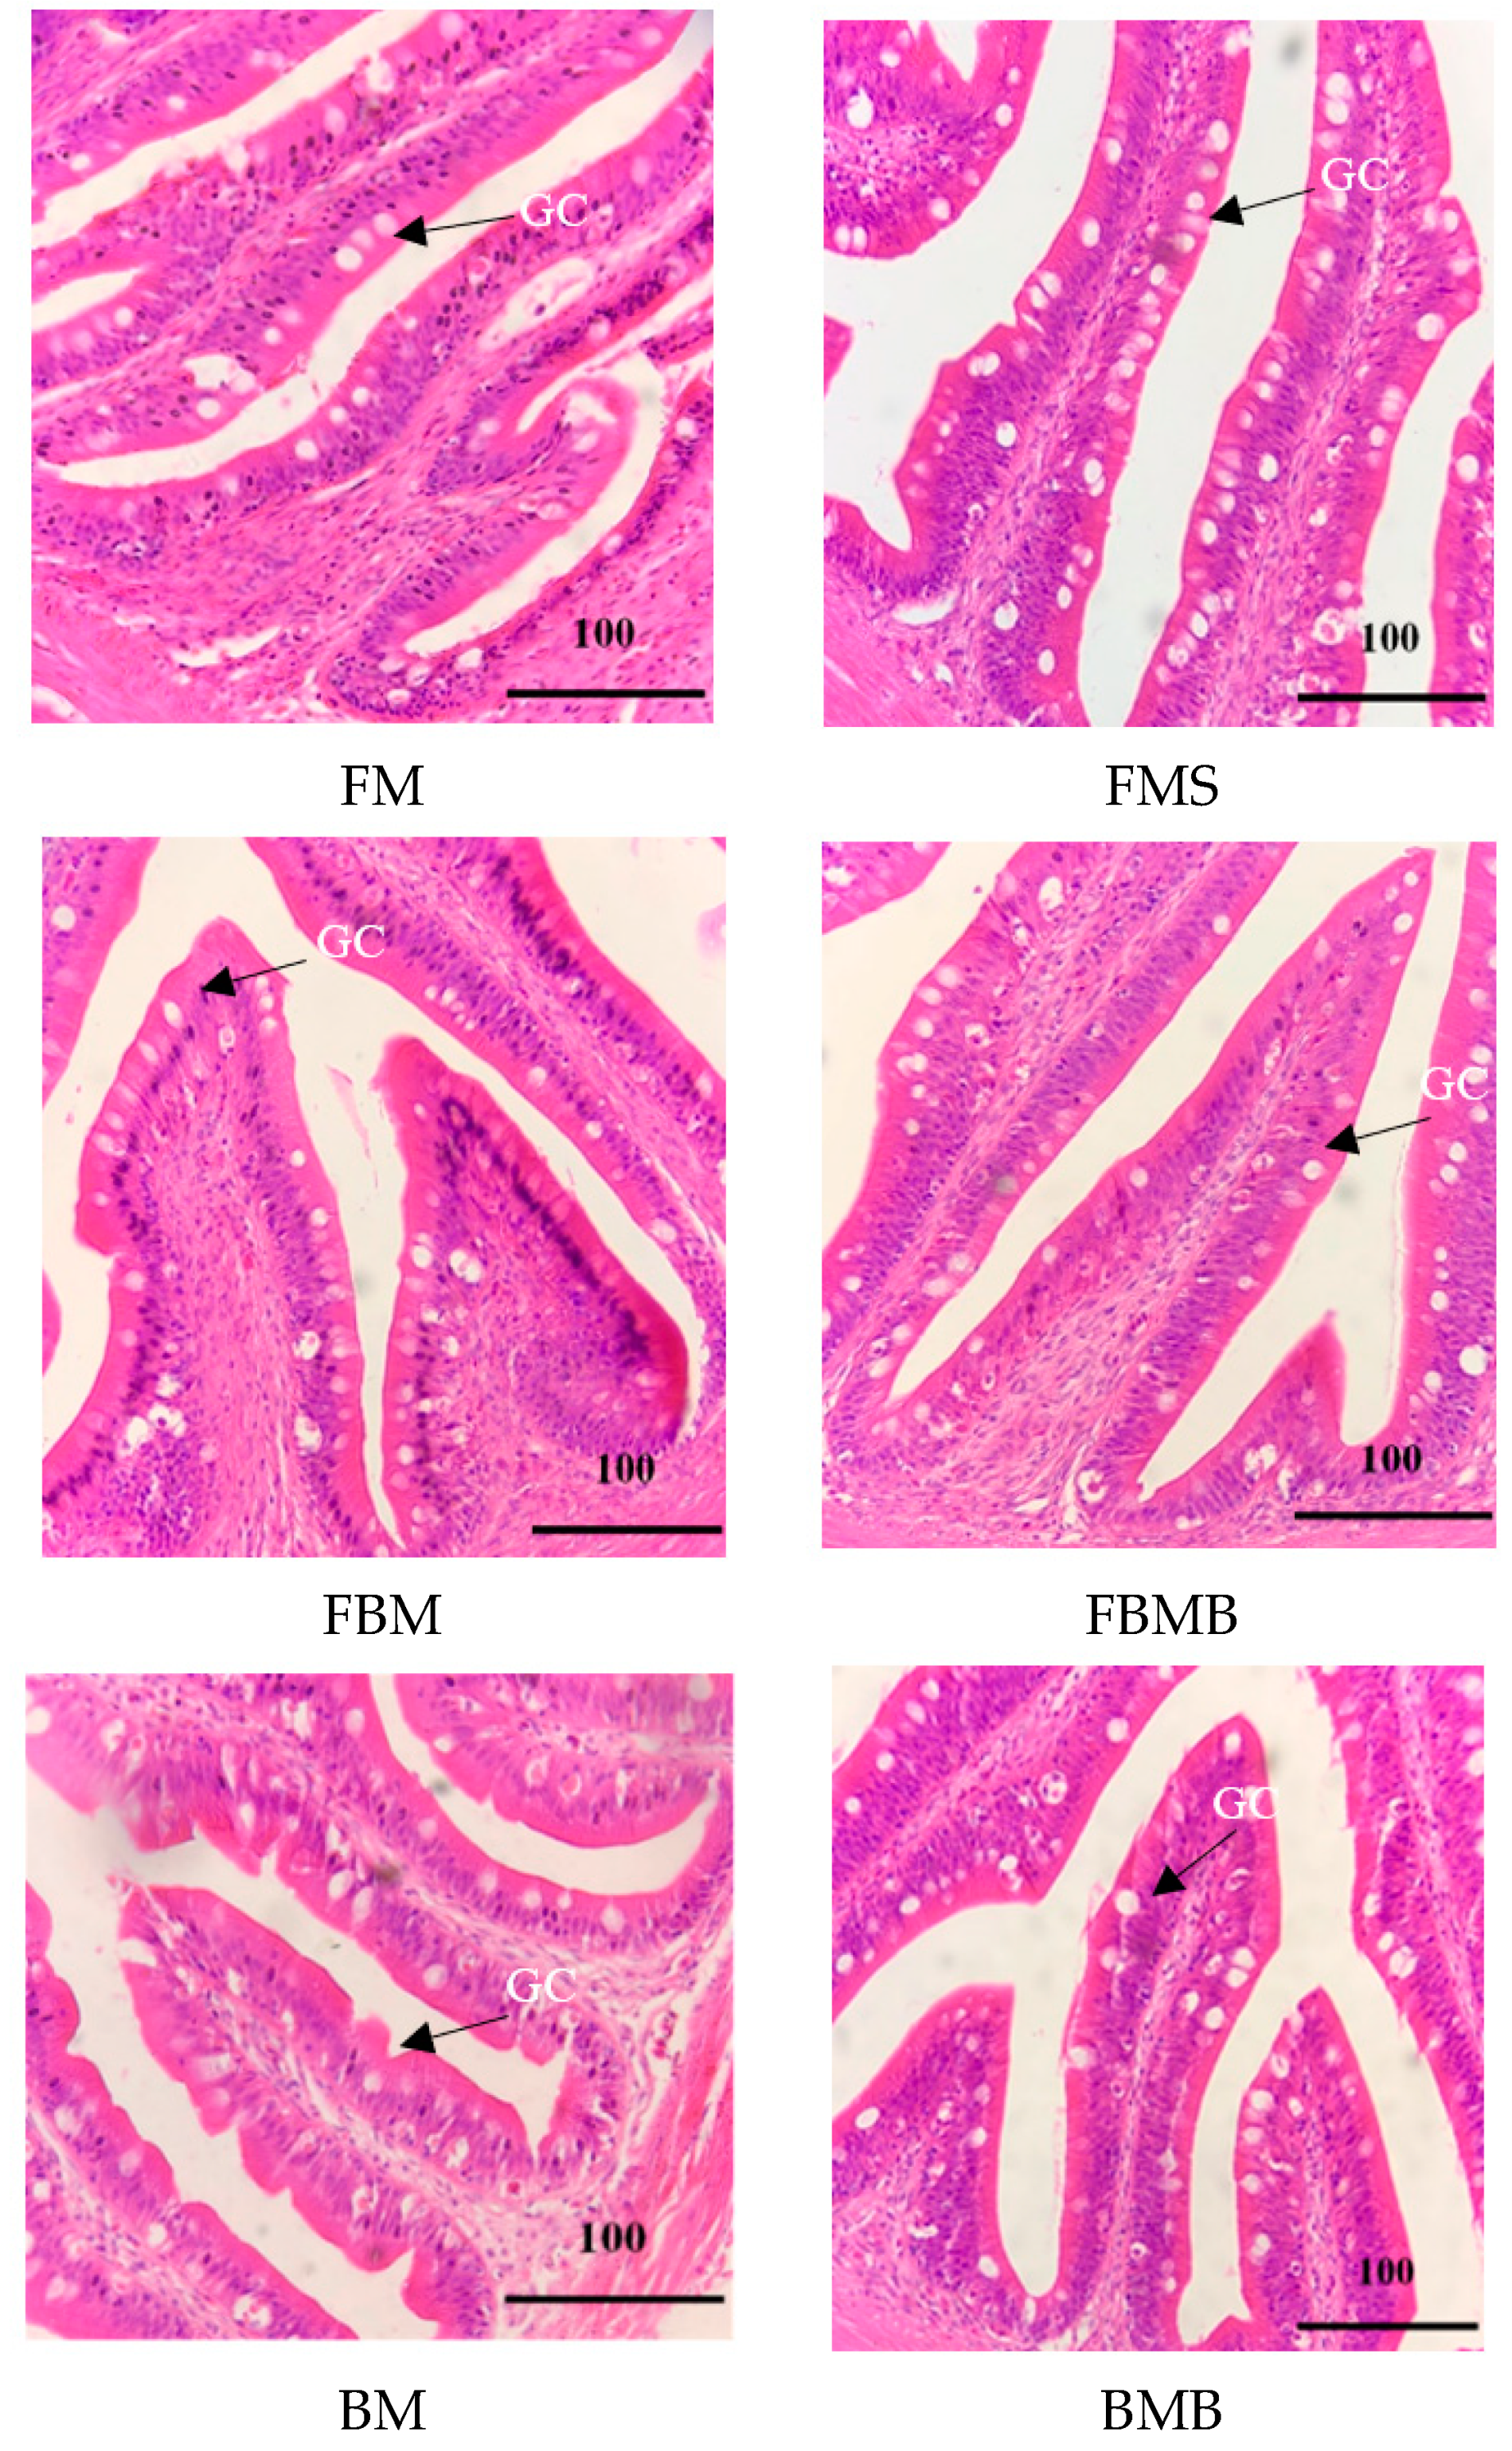
3.5. Intestinal Tract Section

Figure 1 and Figure 2 present sections of the anterior intestine obtained from the jade perch fingerlings consuming feeds that contained two different protein sources and butyric acid contents. As is presented in these two figures, the anterior intestinal villi of the FM group (17.8 ± 0.6 mm) were significantly longer than those of the FBM (12.9 ± 0.4 mm) and BM (11.7 ± 1.4 mm) groups (p < 0.05). Of the groups whose feeds contained butyric acid, the FMB group’s intestinal villi (26.2 ± 1.0 mm) were significantly longer than those of the FBMB (16.5 ± 0.5 mm) and BMB (16.2 ± 0.4 mm) groups (p < 0.05). In addition, the groups whose feeds contained butyric acid had more complete tissues and higher goblet cell counts in the intestinal villi, compared with the groups whose feed did not contain butyric acid.

4. Discussion

In this study, the experimental feed’s nutrient composition changed as the amount of black soldier fly meal added to it was increased. Furthermore, the highly unsaturated fatty acid and total essential amino acid contents decreased as more black soldier fly meal was added to the feed, possibly because of the media in which black soldier fly are bred. Similar phenomena have been reported in other studies. For example, Ref. [14] used chicken manure to breed black soldier flies and then produced meal from them, fed the meal to yellow catfish in a feeding experiment, and discovered that the black soldier fly meal could substitute for 34% of fish meal as a protein source. Ref. [32] employed a peanut bran medium to breed black soldier flies, produced meal from them, and fed the meal to yellow catfish; the experimental results revealed that this meal could substitute for only 12% of fish meal as a protein source. Ref. [33] produced black soldier fly meal from flies feeding on food waste, fed yellow catfish with this meal, and reported that it could substitute for only 14% of fish meal as a protein source. Also using food waste to breed black soldier flies, Ref. [34] and Ref. [33] have produced meal from the flied and fed this meal to white shrimps in their experiments; the meal they produced could substitute for 23.5% and 10% of fish meal as a protein source, respectively. In the present study, increases in the amount of black soldier fly meal added to the feed in the place of fish meal may have reduced the content of essential amino acid, resulting in an unbalanced amino acid composition and changing the content of highly unsaturated fatty acid in the feed. Such changes in nutrient composition undermined the jade perch fingerlings’ growth performance. Furthermore, anti-nutritional factors are compounds that reduce the absorption of nutrients, such as phytic acid in soybeans [35]. Therefore, in this study, black soldier flies may contain antinutrients, which is likely caused by the different chemical compositions of the soybean meal on which the insects feed. In summary, although black soldier fly meal is a favorable protein source, its suitability for use in aquaculture feed depends on how the black soldier flies are bred.
Extensive research and discussions have been conducted regarding the performances of alternative ingredients to fish meal. However, related research has predominantly focused on whether the nutrient compositions of such alternatives meet the needs of aquatic organisms, without discussing how nutrient absorption can be improved for these organisms. Intestinal health is critical for the digestion and absorption of nutrients, the resistance to pathogenic micro-organisms, the influence of food antigens on organisms, and the secretion of hormones involved in the regulation of antimicrobial peptides and food intake [36]. Ref. [37] suggested that butyric acid can provide energy to epithelial cells, substantially increase cell proliferation, and improve the colonic barrier function. Ref. [38] noted that a black soldier fly meal protein content higher than 5.3% in feeds caused damage to fish intestinal villi, created vacuoles in the hepatopancreas, and reduced lipid accumulation in tissues. This may result from the chitin existing in black soldier fly meal. Chitin is widely distributed within insects, and chitin polysaccharides account for approximately 20% of the dry weight of insect shells [39]. Ref. [38] indicated that chitin and its derivatives were reported to play a significant role in decreasing fatty acid synthesis as well as decreasing the digestibility of crude protein.
In the present study, butyric acid was added to a variety of feed formulas for the feeding experiment, which revealed a significantly reduced intestinal villi length (p < 0.05) when black soldier fly meal without supplemented butyric acid was used as a substitute for fish meal in the feed. However, the addition of butyric acid significantly improved the growth of the jade perch fingerlings, their intestinal villi length, and their antioxidant enzyme activity (p < 0.05). These results verified the benefits of adding butyric acid to feed and thus were consistent with the finding of Ref. [40], namely that adding 1.3–1.5 mg/kg of sodium butyrate nanoparticles to their feed increased the surface area of the intestinal villi of Nile tilapia (Oreochromis niloticus) fingerlings, thereby improving their growth performance. Ref. [41] and [42] have reported that adding 2 g/kg of butyric acid to their feed can improve the growth of grass carp (Ctenopharyngodon idellus). Similar growth improvement was achieved by Ref. [37] by adding 3 g/kg of butyric acid to the feed of sea bream (Sparus aurata). However, Ref. [43] added 500 mg/kg of butyric acid to the feed of grass carp (Ctenopharyngodon idella) and observed no effect of the butyric acid on the grass carp’s growth; nevertheless, butyric acid was found to promote the growth of healthy bacteria in the intestines. Ref. [41] and Ref. [44] added an acidifier to the feed of Nile tilapia fingerlings that weighed 26 g, and reported that the acidifier significantly improved the growth of healthy intestinal microbiota and reduced the numbers of pathogenic bacteria. The present study’s growth parameters and intestinal tissue sections revealed that the study groups that consumed the feeds containing butyric acid had significantly longer intestinal villi than did those that consumed the feeds not containing butyric acid. Furthermore, the longer villi increased the intestines’ absorptive surface area, which in turn enhanced these groups’ nutrient absorption and growth performance.
Regarding feed performance, the FM group’s protein efficiency ratio (1.8%) was significantly higher than those of the FBM (1.3%) and BM (1.2%) groups. This finding indicated a greater protein efficiency in jade perch fingerlings when fish meal was the main protein source. Among the groups that consumed feeds containing butyric acid, the FMB group had the highest protein efficiency ratio (2.5%; p < 0.05). However, no significant difference was noted between the protein efficiency ratios of the FBMB and FM groups, possibly because of the addition of butyric acid. Ref. [45] indicated that butyric acid can inhibit harmful bacteria and promote the reproduction of beneficial bacteria after entering bacterial cells. Butyrate can also induce the synthesis of intestinal epithelial mRNA and protein, thus maintaining intestinal health, accelerating the proliferation of intestinal villus, and promoting nutrient absorption. This finding is exemplified by the study’s intestinal tissue sections, which showed an increased length in the anterior intestinal villi (26.16 mm) and indicating greater intestinal absorption in the FMB group. This observation is consistent with the finding of Ref. [46], namely that butyric acid promoted nutrient digestion and absorption by increasing the number of epithelial cells in the fish intestine. The intestine is the organ where nutrient absorption primarily occurs in fish; nutrients are transported in and out of intestinal cells through the brush border as well as specific transport proteins located outside the intestinal cell membrane [47,48]. Accordingly, the length of intestinal villi is closely associated with intestinal health; good intestinal health is necessary for efficient nutrient absorption to promote growth in organisms [49].
The nutrient composition of a diet affects the construction of intestinal villi, especially protein sources and their amino acid compositions. Many histological studies have been investigating the impact of various dietary protein sources and unbalanced amino acid composition in fish including rainbow trout [50], gilthead sea bream [51], and common carp [52]. The partial amino acid deficiency in black soldier fly meal protein-based diets (BM and BMB) adversely affected the fish intestinal epithelium. Therefore, the histological effects on the intestine observed in this study may be partly explained by an amino acid imbalance in black soldier fly meal. The experimental results of this study revealed that, with regards to the amino acid composition balance in diets, adding butyric acid significantly increased the length of the anterior intestinal villi and thus benefited the intestinal health and nutrient absorption of the jade perch fingerlings.
Changes in blood parameters, which are sensitive to the nutrient composition of feed, may serve as a critical reference for assessing the health and physiological status of fish [53]. Ref. [54] highlighted that the HGB and Hct of fish decreased when the amount of nutrients was insufficient, thereby proving that blood parameters are effective indicators of fish health. In the present study, adding butyric acid to the feed significantly increased the RBC count, the HGB, and the Hct of the jade perch fingerlings. This result is consistent with those of other studies on fish. For example, Ref. [40] added 1–2 mg/kg of butyric acid nanoparticles to the feed of Nile tilapia and observed a significantly increased RBC count, HGB concentration, Hct, and white blood cell count. Ref. [41] added 2–3 g/kg of sodium butyrate to the feed of European seabass fingerlings and observed increases in the HGB, Hct, RBC count, MCHC, and white blood cell count. In the present study, the feeds containing butyric acid significantly increased the blood parameter values of the jade perch fingerlings, thereby demonstrating the health benefits of butyric acid to these fingerlings.
According to Ref. [55], changes in serum ALT and AST activities are associated with hepatic steatosis. The present study revealed that the jade perch fingerlings consuming the butyric-acid-containing feeds had significantly higher ALT and AST activities in the serum than did those consuming the feeds not containing butyric acid. Moreover, no significant differences were noted in the serum ALT and AST activities of the fingerlings consuming the feeds where the fish meal was replaced with black soldier fly meal and those consuming the feeds that contained fish meal as the sole protein source. The present results revealed that adding butyric acid to the feeds may have stimulated the fingerlings’ liver to some extent. However, no comprehensive discussion has been conducted regarding whether butyric acid causes hepatic damage in aquatic organisms. Ref. [40] conducted a feeding experiment by adding 2 mg/kg of butyric acid to the feed of Nile tilapia initially weighing 25.3 g and observed no hepatic damage in this Nile tilapia. Presenting a contrasting finding, Ref. [40] added 2 g/kg of butyric acid to the feed of largemouth bass (Micropterus salmoide) with an initial weight of 12.3 g and noted increased ALT and AST activities in the liver, which was consistent with histopathological changes. Accordingly, butyric acid’s damage to the liver may vary depending on the species and size of fish, the alternative protein sources used, and the environmental conditions. Several studies have reported that specific antimicrobial peptides and immunologically active substances in insect meal may improve the immunocompetent and antioxidant capacities of organisms. For example, Ref. [56] found that adding maggot meal to the feed of black carp significantly increased the SOD and CAT activities and reduced the MDA content in the serum and liver of the black carp. Similarly, Ref. [57] substituted maggot meal for fish meal in the feed of yellow catfish and demonstrated that when 20% of fish meal was replaced with maggot meal, the catfish exhibited decreased MDA content and increased SOD activity in the serum. This finding is inconsistent with the present study’s finding that substituting black soldier fly meal for more than 50% of the fish meal content in the feed resulted in an increased MDA content and decreased antioxidant enzyme activity in the liver. Ref. [38] conducted a study on carp and found that the carp’s serum MDA content increased with the percentage of fish meal substituted with defatted black soldier fly meal as the feed’s protein source. Accordingly, an appropriate amount of black soldier fly meal may improve the antioxidant capacity of fish, whereas an excessive amount could lead to negative outcomes, such as increased oxidative stress. Sodium butyrate administration increased antioxidant gene expression, such as the SOD, CAT, GPx, GST and GR genes, and consequently these enzyme activities increased in the intestines of fish, which led to lower ROS formation in the intestinal tissues, thereby reducing oxidative stress [58,59]. Ref. [60] suggested that excessive ROS could exacerbate increased MDA activity leading to lipid peroxidation, which decomposes and damages deoxyribonucleic acid, proteins, and the cytoplasm, resulting in cellular structural injury in organisms. When experiencing oxidative damage, an organism responds physiologically by increasing the activities of such antioxidant enzymes as SOD, CAT, and GPx [61]. These enzymes protect organisms from the oxidative stress caused by free radicals [62]. The present study verified the effectiveness of butyric acid in weakening the relationship between oxidant enzymes and lipid peroxidation indicators in jade perch fingerlings. Regarding the oxidative stress and lipid peroxidation induced in the process of replacing fish meal with black soldier fly meal, increasing the percentage of fish meal substituted with black soldier fly meal significantly decreased the SOD, CAT, and GPx activities and significantly increased the MDA content (p < 0.05). According to Ref. [63], antioxidant enzyme activity is negatively correlated with lipid peroxidation because antioxidant enzymes act against the ROS generated from oxidative stress. In the present study, the jade perch fingerlings that consumed feed containing butyric acid exhibited higher SOD, CAT, and GPx activities and lower MDA content than did those that consumed feed not containing butyric acid. This finding verified the benefit of butyric acid in inhibiting oxidation. In a two-way ANOVA, the interaction between the feed’s protein source composition and butyric acid content was found to significantly influence the antioxidant enzyme and lipid peroxidation indicators. Ref. [64] argued that organic acid can increase the antioxidant responses of aquatic animals; this argument has been verified in multiple fish species, including grass carp [42], Nile tilapia [65], and Pengze crucian carp [66]. In this study, the jade perch fingerlings that consumed the feeds containing butyric acid were more resistant to oxidative stress, which indicated that they were healthier compared with those that consumed the feeds not containing butyric acid.

5. Conclusions

The complete substitution of FM with black soldier fly meal derived from flies fed with soybean meal considerably reduced the growth performance of jade perch fingerlings and changed their muscle protein contents and lipid contents. Black soldier fly meal supplemented with butyric acid may effectively partially substitute FM in the diet of jade perch fingerlings without adversely affecting their growth performance.
This study verified the positive effects of butyric acid as a feed additive on the growth, feed efficiency, and intestinal histomorphology of jade perch fingerlings. Under the premise that the amino acid composition of the feed satisfies the dietary needs of the jade perch fingerlings, adding 1 g/kg of butyric acid to the feed of such fish improves their growth and intestinal health as well as the feed efficiency.

Author Contributions

Conceptualization, J.-H.C., T.-S.W. and T.-W.H.; methodology, T.-W.H.; formal analysis, T.-S.W. and T.-W.H.; data curation, T.-S.W. and T.-W.H.; writing—original draft, J.-H.C.; writing—review and editing, J.-H.C. All authors have read and agreed to the published version of the manuscript.

Funding

This research received no external funding.

Institutional Review Board Statement

All the animal experiments conformed to the principles of the use and care of experimental animals of National Chiayi University’s Biosafety Committee (approval no. NCYU-IACUC-11101).

Informed Consent Statement

Not applicable.

Data Availability Statement

Data are contained within the article.

Conflicts of Interest

The authors declare no conflict of interest.

References

  1. Tacon, A.G.J.; Silva, S.S.D. Feed preparation and feed management strategies within semi-intensive fish farming systems in the tropics. Aquaculture 1997, 151, 379–404. [Google Scholar] [CrossRef]
  2. Péron, G.; Mittaine, J.F.; Gallic, B.L. Where do fishmeal and fish oil products come from? An analysis of the conversion ratios in the global fishmeal industry. Mar. Policy 2010, 34, 815–820. [Google Scholar] [CrossRef]
  3. Zhou, F.; Song, W.; Shao, Q.; Peng, X.; Xiao, J.; Hua, Y.; Ng, W.K. Partial replacement of fish meal by fermented soybean meal. in diets for black sea bream, Acanthopagrus schlegelii, juveniles. J. World Aquacult. Soc. 2011, 42, 184–197. [Google Scholar] [CrossRef]
  4. Kim, S.S.; Galaz, G.B.; Pham, M.A.; Jang, J.W.; Oh, D.H.; Yeo, I.K.; Lee, K.J. Effects of dietary supplementation of a Meju, Fermented soybean meal, and aspergillus oryzae for juvenile Parrot fish (Oplegnathus fasciatus). Asian-Aust. J. Anim. Sci. 2009, 22, 849–856. [Google Scholar] [CrossRef]
  5. FAO. The State of World Fisheries and Aquaculture; Food and Agriculture Organization of the United Nations: Rome, Italy, 2022. [Google Scholar]
  6. Parolini, M.; Ganzaroli, A.; Bacenetti, J. Earthworm as an alternative protein source in poultry and fish farming: Current applications and future perspectives. Sci. Total Environ. 2020, 734, 139460. [Google Scholar] [CrossRef] [PubMed]
  7. FAO. The State of World Fisheries and Aquaculture; Food and Agriculture Organization of the United Nations: Rome, Italy, 2023. [Google Scholar]
  8. Van Huis, A.; Tomberlin, J.K. Insects as Food and Feed: From Production to Consumption, 1st ed.; Wageningen Academic Publishers: Wageningen, The Netherlands, 2017; pp. 73–96. [Google Scholar]
  9. Henchion, M.; Hayes, M.; Mullen, A.M.; Fenelon, M.; Tiwari, B. Future Protein Supply and Demand: Strategies and Factors Influencing a Sustainable Equilibrium. Foods 2017, 53, 53. [Google Scholar] [CrossRef]
  10. Wang, Y.S.; Shelomi, M. Review of Black Soldier Fly (Hermetia illucens) as Animal Feed and Human Food. Foods 2017, 6, 91. [Google Scholar] [CrossRef] [PubMed]
  11. Dosdat, A. Environmental impact of aquaculture in the Mediterranean: Nutritional and feeding aspects. Zaragoza: CIHEAM. Cah. Options Méditerranéennes 2001, 55, 23–36. [Google Scholar]
  12. Barragan-Fonseca, K.B.; Dicke, M.; van Loon, J.J.A. Nutritional value of the black soldier fly (Hermetia illucens L.) and its suitability as animal feed—A review. J. Insects Food Feed 2017, 3, 105–120. [Google Scholar] [CrossRef]
  13. Abdel-Tawwab, M.; Khalil, R.H.; Metwally, A.A.; Shakweer, M.S.; Khallaf, M.A.; Abdel-Latif, H.M.R. Effects of black soldier fly (Hermetia illucens L.) larvae meal on growth performance, organs-somatic indices, body composition, and hemato-biochemical variables of European sea bass, Dicentrarchus labrax. Aquaculture 2020, 522, 735136. [Google Scholar] [CrossRef]
  14. Xiao, X.; Jin, P.; Zheng, L.; Cai, M.; Yu, Z.; Yu, J.; Zhang, J. Effects of black soldier fly (Hermetia illucens) larvae meal protein as a fishmeal replacement on the growth and immune index of yellow catfish (Pelteobagrus fulvidraco). Aquac. Res. 2018, 49, 1569–1577. [Google Scholar] [CrossRef]
  15. Huyben, D.; Vidaković, A.; Hallgren, S.W.; Langeland, M. High-throughput sequencing of gut microbiota in rainbow trout fed larval and prepupae stages of black soldier fly (Hermetia illucens). Aquaculture 2019, 500, 485–491. [Google Scholar] [CrossRef]
  16. Fisher, H.J.; Collins, S.A.; Hanson, C.; Mason, B.; Colombo, S.M.; Anderson, D.M. Black soldier fly larvae meal as a protein source in low fish meal diets for Atlantic salmon (Salmo salar). Aquaculture 2020, 521, 734978. [Google Scholar] [CrossRef]
  17. Devic, E.; Leschen, W.; Murray, F.; Little, D.C. Growth performance, feed utilization and body composition of advanced nursing Nile tilapia (Oreochromis niloticus) fed diets containing black soldier fly (Hermetia illucens) larvae meal. Aquac. Nutr. 2018, 24, 416–423. [Google Scholar] [CrossRef]
  18. Foysal, M.J.; Fotedar, R.; Tay, C.Y.; Gupta, S.K. 2019. Dietary supplementation of black soldier fly (Hermetica illucens) meal modulates gut microbiota, innate immune response and health status of marron (Cherax cainii, Austin 2002) fed poultry-by-product and fishmeal based diets. PeerJ 2019, 7, e6891. [Google Scholar] [CrossRef]
  19. Gebremichael, A.; Kucska, B.; Ardó, L.; Biró, J.; Berki, M.; Lengyel-Kónya, É.; Tömösközi-Farkas, R.; Egessa, R.; Müller, T.; Gyalog, G.; et al. Physiological Response of Grower African Catfish to Dietary Black Soldier Fly and Mealworm Meal. Animals 2023, 13, 968. [Google Scholar] [CrossRef] [PubMed]
  20. Gorka, P.; Kowalski, Z.M.; Pietrzak, P.; Kotunia, A.; Jagusiak, W.; Holst, J.J. Effect of method of delivery of sodium butyrate on rumen development in newborn calves. J. Diary Sci. 2011, 94, 5578–5588. [Google Scholar] [CrossRef]
  21. Berni Canani, R.; Di Costanzo, M.; Leone, L.; Pedata, M.; Meli, R.; Calignano, A. Potential beneficial effects of butyrate in intestinal and extraintestinal disease. World J. Gastroenterol. 2011, 17, 1519–1528. [Google Scholar] [CrossRef]
  22. Astbury, S.M.; Corfe, B.M. Uptake and metabolism of the short-chain fatty acid butyrate, a critical review of the literature. Curr. Drug Metab. 2012, 13, 815–821. [Google Scholar] [CrossRef] [PubMed]
  23. Xiao, S.W.; Jiang, S.; Qian, D.W.; Duan, J.A. Modulation of microbially derived short-chain fatty acids on intestinal homeostasis, metabolism, and neuropsychiatric disorder. Appl. Microbiol. Biotechnol. 2020, 104, 589–601. [Google Scholar] [CrossRef]
  24. Mog, M.; Ngasotter, S.; Tesia, S.; Waikhom, D.; Panda, S.P.; Sharma, S.; Varshney, S. Problems of antibiotic resistance associated with oxytetracycline use in aquaculture: A review. J. Entomol. Zool. Stud. 2020, 8, 1075–1082. [Google Scholar]
  25. Manrique Vergara, D.; González Sánchez, M.E. Short chain fatty acids (butyric acid) and intestinal diseases. Nutr. Hosp. 2017, 34, 58–61. [Google Scholar] [CrossRef]
  26. Zarei, S.; Badzohreh, G.; Davoodi, R.; Bahabadi, M.N.; Salehi, F. Effects of dietary butyric acid glycerides on growth performance, haemato-immunological and antioxidant status of yellowfin seabream (Acanthopagrus latus) fingerlings. Aquac. Res. 2021, 52, 5840–5848. [Google Scholar] [CrossRef]
  27. Aalamifar, H.; Soltanian, S.; Vazirzadeh, A.; Akhlaghi, M.; Morshedi, V.; Gholamhosseini, A.; Mozanzadeh, M.T. Dietary butyric acid improved growth, digestive enzyme activities and humoral immune parameters in Barramundi (Lates calcarifer). Aquac. Nutr. 2020, 26, 156–164. [Google Scholar] [CrossRef]
  28. Sangari, M.; Sotoudeh, E.; Bagheri, D.; Morammazi, S.; Mozanzadeh, M.T. Growth, body composition, and hematology of yellowfin seabream (Acanthopagrus latus) given feeds supplemented with organic acid salts (sodium acetate and sodium propionate). Aquac. Int. 2020, 29, 261–273. [Google Scholar] [CrossRef]
  29. Sotoudeh, E.; Sangari, M.; Bagheri, D.; Morammazi, S.; Torfi Mozanzadeh, M. Dietary organic acid salts mitigate plant protein induced inflammatory response and improve humoral immunity, antioxidative status and digestive enzyme activities in yellowfin seabream, Acanthopagrus latus. Aquac. Nutr. 2020, 2, 1669–1680. [Google Scholar] [CrossRef]
  30. Chu, J.H.; Liu, K.J.; Wu, T.M. Effects of pitaya (Hylocereus polyrhizus) fermentation waste dietary supplement on growth performance, and anti-oxidation of Pinnate batfish, Platax pinnatus. Aquac. Res. 2021, 52, 6689–6698. [Google Scholar] [CrossRef]
  31. Chu, J.H.; Chen, S.M.; Huang, C.H. Growth, hematological parameters and tissue lipid peroxidation of soft-shelled turtles, Pelodiscus sinensis, fed diets supplemented with different levels of ferrous sulphate. Aquac. Nutr. 2009, 15, 54–59. [Google Scholar] [CrossRef]
  32. Han, X.; Kun, Y.E.; Wang, Z.; Chen, F.; Chai, Z.; Zhan, W.; Wang, Q. Effect of substitution of fish meal with defatted black soldier fly larvae meal on growth, body composition, serum biochemical parameters, and antioxidant capacity of juvenile large yellow croaker (Larimichthys crocea). J. Fish. Sci. China 2020, 27, 524–535. [Google Scholar]
  33. Hu, J.R.; Wang, G.X.; Huang, Y.H. Effects of substitution of fish meal with black soldier fly (Hermetia illucens) larvae meal, in yellow catfish (Pelteobagrus fulvidraco) diets. Isr. J. Aquac. Bamidgeh 2017, 69, 1382–1391. [Google Scholar]
  34. Wang, G.X.; Peng, H.U., Jr. Evaluation of defatted Hermetia illucens larvae meal for Litopenaeus vannamei: Effects on growth performance, nutrition retention, antioxidant and immune response, digestive enzyme activity and hepatic morphology. Aquac. Nutr. 2021, 27, 986–997. [Google Scholar] [CrossRef]
  35. Thrastardottir, R.; Olafsdottir, H.T.; Thorarinsdottir, R.I. Yellow Mealworm and Black Soldier Fly Larvae for Feed and Food Production in Europe, with Emphasis on Iceland. Foods 2021, 10, 2744. [Google Scholar] [CrossRef]
  36. Dong, B.; Yi, Y.H.; Liang, L.F. High throughput identification of antimicrobial peptides from fish gastrointestinal microbiota. Toxins 2017, 9, 266. [Google Scholar] [CrossRef] [PubMed]
  37. Robles, R.; Lozano, A.B.; Sevilla, A.; Máarquez, L.; Nuez-Ortin, W.; Moyano, F.J. Effect of partially protected butyrate used as feed additive on growth and intestinal metabolism in sea bream (Sparus aurata). Fish Physiol. Biochem. 2013, 39, 1567–1580. [Google Scholar] [CrossRef] [PubMed]
  38. Li, S.; Ji, H.; Zhang, B.; Zhou, J.; Yu, H. Defatted black soldier fly (Hermetia illucens) larvae meal in diets for juvenile Jian carp (Cyprinus carpio var. Jian): Growth performance, antioxidant enzyme activities, digestive enzyme activities, intestine and hepatopancreas histological structure. Aquaculture 2017, 477, 62–70. [Google Scholar] [CrossRef]
  39. Finke, M.D. Estimate of Chitin in Raw Whole Insect. Zoo Biol. 2007, 26, 105–115. [Google Scholar] [CrossRef] [PubMed]
  40. Abdel-Tawwab, M.; Shukry, M.; Farrag, F.A.; El-Shafai, N.M.; Dawood, M.A.O.; Abdel-Latif, H.M.R. Dietary sodium butyrate nanoparticles enhanced growth, digestive enzyme activities, intestinal histomorphometry, and transcription of growth-related genes in Nile tilapia juveniles. Aquaculture 2021, 536, 736467. [Google Scholar] [CrossRef]
  41. Abdel-Mohsen, H.H.; Wassef, E.A.; El-Bermawy, N.M.; Abdel-Meguid, N.E.; Saleh, N.E.; Barakat, K.M.; Shaltout, O.E. Advantageous effects of dietary butyrate on growth, immunity response, intestinal microbiota and histomorphology of European Seabass (Dicentrarchus labrax) fry. Egypt. J. Aquat. Biol. Fish. 2018, 22, 93–110. [Google Scholar] [CrossRef]
  42. Liu, M.; Guo, W.; Wu, F.; Qu, Q.C.; Tan, Q.S.; Gong, W.B. Dietary supplementation of sodium butyrate may benefit growth performance and intestinal function in juvenile grass carp (Ctenopharyngodon idellus). Aquac. Res. 2016, 47, 4102–4111. [Google Scholar] [CrossRef]
  43. Zhou, J.S.; Guo, P.; Yu, H.B.; Ji, H.; Lai, Z.W.; Chen, Y.A. Growth performance, lipid metabolism, and health status of grass carp (Ctenopharyngodon idella) fed three different forms of sodium butyrate. Fish Physiol. Biochem. 2019, 45, 287–298. [Google Scholar] [CrossRef]
  44. Abu Elala, N.M.; Ragaa, N.M. Eubiotic effect of a dietary acidifier (potassium diformate) on the health status of cultured Oreochromis niloticus. J. Adv. Res. 2015, 6, 621–629. [Google Scholar] [CrossRef]
  45. Lin, X.; Zhang, C.; Cao, K.; Li, Z.; Zhao, Z.; Li, X.; Leng, X. Dietary Sodium Butyrate Changed Intestinal Histology and Microbiota of Rainbow Trout (Oncorhynchus mykiss), but Did Not Promote Growth and Nutrient Utilization. Aquac. Nutr. 2023, 2023, 3706109. [Google Scholar]
  46. Vielma, J.; Lall, S. Dietary formic acid enhances apparent digestibility of minerals in rainbow trout, Oncorhynchus mykiss (Walbaum). Aquac. Nutr. 1997, 3, 265–268. [Google Scholar] [CrossRef]
  47. Bröer, S. Amino Acid Transport Across Mammalian Intestinaland Renal Epithelia. Physiol. Rev. 2008, 88, 249–286. [Google Scholar]
  48. Nicholson, J.K.; Holmes, E.; Kinross, J.; Burcelin, R.; Gibson, G.; Jia, W.; Pettersson, S. Host-gut microbiota metabolic interactions. Science 2012, 336, 262–1267. [Google Scholar] [CrossRef]
  49. Abdel-Latif, H.M.R.; Abdel-Tawwab, M.; Khafagac, A.F.; Dawood, M.A.O. Dietary oregano essential oil improved the growth performance via enhancing the intestinal morphometry and hepato-renal functions of common carp (Cyprinus carpio L.) fingerlings. Aquaculture 2020, 526, 735432. [Google Scholar] [CrossRef]
  50. Caballero, M.J.; Obach, A.; Rosenlund, G.; Montero, D.; Gisvold, M.; Izquierdo, M.S. Impact of different dietary lipid sources on growth, lipid digestibility, tissue fatty acid composition and histology of rainbow trout, Oncorhynchus mykiss. Aquaculture 2002, 214, 253–271. [Google Scholar]
  51. Caballero, M.J.; Izquierdo, M.S.; Kjørsvik, E.; Montero, D.; Socorro, J.; Fernández, A.J.; Rosenlund, G. Morphological aspects of intestinal cells from gilthead seabream (Sparus aurata) fed diets containing different lipid sources. Aquaculture 2003, 225, 325–340. [Google Scholar]
  52. Ostaszewska, T.; Dabrowski, K.; Kamaszewski, M.; Grochowski, P.; Verri, T.; Rzepkowska, M.; Wolnicki, J. The effect of plant protein-based diet supplemented with dipeptide or free amino acids on digestive tract morphology and PepT1 and PepT2 expressions in common carp (Cyprinus carpio L.). Comp. Biochem. Physiol. A Mol. Integr. Physiol. 2010, 157, 158–169. [Google Scholar]
  53. Buscaino, G.; Filiciotto, F.; Buffa, G.; Bellante, A.; Di Stefano, V.; Assenza, A.; Fazio, F.; Caola, G.; Mazzola, S. Impact of an acoustic stimulus on the motility and blood parameters of European sea bass (Dicentrarchus labrax L.) and gilthead sea bream (Sparus aurata L.). Mar. Environ. Res. 2010, 69, 136–142. [Google Scholar] [CrossRef] [PubMed]
  54. Fazio, F.; Marafioti, S.; Arfuso, F.; Piccione, G.; Faggio, C. Influence of different salinity on haematological and biochemical parameters of the widely cultured mullet, Mugil cephalus. Mar. Freshw. Behav. Physiol. 2013, 46, 211–218. [Google Scholar] [CrossRef]
  55. Caldwell, S.H.; Oelsner, D.H.; Iezzoni, J.C.; Hespenheide, E.E.; Battle, E.H.; Driscoll, C.J. Cryptogenic cirrhosis: Clinical characterization and risk factors for underlying disease. Hepatology 1999, 29, 664–669. [Google Scholar] [CrossRef] [PubMed]
  56. Ming, J.H.; Ye, J.Y.; Zhang, Y.X. The influence of maggot meal and L-carnitine on growth, immunity, antioxidant indices and disease resistance of black carp (Mylopharyngodon piceus). J. Chin. Cereals Oil Assoc. 2013, 28, 80–86. [Google Scholar]
  57. Wen, Y.H.; Huang, Y.H.; Wang, G.X. Effect of replacement of fish meal with maggot meal on antioxidant indexes, digestive enzyme activities, foregut and hepatopancreas histological structure of Pelteobagrus falvidraco. Feed. Ind. 2015, 36, 29–35. [Google Scholar]
  58. Abd El-Naby, A.S.; Khattaby, A.E.-R.A.; Samir, F.; Awad, S.M.M.; Abdel-Tawwab, M. Stimulatory effect of dietary butyrate on growth, immune response, and resistance of Nile tilapia, Oreochromis niloticus against Aeromonas hydrophila infection. Anim. Feed Sci. Technol. 2019, 254, 114212. [Google Scholar] [CrossRef]
  59. Mirghaed, A.T.; Yarahmadi, P.; Soltani, M.; Paknejad, H.; Hoseini, S.M. Dietary sodium butyrate (Butirex® C4) supplementation modulates intestinal transcriptomic responses and augments disease resistance of rainbow trout (Oncorhynchus mykiss). Fish Shellfish. Immunol. 2019, 92, 621–628. [Google Scholar] [CrossRef] [PubMed]
  60. Vinagre, C.; Madeira, D.; Narciso, L.; Cabral, H.N.; Diniz, M. Effect of temperature on oxidative stress in fish: Lipid peroxidation and catalase activity in the muscle of juvenile seabass, Dicentrarchus labrax. Ecol. Indic. 2012, 23, 274–279. [Google Scholar]
  61. Slaninova, A.; Smutna, M.; Modar, H.; Svobodova, Z. A review: Oxidative stress in fish induced by pesticides. Neuroendocrinol. Lett. 2009, 30, 2–12. [Google Scholar]
  62. Birnie-Gauvin, K.; Costantini, D.; Cooke, S.J.; Willmore, W.G. A comparative and evolutionary approach to oxidative stress in fish: A review. Fish Fish. 2017, 18, 928–942. [Google Scholar] [CrossRef]
  63. Ibrahim, R.E.; El-Houseiny, W.; Behairy, A.; Abo-Elmaaty, A.; Al-Sagheer, A.A. The palliative role of Eruca sativa leaves dietary supplementation against oxidative stress, immunosuppression, and growth retardation in temperature-stressed Oreochromis niloticus. J. Therm. Biol. 2019, 84, 26–35. [Google Scholar] [CrossRef]
  64. Hoseinifar, S.H.; Sun, Y.Z.; Caipang, C.M. Short-chain fatty acids as feed supplements for sustainable aquaculture: An updated view. Aquac. Res. 2017, 48, 1380–1391. [Google Scholar] [CrossRef]
  65. Dawood, M.A.O.; Eweedah, N.M.; Elbialy, Z.I.; Abdelhamid, A.I. Dietary sodium butyrate ameliorated the blood stress biomarkers, heat shock proteins, and immune response of Nile tilapia (Oreochromis niloticus) exposed to heat stress. J. Therm. Biol. 2020, 88, 102500. [Google Scholar] [CrossRef] [PubMed]
  66. Fang, L.; Wang, Q.; Guo, X.; Pan, X.; Li, X. Effects of dietary sodium butyrate on growth performance, antioxidant capacity, intestinal histomorphology and immune response in juvenile Pengze crucian carp (Carassius auratus Pengze). Aquac. Rep. 2021, 21, 100828. [Google Scholar] [CrossRef]
Figure 1. Histological sections of the intestinal tracts from the jade perch, S. barcoo, in the fish meal group (FM) showing overall normal intestinal villi length. The villi length of the jade perch in the fish meal supplemented with 1% sodium butyrate (FMB) group was longer. Meanwhile, the intestinal villi length was shorter when the black soldier fly meal protein increased (FBM and BM). The FBM and BM supplemented with 1% sodium butyrate (FBMB and BMB) groups showed increased intestinal villi length. a,b,c,d Means in the same column with different letters significantly differ at p < 0.05. Each parameter represents the mean of three samples (n = 3) with three fish pooled in each sample. Scale bar = 500 μm.
Fishes 08 00437 g001
Figure 2. Comparative photomicrographs (H&E staining) of the intestinal tissues of jade perch, S. barcoo, fed on experimental diets for 56 days. Tissues from all groups showed normal histologic structures of intestinal villi and goblet cells (scale bar = 100 μm). GC: goblet cells.
Fishes 08 00437 g002
Table 1. Composition of experimental diets for jade perch, S. barcoo.
TreatmentsFMFMBFBMFBMBBMBMB
Fish meal5050252500
BSF 5 meal0026.426.452.852.8
Oil 46.066.063.923.921.781.78
Yeast111111
α-starch101010101010
Vitamin mix 1222222
Mineral mix 2222222
α-Cellulose28.9427.9429.6828.6830.4229.42
Butyric acid010101
Analyzed composition (as fed) 3
Moisture10.729.5810.198.659.189.77
Crude protein31.5831.4231.3831.2931.6631.13
Crude lipid8.518.808.808.028.078.29
Ash15.7716.5311.3711.766.917.45
Crude fiber26.4225.7628.2228.6529.5228.64
1 Thiamin HCl, 0.5%; riboflavin, 0.8%; niacinamide, 2.6%; D-biotin, 0.1%; Ca-pantothenate, 1.5%; pyridoxine HCl, 0.3%; folic acid, 0.5%; inositol, 18.1%; ascorbic acid, 12.1%; cyanobalamin, 0.1%; para-aminobenzoic acid, 3%; BHT, 0.1%; cellulose, 60.3%. 2 Iron, 1.3%; 0.1% copper; 0.8% zinc; 0.2% manganese; 0.5% magnesium; 0.02% cobalt; 0.05% iodine; 0.005% selenium; 0.8% thiamin HCl; 0.5% riboflavin; 3.5% niacinamide; 0.1% D-biotin; 0.15% Ca pantothenate; 0.8% pyridoxine HCl; 0.2% folic acid; 8.5%; inositol; 12.0% ascorbic acid; 0.15% cyanocobalamin; 0.1% ethoxyquin; 73.2% α-cellulose. 3 Expressed as a percent of dry weight. 4 Fish oil: soybean oil = (2:1 v/v). 5 BSF meal: black solider fly meal. FM: fish meal (Peru), FMS: fish meal+ 1% sodium butyrate (Sigma-Aldrich, St. Louis, MO 68178, USA), FBM: 50% fish meal + 50% black soldier fly meal (Kunyi Biotech Inc., Chiayi city, Taiwan), FBMB: 50% fish meal + 50% black soldier fly + 1% sodium butyrate, BM: black soldier fly, and BMB: black soldier fly + 1% sodium butyrate.
Table 2. Major fatty acid (% total fatty acids) and essential amino acid (g/100 g total protein) composition of experimental diets.
Fatty AcidsFM/FMBFBM/FBMBBM/BMB
12:03.966.679.38
14:05.562.872.18
14:10.010.010.01
16:022.6617.7112.75
16:10.460.400.34
18:05.724.222.73
18:10.237.9615.69
18:2 n-621.5728.2034.82
18:3 n-32.313.122.93
20:00.170.180.19
20:10.150.190.23
20:2 n-60.390.310.23
20:3 n-61.220.940.66
20:3 n-31.561.932.30
20:4 n-614.4611.356.25
20:5 n-30.740.430.11
22:00.232.193.14
22:10.900.730.56
22:5 n-35.203.101.01
22:6 n-312.507.504.50
SFAs38.2933.8430.37
MUFAs1.769.2916.83
PUFAs27.0534.540.94
HUFAs32.9022.3811.87
Amino acids
Arginine2.201.560.99
Histidine0.770.660.54
Isoleucine1.581.090.60
Leucine2.441.700.95
Lysine2.671.670.66
Methionine0.860.951.04
Phenylalanine1.340.980.61
Threonine1.370.940.50
Valine1.701.250.79
Tryptophan0.340.390.43
Sum of EAA15.2711.197.11
Table 3. Initial weight (g), final weight (g), weight gain percentage (WG, %), protein efficiency ratio (PER, %), feed conversion ratio (FCR), Feed intake (FI, g/fish), and survival (%) of jade perch, S. barcoo, fed experimental diets for 56 days.
Treatments
Initial WeightFinal WeightWGFCRPERFISurvival
FM7.3 ± 0.152.3 ± 2.8 b616.4 ± 47.9 b1.7 ± 0.1 cd1.8 ± 0.1 b77.7 ± 5.6 ab100
FMB7.3 ± 0.166.2 ± 5.2 a806.5 ± 60.9 a1.3 ± 0.2 d2.5 ± 0.4 a77.5 ± 17.7 ab100
FBM7.3 ± 0.233.6 ± 3.0 c359.9 ± 42.3 c2.3 ± 0.3 ab1.3 ± 0.2 c62.4 ± 3.2 bc100
FBMB7.3 ± 0.149.9 ± 5.1 b580.1 ± 64.2 b2.0 ± 0.3 bc1.7 ± 0.2 bc83.0 ± 5.2 a100
BM7.3 ± 0.132.1 ± 2.7 c339.3 ± 32.1 c2.7 ± 0.7 a1.2 ± 0.3 c66.4 ± 9.7 abc100
BMB7.3 ± 0.133.7 ± 2.7 c359.2 ± 37.0 c2.2 ± 0.2 abc1.5 ± 0.1 bc58.6 ± 7.5 c100
Mean values and standard error (mean ± S.E., n = 3) are presented for each parameter. a,b,c,d Means in the same rows with different letters significantly differ at p < 0.05.
Table 4. Red blood cell count (RBC, 106/µL), hemoglobin concentration (HGB, g/dL), hematocrit (Hct, %), mean corpuscular volume (MCV, fL), mean corpuscular hemoglobin (MCH, pg), and mean corpuscular hemoglobin concentration (MCHC, g/dL) values of jade perch, S. barcoo, for 56 days.
Treatments
RBCHGBHctMCVMCHMCHC
FM2.2 ± 0.2 b7.7 ± 0.2 c29.2 ± 0.9 b36.1 ± 1. 7 a136.9 ± 11.7 a26.4 ± 1.1 c
FMB3.1 ± 0.2 a9.4 ± 0.2 a32.5 ± 1.2 a30.3 ± 3.0 b105.3 ± 11.6 b28.8 ± 1.2 ab
FBM2.2 ± 0.1 b7.5 ± 0.4 c25.0 ± 1.5 c34.8 ± 3.4 a116.0 ± 7.5 b29.9 ± 1.7 a
FBMB3.1 ± 0.1 a8.6 ± 0.2 b31.2 ± 1.0 ab27.9 ± 09 b101.2 ± 5.2 b27.6 ± 0.9 abc
BM2.1 ± 0.1 b7.2 ± 0.2 c24.6 ± 1.2 c34.3 ± 0.8 a116.5 ± 4.0 b29.4 ± 0.7 a
BMB3.0 ± 0.1 a8.3 ± 0.3 b30.8 ± 0.6 ab28.1 ± 1.5 b104.3 ± 5.1 b27.0 ± 1.5 bc
Mean values and standard error (mean ± S.E., each parameter represents the mean of three samples (n = 3) with three fish pooled in each sample). a,b,c Means in the same rows with the different letters are significantly different (p < 0.05).
Table 5. Muscle composition (%) of jade perch, S. barcoo, fed experimental diets for 56 days.
Treatments
MoistureCrude ProteinCrude LipidsAsh
FM77.7 ± 0.1 a86.3 ± 0.2 b15.7 ± 0.1 a4.4 ± 0.2
FMB77.7 ± 0.1 ab88.4 ± 0.2 a14.2 ± 0.1 b4.4 ± 0.4
FBM778 ± 0.1 a85.0 ± 0.5 c14.1 ± 0.7 b4.4 ± 0.5
FBMB77.7 ± 0.1 ab86.3 ± 0.2 b13.6 ± 0.1 bc4.4 ± 0.1
BM77.7 ± 0.1 ab84.1 ± 0.4 d13.5 ± 0.2 c4.5 ± 0.1
BMB77.6 ± 0.1 b85.5 ± 0.1 c13.2 ± 0.1 c4.4 ± 0.2
Mean values and standard error (mean ± S.E., n = 3) are presented for each parameter. a,b,c Means in the same rows with different letters significantly differ at p < 0.05.
Table 6. Superoxide dismutase (SOD, U/mg protein), catalase (CAT, U/mg protein), and glutathione peroxidase (GPx, U mg/protein), malondialdehyde (MDA, μmole/g tissue), alanine aminotransferase (ALT, IU/L), and aspartate aminotransferase (AST, IU/L) of liver of jade perch, S. barcoo, fed experimental diets for 56 days.
Treatments
SODCATGPXALTASTMDA
FM10.4 ± 0.5 c9.3 ± 0.6 c11.0 ± 0.5 c19.8 ± 0.3 b20.8 ± 0.6 b1.2 ± 0.1 d
FMB14.5 ± 0.7 a13.8 ± 0.6 a16.2 ± 0.3 a27.2 ± 0.8 a28.5 ± 0.1 a1.0 ± 0.1 e
FBM9.4 ± 1.0 cd8.4 ± 1.2 cd10.0 ± 0.6 d19.8 ± 0.3 b20.7 ± 1.1 b1.3 ± 0.1 c
FBMB11.9 ± 0.7 b11.1 ± 0.6 b14.2 ± 0.3 b27.3 ± 1.1 a28.5 ± 0.1 a1.3 ± 0.2 c
BM8.2 ± 0.7 d7.5 ± 0.5 d8.8 ± 0.2 e19.9 ± 0.3 b20.7 ± 1.8 b1.6 ± 0.1 a
BMB10.1 ± 0.3 c9.0 ± 0.9 c11.3 ± 0.8 c26.8 ± 2.4 a28.6 ± 1.2 a1.5 ± 0.1 b
Mean values and standard error (mean ± S.E., each parameter represents the mean of three samples (n = 3) with three fish pooled in each sample). a,b,c,d,e Means in the same rows with different letters significantly differ at p < 0.05.
Disclaimer/Publisher’s Note: The statements, opinions and data contained in all publications are solely those of the individual author(s) and contributor(s) and not of MDPI and/or the editor(s). MDPI and/or the editor(s) disclaim responsibility for any injury to people or property resulting from any ideas, methods, instructions or products referred to in the content.

