Article

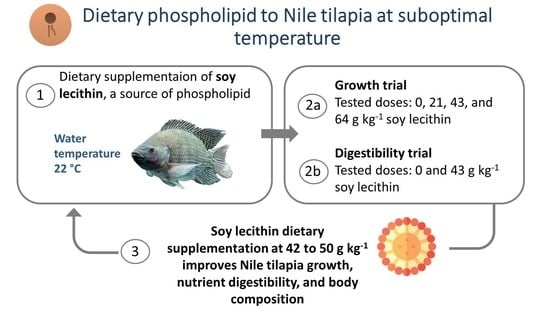
Soy Lecithin Supplementation Promotes Growth and Increases Lipid Digestibility in GIFT Nile Tilapia Raised at Suboptimal Temperature

by
Rosana Oliveira Batista
1,
Bianca Leticia Richter
1,
Jorge Filipe Banze
1,
Delano Dias Schleder
2,
Maria Salhi
3,
Renata Oselame Nobrega
1,
Maria Fernanda Oliveira da Silva
1,
Bruna Mattioni
4,
James Eugene Pettigrew
5 and
Débora Machado Fracalossi
1,*
1
Department of Aquaculture, Federal University of Santa Catarina, Florianópolis 88034-001, SC, Brazil
2
Department of Veterinary Medicine, Instituto Federal Catarinense, Campus Araquari, Araquari 89245-000, SC, Brazil
3
Natural Resources Laboratory, Institute of Ecology and Environmental Sciences, Faculty of Sciences, University of the Republic, Montevideo 11400, Uruguay
4
Carl and Melinda Helwig Department of Biological and Agricultural Engineering, Kansas State University, Manhattan, KS 66502, USA
5
Pettigrew Research Services, Tubac, AZ 85646, USA
*
Author to whom correspondence should be addressed.
Fishes 2023, 8(8), 404; https://doi.org/10.3390/fishes8080404
Submission received: 20 June 2023 / Revised: 24 July 2023 / Accepted: 25 July 2023 / Published: 3 August 2023

Abstract

:
Soy lecithin (SL) is a source of phospholipids, which play a crucial role in determining cell membrane structure, fluidity, and functionality. This study investigated the effects of dietary SL on the performance, nutrient digestibility, and body composition of Nile tilapia juveniles (average initial weight 12.2 g) raised at 22 °C. The experimental diets contained increasing levels of SL (0.0, 21.0, 43.0, and 64.0 g kg−1). The best weight gain and feed efficiency occurred with 42.2 and 49.8 g kg−1 of SL inclusion, respectively, estimated through quadratic regression after 90 days of feeding. The body composition of the fish was also affected by feeding with SL, with a decrease in total body lipids and viscerosomatic and hepatosomatic indices but an increase in polyunsaturated fatty acids. A digestibility trial using only two diets (0SLD and 43SLD) revealed increased lipid and fatty acids digestibility in fish fed with 43SLD. In addition, the consumption of digestible nutrients was the highest in fish fed the diet 43SL. Therefore, SL supplementation is beneficial in fall/spring diets for Nile tilapia juveniles as it can improve growth, lipid digestibility, and body composition when supplemented within the range of 42 to 50 g kg−1 diet.
Key Contribution: Soy-derived phospholipids are paramount in improving Nile tilapia growth at suboptimal temperatures besides offering a potentially practical approach for new ingredients in aquafeeds. Dietary supplementation of soy lecithin improves nutrient digestibility, resulting in the highest performance in terms of growth and body composition. Therefore, we recommend including 42 to 50 g kg−1 soy lecithin to improve growth and to decrease body lipid accumulation.

Graphical Abstract

1. Introduction

Nile tilapia (Oreochromis niloticus) is the third most farmed fish species worldwide [1]. It is a tropical species with optimal growth temperatures ranging from 26 to 30 °C [2]; however, tilapia farming activity has substantially grown in subtropical areas worldwide. These areas exhibit wide temperature variations between summer and winter [3]. In Brazil, the fourth largest tilapia producer worldwide [1], Nile tilapia farming largely occurs in the subtropical regions, where the water temperature varies from 12 to 25 °C in the fall, winter, and spring [3,4]. Because of the severe drop in water temperature during the winter months, mass mortalities of fish have been recorded, leading to significant economic losses [5,6,7].
Fish are ectothermic organisms, meaning they do not maintain a constant body temperature, and therefore undergo several metabolic changes when subject to suboptimal low temperatures. Cold stress can cause a decline in the immune response of fish, and decrease metabolic rate and growth [8], which can lead to mortality or a variety of sub-lethal consequences that will affect growth performance [9].
In fish, lipid metabolism is particularly affected by suboptimal temperatures [10]. Variations in the fatty acid content of phospholipids in the cell membrane are particularly important during adaptation to temperature changes. Generally, there is an increase in the proportion of polyunsaturated fatty acids (PUFA) and monounsaturated fatty acids (MUFA) in addition to a reduction in saturated fatty acids (SFA) in membrane phospholipids with decreasing environmental temperatures [11,12]. The increase in PUFA maintains the liquid crystal state of the lipid matrix by counteracting cold-induced solidification of the lipid bilayers [13,14].
Nutrient digestibility can also be affected in fish raised at suboptimal temperatures. Previous studies have shown that the digestibility of proteins, lipids, and SFAs was 20% lower when Nile tilapia were raised at 22 °C [15] compared to 28 °C [16]. In both studies, diets had similar compositions and were supplemented with increasing levels of Aurantiochytrium sp. meal, a docosahexaenoic acid (DHA, 22:6 n-3)-producing heterotrophic microorganism. Likewise, for carnivorous marine fish, such as Atlantic salmon (Salmo salar) and Arctic charr (Salvelinus alpinus), low water temperatures decreased SFA digestibility, whereas MUFA and PUFA digestibility were less affected [17,18].
One strategy to help fish cope with low suboptimal temperatures in aquaculture systems is to provide an optimal diet to meet their metabolic needs under such conditions. Due to the main changes in the lipid metabolism in suboptimal temperatures, dietary lipid modulation is of paramount importance when designing such diets [3,19]. Previous studies [15,20] have shown that diets containing PUFA, mostly from the n-3 series, improved the growth and feed efficiency of Nile tilapia reared at suboptimal temperatures. Other studies have reported that thermal tolerance and survival were improved in Nile tilapia fed diets supplemented with n-3 PUFA [13,21].
Dietary lipid modulation in Nile tilapia raised at suboptimal temperatures was previously investigated by adding different lipid sources [20], a mixture of vegetable oils [22], or feed additives [15,23], where fatty acids were present in the form of triacylglycerols (neutral lipids). Phospholipids are polar lipids and may be superior to neutral lipids as a source of fatty acids because of their superior digestibility [24]. Dietary inclusion of phospholipids has been shown to improve lipid emulsification and facilitate digestion by improving intestinal absorption of long-chain fatty acids, because as amphipathic molecules they are capable of forming micelles more easily than triacylglycerols [24]. Phospholipids are interesting candidates for inclusion in winter diets for fish because of their important biological functions and role in adaptation to low temperatures.
Currently, soy lecithin is the primary phospholipid source in fish and crustacean feeds. Owing to the large volumes of soybeans produced globally, soy lecithin is a readily available form of phospholipids for fish diets [25]. Phospholipid content and composition in soy lecithin are variable but usually fall in the range of 50 to 60% of total phospholipids containing 13 to 18% phosphatidylcholine, 10 to 15% phosphatidylethanolamine, 10 to 15% phosphatidylinositol, and 5 to 12% phosphatidic acid [25]. The most abundant fatty acid in soy lecithin is linoleic acid (18:2 n-6, LOA), representing approximately 52 to 60% of the total fatty acid content [26].
Despite the important role of phospholipids in fish adaptation to low temperatures, no studies have yet investigated the inclusion of phospholipid sources, such as soy lecithin, under suboptimal temperature conditions. Thus, considering the worldwide distribution of tilapia farming, which includes subtropical climate regions, our study aimed to evaluate the dietary inclusion of soy lecithin as a source of phospholipids on growth performance, digestibility, and body composition of Nile tilapia raised at 22 °C.

2. Materials and Methods

2.1. Experimental Design and Diets

We ran a growth trial and a digestibility trial. In the growth trial, four experimental diets were formulated with practical ingredients to meet the nutritional requirements of Nile tilapia [27,28]. All diets were isonitrogenous and contained increasing levels of soy lecithin (0.0, 21.0, 43.0, and 64.0 g kg−1; named 0SL, 21SL, 43SL, and 64SL, respectively). Experimental diets for the growth and digestibility trials are presented in Table 1 and Table 2, respectively.
When formulating the experimental diets, only the phospholipid composition of soy lecithin, the primary source of phospholipids, was considered. However, the diet without soy lecithin also contained phospholipids (see total polar lipid content in Table 1) due to the contributions from poultry by-product meal and soybean meal, which were included at identical levels in all diets.
Soy lecithin included in the diets was de-oiled. This type of lecithin was obtained by degumming with water, drying, and treating with hydrogen peroxide, which transforms it into a powder. As advantages, the manufacturer highlights the low amount of neutral lipids (approximately 2% triacylglycerol), making it easy to mix with other powdered products, as well as the absence of flavor [25]. Corn oil was used as a source of lipids in the experimental diets, mainly in the control diet (without lecithin), and replaced as soy lecithin was included. In the 64SL diet, corn oil was not used because only the inclusion of soy lecithin already met the requirement for lipids and fatty acids of the species. The inclusion of soy lecithin influenced the total lipid and polar lipid contents of the diets: the higher the soy lecithin inclusion, the higher the lipid and polar lipid contents (Table 1).
Before diet preparation, all ingredients were analyzed to determine their proximate composition, fatty acid profile, and energy content. Fatty acid profiles of the experimental diets were determined at the beginning and end of the feeding trial to ensure that there were no losses due to oxidation during the experimental period. These procedures are detailed in Section 2.5.
The preparation of the ingredients for manufacturing the diets and the extrusion conditions were previously described by Nobrega and coworkers [15], except for minor modifications in the extrusion temperature. Temperature was reduced to 75 °C when processing diets with low inclusion levels of soy lecithin (0.0, 21.0, and 43.0 g kg−1) and further reduced to 60 °C when processing the diet with a higher level of inclusion of soy lecithin (64.0 g kg−1) to allow the diet granules to float. After extruding the diets, the obtained pellets were 1.5 to 2.0 mm in length. These were dried in an oven with forced air circulation at 50 °C for 4 h and stored in sealed containers, protected from light, and kept in a dry environment at 4 °C to avoid oxidation of the fatty acids until use.

2.2. Experimental Procedures

Nile tilapia juveniles of the genetically improved farmed tilapia (GIFT)—Epagri SC03 strain, sexually inverted to be male, were obtained from the Empresa de Pesquisa Agropecuária e Extensão Rural de Santa Catarina (Epagri, Itajaí, Brazil). Fish management followed a protocol (# 3641231120) approved by the Ethics Committee of Animal Use of the Universidade Federal de Santa Catarina (CEUA, UFSC).
Fish were initially acclimatized to laboratory conditions in 1000 L tanks connected to a freshwater recirculation system (RAS), with a water temperature of 28 °C, for two weeks. Subsequently, groups of 25 fish were distributed in 24 tanks of 100 L (each tank was considered as an experimental unit). The fish were acclimated to the experimental units at 28 °C for one week. In the second week, the water temperature was gradually reduced from 28 to 22 °C (1 °C per day) and, from the third week of acclimatization, the water temperature was maintained at 22 °C, i.e., the object of study. During acclimation in the 1000 L tanks, the fish were fed a commercial diet for fingerlings containing 40% protein and 8% lipid, three times a day to apparent satiation. During acclimatization to the 100 L tanks, the fish were fed the experiment’s control diet, without the inclusion of soy lecithin (0SL), twice a day until apparent satiation.
The initial weight of the fish at the end of the acclimatization period was 12.22 ± 0.09 g, mean weight ± standard error. During the experimental period (90 days, January to April 2021), fish were fed their respective experimental diets twice a day (10:00 and 18:00 h) to apparent satiation. The diets were randomly distributed to the experimental units, resulting in four dietary treatments with six replicates per treatment.
Feed intake, mortality rates, water temperature, and dissolved oxygen were recorded daily while all other water quality parameters were measured weekly. The average water quality values (±standard deviation) were as follows: temperature, 22.03 ± 0.48 °C; dissolved oxygen, 7.40 ± 0.53 mg L−1; pH, 7.54 ± 0.10; salinity, 0.92 ± 0.08 g L−1; alkalinity, 40.98 ± 7.15 CaCO3 mg L−1; total ammonia, 0.13 ± 0.10 mg L−1; nitrate, 0.01 ± 0.01 mg L−1. The inlet water flow rate in each tank was 25 mL s−1. All water quality parameters, apart from water temperature, were in accordance with the recommended levels for Nile tilapia farming [29].

2.3. Fish Biometrics and Sample Collection

At the beginning and end of the feeding trial, the fish were individually weighed (0.01 g precision). Before these measurements, all fish were fasted for 24 h and anesthetized with 100 mg L−1 Eugenol® (Biodinâmica Química e Farmacêutica Ltd., Ibiporã, Brazil). The following variables were calculated from fish biometrics and feed intake data: weight gain (WG, g = final weight − initial weight), daily WG (DWG, g day−1 = weight gain × day−1), specific growth rate (SGR, % day−1 = ({ln final weight − ln initial weight} × days−1) × 100), feed efficiency (FE = (weight gain) × (total feed intake)−1), daily feed intake (DFI, % live weight day−1 = 100 × (feed intake × days−1) × ({final weight + initial weight} × 2−1)−1), and apparent net protein retention (ANPR, % = 100 × (final body protein − initial body protein) × (protein intake)−1).
Thirty fish were collected, grouped, and analyzed in triplicate for determination of the initial whole-body proximal and fatty acid compositions, whereas the same measurements were made in three fish per experimental unit at the end of the trial. More fish were needed to reach the sample size for fillet proximal and fatty acid compositions. Thus, fillets of a group of 40 fish as well as five fish per experimental unit were collected for the initial and final compositions, respectively.
Prior to sampling, fish were fasted for 24 h and euthanized via an overdose (200 mg L−1) of the anesthetic Eugenol®, followed by sectioning of the spine. The collected samples were lyophilized, homogenized, and stored at −20 °C until analysis.

2.4. Digestibility Trial

A digestibility trial was carried out with Nile tilapia at 22 °C to evaluate the apparent digestibility coefficients (ADC) of selected nutrients in similar diets to the 0SL and 43SL diets used in the previously described dose–response feeding trial. The 43SL diet was selected because it promoted the greatest weight gain. Digestibility diets were then named 0SLD and 43SLD because they also included yttrium oxide as an inert marker replacing broken rice (Table 2). The digestibility of dry matter, crude protein, crude fat, polar lipids, and fatty acids was evaluated.
The same fish used in the dose-response trial were subsequently grouped in 1000 L tanks and fed a practical diet without lecithin inclusion for five weeks at 22 °C. Fish were then transferred into six 200 L cylinder-conical tanks (two diets × three replicates), connected to the same RAS at 22 °C. Each tank was stocked with 12 fish (mean weight 159.33 ± 1.02 g) that were fed the experimental diets for two weeks. After this period, feces were collected for 32 days. The 200 L tanks were equipped with a 50 mL tube at the bottom for the collection of settled feces. These tubes were immersed in isothermal containers with ice to prevent the microbial degradation of feces. The tubes and ice were changed every 3 h. Removed tubes were centrifuged for 5 min at 1077× g and fecal (precipitate) samples were stored at −20 °C prior to lyophilization. These procedures have been previously described by Rodrigues et al. [30].
Fish were fed twice daily (10:00 and 17:00 h) until apparent satiation. One hour after each feeding, the tank walls were carefully cleaned and approximately 70% of the water in each tank was renewed. This procedure was performed to avoid the contamination of feces with feed, remove any regurgitated feed, and remove any bacterial biofilm from the tank walls. The fecal collection periods occurred after cleaning the tanks. Fecal samples were collected daily between 18:00 h to 21:00 h and from 21:00 h to 00:00 h, with two collections per period. The time of collection was chosen because more feces were evacuated at night. At the end of each collection period, fecal samples were lyophilized, homogenized, and stored at −20 °C until further analyses.
The apparent digestibility coefficient (ADC) was calculated using the following equation (NRC 2011):
ADC ,   % = 100 100 × Marker   Diet Marker   Feces × Nutrient   Feces Nutrient   Diet
The average values of water quality indicators (average ± standard deviation) were as follows: temperature, 22.04 ± 0.91 °C; dissolved oxygen, 7.58 ± 0.36 mg L−1; pH, 7.22 ± 0.40; salinity, 1.47 ± 0.33 g L−1; alkalinity, 55.55 ± 8.81; CaCO3 mg L−1; total ammonia, 0.06 ± 0.05 mg L−1; nitrite, 0.09 ± 0.01 mg L−1; nitrate, 0.00 ± 0.00 mg L−1. The inlet water flow in each tank was 50 mL s−1. As reported for the dose–response feeding trial, water quality parameters, except for the water temperature, were in accordance with the recommended levels for Nile tilapia farming.
Using the ADC, we calculated the digestible intake of nutrients and energy (DIN) in fish fed the 0SL and 43SL diets using the consumption data from the growth trial. The digestible nutrient intake was calculated using the following equation:
DIN ,   g   = Nutrient   composition   in   feed   ×   ADC 100 × Total   fish   intake 1 100  

2.5. Chemical Analyses

The analysis of proximal composition followed procedures standardized by the Association of Official Analytical Chemists [31]. Moisture content was measured by drying at 105 °C to a constant weight (method 950.01), crude protein was determined with Leco FP-528 LC equipment using the Dumas method (method 990.03), and mineral matter was determined following incineration at 550 °C (method 942.05). Crude energy was determined using a calorimeter (PARR, model ASSY 6200) according to the manufacturer’s instructions. Lipid analyses of the ingredient, body, and fillet samples were performed using the Soxhlet method (method 920.39C). To quantify the polar lipids of the ingredients, diets, and feces, total lipids in the samples were measured by the method described by Folch et al. [32], and the polar and neutral lipids were separated by solid-phase extraction (SPE) using an SPE column (Sep-Pak Silica) according to the methods described by Juaneda and Rocquelin [33].
Fatty acid measurements in the ingredients, diets, bodies, and feces were performed using gas chromatography. Sample lipids were cold extracted and quantified using the methods described by Bligh and Dyer [34]. Fatty acids were then esterified using the method described by O’Fallon et al. [35] and separated using a gas chromatograph (7890 B; Agilent, Santa Clara, CA, USA) with an FID detector and a CP-Sil 88 capillary column (60 m, 0.25 mm, 0.20 µm, 7-inch in cage; Agilent, Santa Clara, CA, USA). The chromatographic conditions were the same as used by Nobrega and coworkers [15].
For yttrium quantification, samples were digested with nitric acid at 180 °C for 48 h and then analyzed by inductively coupled plasma-optical emission spectrometry.

2.6. Statistical Analysis

The experiment was conducted using a completely randomized design. Data were compared using the Levene test to verify homoscedasticity and the Shapiro–Wilk test to evaluate normality. Quadratic regression analyses were used to evaluate the effect of increasing levels of dietary soy lecithin on growth performance, body proximal composition, body indices, and fatty acid composition variables. The ADC and digestible intake of energy, dry matter, protein, lipids, polar lipids, and fatty acids data, resulting from the digestibility trial, were subjected to the Student’s t-test. For all statistical analyses, Statistica 13.0 software (Statsoft Inc. Tulsa, OK, USA) was used and a significance level of 5% was adopted. Statistical graphs were made using software GraphPad Prism version 8.0.1.

3. Results

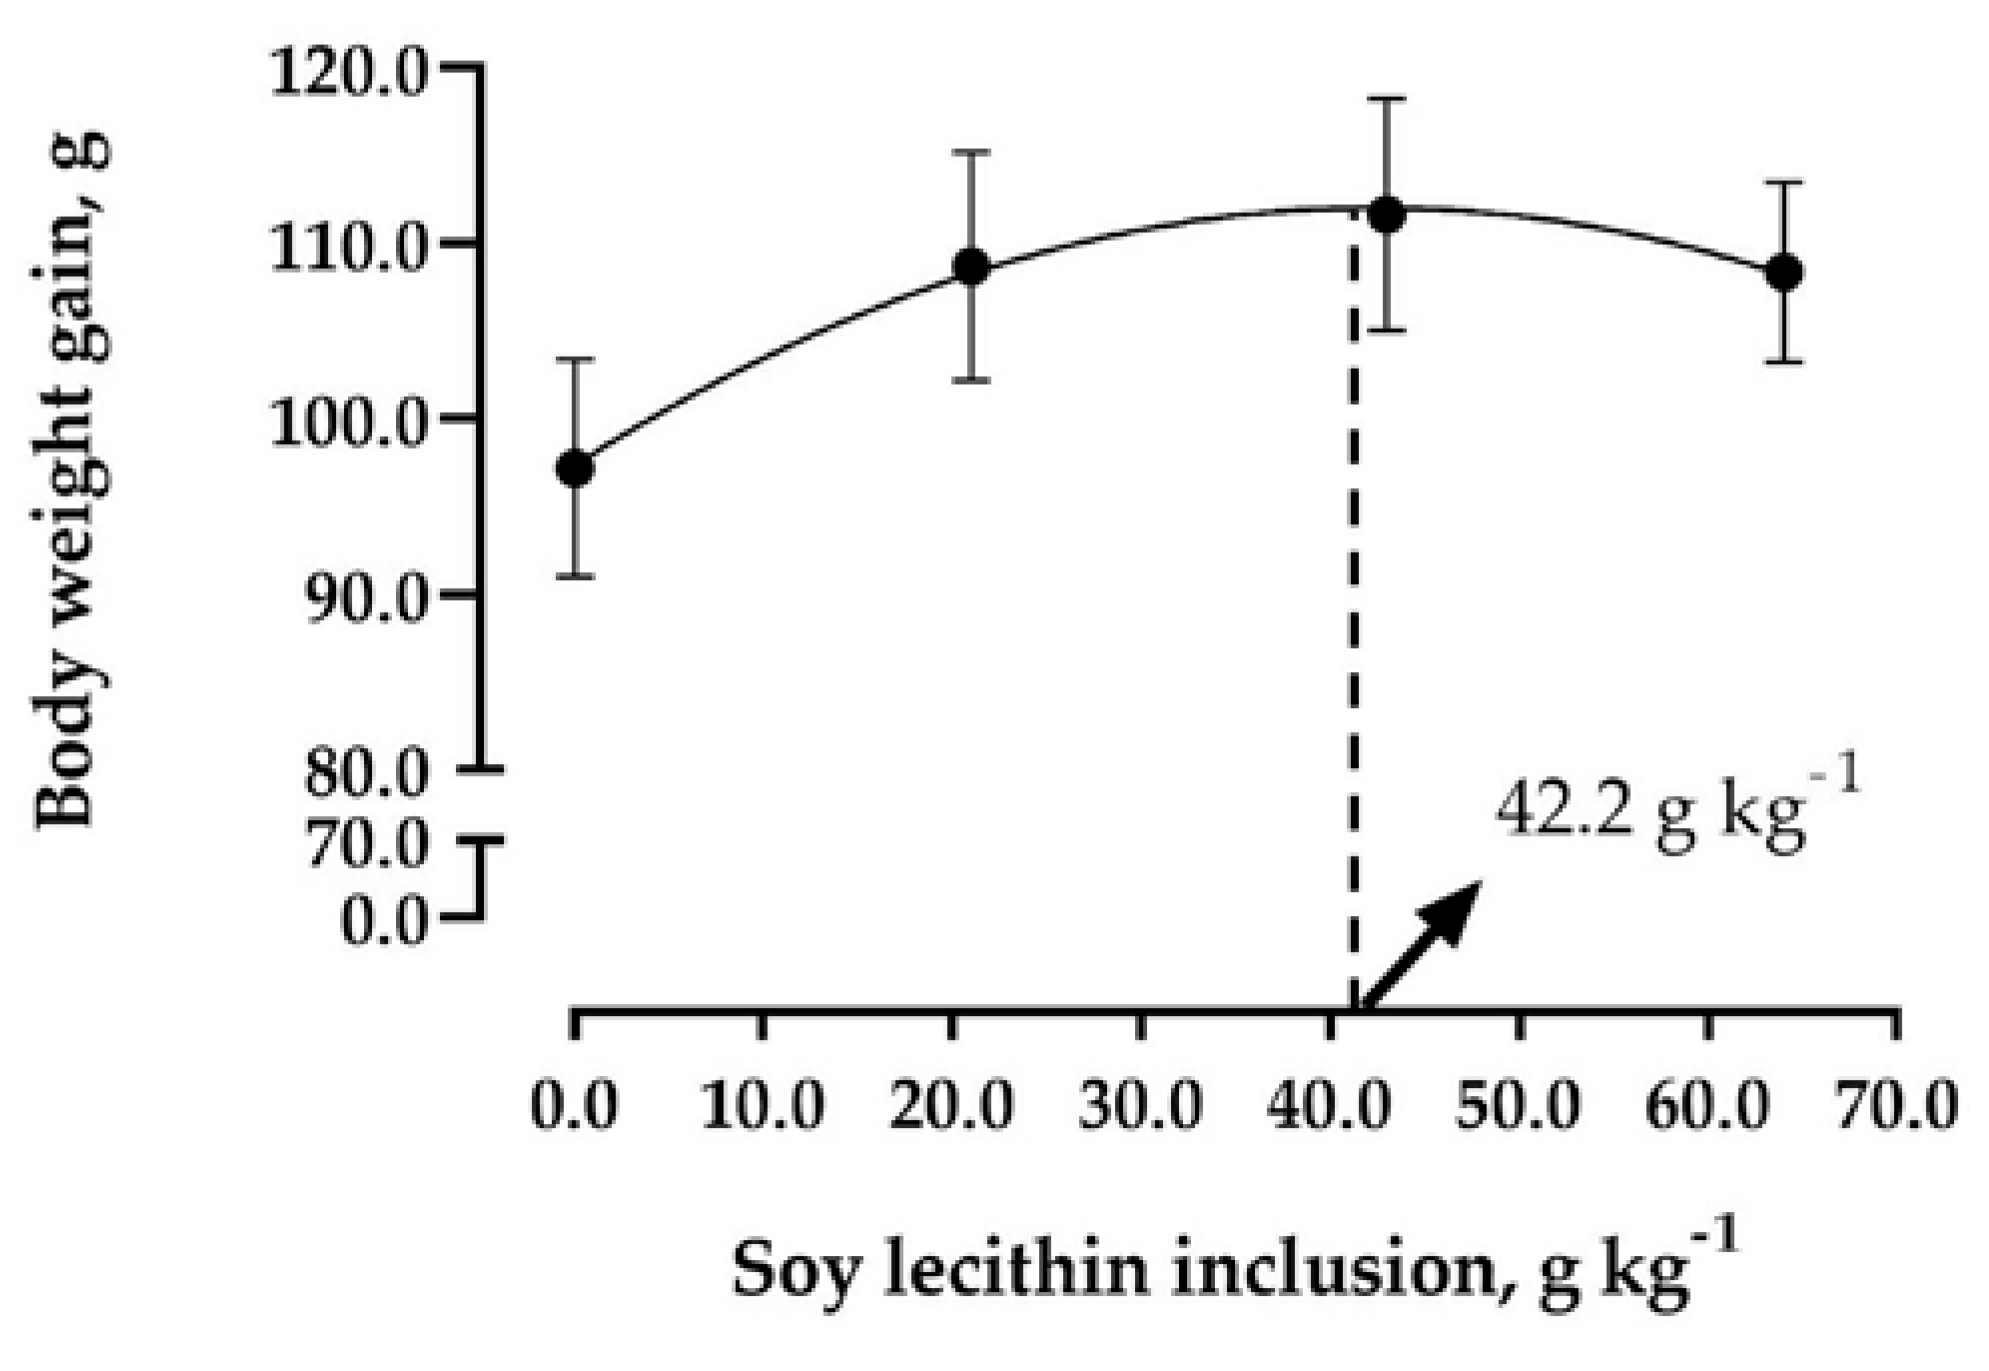
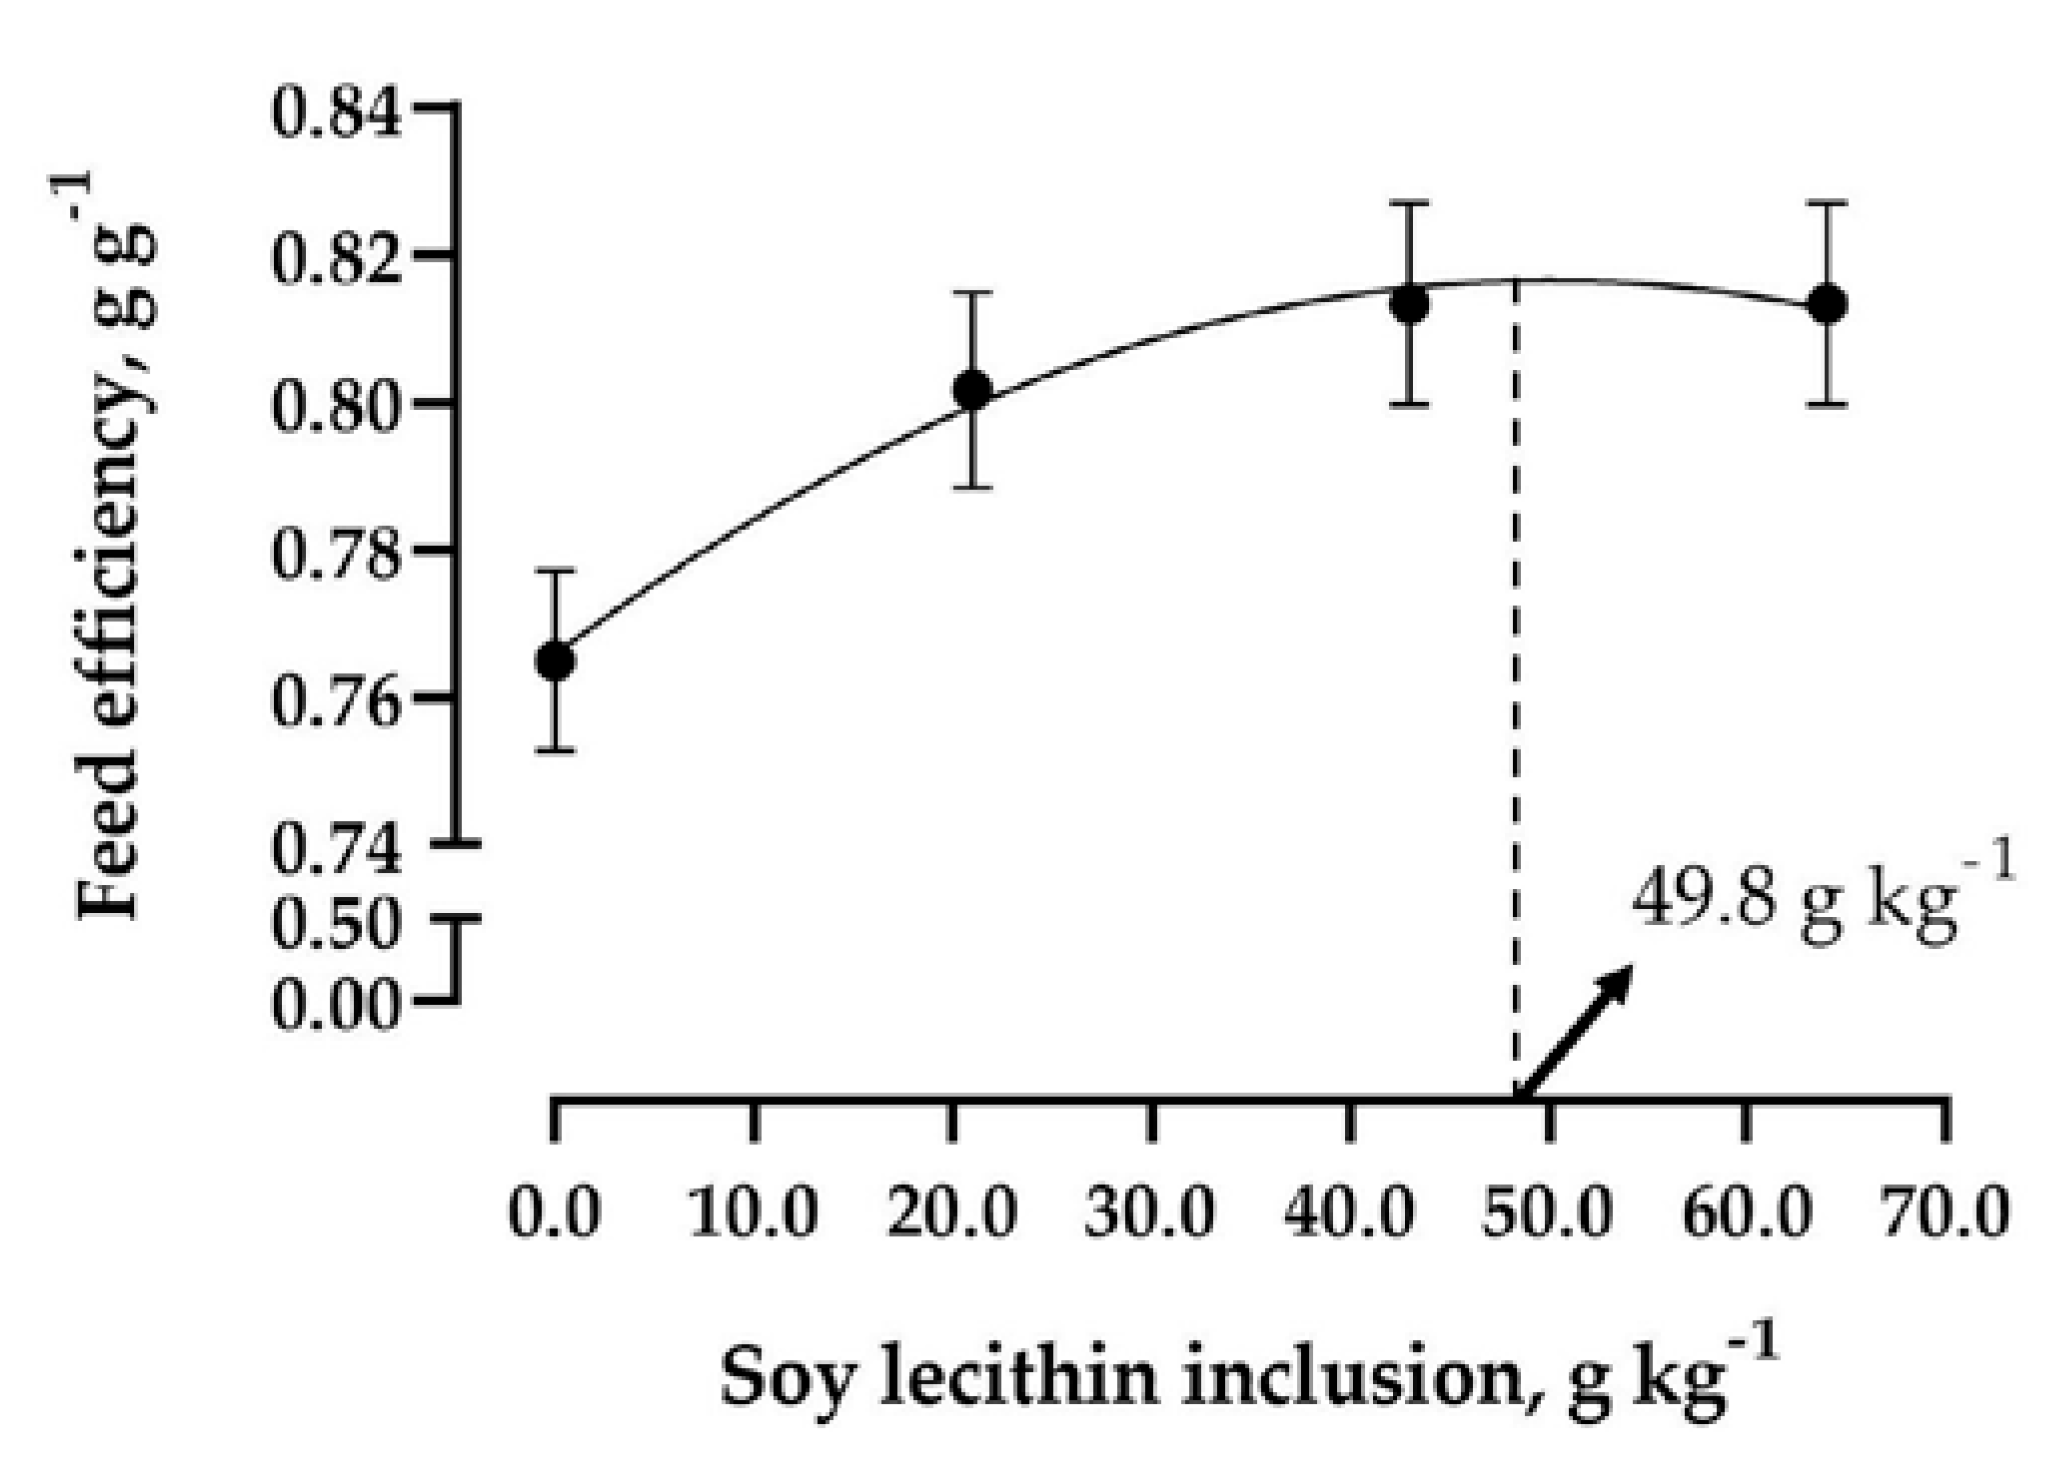
3.1. Growth Performance, Protein Retention, and Somatic Indices

Nile tilapia growth performance variables, including weight gain, daily weight gain, specific growth rate, feed efficiency, daily feed intake, and viscerosomatic and hepatosomatic indices, were fit to a quadratic regression model (Table 3). Survival rates were similar among fish receiving the different diets, ranging from 97.33 to 99.33%.
The growth and feed efficiency of Nile tilapia juveniles reared at 22 °C was positively affected by increasing dietary inclusion of soy lecithin (p < 0.05). Through quadratic regression, the best soy lecithin inclusion rates were determined to be 42.2 g kg−1 for weight gain and 49.8 g kg−1 for feed efficiency (Figure 1 and Figure 2). Using the regression equation, supplementation with 42.2 g kg−1 of soy lecithin represents a 15.2% increase in weight gain, and supplementation with 49.8 g kg−1 an increase in feed efficiency of 6.5%, both compared to fish fed the 0SL diet.
The polynomial quadratic regression was significant for daily weight gain (p < 0.05), which ranged from 1.08 to 1.20 g day−1 with increased soy lecithin inclusion (0SL to 64SL; Table 3). The viscerosomatic and hepatosomatic indices decreased as soy lecithin dietary inclusion increased (Table 3). Protein retention rate was not significantly affected by the inclusion of soy lecithin (p < 0.05).

3.2. Body and Fillet Composition

Whole-body lipid composition was significantly affected in fish fed increasing levels of soy lecithin. The body lipid content decreased in response to increasing soy lecithin supplementation, indicating a quadratic response. Soy lecithin dietary supplementation of 50.2 g kg−1 would promote the lowest accumulation of body lipids, as estimated by the quadratic regression model. Fillet protein content was affected by the inclusion of soy lecithin, presenting a quadratic response, with a decrease in protein content with increasing inclusion of soy lecithin (Table 4).

3.3. Whole-Body Fatty Acid Profiles

Increasing dietary levels of soy lecithin significantly affected the profiles of several body fatty acids and fatty acid groups (p < 0.05), presenting a quadratic response (Table 5). The following fatty acids or fatty acid groups increased significantly as dietary soy lecithin increased: linoleic acid (LOA, 18:2 n-6), arachidonic acid (ARA, 20:4 n-6), docosahexaenoic acid (DHA, 22:6 n-3), total PUFA, PUFA n-6, PUFA n-3, and long-chain PUFA from the n-3 and n-6 series (n-3 LC-PUFA and n-6 LC-PUFA). In contrast, the body content of oleic acid (OLA, 18:1 n-9) and total MUFA content decreased with increasing soy lecithin inclusion.
Whole-body LOA content increased quadratically with increasing dietary soy lecithin, varying from 3.20 to 3.58 g 100 g−1 dry weight in fish fed the 0SL and 64SL diets, respectively; this represents a 12% increase at the top inclusion level compared to control.
Although n-3 LC-PUFA were not present in the diets, we found a significant increase in their levels in fish as the dietary inclusion of soy lecithin increased. More specifically, there was an increase of 85%, 58%, and 60% in LC-PUFA n-3, PUFA n-3, and DHA contents, respectively, in fish fed the 64SL diet compared to those fed the 0SL diet.

3.4. Selected Nutrient Digestibility and Digestible Intake

The digestibility of selected nutrients was relatively high for both 0SLD and 43SLD diets fed to Nile tilapia raised at 22 °C, with a minimum ADC of 79% (Table 6). No differences were observed in the ADC values for total energy, dry matter, and protein. Total lipid and polar lipid ADC were influenced by the inclusion of soy lecithin, with a higher digestibility for fish fed 43SLD compared to those fed 0SLD.
In general, the digestibility of fatty acids and groups of SFA, MUFA, and PUFA n-6, were higher in diets containing soy lecithin. The ADC of n-3 PUFA was calculated only for the 43SLD diet because these fatty acids were not found in the 0SLD diet. The n-3 PUFA showed high digestibility in the 43SLD diet with an ADC of 100%.
Using both digestibility data and feed consumption data from the dose-response trial, we calculated the consumption of digestible and energy nutrients (Table 7). Digestible feed intake was higher in fish fed 43SL compared to those fed 0SL when we evaluated the digestible intake of energy, protein, lipids, and fatty acids. However, consumption of monounsaturated fatty acids, such as C18:1 n-9 and total MUFA was higher in fish fed 0SL (Table 7).

4. Discussion

The importance of dietary phospholipids for optimal growth and feed efficiency in fall/spring diets of tilapia was clearly demonstrated in the present study. The inclusion of phospholipids in the form of soy lecithin improved the weight gain, feed efficiency, and digestibility of lipids for Nile tilapia when raised at suboptimal temperatures (22 °C). The optimal soy lecithin inclusion level was estimated to be 42.2 g kg−1 for weight gain and 49.8 g kg−1 for feed efficiency.
Several studies have reported the benefits of phospholipid inclusion in fish diets for improved growth, survival, resistance to high temperature stress, absorption, and distribution of lipids, especially for fish in larval stages and marine carnivores [36,37,38,39,40,41]; however, studies addressing phospholipid inclusion in the diets of juvenile and adult freshwater omnivorous fishes in particular are scarce because they show a high capacity to synthesize phospholipids de novo compared to marine carnivores [42]. Despite this, some studies have demonstrated that the inclusion of 30.0 g kg−1 soy lecithin, a source of phospholipids, could improve growth, function, and intestinal health of juvenile common carp (Cyprinus carpio) and grass carp (Ctenopharyngodon idella) reared under optimal temperatures of 25–26 °C [43, 44].
Positive growth results have also been reported for juvenile Nile tilapia at optimal growth temperatures with the dietary inclusion of purified phosphatidylcholine (PC) [45]. PC is one of the most abundant phospholipid classes in fish tissues and plant ingredients, including soy lecithin. Dietary supplementation with 15.0 g kg−1 PC increased the weight gain and feed efficiency of juvenile Nile tilapia maintained at 28 °C [45]; however, in adult fish kept at 28 to 34 °C, dietary supplementation with PC did not affect weight gain despite increasing feed efficiency and PC content in the liver, but with decreasing fat content in the liver, viscera, and whole body [46].
At the ideal rearing temperature, omnivorous freshwater fish may not require dietary phospholipid inclusion, because their ability to synthesize phospholipids de novo is sufficient for adequate physiological function [24]; however, at low temperatures, the nutritional requirements of freshwater fish, especially lipid requirements, may change given their ectothermic conditions and inherent metabolic changes [3]. For instance, biological membranes undergo homeo-viscous adaptation, which involves the remodeling of the phospholipid membrane portion. Remodeling primarily comprises changes in the fatty acid composition and proportion of phospholipid headgroups [14,24]. Therefore, our findings showed that phospholipid inclusion in Nile tilapia diets can significantly contribute to improved growth performance at suboptimal temperatures.
The improvement in feed utilization observed in our study may be related to the higher digestibility of nutrients conferred by soy lecithin due to its emulsifying properties that improve feed digestion [24]. The mode of action of emulsifiers is related to increasing the active surface of lipids and promoting the formation of micelles by fatty acids, a step that is crucial for the digestion and absorption of lipids [47]. Thus, evaluating products to improve intestinal digestion and lipid absorption, thereby improving nutrient utilization, is an important strategy for increasing the sustainability of Nile tilapia farming at lower than optimal temperatures [48].
In addition to better feed efficiency, the decrease in body lipid and viscerosomatic and hepatosomatic indices, indicate that dietary lipid efficiency improved when it was offered in the form of phospholipids. Many studies have already reported that the increase in lipid levels in the diet can lead to a deposition of fat in the body, fillet, and liver [48,49,50]. However, in these studies, lipid increase in the diet is related to the use of fish oil and vegetable oils, which are formed by triacylglycerols (neutral lipids). Therefore, incorporation of phospholipids, such as soy lecithin, into the diet may be a useful strategy to improve lipid utilization and potentially reduce the risk of diet-induced lipid accumulation or other metabolic disorders. A trend for decreasing lipid accumulation in fish fed phospholipids has been reported for other species such as the large yellow croaker (Larmichthys crocea) [51] and hybrid snakehead (Channa argus × Channa maculata) [52], which might be attributed to the important role of phospholipids in the transport of triacyl-glycerides from the intestine to the liver due to the formation of micelles, and from the liver to extra hepatic tissues due to the formation of very low-density lipoproteins [38]. By calculating the quadratic polynomial regression, we were able to estimate the soy lecithin concentration that would promote the lowest accumulation of body fat, which was determined to be 50.2 g kg−1.
It is well known that the fatty acid composition of fish reflects the fatty acid composition of their diet, and that water temperature influences this profile. LOA is one of the most abundant fatty acids in soy lecithin, representing approximately 52 to 60% of the total fatty acid profile [26], which may have influenced the increase in the body accumulation of such fatty acid observed here as the inclusion of soy lecithin increased. In addition, there was an increase in the body content of ARA, which is an LC-PUFA bioconverted from LOA via desaturase and elongase enzymes [12], as well as an increase in the body content of the total PUFA and LC-PUFA n-6 groups with the inclusion of lecithin. Such results are probably linked to the higher availability of substrates for the transformation of PUFA into LC-PUFA, associated with higher digestibility attributed to phospholipids supplied in the diet. As observed by Corrêa [19], who evaluated the balance of fatty acids in vivo in Nile tilapia reared at optimal and suboptimal temperature (22 °C), there was also the body appearance of n-6 LC-PUFA, mainly 20:2, 20:4, and 22:4 in fish at 22 °C, when fed diets with sunflower oil, a good source of 18:2 n-6, a precursor to the n-6 LC-PUFA. The author highlights the importance of n-6 PUFAs for Nile tilapia as potential essential fatty acids, particularly under lower temperatures, because they registered a notable accumulation of n-6 PUFA in the body, along with the activation of elongases and desaturases responsible for converting PUFA to LC-PUFA. LC-PUFAs are crucial for maintaining plasma membrane fluidity and ensuring the proper functioning of metabolic processes at suboptimal temperatures [19].
In this study, there was a slight increase in body DHA content, and in total n-3 PUFA and n-3 LC-PUFA, although the diets did not contain n-3 LC-PUFA, but α-LNA, indicating that the increase in the proportion of accumulated DHA was likely to be due to endogenous n-3 LC-PUFA biosynthesis with the conversion of dietary α-LNA to eicosapentaenoic (EPA, 20:5 n-3) and DHA. It has been reported that Nile tilapia expresses the genes for Δ-4 and Δ-6 desaturases, thus allowing the conversion of LOA to ARA and α-LNA to DHA through two different pathways, which are mediated by both desaturases [10,53]. DHA is a fatty acid of high biological value and its accumulation in the body suggests its probable presence in structural phospholipids in cells, especially at suboptimal temperatures, as previously reported by Glencross [10].
One important aspect that is typically decreased when raising fish at suboptimal low temperatures is the digestibility of selected dietary nutrients such as proteins, lipids, and SFA [15,17,18]. According to Turchini et al. [54], diets with a high SFA content may have lower digestibility due to the solidification of SFA caused by low temperatures, which may prevent lipid digestion and absorption by fish. Soy lecithin is rich in SFA fatty acids; however, the emulsifying characteristics of phospholipids can overcome this and improve the lipid–water interaction, resulting in better nutrient digestibility, including SFA digestibility. Indeed, our findings show that, despite the low temperature, the inclusion of soy lecithin improved the digestibility of total lipids, polar lipids, and fatty acid groups, such as SFA, MUFA, and PUFA. An improvement in nutrient digestibility and thus a higher intake of digestible nutrients in the diet with 43.0 g kg−1 of lecithin corroborate the greater growth of fish fed soy lecithin. There was also an increase in the digestible consumption of such nutrients, resulting in the highest consumption of digestible energy, which supported the highest performance found in fish fed soy lecithin supplemented within the 42 to 50 g kg−1 range.
The positive biological responses of Nile tilapia to the dietary inclusion of soy lecithin make it an excellent choice for winter diets, especially considering its wide availability in the market. While fishmeal is also a good source of phospholipids, its use is often not economically feasible in Nile tilapia commercial diets, which increases the relevance of using a plant phospholipid source such as soy lecithin. More studies should be conducted to evaluate how phospholipid sources, particularly soy lecithin, affect fish immune responses to the various challenges imposed by farming.

5. Conclusions

This is the first report of growth performance improvements in Nile tilapia when fed diets containing soy lecithin and raised at a suboptimal temperature. An improvement in growth and feed efficiency and a beneficial reduction in viscerosomatic and hepatosomatic indices were also observed because of the dietary inclusion of soy lecithin. Through quadratic modelling, soy lecithin inclusion at 42.2 g kg−1 was found to be best for weight gain and 49.8 g kg−1 was best for feed efficiency; inclusion at 50.2 g kg−1 resulted in the lowest accumulation of body fat and 43.0 g kg−1 improved digestible energy and digestible nutrient intake. Overall, our findings show that the best inclusion level of soy lecithin in fall/spring diets for Nile tilapia juveniles housed at low temperatures is within the range of 42 to 50 g kg−1.

Author Contributions

R.O.B.: Investigation, Methodology, Conceptualization, Data curation, Formal analysis, Visualization, Writing—Original Draft. B.L.R.: Investigation, Methodology. J.F.B.: Investigation, Methodology. D.D.S.: Supervision, Methodology, Conceptualization, Data Curation, Writing—Review and Editing. M.S.: Methodology, Formal analysis, Writing—Review and Editing. R.O.N.: Methodology, Formal analysis, Writing—Review and Editing. M.F.O.d.S.: Formal analysis and Data Curation. B.M.: Methodology, Formal analysis, Writing—Review and Editing. J.E.P.: Conceptualization, Data curation, Writing—Review and Editing. D.M.F.: Supervision, Funding acquisition, Methodology, Project administration, Writing—Review and Editing. All authors have read and agreed to the published version of the manuscript.

Funding

We thank Alltech Inc. (Lexington, KY, USA) for funding our study. The authors also thank the Coordination of Superior Level Staff Improvement (CAPES-Brazil, Finance Code 001) for granting a Ph.D.’s scholarship (88887.461556/2019-0) to Rosana O. Batista and the National Council for Scientific and Technological Development (CNPq- Brazil) for fellowships granted to Jorge F. Banze, Renata O. Nobrega, and Débora M. Fracalossi.

Institutional Review Board Statement

The study was conducted according to the guidelines of the National Council for Control of Animal Experimentation (CONCEA) and was approved by the Ethic Committee on Animal Use of the Federal University of Santa Catarina (CEUA/UFSC), the protocol code 3641231120.

Informed Consent Statement

Not applicable.

Data Availability Statement

The data that support the findings of this study are available from the corresponding author upon reasonable request.

Acknowledgments

We would like to thank BergaPur (Berg + Schmidt, Hamburg, Germany) for donating the soy lecithin. We thank Camila Fernandes Corrêa for the review and comments to the original manuscript.

Conflicts of Interest

This study was funded by Alltech, Inc. (USA) through a joint research alliance between Alltech (USA) and the Universidade Federal de Santa Catarina (UFSC-Brazil). One of the authors is a consultor for Alltech through a committee containing both Alltech staff and UFSC staff, where the research project was developed and approved.

References

  1. FAO. World Fisheries and Aquaculture; FAO: Rome, Italy, 2022; ISBN 9789251072257. [Google Scholar]
  2. Azaza, M.S.; Dhraïef, M.N.; Kraïem, M.M. Effects of water temperature on growth and sex ratio of juvenile Nile tilapia Oreochromis niloticus (Linnaeus) reared in geothermal waters in southern Tunisia. J. Therm. Biol. 2008, 33, 98–105. [Google Scholar] [CrossRef]
  3. Nobrega, R.O.; Banze, J.F.; Batista, R.O.; Fracalossi, D.M. Improving winter production of Nile tilapia: What can be done? Aquac. Rep. 2020, 18, 100453. [Google Scholar] [CrossRef]
  4. da Silva, B.C.; Pereira, A.; Marchiori, N.d.C.; Mariguele, K.H.; Massago, H.; Klabunde, G.H.F. Cold tolerance and performance of selected Nile tilapia for suboptimal temperatures. Aquac. Res. 2021, 52, 1071–1077. [Google Scholar] [CrossRef]
  5. Ibarz, A.; Padrós, F.; Gallardo, M.Á.; Fernández-Borràs, J.; Blasco, J.; Tort, L. Low-temperature challenges to gilthead sea bream culture: Review of cold-induced alterations and “Winter Syndrome”. Rev. Fish Biol. Fish. 2010, 20, 539–556. [Google Scholar] [CrossRef]
  6. Lima De Almeida, A.; Charlle Kally, C.; De Almeida, L.; De Fátima, E.; Martins, F.; Maria, Â.; Pimentel, A.; Tatiane, R.; Fortes-silva, R. Effect of the dietary linoleic/α -linolenic ratio (n6/n3) on histopathological alterations caused by suboptimal temperature in tilapia (Oreochromis niloticus). J. Therm. Biol. 2019, 85, 102386. [Google Scholar] [CrossRef] [PubMed]
  7. Shi, G.C.; Dong, X.H.; Chen, G.; Tan, B.P.; Yang, Q.H.; Chi, S.Y.; Liu, H.Y. Physiological responses and HSP70 mRNA expression of GIFT strain of Nile tilapia (Oreochromis niloticus) under cold stress. Aquac. Res. 2015, 46, 658–668. [Google Scholar] [CrossRef]
  8. Wang, H.; Wang, Y.; Niu, M.; Hu, L.; Chen, L. Cold Acclimation for Enhancing the Cold Tolerance of Zebrafish Cells. Front. Physiol. 2022, 12, 813451. [Google Scholar] [CrossRef]
  9. Zhou, T.; Gui, L.; Liu, M.; Li, W.; Hu, P.; Duarte, D.F.C.; Niu, H.; Chen, L. Transcriptomic responses to low temperature stress in the Nile tilapia, Oreochromis niloticus. Fish Shellfish Immunol. 2019, 84, 1145–1156. [Google Scholar] [CrossRef]
  10. Glencross, B.D. Exploring the nutritional demand for essential fatty acids by aquaculture species. Rev. Aquac. 2009, 1, 71–124. [Google Scholar] [CrossRef]
  11. Liu, C.; Ge, J.; Zhou, Y.; Thirumurugan, R.; Gao, Q.; Dong, S. Effects of decreasing temperature on phospholipid fatty acid composition of different tissues and hematology in Atlantic salmon (Salmo salar). Aquaculture 2020, 515, 734587. [Google Scholar] [CrossRef]
  12. Tocher, D.R. Metabolism and functions of lipids and fatty acids in teleost fish. Rev. Fish. Sci. 2003, 11, 107–184. [Google Scholar] [CrossRef]
  13. Abdel-Ghany, H.M.; El-Sayed, A.F.M.; Ezzat, A.A.; Essa, M.A.; Helal, A.M. Dietary lipid sources affect cold tolerance of Nile tilapia (Oreochromis niloticus). J. Therm. Biol. 2019, 79, 50–55. [Google Scholar] [CrossRef] [PubMed]
  14. Kostetsky, E.Y.; Velansky, P.V.; Sanina, N.M. Phase transitions of phospholipids as a criterion for assessing the capacity for thermal adaptation in fish. Russ. J. Mar. Biol. 2013, 39, 214–222. [Google Scholar] [CrossRef]
  15. Nobrega, R.O.; Batista, R.O.; Corrêa, C.F.; Mattioni, B.; Filer, K.; Pettigrew, J.E.; Fracalossi, D.M. Dietary supplementation of Aurantiochytrium sp. meal, a docosahexaenoic-acid source, promotes growth of Nile tilapia at a suboptimal low temperature. Aquaculture 2019, 507, 500–509. [Google Scholar] [CrossRef]
  16. Fernandes, V.A.G.; Brignol, F.D.; Filler, K.; Pettigrew, J.; Fracalossi, D.M. Aurantiochytrium sp. meal as DHA source in Nile tilapia diet, part I: Growth performance and body composition. Aquac. Res. 2019, 50, 390–399. [Google Scholar] [CrossRef]
  17. Ng, W.K.; Sigholt, T.; Bell, J.G. The influence of environmental temperature on the apparent nutrient and fatty acid digestibility in Atlantic salmon (Salmo salar L.) fed finishing diets containing different blends of fish oil, rapeseed oil and palm oil. Aquac. Res. 2004, 35, 1228–1237. [Google Scholar] [CrossRef]
  18. Olsen, R.E. The influence of temperature on the apparent nutrient and fatty acid digestibility of Arctic charr, Salvelinus alpinus L. Aquac. Res. 1998, 29, 147–158. [Google Scholar] [CrossRef]
  19. Corrêa, C.F.; Nobrega, R.O.; Mattioni, B.; Turchini, G.M.; Fracalossi, D.M. LC-PUFA endogenous biosynthesis is improved in Nile tilapia fed plant-oil sources at cold suboptimal temperature. Aquaculture 2023, 562, 738832. [Google Scholar] [CrossRef]
  20. Corrêa, C.F.; Nobrega, R.O.; Mattioni, B.; Block, J.M.; Fracalossi, D.M. Dietary lipid sources affect the performance of Nile tilapia at optimal and cold, suboptimal temperatures. Aquac. Nutr. 2017, 23, 1016–1026. [Google Scholar] [CrossRef]
  21. Refaey, M.M.; Mehrim, A.I.; Zenhom, O.A.; Mansour, A.T. Effect of fatty acids manipulation on survival and physiological response of hybrid red tilapia under chronic cold stress. Aquaculture 2022, 561, 738663. [Google Scholar] [CrossRef]
  22. Corrêa, C.F.; Nobrega, R.O.; Block, J.M.; Fracalossi, D.M. Mixes of plant oils as fish oil substitutes for Nile tilapia at optimal and cold suboptimal temperature. Aquaculture 2018, 497, 82–90. [Google Scholar] [CrossRef]
  23. Batista, R.O.; Nobrega, R.O.; Schleder, D.D.; Pettigrew, J.E.; Fracalossi, D.M. Aurantiochytrium sp. Meal improved body fatty acid profile and morphophysiology in nile tilapia reared at low temperature. Fishes 2021, 6, 45. [Google Scholar] [CrossRef]
  24. Tocher, D.R.; Bendiksen, E.Å.; Campbell, P.J.; Bell, J.G. The role of phospholipids in nutrition and metabolism of teleost fish. Aquaculture 2008, 280, 21–34. [Google Scholar] [CrossRef] [Green Version]
  25. Van Nieuwenhuyzen, W.; Tomás, M.C. Update on vegetable lecithin and phospholipid technologies. Eur. J. Lipid Sci. Technol. 2008, 110, 472–486. [Google Scholar] [CrossRef]
  26. EFSA Panel on Additives and Products or Substances used in Animal Feed (FEEDAP). Safety and efficacy of lecithins for all animal species. EFSA J. 2016, 14, 4561. [Google Scholar] [CrossRef]
  27. Jobling, M. National Research Council (NRC): Nutrient requirements of fish and shrimp. Aquac. Int. 2012, 20, 601–602. [Google Scholar] [CrossRef]
  28. Furuya, W.M.; Furuya, V.R.B.; Nagae, M.Y.; Graciano, T.S.; Michelato, M.; Xavier, T.O.; Vidal, L.V. Nutrição de Tilápias no Brasil. Sci. Agrar. Parana. 2012, 11, 19–34. [Google Scholar] [CrossRef]
  29. Popma, T.J.; Lovshin, L.L. Worldwide Prospects of Commercial Production of Tilapia; Auburn University: Auburn, AL, USA, 1995. [Google Scholar]
  30. Rodrigues, A.P.O.; Gominho-Rosa, M.D.C.; Cargnin-Ferreira, E.; de Francisco, A.; Fracalossi, D.M. Different utilization of plant sources by the omnivores jundiá catfish (Rhamdia quelen) and Nile tilapia (Oreochromis niloticus). Aquac. Nutr. 2012, 18, 65–72. [Google Scholar] [CrossRef]
  31. Association of Official Analytical Chemists. Official Methods of Analysis of AOAC International. Volume I, Agricultural Chemicals, Contaminants, Drugs, 17th ed.; Horwitz, W., Ed.; AOAC International: Arlington, VA, USA, 2000; pp. 44–46. [Google Scholar]
  32. Folch, J.; Lees, M.; Sloane Stanley, G.H. A simple method for the isolation and purification of total lipides from animal tissues. J. Biol. Chem. 1957, 226, 497–509. [Google Scholar] [CrossRef]
  33. Juaneda, P.; Rocquelin, G. Rapid and convenient separation of pentachlorophenol from human fat using silica Sep-PakTM cartridges. J. Chromatogr. A 1985, 346, 435–439. [Google Scholar] [CrossRef]
  34. Bligh, E.G.; Dyer, W.J. A rapid method of total lipid extraction and purification. Can. J. Biochem. Physiol. 1959, 37, 911–917. [Google Scholar] [CrossRef] [PubMed]
  35. O’Fallon, J.V.; Busboom, J.R.; Nelson, M.L.; Gaskins, C.T. A direct method for fatty acid methyl ester synthesis: Application to wet meat tissues, oils, and feedstuffs. J. Anim. Sci. 2007, 85, 1511–1521. [Google Scholar] [CrossRef] [PubMed] [Green Version]
  36. Cahu, C.L.; Infante, J.L.Z.; Barbosa, V. Effect of dietary phospholipid level and phospholipid:neutral lipid value on the development of sea bass (Dicentrarchus labrax) larvae fed a compound diet. Br. J. Nutr. 2003, 90, 21–28. [Google Scholar] [CrossRef] [Green Version]
  37. Daprà, F.; Geurden, I.; Corraze, G.; Bazin, D.; Zambonino-Infante, J.L.; Fontagné-Dicharry, S. Physiological and molecular responses to dietary phospholipids vary between fry and early juvenile stages of rainbow trout (Oncorhynchus mykiss). Aquaculture 2011, 319, 377–384. [Google Scholar] [CrossRef]
  38. Sivaramakrishnan, T.; Ambasankar, K.; Kumaraguru Vasagam, K.P.; Syama Dayal, J.; Sandeep, K.P.; Bera, A.; Makesh, M.; Kailasam, M.; Vijayan, K.K. Effect of dietary soy lecithin inclusion levels on growth, feed utilization, fatty acid profile, deformity and survival of milkfish (Chanos chanos) larvae. Aquac. Res. 2021, 52, 5366–5374. [Google Scholar] [CrossRef]
  39. Zhao, J.; Ai, Q.; Mai, K.; Zuo, R.; Luo, Y. Effects of dietary phospholipids on survival, growth, digestive enzymes and stress resistance of large yellow croaker, Larmichthys crocea larvae. Aquaculture 2013, 410–411, 122–128. [Google Scholar] [CrossRef]
  40. Pagheh, E.; Agh, N.; Marammazi, J.G.; Nouri, F.; Sepahdari, A.; Gisbert, E.; Torfi Mozanzadeh, M. Dietary soybean lecithin affects growth performance, fillet biochemical composition and digestive enzyme activity in Sparidentex hasta juvenile. J. Appl. Anim. Res. 2019, 47, 24–33. [Google Scholar] [CrossRef] [Green Version]
  41. Taylor, J.F.; Martinez-Rubio, L.; Del Pozo, J.; Walton, J.M.; Tinch, A.E.; Migaud, H.; Tocher, D.R. Influence of dietary phospholipid on early development and performance of Atlantic salmon (Salmo salar). Aquaculture 2015, 448, 262–272. [Google Scholar] [CrossRef] [Green Version]
  42. Geurden, I.; Coutteau, P.; Sorgeloos, P. Increased docosahexaenoic acid levels in total and polar lipid of European sea bass (Dicentrarchus labrax) postlarvae fed vegetable or animal phospholipids. Mar. Biol. 1997, 129, 689–698. [Google Scholar] [CrossRef]
  43. Chen, Y.P.; Jiang, W.D.; Liu, Y.; Jiang, J.; Wu, P.; Zhao, J.; Kuang, S.Y.; Tang, L.; Tang, W.N.; Zhang, Y.A.; et al. Exogenous phospholipids supplementation improves growth and modulates immune response and physical barrier referring to NF-κB, TOR, MLCK and Nrf2 signaling factors in the intestine of juvenile grass carp (Ctenopharyngodon idella). Fish Shellfish Immunol. 2015, 47, 46–62. [Google Scholar] [CrossRef]
  44. Adel, M.; Gholaghaie, M.; Khanjany, P.; Citarasu, T. Effect of dietary soybean lecithin on growth parameters, digestive enzyme activity, antioxidative status and mucosal immune responses of common carp (Cyprinus carpio). Aquac. Nutr. 2017, 23, 1145–1152. [Google Scholar] [CrossRef]
  45. Kasper, C.S.; Brown, P.B. Growth Improved in Juvenile Nile Tilapia Fed Phosphatidylcholine; Growth Improved in Juvenile Nile Tilapia Fed Phosphatidylcholine. N. Am. J. Aquac. 2003, 65, 39–43. [Google Scholar] [CrossRef]
  46. Tian, J.; Wen, H.; Lu, X.; Liu, W.; Wu, F.; Yang, C.G.; Jiang, M.; Yu, L.J. Dietary phosphatidylcholine impacts on growth performance and lipid metabolism in adult Genetically Improved Farmed Tilapia (GIFT) strain of Nile tilapia Oreochromis niloticus. Br. J. Nutr. 2018, 119, 12–21. [Google Scholar] [CrossRef] [PubMed] [Green Version]
  47. Kim, M.J.; Hosseindoust, A.R.; Choi, Y.H.; Kumar, A.; Jeon, S.M.; Lee, S.H.; Jung, B.Y.; Kill, D.Y.; Chae, B.J. An evaluation of metabolizable energy content of main feed ingredients for growing pigs when adding dietary lysophospholipids. Livest. Sci. 2018, 210, 99–103. [Google Scholar] [CrossRef]
  48. Wangkahart, E.; Bruneel, B.; Wisetsri, T.; Nontasan, S.; Martin, S.A.M.; Chantiratikul, A. Interactive effects of dietary lipid and nutritional emulsifier supplementation on growth, chemical composition, immune response and lipid metabolism of juvenile Nile tilapia (Oreochromis niloticus). Aquaculture 2022, 546, 737341. [Google Scholar] [CrossRef]
  49. Lu, K.L.; Xu, W.N.; Li, X.F.; iu, W.B.; Wang, L.N.; Zhang, C.N. Hepatic triacylglycerol secretion, lipid transport and tissue lipid uptake in blunt snout bream (Megalobrama amblycephala) fed high-fat diet. Aquaculture 2013, 408–409, 160–168. [Google Scholar] [CrossRef]
  50. Xie, S.; Yin, P.; Tian, L.; Liu, Y.; Niu, J. Lipid metabolism and plasma metabolomics of juvenile largemouth bass Micropterus salmoides were affected by dietary oxidized fish oil. Aquaculture 2020, 522, 735158. [Google Scholar] [CrossRef]
  51. Feng, S.; Cai, Z.; Zuo, R.; Mai, K.; Ai, Q. Effects of dietary phospholipids on growth performance and expression of key genes involved in phosphatidylcholine metabolism in larval and juvenile large yellow croaker, Larimichthys crocea. Aquaculture 2017, 469, 59–66. [Google Scholar] [CrossRef]
  52. Lin, S.-M.; Li, F.-J.; Yuangsoi, B.; Doolgindachbaporn, S. Effect of dietary phospholipid levels on growth, lipid metabolism, and antioxidative status of juvenile hybrid snakehead (Channa argus×Channa maculata). Fish Physiol. Biochem. 2018, 44, 401–410. [Google Scholar] [CrossRef]
  53. Oboh, A.; Kabeya, N.; Carmona-Antoñanzas, G.; Castro, L.F.C.; Dick, J.R.; Tocher, D.R.; Monroig, O. Two alternative pathways for docosahexaenoic acid (DHA, 22:6n-3) biosynthesis are widespread among teleost fish. Sci. Rep. 2017, 7, 3889. [Google Scholar] [CrossRef] [Green Version]
  54. Turchini, G.M.; Torstensen, B.E.; Ng, W.K. Fish oil replacement in finfish nutrition. Rev. Aquac. 2009, 1, 10–57. [Google Scholar] [CrossRef]
Figure 1. Effect of soy lecithin inclusion level on the body weight gain of Nile tilapia juveniles fed for 90 days at 22 °C. The best growth-related lecithin dose (indicated by the vertical dashed line and arrow) was estimated using the following equation of the quadratic regression model: y= −0.0082x2 + 0.6932x + 97.324, R2 = 0.50.
Fishes 08 00404 g001
Figure 2. Effect of soy lecithin inclusion level on feed efficiency of Nile tilapia juveniles fed for 90 days at 22 °C. Best feed efficiency-related lecithin dose (indicated by the vertical dashed line and arrow) was estimated using the following equation of the quadratic regression model: y = −0.0000212x2 + 0.00211 + 0.765, R2 = 0.75.
Fishes 08 00404 g002
Table 1. Formulation and composition of the experimental diets of the growth trial.
Ingredients 1,
g kg −1 Dry Diet
Diets
0SL 521SL43SL64SL
Soybean meal450.0450.0450.0450.0
Broken rice387.0380.0371.0357.0
Poultry by-product meal100.0100.0100.0100.0
Corn oil34.020.07.00.0
Soy lecithin0.021.043.064.0
Others 229.029.029.029.0
Analyzed Composition, g 100 g −1 Dry Weight
Dry matter91.1491.3091.2190.36
Crude energy (kcal kg−1)4632467447444812
Crude protein33.0433.1033.6332.97
Ether extract6.617.537.838.74
Polar lipids2.593.874.875.97
Mineral matter6.616.816.987.55
C16:0 30.891.001.061.11
C18:1 n-91.561.291.171.01
C18:2 n-61.962.102.232.35
C18:3 n-3nd 60.020.030.03
SFA 41.121.221.351.43
MUFA1.741.661.551.41
PUFA1.962.102.262.39
PUFA n-61.962.102.232.36
PUFA n-30.000.020.030.03
1 Broken rice and soybean meal were obtained from Cravil Ltd. (Palhoça, Brazil). Poultry by-product meal was produced by Kabsa S.A. (Porto Alegre, Brazil). Corn oil “Suavit” was produced by Cocamar Ltd. a (Maringá, Brazil). Soy lecithin was produced by BergaPur (Berg & Schmidt, Hamburg, Germany), and contained 70% total phospholipid (average value from analyses performed between 2014 to 2020, as informed by the manufacturer). 2 Dicalcium phosphate (16.0 g kg−1), vitamin-micromineral premix (10.0 g kg−1), choline bitartrate (1.0 g kg−1), butylated hydroxytoluene (BHT; 1.0 g kg−1), threonine (1.2 g kg−1), and methionine (1.0 g kg−1). A vitamin-micromineral premix (produced by Cargill, Campinas, São Paulo, Brazil). Composition per kg of product: folic acid 420 mg, pantothenic acid 8.333 mg, BHT 25.000 mg, biotin 134 mg, cobalt sulfate 27 mg, copper sulfate 1.833 mg, iron sulfate 8000 mg, calcium iodate 92 mg, sulfate manganese 3.500 mg, niacin 8.333 mg, selenite 100 mg, vitamin (vit.) A 1666.670 IU, vit. B1 2083 mg, vit. B12 5.000 μg, vit. B2 4.166 mg, vit. B6 3.166 mg, ascorbic acid equivalent 66.670 mg, vit. D3 666.670 IU, vit. A 16.666 IU, vit. K3 833 mg, zinc sulfate 23.330 mg, inositol 50.000 mg, calcium propionate 250.000 mg. 3 Fatty acids: C16:0, palmitic acid, PAL; C18:1 n-9, oleic acid, OLA; C18:2 n-6, linoleic acid, LOA; C18:3 n-3, linolenic acid, α-LNA. 4 Fatty acid groups: SFA = saturated, MUFA = monounsaturated, PUFA = polyunsaturated. 5 Soy lecithin. The experimental diets contained increasing levels of soy lecithin (0.0, 21.0, 43.0, and 64.0 g kg−1; namely 0SL, 21SL, 43SL, and 64SL, respectively). 6 Not detected (<0.01 g 100 g−1 dry weight).
Table 2. Formulation and composition of the experimental diets for the digestibility trial.
Ingredients 1, g kg−1 Dry DietDiets
0SLD 543SLD
Soybean meal450.0450.0
Broken rice386.0370.0
Poultry by-product meal100.0100.0
Corn oil34.07.0
Soy lecithin0.043.0
Others 229.029.0
Yttrium oxide1.01.0
Analyzed Composition, g 100 g−1 Dry Weight
Dry matter90.7991.12
Crude energy (kcal kg−1)46704676
Crude protein31.3930.41
Ether extract6.217.84
Polar lipids2.274.91
Mineral matter6.486.82
C16:0 30.851.15
C18:1 n-91.481.18
C18:2 n-61.892.12
C18:3 n-3nd 60.03
SFA 41.091.43
MUFA1.751.58
PUFA1.892.16
PUFA n-61.892.13
PUFA n-30.000.03
1 Broken rice and soybean meal were obtained from Cravil Ltd. (Palhoça, Brazil). Poultry by-product meal was produced by Kabsa S.A. (Porto Alegre, Brazil). Corn oil “Suavit” was produced by Cocamar Ltd.a (Maringá, Brazil). Soy lecithin was produced by BergaPur (Berg & Schmidt, Hamburg, Germany) and contained 70% total phospholipid (average value from analyses performed between 2014 to 2020, as informed by the manufacturer). Yttrium oxide was obtained from Sigma-Aldrich (São Paulo, Brazil). 2 Dicalcium phosphate (16.0 g kg−1), vitamin-micromineral premix (10.0 g kg−1), choline bitartrate (1.0 g kg−1), butylated hydroxytoluene (BHT; 1.0 g kg−1), threonine (1.2 g kg−1), and methionine (1.0 g kg−1). A vitamin-micromineral premix (produced by Cargill. Campinas, São Paulo, Brazil). Composition per kg of product: folic acid 420 mg, pantothenic acid 8333 mg, BHT 25.000 mg, biotin 134 mg, cobalt sulfate 27 mg, copper sulfate 1833 mg, iron sulfate 8000 mg, calcium iodate 92 mg, sulfate manganese 3.500 mg, niacin 8.333 mg, selenite 100 mg, vitamin (vit.) A 1666.670 IU, vit. B1 2083 mg, vit. B12 5.000 μg, vit. B2 4.166 mg, vit. B6 3.166 mg, ascorbic acid equivalent 66.670 mg, vit. D3 666.670 IU, vit. A 16.666 IU, vit. K3 833 mg, zinc sulfate 23.330 mg, inositol 50.000 mg, calcium propionate 250.000 mg. 3 Fatty acids: C16:0, palmitic acid, PAL; C18:1 n-9, oleic acid, OLA; C18:2 n-6, linoleic acid, LOA; C18:3 n-3, linolenic acid, α-LNA. 4 Fatty acid groups: SFA = saturated, MUFA = monounsaturated, PUFA = polyunsaturated. 5 Soy lecithin. The digestibility experimental diets contained two levels of soy lecithin (0.0 and 43.0 g kg−1; namely 0SLD and 43SLD). 6 Not detected (<0.01 g 100 g−1 dry weight).
Table 3. Growth performance, feed intake, feed efficiency, protein retention, and body indices of juvenile Nile tilapia fed with an increasing dietary inclusion of soy lecithin (SL) for 90 days at 22 °C 1.
VariablesDietsPooled
SEM 3
p Value 4
0SL 221SL43SL64SL
Initial weight, g12.2212.2312.2612.220.080.580
Weight gain, g97.19108.67 111.62 108.34 7.370.005
Daily weight gain, g day−11.08 1.21 1.24 1.20 0.080.005
Specific growth rate, % day−1 2.432.542.572.540.070.004
Daily feed intake, % live weight day−12.912.772.732.73 0.06<0.0001
Feed efficiency0.760.800.810.810.02<0.0001
Apparent net protein retention, %36.6637.6338.75 38.12 2.060.133
Viscerosomatic index, %14.90 13.78 13.6613.121.320.025
Hepatosomatic index, %3.82 3.84 3.63 3.25 0.410.029
Survival, %99.33 98.00 98.67 98.67 2.980.632
1 Results are expressed as the average of six replicates. 2 Soy lecithin. The experimental diets contained increasing levels of soy lecithin (0.0, 21.0, 43.0, and 64. g kg−1; namely 0SL, 21SL, 43SL, and 64SL, respectively). 3 Standard error of means. 4 Where polynomial regression was significant, the following equations were obtained: Weight gain, y= −0.0082x2 + 0.6932x + 97.324, R2 = 0.50; Daily weight gain, y = −0.0000908x2 + 0.00770 + 1.081, R2 = 0.48; Specific growth rate, y = −0.0000753x2 + 0.00646 + 2.436, R2= 0.50; Daily feed intake, y = 0.0000767x2 − 0.00761x + 2.906, R2= 0.75; Feed efficiency, y= −0.0000212x2 + 0.00211 + 0.765, R2 = 0.75; Viscerosomatic index, y= 0.000323x2 − 0.462x + 14.827, R2 = 0.42; Hepatosomatic index y= −0.000223x2 + 0.00541x + 3.819, R2= 0.401.
Table 4. Body and fillet composition of juvenile Nile tilapia fed an increasing dietary inclusion of soy lecithin (SL) for 90 days at 22 °C 1.
Variables DietsPooled
SEM 3
p Value 4
Initial0SL 221SL43SL64SL
Body composition, g 100 g−1 wet weight
Dry matter26.5734.4234.21 34.23 34.411.130.578
Protein14.63 15.5815.3315.73 15.310.820.755
Lipid8.2315.2914.4414.5014.310.810.019
Ash3.463.593.46 3.683.651.360.557
Fillet composition, g 100 g−1 wet weight
Dry matter20.6623.47 23.28 23.67 22.830.460.066
Protein18.6120.26 20.11 20.12 19.530.420.012
Lipid0.992.01 1.951.961.830.270.325
1 Results are expressed as the average of six replicates. 2 Soy lecithin. The experimental diets contained increasing levels of soy lecithin (0.0, 21.0, 43.0, and 64.0 g kg−1; namely 0SL, 21SL, 43SL, and 64SL, respectively). 3 Standard error of means. 4 Where polynomial regression was significant, the following equations were obtained: body composition—lipids, y = 0.000357x2 − 0.0301x + 15.187, R2 = 0.384; fillet composition—protein: Y= 0.000265x2 − 0.00699x + 20.100, R2 = 0.418.
Table 5. Whole-body fatty acid profiles of juvenile Nile tilapia fed increasing dietary inclusion levels of soy lecithin (SL) for 90 days at 22 °C 1.
Fatty Acid g 100 g−1 Dry Weight DietsPooled
SEM 4
p Value 5
Initial 0SL 321SL43SL64SL
C16:07.537.267.137.427.270.320.71
C18:1 n-99.8711.6710.8810.5110.140.34<0.001
C18:2 n-62.993.203.223.323.580.100.030
C20:4 n-60.120.250.300.290.300.020.022
C18:3 n-30.040.050.040.040.040.010.29
C20:5 n-30.080.020.030.030.020.020.56
C22:6 n-30.030.050.070.070.080.01<0.001
SFA 210.5810.6210.4010.9310.690.380.572
MUFA12.7414.3413.5513.1912.820.37<0.001
PUFA4.054.955.034.985.360.150.043
PUFA n-63.373.994.074.104.450.090.011
LC-PUFA n-60.380.760.870.840.870.060.030
PUFA n-30.150.120.160.150.190.030.042
LC-PUFA n-30.110.070.110.110.130.030.017
1 Results are expressed as the average of six replicates (n = 3 fish per replicate). 2 Fatty acid groups: SFA = saturated, MUFA = monounsaturated, PUFA = polyunsaturated, LC-PUFA = long-chain polyunsaturated. 3 Soy lecithin. The experimental diets contained increasing levels of soy lecithin (0.0, 21.0, 43.0, and 64.0 g kg−1; namely 0SL, 21SL, 43SL, and 64SL, respectively). 4 Standard error of means. 5 Where polynomial regression was significant, the following equations were obtained: OLA y = 0.000242x2 − 0.0386x + 11.649, R2 = 0.694; LOA y = 0.000153x2 − 0.00393x + 3.199, R2 = 0.354; ARA y= 0.00005x2 + 0.0023x + 0.2518, R2 = 0.395; DHA y = −0.000005x2 + 0.000752x + 0.0502, R2 = 0.730; MUFA y = 0.000233x2 − 0.0378x + 14.315, R2 = 0.606; PUFA y = 0.000157x2 − 0.00459x + 4.976, R2 = 0.318; n-6 PUFA y = 0.000147x2 − 0.00289x + 4.010, R2 = 0.442; LC-PUFA n-6: −0.0000475 x2 + 0.00448x + 0.767, R2 = 0.382; n-3 PUFA y = −0.000101x2 + 0.00117x + 0.128, R2 = 0.365; n-3 LC-PUFA y = −0.000143x2 − 0.00151x + 0.0779, R2 = 0.675.
Table 6. Apparent digestibility coefficients of selected nutrients in diets with and without soy lecithin (SL) in Nile tilapia maintained at 22 °C 1.
Nutrient, %Dietsp Value
0SLD 343SLD
Dry matter79.44 ± 0.3080.01 ± 1.090.437
Protein87.61 ± 0.1487.99 ± 0.940.532
Energy84.34 ± 0.3985.20 ± 0.500.200
Lipid92.84 ± 0.5495.07 ± 0.740.014
Polar lipid79.14 ± 1.4289.61 ± 0.81<0.001
C10:095.13 ± 0.7798.14 ± 0.170.003
C16:092.50 ± 0.5896.05 ± 0.310.006
C18:090.93 ± 0.5794.91 ± 0.29<0.001
C16:1 n-795.68 ± 0.1596.46 ± 0.160.006
C18:1 n-996.16 ± 0.697.32 ± 0.480.075
C22:1 n-1189.34 ± 0.9392.26 ± 0.510.015
C18:2 n-697.28 ± 0.2098.74 ± 0.22<0.001
C20:2 n-692.97 ± 1.0095.16 ± 0.570.004
C18:3 n-3nd 4100.00 ± 0.00-
SFA 292.11 ± 0.5895.79 ± 0.320.008
MUFA96.06 ± 0.6297.21 ± 0.400.061
PUFA97.26 ± 0.2198.74 ± 0.22<0.001
PUFA n-697.26 ± 0.2198.72 ± 0.22<0.001
PUFA n-3nd100.00 ± 0.0-
1 Values are expressed as the average of three replicates followed by the standard error. 2 Groups of fatty acids: SFA = saturated, MUFA = monounsaturated, PUFA = polyunsaturated. 3 Soy lecithin. The digestibility experimental diets contained two levels of soy lecithin (0.0 and 43.0; namely 0SLD and 43SLD, respectively). 4 Not detected.
Table 7. Digestible intake of energy and selected nutrients in Nile tilapia fed diets with and without soy lecithin (SL) and maintained at 22 °C 1.
Nutrient Intake, g FishDietsp Value
0SL 343SL
Energy495.88 ± 28.07543.33 ± 35.460.036
Protein36.44 ± 2.0840.20 ± 2.680.022
Lipid7.73 ± 0.4410.11 ± 0.65<0.001
Polar lipid2.58 ± 0.145.93 ± 0.39<0.001
C16:01.04 ± 0.051.38 ± 0.09<0.001
C18:1 n-91.89 ± 0.10 1.55 ± 0.10<0.001
C18:2 n-62.40 ± 0.132.99 ± 0.20<0.001
C18:3 n-3nd 40.04 ± 0.00-
SFA 21.30 ± 0.071.76 ± 0.11<0.001
MUFA2.10 ± 0.122.05 ± 0.13<0.001
PUFA2.40 ± 0.133.03 ± 0.21<0.001
PUFA n-62.40 ± 0.132.99 ± 0.08<0.001
PUFA n-3nd0.04 ± 0.00-
1 Values are expressed as the average of three replicates followed by the standard error. 2 Groups of fatty acids: SFA = saturated, MUFA = monounsaturated, PUFA = polyunsaturated. 3 Soy lecithin. The experimental diets contained two levels of soy lecithin (0.0 and 43.0 g kg−1; namely 0SL and 43SL, respectively). 4 Not detected.
Disclaimer/Publisher’s Note: The statements, opinions and data contained in all publications are solely those of the individual author(s) and contributor(s) and not of MDPI and/or the editor(s). MDPI and/or the editor(s) disclaim responsibility for any injury to people or property resulting from any ideas, methods, instructions or products referred to in the content.

