
Conservation Genetics of Clinch Dace Chrosomus sp. cf. saylori †


Abstract
1. Introduction
2. Materials and Methods
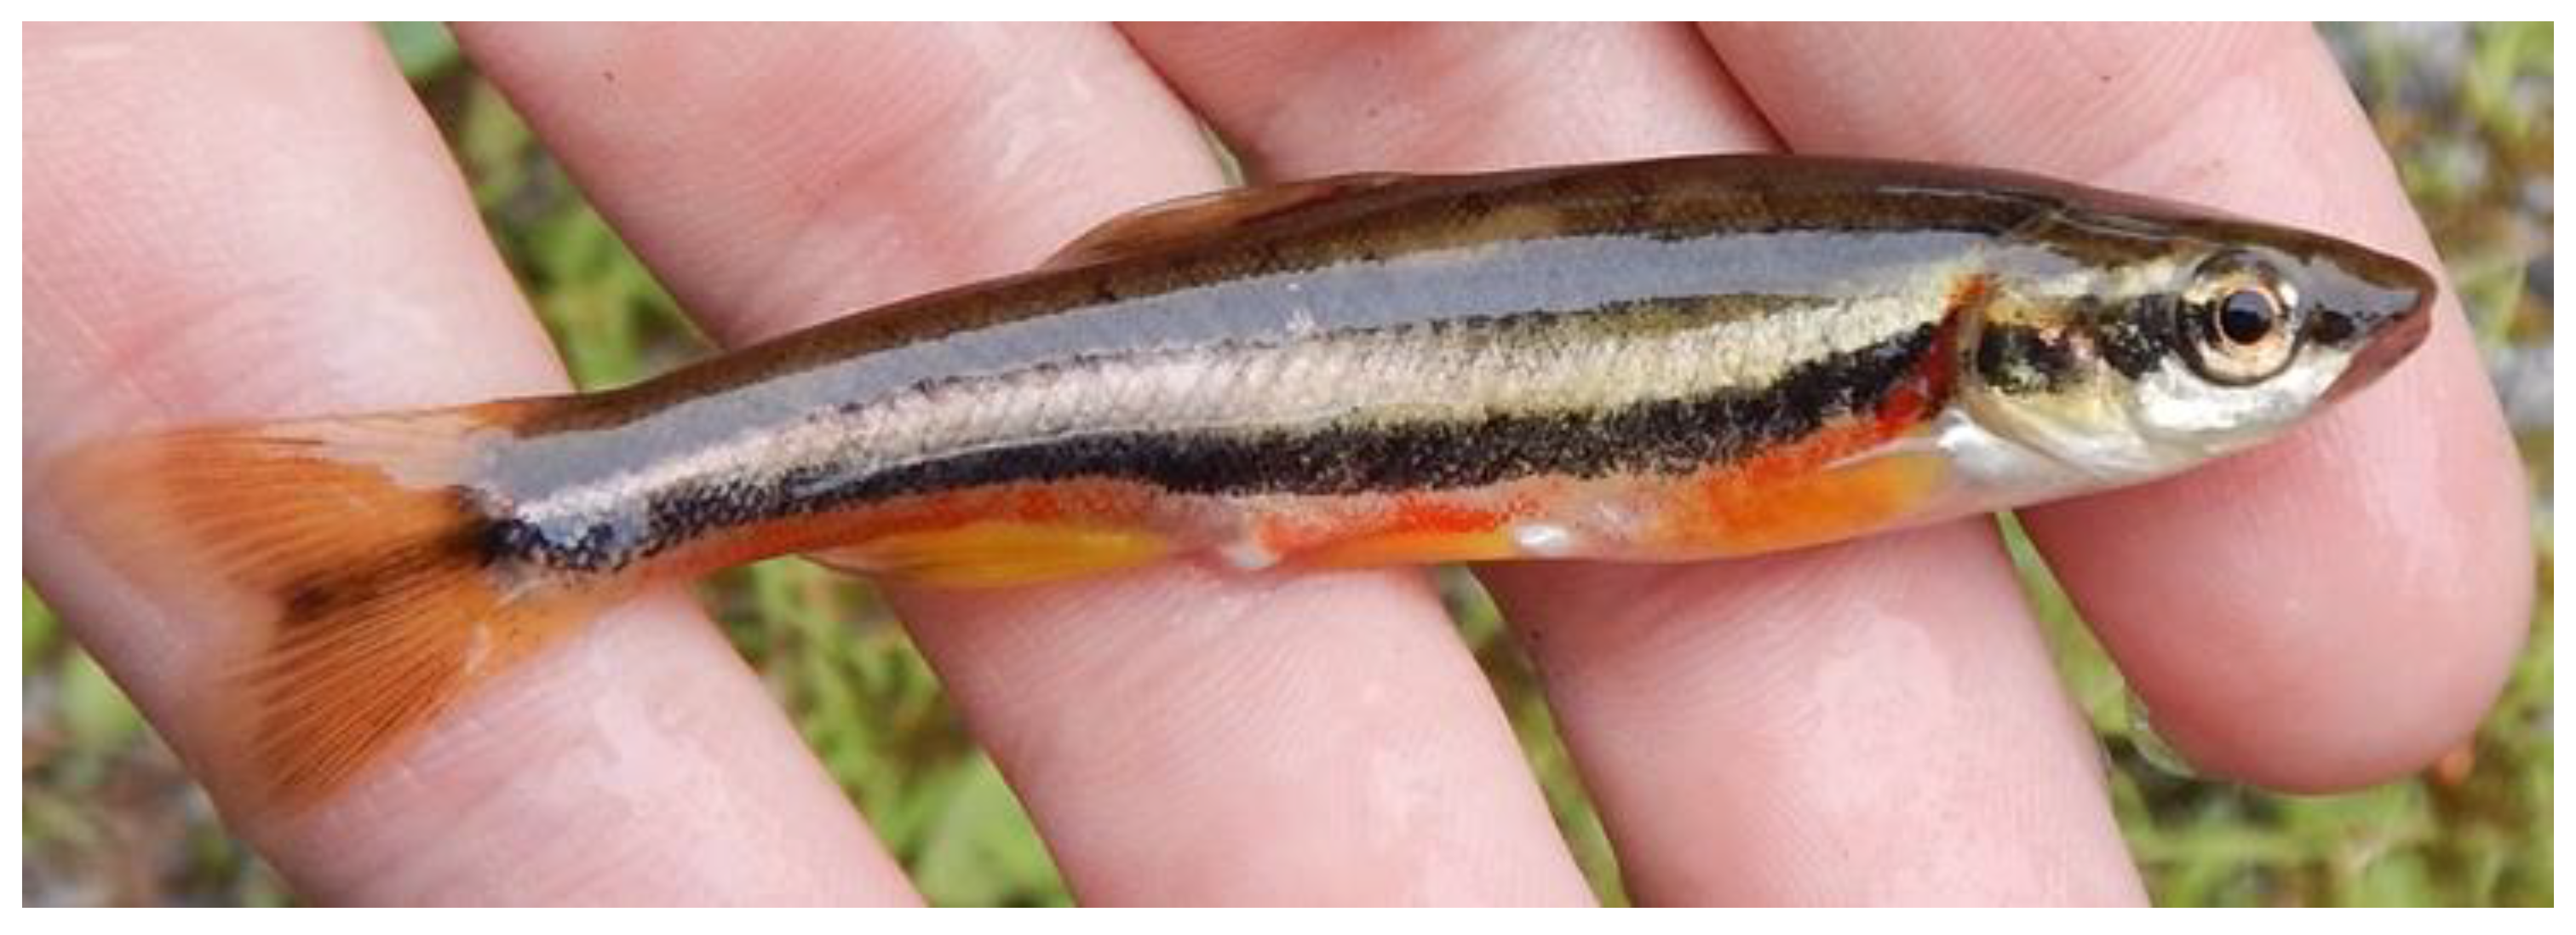
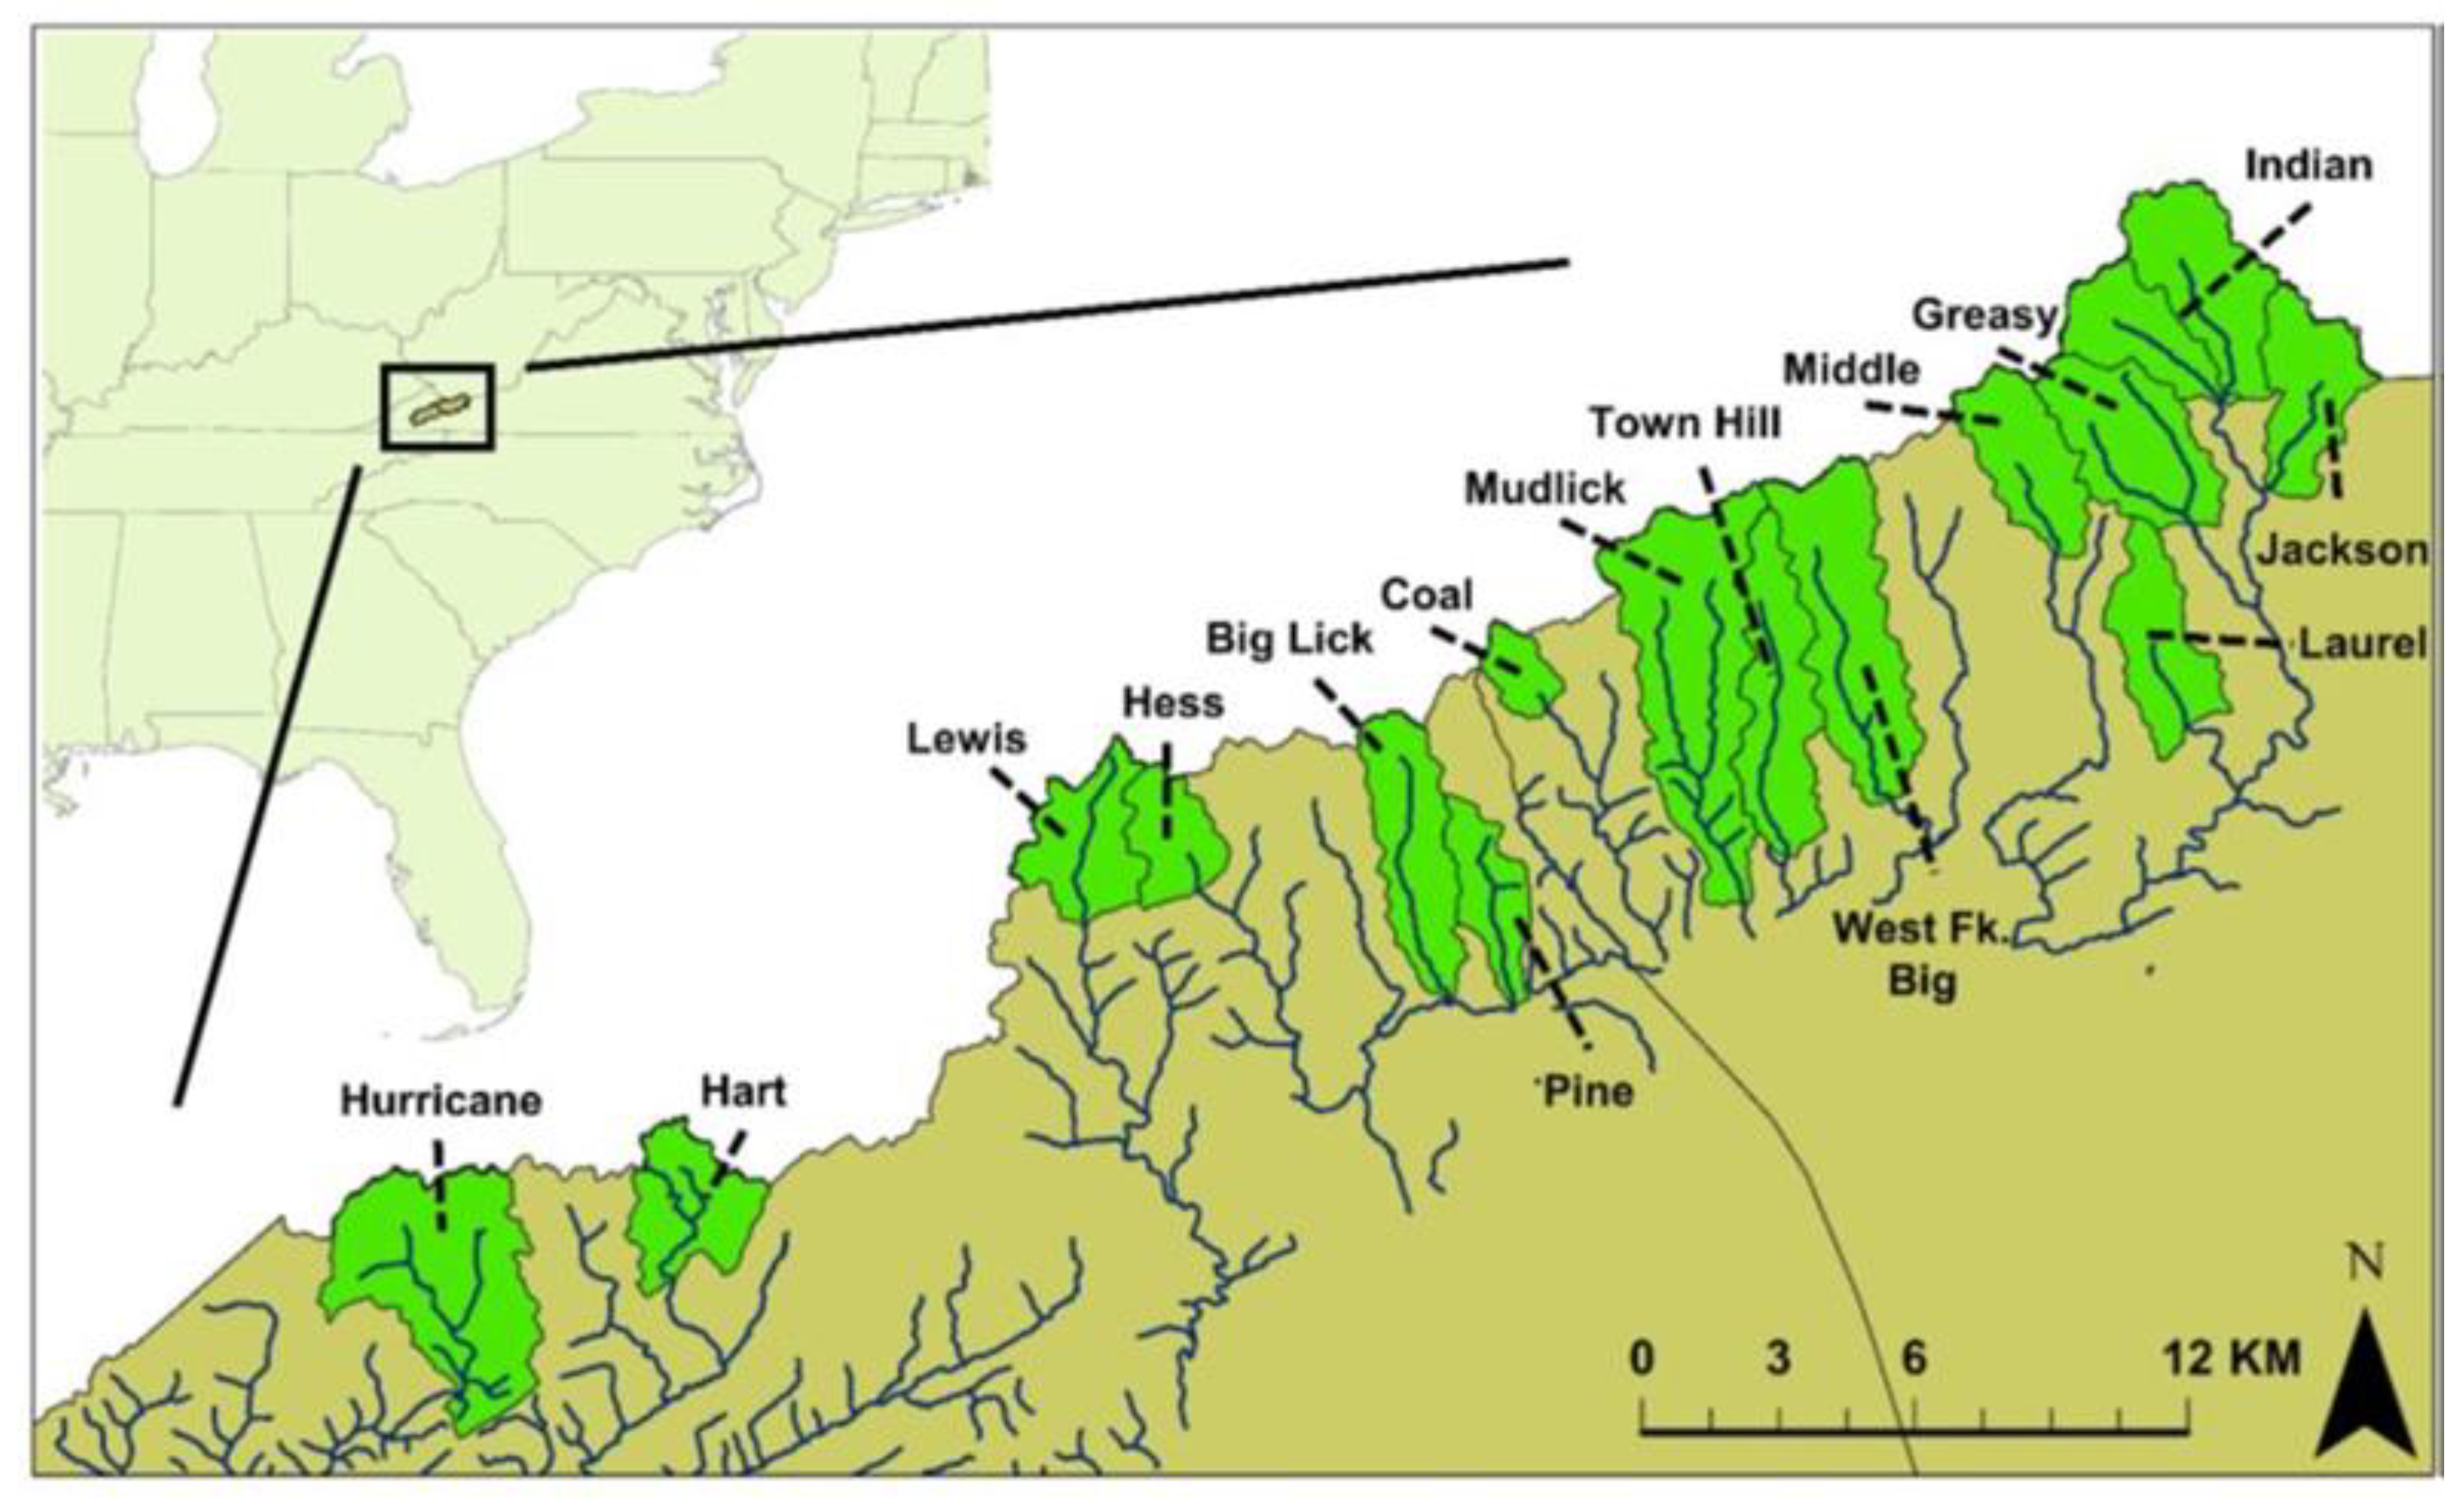
2.1. Fish Sampling
2.2. Genetic Markers
2.3. Data Analysis
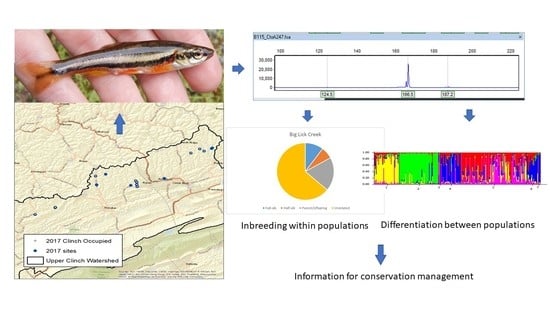
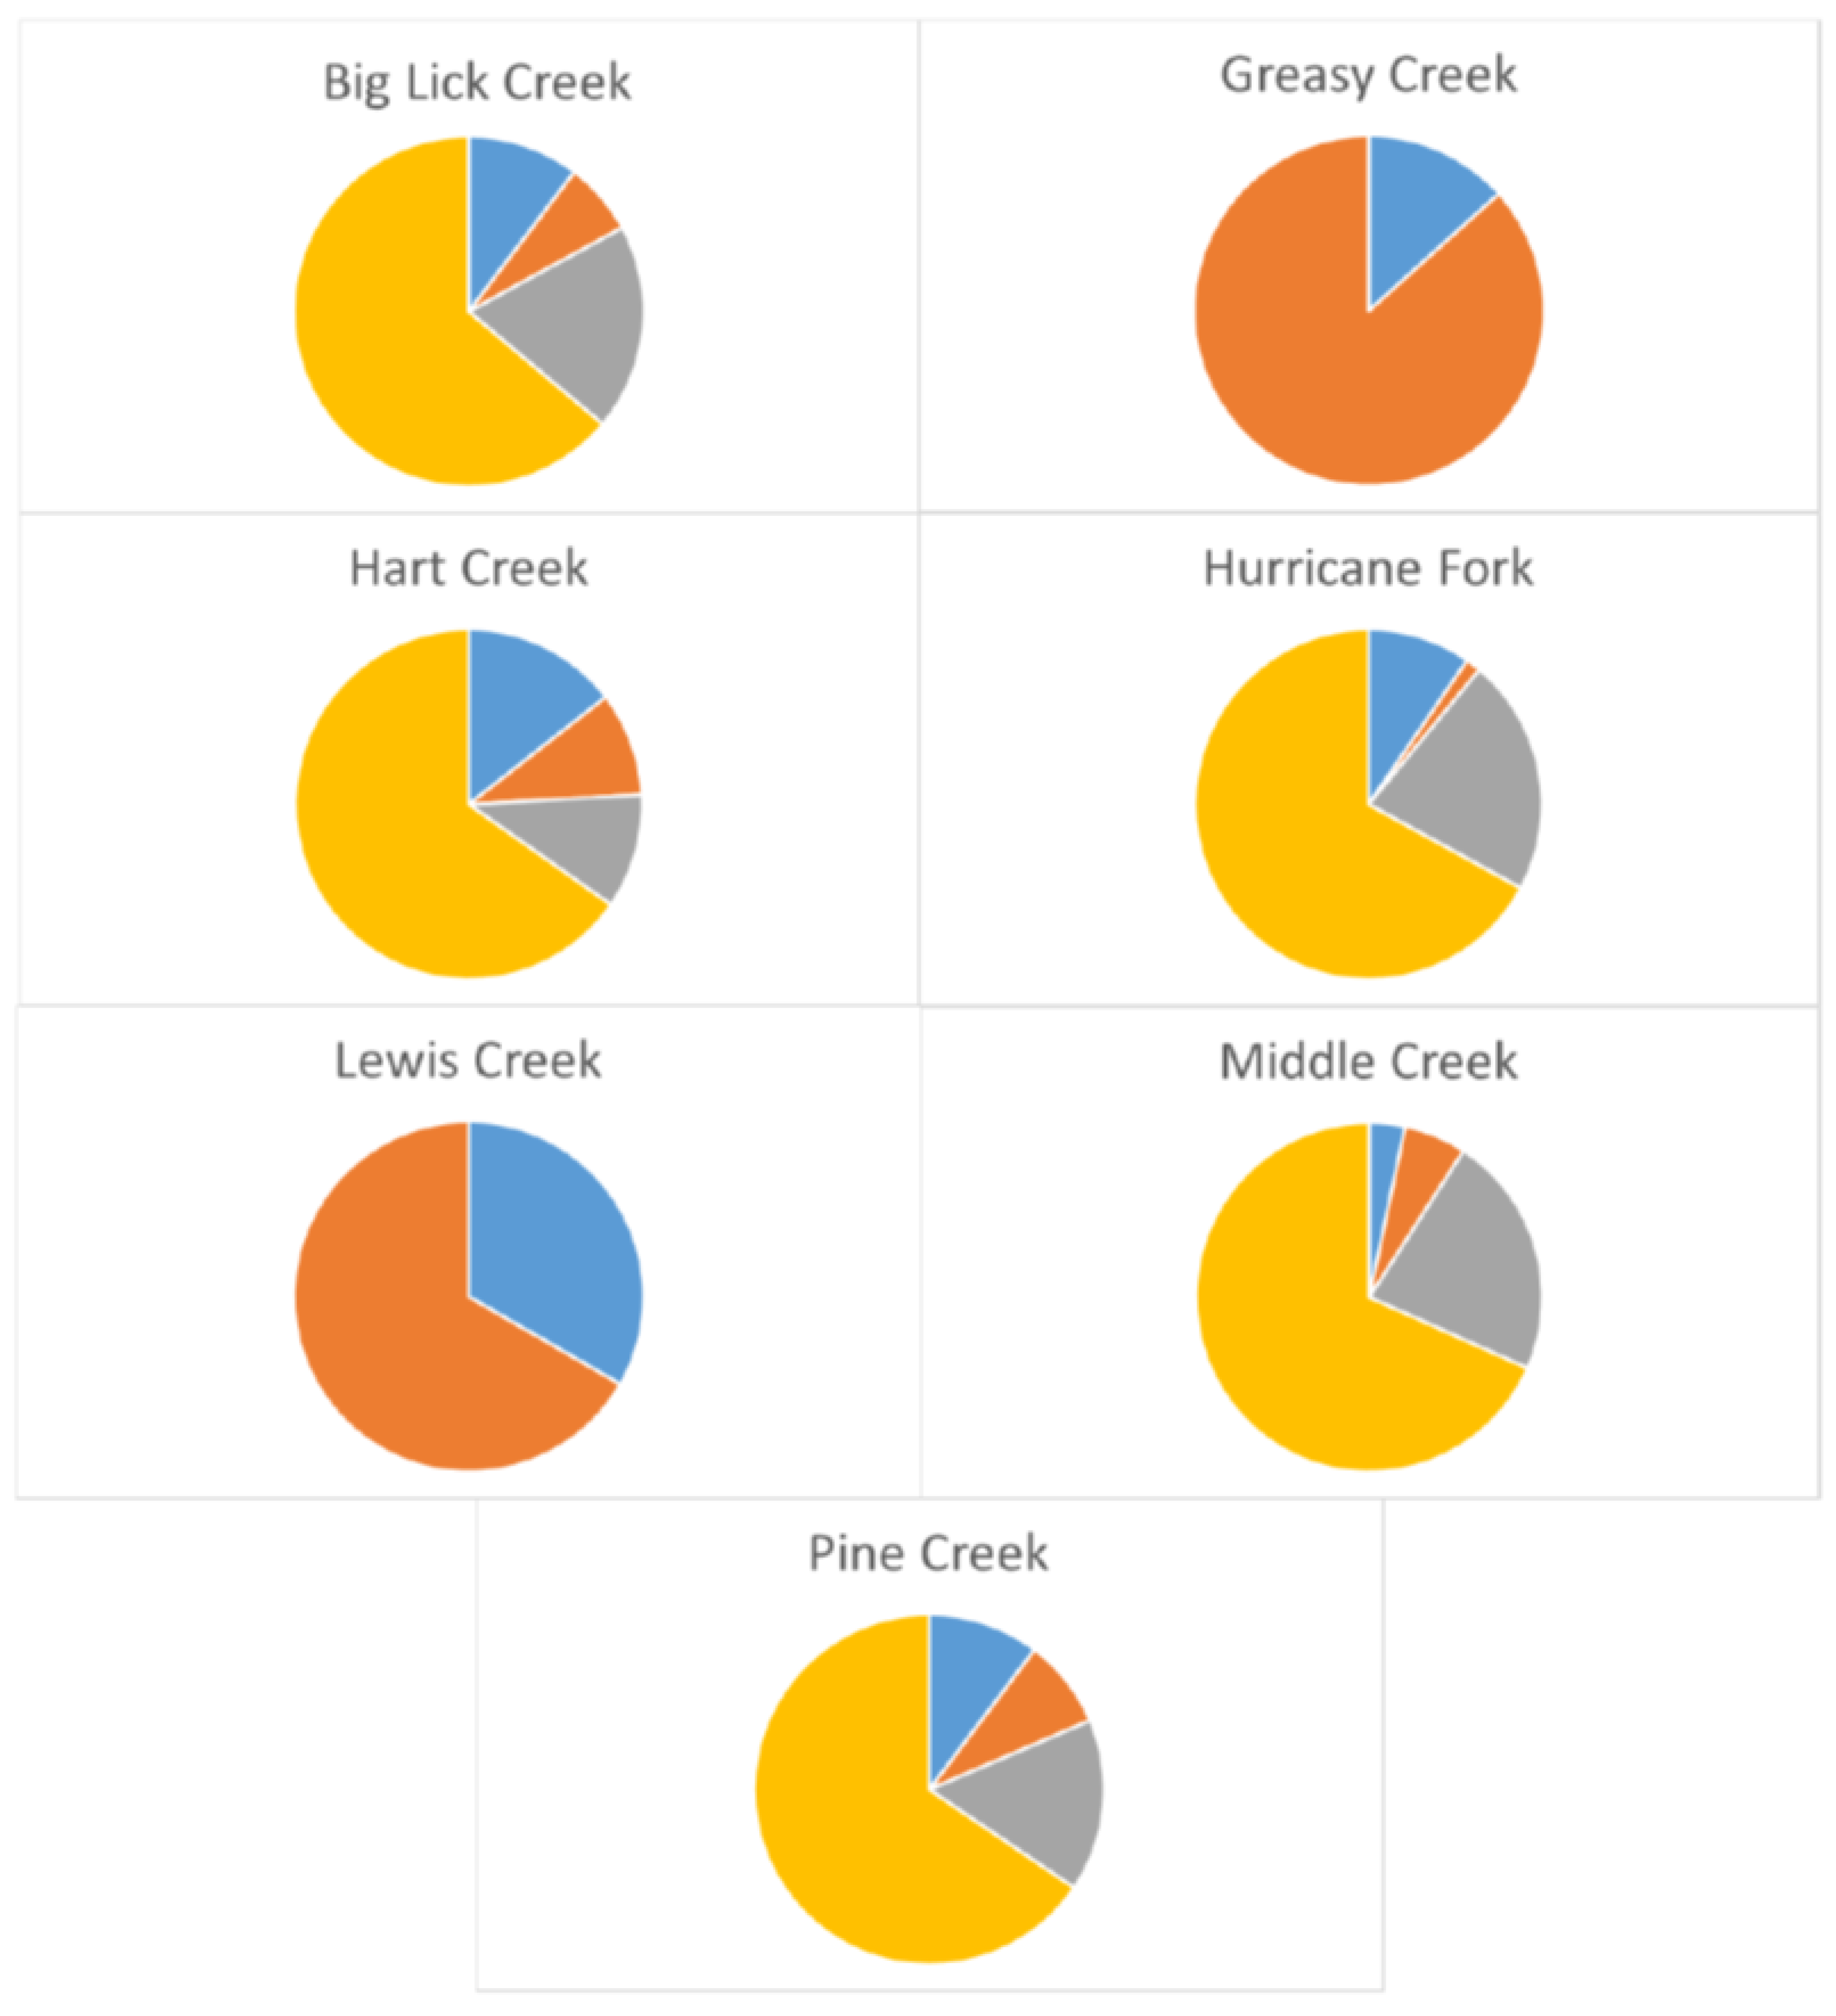
3. Results
3.1. Polymorphism and Utility of Marker Loci
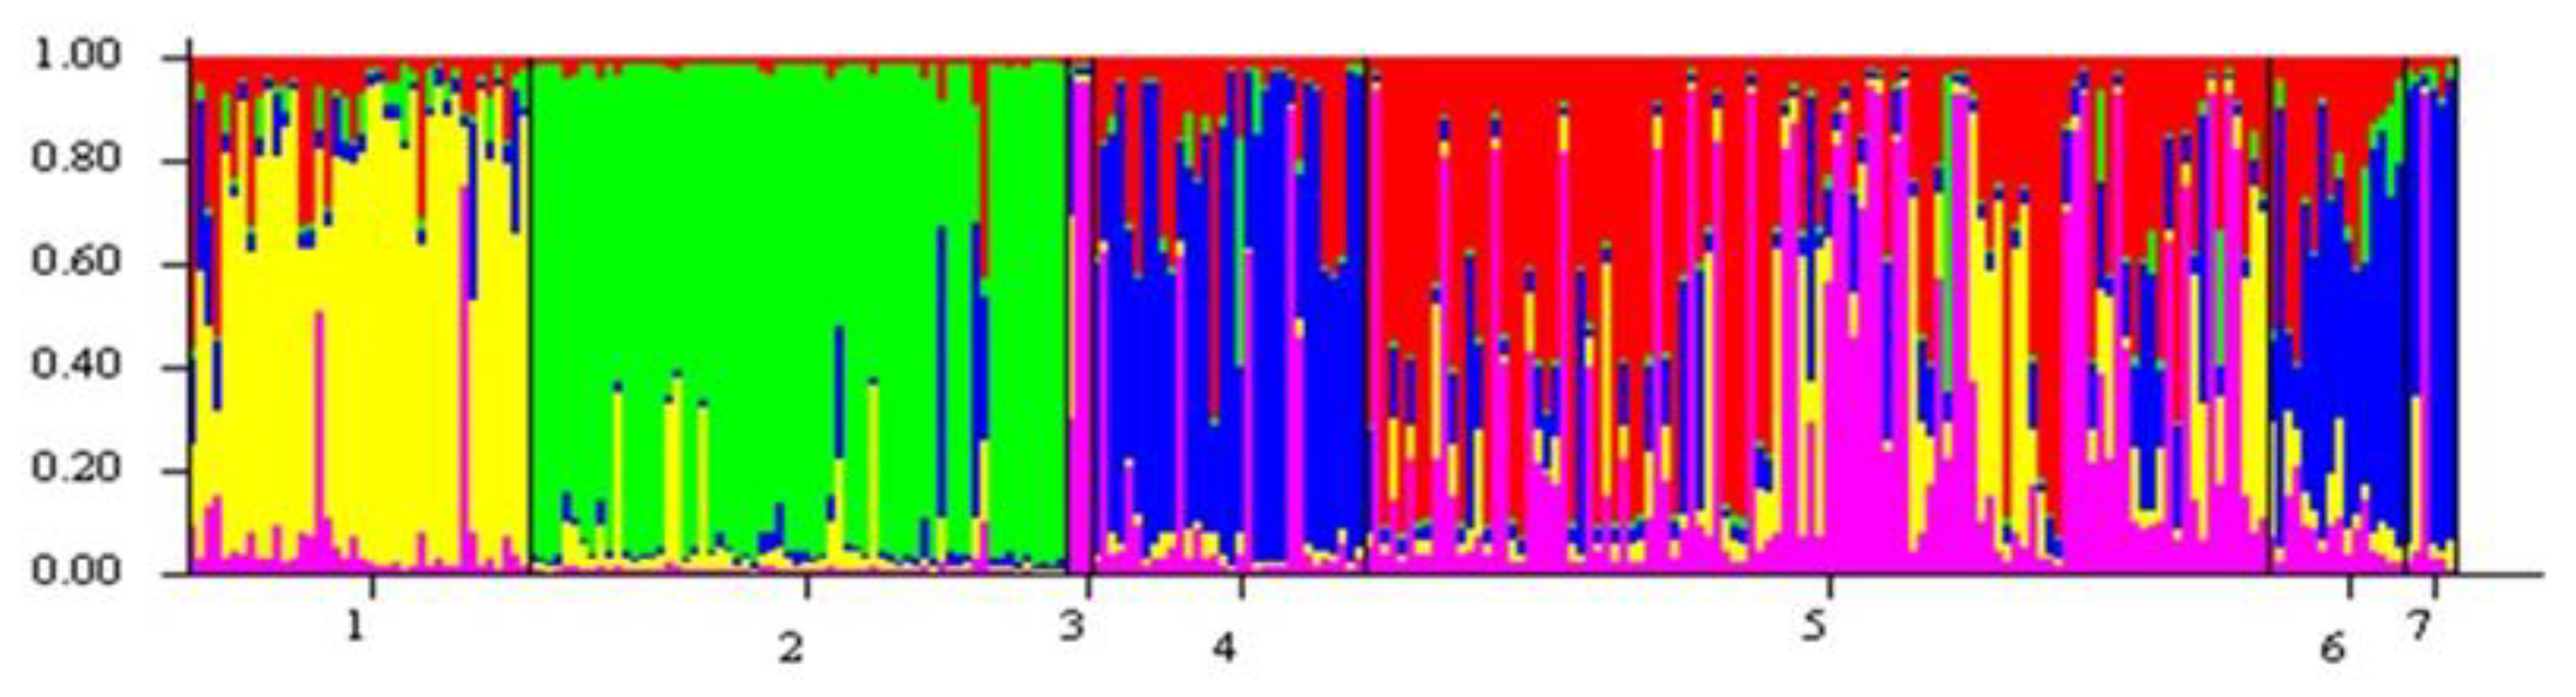
3.2. Recognition of Differentiated Genetic Units
3.3. Within-Population Genetic Variation
3.4. Between-Population Genetic Divergence
4. Discussion
4.1. Population Genetic Processes and Structure
4.2. Management Implications
5. Conclusions
Supplementary Materials
Author Contributions
Funding
Institutional Review Board Statement
Informed Consent Statement
Data Availability Statement
Acknowledgments
Conflicts of Interest
References
- Skelton, C.E. Distribution and Status of Blackside Dace (Phoxinus cumberlandensis) and Clinch Dace (Phoxinus sp. cf. saylori) in the upper Clinch River System, Virginia; Final Report; Virginia Department of Game and Inland Fisheries: Blacksburg, VA, USA, 2007. [Google Scholar]
- White, S.L.; Orth, D.J. Ontogenetic and comparative morphology of Clinch Dace (Chrosomus sp. cf. saylori). Copeia 2013, 2013, 750–756. [Google Scholar] [CrossRef]
- White, S.L.; Orth, D.J. Distribution and habitat correlates of Clinch Dace (Chrosomus sp. cf. saylori) in the upper Clinch River watershed. Am. Midl. Nat. 2014, 171, 311–320. [Google Scholar] [CrossRef]
- Moore, M.J.; Orth, D.J.; Frimpong, E.A. Occupancy and detection of Clinch Dace using two gear types. J. Fish Wildl. Manag. 2017, 8, 530–543. [Google Scholar] [CrossRef]
- Moore, M.J.; Hallerman, E.M.; Orth, D.J. Densities and population sizes of Clinch Dace Chrosomus sp. cf. saylori in the upper Clinch River basin in Virginia. Copeia 2017, 105, 92–99. [Google Scholar]
- Virginia Department of Game and Inland Fishes. Virginia’s 2015 Wildlife Action Plan; VDGIF: Henrico, VA, USA, 2015. Available online: http://bewildvirginia.org/wildlife-action-plan/ (accessed on 30 December 2020).
- U.S. Fish and Wildlife Service. Clinch dace (Chrosomus Sp. Cf. saylori). Environmental Conservation Online System. 2023. Available online: https://ecos.fws.gov/ecp/species/10765 (accessed on 1 June 2023).
- Bourquin, R.; Orth, D.J.; Hallerman, E.M.; Stauffer, D.F. Are road crossings fragmenting populations of Clinch Dace? Northeast. Nat. 2020, 24, 709–722. [Google Scholar] [CrossRef]
- Moore, M.J.; Hallerman, E.M.; Orth, D.J. Multi-metric conservation assessment for the imperiled Clinch Dace. Southeast Fishes Counc. Proc. 2018, 58, 31–56. [Google Scholar]
- Grenier, R.; Costedoat, C.; Chappaz, R.; Dubut, V. Two multiplexed sets of 21 and 18 microsatellites for Phoxinus phoxinus (L.) and Gobio gobio (L.) developed by cross-species amplification. Eur. J. Wildl. Res. 2013, 59, 291–297. [Google Scholar] [CrossRef]
- Dubut, V.; Martin, J.F.; Costedoat, C.; Chappez, R.; Giles, A. Isolation and characterization of polymorphic microsatellite loci in the freshwater fishes Telestes souffia and Telestes muticellus (Teleostei: Cyprinidae). Mol. Ecol. Res. 2009, 9, 1001–1005. [Google Scholar] [CrossRef]
- Dubut, V.; Martin, J.F.; Giles, A.; van Houdt, J.; Chappez, R.; Costedoat, C. Isolation and characterization of polymorphic loci for the dace complex: Leuciscus leuciscus (Teleostei: Cyprinidae). Mol. Ecol. Res. 2009, 9, 1179–1183. [Google Scholar] [CrossRef]
- Dubut, V.; Sinama, M.; Martin, J.F.; Meglecz, E.; Fernandez, J.; Chappez, R.; Giles, A.; Costedoat, C. Cross-species amplification of 41 microsatellites in European cyprinids: A tool for evolutionary population genetics and hybridization studies. BMC Res. Notes 2010, 3, 135. [Google Scholar] [CrossRef]
- Baerwald, M.R.; May, B. Characterization of microsatellite loci for five members of the minnow family Cyprinidae found in the Sacramento-San Joaquin Delta and its tributaries. Mol. Ecol. Res. Notes 2004, 4, 385–390. [Google Scholar] [CrossRef]
- Larno, V.; Launey, S.; Devaux, A.; Loroche, J. Isolation and characterization of microsatellite loci from Chub Leusiscus cephalus (Pisces: Cyprinidae). Mol. Ecol. Res. Notes 2005, 5, 752–754. [Google Scholar] [CrossRef]
- Turner, T.F.; Dowling, T.E.; Broughton, R.E.; Gold, J.R. Variable microsatellite markers amplify across divergent lineages of cyprinid fishes (subfamily Leusiscinae). Conserv. Genet. 2004, 5, 279–281. [Google Scholar] [CrossRef]
- Bessert, M.L.; Orti, G. Microsatellite loci paternity analysis in the Fathead Minnow Pimephales promelas (Teleostei: Cyprinidae). Mol. Ecol. Notes 2003, 3, 532–534. [Google Scholar] [CrossRef]
- Barinova, M.R.; Yadrenkina, E.; Nakajima, M.; Taniguchi, N. Identification and characterization of microsatellite DNA markers developed in Ide Leuciscus idus and Siberian Roach Rutilus rutilus. Mol. Ecol. Notes 2004, 4, 86–88. [Google Scholar] [CrossRef]
- Muenzel, F.M.; Sanetra, M.; Salzburger, W.; Meyer, A. Microsatellites from the Vairone Leuciscus souffia (Pisces: Cyprinidae) and their application to closely related species. Mol. Ecol. Notes 2007, 7, 1048–1050. [Google Scholar] [CrossRef]
- Girard, P.; Angers, B. Characterization of microsatellite loci in Longnose Dace (Rhinichthys cataractae) and interspecific amplification in five other Leusiscinae species. Mol. Ecol. Notes 2006, 6, 69–71. [Google Scholar] [CrossRef]
- Dimsoski, P.; Toth, G.P.; Bagley, M.J. Microsatellite characterization in Central Stoneroller Campostoma anomalum (Pisces: Cyprinidae). Mol. Ecol. 2000, 9, 2187–2189. [Google Scholar] [CrossRef]
- Vyskoclova, M.; Simkova, A.; Martin, J.F. Isolation and characterization of microsatellites in Leuciscus cephalus (Cypriniformes, Cyprinidae) and cross-species amplification within the Family Cyprinidae. Mol. Ecol. Notes 2007, 55, 627–629. [Google Scholar]
- Crooijmans, R.P.M.A.; Bierbooms, V.A.F.; Komen, J.; Van der Poel, J.J.; Groenen, M.A.M. Microsatellite markers in Common Carp (Cyprinus carpio L.). Anim. Genet. 1997, 28, 129–134. [Google Scholar] [CrossRef]
- Van Oosterhout, C.; Hutchinson, W.F.; Wills, D.P.M.; Shipley, P. MICRO-CHECKER: Software for identifying and correcting genotyping errors in microsatellite data. Mol. Ecol. Notes 2004, 4, 535–538. [Google Scholar] [CrossRef]
- Excoffier, L.; Laval, G.; Schneider, S. Arlequin ver. 3.0: An integrated software package for population genetics data analysis. Evol. Bioinformat. Online 2005, 1, 47–50. [Google Scholar]
- Pritchard, J.K.; Stephens, M.; Donnelly, P. Inference of population structure using multilocus genotype data. Genetics 2000, 155, 945–959. [Google Scholar] [CrossRef] [PubMed]
- Garza, J.C.; Williamson, E.G. Detection of reduction in population size using data from microsatellite loci. Mol. Ecol. 2001, 10, 305–318. [Google Scholar] [CrossRef] [PubMed]
- Goudet, J. Fstat, Version 1.2., a program for IBM PC compatibles to calculate Weir and Cockerham’s estimators of F-statistics. J. Hered. 1995, 86, 485–486. [Google Scholar] [CrossRef]
- Chybicki, I.J. Inest 2.2. 2020. Available online: https://www.ukw.edu.pl/pracownicy/strona/igor_chybicki/software_ukw/ (accessed on 2 June 2023).
- Campagne, P.; Smouse, P.E.; Varouchas, G.; Silvain, L.F.; Leru, B. Comparing the van Oosterhout and Chybicki-Burczyk methods of estimating null allele frequencies for inbred populations. Mol. Ecol. Resour. 2012, 12, 975–982. [Google Scholar] [CrossRef]
- Do, C.; Waples, R.S.; Peel, D.; Macbeth, G.M.; Tillett, B.J.; Ovenden, J.R. NeEstimator v2: Re-implementation of software for the estimation of contemporary effective population size (Ne) from genetic data. Mol. Ecol. Resour. 2014, 14, 209–214. [Google Scholar] [CrossRef]
- Kalinowski, S.T.; Wagner, A.P.; Taper, M.L. ML-Relate: A computer program for maximum likelihood estimation of relatedness and relationship. Mol. Ecol. Notes 2006, 6, 576–579. [Google Scholar] [CrossRef]
- Wright, S. The interpretation of population structure by F-statistics with special regard to mating. Evolution 1965, 19, 395–420. [Google Scholar] [CrossRef]
- Excoffier, L.; Smouse, P.E.; Quattro, J.M. Analysis of molecular variance inferred from metric distances among DNA haplotypes: Application to human mitochondrial DNA restriction data. Genetics 1992, 131, 479–491. [Google Scholar] [CrossRef]
- Peakall, R.; Smouse, P.E. GenAlEx 6.5: Genetic analysis in Excel. Population genetic software for teaching and research-an update. Bioinformatics 2012, 28, 2537–2539. [Google Scholar] [CrossRef]
- ESRI. ArcGIS for Desktop; Version 10.2.2; Environmental Systems Research Institute: Redlands, CA, USA, 2014. [Google Scholar]
- Wright, S. Isolation by distance. Genetics 1943, 28, 114–138. [Google Scholar] [CrossRef]
- Caughley, G. Directions in conservation biology. J. Anim. Ecol. 1994, 63, 215–244. [Google Scholar] [CrossRef]
- Newmark, W.D. Extinction of mammal populations in western North American national parks. Conserv. Biol. 1995, 9, 512–526. [Google Scholar] [CrossRef]
- O’Grady, J.J.; Reed, D.H.; Brook, B.W.; Frankham, R. What are the best correlates of predicted extinction risk? Biol. Cons. 2004, 118, 513–520. [Google Scholar] [CrossRef]
- White, S.L.; Orth, D.J. Reproductive biology of Clinch Dace, Chrosomus sp. cf. saylori. Southeast Natur. 2014, 13, 735–743. [Google Scholar] [CrossRef]
- Högland, J. Evolutionary Conservation Genetics; Oxford University Press: New York, NY, USA, 2009. [Google Scholar]
- Hatcher, H.R.; Moore, M.J.; Orth, D.J. Spawning observations of Clinch Dace: Comparison of Chrosomus spawning behavior. Am. Midl. Nat. 2017, 177, 318–326. [Google Scholar] [CrossRef]
- Moritz, C. Conservation units and translocations: Strategies for conserving evolutionary processes. Hereditas 1999, 130, 217–228. [Google Scholar] [CrossRef]
- Palsboll, P.J.; Berube, M.; Allendorf, F.W. Identification of management units using population genetic data. Trends Ecol. Evol. 2007, 22, 11–16. [Google Scholar] [CrossRef]
- Whiteley, A.R.; Fitzpatrick, S.W.; Funk, W.C.; Tallmon, D.A. Genetic rescue to the rescue. Trends Ecol. Evol. 2015, 30, 42–49. [Google Scholar] [CrossRef]
- Frankham, R.; Ballou, J.D.; Eldridge, M.D.; Lacy, R.C.; Ralls, K.; Dudash, M.R.; Fenster, C.B. Predicting the probability of outbreeding depression. Cons. Biol. 2011, 25, 465–475. [Google Scholar] [CrossRef] [PubMed]
- Ryman, N.; Laikre, L. Effects of supportive breeding on the genetically effective population size. Cons. Biol. 1991, 5, 325–329. [Google Scholar] [CrossRef]
- Miller, L.M.; Kapuscinski, A.R. Genetic guidelines for hatchery supplementation programs. In Population Genetics: Principles and Applications for Fisheries Scientists; Hallerman, E., Ed.; American Fisheries Society: Bethesda, MD, USA, 2003; pp. 329–355. [Google Scholar]
- George, A.L.; Kuhajda, B.R.; Williams, J.D.; Cantrell, M.A.; Rakes, P.L.; Shute, J.R. Guidelines for propagation and translocation for freshwater fish conservation. Fisheries 2009, 34, 529–545. [Google Scholar] [CrossRef]


| Locus | Primers (5′–3′) | Core Motif | Allele Size Range | Reference |
|---|---|---|---|---|
| CtoA247 | F-6FAM:TGCAAACATATAAACTGAAACAAGG | (ATC)7 | 160–166 | [13] |
| R:GCAGGTATATTCCCAGCC | ||||
| LleC90 | F-PET:TCAGACACAACTAACCGACC | (TC)15GG(TC)3 | 218–228 | [12] |
| R:GGCGCTGTCCAGAACTGA | ||||
| BLI_84 | F-6FAM:CATTACTACGGAACCACAT | (AC)4N24(CA)9 | 180 | [11] |
| R:GCGAAAAGGAAAGAGACTGA | ||||
| BLI153 | F-6FAM:GCACAGCTCTAATCGGTCACT | (AC)20 | 216–212 | [11] |
| R:TATGGTCAAACACGGGTCAA | ||||
| Lco3 | F-VIC:GCAGGAGCGAAACCATAAAT | (TG)9 | 246–262 | [16] |
| R:AAACAGGCAGGACACAAAGG | ||||
| Lsou8 | F-PET:GCGGTGAACAGGCTTAACTC | (GT)17 | 170–176 | [19] |
| R:TAGGAACGAAGAGCCTGTGG | ||||
| Rhca20 | F-NED:CTACATCTGCAAGAAAGGC | (GA)17 | 87–91 | [20] |
| R:CAGTGAGGTATAAAGCAAGG | ||||
| CypG30 | F-VIC:GAAAAACCCTGAGAAATTCAAAAAGA | (TAGA)7 | 280–240 | [14] |
| R:GGACAGGTAAATGGATGAGGAGATA | ||||
| MFW1 | F-NED:GTCCAGACTGTCATCAGGAG | (GT)14N3(GA)4 | 172 | [23] |
| R:GAGGTGTACACTGAGTCACGC |
| Stream | N | Polymorphic Loci | H0 | He | NA | Range (bp) | M-Ratio | Sig H-W | Bonferroni α |
|---|---|---|---|---|---|---|---|---|---|
| Big Lick Creek | 106 | 6 | 0.29 | 0.28 | 3.33 | 9.00 | 0.37 | 1/6 | 0.010 |
| Greasy Creek | 6 | 4 | 0.42 | 0.52 | 3.00 | 10.00 | 0.36 | 0/4 | 0.012 |
| Hart Creek | 63 | 5 | 0.36 | 0.42 | 3.80 | 10.80 | 0.40 | 1/5 | 0.010 |
| Hurricane Fork | 40 | 4 | 0.39 | 0.36 | 3.50 | 11.00 | 0.40 | 1/4 | 0.012 |
| Lewis Creek | 3 | 2 | 0.50 | 0.57 | 2.00 | 6.00 | 0.31 | 0/2 | 0.025 |
| Middle Creek | 16 | 3 | 0.35 | 0.42 | 3.67 | 13.33 | 0.39 | 0/3 | 0.017 |
| Pine Creek | 32 | 6 | 0.31 | 0.28 | 3.00 | 8.00 | 0.47 | 1/6 | 0.008 |
| Stream | N | Ne | 95% Confidence Interval |
|---|---|---|---|
| Big Lick Creek | 106 | 40.3 | 14.1–177.9 |
| Greasy Creek | 6 | 58.1 | 0.5–∞ |
| Hart Creek | 63 | 491.9 | 27.1–∞ |
| Hurricane Fork | 40 | 23.5 | 3.3–∞ |
| Lewis Creek | 3 | ∞ | ∞–∞ |
| Middle Creek | 16 | ∞ | 9.4–∞ |
| Pine Creek | 32 | 60.7 | 4.0–∞ |
| Stream | FIS | p (Random FIS ≥Observed FIS) | Avg Fi (95%CI) |
|---|---|---|---|
| Big Lick Creek | −0.023 | 0.732 | 0.227 (0.095–0.348) |
| Greasy Creek | 0.212 | 0.126 | 0.075 (0.000–0.249) |
| Hart Creek | 0.134 | 0.005 | 0.316 (0.003–0.505) |
| Hurricane Fork | −0.095 | 0.469 | 0.012 (0.000–0.037) |
| Lewis Creek | 0.143 | 0.734 | 0.418 (0.000–0.819) |
| Middle Creek | 0.163 | 0.091 | 0.103 (0.000–0.201) |
| Pine Creek | −0.090 | 0.956 | 0.088 (0.000–0.196) |
| Big Lick Creek | Greasy Creek | Hart Creek | Hurricane Fork | Lewis Creek | Middle Creek | |
|---|---|---|---|---|---|---|
| Big Lick Creek | - | |||||
| Greasy Creek | 0.186 | - | ||||
| Hart Creek | 0.305 | 0.310 | - | |||
| Hurricane Fork | 0.105 | 0.299 | 0.272 | - | ||
| Lewis Creek | 0.243 | 0.257 | 0.416 | 0.272 | - | |
| Middle Creek | 0.157 | 0.207 | 0.313 | 0.335 | 0.526 | - |
| Pine Creek | 0.191 | 0.175 | 0.337 | 0.371 | 0.462 | 0.036 |
| Source of Variation | Sum of Squares | Variance Components | Percentage of Variation |
|---|---|---|---|
| Among populations | 125.008 | 0.030259 | 25.99 |
| Among individuals within populations | 227.857 | 0.01789 | 1.54 |
| Within individuals | 224.5 | 0.84398 | 72.48 |
| Total | 577.365 | 1.16446 |
Disclaimer/Publisher’s Note: The statements, opinions and data contained in all publications are solely those of the individual author(s) and contributor(s) and not of MDPI and/or the editor(s). MDPI and/or the editor(s) disclaim responsibility for any injury to people or property resulting from any ideas, methods, instructions or products referred to in the content. |
© 2023 by the authors. Licensee MDPI, Basel, Switzerland. This article is an open access article distributed under the terms and conditions of the Creative Commons Attribution (CC BY) license (https://creativecommons.org/licenses/by/4.0/).
Share and Cite
Bourquin, R.; Moore, M.J.; Orth, D.J.; Hallerman, E.M. Conservation Genetics of Clinch Dace Chrosomus sp. cf. saylori. Fishes 2023, 8, 365. https://doi.org/10.3390/fishes8070365
Bourquin R, Moore MJ, Orth DJ, Hallerman EM. Conservation Genetics of Clinch Dace Chrosomus sp. cf. saylori. Fishes. 2023; 8(7):365. https://doi.org/10.3390/fishes8070365
Chicago/Turabian StyleBourquin, Rebecca, Michael J. Moore, Donald J. Orth, and Eric M. Hallerman. 2023. "Conservation Genetics of Clinch Dace Chrosomus sp. cf. saylori" Fishes 8, no. 7: 365. https://doi.org/10.3390/fishes8070365
APA StyleBourquin, R., Moore, M. J., Orth, D. J., & Hallerman, E. M. (2023). Conservation Genetics of Clinch Dace Chrosomus sp. cf. saylori. Fishes, 8(7), 365. https://doi.org/10.3390/fishes8070365