Article

A Comparison of the Physiological Responses to Heat Stress of Two Sizes of Juvenile Spotted Seabass (Lateolabrax maculatus)

1
Fisheries College, Jimei University, Xiamen 361021, China
2
Fujian Provincial Key Laboratory of Marine Fishery Resources and Eco-Environment, Xiamen 361021, China
*
Author to whom correspondence should be addressed.
Fishes 2023, 8(7), 340; https://doi.org/10.3390/fishes8070340
Submission received: 19 May 2023 / Revised: 23 June 2023 / Accepted: 25 June 2023 / Published: 28 June 2023
(This article belongs to the Section Physiology and Biochemistry)

Abstract

:
Temperature affects the metabolism of fish, and fish of different sizes have different tolerances to temperature. The aim of this experiment was to compare two sizes of juvenile spotted seabass, Lateolabrax maculatus (with average weights of 57.91 ± 11.57 g and 13.92 ± 2.77 g, respectively) for changes in physiological, biochemical, and molecular mechanisms under acute heat stress. Experimental fish were exposed to acute temperature increasing from 23 °C to 32 °C, and the mortality rate was noted at various heat stress exposures (0, 3, 6, 12, 24, 48, and 72 h). Moreover, serum and liver were obtained before and after heat stress. The activities of aspartate aminotransferase (AST), alanine aminotransferase (ALT), superoxide dismutase (SOD), malondialdehyde (MDA), lactic acid (LD), lactate dehydrogenase (LDH), glucose, and hepatic glycogen, and the expression of heat shock proteins (HSP70, HSP90) and apoptosis-related genes (BAX, caspase-3) in two sizes of spotted seabass were measured. Results showed that the contents of AST, ALT, SOD, MDA, LD, and glucose as well as the expression level of BAX and mortality were higher in large spotted seabass than in small spotted seabass within 12 h. These results indicate that the large spotted seabass had higher levels of oxidative stress and more severe liver damage, resulting in a higher mortality. Furthermore, the HSPs expression level of small spotted seabass was higher and the mortality was lower than that of large spotted seabass. Therefore, we considered that the large spotted seabass has lower levels of HSPs expression, causing their physiological response to be elevated to resist heat stress. In conclusion, spotted seabass with larger size has a poorer tolerance to heat stress compared with spotted seabass with smaller size. The smaller fish size was possibly resistant to heat stress by regulating the HSPs expression level in a more active extent.
Key Contribution: The expression of constitutive HSPs of small spotted seabass was higher than that of large spotted seabass.

Graphical Abstract

1. Introduction

Temperature is the “abiotic master control factor” for aquatic organisms, affecting their behavior, physiology, and distribution [1]. The global mean water temperature has increased by 0.6 °C since the 19th century, and it is projected that ocean temperatures will rise by 2–5 °C within the next century [2]. Based on this situation, it is anticipated that exposure of aquatic organisms to elevated temperatures will inevitably occur [2,3]. Fish are aquatic ectotherms that exhibit high sensitivity to fluctuations in water temperature. Fish can adapt to ambient temperature by balancing their behavioral, physiological, biochemical, and molecular processes. However, exposure to temperatures outside of their physiological tolerance range may compromise the adaptive capabilities of fish, resulting in reduced growth performance and feed utilization, compromised immune system and reproduction, and increased mortality risk [4,5,6,7]. Therefore, it is important to study the temperature response mechanisms of fish.
Fish are ectothermal animals, and water temperature has a profound effect on their physiological metabolism and behavior [8]. Fish produce more endogenous reactive oxygen species (ROS) when ambient temperatures exceed their optimal temperature range, and this excess ROS damages vital biomolecules, including DNA, proteins, and lipids as well as initiates a chain of events that impairs cellular processes [9]. In response to these damages, cells have developed antioxidant defense systems of varying degrees to resist oxidative stress and maintain cellular redox homeostasis, preventing or repairing the resulting damages [10]. For instance, the antioxidant enzyme systems (SOD and CAT) are stimulated to counteract the damage caused by reactive oxygen species due to elevated temperatures [10]. Furthermore, when under stress, there is an acceleration in the rate of glycogen conversion to glucose and an increase in lactic acid or lactate dehydrogenase content as a response to the body’s energy demands [11,12,13]. Moreover, the liver is the main organ of fish metabolism and detoxification and is particularly vulnerable to stress. The functional status of the liver is worth studying as it can serve as a target organ for assessing the link between stressors and the organism [14]. Alanine aminotransferase (ALT) and aspartate aminotransferase (AST) are mainly found in the liver, and damage to the liver causes them to be released into the blood in large amounts [15]. Therefore, the levels of ALT and AST are important indicators to check whether liver function is normal [15,16,17].
Heat shock proteins (HSPs) are molecular chaperones and have diverse functions in various species, whose main functions are maintenance of protein structure and folding, supporting and repairing damaged cytoskeleton elements, assisting in the production of intra-cellular proteins, and hormone receptors [18,19,20]. Under stressful conditions, the expression of HSPs is upregulated, and they participate in various cellular programs aimed at counteracting the detrimental effects of stress, such as oxidative stress and apoptosis [21]. HSP70 and HSP90 play crucial roles in signal transduction, protein targeting, and degradation throughout the cell cycle, while also mitigating heat stress-induced oxidative damage by maintaining protein homeostasis [22]. Furthermore, HSP70 and HSP90 have been reported to be engaged in anti-apoptosis during oxidative stress [21,23,24]. Apoptosis is a homeostasis mechanism that maintains a cell number and occurs as a defense mechanism against external stimuli [25]. Exposure to temperatures beyond the cell’s threshold may cause damage to lipids, proteins, and DNA. This damage may also lead to mitochondrial disorganization, and thereby trigger the release of cytochrome C. The released cytochrome C interacts with apoptotic protease activating factor-1 (Apaf-1) and deoxyadenosine triphosphate (dATP) to activate the promoter caspase-9, which then activates the effector caspase-3 and finally causes cell death [26]. Additionally, cytochrome C is regulated by the B-cell lymphoma-2 (BCL2) family of pro-apoptotic proteins, such as BAX [26]. Therefore, it is essential to study the changes in apoptosis and heat stress protein-related genes to determine the resistance of the organism to stress.
The spotted seabass has a wide distribution in coastal regions of China, North Korea, and Japan. It can tolerate a wide range of salinity levels and temperatures [27]. It has a temperature resistance range of 0–38 °C and an optimum growth temperature of 16–27 °C, and its feeding intensity decreases below 12 °C and increases above 28 °C [28,29]. Spotted seabass has been widely cultivated as an economic fish, and its output is among the highest among saltwater fish. Recently, the intensive and high-density cultivation mode, and the long duration of high temperatures in summer have increased oxidative stress levels in fish, leading to a higher risk of death [30,31]. Therefore, a comprehensive understanding of the heat stress response mechanism in spotted seabass is imperative, as current information in this respect remains limited. Shen et al. [32] studied the effect of temperature on the starvation metabolism of spotted seabass, and Shin et al. [33] reported the effect of temperature on heat stress protein of spotted seabass. Dahlke et al. [34] reported that the thermal tolerance was different at distinct life stages, and the thermal response of narrow-heated fish was higher than that of eurythermic fish. Currently, there is no report on the response mechanisms of different-sized seabass to high temperatures under the same heat stress conditions. For this reason, the present study aimed to compare the response mechanisms of spotted seabass of different sizes to heat stress. The findings provide theoretical guidance for healthy culture and offer new insights into the physiological and molecular compensation mechanisms induced by heat stress in spotted seabass.

2. Materials and Methods

2.1. Experimental Fish and Rearing Condition

This experiment was conducted at Jimei University’s Fisheries College, using juvenile spotted seabass obtained from a commercial farm (Zhangpu Jin Xing Farm, Zhangzhou, Fujian, China). The fish were initially reared at a normal temperature of 23 °C for 7 days in 1200 L tanks, receiving twice-daily feedings. After acclimation, 240 large spotted seabass (with an average weight of 57.91 ± 11.57 g) were randomly allocated to two independent recirculating systems, namely, the large spotted seabass control group and the large spotted seabass stress group. Similarly, 240 small spotted seabass (with an average weight of 13.92 ± 2.77 g) were allocated to two independent recirculating systems, designated as the small spotted seabass control group and small spotted seabass stress group. Each group consisted of four replicates, with 30 fish per replicate. Each recirculating system was equipped with four tanks, each with a volume of 200 L. Before the experiment started, the fish acclimatized to the environment for 7 days in 200 L tanks and were fed two times per day. Water quality parameters were maintained at dissolved oxygen >5.2 mg/L, temperature 23 ± 0.3 °C, pH 7.2 ± 0.5 units, salinity 6.2 ± 1 ppt, ammonium-nitrogen <0.2 mg/L, and nitrite <0.08 mg/L. All the values were measured using HQd Portable meter and DR900 (HACH Co, New York, NY, USA).

2.2. Heat Stress Test and Sample Collection

The day before the trial began, fish were fasted. Before the temperature increased, 12 large spotted seabass and 12 small spotted seabass were collected as control samples from the respective control groups (23 °C). According to unpublished pilot experiments validated by the supported literature [28,32], 32 °C was chosen to induce heat stress. The water temperature of each stress group increased from 23 °C to 32 °C at a rate of 3 °C/h. At 0 h, 3 h, 6 h, 12 h, 24 h, 48 h, and 72 h after reaching the heat stress temperature, fish mortality was recorded and samples were collected from each stress group. Three live fish were randomly selected from each tank in each stress group for sampling at 0 h and 3 h, respectively. Since 45% of large spotted seabass died within 6 h, two fish were collected from each tank in each stress group at five time points: 6 h, 12 h, 24 h, 48 h, and 72 h, respectively. During sampling, the fish were first anesthetized by 150 mg/L eugenol (Shanghai Reagent, Shanghai, China) aqueous solution. Blood samples were collected from each fish using tail vein sampling. A 1 mL sterile syringe was inserted between the anal fin and the lateral line of the fish to draw a blood sample. Once enough blood had been collected, the syringe was released to maintain an equilibrium of air pressure and prevent hemolysis. The blood samples were gradually transferred into a sterile centrifuge tube with a volume of 1.5 mL and allowed to stand at 4 °C for 24 h. The blood samples were centrifuged at 4 °C and 836× g for 10 min to obtain serum, which was subsequently stored at −80 °C until further analysis. After dissection, the liver was excised, rinsed with phosphate-buffered saline (pH 7.5), and then aseptically transferred to a sterile cryovial for rapid freezing in liquid nitrogen. The sample was stored at −80 °C until further experimentation.
During stress, fish whose gill covers stopped moving, had no eye movement, and did not respond to mechanical stimulation were considered dead and removed from the tank. All tanks used in the experiment were equipped with coolers and heaters to maintain water temperature accurately. The water temperature was monitored every 30 min using a mercury thermometer and deviation was maintained below 0.3 °C. Fish were not fed during the heat stress period.

2.3. Methods for the Detection of Biochemical Indicator

Liver tissues were homogenized in 10 volumes (v/w) of ice-cold, 0.86% normal saline in an ice bath, respectively with a homogenizer (FSH-2A, Jintan, China), and then centrifuged at 3000× g for 10 min at 4 °C to obtain the supernatant, which was used to measure different enzyme levels. This serum was mixed and used directly for the detection of different enzyme activities. All enzyme activities were measured using kits from the Nanjing Jiancheng Bioengineering Institute (Item: ALT: C009-2-1; AST: C010-2-1; ALB: A028-2-1; SOD: A001-3; MDA: A003-1; LD: A019-2-1; LDH: A020-2; Glucose: A154-1-1; Glycogen: A043-1-1).

2.4. RNA Extraction and Reverse Transcription

The total RNA of each sample was extracted from 10 to 20 mg of liver using commercial kits (RC101, Nanjing Vazyme Biotech Co., Ltd., Nanjing, China). During operation, all consumables and instruments used were maintained to be free of RNase. Thereafter, the integrity of each RNA sample was tested by 1% agarose gel electrophoresis, and the concentration and contamination were detected by micro spectrophotometer (NANODROP2000, Thermo Scientific, Waltham, MA, USA). After passing the quality inspection, commercial kits (R323-01, Nanjing Vazyme Biotech Co., Ltd., Nanjing, China) were used for reverse transcription of RNA to obtain cDNA, which was stored at −80 ℃.

2.5. Real-Time Quantitative PCR (RT-qPCR) Reaction

Information on the primers used in the RT-qPCR reaction is shown in Table 1. RT-qPCR was performed by the SYBR Green I chimeric fluorescence method with commercial kits (Q711-02/03, Nanjing Vazyme Biotech Co., Ltd., China) for quantitative expression analysis of HSP70, HSP90, BAX, and caspase-3 mRNA on a fluorescence qPCR instrument. RT-qPCR was performed by the SYBR Green I chimeric fluorescence method with a commercial kit (LC480, Roche, Basel, Switzerland). Three replicates were set for each sample. For each sample, reactions (20 μL) were set on a 96-well plate by mixing 2 μL of template cDNA, 10 μL of 2×concentrated SYBR Green Mix as the fluorescent intercalating agent, 0.4 μL of forward and reverse primer (10 μM), and finally the addition of 7.2 μL RNase-free ddH2O. The thermal cycling program was as follows: Pre-degeneration at 95 °C for 30 s, followed by 40 cycles of 10 s at 95 °C, 20 s at 60 °C, and 20 s at 72 ℃. Fluorescence was monitored at the end of each cycle, while beta-actin (β-actin) was used as a housekeeping gene to standardize the results (Shin et al., 2018). The relative expression levels of each gene among groups were calculated by the 2−ΔΔCt method.

2.6. Data Statistics and Analysis

Statistical analysis of data was performed using Excel 2021 v2305, build 16.0.16501.20074 (Microsoft Corp, Redmont, WA, USA) and SPSS 21 (International Business Machines Corp, Armonk, NY, USA), and all data were expressed as the mean ± standard deviation. Two-way ANOVA was used to analyze the effects of size, time, and their interactive effects on the physiological parameters. One-way ANOVA was used to analyze the influence of size and time on each variable. Then, Duncan’s multiple comparisons and Student’s t-test were used to analyze differences in the same-size seabass at different times of heat stress, and differences in distinct sizes of seabass at the same time of heat stress. The differences were considered significant at p < 0.05. Plots were created using Origin 2021 (Origin Lab., Northampton, MA, USA).

3. Results

3.1. Mortality

Figure 1 depicts the death situation of various sizes of seabass after 72 h of heat stress (32 °C). The mortality of the large spotted seabass group was higher than that of the small spotted seabass group. In the large spotted seabass group, 19 (15.8%) and 36 (30%) died rapidly at 3 h and 6 h after heat stress, respectively. In the small spotted seabass group, one (0.8%) died at 12 h and 72 h after heat stress, and three died at 48 h (2.5%) after heat stress.

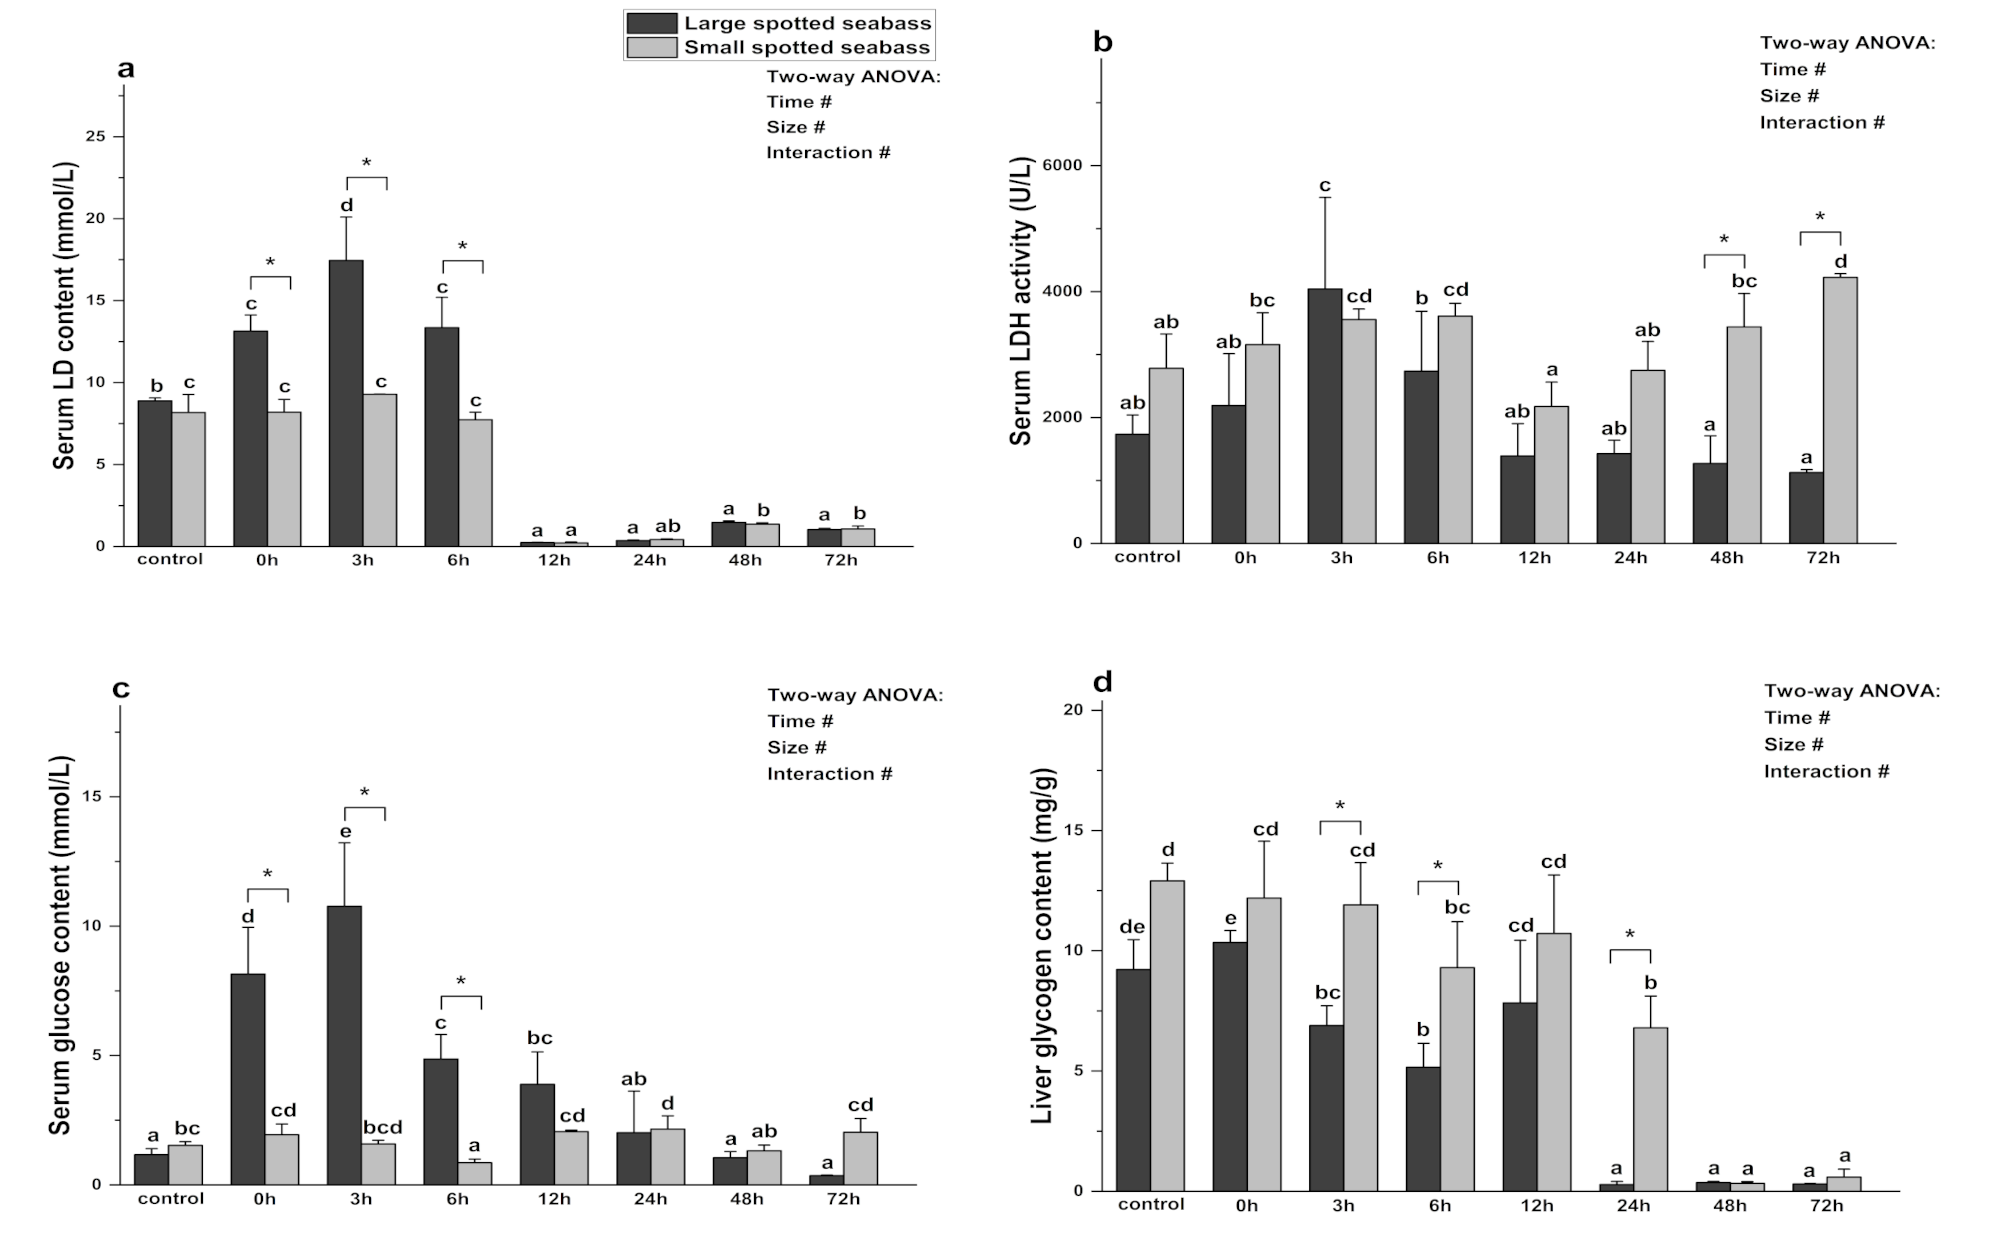
3.2. The Effect of Heat Stress on Index of Liver Function of Spotted Seabass

As illustrated in Figure 2, the activities of serum AST and ALT were significantly affected by size, heat stress time, and their interaction (p < 0.05). Under the same size and different heat stress times, ALT activity in large spotted seabass significantly increased at 3 h and 6 h, peaking at 3 h (p < 0.05), and returning to normal levels after 12 h (p > 0.05). The AST activity increased significantly after heat stress, peaking at 12 h (p < 0.05), and returning to the baseline level after 48 h (p > 0.05). Compared to the state before heat stress, small spotted seabass exhibited a significant increase in AST activity at 6 h of heat stress and peaked at 72 h (p < 0.05). Its ALT activity significantly decreased at 3 h post heat stress (p < 0.05), followed by a significant increase at 24 h and reaching its peak at 48 h (p < 0.05).
Under the same heat stress time and different sizes, except for 24 h and 48 h, the ALT activity of large spotted seabass was higher than that of small spotted seabass, and the difference was significant at 3 h and 6 h (p < 0.05). The AST activity of large spotted seabass was higher than that of small spotted seabass after 24 h of heat stress, with significant differences at 3, 6, and 12 h (p < 0.05). However, the AST activity of small spotted seabass was significantly higher than that of large spotted seabass at 48 h and 72 h (p < 0.05).

3.3. The Effect of Heat Stress on Antioxidant Indexes in Spotted Seabass Serum and Liver

As shown in Figure 3, size and heat stress time significantly affected the activities of serum SOD and MDA (p < 0.05). Under the same size and different heat stress times, the serum SOD activity of large spotted seabass increased from 0 h to 3 h, peaked at 3 h (p < 0.05), gradually decreased to the normal level, and then increased again after 24 h (p < 0.05). The MDA activity rose sharply at 24 h (p < 0.05), and then returned to the basal level (p > 0.05). The serum SOD activity of small spotted seabass increased significantly at 0 h and 3 h after heat stress (p < 0.05), and then returned to normal levels (p > 0.05). The MDA activity gradually increased after heat stress, with significant differences at 24 h and 48 h (p < 0.05), reached its peak at 48 h (p < 0.05), and subsequently returned to normal level (p > 0.05). Under the same heat stress time and different sizes, except for 72 h, the SOD activity of small spotted seabass was always lower than that of large spotted seabass, and the difference was significant at 24 h (p < 0.05). The MDA activity of large spotted seabass consistently exceeded that of small spotted seabass, with a noticeable difference at 24 h (p < 0.05).
In the liver, SOD and MDA activities were significantly affected (p < 0.05) by size, heat stress time, and their interaction (Figure 3). At the same size and different heat stress times, the SOD activity of large spotted seabass increased significantly within 6 h of heat stress (p < 0.05), peaked at 3 h, and returned to normal state after 12 h (p > 0.05). Its MDA activity increased at 3 h, 6 h, and 48 h of heat stress and peaked at 48 h, and then decreased to normal level (p > 0.05). The SOD activity of small spotted seabass peaked at 3 h of heat stress, and then gradually decreased. Its MDA activity decreased significantly at 12 h (p < 0.05), and then gradually returned to normal level (p > 0.05). Under the same heat stress time and different sizes, the MDA and SOD activities were consistently higher in large spotted seabass than small ones. Significant differences were observed in SOD activity at 3 h and MDA activity at 48 h (p < 0.05).

3.4. The Effect of Heat Stress on Spotted Seabass Energy Metabolism

As shown in Figure 4, size, heat stress time, and their interaction had significant effects on LD, LDH, glucose, and liver glycogen content (p < 0.05). Within each size group, the LD content of large spotted seabass exhibited a significant increase from 0 to 6 h after stress (p < 0.05) and then decreased significantly after 12 h (p < 0.05). Its LDH activity gradually increased after heat stress, peaked at 3 h (p < 0.05), and then gradually returned to normal level (p > 0.05). The glucose content of large spotted seabass increased significantly (p < 0.05) from 0 h to 3 h after heat stress, and then gradually decreased. Its liver glycogen content slightly increased at 0 h of heat stress, but significantly decreased thereafter except for 12 h (p <0.05). The LD content of small spotted seabass remained stable from 0 to 6 h (p > 0.05), but exhibited a significant decrease after 12 h (p < 0.05). Its LDH activity gradually increased after heat stress, and the difference was significant at 3 h and 6 h (p < 0.05), then gradually increased and peaked at 72 h (p < 0.05). The glucose content of small spotted seabass decreased significantly at 6 h of heat stress (p < 0.05), and then gradually increased to a peak at 24 h before returning to normal levels (p > 0.05). After heat stress, the liver glycogen content of small spotted seabass decreased significantly at 6 h, 24 h, 48 h, and 72 h (p < 0.05).
Under the same heat stress time and different sizes, the LD content of large spotted seabass was higher than that of small spotted seabass at 0 h, 3 h, 6 h, 12 h, and 48 h after stress, and the difference was significant at 0–6 h (p < 0.05). In addition, except for 3 h, the LDH activity of small spotted seabass was higher than that of large spotted seabass, and the difference was significant at 48 h and 72 h (p < 0.05). The glucose content of large spotted seabass was higher than that of small spotted seabass at 0–12 h of heat stress, and the difference was significant at 0–6 h (p < 0.05). The liver glycogen content of small spotted seabass was higher than that of large spotted seabass, and the difference was significant at 3 h and 24 h (p < 0.05).

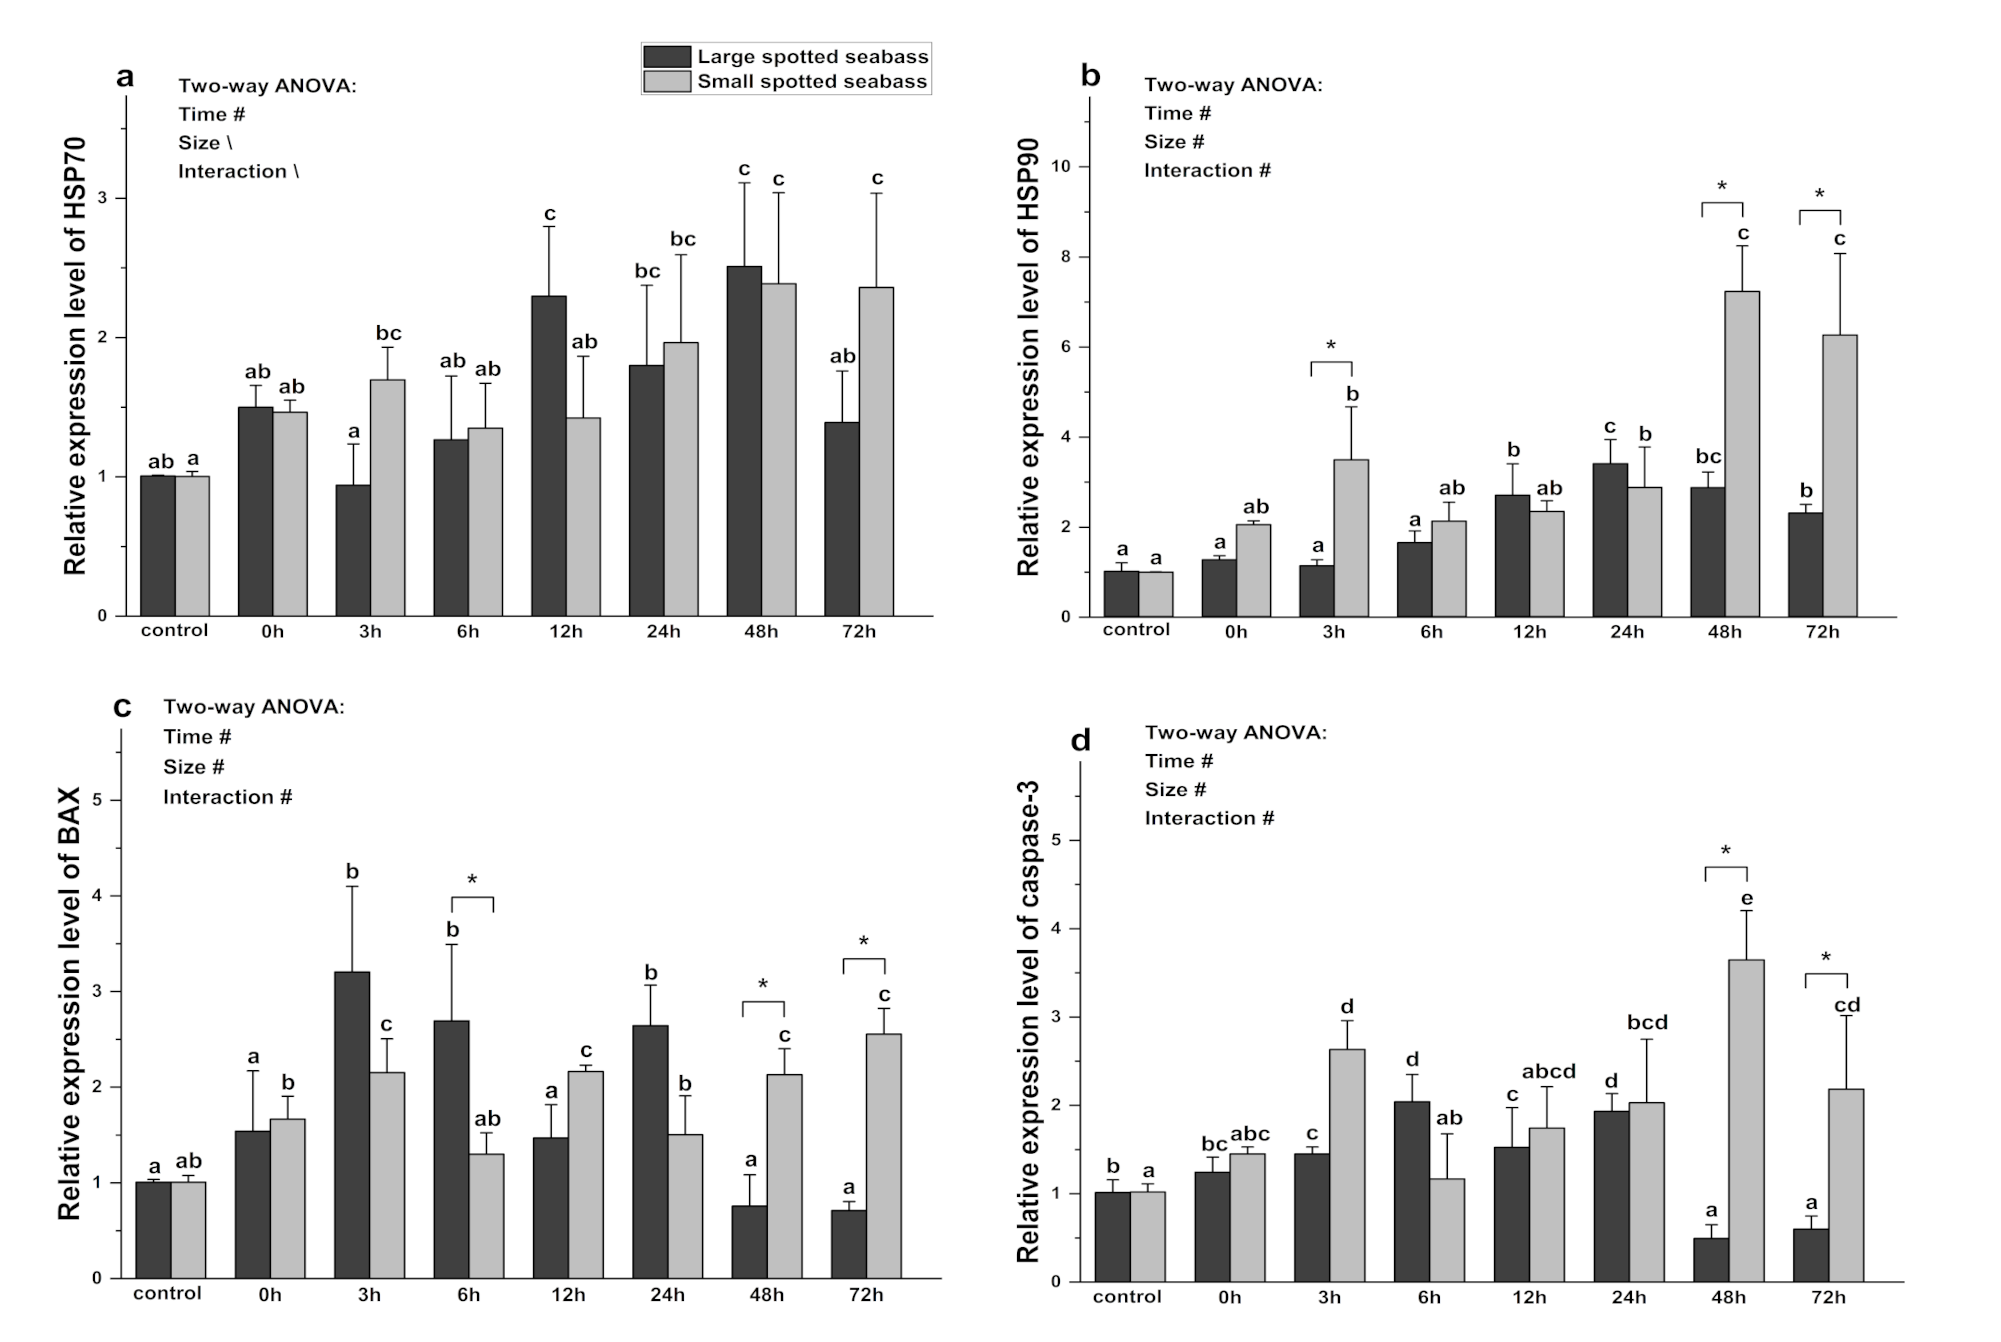
3.5. The Effect of Heat Stress on Gene Expression of HSP70, HSP90, Caspase-3, and BAX in Spotted Seabass

As shown in Figure 5, the gene expression of HSP90, caspase-3, and BAX in the spotted seabass was significantly affected by size, heat stress duration, and their interaction (p < 0.05). The heat stress time had a significant effect on HSP70 gene expression (p < 0.05). Under the same size and different stress times, the HSP70 mRNA level of large spotted seabass increased at 0 h and 48 h (p < 0.05). The HSP90 mRNA level gradually increased after 12 h (p < 0.05). The BAX mRNA level increased gradually at 3 h, 6 h, and 24 h (p < 0.05), while the other time points remained at normal levels (p < 0.05). The caspase-3 mRNA level reached its peak at 6 h (p < 0.05), then began to decline, and increased significantly at 48 h and 72 h (p < 0.05). The HSP70 mRNA level of small spotted seabass increased after heat stress, and was significantly different at 24 h and 72 h (p < 0.05). Meanwhile, the HSP90 mRNA level was significantly increased at 3, 24, 48, and 72 h (p < 0.05). The BAX mRNA level in small spotted seabass was significantly increased at 3, 12, 48, and 72 h (p <0.05). Its caspase-3 mRNA level increased after heat stress and was significantly higher than those before stress at 3, 48, and 72 h (p < 0.05).
Under the same heat stress time and different sizes, the HSP70 mRNA level of large spotted seabass was higher than that of small spotted seabass at 0 h, 12 h, and 48 h of heat stress. Except for 12 h and 24 h, the HSP90 mRNA level of small spotted seabass was higher than that of seabass, and the difference was significant at 3, 48, and 72 h (p < 0.05). The BAX mRNA level in large spotted seabass was higher than that of small spotted seabass at 3, 6, and 24 h of heat stress (p <0.05), and was lower than that of small spotted seabass at other time points, and was significantly different at 48 h and 72 h (p < 0.05). The level of caspase-3 mRNA in large spotted seabass was higher than that in small spotted seabass at 6 h of heat stress, and lower than that in small spotted seabass at other time points, and the difference was significant at 48 h and 72 h (p < 0.05).

4. Discussion

In the context of global warming, fish may experience the threat of high temperatures. The temperature exceeding the tolerance threshold of the fish body will lead to an increase in the oxidative stress level of the fish body, which will affect the health of the fish [37]. However, different sizes of fish have different temperature tolerances and respond differently to heat stress [37,38]. In this test, we compared the levels of oxidative stress and apoptosis in the liver and energy utilization of two sizes of juvenile spotted seabass under acute heat stress. We measured the changes in AST, ALT, SOD, MDA, LDH, LDH, glucose, liver glycogen, and the expression of heat stress proteins (HSP70, HSP90) and apoptosis-related genes (BAX, caspase-3) in two sizes of spotted seabass.
ALT and AST are secreted and expressed by the liver and are usually released into the blood in small amounts [16]. Previous studies on puffer fish Takifugu obscurus and Wuchang bream Megalobrama amblycephala Yih showed that the activities of ALT and AST were increased sharply after heat stress, and the liver was damaged [39,40]. In this study, the levels of ALT and AST in large spotted seabass increased significantly at 3–12 h, whereas those in small spotted seabass increased significantly at 24–72 h. The results indicated that large spotted seabass exhibit severe liver damage within 6 h, while small spotted seabass show similar damage after 24 h.
In general, heat stress can stimulate the production of endogenous ROS, and free radicals can increase and become toxic to cells, thus inducing oxidative stress [41]. Oxidative stress prompts organisms to initiate antioxidant defense mechanisms, thereby maintaining fish homeostasis and enhancing fish resistance. SOD is an important antioxidant enzyme, can remove generated superoxide free radicals and peroxides by oxidative metabolism, and reduce the damage of peroxides in the body [42]. MDA is the product of lipid peroxidation, and its content can not only directly reflect the degree of lipid peroxidation, but also indirectly reflect the degree of oxidative damage in the body [43]. Previous studies have shown that high temperatures can increase the activity of antioxidant enzymes in the body, such as in Antarctic fish, rainbow trout Oncorhynchus mykiss, and African catfish Clarias gariepinus [41,42,43]. In our study, after heat stress, the serum SOD activity of large spotted seabass increased at 0 h, 3 h, and 24 h, and MDA content in serum increased significantly at 24 h. The serum SOD activity of small spotted seabass increased significantly only within 3 h, and MDA increased significantly at 24 h and 48 h. This result shows that the two sizes of spotted seabass all experienced oxidative stress within 3 h. In response to this reaction, the activity of antioxidant enzymes in the fish increased to eliminate excess-free radicals. With time, the free radicals in the body of large spotted seabass accumulated again at 24 h, and the antioxidant enzymes increased again. The MDA level in small spotted seabass significantly increased at 24 h and 48 h, while SOD activity did not show a corresponding increase. It is speculated that the free radicals in small spotted seabass accumulate largely after 24 h, but it has not reached the threshold for the body to start the antioxidant enzyme defense, or increased other antioxidant enzymes, such as CAT. The specific situation needs further study. In addition, the SOD activity of the large spotted seabass in the liver increased significantly from 0 h to 6 h, and the change was not significant thereafter. It was confirmed that the liver of large spotted seabass was damaged after heat stress, and the MDA activity did not change significantly within 24 h of heat stress, which was related to the increase in SOD activity, whereas it increased significantly within 48 h, which is consistent with the antioxidant defense in the serum. The SOD activity in the liver of the small spotted seabass did not change significantly at the initial stage of heat stress, but decreased significantly after 12 h, and the MDA activity maintained a steady state. This indicates that the liver of the small spotted seabass did not sustain significant damage. On the other hand, we discovered that the large spotted seabass always had higher SOD and MDA activities than the small spotted seabass in serum and liver, implying that the oxidative stress intensity of the large spotted seabass was greater than that of the small spotted seabass under heat stress at 32 °C.
When fish respond to stress, they trigger the body’s self-protection mechanism, which requires significant metabolic energy to maintain body homeostasis. LD and LDH are related metabolites of anaerobic respiration. For fish that cannot tolerate hypoxia, long-term LD production in their bodies will lead to metabolic acidosis, protein denaturation, enzyme activity stop, and eventually death [44]. High levels of lactic acid indicate high levels of anaerobic metabolism [45]. Under heat stress, LD or LDH levels in olive flounder Paralichthys olivaceus, turbot Scophthalmus maximus, brook trout Salvelinus fontinalis, and pearl oyster Pinctada fucata are elevated, and anaerobic respiration is enhanced [46,47,48]. In the present study, the LD and LDH levels of large spotted seabass increased from 0 h to 6 h after heat stress at 32 °C. This suggests that the aerobic metabolism of large spotted seabass decreased within 6 h after heat stress, while the anaerobic metabolism was enhanced to maintain the body’s energy supply. The LD content of the small spotted seabass basically maintained a steady state from 0 h to 6 h, and the LDH content continued to increase after heat stress, and then gradually increased after a slight decrease at 12 h, indicating that heat stress had little effect on the respiratory metabolism of the small spotted seabass. The LD content of the two sizes of spotted seabass decreased significantly after 12 h, which may indicate that heat stress accelerated the sugar production rate to help fish restore their energy storage to the pre-stress level. LDH is an essential enzyme for energy metabolism in the body, which catalyzes the conversion between pyruvate and lactic acid depending on substrate concentration [48]. The LDH content of small spotted seabass increased after 24 h but LD did not increase, which may be related to the rate of pyruvate generation. On the other hand, we observed differences in the levels of LD and LDH between the two sizes of spotted seabass after heat stress. The LD level of the small spotted seabass was lower than that of the large spotted seabass, and the LD content of the large spotted seabass increased significantly for a long time. It indicates that the anaerobic metabolism of the large spotted seabass was stronger than that of the small spotted seabass in response to heat stress. In particular, the metabolic energy consumption was higher than that of the small spotted seabass. At the same time, the LDH content of the small spotted seabass was higher than that of the large spotted seabass, which also explained this problem. This implies that stress levels were higher in large spotted seabass than in small spotted seabass at the same temperatures, causing its energy consumption to be faster. Similar results were observed in starry flounder Platichthys stellatus under heat stress conditions [49].
Glycogen is the energy-supplying substance in the body. When the fish is under stress, the body will accelerate the conversion of liver glycogen into glucose, which will increase the blood sugar level and use glucose as an energy source to cope with stress [11]. For instance, when grass carp Ctenopharyngodon idella and Antarctic fish Harpagifer antarcticus respond to heat stress, glycogen is converted into glucose in response to heat stress [3,11]. In this study, the liver glycogen of large spotted seabass decreased at all time points except for heat stress at 0 h, and the serum glucose level increased from 0 h to 6 h of heat stress, and then gradually decreased. This shows that heat stress accelerates the metabolism of large spotted seabass, resulting in faster utilization of sugar and faster conversion of glycogen into glucose. As a result, the content of liver glycogen decreased and the blood sugar concentration increased. With the prolongation of stress time, the blood sugar content gradually decreased. However, the liver glycogen content of small spotted seabass was maintained at normal levels except for 48 h and 72 h of heat stress, and the blood sugar content remained unchanged except for 6 h and 24 h. Compared with the large spotted seabass, the liver glycogen content of the small spotted seabass was always higher, and the blood sugar content was stable. This result also confirmed that under the same stress conditions, the large spotted seabass was under greater stress and required more energy to cope with it.
Heat stress induces the expression of multiple HSPs gene families; HSP70 and HSP90 are the most prominent. The expression of HSP70 and HSP90 genes is induced in many fishes after heat stress, such as killifish Fundulus heteroclitus, lake whitefish and koi fish Cyprinus carpio [50,51,52]. Stress-induced HSP90 and HSP70 are mainly used to resist environmental stress and improve cell viability and disease resistance. Therefore, both HSP70 and HSP90 can be useful biomarkers for assessing heat stress in fish [19]. The size of animals affects many aspects of organisms [53]. Suzanne [54] compared thermal resistance between juvenile and adult rainbow trout and showed that an enhanced heat shock protein response may contribute to greater heat resistance in juvenile fish. In this study, the expressions of HSP70 and HSP90 were upregulated in the livers of the two sizes of spotted seabass. However, there was no significant difference in the expression of HSP70 mRNA between the two sizes of spotted seabass. This indicates that size has little effect on the expression of HSP70 mRNA in spotted seabass, which is different from the results observed in the starry flounder Platichthys stellatus and rainbow trout Oncorhynchus mykiss, which may be related to species differences and sampling organization [49,54]. At the same time, we observed that the expression of HSP90 mRNA in small spotted seabass was significantly higher than that in large spotted seabass, indicating that the expression of HSP90 mRNA varies with size, which is consistent with the results observed in starry flounder Platichthys stellatus [49]. In general, we observed a high level of constitutive HSPs (HSP90, HSP90) expression in the liver of small spotted seabass. This result indicated that HSP70 and HSP90 were both involved in protecting against high temperature-induced cell damage, but the expression of HSP genes decreased with the increasing size of spotted seabass, resulting in a weakened ability to resist stress damage in large spotted seabass, which may be one of the reasons for their high mortality. Specifically, the heat tolerance was higher in small spotted seabass than in large spotted seabass.
Apoptosis is a physiological cell death that plays an important role in maintaining tissue homeostasis and eliminating unfeasible cells [25]. BAX and caspase-3 are two important apoptotic proteins in cell apoptosis. Under heat stress, the BAX and caspase-3 genes of pufferfish Takifugu obscurus, juvenile turbot Scophthalmus maximus. L were induced to express [22,55]. In our study, heat stress at 32 °C induced apoptosis in two sizes of spotted seabass, among which the expression of the pro-apoptosis gene BAX and the apoptosis-regulating gene caspase-3 of the large spotted seabass were stimulated by heat stress. This showed a trend of increasing (0–24 h) and then decreasing (48–72 h), indicating that the large spotted seabass was damaged by heat stress and that the apoptosis pathway was activated. The decline in BAX and caspase-3 gene expression in the latter stage, combined with the changes in the activities of ALT and AST above, determined that the fish might have adapted to this stress at the later stage. The expression levels of BAX and caspase-3 mRNA in the small spotted seabass were continuously upregulated after heat stress. However, the upregulation of large spotted seabass was more significant within 24 h. This confirms that the apoptosis of small spotted seabass was not as strong as that of large spotted seabass within 24 h of heat stress, and the liver damage was not as serious as that of large spotted seabass, which was consistent with the conclusions of AST and ALT. The caspase-3 mRNA level increased sharply after 24 h, which may be caused by the decline in the resistance of small spotted seabass over time.

5. Conclusions

In the current study, although the spotted seabass in this experiment are in the juvenile stage, the results show that juvenile spotted seabass of different sizes have different tolerances to high temperatures. These results indicate that the physiological response of the large spotted seabass was enhanced to resist the damage caused by heat stress at 32 °C. In contrast, the physiological response was relatively stable and low mortality rates were observed in small spotted seabass. After experiencing heat stress, the small spotted seabass exhibits a more active expression of the heat shock protein compared to the large spotted seabass. This suggests that the latter has a relatively slower activity of the heat shock protein, leading to the enhancement of other physiological responses in order to cope with injury caused by heat stress. With time, the resistance of small spotted seabass gradually weakened, and other physiological responses gradually increased after 48 h. In summary, we conclude that the spotted seabass with bigger size has a poorer tolerance to heat stress compared with the spotted seabass with smaller size. The smaller fish size is possibly resistant to heat stress by regulating the HSPs expression level in a more active extent. These results clarified the difference in heat resistance between large spotted seabass and small spotted seabass. This is helpful in guiding the management of spotted seabass farms, while also providing basic data and new insights into the physiological and molecular compensation mechanisms induced by heat stress in spotted seabass.

Author Contributions

H.Q., Z.H. and Z.L. (Zhongbao Li) conceived and designed the experiments. H.Q., Z.H., Z.L. (Zhongying Long), J.M., L.K., Y.L., H.L. and S.Z. performed the experiments. H.Q. analyzed the data, wrote the paper, and prepared the figures and tables. H.Q., Z.H. and Z.L. (Zhongbao Li) discussed the results. Z.H. and Z.L. (Zhongbao Li) reviewed the drafts of the paper. All authors have read and agreed to the published version of the manuscript.

Funding

This experiment was funded by the Science and Technology Planning Project in Fujian, China (Grant No. 2015N0010) and Science and Technology Planning Project in Xiamen, China (Grant No. 3502Z20143017).

Institutional Review Board Statement

The study was approved by the Animal Ethics Committee of Jimei University (Grant No. JMU202103009).

Data Availability Statement

Data are available upon request from the authors.

Conflicts of Interest

The authors declare no conflict of interest.

References

  1. López-Olmeda, J.F.; Sánchez-Vázquez, F.J. Thermal biology of zebrafish (Danio rerio). J. Therm. Biol. 2011, 36, 91–104. [Google Scholar] [CrossRef]
  2. Allen, S.K.; Barros, V.; Burton, I.; Campbell-Lendrum, D.; Cardona, O.-D.; Cutter, S.L.; Dube, O.P.; Ebi, K.L.; Field, C.B.; Handmer, J.W.; et al. Summary for Policymakers. In Managing the Risks of Extreme Events and Disasters to Advance Climate Change Adaptation; Cambridge University Press: Cambridge, UK, 2012; pp. 3–22. [Google Scholar]
  3. Julia, S.; Kurt, P.; Ricardo, O.-S.; Christina, C.C.-H.; Navarro, J.M.; Luis, V.-C. Effects of warming rates on physiological and molecular components of response to CTMax heat stress in the Antarctic fish Harpagifer antarcticus. J. Therm. Biol. 2021, 99, 103021. [Google Scholar] [CrossRef]
  4. Imsland, A.K.; Sunde, L.M.; Folkvord, A.; Stefansson, S.O. The interaction of temperature and fish size on growth of juvenile turbot. J. Fish Biol. 1996, 49, 926–940. [Google Scholar] [CrossRef]
  5. Fraser, E.J.; Bosma, P.T.; Trudeau, V.L.; Docherty, K. The Effect of Water Temperature on the GABAergic and Reproductive Systems in Female and Male Goldfish (Carassius auratus). Gen. Comp. Endocrinol. 2002, 125, 163–175. [Google Scholar] [CrossRef] [PubMed]
  6. Langston, A.L.; Hoare, R.; Stefansson, M.; Fitzgerald, R.; Wergeland, H.; Mulcahy, M. The effect of temperature on non-specific defence parameters of three strains of juvenile Atlantic halibut (Hippoglossus hippoglossus L.). Fish Shellfish. Immunol. 2002, 12, 61–76. [Google Scholar] [CrossRef]
  7. Miranda, L.A.; Chalde, T.; Elisio, M.; Strüssmann, C.A. Effects of global warming on fish reproductive endocrine axis, with special emphasis in pejerrey Odontesthes bonariensis. Gen. Comp. Endocrinol. 2013, 192, 45–54. [Google Scholar] [CrossRef]
  8. Alfonso, S.; Gesto, M.; Sadoul, B. Temperature increase and its effects on fish stress physiology in the context of global warming. J. Fish Biol. 2021, 98, 1496–1508. [Google Scholar] [CrossRef] [PubMed]
  9. Lesser, M.P. OXIDATIVE STRESS IN MARINE ENVIRONMENTS: Biochemistry and Physiological Ecology. Annu. Rev. Physiol. 2006, 68, 253–278. [Google Scholar] [CrossRef] [PubMed] [Green Version]
  10. Kannan, K.; Jain, S.K. Oxidative stress and apoptosis. Pathophysiology 2000, 7, 153–163. [Google Scholar] [CrossRef] [PubMed]
  11. Jiang, D.; Wu, Y.; Huang, D.; Ren, X.; Wang, Y. Effect of blood glucose level on acute stress response of grass carp Ctenopharyngodon idella. Fish Physiol. Biochem. 2017, 43, 1433–1442. [Google Scholar] [CrossRef]
  12. Pottinger, T.G.; Carrick, T.R. A comparison of plasma glucose and plasma cortisol as selection markers for high and low stress-responsiveness in female rainbow trout. Aquaculture 1999, 175, 351–363. [Google Scholar] [CrossRef] [Green Version]
  13. Wendelaar Bonga, S.E. The stress response in fish. Physiol. Rev. 1997, 77, 591–625. [Google Scholar] [CrossRef]
  14. Zheng, J.-L.; Peng, L.-B.; Zhu, Q.-L.; Zhang, X.-L.; Hu, W. Waterborne zinc induced lobe-dependent effect on oxidative stress and energy metabolism in hepatopancreas of Larimichthys crocea. Aquat. Toxicol. 2019, 215, 105270. [Google Scholar] [CrossRef]
  15. Vaglio, A.; Landriscina, C. Changes in Liver Enzyme Activity in the TeleostSparus aurata in Response to Cadmium Intoxication. Ecotoxicol. Environ. Saf. 1999, 43, 111–116. [Google Scholar] [CrossRef]
  16. Al-Deghayem, W.A.A.; Suliman, E.A.M. The effects of diet and temperature on enzymes, hormones, and fecundity of the African Catfish Clarias gariepinus (Burchell 1822). J. Appl. Biol. Biotechnol. 2019, 7, 71–77. [Google Scholar] [CrossRef] [Green Version]
  17. Yan, L.; Wang, P.; Zhao, C.; Fan, S.; Lin, H.; Guo, Y.; Ma, Z.; Qiu, L. Toxic responses of liver in Lateolabrax maculatus during hypoxia and re-oxygenation. Aquat. Toxicol. 2021, 236, 105841. [Google Scholar] [CrossRef] [PubMed]
  18. Jacob, P.; Hirt, H.; Bendahmane, A. The heat-shock protein/chaperone network and multiple stress resistance. Plant Biotechnol. J. 2017, 15, 405–414. [Google Scholar] [CrossRef] [Green Version]
  19. Roberts, R.J.; Agius, C.; Saliba, C.; Bossier, P.; Sung, Y.Y. Heat shock proteins (chaperones) in fish and shellfish and their potential role in relation to fish health: A review. J. Fish Dis. 2010, 33, 789–801. [Google Scholar] [CrossRef] [PubMed]
  20. Mohanty, B.P.; Mahanty, A.; Mitra, T.; Parija, S.C.; Mohanty, S. Heat shock proteins in stress in teleosts. Regul. Heat Shock. Protein Responses 2018, 13, 71–94. [Google Scholar]
  21. Takayama, S.; Reed, J.C.; Homma, S. Heat-shock proteins as regulators of apoptosis. Oncogene 2003, 22, 9041–9047. [Google Scholar] [CrossRef] [PubMed] [Green Version]
  22. Jia, Y.; Chen, X.; Wang, Z.; Meng, Z.; Huang, B.; Guan, C. Physiological response of juvenile turbot (Scophthalmus maximus L.) during hyperthermal stress. Aquaculture 2020, 529, 735645. [Google Scholar] [CrossRef]
  23. Madeira, D.; Vinagre, C.; Diniz, M.S. Are fish in hot water? Effects of warming on oxidative stress metabolism in the commercial species Sparus aurata. Ecol. Indic. 2016, 63, 324–331. [Google Scholar] [CrossRef]
  24. Mosser, D.D.; Caron, A.W.; Bourget, L.; Meriin, A.B.; Sherman, M.Y.; Morimoto, R.I.; Massie, B. The Chaperone Function of hsp70 Is Required for Protection against Stress-Induced Apoptosis. Mol. Cell. Biol. 2000, 20, 7146–7159. [Google Scholar] [CrossRef] [PubMed] [Green Version]
  25. Elmore, S. Apoptosis: A Review of Programmed Cell Death. Toxicol. Pathol. 2007, 35, 495–516. [Google Scholar] [CrossRef]
  26. Li, T.; Zeng, L.; Gao, W.; Cui, M.-Z.; Fu, X.; Xu, X. PSAP induces a unique Apaf-1 and Smac-dependent mitochondrial apoptotic pathway independent of Bcl-2 family proteins. Biochim. Et Biophys. Acta (BBA) Mol. Basis Dis. 2013, 1832, 453–474. [Google Scholar] [CrossRef] [PubMed] [Green Version]
  27. Xu, A.; Shang-Guan, J.; Li, Z.; Gao, Z.; Huang, Y.C.; Chen, Q. Effects of dietary Chinese herbal medicines mixture on feeding attraction activity, growth performance, nonspecific immunity and digestive enzyme activity of Japanese seabass (Lateolabrax japonicus). Aquac. Rep. 2020, 17, 100304. [Google Scholar] [CrossRef]
  28. Liu, X. Cultivation techniques for seabass in Bai Jiao. Contemp. Fish. 2010, 35, 72–73. (In Chinese) [Google Scholar]
  29. Zhao, W. Key points of the freshwater culture technology of Lateolabrax japonicus. J. Beijing Fish. 2002, 5, 22. (In Chinese) [Google Scholar]
  30. Bevelhimer, M.; Bennett, W. Assessing cumulative thermal stress in fish during chronic intermittent exposure to high temperatures. Environ. Sci. Policy 2000, 3, 211–216. [Google Scholar] [CrossRef]
  31. Huang, Z.; Li, Z.; Xu, A.; Zheng, D.; Ye, Y.; Wang, Z. Effects of exogenous multienzyme complex supplementation in diets on growth performance, digestive enzyme activity and non-specific immunity of the Japanese seabass, Lateolabrax japonicus. Aquac. Nutr. 2020, 26, 306–315. [Google Scholar] [CrossRef]
  32. Shen, Q.; Xu, S.; Wang, D.; Yan, X. Effects of water temperature on metabolizability of starved Lateolabrax japonicus. J. Fish. Sci. China 2008, 3, 500–505. (In Chinese) [Google Scholar]
  33. Shin, M.-K.; Park, H.-R.; Yeo, W.-J.; Han, K.-N. Effects of Thermal Stress on the mRNA Expression of SOD, HSP90, and HSP70 in the Spotted seabass (Lateolabrax maculatus). Ocean. Sci. J. 2018, 53, 43–52. [Google Scholar] [CrossRef]
  34. Dahlke, F.T.; Wohlrab, S.; Butzin, M.; Pörtner, H.-O. Thermal bottlenecks in the life cycle define climate vulnerability of fish. Science 2020, 369, 65–70. [Google Scholar] [CrossRef]
  35. Huang, H.; Zhang, X.; Liang, X.; Wu, X.; Gu, X.; Han, J.; Xue, M. N-carbamoylglutamate improves lipid metabolism, inflammation, and apoptosis responses in visceral adipocytes of Japanese seabass (Lateolabrax japonicus), in vivo and in vitro. Anim. Nutr. 2021, 7, 707–715. [Google Scholar] [CrossRef] [PubMed]
  36. Wei, Y.; Lu, K.; Wang, l.; Song, K.; Zhang, C. Effects of berberine supplementation in feed on the growth and fat metabolism of Japanese seabass (Lateolabrax japonicus). Chin. J. Anim. Nutr. 2021, 33, 5193–5202. (In Chinese) [Google Scholar]
  37. Phrompanya, P.; Panase, P.; Saenphet, S.; Saenphet, K. Histopathology and oxidative stress responses of Nile tilapia Oreochromis niloticus exposed to temperature shocks. Fish. Sci. 2021, 87, 491–502. [Google Scholar] [CrossRef]
  38. He, L.Q.; Wang, W.L.; Zeng, B.H.; Yang, R.B.; Liu, H.P.; Zeng, X.L.; Xu, Z.L.; Wang, J. The study on the temperature tolerance of different sizes of Schizothorax waltoni. Acta Hydrobiol. Sin. 2020, 44, 1231–1238. (In Chinese) [Google Scholar]
  39. Cheng, C.-H.; Guo, Z.-X.; Luo, S.-W.; Wang, A.-L. Effects of high temperature on biochemical parameters, oxidative stress, DNA damage and apoptosis of pufferfish (Takifugu obscurus). Ecotoxicol. Environ. Saf. 2018, 150, 190–198. [Google Scholar] [CrossRef]
  40. Ming, J.; Xie, J.; Xu, P.; Ge, X.; Liu, W.; Ye, J. Effects of emodin and vitamin C on growth performance, biochemical parameters and two HSP70s mRNA expression of Wuchang bream (Megalobrama amblycephala Yih) under high temperature stress. Fish Shellfish Immunol. 2012, 32, 651–661. [Google Scholar] [CrossRef]
  41. Klein, R.D.; Borges, V.D.; Rosa, C.E.; Colares, E.P.; Robaldo, R.B.; Martinez, P.E.; Bianchini, A. Effects of increasing temperature on antioxidant defense system and oxidative stress parameters in the Antarctic fish Notothenia coriiceps and Notothenia rossii. J. Therm. Biol. 2017, 68, 110–118. [Google Scholar] [CrossRef]
  42. Dawood, M.A.O.; Noreldin, A.E.; Sewilam, H. Blood biochemical variables, antioxidative status, and histological features of intestinal, gill, and liver tissues of African catfish (Clarias gariepinus) exposed to high salinity and high-temperature stress. Environ. Sci. Pollut. Res. 2022, 29, 56357–56369. [Google Scholar] [CrossRef] [PubMed]
  43. Wang, Y.; Liu, Z.; Li, Z.; Shi, H.; Kang, Y.; Wang, J.; Huang, J.; Jiang, L. Effects of heat stress on respiratory burst, oxidative damage and SERPINH1 (HSP47) mRNA expression in rainbow trout Oncorhynchus mykiss. Fish Physiol. Biochem. 2016, 42, 701–710. [Google Scholar] [CrossRef] [PubMed]
  44. Islam, M.J.; Kunzmann, A.; Slater, M.J. Extreme winter cold-induced osmoregulatory, metabolic, and physiological responses in European seabass (Dicentrarchus labrax) acclimatized at different salinities. Sci. Total Environ. 2021, 771, 145202. [Google Scholar] [CrossRef] [PubMed]
  45. Handy, J. Lactate—The bad boy of metabolism, or simply misunderstood? Curr. Anaesth. Crit. Care 2006, 17, 71–76. [Google Scholar] [CrossRef]
  46. Lu, Y.; Wu, Z.; Song, Z.; Xiao, P.; Liu, Y.; Zhang, P.; You, F. Insight into the heat resistance of fish via blood: Effects of heat stress on metabolism, oxidative stress and antioxidant response of olive flounder Paralichthys olivaceus and turbot Scophthalmus maximus. Fish Shellfish Immunol. 2016, 58, 125–135. [Google Scholar] [CrossRef] [PubMed]
  47. Mackey, T.E.; Hasler, C.T.; Durhack, T.; Jeffrey, J.D.; Macnaughton, C.J.; Ta, K.; Enders, E.C.; Jeffries, K.M. Molecular and physiological responses predict acclimation limits in juvenile brook trout (Salvelinus fontinalis). J. Exp. Biol. 2021, 224, 241885. [Google Scholar] [CrossRef]
  48. Zhang, H.; Jia, H.; Xiong, P.; Yao, G.; He, M. Transcriptome and enzyme activity analyses of tolerance mechanisms in pearl oyster (Pinctada fucata) under high-temperature stress. Aquaculture 2022, 550, 737888. [Google Scholar] [CrossRef]
  49. Lee, H.B.; Yoon, J.H.; Park, J.Y.; Lee, I.Y.; Lim, H.K. A comparison of the physiological responses to heat stress of juvenile and adult starry flounder (Platichthys stellatus). Isr. J. Aquac. Bamidgeh 2021, 73, 1–15. [Google Scholar] [CrossRef]
  50. Healy, T.M.; Tymchuk, W.E.; Osborne, E.J.; Schulte, P.M. Heat shock response of killifish (Fundulus heteroclitus): Candidate gene and heterologous microarray approaches. Physiol. Genom. 2010, 41, 171–184. [Google Scholar] [CrossRef] [Green Version]
  51. Stefanovic, D.I.; Manzon, L.A.; McDougall, C.S.; Boreham, D.R.; Somers, C.M.; Wilson, J.Y.; Manzon, R.G. Thermal stress and the heat shock response in embryonic and young of the year juvenile lake whitefish. Comp. Biochem. Physiol. Part A: Mol. Integr. Physiol. 2016, 193, 1–10. [Google Scholar] [CrossRef]
  52. Yu, H.; Zhang, C.; Xing, W.; Li, T.; Xu, G.; Ma, Z.; Jiang, N.; Luo, L. Comparative study on the non-specific immune response and hsp70 gene expression among three strains of koi (Cyprinus carpio) under acute heat stress. Aquac. Rep. 2020, 18, 100461. [Google Scholar] [CrossRef]
  53. Webb, P.W.; Gans, C. Is Bigger Better? BioScience 1986, 36, 340–342. [Google Scholar] [CrossRef]
  54. Suzanne, F.S.L.H.D.C. A comparison of the heat shock response in juvenile and adult rainbow trout (Oncorhynchus mykiss)—Implications for increased thermal sensitivity with age. Can. J. Fish. Aquat. Sci. 2009, 66, 91–100. [Google Scholar] [CrossRef]
  55. Cheng, C.-H.; Yang, F.-F.; Liao, S.-A.; Miao, Y.-T.; Ye, C.-X.; Wang, A.-L.; Tan, J.-W.; Chen, X.-Y. High temperature induces apoptosis and oxidative stress in pufferfish (Takifugu obscurus) blood cells. J. Therm. Biol. 2015, 53, 172–179. [Google Scholar] [CrossRef] [PubMed]
Figure 1. Death numbers of two sizes of L. maculatus under different heat stress times (32 °C).
Fishes 08 00340 g001
Figure 2. Changes in ALT (a) and AST (b) activities in serum of two sizes of L. maculatus (with average weights of 57.91 ± 11.57 g and 13.92 ± 2.77 g, respectively) under heat stress. Different lowercase letters (a, b, c, d, e or f) denote statistically significant differences among the various heat stress times (Duncan’s test, p < 0.05). The symbol “*” indicates significant differences (t-test, p < 0.05) among the two sizes of L. maculatus at the sampling time. The symbol “#” indicates that the size or time or their interaction has a significant effect on the parameter (two-way ANOVA, p < 0.05). Data are presented as mean ± deviation (n = 4 ).
Fishes 08 00340 g002
Figure 3. Changes in serum MDA (a), serum SOD (b), liver MDA (c), and liver SOD (d) activities during heat stress in different sizes of L. maculatus (with average weights of 57.91 ± 11.57 g and 13.92 ± 2.77 g, respectively). Different lowercase letters (a, b, c, d, e or f) denote statistically significant differences among the various heat stress times (Duncan’s test, p < 0.05). The symbol “*” indicates significant differences (t-test, p < 0.05) among the different sizes of L. maculatus at the sampling time. The symbol “#” indicates that the size or time or their interaction has a significant effect on the parameter (two-way ANOVA, p < 0.05). The symbol “\” indicates that the size or time or their interaction has no significant effect on the parameter (two-way ANOVA, p < 0.05). Data are presented as mean ± deviation (n = 4).
Fishes 08 00340 g003
Figure 4. Changes in serum LD (a), serum LDH (b), serum glucose (c), and liver glycogen (d) during heat stress in different sizes of L. maculatus (with average weights of 57.91 ± 11.57 g and 13.92 ± 2.77 g, respectively). Different lowercase letters (a, b, c, d, or e) denote statistically significant differences among the various heat stress times (Duncan’s test, p < 0.05). The symbol “*” indicates significant differences (t-test, p < 0.05) among the different sizes of L. maculatus at the sampling time. The symbol “#” indicates that the size or time or their interaction has a significant effect on the parameter (two-way ANOVA, p < 0.05). Data are presented as mean ± deviation (n = 4).
Fishes 08 00340 g004
Figure 5. Changes in relative expression of HSP70 (a), HSP90 (b), BAX (c), and caspase-3 (d) mRNA during heat stress in different sizes of L. maculatus (with average weights of 57.91 ± 11.57 g and 13.92 ± 2.77 g, respectively). Different lowercase letters (a, b, c, d, or e) denote statistically significant differences among the various heat stress times (Duncan’s test, p < 0.05). The symbol “*” indicates significant differences (t-test, p < 0.05) among the different sizes of L. maculatus at the sampling time. The symbol “#” indicates that the size or time or their interaction has a significant effect on this parameter (two-way ANOVA, p < 0.05). The symbol “\” indicates that the size or time or their interaction has no significant effect on this parameter (two-way ANOVA, p < 0.05). Data are presented as mean ± deviation (n = 4).
Fishes 08 00340 g005
Table 1. Primer sequences used in this study.
PrimersPrimer Sequence 5′-3′References
Caspase-3F: TGACCAGACAGTCGAGCAGA[35]
R: AACACACCCTCATCTCCGTG
BAXF: TGGAAGTGGGAGCTGTCTTG[36]
R: GGCGAGCTTCTTGTGGTTTG
HSP90F: ACACAACGATGATGAGCAGT[33]
R: TCAGGTGCAGGATGATCTTT
HSP70F: CCCAAGGTCCAAGTTGAGT[33]
R: AGGTAGGCTTCAGCAATCTC
β-actinF: CGCCGCACTGGTTGTT[33]
R: TTTGGGGTTCAGGGGG
Note: F indicates forward primer, while R indicates reverse primer.
Disclaimer/Publisher’s Note: The statements, opinions and data contained in all publications are solely those of the individual author(s) and contributor(s) and not of MDPI and/or the editor(s). MDPI and/or the editor(s) disclaim responsibility for any injury to people or property resulting from any ideas, methods, instructions or products referred to in the content.

