Article

Potential of Otolith Microchemistry to Distinguish Nursery Areas of Salmon within River Simojoki

1
Environmental and Marine Biology, Faculty of Science and Engineering, Åbo Akademi University, 20500 Turku, Finland
2
Natural Resources Institute Finland (LUKE), 94450 Keminmaa, Finland
3
Accelerator Laboratory, Turku PET Centre, Åbo Akademi University, 20500 Turku, Finland
4
Finnish Isotope Geosciences Laboratory, Geological Survey of Finland, 02151 Espoo, Finland
5
Cell Biology, Faculty of Science and Engineering, Åbo Akademi University, 20500 Turku, Finland
*
Author to whom correspondence should be addressed.
Retired.
Fishes 2023, 8(6), 332; https://doi.org/10.3390/fishes8060332
Submission received: 29 May 2023 / Revised: 14 June 2023 / Accepted: 15 June 2023 / Published: 20 June 2023
(This article belongs to the Section Biology and Ecology)

Abstract

:
Draining into the northern Baltic Sea, River Simojoki is an important spawning river for Atlantic salmon. The present study aimed to preliminary explore the potential of analysing the elemental composition of otoliths to distinguish the within-river nursery area of origin for salmon. Parr were sampled at three nursery areas in the river and smolts of unknown origin were sampled near the river mouth during the migration to the sea. The concentrations of multiple elements and the strontium 87Sr/86Sr isotopic ratio in the otoliths were analysed using single- and multi-collector laser ablation inductively coupled plasma mass spectrometry, respectively. Based on the otolith elemental variables, parr could be reclassified to the sampled nursery areas using discriminant function analysis and random forest with a success rate of 53.3% and 63.3%, respectively. However, for parr sampled at the uppermost nursery area in the river, the success rates were 90% and 100%, respectively. Applying the classification models trained on the parr samples to determine which nursery area sampled smolt originated from was constrained by the limited sampling of parr, both in sample sizes and the coverage of the nursery areas found in the river.
Key Contribution: Significant differences in the otolith elemental composition were detected between parr sampled at three different nursery areas within River Simojoki.

1. Introduction

Atlantic salmon (Salmo salar L.) is found across a wide range, including the northern Atlantic Ocean and the Baltic Sea. In the latter, the most important rivers for reproduction are located in the Gulf of Bothnia [1]. Salmon displays an anadromous life cycle where mature individuals migrate from the sea up the natal river during spring and summer to spawn in the autumn. The embryos hatch in April–May, and the free embryos remain within the redd until the yolk sac is absorbed approximately one month later [2,3]. The salmon, now referred to as fry, seek out nearby areas with slower currents, often close to the shoreline, where they initiate external feeding [2,3]. In late summer, the salmon develop into the parr stage and move into nearby faster-flowing habitats where they establish territories [2,3]. The parr remain stationary in the river for around three years before undergoing smoltification, which includes several morphological, physiological, and behavioural changes enabling survival at sea [2,3,4]. Thereafter, the smolt rapidly migrate out of the river into the sea in mid-May–early July and continue migrating southward to reach the primary feeding grounds [2,5]. After having spent 1–4 years at the feeding grounds, the mature salmon undertake the migration back to the natal river for spawning [2]. As Atlantic salmon is an iteroparous species, individuals may repeatedly spawn for several years [6].
The Baltic Sea stock of salmon is considered vulnerable by the Baltic Marine Environment Protection Commissions threat assessment of Baltic Sea species, mainly as a consequence of the loss of spawning grounds due to the damming of rivers for hydropower production and dredging of rapids to benefit log driving [1]. Fishing in the sea has also been a major factor limiting the stock, but following implementations of stricter regulations in the late 1990s, the negative impact has been limited [7,8]. Since the turn of the millennium, there has been a steady increase in the natural smolt production in rivers in the Gulf of Bothnia, going from ~1.3 million smolts produced in the year 2000 to ~2.3 million in 2009 [9]. By 2016, most of the rivers in the area had actualised the management target set at 75% of the potential smolt production capacity [10].
River Simojoki is a 175 km long river discharging into the northernmost part of the Gulf of Bothnia, Baltic Sea. The river has remained undammed and unobstructed, but its rapids were extensively dredged for log driving in the 1950s and 1960s [11]. Restoration projects of the river were initiated in the 1970s and were finalised in the early 2000s [11]. The mean discharge rate of the river is 38 m3 s−1, but as a consequence of ditching by the forestry industry within the 3160 km2 catchment area, it is highly intra- and interannually variable, changing from a minimum rate of <10 m3 s−1 in late winter to a maximum rate of ˃400 m3 s−1 during the spring flood [8,11,12,13]. During summer, salmon ascend River Simojoki up to 110 km from the sea for spawning, with occasional spawning recorded up to Lake Simojärvi, located 175 km upstream [8,11,14,15]. The smolt production of the local salmon stock has varied considerably throughout the years with an estimated output during 1977–2020 of 23,300 ± 17,700 smolts/year ( x ¯ ± SD), range 1300–67,000 [7]. In 1984, during a decade of particularly low smolt production at 10,100 ± 6500 smolts/year ( x ¯ ± SD), range 1500–19,000, a supplementary stocking programme of parr and smolts was implemented, continuing over the turn of the century [7,8,16,17]. Since 2011, only minor stocking for research purposes has occasionally been conducted in River Simojoki [7]. The highly variable smolt production of the local salmon stock has been hypothesised to be a consequence of the high intra- and interannual variability in the discharge rate [12]. During spawning seasons with especially high discharge, salmon gain access to plenty of suitable spawning areas along the shoreline. However, as the discharge decreases to its minimum rate in late winter, many of these spawning areas end up above the water level, exposing and killing the embryos [12]. The low discharge rates in late winter–early spring are also thought to negatively affect the survival of smolt by limiting the size of the available habitats [12].
The salmon stock in River Simojoki has been the subject of annual surveys since 1972 [11]. The number of ascending mature fish has been monitored using sonar, the parr densities in the nursery areas have been surveyed by electrofishing, and the smolt production has been estimated by trapping smolts migrating to the sea (e.g., [11,12,15,16,17,18,19,20]). Despite previous efforts, it remains unclear to what degree the different rapids contribute to total salmon production. The distance from the rapids to the sea might affect the survival of migrating smolt, especially in the upper reaches of the river where there are several long pool sections and lakes that they have to pass through which, in general, is considered to increase the mortality due to exposure to avian and fish predators [14,21]. However, a study releasing externally tagged, hatchery-reared smolts in different parts of the river in 1996–1999 found no significant effect of distance to the sea at the release site on smolt recapture rate in the river mouth, as it varied greatly interannually [14].
The application of otolith microchemistry as a tool for identifying the spawning areas of fish and to distinguish fish originating from different natal rivers is well established (e.g., [22,23,24,25,26,27,28]). To a lesser extent, otolith microchemistry has also been used to distinguish fish originating from different spawning areas within the same river system, although here, greater challenges have generally been encountered due to smaller variations in otolith elemental composition between samples (e.g., [29,30,31,32,33,34,35]). Otoliths are paired calcified structures located in the inner ear of Osteichthyes, constituting a part of the auditory and vestibular system [36]. The sagitta, the largest of the otoliths, is built up starting from a primordium through biomineralisation of calcium carbonate (~96%) within a protein matrix (~3%) [37]. The biomineralisation process is considered to be affected by both extrinsic factors, such as ambient ion concentration, oxygen level, and temperature, as well as intrinsic ones, such as ontogeny, sexual maturation, spawning, somatic growth rate, and feeding rate [38,39]. During the biomineralisation process, other elements (~1%) are incorporated into the otolith as well, either through the substitution of calcium in calcium carbonate, by trapping in crystal defects, or by binding to the protein matrix [37]. The incorporation rate of elements not under strict physiological regulation often reflects the availability in the ambient environment [37,38]. Thus, the concentration of these elements in the otolith may be analysed to deduce the fish’s environment at specific points in its life [37,38]. Especially the concentration of strontium (Sr), which generally is positively correlated with salinity in marine and brackish environments, has often been used to track migration over salinity gradients and to detect anadromy [37]. An alternative to studying the concentrations of elements in otoliths is to analyse the isotopic ratio of elements, such as the 87Sr/86Sr ratio [40]. The strontium isotope 87Sr is formed by the radioactive decay of the rubidium isotope 87Rb with a half-life of approximately 4.9 × 10¹⁰ years. In contrast, 86Sr is non-radiogenic and thus stable over time. As a consequence, the 87Sr/86Sr ratio varies with the age of minerals, with higher ratios found in older minerals or minerals with initially higher Rb/Sr ratios [41]. Depending on the geology in the drainage area, rivers entering the Baltic Sea differ in the concentration of Sr and the 87Sr/86Sr ratio. Generally, the concentration of Sr is lower in the northern rivers compared to the southern rivers (15–50 µg L−1 vs. 100–500 µg L−1), and the 87Sr/86Sr ratio is higher (0.73 vs. 0.71) [41]. The 87Sr/86Sr ratio also differs at a finer spatial scale, and many rivers draining into the Gulf of Bothnia can be differentiated based on their isotopic ratio [42]. The 87Sr/86Sr ratio incorporated into otoliths is expected to reflect the ratio found in the ambient environment, as no or minimal selection against specific isotopes is assumed to occur during the biomineralisation process [40]. However, analysing the 87Sr/86Sr ratio in otoliths to distinguish fish originating from different spawning grounds in the Baltic Sea remains relatively rare, and a Google Scholar search on 12 August 2022 using the keywords otolith, 87Sr, 86Sr, isotope, and Baltic Sea returned only three such studies published [22,43,44].
To statistically analyse the elemental composition of otoliths to determine the spawning ground of origin for fish, methods such as quadratic discriminant analysis and discriminant function analysis (DFA) are predominantly used [45]. However, machine learning classification methods such as random forest (RF) are showing great promise as they make less restrictive assumptions and often have a higher correct classification rate [45,46,47]. In RF, many classification trees are built based on the random bootstrapping of data. In each classification tree, the bootstrapped data are recursively split into binary groups by testing a set number of dependent variables and selecting the variable most successful in maximising the within-group homogeneity at each split. The process is ended when further splitting does not increase within-group homogeneity. The classification ability of each tree is then tested by classifying individuals not used to build the tree in question, and the combined classification ability of the RF is presented as out-of-bag (OOB) error rates. The RF can be applied to classify unknown individuals by running them through each classification tree, which then votes for a class. In the end, the class that receives the most votes from the forest is selected as the classification. In contrast to DFA, RF places no assumption on the multivariate distribution of the data and is robust against outliers; furthermore, RF is better suited when small sample sizes with many dependent variables are analysed [46,47].
The present study aimed to preliminary investigate the feasibility of distinguishing salmon originating from different nursery areas in River Simojoki by analysing the elemental composition of otoliths. The assumption was that there exists a gradient in the elemental composition in the main stem of River Simojoki, caused by inflow from tributary rivers with different elemental composition. This difference in the ambient environment between the nursery areas in the river was hypothesised to be reflected in the otolith elemental composition for parr originating from these areas. Parr were considered to remain in the vicinity of the nursery areas before undergoing smoltification, which would allow the elemental composition of their otoliths to be analysed to establish elemental profiles characteristic of the different areas [2]. This, in turn, would enable determining the nursery area of origin for smolt caught during the migration to the sea by analysing the elemental composition in the region of their otoliths formed during the first summer and comparing these to the previously established profiles. If the method proved successful, it could provide a valuable tool for tracking the origin of smolt and adult salmon, which would be useful for management and conservation purposes.

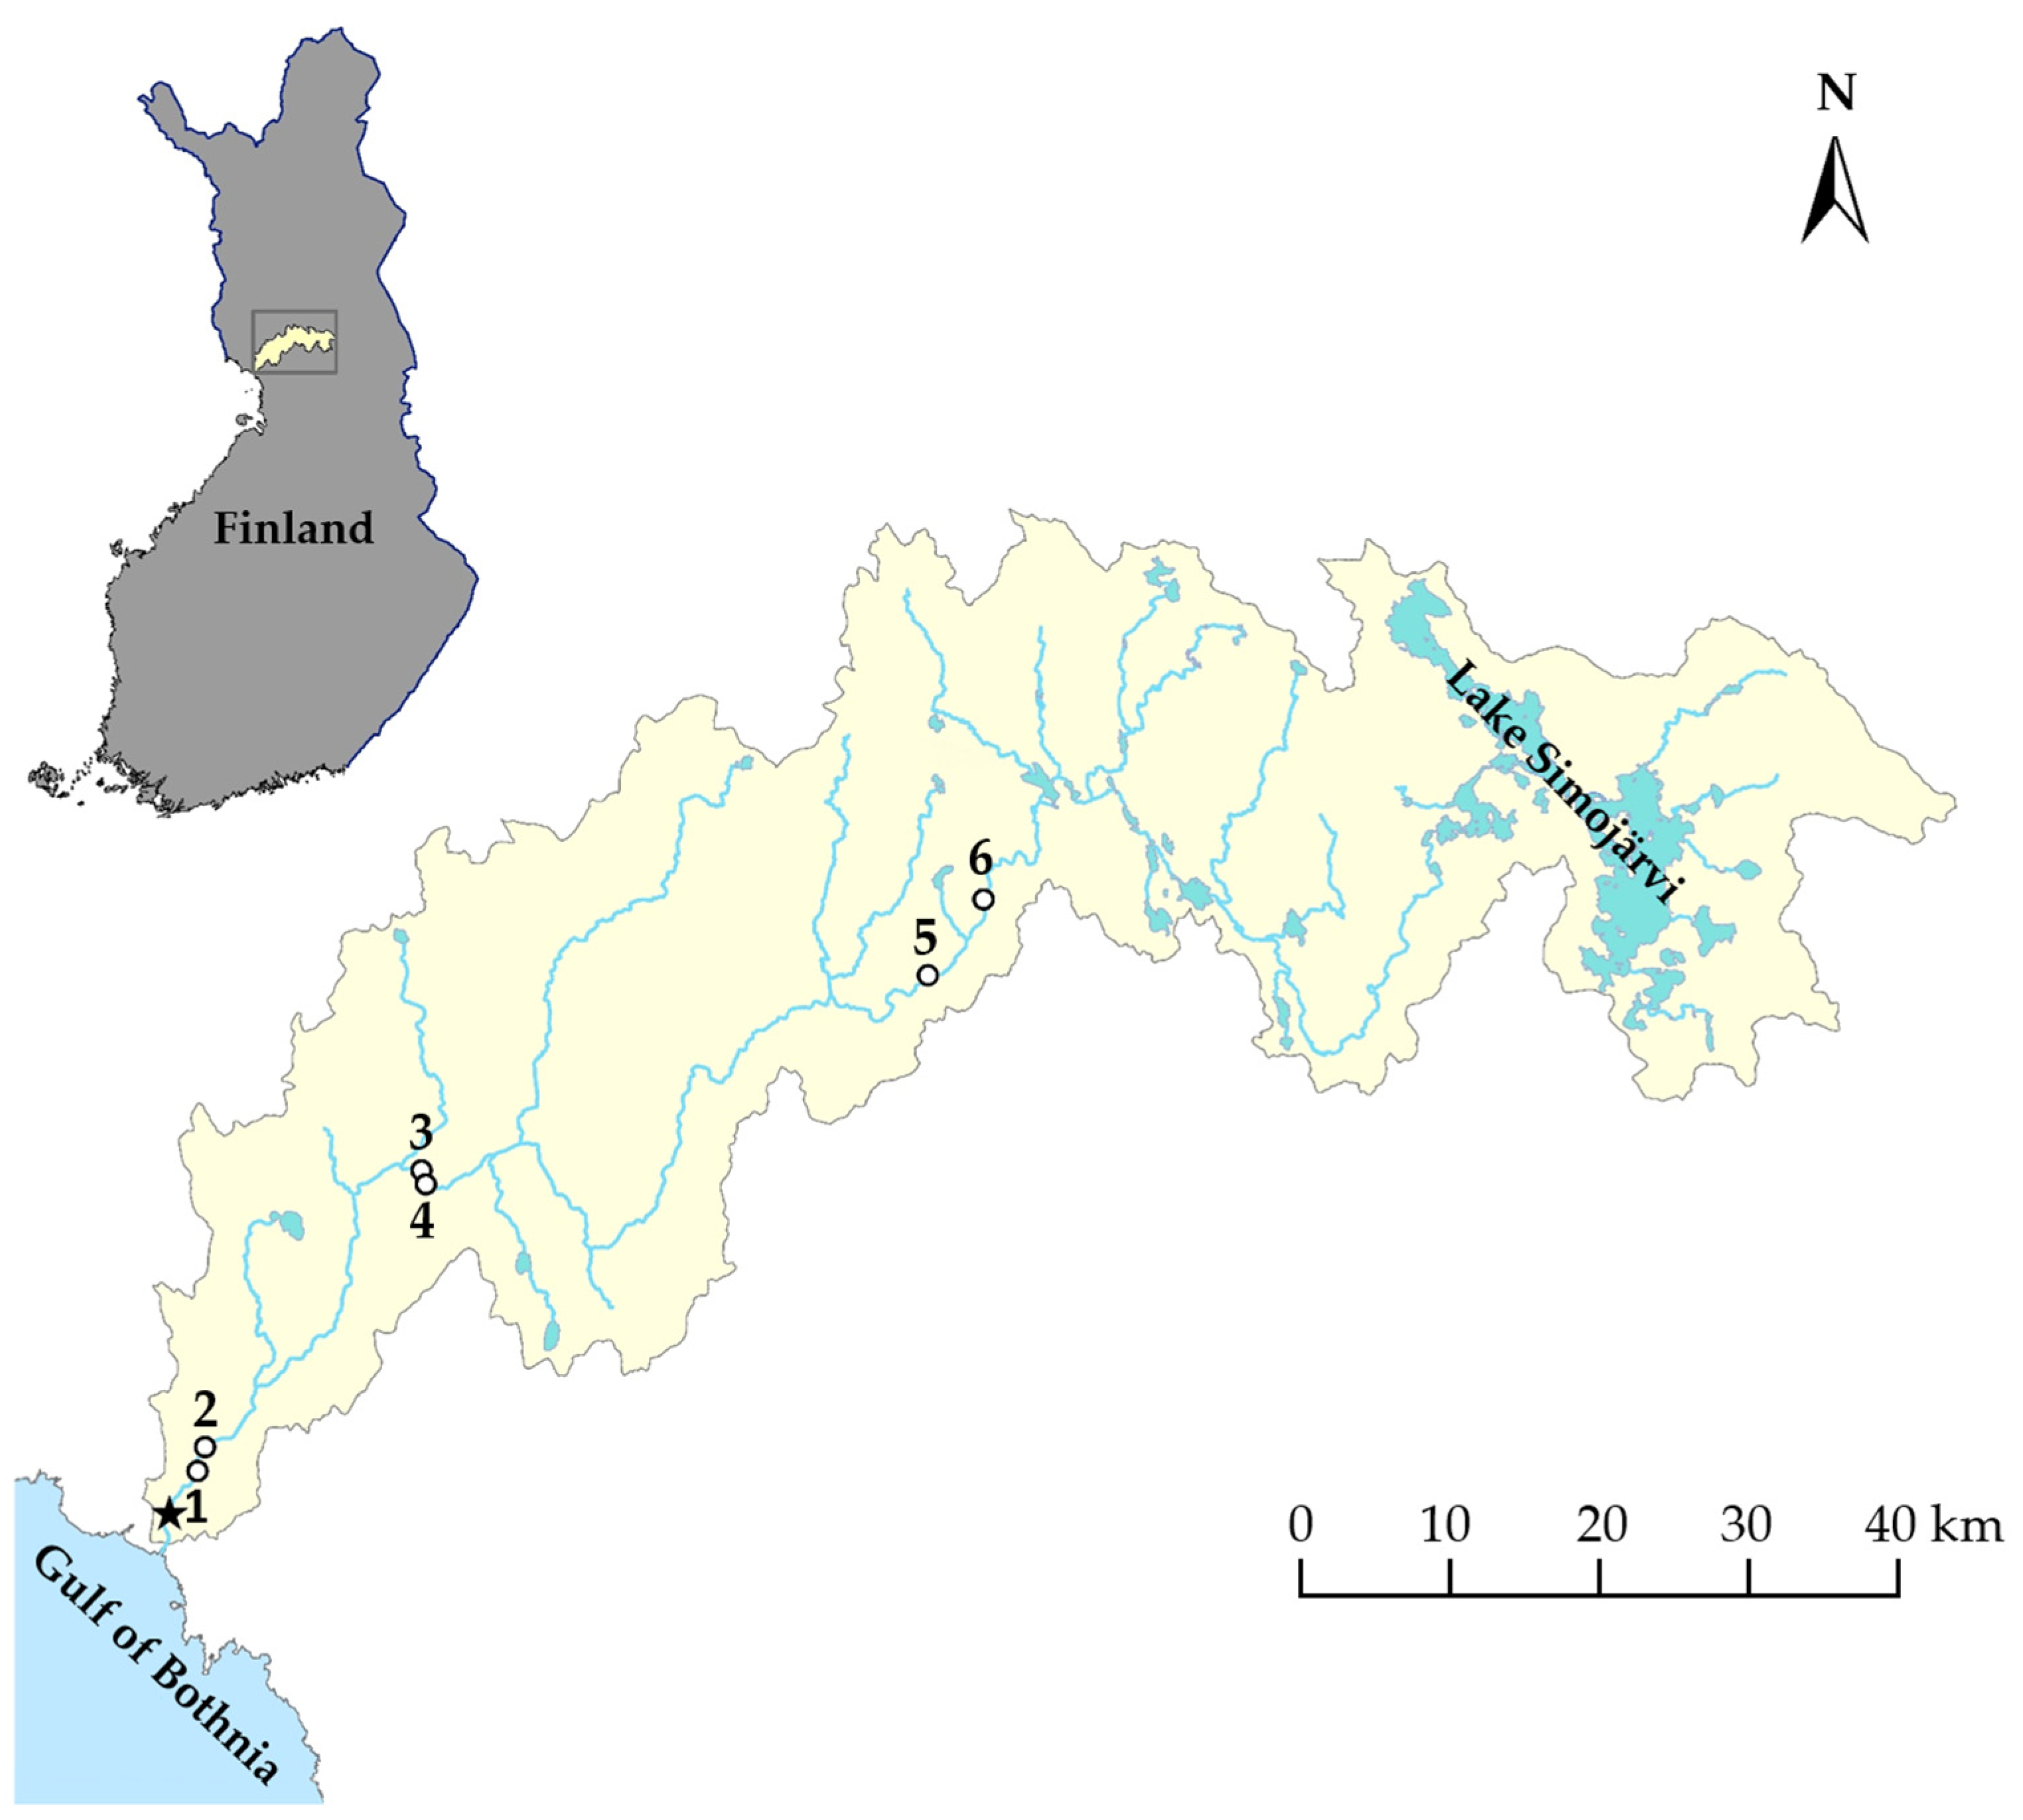
2. Materials and Methods
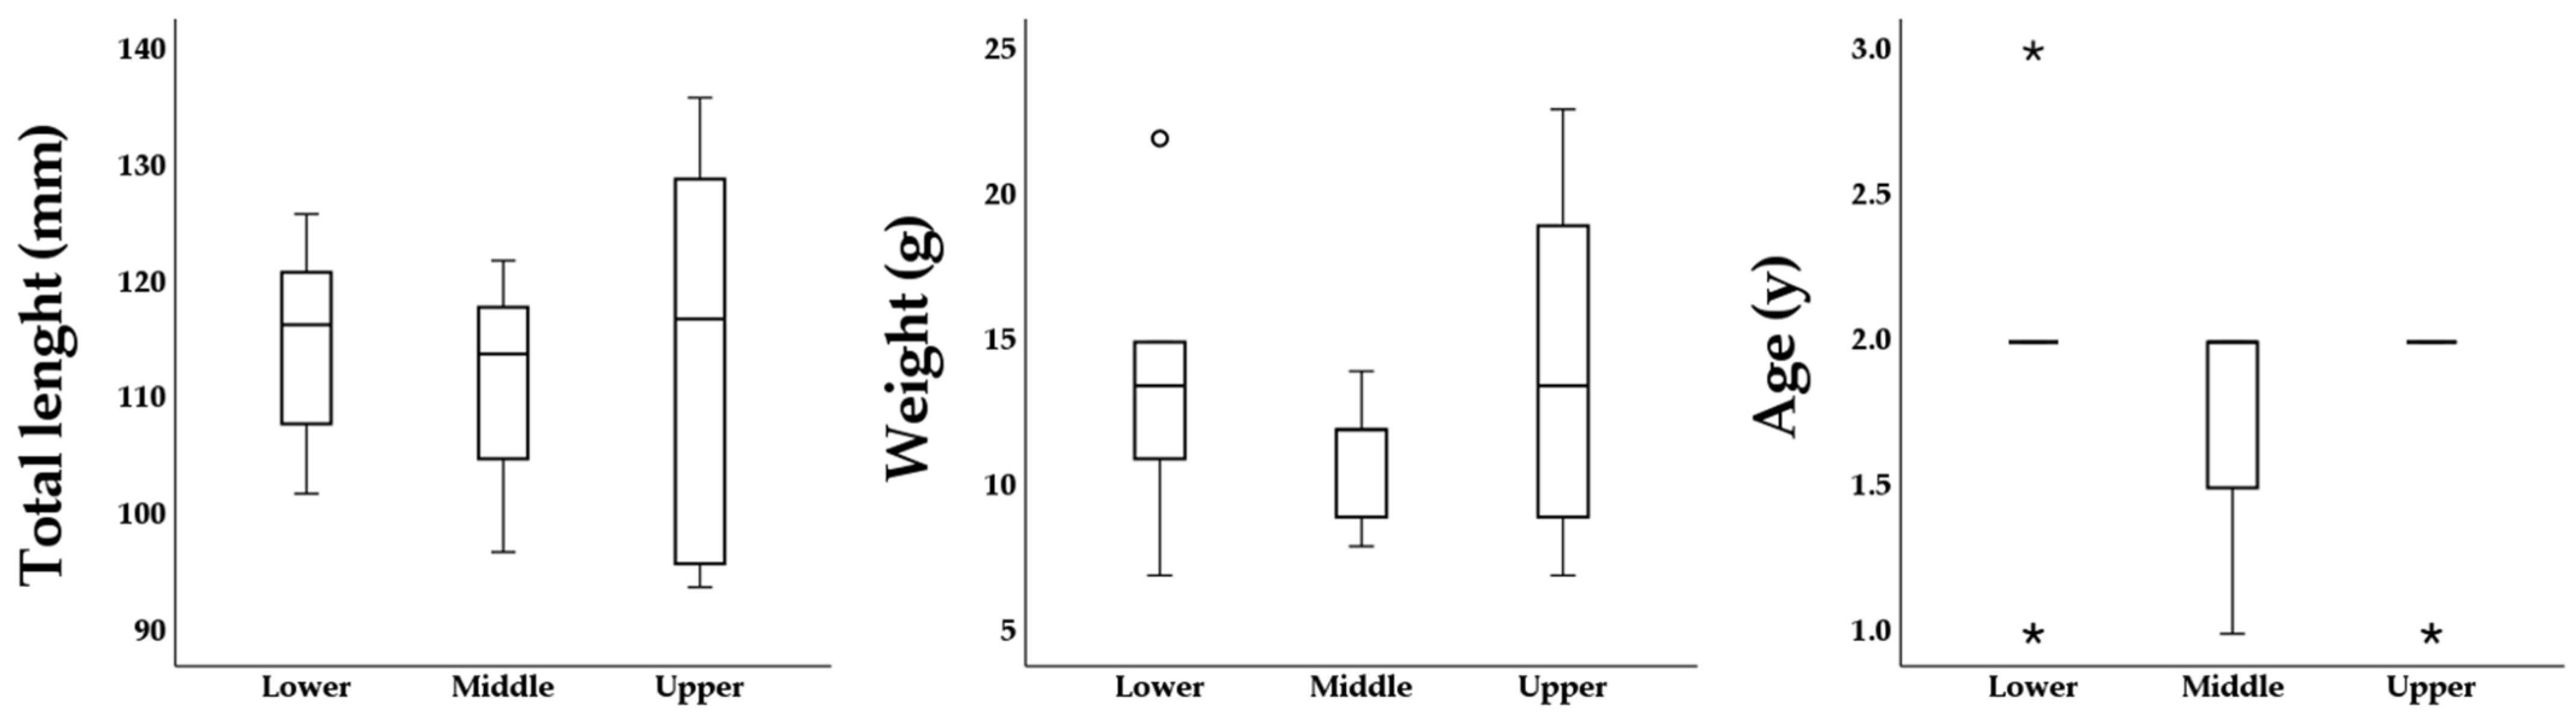
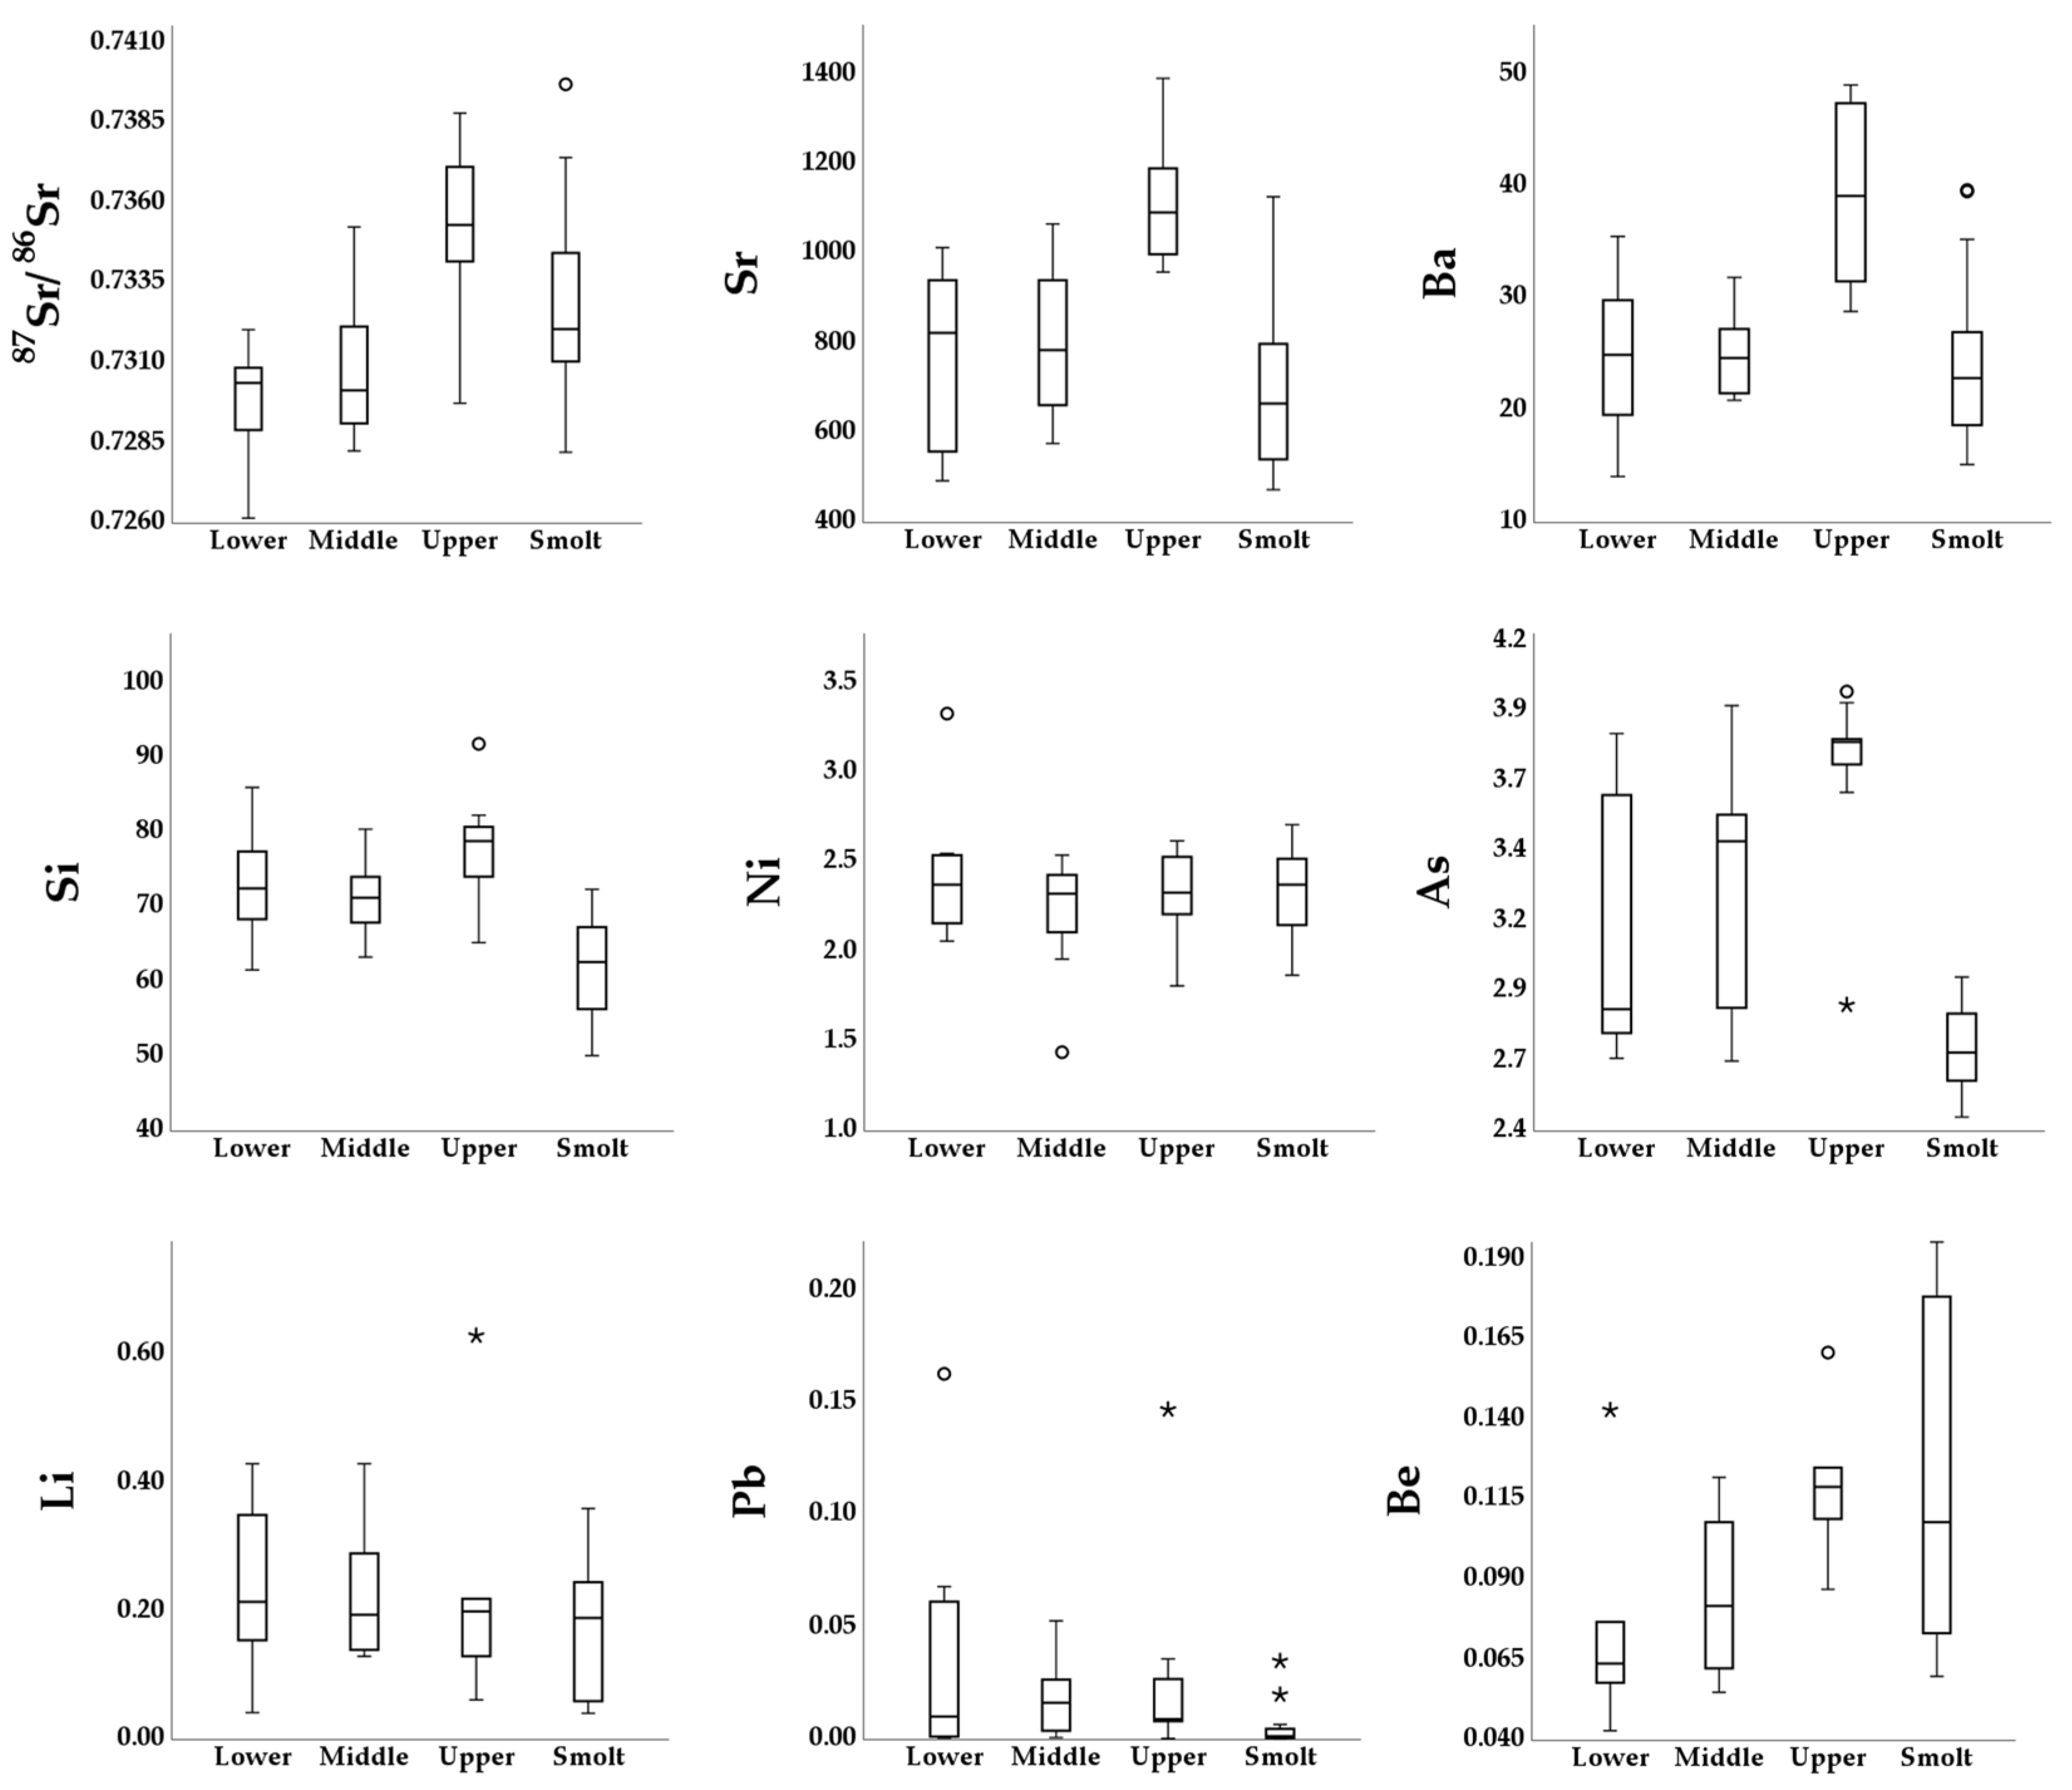
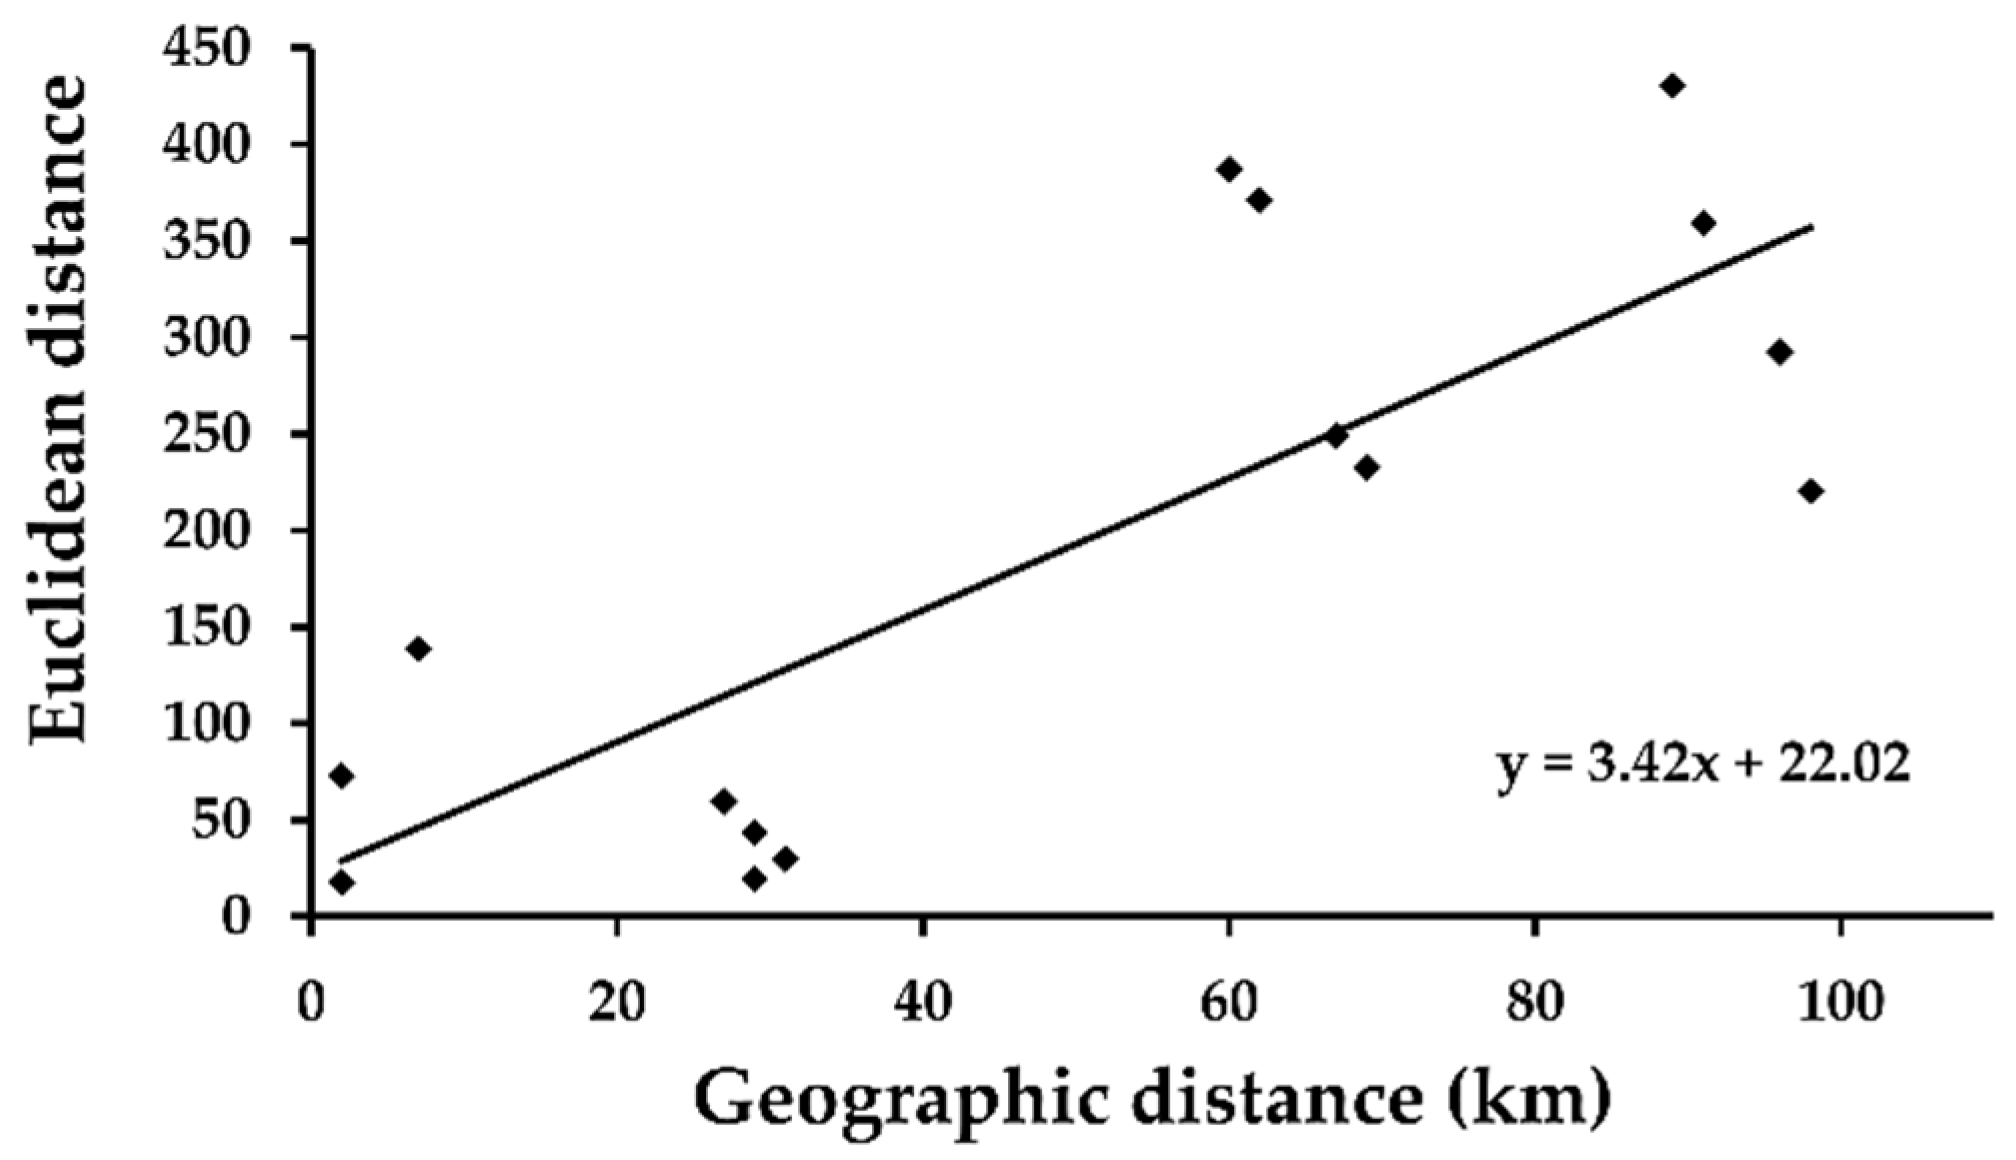
Parr were caught by electrofishing in August 2019 using a transformer (type ELT 60 NGI, Hans Grassl, Schönau am Königssee, Germany) connected to a 1 kW aggregate (Honda, Tokyo, Japan). The sampling was undertaken at three nursery areas in the main stem of River Simojoki, henceforth referred to as the lower, middle, and upper areas. For the upper and the lower areas, the uppermost and the lowermost commonly used spawning areas were selected [8,11]. The middle area was selected with the criteria that major tributary rivers should join the main stem of the river between the three sampled areas, increasing the probability that the water chemistry between the areas, and hence the otolith elemental composition for the sampled parr, would differ. From each nursery area, parr were sampled at two rapids, totalling ten parr/area (Figure 1, Table A1). The distance to the river mouth for the two lowermost rapids was 7 and 9 km, the two middle rapids 36 and 38 km, and the two uppermost rapids 98 and 105 km. Smolts, for which the nursery areas of origin were unknown, were sampled on three occasions, 24 and 31 May and 10 June 2019, covering the peak migration to the sea occurring in late May–early June in River Simojoki [5]. The sampling was undertaken using a trap net near the river mouth, and at each sampling date, ten smolts were randomly selected for the study (Figure 1, Table A1). The fish were killed by anaesthetic overdose in accordance with Directive 2010/63/EU, Annex V.
The total body length of the fish was measured to the nearest millimetre, and the fish were weighed to the nearest gram (Table A1). Scales were removed from slightly above the lateral line between the dorsal and adipose fins, and the age of the fish was visually determined by counting annuli in a microfiche reader (Table A1). The sagittal otoliths were removed from the fish, rinsed in Milli-Q® water, and left to dry for 24 h in a laminar flow cabinet. Thereafter, the otoliths were placed in silicone moulds, sulcus side facing downward, and embedded in epoxy (EpoFix, Struers, Ballerup, Denmark). Using a grinder–polisher (RotoPol 35, Struers, Ballerup, Denmark), the embedded otoliths were wet-ground on the anti-sulcus side with 800 p sandpaper (Carbimet, Buehler, Lake Bluff, IL, USA) until the edges were exposed. Subsequently, the grinding was conducted in stages with regular visual inspections under a microscope (transmitted light) until the first annuli became visible. At this stage, the otoliths were wet-ground by hand using 2500 p sandpaper (Carbimet, Buehler, Lake Bluff, IL, USA) until the primordium was exposed as determined under a microscope (transmitted light). The final polishing was conducted using a soft polishing disk (MD Nap, Struers, Ballerup, Denmark) and a 1-micron polish suspension (liquid diamond type WX, Kemet, Maidstone, UK) until the surface of the otolith was completely smooth, as inspected under a light microscope using reflective light, and the primordium was clearly visible as inspected using transmitted light. The polished otoliths were rinsed in ethanol, followed by Milli-Q® water, and wiped with a lens-cleaning tissue. Finally, the prepared otoliths were mounted on glass slides using double-sided tape. Primarily, the right-side otolith was prepared in this manner, but in cases where it was damaged or the preparation was unsuccessful, the left-side otolith was prepared instead.
In situ, Sr isotope analyses of the otoliths were performed at the Geological Survey of Finland (GTK) by means of laser ablation multi-collector inductively coupled plasma mass spectrometry (LA-MC-ICP-MS) using a Nu Plasma High-Resolution MC-ICP-MS (Nu Instruments Ltd., Wrexham, UK) and an Analyte G2 laser microprobe (Photon Machines, San Diego, CA, USA). The MC-ICP-MS was equipped with nine Faraday detectors and amplifiers with 1011 Ω resistors. The ablation was performed in helium (He) gas (gas flow 0.4 and 0.1 L/min) within a HelEx ablation cell [50]. All analyses were performed in the static ablation mode using the following parameters: beam diameter 110 μm, pulse frequency 10 Hz, and beam energy density 3.0 J/cm2. The otoliths were analysed in a spot placed on the dorsal–ventral axis with the innermost edge of the spot touching a 100 µm radius from the primordium. The location was selected to analyse the environmental history of the fish during the first summer, avoiding interference from the pre-hatch history and the maternally derived region found in the primordium [51,52]. During the laser ablation, the data were collected for 84Sr-Kr, 85Rb, 86Sr-Kr, 87Rb-Sr, and 88Sr. The measured isotope ratios were corrected for instrumental fractionation using an exponential law and an 86Sr/88Sr ratio of 0.1194. The isobaric interference of 87Rb on 87Sr was monitored and corrected using the 85Rb ion signal and a ratio of 0.38571 for 87Rb/85Rb. Preceding each ablation, the isobaric interference of 86Kr on 86Sr was corrected by measuring the background for 30 s. The accuracy of the laser ablation protocol was verified throughout the day of measurement by repeated analysis of an in-house plagioclase standard from a megacryst of the Cameroon volcanic chain ([53], sample Mir a) and a pressed standard made from the reference material FEBS-1 (certified otolith standard for trace metals, NRCC, Ottawa, ON, Canada) [54]. As the mean total Sr signal obtained for the plagioclase standard was 3.36 V, an ablation length of 120 s was needed to achieve an internal precision of ≤±0.000020 (2σ). The depth of the ablated spot was ~120 µm. The same laser ablation parameters were used for the standards as for the samples. During the course of the analysis, the mean 87Sr/86Sr ratio obtained for the plagioclase and otolith standards were 0.703067 ± 0.000093 (2σ, n = 5) and 0.709154 ± 0.000052 (2σ, n = 4), respectively, similar to their respective reference solution ratios of 0.703057 ± 0.000014 (2σ) and 0.709176 ± 0.000032 (2σ) [54]. Throughout the measurements, the mean 84Sr/86Sr was 0.05653 ± 0.00068 (2σ, n = 9), which is similar to the accepted ratio of ~0.0565 ± 0.0000 (2σ) [55].
Laser ablation single-collector (SC) ICP-MS analyses of the otoliths were performed at GTK using a Nu AttoM SC-ICP-MS (Nu Instruments Ltd., Wrexham, UK) and an Analyte 193 ArF laser-ablation system (Photon Machines, San Diego, CA, USA). The ablation was performed in He gas (gas flow 0.4 and 0.1 L/min) within a HelEx ablation cell [50]. The concentrations of the elements Sr, barium (Ba), lithium (Li), silicon (Si), nickel (Ni), lead (Pb), arsenic (As), and beryllium (Be) were measured at low resolution (∆M/M = 300) using the fast scanning mode with the following parameters: beam diameter 50 μm, pulse frequency 10 Hz, and a pulse energy of 5 mJ at 30% attenuation to produce an energy flux of 2.2 J/cm2 on the sample surface (Table A2). As with LA-MC-ICP-MS, the otoliths were analysed in a spot placed on the dorsal–ventral axis with the innermost edge touching a 100 µm radius from the primordium. The ablation length was set to 40 s for signal acquisition, followed by 20 s of background measurement. The depth of the ablated spot was ~40 µm. The analyses were performed using time-resolved analysis with continuous data acquisition for each set of points (3 standards, 12 unknown). The standard NIST612 (certified solid synthetic silicate standard, NIST, Gaithersburg, MD, USA) was used to standardise the elements Be and As, and the standard JCp-1 (certified coral standard, myStandards, Kiel, Germany) to standardise Li, Si, Ni, Sr, Pb, and Ba. The FEBS-1 standard was used for quality control, and 43Ca was used as an internal standard for quantification to increase the precision. Data reduction was handled using the software GLITTERTM which enables baseline subtraction, integration of the signal over a selected time resolve area, and quantification using known concentrations of external and internal standards [56]. As ≥10% of the measurements for Li, Pb, and Be were below the limit of quantification (LOQ), these elemental variables were excluded from all further statistical analysis.
The dependent variables total length, weight, and age were statistically analysed to determine whether these differed for parr sampled at the three nursery areas. The variables were checked for normal distribution using Shapiro–Wilk’s test (alpha level 0.05) and homogeneity of variance using Levene’s test (alpha level 0.05). The tests returned non-significant results except for the variables total length, which deviated slightly from the assumption of homogeneity of variance (p = 0.04) but was considered close enough for further parametric statistical analysis, and age, which did not conform to a normal distribution (p ≤ 0.05) and was subsequently analysed using a Kruskal–Wallis H test (alpha level 0.05). There was also an outlier for the variable weight, but as it was non-extreme; positioned only at 1.75 interquartile ranges (IQR) from the nearest quartile, it was included in the subsequent parametric statistics. The variables total length and weight were checked for multivariate outliers using Mahalanobis’ distance producing a maximum value of 10.00, which was less than the critical value of 13.82 for two dependent variables and no significant multivariate outliers were detected (p ≥ 0.001). The dependent variables were tested for multicollinearity using linear regression, revealing no strong collinearity (variance inflation factor = 6.6). Additionally, the Box’s M test (alpha level 0.001) produced an M statistic of 20.8 which was non-significant (p = 0.005), indicating the covariance matrices were homogeneous. A one-way MANOVA (alpha level 0.05) was conducted on the dependent variables total length and weight to determine whether there were differences for parr sampled at the three nursery areas. As not all assumptions for the MANOVA were strictly met, Pillai’s Trace was used to interpret the results.
The otolith elemental composition for parr sampled in River Simojoki was statistically analysed to determine whether there were differences between the nursery areas. The elemental variables 87Sr/86Sr, Sr, Ba, Si, Ni, and As were checked for normal distribution using Shapiro–Wilk’s test (alpha level 0.05) and homogeneity of variance using Levene’s test (alpha level 0.05). Ni and As failed to meet the assumption of normal distribution and were analysed using Kruskal–Wallis H tests (alpha level 0.025) with Bonferroni corrected Dunn’s post hoc tests (alpha level 0.05). Ba deviated slightly from the assumption of homogeneity of variance (p = 0.03) but was deemed close enough to be included in further parametric statistical analysis. For Si, there was an outlier in the sample from the upper nursery area, but as it was non-extreme; positioned only at 1.66 IQR from the nearest quartile, it was included in the subsequent parametric statistics. The data were checked for multivariate outliers using Mahalanobis’ distance, producing a maximum value of 11.01, which was less than the critical value of 18.47 for four dependent variables and no significant multivariate outliers were detected (p ≥ 0.001). The assumption of no multicollinearity of the dependent variables was tested using linear regression, revealing no strong collinearity (Variance Inflation Factor ≤ 5). Additionally, the Box’s M test (alpha level 0.001) produced an M statistic of 28.1 which was non-significant (p = 0.35), indicating the covariance matrices were homogeneous. A one-way MANOVA (alpha level 0.05) was conducted on the variables 87Sr/86Sr, Sr, Ba, and Si. As not all assumptions for the MANOVA were met, Pillai’s Trace was used to interpret the results. The MANOVA was followed up by multiple one-way ANOVAs (alpha level 0.05) to determine whether there were differences in single elemental variables between the sampled areas. For the elemental variables for which the ANOVAs returned a significant result, Tukey HSD tests (alpha level 0.05) were applied to pinpoint the difference.
A Mantel test was conducted to study how the geographic distance between the six sampled rapids related to the difference in otolith elemental composition for the corresponding parr samples. For the test, the elemental variables 87Sr/86Sr, Sr, Ba, Si, Ni, and As were used. The geometric centres of the otolith elemental variables, or centroids, for the six samples were determined and the Euclidean distances between these were calculated.
DFA was applied on parr caught at the three nursery areas (n = 10/area) based on a combination of the elemental variables 87Sr/86Sr, Sr, Ba, and Si. To measure the rate of correct classification for the DFA, leave-one-out cross-validation was used. The DFA was then applied to classify the smolts as originating from either the lower, middle, or upper nursery areas in River Simojoki.
In addition to the DFA, RF using the R package randomForest was trained on the parr using the elemental variables 87Sr/86Sr, Sr, Ba, Si, Ni, and As [46,57]. The number of variables tested at each split (mtry) was set to the square root of the number of elemental variables. The number of trees used in the forest (ntree) was optimised by plotting the OOB error rates and selecting an ntree after which it stabilised. The RF was applied with the optimised mtry and ntree and the importance of each elemental variable was ranked according to the Mean Decrease in Gini. To further optimise the combination of elemental variables used in the forest, the variable least important for the classification was omitted, and the RF was rerun as previously described. The process above was iterated until only two variables were left, resulting in five random forest configurations: RF1–RF5 (Table 1). The second and third iterations, RF3 and RF4, obtained the lowest OOB error rates at 36.7%. To classify the smolts as originating from either of the three sampled nursery areas, RF3 based on the elemental variables 87Sr/86Sr, Sr, Ba, and As was used.

3. Results

The MANOVA detected no significant difference on the linear combination of the variables total length and weight between parr sampled at the three nursery areas (F4, 54 = 1.283, p = 0.29, Pillai’s Trace = 0.174, partial η2 = 0.087, Figure 2). Similarly, the Kruskal–Wallis H test for the variable age was non-significant (H2 = 0.405, p = 0.82, Figure 2).
The results from the elemental analysis of parr and smolt otoliths using single- and multi-collector LA-ICP-MS are presented in Figure 3 and Table A2. The MANOVA on the linear combination of the otolith elemental variables 87Sr/86Sr, Sr, Ba, and Si detected a statistically significant difference between parr sampled at the three nursery areas (F8, 50 = 4.293, p < 0.001, Pillai’s Trace = 0.814, partial η2 = 0.407). The follow-up ANOVAs detected significant differences in the variables 87Sr/86Sr (F2, 27 = 16.104, p < 0.001, η2 = 0.544), Sr (F2, 27 = 13.139, p < 0.001, η2 = 0.493), and Ba (F2, 27 = 16.383, p < 0.001, η2 = 0.548), but not for Si (F2, 27 = 2.831, p = 0.77, η2 = 0.173). The post hoc Tukey HSD tests detected a significantly higher (p < 0.001) 87Sr/86Sr ratio for parr sampled at the upper area ( x ¯   ± SD, 0.735300 ± 0.002513) compared to the middle (0.730939 ± 0.002485) and the lower (0.729649 ± 0.001960) areas. No significant difference was detected between the middle and the lower area samples (p = 0.44). The same pattern was repeated for Sr and Ba, where the concentrations were significantly higher (p < 0.001) for the upper area sample ( x ¯ ± SD, Sr: 1115 ± 142 µg/g, Ba: 38.9 ± 7.58 µg/g) compared to the middle (Sr: 805 ± 155 µg/g, Ba: 24.9 ± 3.76 µg/g) and lower area samples (Sr: 775 ± 191 µg/g, Ba: 24.4 ± 7.27 µg/g). Again, no significant differences were detected for Sr and Ba between parr sampled at the middle and the lower areas (p = 0.91 and p = 0.98, respectively). The Kruskal–Wallis H tests for the elements which did not meet the assumptions of normal distribution detected significant differences between the parr samples for As (H2 = 10.68, p = 0.01) but not for Ni (H2 = 0.53, p = 0.76). The Dunn’s post hoc test for As detected a significant difference between the samples from the upper area ( x ¯ ± SD, 3.70 ± 0.315 µg/g) and the middle area (3.26 ± 0.448 µg/g) (p = 0.05), and between the upper and the lower area (3.07 ± 0.457 µg/g) (p = 0.01). Again, no significant difference was detected between parr sampled at the middle and the lower nursery areas (p = 1.00).
The Mantel test revealed a strong positive correlation between the Euclidean distance between otolith elemental centroids for parr sampled at the six rapids (Table 2) and the geographic distance between the rapids (r13 = 0.79, p = 0.05, 999 runs, Figure 4).
The two discriminant functions created for the DFA were statistically significant together (Λ = 0.22, X28, 30 = 38.37, p < 0.001), where discriminant function 1 had a much higher predictive ability than discriminant function 2 (Table 3). For discriminant function 1, 87Sr/86Sr and Sr had the highest loading, while Si and 87Sr/86Sr had the highest loading for discriminant function 2 (Table 3). The discriminant functions correctly classified the parr to the nursery area they were sampled from in 53.3% of cases. The highest correct classification rate was for parr sampled at the upper area (90% correctly classified), followed by parr sampled at the middle (40%) and the lower areas (30%) (Table 4).
The classification of the smolts using DFA indicated that the sample overwhelmingly was made up of fish originating from the middle nursery area (80%, n = 24), while the lower and the upper areas contributed an equally small proportion (10%, n = 3) (Figure 5, Table 5). Not surprisingly, considering the marked difference in the correct classification rates for the parr samples from the different areas, the smolts classified as originating from the upper area had the highest probability for the classification ( x ¯ ± SD, 0.94 ± 0.07), followed by the smolts classified as originating from the middle (0.71 ± 0.12) and the lower areas (0.63 ± 0.16). Smolts classified as originating from the middle and lower areas had a next to zero probability of being classified as originating from the upper area ( x ¯ ± SD, 0.01 ± 0.02, and 0.00 ± 0.00, respectively), but a quite high probability of being classified as each other (0.28 ± 0.13 and 0.37 ± 0.16, respectively). The probability of smolts classified as originating from the upper area being classified as originating from the middle or the lower areas was very small ( x ¯ ± SD, 0.05 ± 0.06 and 0.01 ± 0.01, respectively).
RF3 correctly classified the parr to the nursery area they were sampled from in 63.3% of cases. Similar to the DFA, the highest correct classification rate for RF3 was for parr sampled at the upper nursery area (100% correctly classified), followed by parr sampled at the middle (50%) and the lower areas (40%) (Table 4). Unlike the DFA, RF3 classified the largest proportion of the smolt sample as originating from the lower area (53.3%, n = 16), followed by the middle area (36.7%, n = 11), and last, the upper area (10%, n = 3) (Table 5). The probability for the classifications was also overall lower for RF3 compared to DFA, with the highest probability for smolts classified as originating from the lower area ( x ¯ ± SD, 0.69 ± 0.13), followed by smolts classified as originating from the middle (0.67 ± 0.13) and the upper areas (0.65 ± 0.22). Again, smolts classified as originating from the middle and lower areas had a very low probability of being classified as originating from the upper area ( x ¯ ± SD, 0.09 ± 0.09, and 0.01 ± 0.03, respectively) but quite a high probability of being classified as each other (0.24 ± 0.12 and 0.30 ± 0.12, respectively). The probability of smolts classified as originating from the upper area being classified as originating from the middle or the lower areas was roughly equal ( x ¯ ± SD, 0.20 ± 0.10, and 0.15 ± 0.11, respectively).
Applying DFA and RF3 to classify the smolt sample yielded quite different results, with an overall classification agreement of 57% between the two methods (Table 5). As expected, based on the overall low correct classification rate for parr sampled at the middle and the lower nursery areas, the disagreement between the methods was found in classifying smolts as originating from these areas. Excluding smolts classified as originating from the upper area where the two methods were in complete agreement, the methods only agreed in 47% of the cases.

4. Discussion

Significant differences in the otolith elemental composition for parr sampled at the three nursery areas were found in the concentrations of Sr, Ba, and As, and in the 87Sr/86Sr ratio, which all were significantly higher for parr sampled at the upper area compared to the middle and lower areas. No significant difference could be demonstrated between the parr sampled at the middle and the lower areas for any elemental variable. Support for the assumption that there exists a gradient in the elemental composition in the main stem of River Simojoki, which is reflected in the elemental composition of otoliths, was found in the strong correlation of the geographic distance between the six sampled rapids to the distance between centroids for otolith elemental composition for the corresponding parr samples (Figure 4). Interestingly, comparing the results for Ba, As, and Sr to geological maps compiled for the drainage area of River Simojoki, an unexpected pattern is revealed [58]. According to water samples from the drainage area, the concentration of Ba and As is lower in the area associated with the upper stretches of the river compared to the lower. These elements would therefore be expected to form a gradient in the river with increasing concentrations downstream, which would be reflected in the otolith elemental composition of parr sampled at the nursery areas, in other words, opposite to the pattern demonstrated in the present study. The geological maps also reveal only minor differences in concentrations of Sr in the drainage area, which would be expected to be reflected by a close to uniform concentration in the river and, consequently, in the otoliths of the sampled parr. Again, this runs contrary to results in this study, where the concentration of Sr was significantly higher in otoliths from parr sampled at the upper nursery area compared to the middle and lower areas. A final unexpected pattern was found for the element Ni for which no significant difference in the otolith concentration of parr sampled at the three nursery areas could be detected. Again consulting the geological maps, there were higher concentrations of Ni in water samples from the drainage area associated with the lower stretches of the river compared to the upper stretches. All things being equal, this pattern would have been expected to be reflected in the elemental composition of the parr otoliths. However, it is here important to note that the elemental uptake of otoliths is affected by the elemental composition of the ambient environment as a whole and, as such, is not always predictable by the availability of single elements [37].
DFA and RF3 were moderately successful in correctly classifying parr to the nursery areas from which they were sampled, with 53.3% and 63.3% correctly classified, respectively. This moderate correct classification rate still represents a marked improvement compared to random classification, which would only correctly classify the parr in 33.3% of cases. Not surprisingly, considering the significantly higher concentrations of Sr, Ba, and As and the higher 87Sr/86Sr ratio in otoliths of parr sampled at the upper area, DFA and RF3 were much better at classifying parr sampled from this area (90% and 100% correctly classified, respectively) compared to parr sampled at the other areas (30–50% correctly classified). The similarity in the otolith elemental composition for parr sampled at the middle and lower areas, leading to an overall low correct classification rate, could be interpreted as indicating the intermixing of parr between the two areas. Reliable classification requires that parr remain relatively stationary in the river and obtain an elemental composition of the otolith characteristic of the specific nursery areas before undergoing smoltification. In a study of the neighbouring River Tornionjoki, stable isotopes were successfully utilised to track smolts to their spawning grounds as no large movements of parr within the river were observed [4]. This might, however, not be entirely the case for River Simojoki as a small number of one-year-old parr are caught each spring during the annual sampling of smolt migrating to the sea [E. Jokikokko 2022, pers. comm.]. As the smolt sampling is undertaken in a pool section not suitable as a nursery for parr, and the nearest nursery areas upstream and downstream are found at a distance of ~600 m and ~300 m, respectively, it is likely that these parr are caught when relocating in the river [E. Jokikokko 2022, pers. comm.]. If parr does relocate within River Simojoki before smoltification, this will lead to the intermixing of parr originating from different nursery areas, making the otolith elemental profiles based on these parr less specific for the nursery area they were sampled from. Displacement during the parr stage would be expected to generally follow the direction of the current, gradually increasing the intermixing of the samples downstream. This could explain the higher correct classification rate for parr sampled at the upper nursery area compared to the middle and lower areas, as this sample would be the least intermixed. However, if the displacement of parr occurred frequently, the samples would have been expected to show a skew towards older and larger individuals downstream. The similarity in total length, weight, and age for parr sampled at the three nursery areas could therefore indicate that if parr did relocate before undergoing smoltification, at least it was not a prevalent phenomenon. Furthermore, as this study sampled parr at nursery areas in the river with a relatively large geographic separation, any weakening of the area specificity of the otolith elemental profiles as a consequence of intermixing of parr from nearby nursery areas would be expected to be overshadowed by the difference in the ambient environments between the sampled areas due to the large geographic distance between them. The issue of whether the similarity in the elemental composition for parr sampled at the middle and lower areas was a consequence of similarities in the ambient environments or intermixing, for now, has to remain unsettled as no water samples were gathered from the nursery areas in this study.
Determining the origin of the smolt sample using DFA and RF3 yielded quite discrepant results with an overall low classification agreement. Not surprisingly, considering the low correct classification rate for parr sampled at the lower and middle areas, the disagreement was found in classifying smolts as originating from either one of these areas. This low agreement of classification is likely a consequence of the similar otolith elemental composition for parr sampled at these nursery areas, increasing the randomness in the classification. Additionally, it is important to note that the DFA and RF3 were only trained on parr sampled at three different nursery areas, which only partially covers all the nursery areas found in the river. Therefore, smolts—which, as parr grew up at unsampled nursery areas— are likely to occur in the sample, adding error to the classification. As a consequence of the limitations mentioned above, no broader conclusions regarding the relative contribution from different nursery areas to overall smolt production could be made based on these results.
RF has been considered a less constrained and generally more powerful method for classification than traditional statistical methods such as DFA [45]. This viewpoint is supported by the present study, where the optimised RF3 had a 10% higher correct classification rate than the DFA. The study also supports the idea that when it comes to variable selection for RF, “the more” is in fact not always “the merrier” [45]. When performing the first RF with six elemental variables (87Sr/86Sr, Sr, Ba, Si, Ni, and As), a correct classification rate of 56.7% was achieved, but after subsequent removal of the least informative variables, the rate was increased to 63.3% using only four variables (87Sr/86Sr, Sr, Ba, and As) (Table 1). This goes to show that not all elemental variables contribute equally to classification success, and some variables might actually contribute more noise than signal [45]. Furthermore, the analysis also loses power as variables are added, i.e., the more variables, the more observations are needed.

5. Conclusions

The present study demonstrated the potential of analysing the elemental composition of otoliths to determine the nursery ground of origin for salmon in River Simojoki. Significant differences in the otolith elemental composition were detected for parr sampled at the upper nursery area compared to the middle and lower areas. Applying DFA and RF to reclassify the parr to the sampled nursery areas proved only moderately successful due to the similarity in the otolith elemental composition for parr sampled at the middle and lower areas. However, these methods achieved a very high correct classification rate of 90% and 100%, respectively, for parr sampled at the upper nursery area. These results warrant further sampling of parr from all the known nursery areas in River Simojoki to investigate whether the methodology used here can be applied to distinguish salmon originating from different nursery areas at a finer spatial scale. The assumption of only minor displacement of salmon within the river before smoltification also has to be tested as the intermixing of fish originating from different nursery areas would be expected to have a larger effect if a finer spatial scale were considered than in the present study, where the areas sampled had a relatively large geographic separation. As such, it might be better to sample salmon at an earlier life stage, either as fry or free embryos, which would leave fewer opportunities for displacement from the initial nursery areas and for intermixing. Additionally, water samples from the nursery areas should be gathered as many comparable studies have found such samples informative in interpreting the elemental composition of otoliths (e.g., [23,32,59]). The end goal should be to develop a model to determine the nursery ground of origin for adult salmon and smolts, which, for example, could be used to investigate questions such as nursery ground fidelity of returning spawners, run timing of smolts originating from different nursery grounds, and the relative contribution of the different nursery grounds to overall smolt production. All are questions of importance in order to devise efficient management programmes sustaining natural salmon production.

Author Contributions

Conceptualization, V.F., E.J., J.-O.L. and H.H.; formal analysis, V.F.; investigation, V.F., E.J., J.-O.L. and Y.L.; resources, E.J.; data curation, V.F.; writing—original draft preparation, V.F., E.J. and Y.L.; writing—review and editing, V.F., E.J., J.-O.L., H.H. and K.L.; visualization, V.F.; supervision, J.-O.L. and K.L.; project administration, E.J. and K.L.; funding acquisition, E.J. All authors have read and agreed to the published version of the manuscript.

Funding

This research received no external funding. The APC was funded by Gösta Branders research fund, Åbo Akademi Research Foundation.

Institutional Review Board Statement

The sampling was performed in accordance with the ethical code for experimental animals set by Project Authorisation Board Finland, and Finnish legislation (Finnish Act 497/2013 and Decree 564/2013, Annex 2). Permission to use the electrofishing equipment was granted by the Centre for Economic Development, Transport and the Environment. The research protocols were approved by Natural Research Institute Finland.

Data Availability Statement

All data are disclosed in the manuscript.

Acknowledgments

Arto Peltola, University of Turku; Jarno Jääskeläinen, LUKE; Ari Leskelä, LUKE; Matti Kylmäaho, LUKE; Phoebe Armitage, ÅAU; The Swedish Cultural Foundation in Finland; Nordenskiöld Society in Finland.

Conflicts of Interest

The authors declare no conflict of interest.

Appendix A

Table A1. Data for salmon sampled in River Simojoki.
IDSampled RapidNursery AreaDateLength (mm)Weight (g)Age (Y)
ParrSJ.P 731lower7.8126223
SJ.P 741lower7.810272
SJ.P 751lower7.8113112
SJ.P 2862lower16.8121152
SJ.P 2872lower16.8108101
SJ.P 2882lower16.8117142
SJ.P 2892lower16.8117132
SJ.P 2902lower16.8122142
SJ.P 2912lower16.8107111
SJ.P 2922lower16.8116152
SJ.P 2463middle15.8113122
SJ.P 2473middle15.8122142
SJ.P 2483middle15.8115122
SJ.P 2493middle15.810592
SJ.P 2503middle15.89781
SJ.P 1884middle14.811813*
SJ.P 1894middle14.810791
SJ.P 1904middle14.8117122
SJ.P 1914middle14.811812*
SJ.P 1924middle14.8102112
SJ.P 1165upper8.8129192
SJ.P 1175upper8.89692
SJ.P 1185upper8.89471
SJ.P 1195upper8.8117142
SJ.P 1205upper8.89571
SJ.P 1066upper8.8136222
SJ.P 1076upper8.8136232
SJ.P 1086upper8.8113132
SJ.P 1096upper8.812014*
SJ.P 1106upper8.8117132
SmoltSJ.S 83 24.5121123
SJ.S 90 24.5131163
SJ.S 91 24.5128153
SJ.S 92 24.5130153
SJ.S 93 24.5150213
SJ.S 94 24.5145214
SJ.S 95 24.5142213
SJ.S 96 24.5147223
SJ.S 97 24.5144203
SJ.S 99 24.5148213
SJ.S 312 31.5125153
SJ.S 319 31.5124153
SJ.S 320 31.5122143
SJ.S 321 31.5131173
SJ.S 322 31.5132153
SJ.S 323 31.5134183
SJ.S 324 31.5134153
SJ.S 325 31.5134173
SJ.S 326 31.5127133
SJ.S 328 31.5116133
SJ.S 474 10.6129183
SJ.S 477 10.6123152
SJ.S 479 10.6162*4
SJ.S 480 10.6128*3
SJ.S 481 10.6128*3
SJ.S 482 10.6118*2
SJ.S 483 10.6124*2
SJ.S 484 10.6129*3
SJ.S 485 10.6152272
SJ.S 486 10.6142204
* missing value.
Table A2. Otolith elemental composition for salmon sampled in River Simojoki. All elemental measurements, except for 87Sr/86Sr, are in µg/g. LOD = limit of detection, BDL = below detection limit.
IDNursery
Area
87Sr/86SrLiSiNiSrBaPbBeAs
ParrSJ.P 73lower0.730880.2586.03.3371327.40.1630.0643.7
SJ.P 74lower0.726160.3983.82.4886235.5BDL0.0433.8
SJ.P 75lower0.730590.4375.22.4689929.90.0181BDL3.6
SJ.P 286lower0.730830.0477.52.5595422.60.0550.0772.8
SJ.P 287lower0.730180.1568.42.5494128.20.0680.0582.8
SJ.P 288lower0.729630.3161.62.0678420.50.00128BDL2.7
SJ.P 289lower0.73205BDL70.42.1655819.60.002460.1432.8
SJ.P 290lower0.730860.1674.62.2949314.5BDLBDL2.8
SJ.P 291lower0.72891BDL69.12.22101431.60.00072BDL3.1
SJ.P 292lower0.72640.1867.92.1653114.10.00131BDL2.7
SJ.P 246middle0.73154BDL73.22.3366224.00.00388BDL3.5
SJ.P 247middle0.735260.2266.41.4480421.30.0207BDL2.8
SJ.P 248middle0.72948BDL67.92.5487525.40.01220.072.9
SJ.P 249middle0.734780.2963.32.1176621.70.0219BDL2.8
SJ.P 250middle0.72826BDL70.51.9695927.30.0530.0942.7
SJ.P 188middle0.730820.1780.42.357620.90.000860.0553.9
SJ.P 189middle0.729240.4374.12.3294131.90.00640.1223.7
SJ.P 190middle0.728740.1476.52.4365721.50.0454BDL3.4
SJ.P 191middle0.72912BDL72.02.34106629.40.00177BDL3.4
SJ.P 192middle0.732150.1369.12.4874325.70.0267BDL3.5
SJ.P 116upper0.73690.2280.82.34115341.80.1470.1613.6
SJ.P 117upper0.73496BDL65.32.34139247.40.036BDL2.9
SJ.P 118upper0.73418BDL76.32.53119133.40.00850.1193.8
SJ.P 119upper0.73378BDL80.32.3108128.80.001560.1093.8
SJ.P 120upper0.729750.1373.32.6110340.4BDLBDL3.7
SJ.P 106upper0.735690.6391.92.0399949.10.000490.0873.9
SJ.P 107upper0.73714BDL82.32.62128347.80.00910.1254.0
SJ.P 108upper0.737150.0678.21.81100131.50.027BDL3.8
SJ.P 109upper0.738820.2079.52.2198430.90.0097BDL3.8
SJ.P 110upper0.73463BDL74.12.3295938.00.0082BDL3.8
SmoltSJ.S 83 0.724770.0467.12.1854118.70.00232BDL2.7
SJ.S 90 0.732040.2670.32.1751418.20.00062BDL2.9
SJ.S 91 0.731660.2066.72.5655517.00.00065BDL2.6
SJ.S 92 0.731730.1670.52.0188926.00.00069BDL2.5
SJ.S 93 0.734950.1472.42.6894835.30.0350.092.7
SJ.S 94 0.733530.2671.42.3853115.2BDLBDL2.7
SJ.S 95 0.73170.0468.02.2550518.70.00084BDL2.6
SJ.S 96 0.73231BDL67.82.5150318.70.00490.222.5
SJ.S 97 0.72985BDL68.12.4579924.80.0067BDL2.9
SJ.S 99 0.732550.1751.52.5259326.20.00072BDL2.6
SJ.S 312 0.733880.0662.11.9557425.00.00120.062.6
SJ.S 319 0.736510.3367.32.0675021.90.000450.0782.7
SJ.S 320 0.732010.3666.82.1955315.90.0015BDL2.6
SJ.S 321 0.735330.3064.62.1566225.4BDL0.1082.6
SJ.S 322 0.735BDL60.32.3777925.0BDL0.0682.5
SJ.S 323 0.728520.0663.12.1350816.3BDL0.0692.7
SJ.S 324 0.73445BDL57.92.1768129.90.001580.2182.5
SJ.S 325 0.731330.2360.22.0855822.70.005BDL2.6
SJ.S 326 0.73210.0563.41.8752821.3BDLBDL2.5
SJ.S 328 0.731060.2353.32.7147320.30.00064BDL2.7
SJ.S 474 0.73292BDL56.42.6175623.10.001030.1443.0
SJ.S 477 0.72822BDL56.92.2754518.60.020.2132.9
SJ.S 479 0.739720.1259.42.39100239.60.0065BDL2.8
SJ.S 480 0.72920.2155.82.5282019.00.0016BDL2.8
SJ.S 481 0.73074BDL55.21.9683127.0BDLBDL2.8
SJ.S 482 0.731110.0655.02.6772521.90.0047BDL2.7
SJ.S 483 0.73527BDL56.82.6266927.00.0016BDL2.9
SJ.S 484 0.7306BDL65.22.592934.90.000610.1142.9
SJ.S 485 0.737430.2250.12.55112739.70.00142BDL2.8
SJ.S 486 0.733480.1850.62.3969834.2BDLBDL2.5
LOD ± SD 0.035 ± 0.0060.345 ± 0.0360.0591 ± 0.00350.003021 ± 0.0006010.000626 ± 0.0000900.000306 ± 0.0000800.0214 ± 0.00600.023 ± 0.002
LOQ ± SD 0.104 ± 0.0191.034 ± 0.1070.1772 ± 0.01040.009063 ± 0.0018020.001879 ± 0.0002710.000917 ± 0.0002400.0641 ± 0.01800.068 ± 0.007

References

  1. HELCOM. Red List Species Information Sheets (SIS) Fish. Available online: https://helcom.fi/wp-content/uploads/2019/08/HELCOM-RedList-All-SIS_Fish.pdf (accessed on 19 November 2018).
  2. Karlsson, L.; Karlström, Ö. The Baltic salmon (Salmo salar L.): Its history, present situation and future. Dana 1994, 10, 61–85. [Google Scholar]
  3. McCormick, S.D.; Hansen, L.P.; Quinn, T.P.; Saunders, R.L. Movement, migration, and smolting of Atlantic salmon (Salmo salar) life history. Can. J. Fish. Aquat. Sci. 1998, 55, 48–58. [Google Scholar] [CrossRef]
  4. Linnansaari, T.; Romakkaniemi, A.; Vähä, V.; Perä, I.; Cunjak, R.; Graham, B. Pysyvien isotooppien käyttö Tornionjoen eri vesistönosien lohen poikastuotannon arvioinnissa. [The Use of Stable Isotopes in the Assessment of Salmon Fry Production in Different Parts of the Tornionjoki Water Body]. Available online: https://tlinnans.ext.unb.ca/SIATornio_Linnansaarietal.pdf (accessed on 29 May 2023).
  5. Jutila, E.; Jokikokko, E.; Julkunen, M. The smolt run and postsmolt survival of Atlantic salmon, Salmo salar L., in relation to early summer water temperatures in the northern Baltic Sea. Ecol. Freshw. Fish. 2005, 14, 69–78. [Google Scholar] [CrossRef]
  6. Klemetsen, A.; Amundsen, P.-A.; Dempson, J.B.; Jonsson, B.; Jonsson, N.; O’Connell, M.F.; Mortensen, E. Atlantic salmon Salmo salar L., brown trout Salmo trutta L. and Arctic charr Salvelinus alpinus (L.): A review of aspects of their life histories. Ecol. Freshw. Fish. 2003, 12, 1–59. [Google Scholar] [CrossRef]
  7. ICES. Baltic Salmon and Trout assessment working group (WGBAST). ICES Sci. Rep. 2021, 3, 331. [Google Scholar] [CrossRef]
  8. Romakkaniemi, A.; Perä, I.; Karlsson, L.; Jutila, E.; Carlsson, O.; Pakarinen, T. Development of wild Atlantic salmon stocks in the rivers of the northern Baltic Sea in response to management measures. ICES J. Mar. Sci. 2003, 60, 329–342. [Google Scholar] [CrossRef]
  9. HELCOM. Salmon and Sea Trout Populations and Rivers in the Baltic Sea—HELCOM assessment of salmon (Salmo salar) and sea trout (Salmo trutta) populations and habitats in rivers flowing to the Baltic Sea. Balt. Sea Environ. Proc. 2011, 126A, 82. [Google Scholar]
  10. HELCOM. Abundance of Salmon Spawners and Smolt. HELCOM Core Indicator Report. Available online: www.helcom.fi/wp-content/uploads/2019/08/Abundance-of-salmon-spawners-and-smolt-HELCOM-core-indicator-2018.pdf (accessed on 8 August 2022).
  11. Jutila, E. From the River to the Open Sea—A Critical Life Phase of Young Atlantic Salmon Migrating from the Simojoki River. Ph.D. Thesis, University of Helsinki, Helsinki, Finland, 13 June 2008. [Google Scholar]
  12. Romakkaniemi, A.; Jokikokko, E.; Turunen, J.; Pakarinen, T.; Pulkkinen, H. Toimenpideohjelma Simojoen lohikannan elvyttämiseksi. [Action Programme for the Recovery of the River Simojoki Salmon Population]. Maa-Ja Metsätalousministeriö 2020, 12, 52. [Google Scholar]
  13. WATERINFO.fi. Available online: wwwi2.ymparisto.fi/i2/64/q6400410y/wqfi.html (accessed on 4 April 2023).
  14. Jokikokko, E.; Mäntyniemi, S. The survival of stocked Atlantic salmon smolts during sea run and the timing of migration in the river Simojoki, northern Finland. Aquaculture 2003, 219, 431–444. [Google Scholar] [CrossRef]
  15. Jokikokko, E.; Jutila, E. The effects of stocking with salmon parr, Salmo salar, on the smolt production in the River Simojoki, Northern Finland. In Stocking and Introduction of Fish; Cowx, I.G., Ed.; Blackwell Science Ltd.: Oxford, UK, 1998; pp. 35–45. [Google Scholar]
  16. Jutila, E.; Jokikokko, E.; Julkunen, M. Management of Atlantic salmon in the Simojoki river, northern Gulf of Bothnia: Effects of stocking and fishing regulation. Fish. Res. 2003, 64, 5–17. [Google Scholar] [CrossRef]
  17. Jokikokko, E. Atlantic Salmon (Salmo salar L.) Stocking in the Simojoki River as a Management Practice. Ph.D. Thesis, University of Oulu, Oulu, Finland, 24 November 2006. [Google Scholar]
  18. Jokikokko, E.; Jutila, E.; Kallio-Nyberg, I. Changes in smolt traits of Atlantic salmon (Salmo salar Linnaeus, 1758) and linkages to parr density and water temperature. J. Appl. Ichthyol. 2016, 32, 832–839. [Google Scholar] [CrossRef]
  19. Jutila, E.; Jokikokko, E.; Ikonen, E. Post-smolt migration of Atlantic salmon, Salmo salar L., from the Simojoki river to the Baltic Sea. J. Appl. Ichthyol. 2009, 25, 190–194. [Google Scholar] [CrossRef]
  20. Lilja, J.; Jaala, E.; Jokikokko, E.; Romakkaniemi, A. Simojoen nousulohien kaikuluotaustutkimukset vuosina 2003–2005. [Hydroacoustic assessment of salmon spawning migration into the River Simojoki in 2003–2005]. Kala-Ja Riistarapporteja 2006, 387, 29. [Google Scholar]
  21. Rasmussen, G.; Aarestrup, K.; Jepsen, N. Mortality of sea trout (Salmo trutta L.) and Atlantic salmon (Salmo salar L.) smolts during seaward migration through rivers and lakes in Denmark. ICES C.M. 1996, T:9, 1–14. [Google Scholar]
  22. Rohtla, M.; Vetemaa, M.; Svirgsden, R.; Taal, I.; Saks, L.; Kesler, M.; Verliin, A.; Saat, T. Using otolith 87Sr:86Sr as a natal chemical tag in the progeny of anadromous Baltic Sea pike (Esox lucius)—A pilot study. Boreal Environ. Res. 2014, 19, 379–386. [Google Scholar]
  23. Martin, J.; Bareille, G.; Berail, S.; Pécheyran, C.; Daverat, F.; Bru, N.; Tabouret, H.; Donard, O. Spatial and temporal variations in otolith chemistry and relationships with water chemistry: A useful tool to distinguish Atlantic salmon Salmo salar parr from different natal streams. J. Fish Biol. 2013, 82, 1556–1581. [Google Scholar] [CrossRef] [PubMed]
  24. Reader, J.M.; Spares, A.D.; Stokesbury, M.J.; Avery, T.; Dadswell, M.J. Elemental fingerprints of otoliths from smolt of Atlantic salmon, Salmo salar Linnaeus, 1758, from three maritime watersheds: Natural tag for stock discrimination. Proc. Nova Scotian Inst. Sci. 2015, 48, 91–123. [Google Scholar] [CrossRef] [Green Version]
  25. Veinott, G.; Porter, R. Using otolith microchemistry to distinguish Atlantic salmon (Salmo salar) parr from different natal streams. Fish. Res. 2005, 71, 349–355. [Google Scholar] [CrossRef]
  26. Engstedt, O.; Engkvist, R.; Larsson, P. Elemental fingerprinting in otoliths reveals natal homing of anadromous Baltic Sea pike (Esox lucius L.). Ecol. Freshw. Fish. 2014, 23, 313–321. [Google Scholar] [CrossRef]
  27. Gahagan, B.I.; Vokoun, J.C.; Whitledge, G.W.; Schultz, E.T. Evaluation of Otolith Microchemistry for Identifying Natal Origin of Anadromous River Herring in Connecticut. Mar. Coast. Fish. 2012, 4, 358–372. [Google Scholar] [CrossRef]
  28. Barbee, N.; Swearer, S. Characterizing natal source population signatures in the diadromous fish Galaxias maculatus, using embryonic otolith chemistry. Mar. Ecol. Prog. Ser. 2007, 343, 273–282. [Google Scholar] [CrossRef]
  29. Wells, B.K.; Rieman, B.E.; Clayton, J.L.; Horan, D.L.; Jones, C.M. Relationships between Water, Otolith, and Scale Chemistries of Westslope Cutthroat Trout from the Coeur d’Alene River, Idaho: The Potential Application of Hard-Part Chemistry to Describe Movements in Freshwater. Trans. Am. Fish. Soc. 2003, 132, 409–424. [Google Scholar] [CrossRef]
  30. Martin, J.P.; Bareille, G.; Berail, S.; Pécheyran, C.; Gueraud, F.; Lange, F.; Daverat, F.; Bru, N.; Beall, E.P.; Barracou, D.; et al. Persistence of a southern Atlantic salmon population: Diversity of natal origins from otolith elemental and Sr isotopic signatures. Can. J. Fish. Aquat. Sci. 2013, 70, 182–197. [Google Scholar] [CrossRef]
  31. Shrimpton, J.M.; Warren, K.D.; Todd, N.L.; McRae, C.J.; Glova, G.J.; Telmer, K.; Clarke, A.D. Freshwater movement patterns by juvenile Pacific salmon Oncorhynchus spp. before they migrate to the ocean: Oh the places you’ll go! J. Fish Biol. 2014, 85, 987–1004. [Google Scholar] [CrossRef] [PubMed]
  32. Bourret, S.L.; Kennedy, B.P.; Caudill, C.C.; Chittaro, P.M. Using otolith chemical and structural analysis to investigate reservoir habitat use by juvenile Chinook salmon Oncorhynchus tshawytscha. J. Fish Biol. 2014, 85, 1507–1525. [Google Scholar] [CrossRef]
  33. Miyan, K.; Khan, M.A.; Patel, D.K.; Khan, S.; Prasad, S. Otolith fingerprints reveal stock discrimination of Sperata seenghala inhabiting the Gangetic river system. Ichthyol. Res. 2016, 63, 294–301. [Google Scholar] [CrossRef]
  34. Olley, R.; Young, R.G.; Closs, G.P.; Kristensen, E.A.; Bickel, T.O.; Deans, N.A.; Davey, L.N.; Eggins, S.M. Recruitment sources of brown trout identified by otolith trace element signatures. N. Z. J. Mar. Freshw. Res. 2011, 45, 395–411. [Google Scholar] [CrossRef] [Green Version]
  35. Turcotte, L.A.; Shrimpton, J.M. Assessment of spawning site fidelity in interior Fraser River coho salmon Oncorhynchus kisutch using otolith microchemistry, in British Columbia, Canada. J. Fish Biol. 2020, 97, 1833–1841. [Google Scholar] [CrossRef]
  36. Panfili, J.; de Pontual, H.; Troadec, H.; Wright, P. Manual of Fish Sclerochronology; IFREMER-IRD: Brest, France, 2002; p. 464. ISBN 2-84433-067-3. [Google Scholar]
  37. Campana, S.E. Chemistry and composition of fish otoliths: Pathways, mechanisms and applications. Mar. Ecol. Prog. Ser. 1999, 188, 263–297. [Google Scholar] [CrossRef] [Green Version]
  38. Hüssy, K.; Limburg, K.E.; de Pontual, H.; Thomas, O.R.; Cook, P.K.; Heimbrand, Y.; Blass, M.; Sturrock, A.M. Trace Element Patterns in Otoliths: The Role of Biomineralization. Rev. Fish. Sci. Aquac. 2020, 29, 445–477. [Google Scholar] [CrossRef]
  39. Nazir, A.; Khan, M.A. Using otoliths for fish stock discrimination: Status and challenges. Acta. Ichthyol. Piscat. 2021, 51, 199–218. [Google Scholar] [CrossRef]
  40. Walther, B.D.; Thorrold, S.R. Continental-scale variation in otolith geochemistry of juvenile American shad (Alosa sapidissima). Can. J. Fish. Aquat. Sci. 2008, 65, 2623–2635. [Google Scholar] [CrossRef]
  41. Löfvendahl, R.; Åberg, G.; Hamilton, P.J. Strontium in rivers of the Baltic Basin. Aquat. Sci. 1990, 52, 315–329. [Google Scholar] [CrossRef]
  42. Åberg, F.; Wickman, F.E. Variations of 87Sr/86Sr in water from streams discharging into the Bothnian Bay, Baltic Sea. Nord. Hydrol. 1987, 18, 33–42. [Google Scholar] [CrossRef]
  43. Rohtla, M.; Svirgsden, R.; Verliin, A.; Rumvolt, K.; Matetski, L.; Hommik, K.; Saks, L.; Vetemaa, M. Developing novel means for unravelling population structure, provenance and migration patterns of European whitefish Coregonus lavaretus s.l. in the Baltic Sea. Fish. Res. 2017, 187, 47–57. [Google Scholar] [CrossRef]
  44. Matetski, L.; Rohtla, M.; Svirgsden, R.; Kesler, M.; Saks, L.; Taal, I.; Hommik, K.; Paiste, P.; Kielman-Schmitt, M.; Kooijman, E.; et al. Variability in stream water chemistry and brown trout (Salmo trutta L.) parr otolith microchemistry on different spatial scales. Ecol. Freshw. Fish. 2022, 31, 438–453. [Google Scholar] [CrossRef]
  45. Mercier, L.; Darnaude, A.M.; Bruguier, O.; Vasconcelos, R.P.; Cabral, H.N.; Costa, M.J.; Lara, M.R.; Jones, D.L.; Mouillot, D. Selecting statistical models and variable combinations for optimal classification using otolith microchemistry. Ecol. Appl. 2011, 21, 1352–1364. [Google Scholar] [CrossRef]
  46. Breiman, L. Random forests. Mach. Learn. 2001, 45, 5–32. [Google Scholar] [CrossRef] [Green Version]
  47. Díaz-Uriarte, R.; Andrés, S.A. Gene selection and classification of microarray data using random forest. BMC Bioinform. 2006, 73, 3. [Google Scholar] [CrossRef] [Green Version]
  48. Finnish Environment Institute. OIVA—Ympäristö-ja Paikkatietopalvelu Asiantuntijoille. [OIVA—Environmental and Geographic Information Service for Experts]. Available online: https://wwwp2.ymparisto.fi/scripts/oiva.asp (accessed on 22 February 2011).
  49. National Land Survey of Finland; Helsinki, Finland. Permission 53/MML/10, 2023.
  50. Müller, W.; Shelley, M.; Miller, P.; Broude, S.V. Initial performance metrics of a new custom-designed ArF excimer LA-ICPMS system coupled to a two-volume laser-ablation cell. J. Anal. At. Spectrom. 2009, 24, 209–214. [Google Scholar] [CrossRef]
  51. Kalish, J.M. Use of Otolith Microchemistry to Distinguish the Progeny of Sympatric Anadromous and Non-anadromous Salmonids. Fish. Bull. 1990, 88, 657–666. [Google Scholar]
  52. Meekan, M.G.; Dodson, J.J.; Good, S.P.; Ryan, D.A.J. Otolith and fish size relationships, measurement error, and size-selective mortality during the early life of Atlantic salmon. Can. J. Fish. Aquat. Sci. 1998, 55, 1663–1673. [Google Scholar] [CrossRef]
  53. Rankenburg, K.; Lassiter, J.C.; Brey, G.P. Origin of megacrysts in volcanic rocks of the Cameroon volcanic chain—Constraints on magma genesis and crustal contamination. Contrib. Mineral. Petrol. 2004, 147, 129–144. [Google Scholar] [CrossRef]
  54. Yang, Z.; Fryer, B.; Longerich, H.P.; Gagnon, J.E.; Samson, I. 785 nm femtosecond laser ablation for improved precision and reduction of interferences in Sr isotope analyses using MC-ICP-MS. J. Anal. At. Spectrom. 2011, 26, 341–351. [Google Scholar] [CrossRef]
  55. Thirlwall, M. Long-term reproducibility of multicollector Sr and Nd isotope ratio analysis. Chem. Geol. 1991, 94, 85–104. [Google Scholar] [CrossRef]
  56. Van Achterbergh, E.; Ryan, C.; Jackson, S.; Griffin, W. GLITTER: Data reduction software for LA-ICP-MS. Mineral. Assoc. Can. 2001, 29, 239–243. [Google Scholar]
  57. Liaw, A.; Wiener, M.C. Classification and regression by randomForest. R News 2002, 2, 18–22. [Google Scholar]
  58. Geochemical Atlas of Europe. Available online: http://weppi.gtk.fi/publ/foregsatlas/index.php (accessed on 28 August 2022).
  59. Zimmerman, C.E.; Edwards, G.W.; Perry, K. Maternal origin and migratory history of steelhead and rainbow trout captured in rivers of the Central Valley. Calif. Trans. Am. Fish. Soc. 2009, 138, 280–291. [Google Scholar] [CrossRef]
Figure 1. Map of River Simojoki and its associated drainage area. The small circles represent the rapids from which the parr were sampled, and the star the sampling site for the smolts. The parr samples from rapids—1 and 2, 3 and 4, and 5 and 6 were pooled into samples denoted as the lower, middle, and upper nursery areas, respectively. The border of the drainage area was retrieved from the Finnish Environment Institute [48]. Rivers, lakes, and the national border were adapted with permission from the National Land Survey of Finland [49].
Fishes 08 00332 g001
Figure 2. Boxplots depicting the total length, weight, and age for parr sampled at the lower, middle, and upper nursery areas in River Simojoki. The lower and upper edges of the box depict the upper and lower quartiles, and the line within the box depicts the median. ○ = outlier 1.5–3 interquartile ranges (IQR) from the nearest quartile, * = outlier ˃ 3 IQR from the nearest quartile.
Fishes 08 00332 g002
Figure 3. Boxplots depicting the elemental composition of otoliths from parr sampled at the lower, middle, and upper nursery areas in River Simojoki, and smolts sampled near the river mouth. The lower and upper edges of the box depict the upper and lower quartiles, and the line within the box depicts the median. All measurements except 87Sr/86Sr are in µg/g. ○ = outlier 1.5–3 IQR from the nearest quartile, * = outlier ˃ 3 IQR from the nearest quartile.
Fishes 08 00332 g003
Figure 4. The linear relationship between the Euclidean distance between otolith elemental centroids for parr sampled at the six rapids and geographic distance between the rapids.
Fishes 08 00332 g004
Figure 5. DFA based on a combination of the otolith elemental variables 87Sr/86Sr, Sr, Ba, and Si for parr caught at three nursery areas in River Simojoki. The DFA was applied on smolts caught near the river mouth to determine the nursery area of origin. Larger symbols represent group centroids.
Fishes 08 00332 g005
Table 1. Summary for all the random forest (RF) configurations tested. The second iteration, RF3, was used for classifying the smolt sample. ntree = number of trees used in the forest, mtry = number of variables tested at each split, OOB = out-of-bag error rates.
Mean Decrease in Gini
NiSiAs87Sr/86SrSrBantreemtryOOB%
RF11.892.112.924.154.234.08801243.3
RF2 2.203.324.614.594.60501246.7
RF3 3.455.185.315.401001236.7
RF4 6.346.526.50501136.7
RF5 9.1310.101501143.3
Table 2. Euclidean distance between centroids for the otolith elemental variables 87Sr/86Sr, Sr, Ba, Si, Ni, and As for parr sampled at six rapids in River Simojoki.
Sampled Rapid23456
172.8919.2329.58359.14220.42
2 59.5643.55430.68292.34
3 17.64371.17232.96
4 387.43248.95
5 138.88
Table 3. Discriminant functions 1 and 2 used for the discriminant function analysis (DFA). The standardised canonical discriminant function coefficients are presented for the elements used.
Discriminant FunctionEigenvalue% of VarianceCanonical Correlation87Sr/86SrSiSrBa
13.28898.50.8760.7570.2540.4640.389
20.051.50.218−0.4950.9020.31−0.133
Table 4. Confusion matrix for DFA and RF3 classification of parr sampled at the upper, middle, and lower nursery areas in River Simojoki. For DFA, the elemental variables 87Sr/86Sr, Sr, Ba, and Si were used, and for RF3, they were 87Sr/86Sr, Sr, Ba, and As.
Predicted Nursery Area
Sampled Nursery AreaLowerMiddleUpper% Correctly Classified
DFALower37030
Middle64040
Upper01990
RF3Lower46040
Middle55050
Upper0010100
Table 5. Classification of the smolt sample based on DFA and RF3. The smolts were classified as originating from the lower (1), middle (2), or upper (3) nursery area in River Simojoki.
IDDFARF3
SJ.S 8311
SJ.S 9021
SJ.S 9121
SJ.S 9222
SJ.S 9333
SJ.S 9421
SJ.S 9521
SJ.S 9621
SJ.S 9722
SJ.S 9922
SJ.S 31222
SJ.S 31922
SJ.S 32021
SJ.S 32122
SJ.S 32222
SJ.S 32311
SJ.S 32422
SJ.S 32521
SJ.S 32621
SJ.S 32821
SJ.S 47422
SJ.S 47711
SJ.S 47933
SJ.S 48021
SJ.S 48121
SJ.S 48221
SJ.S 48322
SJ.S 48421
SJ.S 48533
SJ.S 48622
Disclaimer/Publisher’s Note: The statements, opinions and data contained in all publications are solely those of the individual author(s) and contributor(s) and not of MDPI and/or the editor(s). MDPI and/or the editor(s) disclaim responsibility for any injury to people or property resulting from any ideas, methods, instructions or products referred to in the content.

