

Quality Improvement and Shelf-Life Extension of Iced Nile Tilapia Fillets Using Natural Garlic Extract

 , , , and
Abstract
1. Introduction
2. Materials and Methods
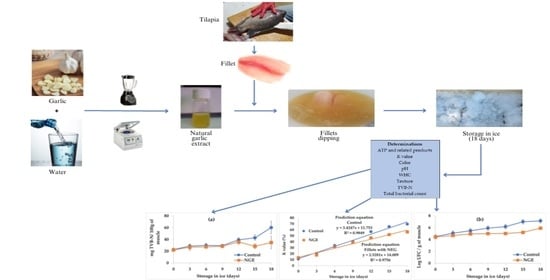
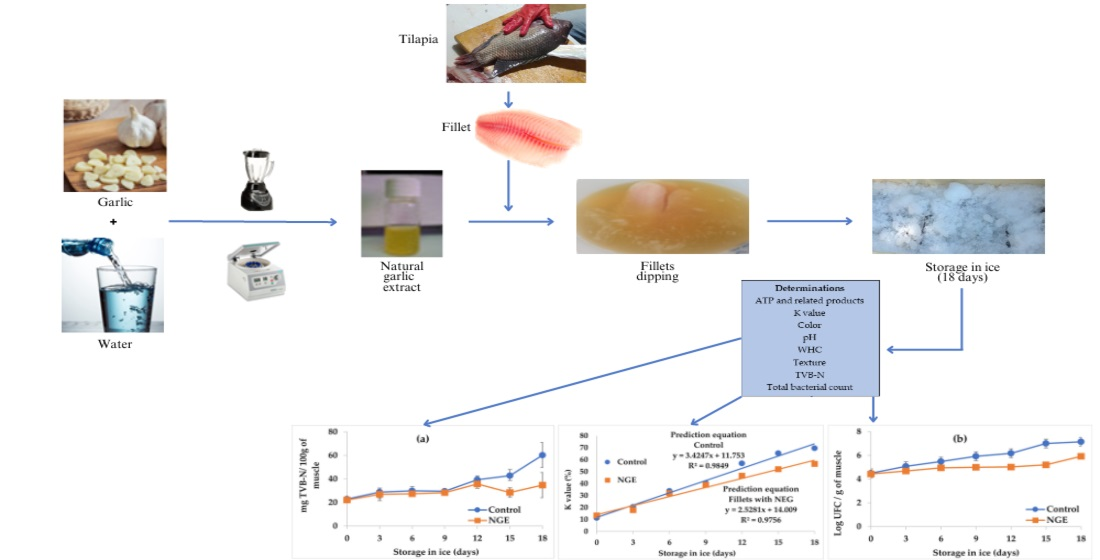
2.1. Obtaining Tilapia Specimens
2.2. Preparation and Application of the Natural Garlic Extract (NGE)
2.3. Ice Storage Study
2.4. Quality Determinations
2.4.1. Adenosine 5′-Triphosphate (ATP) and Degradation Products
2.4.2. K-Value (Freshness Index)
2.4.3. pH
2.4.4. Color
2.4.5. Texture
2.4.6. Water Holding Capacity (WHC)
2.4.7. Total Volatile Bases (TVB-N)
2.4.8. Aerobic Mesophilic Count
2.4.9. Statistical Analysis
3. Results
3.1. Effect of NGE on the Post Mortem Biochemistry of Tilapia Muscle
3.1.1. Nucleotide Catabolism
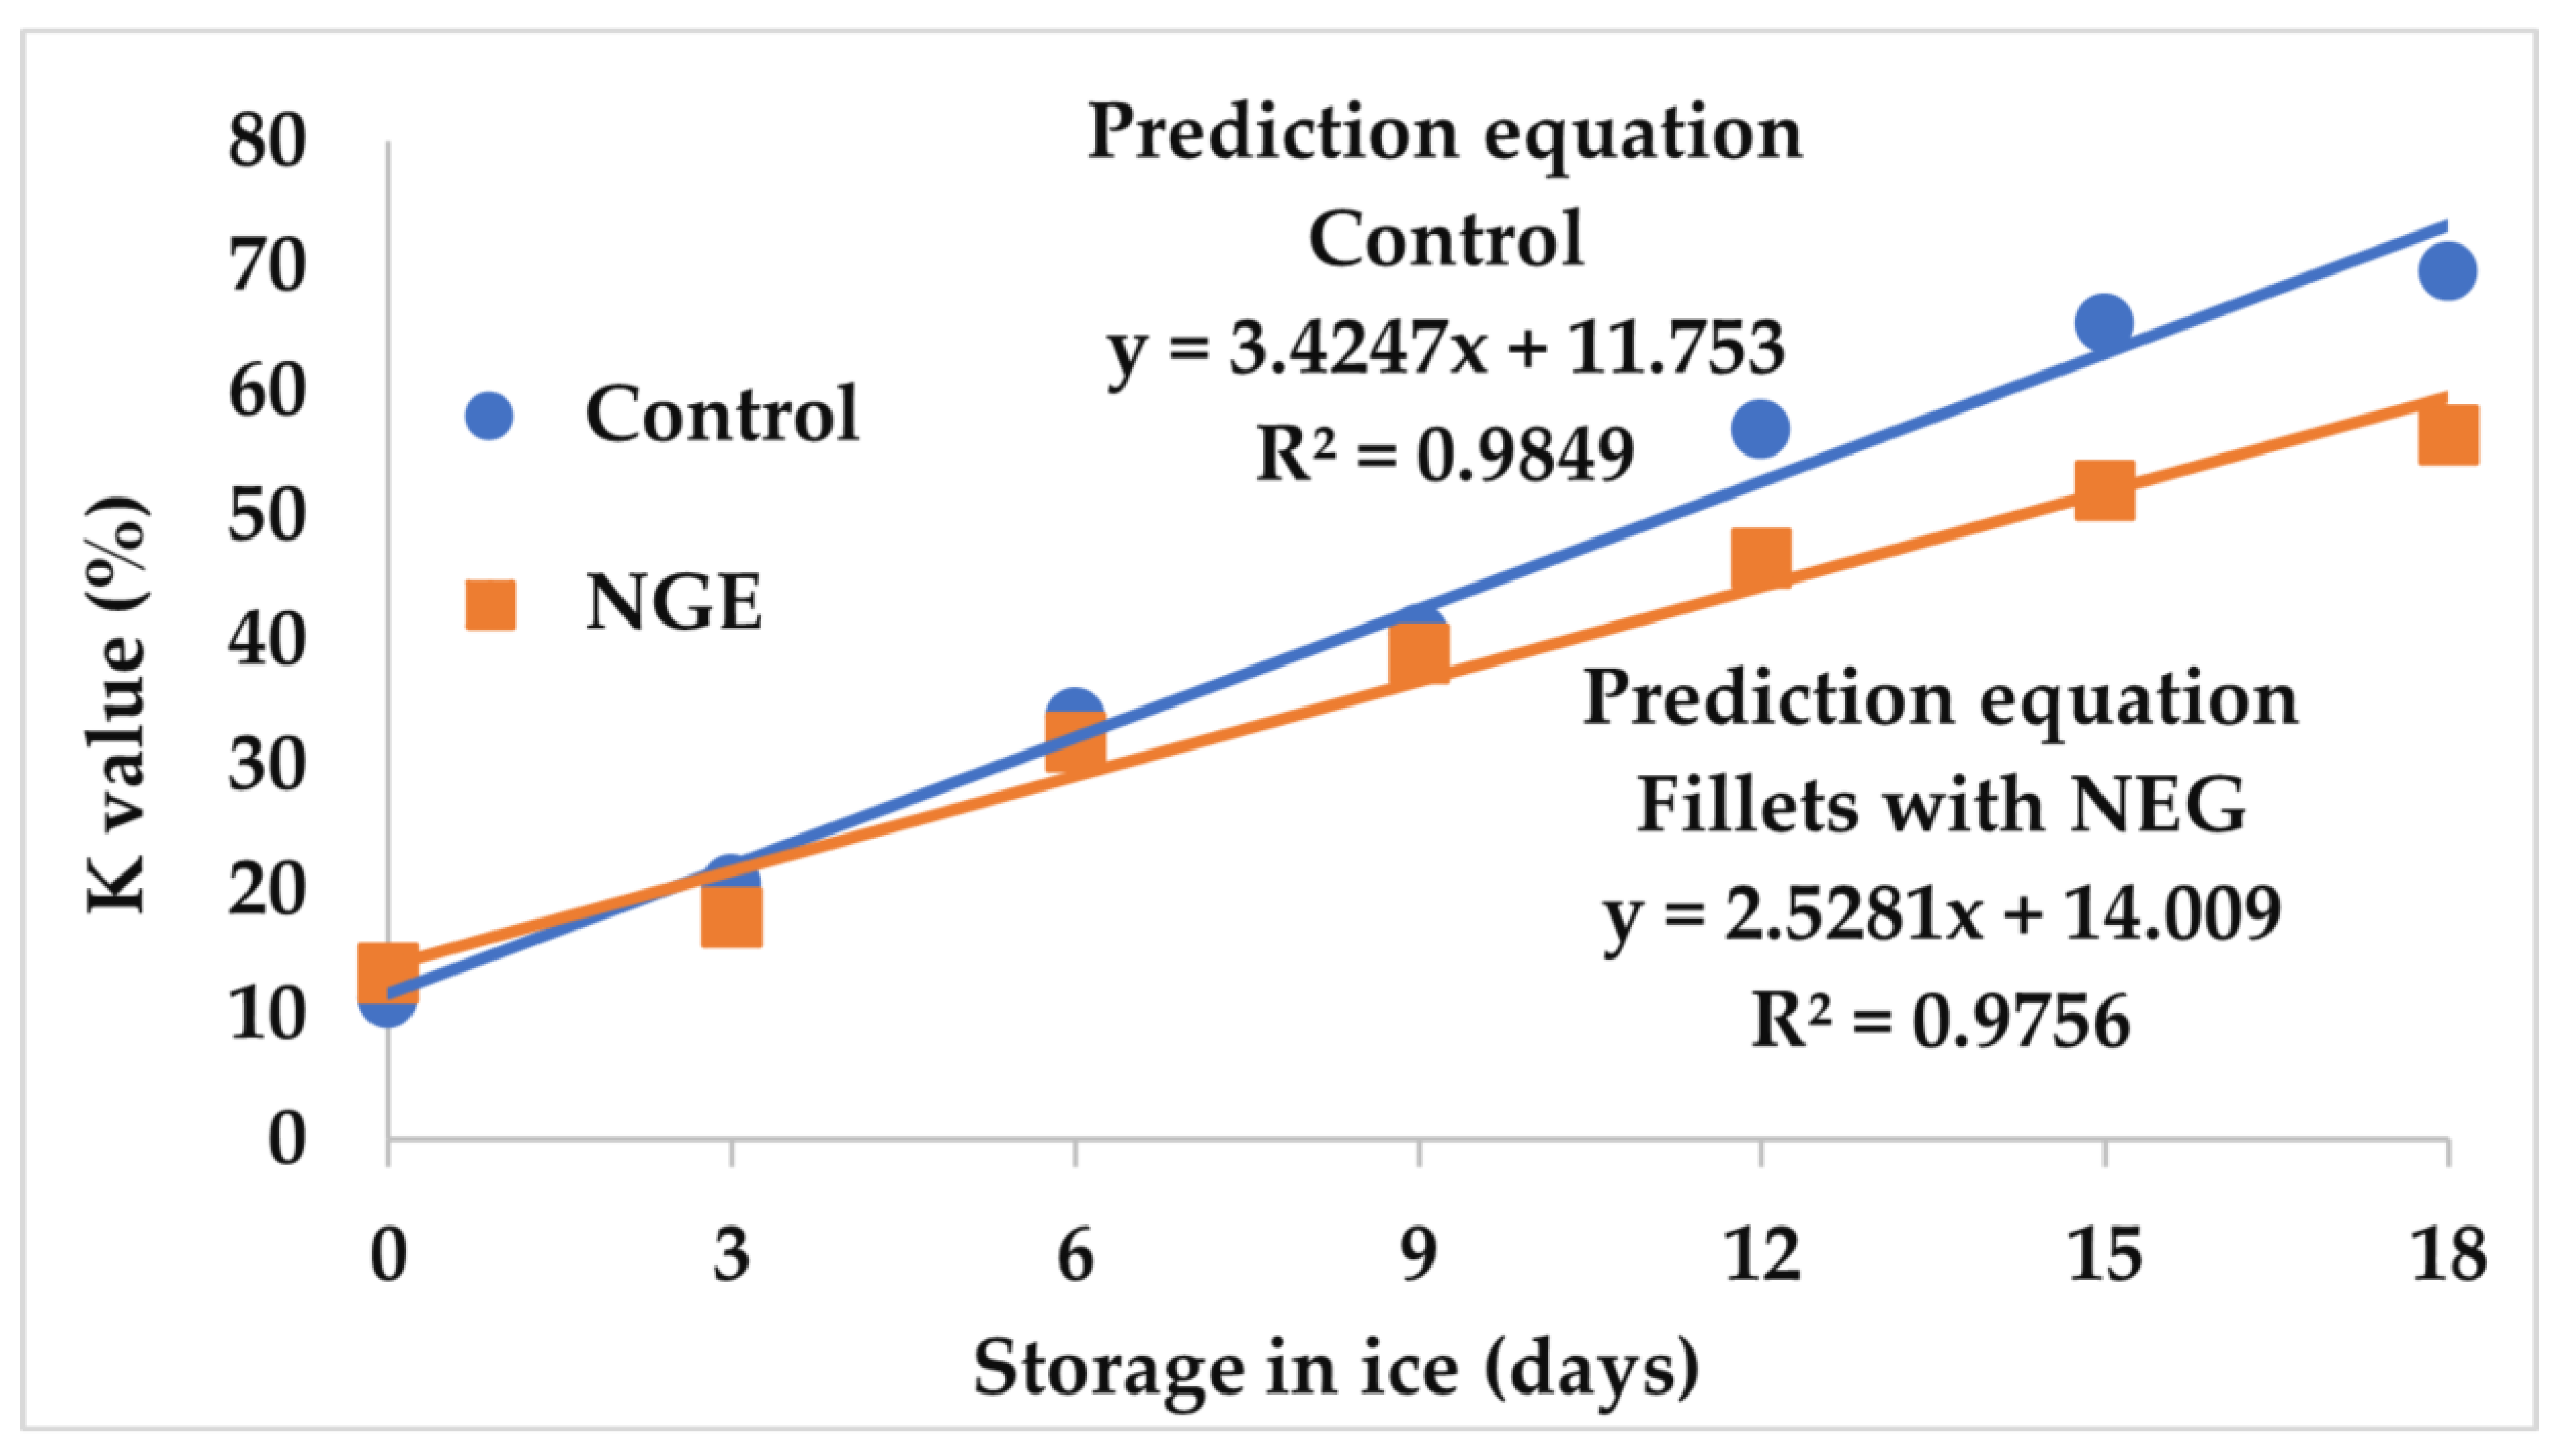
3.1.2. K-Value
3.2. Effect of the NGE on Tilapia Muscle Physicochemical Quality
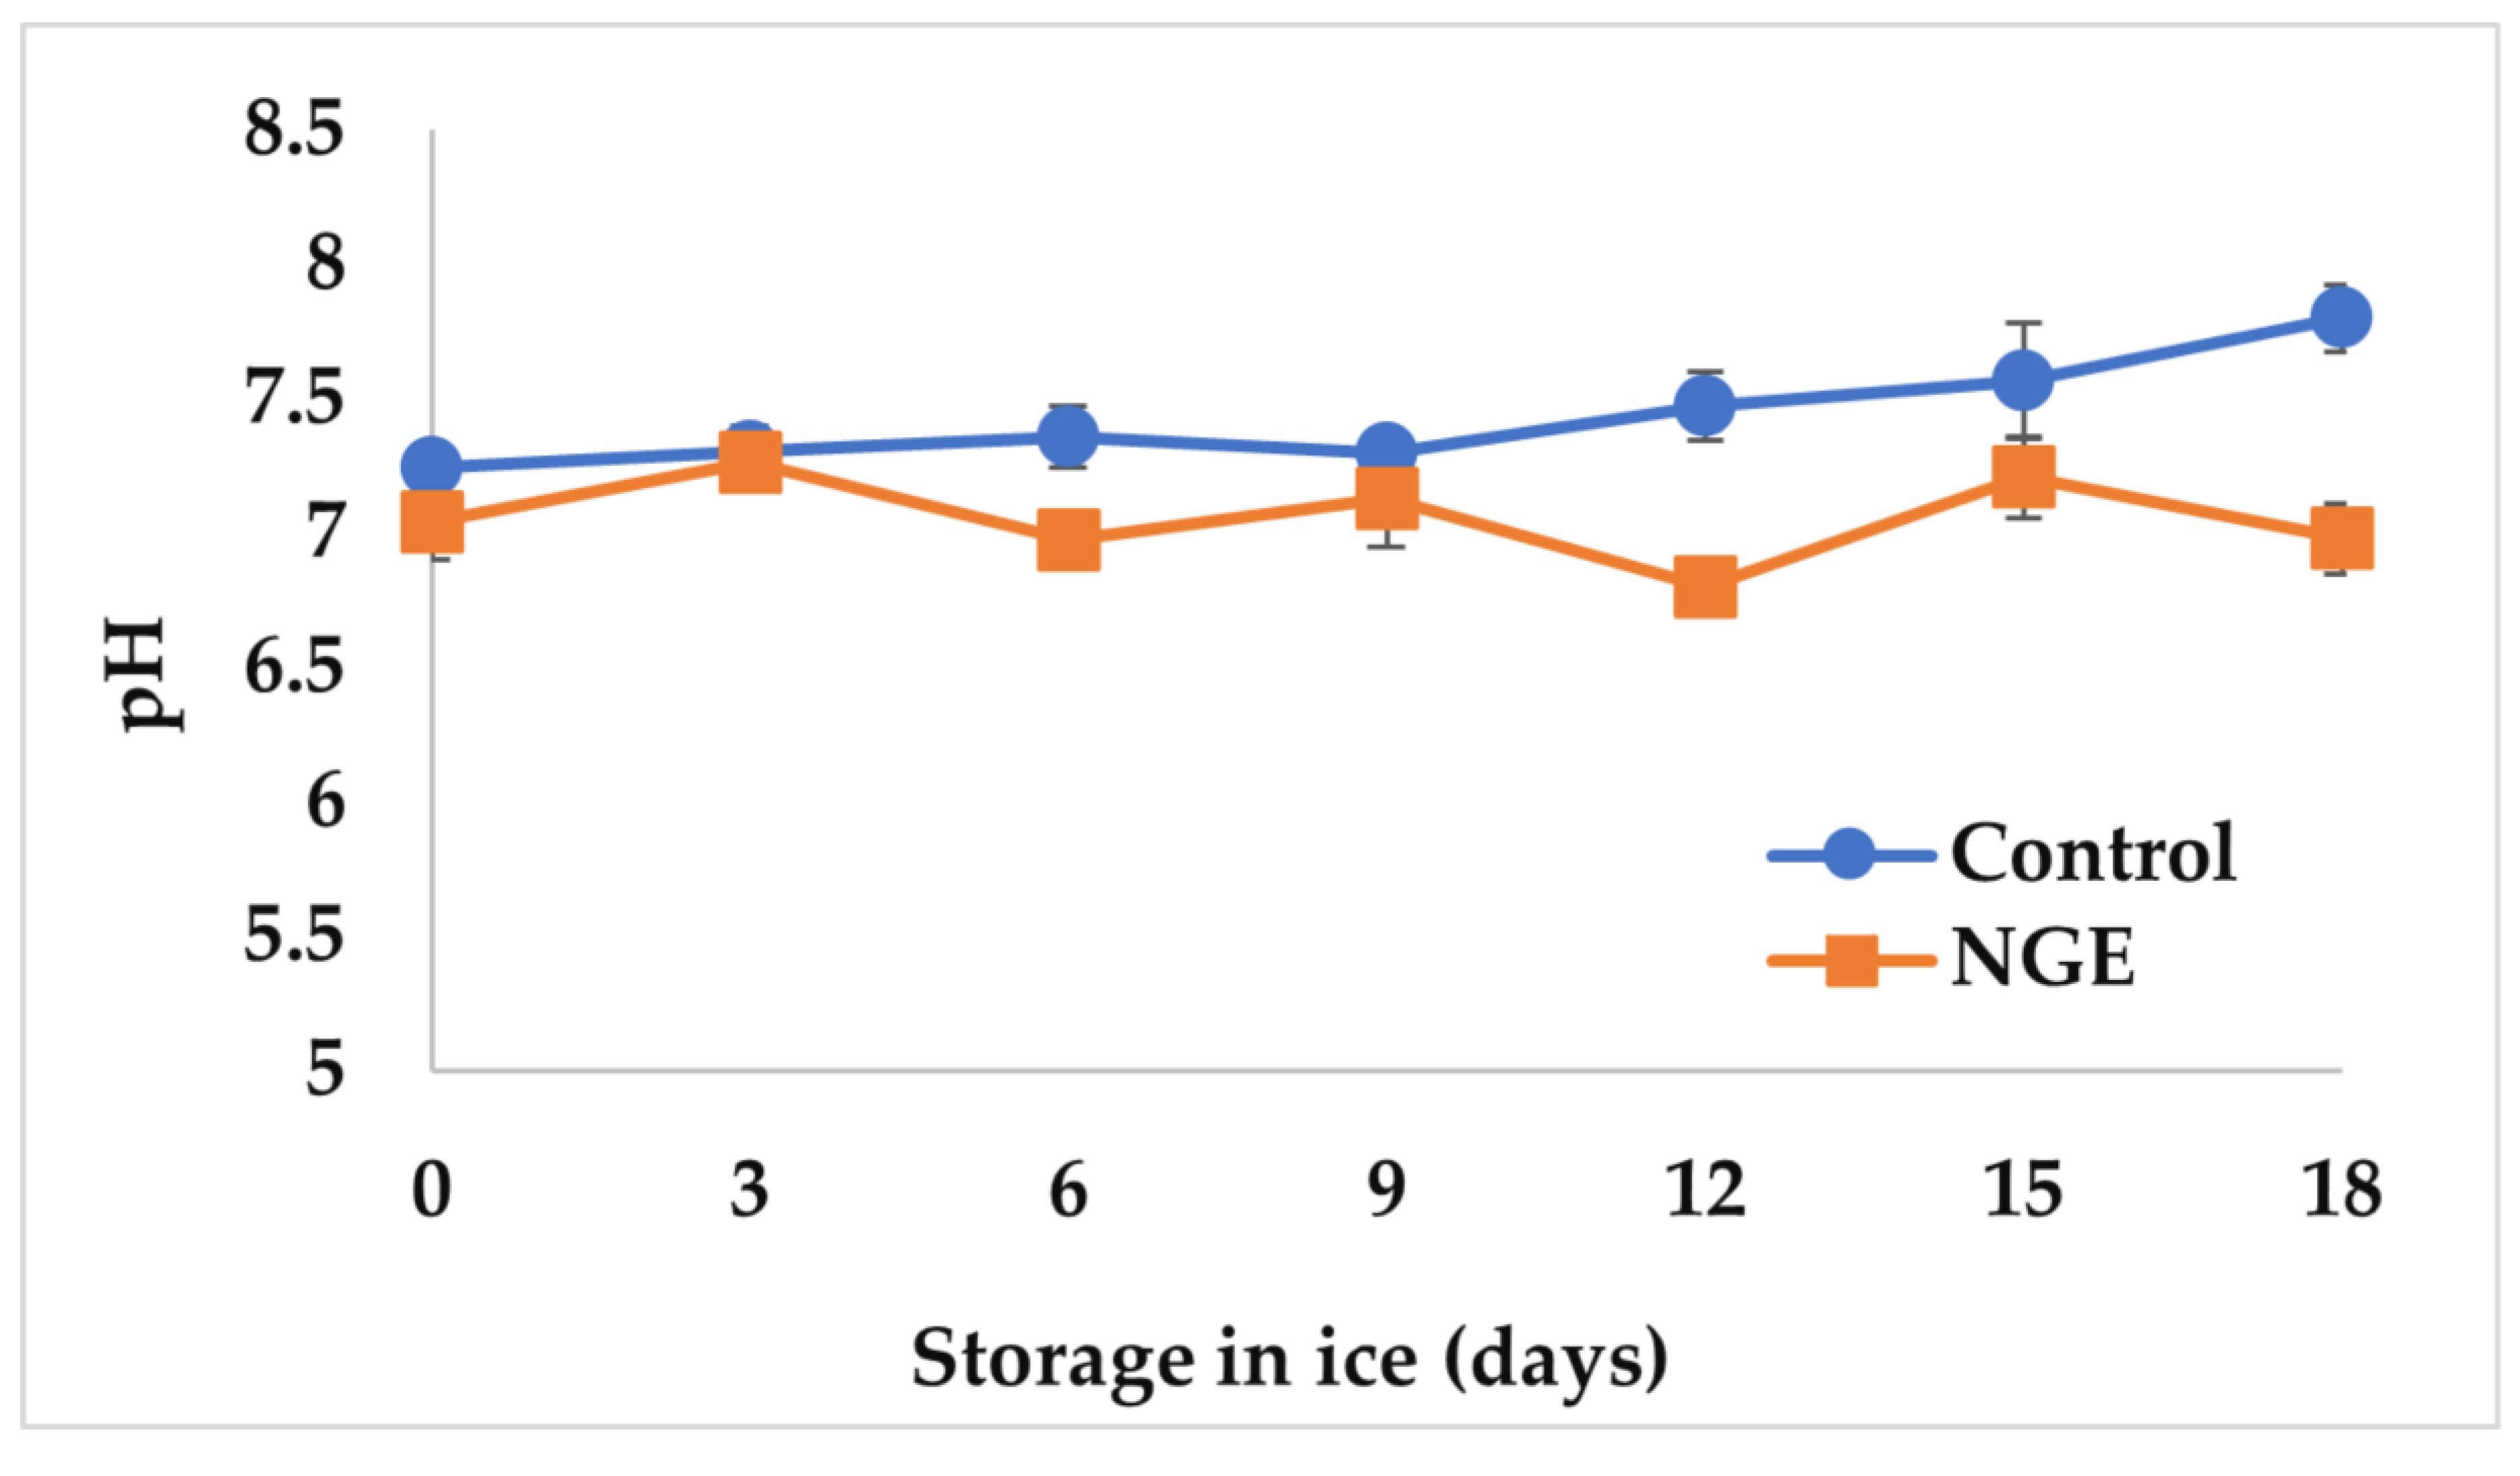
3.2.1. pH
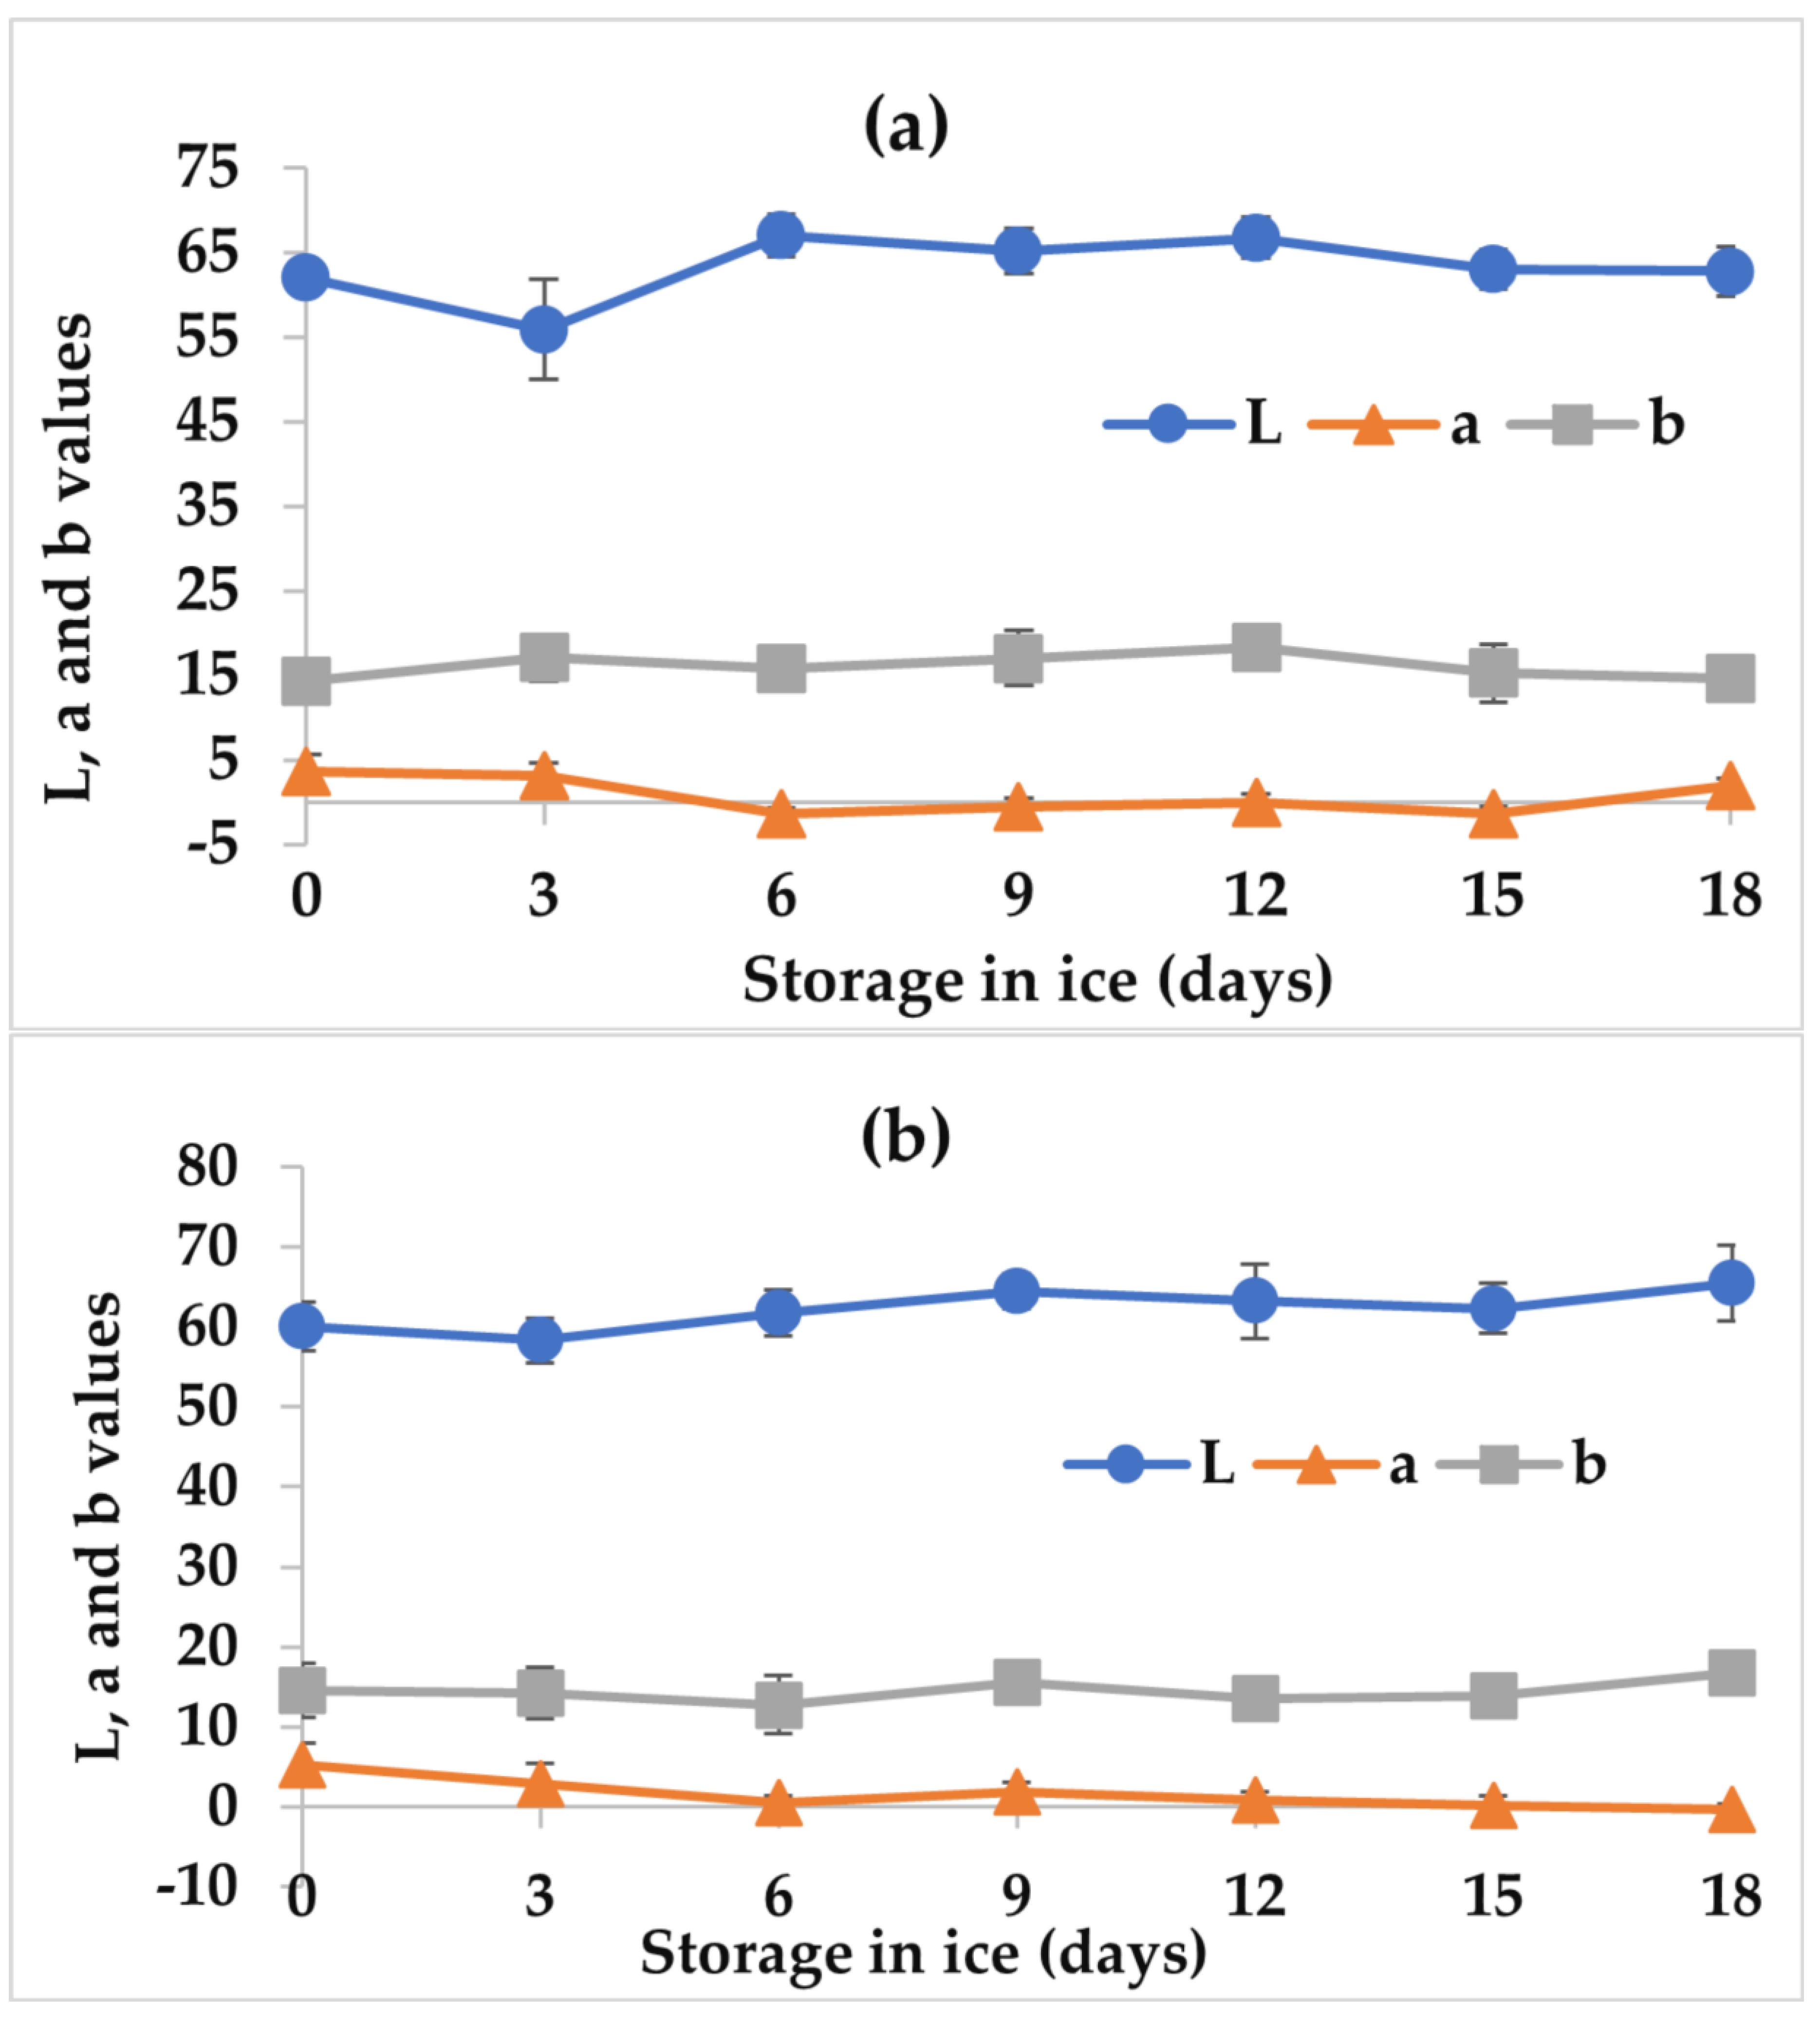
3.2.2. Color
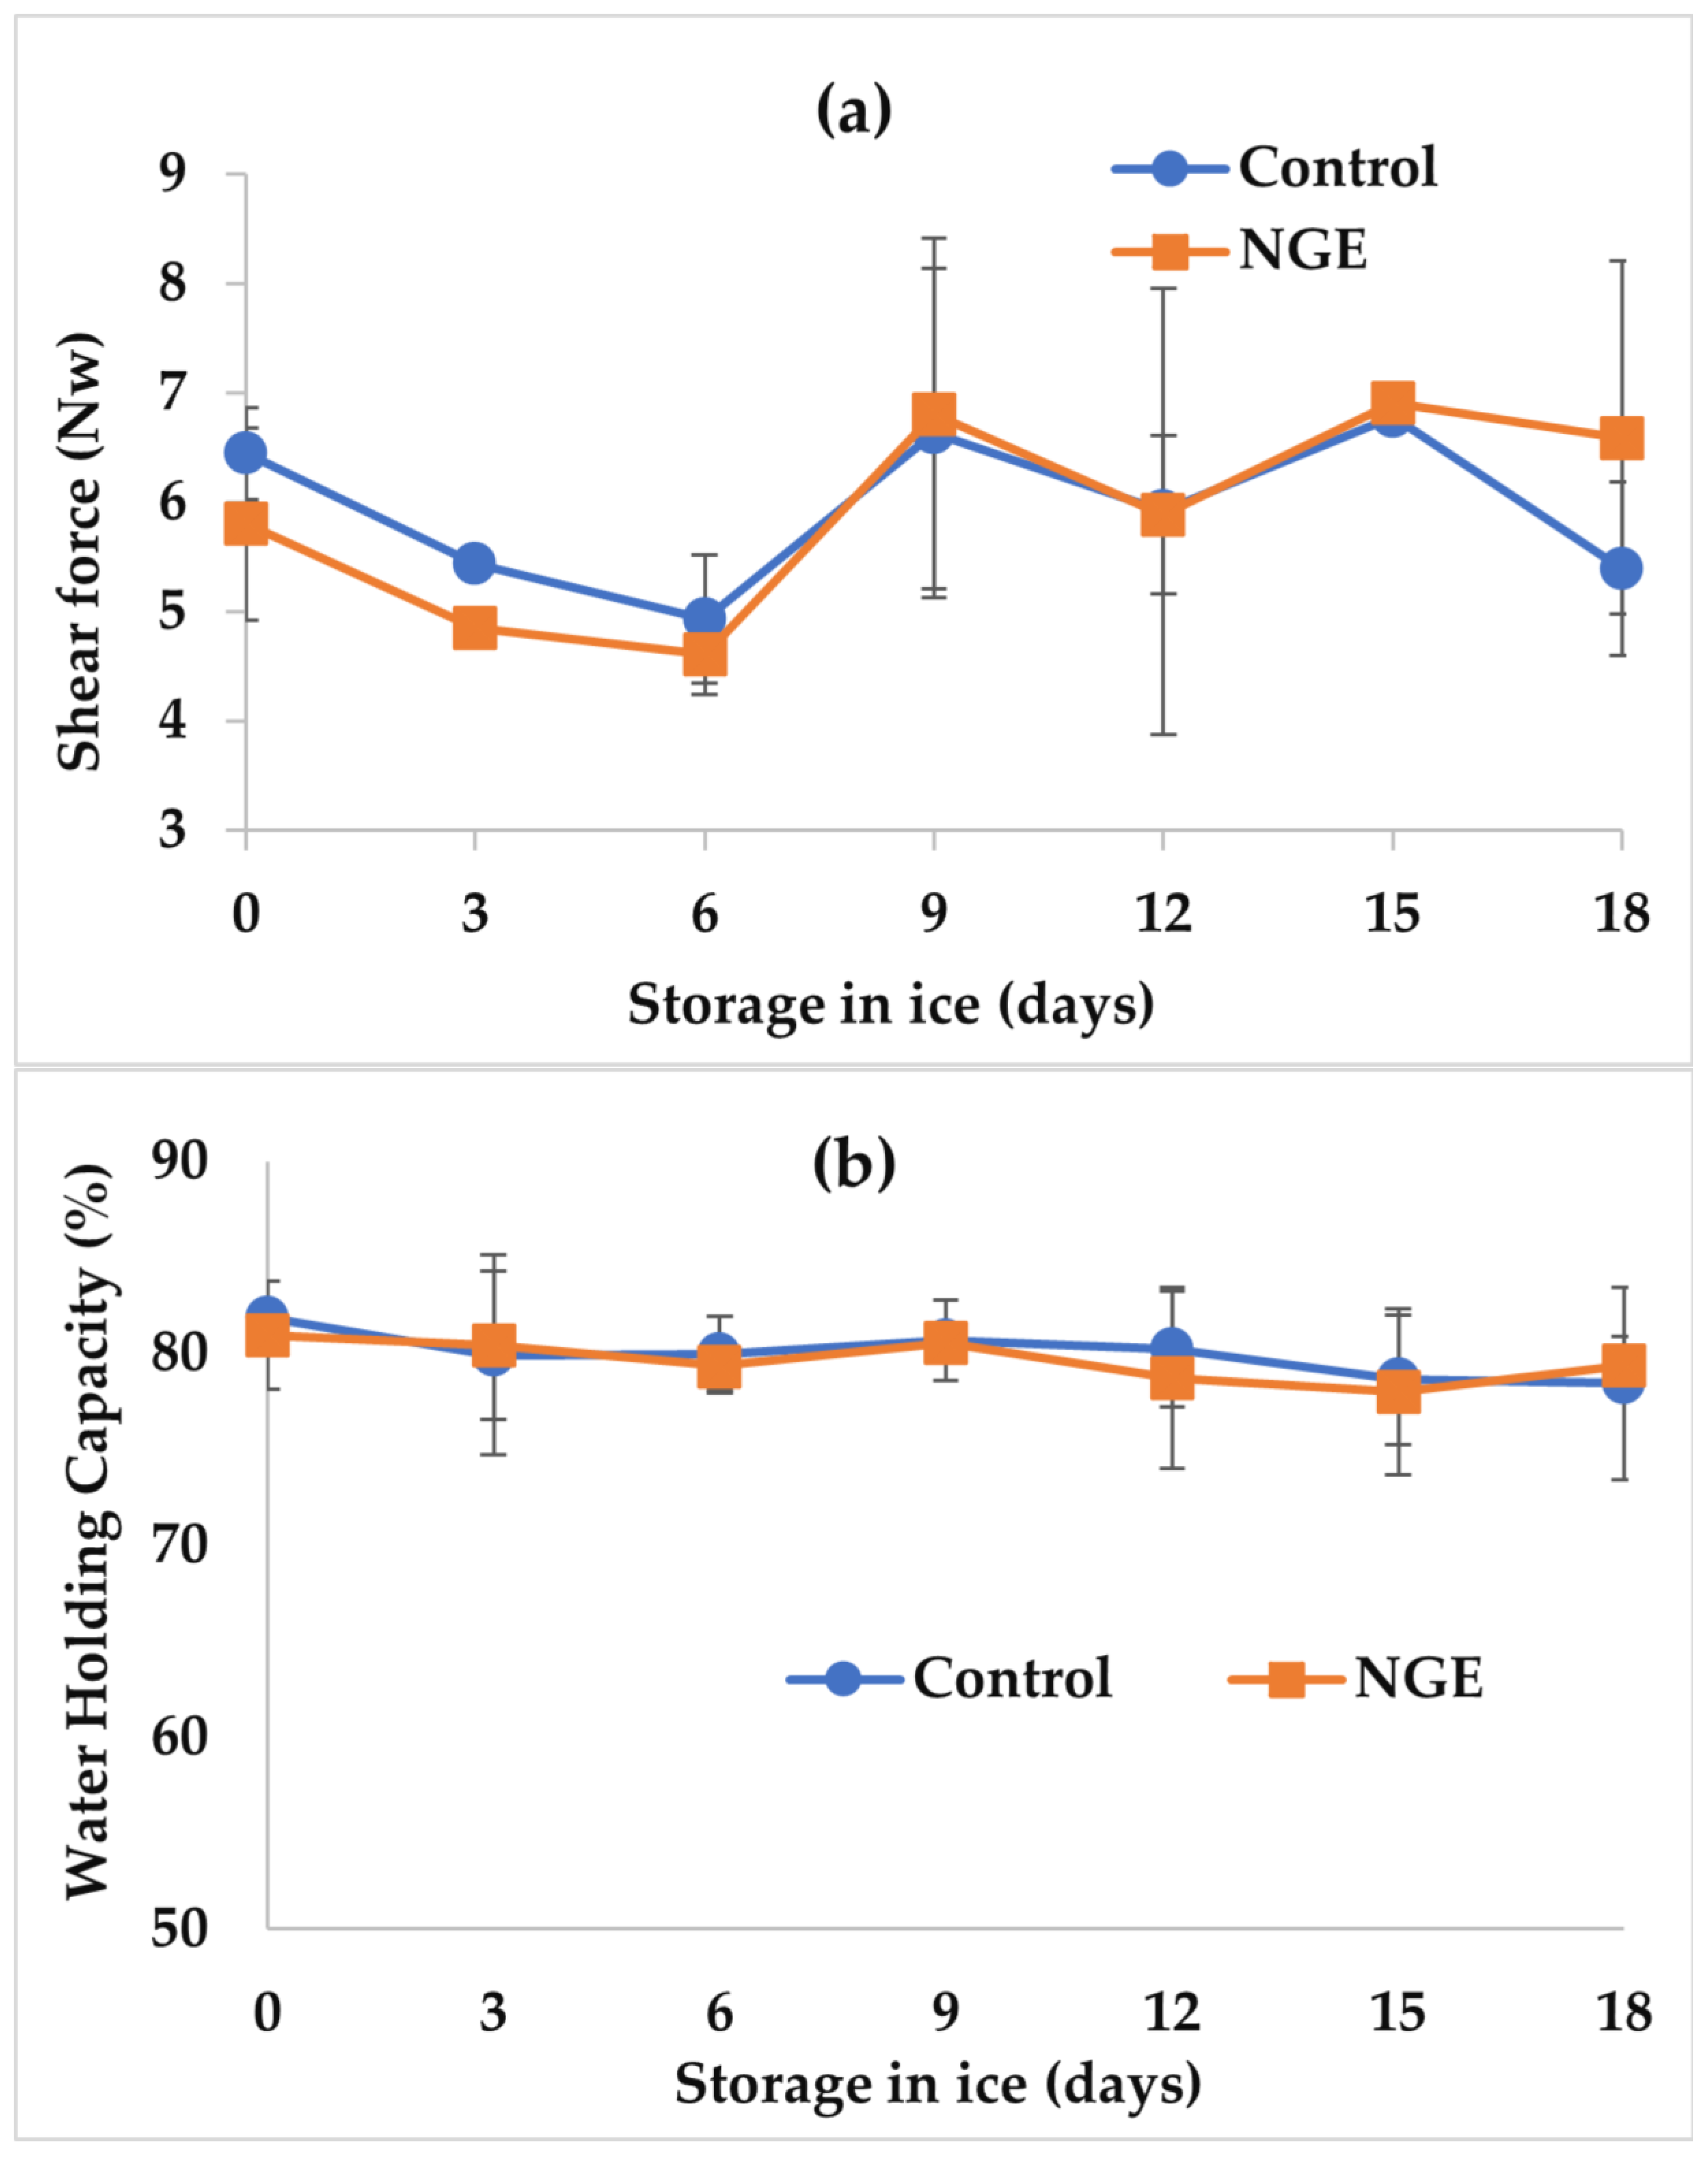
3.2.3. Texture and Water Holding Capacity (WHC)
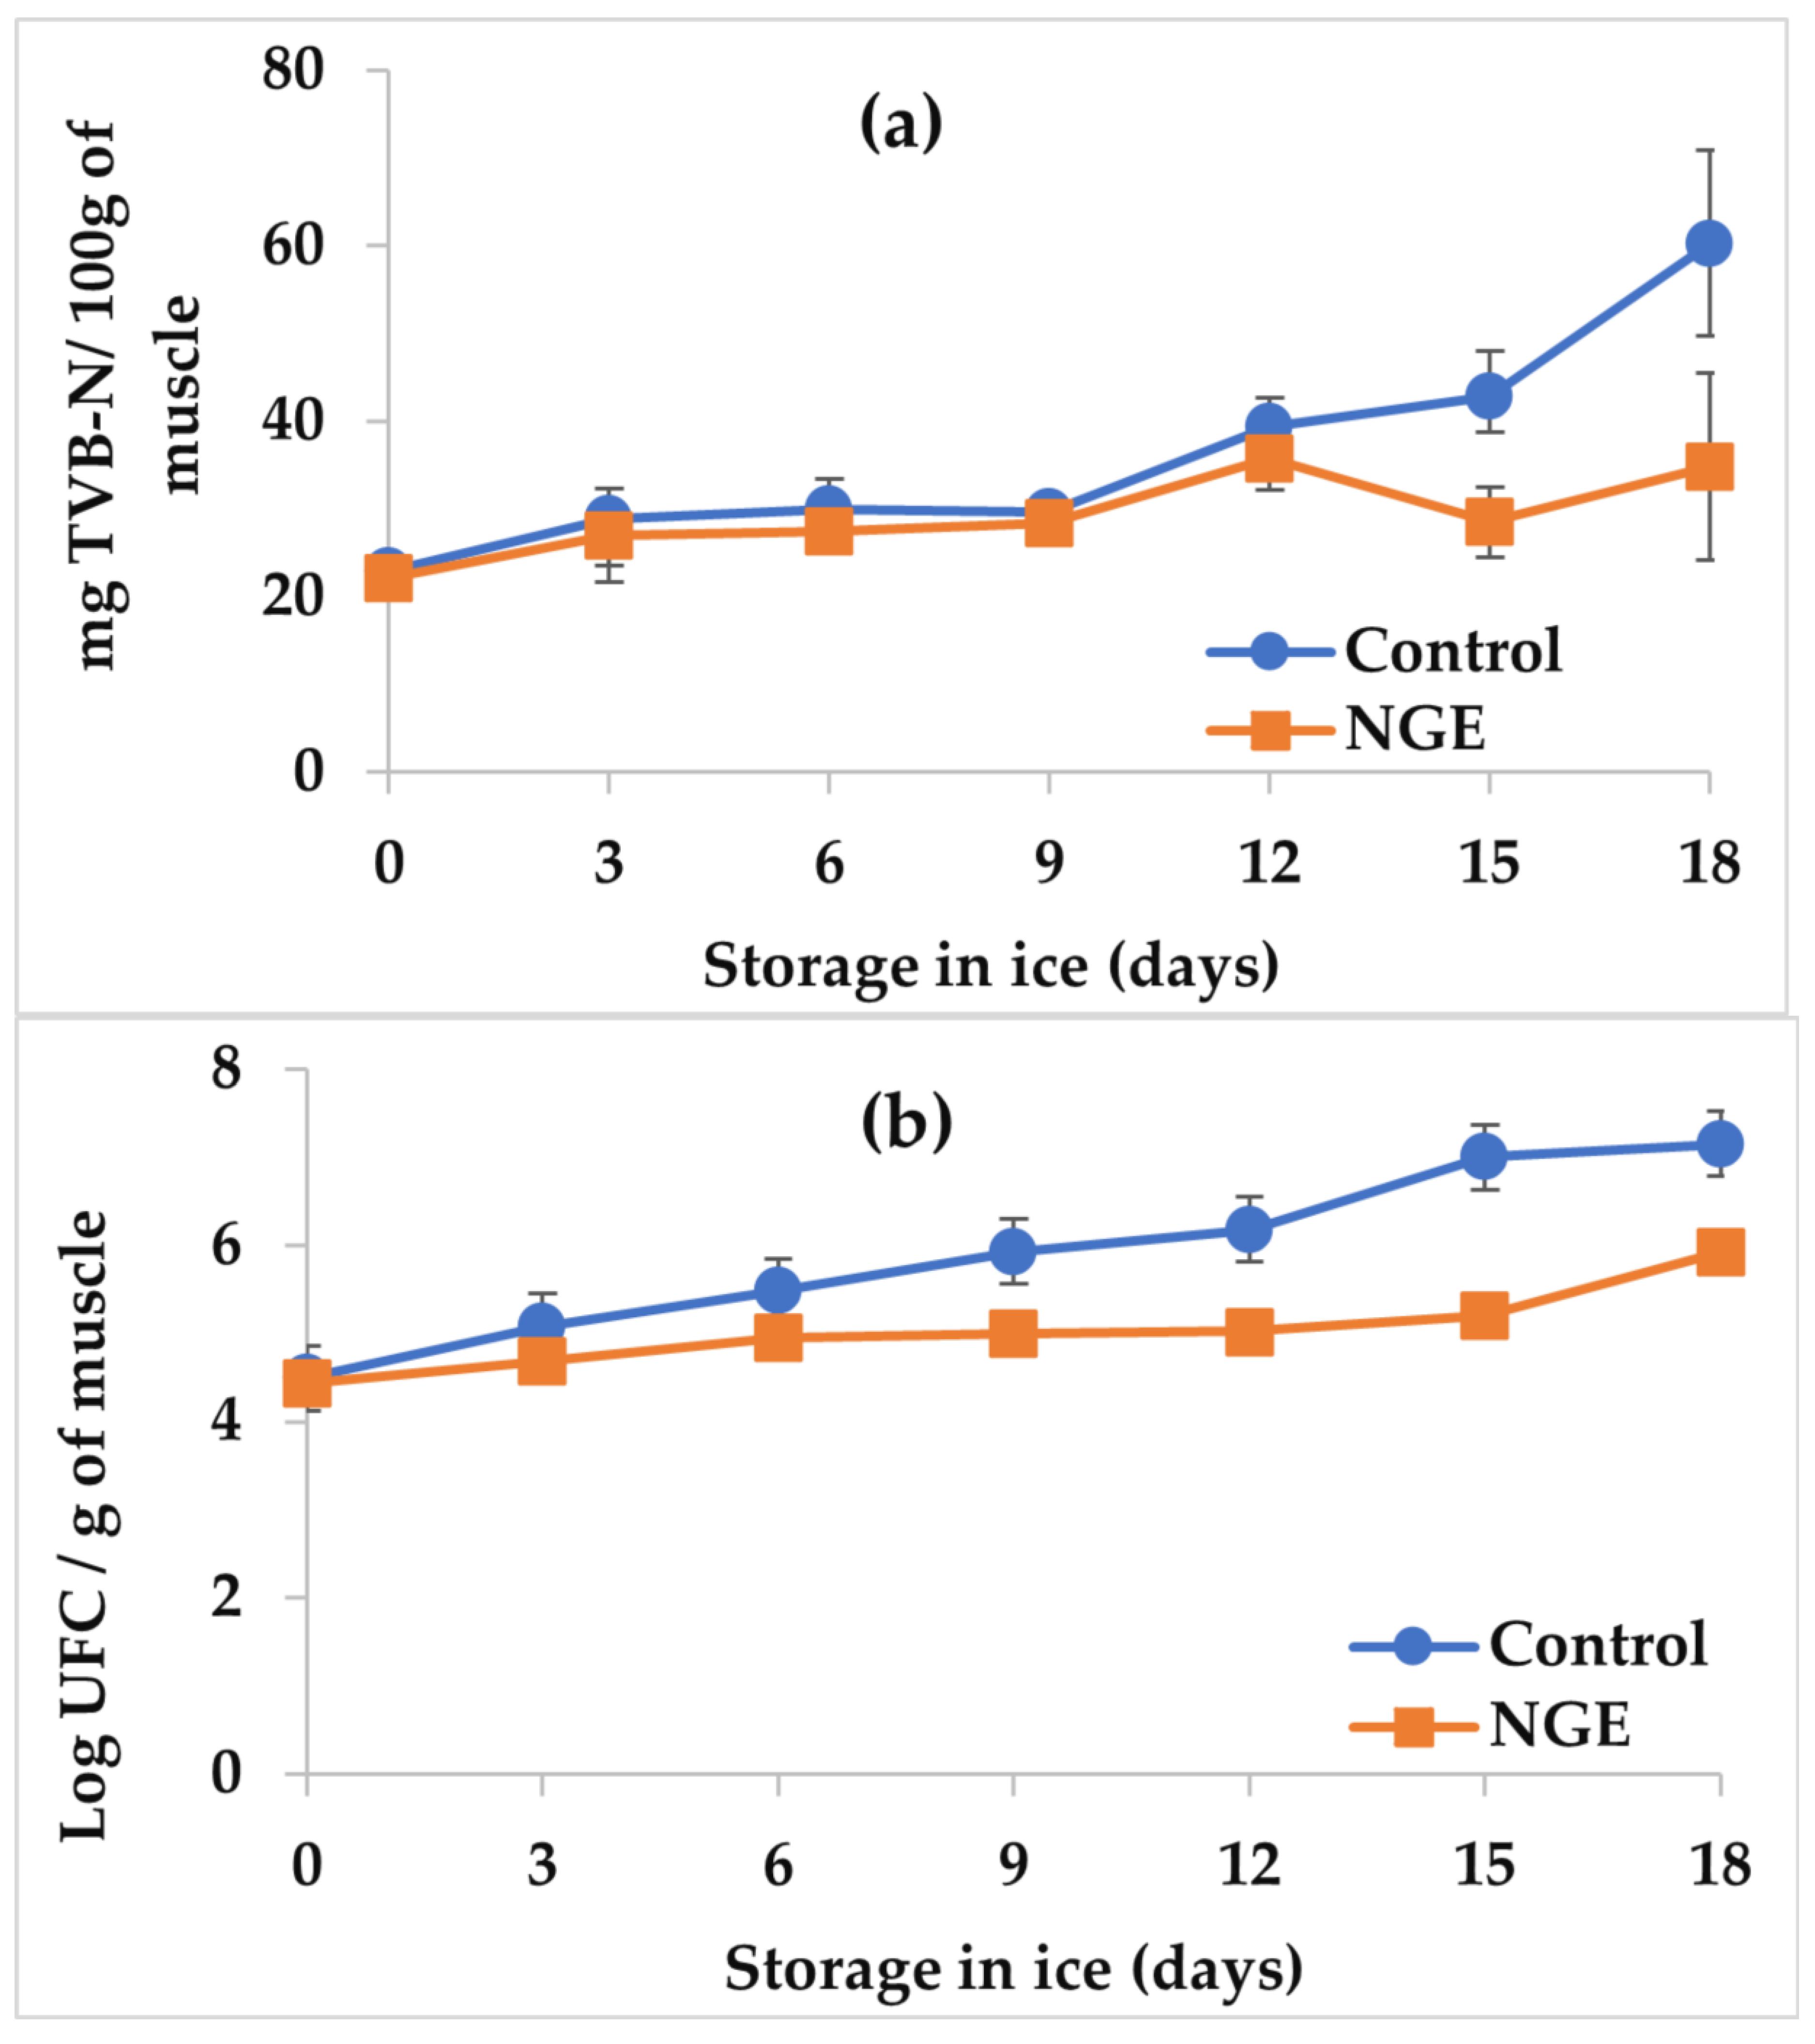
3.2.4. Total Volatile Bases (TVB-N)
3.3. Effect on the Microbiological Quality
4. Conclusions
Author Contributions
Funding
Institutional Review Board Statement
Informed Consent Statement
Data Availability Statement
Conflicts of Interest
References
- Ding, T.; Li, T.; Li, J. Preparation of coaxial polylactic acid-propyl gallate electrospun fibers and the effect of their coating on salmon slices during chilled storage. ACS Appl. Mater. Interfaces 2019, 11, 6463–6474. [Google Scholar] [CrossRef] [PubMed]
- Gram, L.; Huss, H.H. Microbiological spoilage of fish and fish products. Int. J. Food Microbiol. 1996, 33, 121–137. [Google Scholar] [CrossRef] [PubMed]
- Gram, L.; Dalgaard, P. Fish spoilage bacteria-Problems and solutions. Curr. Opin. Biotechnol. 2002, 13, 262–266. [Google Scholar] [CrossRef] [PubMed]
- Zhuang, S.; Hong, H.; Zhang, L.; Luo, Y. Spoilage-related microbiota in fish and crustaceans during storage: Research progress and future trends. Compr. Rev. Food Sci. Food Saf. 2020, 20, 252–288. [Google Scholar] [CrossRef] [PubMed]
- Anagnostopoulos, D.A.; Parlapani, F.F.; Boziaris, I.S. The evolution of knowledge on seafood spoilage microbiota from the 20th to the 21st century: Have we finished or just begun? Trends Food Sci. Technol. 2022, 120, 236–247. [Google Scholar] [CrossRef]
- Tavares, J.; Martins, A.; Fidalgo, L.G.; Lima, V.; Amaral, R.A.; Pinto, C.A.; Silva, A.M.; Saraiva, J.A. Fresh Fish Degradation and Advances in Preservation Using Physical Emerging Technologies. Foods 2021, 10, 780. [Google Scholar] [CrossRef]
- Abd El-Hay, M.M. Processing and preparation of fish. In Postharvest and Postmortem Processing of Raw Food Materials; Jafari, S.M., Ed.; Woodhead Publishing: New Delhi, India, 2022; pp. 315–342. [Google Scholar] [CrossRef]
- Ramírez, G.H.; Castillo, Y.F.; Montaño, C.E.; Ruíz-Cruz, S.; Márquez, R.E.; Canizales, R.D.; Torres-Arreola, W.; Montoya, C.N.; Ocaño-Higuera, V.M. Protective effect of an edible tomato plant extract/chitosan coating on the quality and shelf life of sierra fish fillets. J. Chem. 2018, 2018, 2436045. [Google Scholar] [CrossRef]
- Aponte, M.; Anastasio, A.; Marrone, R.; Mercogliano, R.; Peruzy, M.F.; Murru, N. Impact of gaseous ozone coupled to passive refrigeration system to maximize shelf-life and quality of four different fresh fish products. LWT 2018, 93, 412–419. [Google Scholar] [CrossRef]
- Yu, D.; Wu, L.; Regenstein, J.M.; Jiang, Q.; Yang, F.; Xu, Y.; Xia, W. Recent advances in quality retention of non-frozen fish and fishery products: A review. Crit. Rev. Food Sci. Nutr. 2020, 60, 1747–1759. [Google Scholar] [CrossRef]
- Mei, J.; Ma, X.; Xie, J. Review on natural preservatives for extending fish shelf life. Foods 2019, 8, 490. [Google Scholar] [CrossRef]
- Cortesi, M.L.; Panebianco, A.; Giuffrida, A.; Anastasio, A. Innovations in seafood preservation and storage. Vet. Res. Commun. 2009, 33, S15–S23. [Google Scholar] [CrossRef]
- Anastasio, A.; Marrone, R.; Chirollo, C.; Smaldone, G.; Attouchi, M.; Adamo, P.; Sadok, S.; Pepe, T. Swordfish steaks vacuum-packed with Rosmarinus officinalis. Ital. J. Food Saf. 2014, 26, 390–397. [Google Scholar]
- Garba, I.; Umar, A.I.; Abdulrahman, A.B.; Tijjani, M.B.; Aliyu, M.S.; Zango, U.U.; Muhammad, A. Phytochemical and antibacterial properties of garlic extracts. Bayero J. Pure Appl. 2013, 6, 45–48. [Google Scholar] [CrossRef]
- Liaqat, A.; Zahoor, T.; Atif Randhawa, M.; Shahid, M. Characterization and antimicrobial potential of bioactive components of sonicated extract from garlic (Allium sativum) against foodborne pathogens. J. Food Process. Preserv. 2019, 43, e13936. [Google Scholar] [CrossRef]
- El-Sayed, S.M.; Youssef, A.M. Potential application of herbs and spices and their effects in functional dairy products. Heliyon 2019, 5, e01989. [Google Scholar] [CrossRef] [PubMed]
- Moya-Salvador, A. Compuestos Organosulfurados Presentes en Aliáceas y sus Propiedades Saludables. Master’s Thesis, Facultad de Farmacia, Universidad de Sevilla, Sevilla, Spain, 2020; p. 59. [Google Scholar]
- Ryder, J.M. Determination of adenosine triphosphate and its breakdown products in fish muscle by High Performance Liquid Chromatography. J. Agric. Food Chem. 1985, 33, 678–680. [Google Scholar] [CrossRef]
- Sagedhal, A.; Busalmen, J.P.; Roldán, H.A.; Paredi, M.E.; Crupkin, M. Post-mortem changes in adenosine triphosphate and related compounds in mantle of squid (Illex argentinus) at different stages of sexual maturation. J. Aquat. Food Prod. Technol. 1997, 6, 43–56. [Google Scholar] [CrossRef]
- Woyewoda, A.D.; Shaw, S.J.; Ke, P.J.; Burns, B.G. Recommended Laboratory Methods for Assessment of Fish Quality; Canadian Technical Report of Fisheries and Aquatic Sciences; Department of Fisheries and Oceans: Halifax, NS, Canada, 1986; p. 143. [Google Scholar]
- Cheng, C.S.; Hamann, D.D.; Webb, N.B.; Sidwell, V. Effects of species and storage time on minced fish gel texture. J. Food Sci. 1979, 44, 1087–1092. [Google Scholar] [CrossRef]
- Norma Oficial Mexicana. NOM-092-SSA1-1994. Método para la Cuenta de Bacterias Aerobias en Placa; Diario Oficial de la Federación. Secretaria de Gobernación, México. 1995, p. 4. Available online: https://www.dof.gob.mx/nota_detalle.php?codigo=4886029&fecha=12/12/1995#gsc.tab=0 (accessed on 9 May 2023).
- Hintze, J.L. NCSS 2000 Statistical System for Windows-User’s Guide; Number Cruncher Statistical Systems: Kaysville, UT, USA, 1998. [Google Scholar]
- Hong, H.; Regenstein, J.M.; Luo, Y. The importance of ATP-related compounds for the freshness and flavor of post-mortem fish and shellfish muscle: A review. Crit. Rev. Food Sci. Nutr. 2017, 57, 1787–1792. [Google Scholar] [CrossRef]
- Montoya-Camacho, N.; Márquez-Ríos, E.; Castillo-Yáñez, F.J.; Ruíz-Cruz, S.; Cárdenas-López, J.L.; Arvizu-Flores, A.A.; Torres-Arreola, W.; Ocaño-Higuera, V.M. Efecto de la temperatura de almacenamiento sobre el rigor mortis del músculo de tilapia (Oreochromis niloticus). Biotecnia 2020, 22, 88–93. [Google Scholar] [CrossRef]
- Ocaño-Higuera, V.M.; Márquez-Ríos, E.; Canizales-Dávila, M.; Castillo-Yáñez, F.J.; Pacheco-Aguilar, R.; Lugo-Sánchez, M.E. Postmortem changes in cazon fish muscle stored on ice. Food Chem. 2009, 116, 933–938. [Google Scholar] [CrossRef]
- Ocaño-Higuera, V.M.; Maeda-Martínez, A.N.; Márquez-Ríos, E.; Canizales-Rodríguez, D.F.; Castillo-Yáñez, F.J.; Ruíz-Bustos, E.; Graciano-Verdugo, A.Z.; Plascencia-Jatomea, M. Freshness assessment of ray fish stored in ice by biochemical, chemical and physical methods. Food Chem. 2011, 125, 49–54. [Google Scholar] [CrossRef]
- Batista, M.G.; Lessi, E.; Kodaira, M.; Falcao, P.D.T. Alterações bioquímicas post-mortem de matrinxã Brycon cephalus (Günther, 1869) procedente da piscicultura, mantido em gelo. Cienc. Tecnol. Aliment. 2004, 24, 573–581. [Google Scholar] [CrossRef]
- Castillo-Yáñez, F.J.; Pacheco-Aguilar, R.; Márquez-Ríos, E.; Lugo-Sánchez, M.E.; Lozano-Taylor, J. Freshness loss in sierra fish (Scomberomorus sierra) muscle stored in ice as affected by poscapture handling practices. J. Food Biochem. 2007, 31, 56–67. [Google Scholar] [CrossRef]
- Howgate, P. Kinetics of degradation of adenosine triphosphate in chill-stored rainbow trout (Oncorhynchus mykiss). Int. J. Food Sci. 2005, 40, 579–588. [Google Scholar] [CrossRef]
- Hwang, J.H.; Kim, Y.; Choi, H.; Lee, K.G. ATP degradation products as freshness indicator of flatfish during storage. Food Sci. Biotechnol. 2019, 28, 1891–1897. [Google Scholar] [CrossRef]
- Montoya-Camacho, N. Efecto de la Temperatura de Almacenamiento Sobre el Rigor Mortis y la Calidad del Músculo de Tilapia (Oreochromis niloticus). Master’s Thesis, Departamento de Investigación y Posgrado en Alimentos, Universidad de Sonora, Hermosillo, Sonora, México, 2013. [Google Scholar]
- Ehira, S.; Uchiyama, H. Determination of fish freshness using the K value and comments on some other biochemical changes in relation to freshness. In Seafood Quality Determination; Kramer, D.E., Liston, J., Eds.; Elsevier: Amsterdam, The Netherlands, 1987; pp. 185–193. [Google Scholar]
- Liu, S.; Fan, W.; Zhong, S.; Ma, C.; Li, P.; Zhou, K.; Zhu, M. Quality evaluation of tray-packed tilapia fillets stored at 0°C based on sensory, microbiological, biochemical and physical attributes. Afr. J. Biotechnol. 2010, 9, 692–701. [Google Scholar] [CrossRef]
- Khalid, I.S. Chemical, sensory and shelf life evaluation of sliced salmon treated with salts of organic acids. Food Chem. 2007, 101, 592–600. [Google Scholar]
- Özoğul, Y.; Özoğul, F.; Kuley, E.; Ozkutuk, A.S.; Gökbulut, C.; Köse, S. Biochemical, sensory and microbiological attributes of wild turbot (Scophthalmus maximus), from the black sea, during chilled storage. Food Chem. 2006, 99, 752–758. [Google Scholar] [CrossRef]
- Teixeira, B.; Marques, A.; Pires, C.; Ramos, C.; Batista, I.; Saraiva, J.A.; Nunes, M.L. Characterization of fish protein films incorporated with essential oils of clove, garlic and origanum: Physical, antioxidant and antibacterial properties. LWT-Food Sci. Technol. 2014, 59, 533–539. [Google Scholar] [CrossRef]
- Saito, T.; Arai, K.; Matruyoshi, M. A new method for estimating the freshness of fish. Bull. Jpn. Soc. Sci. Fish. 1959, 24, 749–750. [Google Scholar] [CrossRef]
- Khalafalla, F.A.; Ali, F.H.; Hassan, A.H. Quality improvement and shelf-life extension of refrigerated Nile tilapia (Oreochromis niloticus) fillets using natural herbs. Beni-Suef Univ. J. Basic Appl. Sci. 2015, 4, 33–40. [Google Scholar] [CrossRef]
- Copes, J.; Pellicer, K.; del Hoyo, G.; Brocado, S.; Gianuzzi, L. Estudio del comportamiento del pH en filetes de pejerrey de laguna (Odhontheses bonariensis) conservados con y sin vacío, utilizando distintos tratamientos y almacenados a temperaturas de 4, 0 y −5 °C. Analecta Vet. 2008, 28, 21–25. [Google Scholar]
- Tomé, E.; Iglesias, M.; Kodaira, M.; González, A. Efecto de la temperatura de almacenamiento en el rigor mortis y en la estabilidad de la tilapia (Oreochromis spp.) cultivada. Rev. Científica FCV-LUZ 2000, 11, 373–378. [Google Scholar]
- Durán, A.; Erdemli, U.; Karakaya, M.; Tyilmaz, M. Effects of slaughter methods on physical, biochemical and microbiological quality of rainbow trout (Oncorynchus mykiss) and mirror carp (Cyprinus carpio) filleted in pre-, in- or post-rigor periods. Fish. Sci. 2008, 74, 1146–1156. [Google Scholar] [CrossRef]
- Attouchi, M.; Sadok, S. The effect of powdered thyme sprinkling on quality changes of wild and farmed gilthead sea bream fillets stored in ice. Food Chem. 2010, 119, 1527–1534. [Google Scholar] [CrossRef]
- Huss, H.H. Quality and Quality Changes in Fresh Fish; Documento Técnico de Pesca N° 348; FAO: Rome, Italy, 1995; p. 202. [Google Scholar]
- Bhatwalkar, S.B.; Mondal, R.; Krishna, S.B.N.; Adam, J.K.; Govender, P.; Anupam, R. Antibacterial Properties of Organosulfur Compounds of Garlic (Allium sativum). Front. Microbiol. 2021, 12, 613077. [Google Scholar] [CrossRef]
- Mujica, H.; Pérez, C.M. Características físicas y químicas de ajo cosechado en dos estados de madurez y almacenado en condiciones ambientales. Bioagro 2006, 18, 171–175. [Google Scholar]
- Nunak, N.; Scheining, G. Instrumental textural changes in raw white shrimp during iced storage. J. Aquat. Food Prod. Technol. 2011, 20, 350–360. [Google Scholar] [CrossRef]
- Pornrat, S.; Sumate, T.; Rommance, S.; Sumolaya, K.; Kerr, W.L. Changes in the ultrastructure and texture of prawn muscle (Macrobrachuim rosenbergii) during cold storage. LWT-Food Sci. Technol. 2007, 40, 1747–1754. [Google Scholar] [CrossRef]
- Ashie, I.N.; Smith, J.P.; Simpson, B.K. Spoilage and shelf-life extension of fresh fish and shellfish. Crit. Rev. Food Sci. Nutr. 1996, 36, 87–121. [Google Scholar] [CrossRef] [PubMed]
- Haileslassie, W.; Gebrehiwot, M.; Balcha, E.; Hagos, Y.; Kidane, W. Determination of pH and water holding capacity of beef from selected butcher shops of Mekelle, Ethiopia. J. Vet. Med. Anim. Health 2018, 10, 159–164. [Google Scholar]
- Chan, S.S.; Roth, B.; Jessen, F.; Jakobsen, A.N.; Lerfall, J. Water holding properties of Atlantic salmon. Compr. Rev. Food Sci. Food Saf. 2022, 21, 477–498. [Google Scholar] [CrossRef]
- Coronado, B.A.L.; Moreno, V.M.J. Evaluación de la Calidad Física, Química y Microbiológica de Filete de Tilapia (Oreochromis niloticus) Adicionado con Antimicrobianos Naturales Durante su Almacenamiento en Hielo. Bachelor’s Thesis, Universidad de Sonora, Sonora, México, 2011. [Google Scholar]
- Moosavi-Nasab, M.; Khoshnoudi-Nia, S.; Azimifar, Z.; Kamyab, S. Evaluation of the total volatile basic nitrogen (TVB-N) content in fish fillets using hyperspectral imaging coupled with deep learning neural network and meta-analysis. Sci. Rep. 2021, 11, 5094. [Google Scholar] [CrossRef]
- Pankyamma, S.V.; Rani, K.S.; Binsi, P.K. Gravading process of Nile tilapia (Oreochromis niloticus) and evaluation of its biochemical and sensory changes during refrigerated storage. J. Food Process. Preserv. 2020, 44, e14631. [Google Scholar] [CrossRef]
- Gökodlu, N.; Özden, Ö.; Erkan, N. Physical, chemical, and sensory analyses of freshly harvested sardines (Sardina pilchardus) stored at 4 °C. J. Aquat. Food Prod. Technol. 1998, 7, 5–15. [Google Scholar] [CrossRef]
- Calo-Mata, P.; Arlino, S.; Boehme, K.; de Miguel, T.; Pascoal, A.; Barros-Velázquez, J. Current applications and future trends of lactic acid bacteria and their bacteriocins for the biopreservation of aquatic food products. Food Bioproc. Tech. 2008, 1, 43–63. [Google Scholar] [CrossRef]
- Tawfik, T.E.A.E.; Farghaly, R.M.; Gad-Elrab, H.M.; Abdel-Aziz, N.M. Effect of some essential oils against Aeromonas hydrophila artificially inoculated into raw Nile Tilapia fish fillets during refrigeration storage. SVU-Int. J. Vet. Sci. 2022, 5, 88–102. [Google Scholar] [CrossRef]
- Kirrella, G.; Moustafa, N.; Kishk, D.; Abdallah, R. Impact of using some essential oils on sensory acceptability and Aeromonas hydrophila contamination of Nile tilapia fish fillet during refrigeration storage. Kafrelsheikh Vet. Med. J. 2021, 19, 9–13. [Google Scholar] [CrossRef]
- Norma Oficial Mexicana. 1993. NOM-027-SSA1-1993 “Productos de la pesca. Pescados Frescos-Refrigerados y Congelados. Especificaciones Sanitarias”. Diario Oficial de la Federación. Secretaria de Gobernación, México. 1995, p. 8. Available online: https://www.dof.gob.mx/nota_detalle.php?codigo=4870248&fecha=03/03/1995&print=true (accessed on 9 May 2023).


Disclaimer/Publisher’s Note: The statements, opinions and data contained in all publications are solely those of the individual author(s) and contributor(s) and not of MDPI and/or the editor(s). MDPI and/or the editor(s) disclaim responsibility for any injury to people or property resulting from any ideas, methods, instructions or products referred to in the content. |
© 2023 by the authors. Licensee MDPI, Basel, Switzerland. This article is an open access article distributed under the terms and conditions of the Creative Commons Attribution (CC BY) license (https://creativecommons.org/licenses/by/4.0/).
Share and Cite
Jiménez-Ruíz, E.I.; Ocaño-Higuera, V.M.; Valdez-Hurtado, S.; Cruz-Guzmán, J.A.; Otero-León, C.B.; Ruíz-Cruz, S.; Garzón-García, A.M.; Barrales-Cureño, H.J.; Canizales-Rodríguez, D.F.; Pérez-Martínez, C.J.; et al. Quality Improvement and Shelf-Life Extension of Iced Nile Tilapia Fillets Using Natural Garlic Extract. Fishes 2023, 8, 325. https://doi.org/10.3390/fishes8060325
Jiménez-Ruíz EI, Ocaño-Higuera VM, Valdez-Hurtado S, Cruz-Guzmán JA, Otero-León CB, Ruíz-Cruz S, Garzón-García AM, Barrales-Cureño HJ, Canizales-Rodríguez DF, Pérez-Martínez CJ, et al. Quality Improvement and Shelf-Life Extension of Iced Nile Tilapia Fillets Using Natural Garlic Extract. Fishes. 2023; 8(6):325. https://doi.org/10.3390/fishes8060325
Chicago/Turabian StyleJiménez-Ruíz, Edgar Iván, Víctor Manuel Ocaño-Higuera, Santiago Valdez-Hurtado, José Alberto Cruz-Guzmán, Cesar Benjamín Otero-León, Saúl Ruíz-Cruz, Alba Mery Garzón-García, Hebert Jair Barrales-Cureño, Dalila Fernanda Canizales-Rodríguez, Cinthia Jhovanna Pérez-Martínez, and et al. 2023. "Quality Improvement and Shelf-Life Extension of Iced Nile Tilapia Fillets Using Natural Garlic Extract" Fishes 8, no. 6: 325. https://doi.org/10.3390/fishes8060325
APA StyleJiménez-Ruíz, E. I., Ocaño-Higuera, V. M., Valdez-Hurtado, S., Cruz-Guzmán, J. A., Otero-León, C. B., Ruíz-Cruz, S., Garzón-García, A. M., Barrales-Cureño, H. J., Canizales-Rodríguez, D. F., Pérez-Martínez, C. J., & Sumaya-Martínez, M. T. (2023). Quality Improvement and Shelf-Life Extension of Iced Nile Tilapia Fillets Using Natural Garlic Extract. Fishes, 8(6), 325. https://doi.org/10.3390/fishes8060325