Article

A Benchmark for Atlantic Salmon Conservation: Genetic Diversity and Structure in a Southern European Glacial Refuge before the Climate Changed

Department of Biodiversity, Ecology and Evolution, Faculty of Biological Sciences, Complutense University of Madrid (UCM), 28040 Madrid, Spain
*
Author to whom correspondence should be addressed.
Fishes 2023, 8(6), 321; https://doi.org/10.3390/fishes8060321
Submission received: 25 May 2023 / Revised: 13 June 2023 / Accepted: 14 June 2023 / Published: 16 June 2023
(This article belongs to the Special Issue Effect of Climate Change on Salmonid Fishes in Rivers)

Abstract

:
Atlantic salmon Salmo salar supports highly valuable commercial and recreational fisheries in Europe, but its stocks are currently overexploited and threatened by climate change. Its southernmost populations (in northern Spain) play a key role in conserving the species’ original genetic diversity, which is endangered due to decades-long (1970s to 1990s) massive stocking with non-native stocks. Their decline is well documented, but the effect of stock transfer and conservation efforts is unclear. Nine microsatellite loci were amplified from archival samples (scales from 1958–1959) from eight Spanish rivers to analyse the species’ natural genetic dynamics before its decline started. Allelic richness was high in the historical populations (the 1950s) and above most contemporary estimates. Private alleles were found in most rivers, indicating high local uniqueness and relative isolation among river basins. Some alleles are regional markers since they are rare or absent from contemporary northern European populations. Effective population size suggested good conservation status, with higher values than those estimated for contemporary populations. Strong population structure and genetic differentiation between rivers were found, with limited gene flow, restricted to geographically close populations. Our estimates of historical genetic diversity and structure from southernmost salmon populations are a powerful benchmark to guide conservation programs.
Key Contribution: Genetic diversity and effective size of southernmost European Atlantic salmon populations have declined dramatically since the 1950s, coupled with a loss of the historical genetic structure. Human-induced pressures, including extensive stocking with non-native stocks and ongoing climate change, are responsible for the changed population genetic structure of these rear-edge populations.

1. Introduction

Preservation of genetic diversity not only is paramount for the long-term conservation of species [1,2] but also enhances the capacity of ecosystems to withstand, recover, and adapt to environmental perturbations [3,4,5]. However, anthropogenic pressures on natural populations have long modified the genetic structure and gene flow patterns of fish species worldwide. These pressures hinder current attempts to identify which gene pools/stocks are genetically differentiated and which must be prioritised for conservation.
Atlantic salmon (Salmo salar) is an anadromous species with a very high socioeconomic status in Europe as it supports valuable commercial and recreational fisheries. However, since the second half of the 20th century, the species experienced alarming reductions in population size and genetic diversity due to overexploitation, anthropogenic impacts in fresh waters (i.e., water and habitat quality degradation, connectivity loss, and population admixing with non-native domesticated strains), and possible ecosystem change with reduced feeding opportunities for Atlantic salmon in the North Atlantic Ocean occurring in 2005. Production was reduced after that with smaller, slower growing, and later maturing salmon [6,7]. Consequently, the species was assessed as vulnerable (VU A2ace) in Europe [8]. These impacts have been more severe in southern European populations, where effective population sizes have been reported to be rather low [9] and negatively affected by current climate change [10,11,12]. Apart from the climate-driven ecosystem regime shifts leading to poorer trophic conditions that have occurred in their marine feeding habitats [11,12], southern populations have experienced the most serious impacts upon their local environmental conditions (mainly temperature and river flow) of its entire distribution [7,11,13]. These southern European salmon populations also have the singularity of following a westerly migration route towards Greenland instead of following the easterly branch of the North Atlantic current into the Norwegian Sea [14,15]. Better knowledge of these marine migration routes can help understand the causes of the ongoing salmon population decline.
Spanish populations have been profusely studied in terms of their genetic variability, population structure, and response to different management and conservation measures [16]. These studies were typically based on samples collected from the 1980s onwards, which corresponds to a period of drastic reduction in population sizes. This collapse was driven by the concurrence of an abrupt acceleration in the anthropogenic warming trend and the warm phase of the Atlantic Multidecadal Oscillation, which caused a major regime shift in biophysical conditions throughout the North Atlantic salmon feeding grounds [11]. Massive stocking of non-native salmon was performed in Spanish rivers between the 1970s and 1990s following the populations’ collapse in an attempt to aid population recovery [17]. Salmon were mainly imported from Scotland and released (between 20,000 and 100,000) annually at similar densities in all rivers [12]. However, information regarding the genetic diversity and structure of Spanish populations before this time is scarce [12,18,19]. In addition, conclusions from previous studies are strikingly disparate. Some results indicate a strong loss of diversity and population structure, significant levels of introgression, and a general population homogenization across river basins [12,20,21]. In contrast, others show a low impact of admixture with non-native strains [22] and a reduction in the effective population size of native stocks, while maintaining relatively high levels of genetic variation [18]. Finally, others reveal different effects between western and eastern Spanish rivers [23].
In order to carefully assess the current conservation status of Spanish Atlantic salmon populations and to understand the effects of anthropogenic disturbances, climate-driven environmental changes, and conservation efforts, it would be desirable to have an overview of historical genetic diversity (prior to stocking and the severe impacts of climate change). This can provide a benchmark for restoration attempts [24]. To this end, salmon scales collected in 1958–1959 in eight river basins that cover most of its Spanish distribution were analysed for variation at nine microsatellite loci. Microsatellites can be superior markers to SNPs for studying genetic diversity in natural populations, so microsatellite DNA polymorphism analysis can help support the success of conservation and restoration projects as an economically advantageous research technique [25,26]. Microsatellites were chosen in the present study because they also allow comparison with the significant amount of data already available in the literature and databases.
Our main objectives were to (a) study the genetic diversity of each population; (b) infer connectivity, migration rates, and population structure across river basins; (c) obtain indicators of the historical conservation status of each population, such as effective population size and evidence of bottleneck events. This information will provide insight into the changes experienced by Spanish salmon populations in the last 70 years and a benchmark for comparisons with current populations in the context of ongoing climate change.

2. Materials and Methods
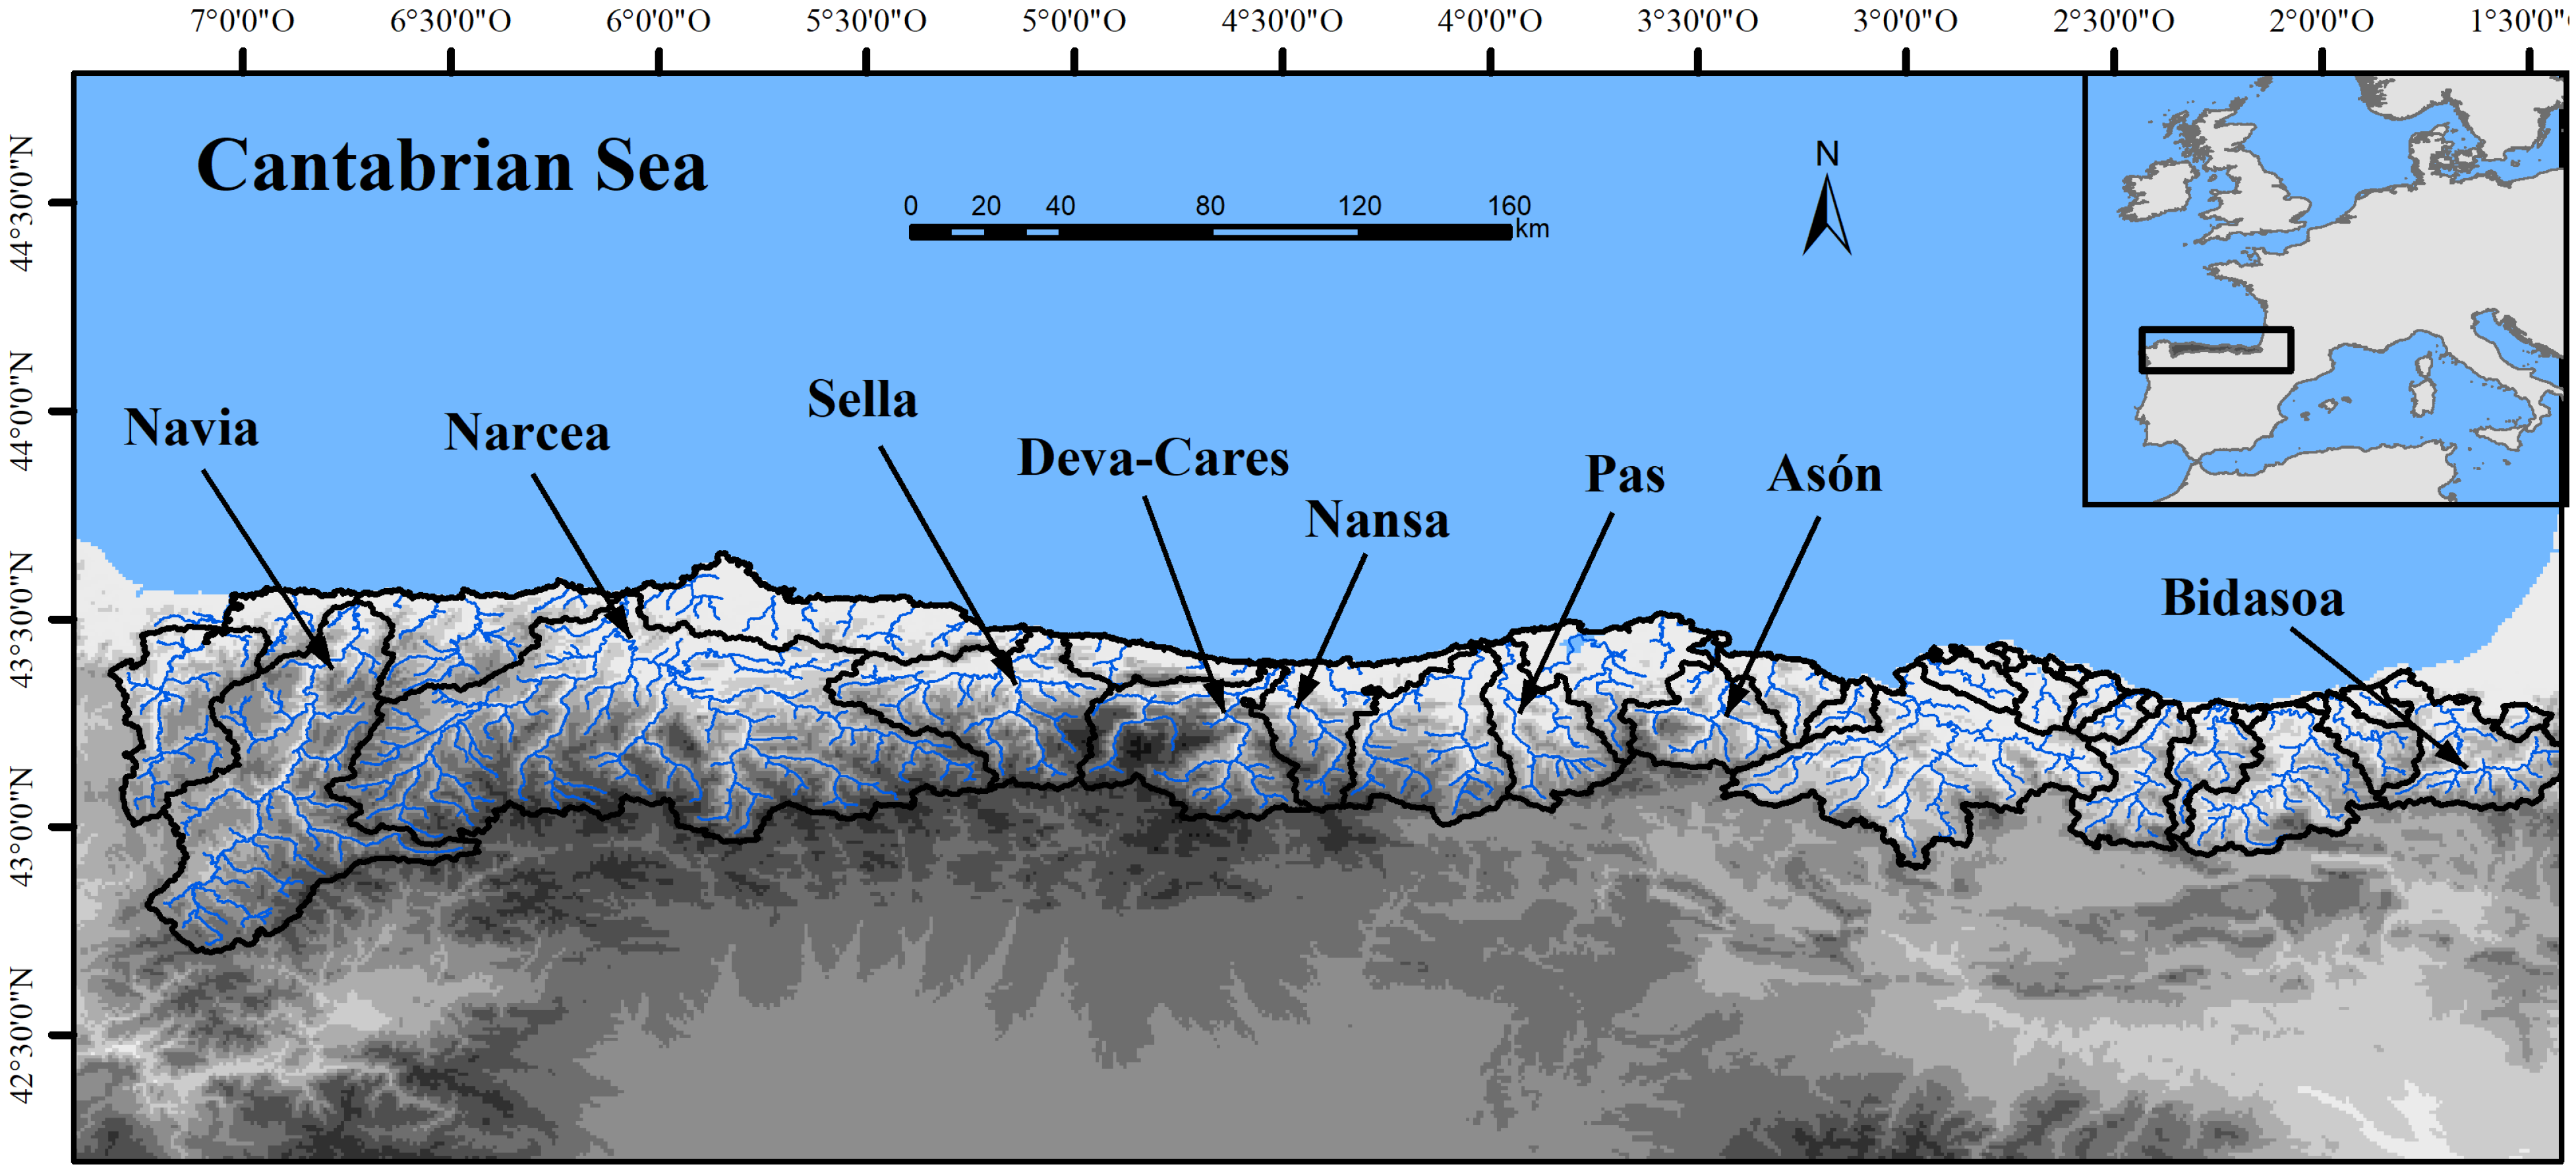
2.1. Study Area

A total of 374 archival samples of dried scales of Atlantic salmon from 8 northern Spanish rivers (Navia, Narcea, Sella, Deva-Cares, Nansa, Pas, Asón, and Bidasoa; Figure 1) were analysed. Archival samples were collected in 1958–1959 from returning salmon by the National Inland Fishing and Hunting Service of the Spanish Ministry of Agriculture (Madrid). Scales of salmon returning after two winters at sea were selected.
The Spanish rivers constitute the southernmost part of the Atlantic salmon distribution in Europe. In this area, the geomorphology and hydrogeology of the rivers are determined by the proximity of the Cantabrian Mountains to the sea, which produces very steep, V-shaped valleys that widen in their downstream sections. The main courses of the river basins are narrow and short, less than 100 km long, except for the River Navia, with a length of 159 km. In general, there is a dominance of fast-water habitats, and all are very well-preserved streams free from human activities causing water or habitat quality degradation.
However, the local hydroclimatic conditions in the study area have markedly changed over the last decades. Almodóvar et al. [11] detected a significant upward trend in regional temperature anomalies during 1950–2011, with an abrupt increase in the late 1980s. During this period, local climate warming concurred with a significant continuous increase in the frequency of low-flow events and a decrease in the minimum flow over seven or thirty consecutive days in the main rivers draining into the Cantabrian Sea and the Bay of Biscay. Such hydroclimatic changes were significantly linked to the abrupt decline observed in salmon captures in the study area since the 1970s, which was strongly accelerated from the late 1980s onwards [11]. In addition to the archival samples, reference samples of Atlantic salmon microsatellites for the eastern Atlantic (SALSEA) [27] were used for comparison.

2.2. Trends in Population Abundance

Atlantic salmon catch per unit effort (CPUE) data collected by the management authorities of Asturias, Cantabria, and Navarra in the study rivers for the last 73 years (1950–2022) were analysed. River catches were used as a proxy for abundance because this is the only measure of Atlantic salmon abundance consistently recorded in Spanish rivers over time. Until the early 2000s, the local authorities pooled salmon catches from the three rivers of Cantabria (Nansa, Pas, and Asón); so for consistency, we pooled their catches for the whole 73-year series. The salmon fishing season lasts from March to July, and the fishing regulations, number of fishing licences, and, thus, fishing effort have not changed significantly over the study period [11]. The nonparametric Mann–Kendall test, as modified by Yue and Wang [28] to account for serial correlation, was employed to detect significant annual upward or downward trends of salmon abundance in all the study rivers using the modifiedmk version 1.6 R package [29]. To detect regime shifts in the total salmon catch time series, a split moving-window boundary analysis [30] was used. This test computes the statistical contrast of the means of two halves of a window (width of 20 years here) as it moves along the time series through ANOVA tests (α = 0.01).

2.3. DNA Extraction and Microsatellite Genotyping

The QIAamp DNA Mini Kit (QIAGEN, IZASA, Madrid, Spain) was used to extract genomic DNA from archival scales. The quality and concentration of DNA were determined using spectrophotometry and were verified by 0.8% agarose gel electrophoresis. The following nine microsatellite loci were analysed: Ssa197, Ssa85 [31], SSOSL417, SSOSL85, SSOLS311 [32], SSOSL438 [33], SsaF43 [34], SSspG7, and SSsp2210 [35]. For each locus, a polymerase chain reaction (PCR) was performed in a volume of 25 μL. PCR reactions contained 1X Mg-free PCR buffer, 1.5–2.5 mM MgCl2, 0.16 mM of each primer, 200 μM of dNTPs, 1–1.25 U of Biotools HotSplit DNA polymerase (Biotools, Madrid, Spain), and 50–100 ng genomic DNA template. Specific annealing temperatures for the loci were 50 °C (SSOSL85, SSOSL311), 53 °C (SSOSL417, SSOSL438), 55 °C (SsaF43, SSspG7), or 58 °C (Ssa197, SSsp2210, Ssa85).
The amplifications were performed in a PCR machine GeneAmp® PCR System 9700 (Applied Biosystems, Waltham, MA, USA) using the following conditions, with occasional modifications to adapt to specific primers and/or samples: 95 °C 5 min, 30–40 cycles of 95 °C 20–40 s, 50 °C up to 58 °C, 20–40 s, and 72 °C 20–40 s, with a final extension at 72 °C 10 min. An ABI PRISM 3730 sequencer (Applied Biosystems, Waltham, MA, USA) was used to visualise the PCR products, and allele scoring was performed manually with the Peak ScannerTM Software v1.0 (Applied Biosystems, Waltham, MA, USA). To avoid cross-contamination while working with the archival samples, the entire process of buffer preparation, DNA extraction, and PCR amplification were performed in a laminar flow hood. The working area and equipment were cleaned with UV light followed by swabbing with ethanol before each new step in the protocol, and strict cleaning procedures were respected by all staff. Negative and positive controls were applied in all steps of the extraction and genotyping process.

2.4. Genetic Diversity

MICRO-CHECKER v2.2.3 (University of Hull, Hull, UK) [36] was used to assess the frequency of null alleles and scoring errors due to stuttering or large allelic drop-out. The combined use of two or three methods has been suggested as the best strategy for minimizing the false-positive and false-negative rates [37]. For this reason, two different analysis methods were additionally used to test for the presence of null alleles: CERVUS v3.0.3 (Field Genetics, London, UK) [38] and ML-NullFreq (Montana State University, Bozeman, MT, USA) [39].
GENEPOP v4.1 (Université de Montpellier, Montpellier, France) [40] was used to perform tests for departure from Hardy–Weinberg equilibrium and linkage disequilibrium for each locus and sample. The statistical significance was evaluated using the Bonferroni corrections. GENETIX v4.05.2 (Université de Montpellier, Montpellier, France) [41] was used to estimate Wright’s fixation index (FIS) for samples’ deviation from Hardy–Weinberg expectations for heterozygote disequilibrium following Weir and Cockerham [42]. Allele frequencies, number of alleles, and observed (Ho) and expected (He) heterozygosities were calculated at the population level with GENETIX v4.05.2 [41].

2.5. Connectivity and Population Structure

FSTAT v2.9.3 (Université de Lausanne, Lausanne, Switzerland) [43] was used to compute allelic richness (AR) and the genetic differentiation (FST) between population pairs using sequential Bonferroni-corrected p-values (10,000 permutations). GENEALEX v6.501 (Australian National University, Acton, Australia) [44] was used to visualise linearised FST values FST/(1 − FST) among locations via principal coordinates analysis (PCoA).
The Bayesian clustering method implemented in STRUCTURE v2.3.4 (Stanford University, Stanford, CA, USA) [45] was applied to further explore population structure. Structure analyses were performed for 1 to 10 clusters (ΔK) with 10 replicates for each simulated cluster. Analyses were run using an admixture model with correlated allele frequencies, 1,000,000 MCMC generations, and a burn-in period of 250,000 steps. Optimal ΔK was determined using STRUCTURE HARVESTER v0.6.94 (University of California, Los Angeles, Los Angeles, CA, USA) [46,47]. Replicates were aggregated using CLUMP v1.1.2 (Stanford University, Stanford, CA, USA) [48] and graphically displayed using DISTRUCT v1.1 (Stanford University, Stanford, CA, USA) [49]. Since STRUCTURE can capture major structures in a dataset but overlook finer scale structure [46], a hierarchical approach was followed. STRUCTURE was further applied independently to the identified genetic clusters until either each river represented its own cluster or optimal ΔK for a group of populations approached 1.
Relationships between genetic differentiation and landscape characteristics were examined using two approaches. First, the Mantel test was used to assess the significance of the correlation between linearised FST [50] and pairwise geographic distance between locations (measured as the shortest sea distance between river mouths [51]). Mantel tests with 9999 permutations were conducted in the R v3.3.3. package ade4 v1.7-11 [52,53]. Distance-based canonical redundancy analysis (dbRDA) of pairwise differentiation, implemented in the R package vegan v2.5-2 [54], was used as an additional method to study the correlation between FSTs and geographic distance.
Evidence for demographic bottlenecks was examined following two approaches. First, BOTTLENECK v1.2.02 (INRA-URLB, Montpellier, France) [55,56] was used to test for heterozygosity excess, assuming a two-phase mutation model (TPM) with 80% stepwise mutations (SMM) [57] and 10,000 iterations. The statistical significance of heterozygous excess was tested by one-tailed Wilcoxon’s signed-rank test. In addition, we estimated the ratio of the number of alleles to the range of allele size (M-ratio) following Garza and Williamson [58]. The M-ratio was most likely to correctly detect a population size reduction if the bottleneck was more ancient, prolonged, and had a large Θ value (Θ = 4Neµ) after the initial population decline [59]. The M_P_VAL software (NOAA Fisheries Santa Cruz Laboratory, University of California, Santa Cruz, CA, USA) [58] was used to estimate the M-ratio, which was compared with a critical value of M (Mc) from a theoretical population in mutation-drift equilibrium, implemented in the CRITICAL_M software (NOAA Fisheries Santa Cruz Laboratory, University of California, Santa Cruz, CA, USA) [58], assuming pre-bottleneck effective population size of 50, 100, 500 or 1000 and a mutation rate (µ) of 5 × 10⁻⁴. According to the recommendations of Perry et al. [60], the proportion of one-step mutations (pg) was set to 0.22, and the mean size of non-one-step mutations (Δg) to 3.1.
BAYESASS v3.0.3 (University of California, Davis, CA, USA) [61] was used to estimate recent migration rates (m) among rivers, using 2,000,000 burn-in and 20,000,000 iterations. Delta values for allele frequencies, inbreeding coefficients, and migration rates were set to 0.6, 0.7, and 1, respectively; these values provide adequate mixing within the ideal range of 20% and 60% [62].
The coalescent method implemented in MIGRATE-N v3.2.7 (Evolution and Genomics, Ballwin, MO, USA) [63,64] was chosen to explore migration rates between and within rivers. Estimations of mutation-scaled migration rates M (M = m/µ) and Θ (Θ = 4Neµ) were calculated using a Bayesian search strategy and a Brownian motion microsatellite model. Parameter space was searched using 10 short chains and 1 long chain with 3 replicates for 20,000,000 generations, an increment step of 20, and a burn-in of 250,000. Likewise, the parameter space was explored using 4 chains with an adaptive heating scheme (temperatures: 1.0, 1.2, 1.5, 3.0) to ensure that run results did not reflect local likelihood peaks. Finally, the Bayesian assignment procedure of Rannala and Mountain [65] implemented in GENECLASS v2 (INRA-URLB, Montpellier, France) [66] was used to identify putative first-generation migrants in Spanish rivers. The Paetkau et al. [67] resampling method was used to estimate the probability of each individual being a migrant based on 10,000 simulated individuals and a type 1 error threshold significance of 0.01.

2.6. Demographic Parameters

Estimates of census population size (Nc) were determined by the harmonic mean of ten years of annual river catches of returning adults collected by local management authorities. The effective number of breeders within a reproductive year (Nb) was calculated using the linkage disequilibrium (LD) method implemented in NeESTIMATOR v2.1 (Department of Agriculture and Fisheries, Queensland Government, Brisbane, Australia) [68]. A minimum allele frequency cutoff value of 0.02 was employed and 95% confidence intervals were obtained using the jack-knife method. This approach is based on LD between alleles from unlinked neutral loci within populations with random mating and implements a bias correction under a wide range of sample sizes.
Several studies [69,70,71,72,73] have shown that Nb (LD) estimates are robust to predict gene flow when migration rates are low and flow occurs between populations with weak genetic differentiation, even with small effective population sizes and missing data adjustment. This method appears to be the most suitable to estimate effective population size, showing consistent values across different demographic scenarios. In cases with overlapping generations, Nb estimates can be biased. For this reason, we applied the method developed by Waples et al. [74], in which two simple life-history traits are used to adjust genetic estimates of Nb to correct biases due to age structure. Nb was adjusted using the ratio between adult life span (AL) and age-at-maturity (α), following the equation:
Nb(adj) = Nb/(1.103 − 0.245Log (AL/α))
Nb is more easily quantifiable and thus can be a useful tool for managers, but remains less used than Ne [9]. Adjusted age-at-spawning was estimated between 2.65 to 3.04 years in Spanish rivers [18]; hence, an average age-at-maturity of 2.8 years was assumed for all rivers. The AL value was calculated as described by Waples et al. [74], using a maximum breeding age (ω) of 5 years for Atlantic salmon. The Ne(adj) was calculated using the equation proposed by Waples et al. [74]:
Ne(adj) = Nb(adj)/(0.485 + 0.758Log (AL/α))
The effective size ratios Nb(adj)/Nc and Ne(adj)/Nc also were calculated following Perrier et al. [9].

3. Results

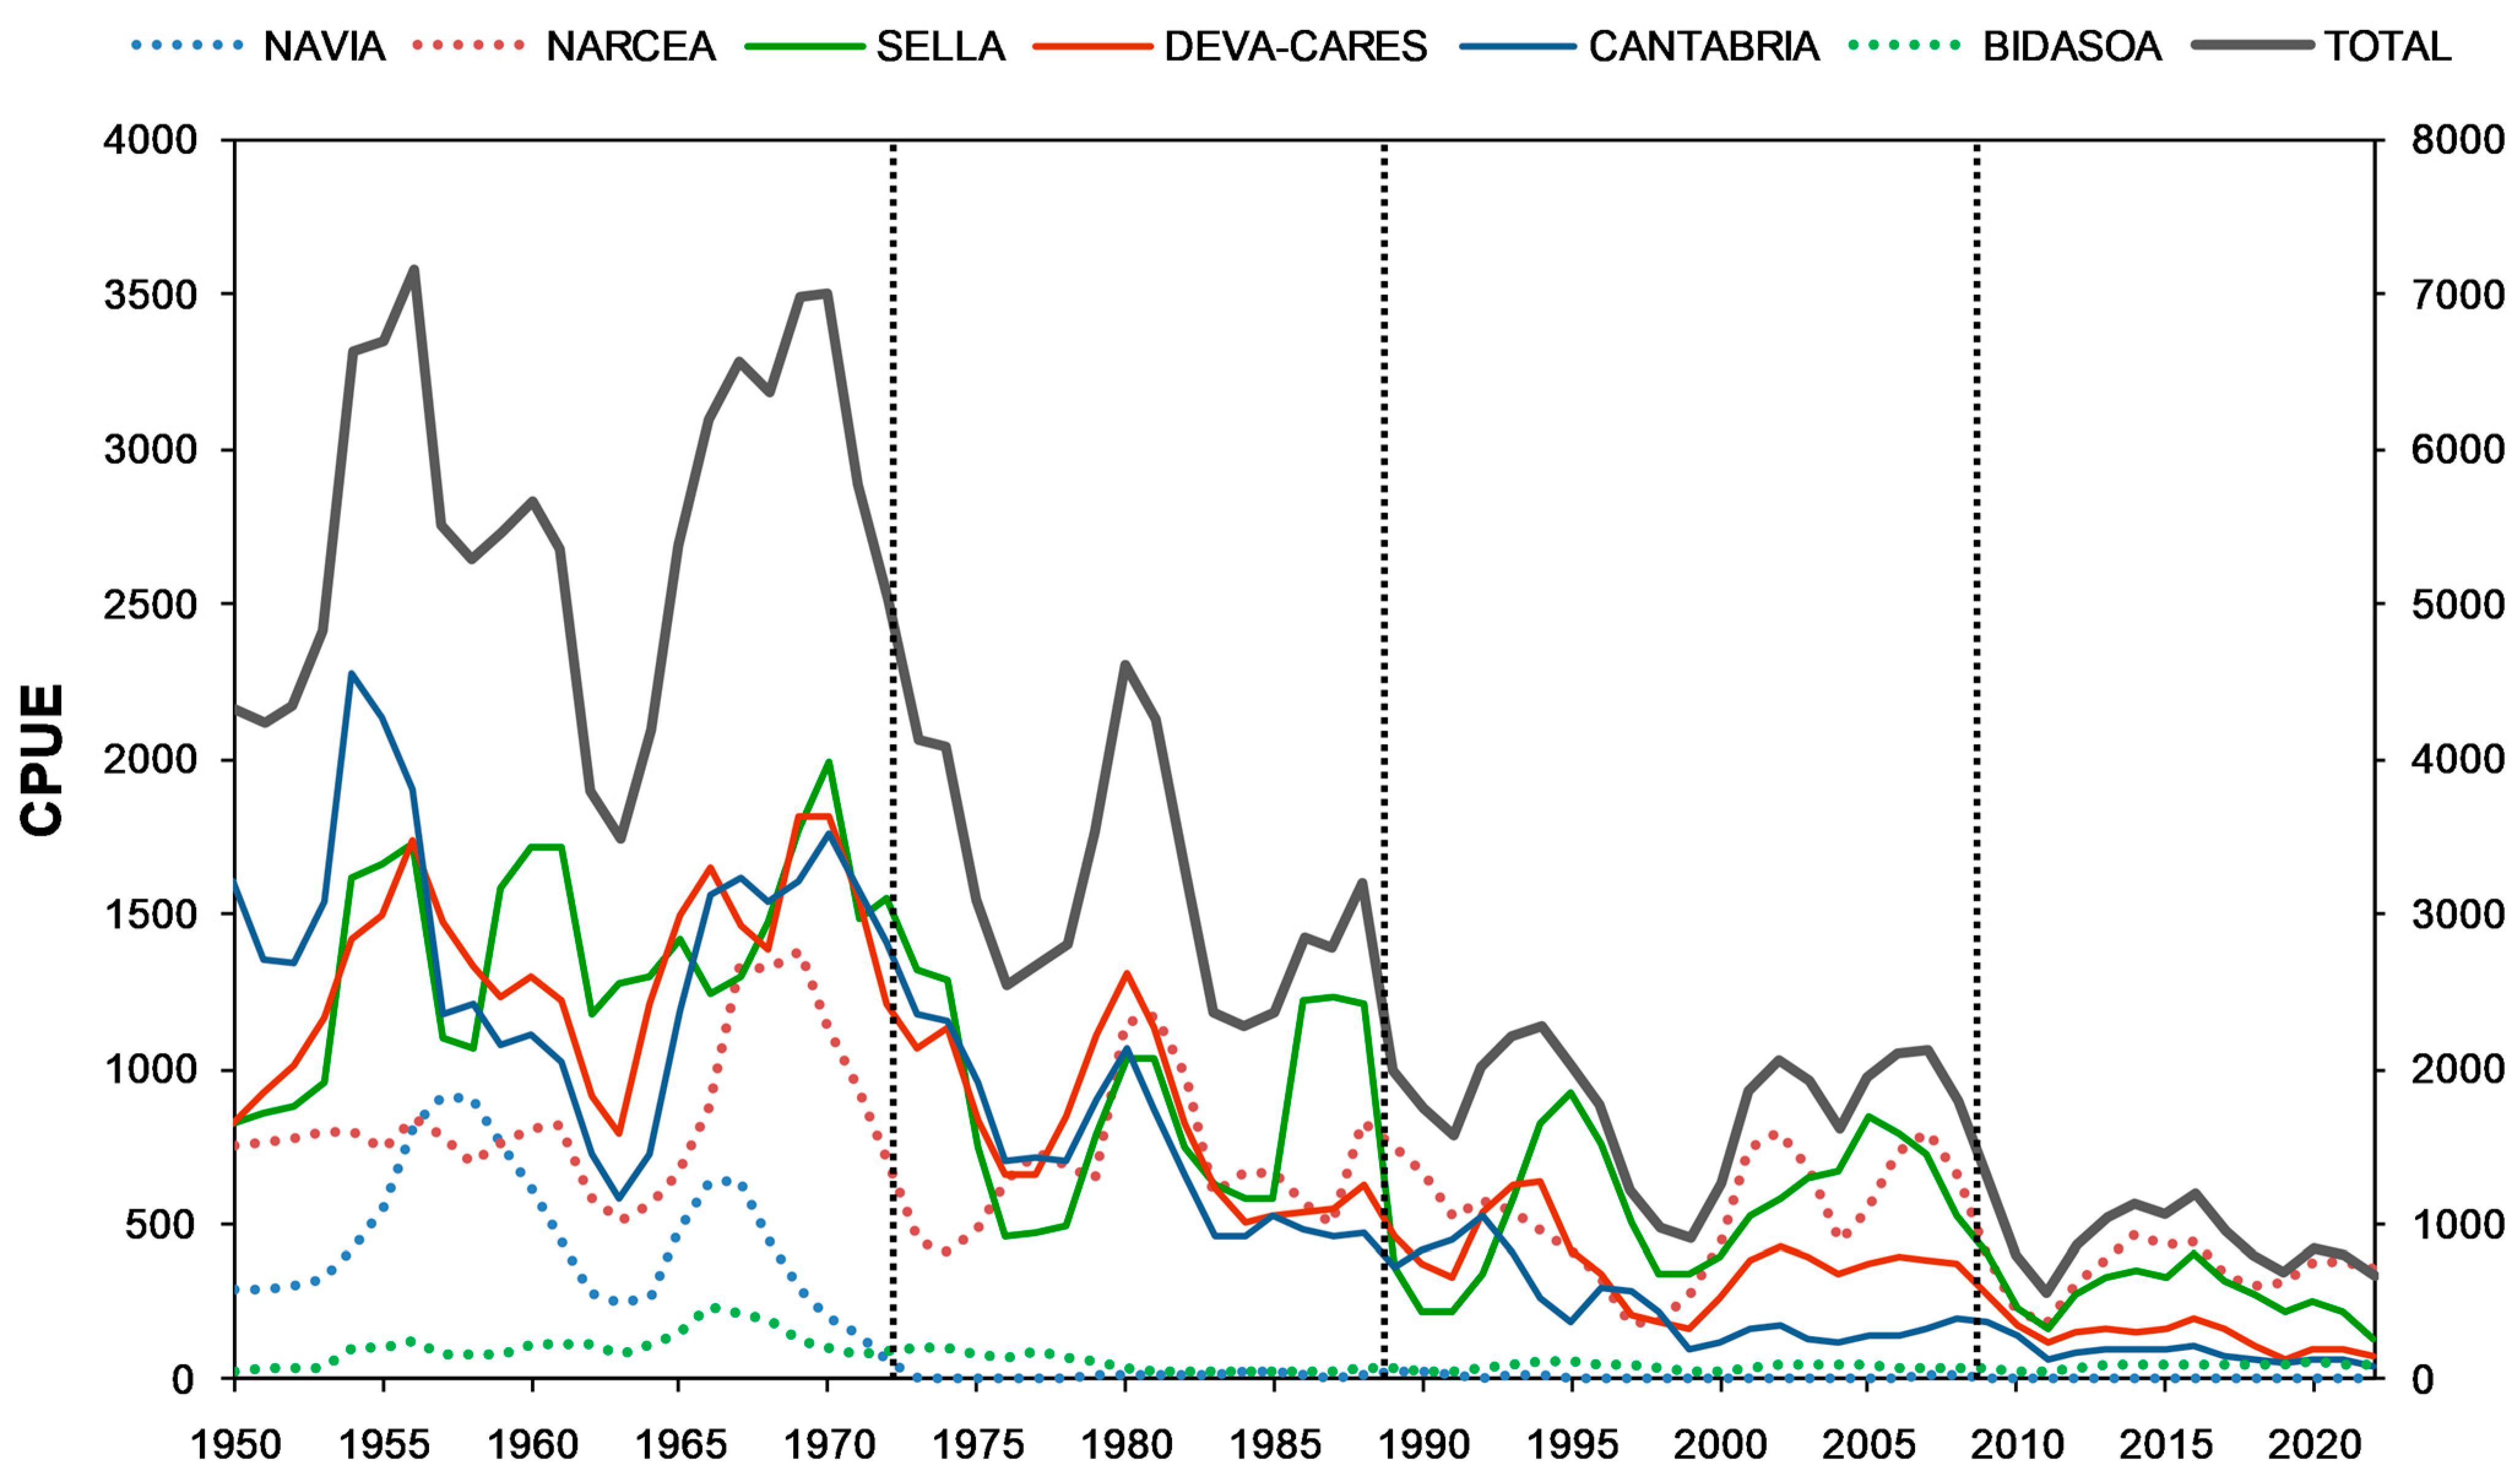
3.1. Long-Term Trends in Population Abundance

Total salmon abundance in the study area decreased significantly over the 1950–2022 period (Mann–Kendall test; τ = −0.493, adjusted Kendall p < 0.001, Sen’s slope = −13% change per decade). The same downward trend was observed in the individual rivers (Navia, τ = −0.611, p < 0.001, Sen’s slope = −3.8%; Narcea τ = −0.316, p < 0.001, Sen’s slope = −9%; Sella, τ = −0.494, p < 0.001, Sen’s slope = −11%; Deva-Cares, τ = −0.674, p < 0.001, Sen’s slope = −15.1%; Cantabria’s rivers, τ = −0.708, p < 0.001, Sen’s slope = −15%; Bidasoa, τ = −0.210, p < 0.05, Sen’s slope = −6.1%) (Figure 2). There was a regime shift in CPUE in the early 1970s followed by an abrupt decline from 1988–1989 and a more recent shift in 2008–2009 (Figure 2). Total salmon abundance dropped by 45% from the 1950–1972 period (mean = 5519.4 ± 1770.9) to the 1973–1988 period (mean = 3020.6 ± 1207.9), decreasing from this period to 1989–2008 (mean = 1728.9 ± 563.1) by 43%. Finally, salmon populations were further reduced by 52% from 2009 onwards (mean = 820.6 ± 343.7). On the whole, total salmon abundance was reduced by 85% from 1950–1972 to 2009–2022.

3.2. Genetic Diversity

Variations at nine microsatellite loci were examined in archival samples (the 1950s) from eight Spanish rivers. The locus Ssa85 was removed from the data set because it was difficult to amplify in some individuals and because of the occurrence of some alleles in the Navia, Narcea, and Asón rivers using MICRO-CHECKER (at the Bonferroni confidence level), CERVUS (F(null) ≥ 0.20) and ML-NullFreq (F(null) ≥ 0.11, p < 0.05) analyses.
A total of 110 alleles were found among all archival salmon samples. The mean number of alleles per locus ranged from 6.13 for the River Pas to 8.75 for the River Bidasoa (Table 1). The number of alleles varied from two at locus SSOSL438 to 12 at locus SSOSL311. Allelic richness showed significant differences among rivers (ANOVA, p < 0.05). Higher values were observed in the rivers Sella, Deva-Cares, and Bidasoa (AR mean = 8.2, range: 7.8–8.7), i.e., those with higher flows. Lower values were found in the rivers Navia, Narcea, Nansa, Pas, and Asón (AR mean = 7.1, range: 6.0–7.5), i.e., those with lower flows. Observed heterozygosity ranged from 0.58 (the River Pas) to 0.75 (the River Deva-Cares). No statistically significant deviation from Hardy–Weinberg equilibrium or any evidence of linkage between pairs of loci was detected.
Results from the comparison of the genetic diversity parameters (AR, He, and Ho) and effective population size Ne between the archival (the 1950s) and contemporary (the 1990s and 2000s) samples of Spanish Atlantic salmon are shown in Table 2. Average allelic richness AR for the historical (the 1950s) samples was higher than contemporary averages. However, the average expected He and observed Ho heterozygosity in archival samples were not apparently different from those of contemporary populations, with the exception of the lower 1990s values for the rivers Narcea and Sella. Finally, the average effective population size Ne for the archival 1950s samples was always higher than contemporary values, showing an evident decline.
All study rivers contained private alleles, ranging in number from 1 to 8 (for the River Bidasoa) (Table 3). All the microsatellite loci showed private alleles, with SSOSL311 and SSOSL417 showing the highest number of allelic variants across rivers (7 in both cases). Frequencies for these alleles ranged from 1.04% to 7.10%, the highest value corresponding to SSspG7*110 from the River Sella.
After comparison with the SALSEA baseline for the coincident microsatellite loci (Ssa197*, SSsp2210*, SspG7*, and SsaF43*), a few of these private alleles were found exclusively in Spanish rivers and were absent or extremely rare in northern European samples. For example, Ssa197*151 and SSspG7*110 were only found in the historical samples from the River Sella and the 2000s samples from the rivers Ulla and Eo; SSspG7*106 and SsaF43*128 were found in historical samples from the rivers Sella and Pas, and only (at a very low frequency) in three isolated populations from Ireland and Norway and Iceland, respectively.

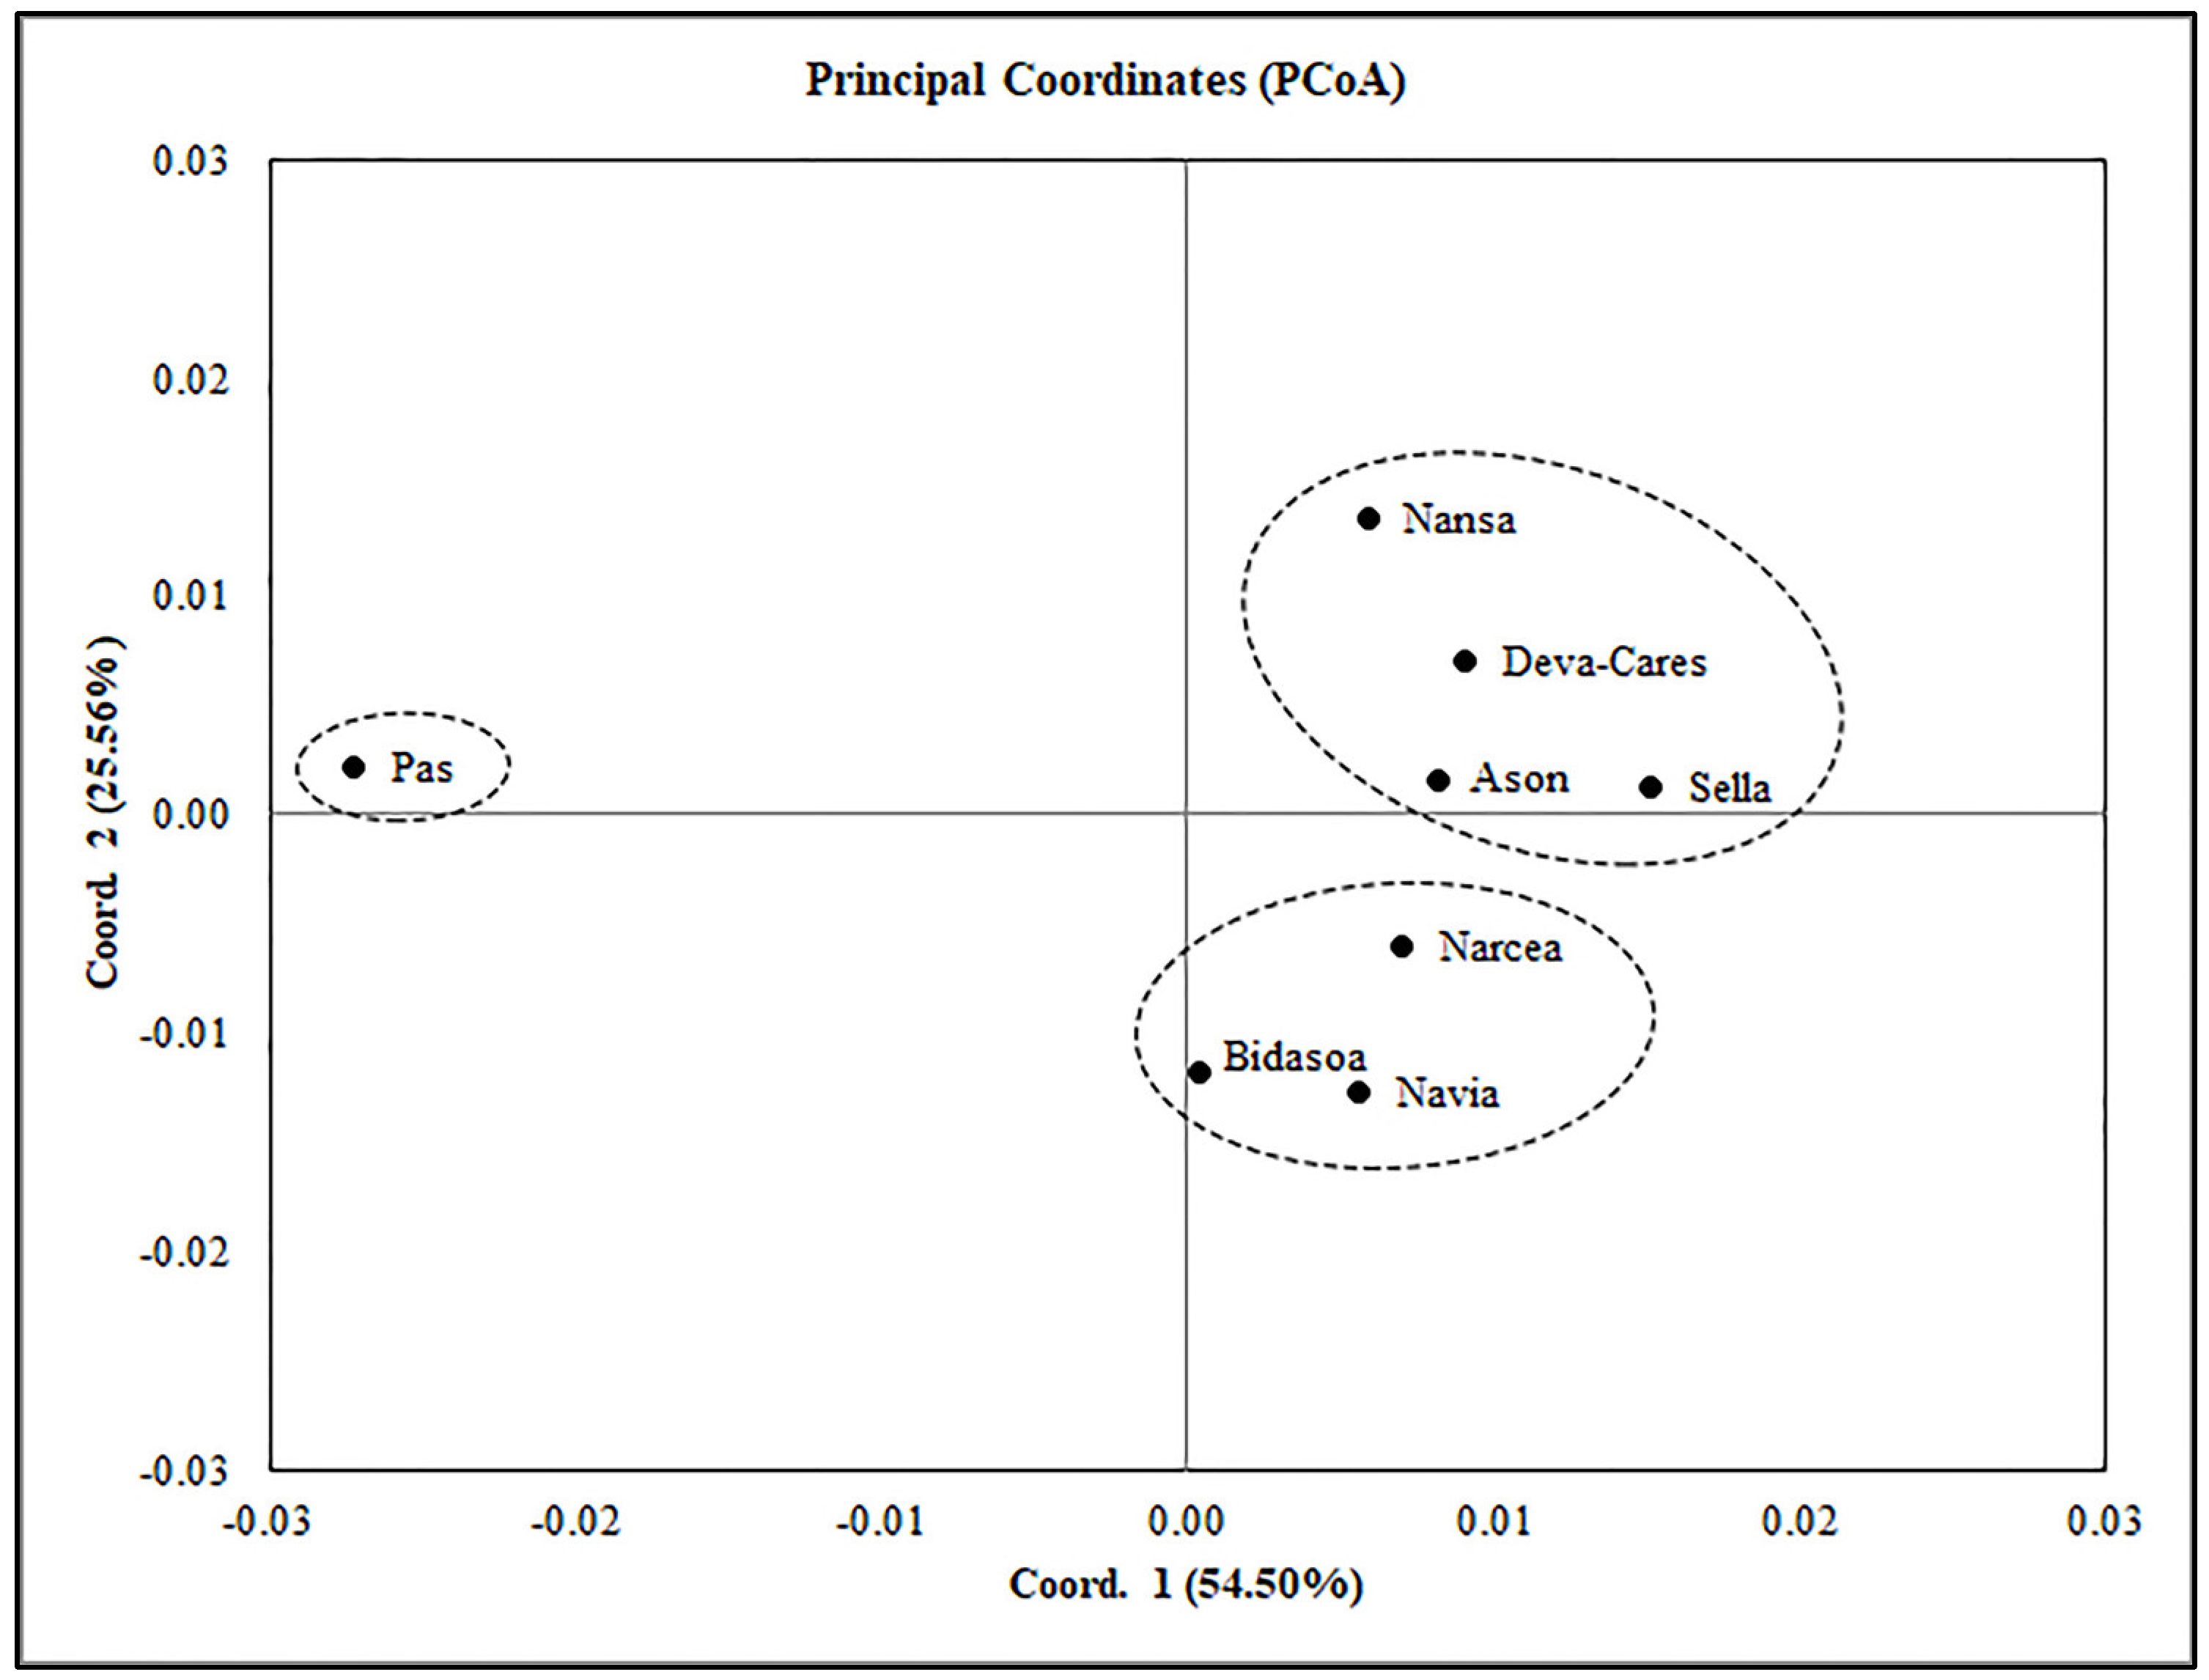
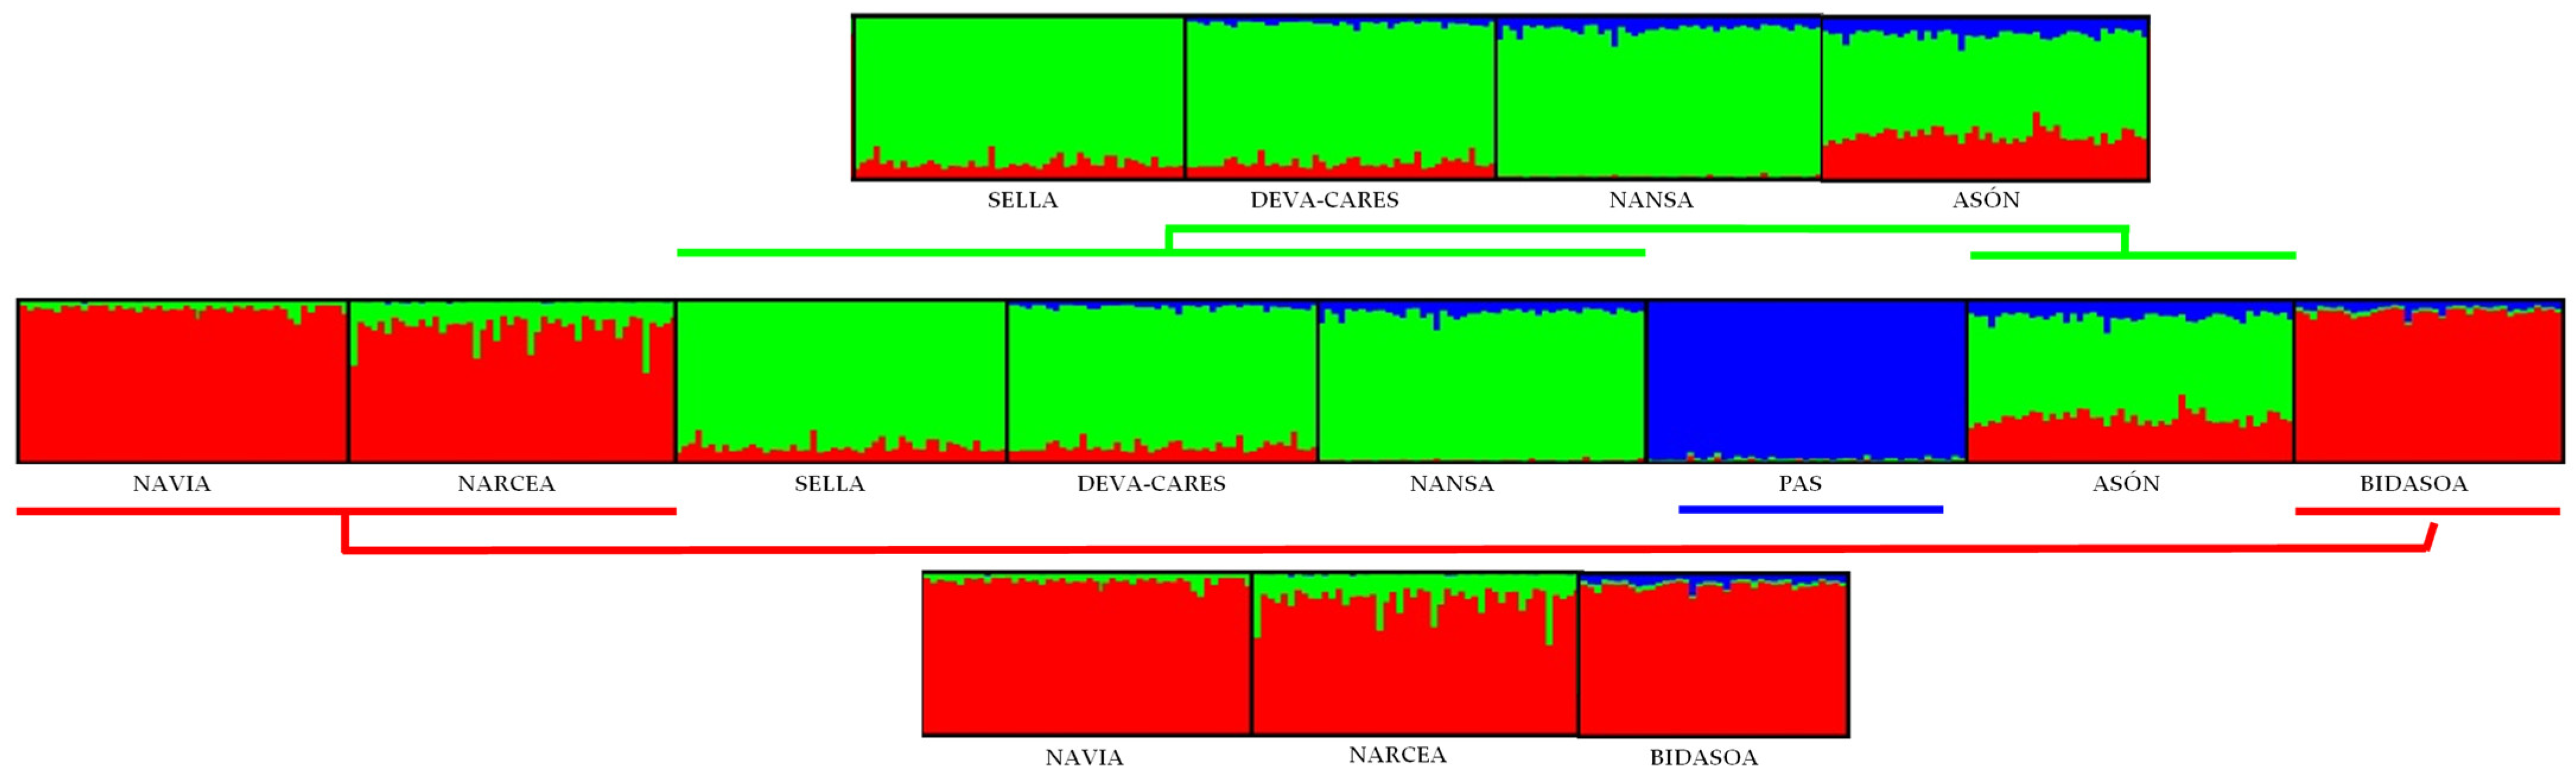
3.3. Connectivity and Population Structure

All pairwise FST values were statistically significant after the Bonferroni corrections (Table 4). They ranged from 0.008 to 0.098 (average FST = 0.054). The lowest level of genetic differentiation was observed between the rivers Sella and Deva-Cares (FST = 0.008, p < 0.010) and rivers Navia and Narcea (FST = 0.019, p < 0.01), whereas the highest level of differentiation was observed between the rivers Sella and Pas (FST = 0.098, p < 0.01).
Principal coordinate analysis (PCoA) based on linearised FSTs showed the separation of three groups in the studied rivers (Figure 3). The first axis, which accounted for 54.5% of molecular variance, separated the River Pas population from the rest of the rivers. The second axis, which explained 25.6% of the variance, separated the rivers Narcea, Navia, and Bidasoa from the Sella, Deva-Cares, Nansa, and Asón group, while the River Pas occupied an intermediate position.
The results of the Evanno test suggested that ΔK = 3 was the optimal cluster number for the first hierarchical level for the STRUCTURE analysis. Furthermore, the most significant increase in the LnP(D) values was detected at ΔK = 3. This Bayesian approach confirmed the same three genetic units found in the PCoA analysis (Figure 4). The River Asón population was assigned to the Sella, Deva-Cares, and Nansa clusters, to which it had the greatest percentage of membership (Q value = 62.0%). At the second and third hierarchical levels, all rivers were genetically different, except for Deva-Cares and Sella populations, which were indistinguishable from each other and presented a very low genetic divergence (FST = 0.008), so they were considered together for further analyses.
Mantel and dbRDA failed to detect isolation by distance among the analysed populations and significant correlations between genetic and geographic distances (Mantel: r = −0.083, p > 0.05; dbRDA: r = 0.801, p > 0.05). The results of the bottleneck tests did not show any such effect on the studied populations (Table 5). The BOTTLENECK test did not detect significant excess heterozygosity for the TPM model with 80% stepwise mutations (SMM) (p > 0.05, Table 5). Similarly, M-ratio values were not significantly lower than the simulated critical value of M (Mc) under mutation-drift equilibrium for the lower and upper values of pre-bottleneck effective population size values (p > 0.05, Table 5). Both tests did not show old or recent bottlenecks in the archival samples of Spanish salmon populations.
Recent migration rates between most isolated populations were low and asymmetric (m = 0.020–0.100) or very low (m < 0.020) (Figure 5). Higher migration rates were detected between the Navia (source) and Narcea (destination) populations (m = 0.119, range 0.099–0.141); Narcea and Navia (m = 0.245, range 0.181–0.309), and the Nansa and Sella + Deva-Cares populations (m = 0.169, range 0.074–0.264). Migration rates estimated by MIGRATE were very low (0.002–0.022) and showed no clear patterns. In addition, several of the chains did not reach convergence.
Finally, GENECLASS analysis identified nine individuals as migrants (p < 0.01) (Table 6). The migrants’ populations of origin were in accordance with their percentage of membership estimated from STRUCTURE analysis and their population migration rates estimated by BAYESASS, except for one migrant found in the River Pas. This individual was identified as being from the River Navia but showed a high percentage of membership (Q value = 93.5%) to the Pas cluster, and overall, there was a very low migration rate between rivers (average m = 0.013).

3.4. Demographic Parameters

Estimates of the census size, the effective number of breeders, the adjusted number of breeders, the adjusted effective size, and the effective size ratios are shown in Table 6. Nb(adj) was lowest for the rivers Pas and Nansa (77 and 85 respectively) and highest for the Deva-Cares and Sella populations (1040), with the remaining values being in the 139–575 range. For Ne(adj), a similar trend was observed, with the lowest values found for rivers Pas and Nansa (180, 197) and the highest values for the Deva-Cares and Sella populations (2431), while the rest of the populations varied between 325 and 1344. The River Narcea had the lowest Nb(adj)/Nc value (0.107), while the rest of the populations showed higher values (0.497–0.681). The River Bidasoa presented an unusually high value (2.890). The Ne(adj)/Nc values ranged between 0.250 (Narcea) and 1.592 (Nansa), with the Bidasoa again showing a very high value (6.753).

4. Discussion

4.1. Genetic Diversity

The historical (the 1950s) allelic richness of Spanish salmon populations was comparable to those found in some northern European populations [78,79] and was markedly higher than those observed in the 1990s Spanish samples [18]. These findings indicate a healthy level of genetic diversity prior to a severe loss in the following four decades. This genetic diversity loss contrasts with the increase of allelic richness observed in other salmonid populations after stocking [80] but could be explained by the loss of private alleles, an increase in the fishing effort [76], and the population collapse caused by climate-driven environmental changes in their breeding and feeding areas [10,11], leading to genetic drift in the resulting small populations. The increase in allelic richness in the Spanish 2000s samples [76], surpassing historical pre-stocking values, could be explained as a result of the genetic introgression caused by the stock transfer from northern Europe [12].
The absence of significant deviations from Hardy–Weinberg equilibrium (HWE) is consistent with other wild populations presenting low levels of disturbance (i.e., Icelandic populations [81]). In contrast, Consuegra et al. [18] found significant deviations from HWE (heterozygote deficit) in the rivers Nansa (samples from 1996 and 1997) and Deva (samples from 1993 and 1996), while Griffiths et al. [82] found that genotype frequencies in samples from the rivers Narcea, Asón, and Sella from 2004 significantly deviated from HWE. According to Griffiths et al. [82], these deviations from HWE expectations may be attributed to the decline in salmon population sizes in the Spanish river basins, combined with the effects of historical stocking and supportive breeding measures.
The number of private alleles found in historical samples and their absence in current populations offers further evidence of the loss of local genetic diversity. The existence of this native genetic diversity provides evidence of the relative historical isolation of salmon populations in these rivers before climate change and the effects of stocking on affected populations.

4.2. Connectivity and Population Structure

Historical Spanish populations showed a strong and significant genetic structuring very similar to that found in the River Teno complex (Norway and Finland) salmon population (FST = 0.065) [83]. Likewise, a pattern of spatial genetic differentiation was also described in the Spanish rivers, with an overall FST value of 0.019 [75]. Separating the pairwise comparisons by year (1993 vs. 1999), an increase in genetic differentiation (from 0.016 to 0.023) was found [75]. Even then, these values are far from those obtained here for the historical (the 1950s) populations (0.054). An overall FST value of 0.053 for Spanish rivers sampled in 1988, which dropped to 0.017 in 1996 and recovered to 0.033 in 2007, was reported [21]. These comparisons support the view of original marked genetic differentiation between populations, which was disrupted by human-mediated pressures, such as stock transfer and possible alterations of homing behaviour due to climate change, and a slow later recovery.
The results from the STRUCTURE and PCoA analyses confirmed a significant level of genetic structure in the region, which would correspond to the situation existing before the effects of climate change and foreign stocking intensified in the late 1980s. Indeed, right after the end of stock transfer practices (the 1990s), some Spanish populations (from which the rivers Sella, Narcea, and Cares overlap with our study) could be considered a single genetic unit [21]. In 2007, after several years of supportive breeding, the genetic structure changed into three separate units. This suggests that the removal of human-mediated transfer practices allowed the recovery of the natural genetic structure of salmon populations from Spanish rivers, even if the allocation to genetic units did not exactly match the clusters found in the 1950s.
While most of the allocations to genetic clusters are consistent with geographic location (with neighbouring rivers being the most closely related), other allocations are surprising and warrant more complex explanations. The River Pas population seems to be very isolated genetically, but it is geographically located between the other river basins. On the other hand, the population from the River Bidasoa (the easternmost river basin) was included in the same cluster as the rivers Narcea and Navia (the westernmost river basins). This cluster could be explained by the existence of undocumented pre-1960s human-mediated transfers, which could have homogenised these distant populations. Another compatible scenario is the existence in the past of a widespread lineage, linked by frequent migration, corresponding to the Narcea-Navia-Bidasoa cluster, from which smaller populations (Bidasoa) would have eventually become isolated, diverging into distinct genetic units. Therefore, larger populations (Narcea-Navia) could have retained more of the original signal of panmixia. However, the separation of these populations into different clusters in the lower hierarchical level appears to be more consistent with the geographical location of the populations and should reflect their connectivity and spatial genetic structure more accurately.
A STRUCTURE analysis including samples from the rivers Deva, Asón, Pas, and Nansa, and samples pooled by decades since the 1950s was recently carried out by Ciborowski et al. [19]. As temporal variation added heterogeneity to the dataset and the microsatellites used were not all the same as in the present study, it is difficult to compare the results of both analyses. There were some similarities and some discrepancies. As in the second hierarchical level, each river was assigned to its own cluster. However, populations from the rivers Nansa and Pas could be assigned to the same cluster considering the 1960s data in isolation, while in our study, the Pas population is clearly isolated from the rest at the first hierarchical level.
Significant migration only occurred between contiguous rivers, which were recovered in the same PCoA and STRUCTURE (1st-level) clusters. Estimates obtained by MIGRATE were generally very low and differed from the BAYESASS migration rates in magnitude and direction. Estimates from MIGRATE tend to be comparatively low and do not necessarily reflect connectivity inferred by BAYESASS (commonly interpreted as contemporary connectivity) [24]. In this light, we decided to focus on BAYESASS migration rates for interpretation.
Estimated migration rates for Atlantic salmon have been rarely reported for the Spanish rivers. An earlier study in the 1990s [18], using microtagging-recapture and Bayesian assignment tests based on microsatellites to estimate the proportion of salmon migrants among the rivers Asón, Pas, and Nansa, obtained a range from 0.07 to 0.31. Migration rates obtained for most population pairs in our study are within or below this range (even though some of them are far from each other), indicating infrequent departures from homing behaviour among historical populations.
More studies on Atlantic salmon migration rates have been carried out in the rest of its geographical distribution. Several tagging studies have shown that straying in salmonids is rare, typically ranging between 1 and 10% in geographically close rivers [24]. In the River Teno (Norway and Finland, samples from 1979 to 2001), recent migration rates (using BAYESASS) varied between 0.003–0.260 [84]. In Canadian rivers from Newfoundland and Labrador, a similar range was obtained (0.011–0.303) using contemporary samples and the same methodology [24]. Both studies considered such migration rates as low. Once again, estimates from our historical populations seem to overlap with those previous rates, but with lower maximum values. It is remarkable that migration from larger to smaller populations and vice versa were detected. Some authors [18] suggested that larger, more stable populations should act as a sink attracting strays from neighbouring rivers, while others [85,86,87] found that larger populations act as a source. Empirical studies show that larger populations can behave as sinks and that patterns can switch over evolutionary time scales [24]. In any case, we found that gene flow from smaller to larger populations was quantitatively prevailing. On the other hand, warmer and drier local environmental conditions seem to cause increased straying between neighbouring rivers in southern populations of Atlantic salmon, resulting in a higher gene flow between close populations [77]. Thus, ongoing climate change might increase straying rates in the future. Values obtained in current populations from Spain could be compared with migration rates from historical populations to extrapolate and test this hypothesis across the whole Cantabrian watershed.
The absence of isolation by distance is not uncommon in Atlantic salmon populations at large spatial scales [24,88]. Considering the strong homing behaviour of the species, it seems intuitive that genetic distances between populations from different river basins have an important geographical component. However, it seems more likely that the spatial genetic structure in the Spanish populations may be determined by the geological and ecological characteristics of the rivers (isolation by the environment [89]). Thus, the studied rivers can be classified into Atlantic siliceous rivers (Navia, Narcea), Atlantic calcareous rivers (Sella, Deva-Cares, Nansa, Pas, Asón), and Pyrenean rivers (Bidasoa). Salmon are more likely to stray into rivers that are ecologically similar to their river of origin [90], which is consistent with the correspondence between the 1st-level genetic clusters and the grouping of the rivers on the former classification. Other environmental features of the rivers (temperature, water discharge, etc.) could explain further subdivision in 2nd-level clusters and isolation of the River Pas, the closer relationship between the Sella and Deva-Cares samples, or the exclusion of Nansa (geographically closer to Sella and Deva-Cares).

4.3. Demographic Parameters

The population abundance trends estimated in this study are consistent with previous studies in the area [11], showing a widespread and strong population decline linked to climate change from the 1980s. Consequently, the estimates of the census size, the effective and adjusted number of breeders, the adjusted effective size, and the effective size ratios in historical samples were generally closer to values found in well-preserved, high-latitude salmon populations than to current Spanish populations, which experienced a strong decline linked to climate change from the 1980s [10,11]. For example, the average Nb(adj) from our study was 356, the average Nb(adj) estimate from Canadian (Quebec) populations was 211 [9], and the average Nb estimated for some Spanish rivers was 107.5 [75]. The same applies to Ne(adj): our estimates from historical populations ranged from 180 to 2431 (average 833), while estimates for the 1990s and 2000s populations ranged from 37 to 96 (average 60 [76]), 64–260 [17,75] or 38–175 [18]. These results are consistent with the general declines in Ne observed in salmon populations worldwide [91].
As evidence of the reasonably good conservation status of the historical populations, all had Ne above the minimum threshold (Ne = 95) for retaining 90% of genetic diversity over 100 years [76], and several showed Ne values close to or well over the threshold (Ne = 1000), below which long-term maintenance of evolutionary potential is uncertain [92]. Considering other Ne estimates from the study area [76], which included three of the studied rivers (Cares, Sella, and Narcea), it is established that the decline in effective population size between the 1990s and 2007–2008 already started between the 1950s and the 1990s, probably due to marine overfishing and climate-driven environmental changes in both freshwater and marine habitats. Contrary to Consuegra et al. [18], who found evidence of bottlenecks in the more recent (1993–1998) samples of the populations from the rivers Deva, Nansa, Pas, and Asón, there was no signal of bottlenecking in the populations sampled in the 1950s. This is other evidence of the good conservation status of the historical populations that highlights the importance of their decline in the last decades of the 20th century.

5. Conclusions

Historical (the 1950s) Atlantic salmon populations from Spain showed a remarkable native allelic uniqueness, different indicators of good conservation status (not dissimilar from current Canadian and Scandinavian populations), and a marked population structure with limited migration between close river basins. Since then, study populations have experienced a continuous decline that was accelerated in the 1980s, which could be attributed to intense climate-driven biophysical changes in their marine and freshwater habitats. This decline contributed to a reduction in genetic diversity since the 1990s, which was reversed due to massive stocking with non-native stocks, a practice that could not prevent a loss of native alleles and the population collapse. Furthermore, the synergistic effects of a warmer climate, drier rivers, and the homogenizing effect of human-mediated introgression have driven the genetic erosion of native population structure.
Despite efforts to recover targeted stocks, the current situation is alarming and merits urgent measures to prevent local extinction. Stocking practices have been highly detrimental and their effects, combined with those of climate change, can be considered the main anthropogenic impact affecting salmon survival and the integrity of the species’ genome regionally. Comparisons of current populations with the benchmark provided in our study could help identify which factors have affected salmon populations the most in this area in the last 70 years, in order to guide conservation programs and evaluate the adaptive potential of the species under ongoing climate change. Efforts should target recovering the historical structure of populations and preserving their unique gene pools.

Author Contributions

A.A. planned, supervised, and coordinated the work. A.A., S.L. and D.F.M. performed laboratory work and data analyses. A.A. wrote the paper with major contributions from B.E., G.G.N. and D.A. A.A. and B.E. gathered the funding and coordinated the project administration. All authors have read and agreed to the published version of the manuscript.

Funding

This research was funded by the Spanish Ministry of Science and Innovation through research project CGL2012-36049 and by the Spanish Ministry of Economy, Industry and Competitiveness through research project CGL2017-84269-P.

Institutional Review Board Statement

All laboratory procedures complied with current Spanish and European conservation legislation and strictly adhered to regulations on the handling of wild animals (Directive 2010/63/EU).

Data Availability Statement

The data presented in this study are available upon request from the corresponding author (A.A.: [email protected]).

Acknowledgments

We are very grateful to Jerónimo de la Hoz (Environmental Agency, Regional Government of Asturias, Spain) for his help. We are also very grateful to John Gilbey, who kindly provided us with the microsatellite baseline generated by the SALSEA-Merge Project (Available online: www.nasco.int/sas/salseamerge.htm, accessed on 15 May 2022).

Conflicts of Interest

The authors declare no conflict of interest.

References

  1. Schindler, D.E.; Hilborn, R.; Chasco, B.; Boatright, C.P.; Quinn, T.P.; Rogers, L.A.; Webster, M.S. Population diversity and the portfolio effect in an exploited species. Nature 2010, 465, 609–612. [Google Scholar] [CrossRef] [PubMed]
  2. Hoban, S.; Archer, F.I.; Bertola, L.D.; Bragg, J.G.; Breed, M.F.; Bruford, M.W.; Hunter, M.E. Global genetic diversity status and trends: Towards a suite of Essential Biodiversity Variables (EBVs) for genetic composition. Biol. Rev. 2022, 97, 1511–1538. [Google Scholar] [CrossRef]
  3. Luck, G.W.; Daily, G.C.; Ehrlich, P.R. Population diversity and ecosystem services. Trends Ecol. Evol. 2003, 18, 331–336. [Google Scholar] [CrossRef] [Green Version]
  4. Frankham, R. Genetics and extinction. Biol. Conserv. 2005, 126, 131–140. [Google Scholar] [CrossRef]
  5. Reusch, T.B.H.; Ehlers, A.; Hämmerli, A.; Worm, B. Ecosystem recovery after climatic extremes enhanced by genotypic diversity. Proc. Natl. Acad. Sci. USA 2005, 102, 2826–2831. [Google Scholar] [CrossRef] [PubMed] [Green Version]
  6. Dadswell, M.; Spares, A.; Reader, J.; McLean, M.; McDermott, T.; Samways, K.; Lilly, J. The decline and impending collapse of the Atlantic Salmon (Salmo salar) population in the North Atlantic Ocean: A review of possible causes. Rev. Fish. Sci. Aquac. 2021, 30, 215–258. [Google Scholar] [CrossRef]
  7. Thorstad, E.B.; Bliss, D.; Breau, C.; Damon-Randall, K.; Sundt-Hansen, L.E.; Hatfield, E.M.; Sutton, S.G. Atlantic salmon in a rapidly changing environment. Facing the challenges of reduced marine survival and climate change. Aquat. Conserv. Mar. Freshw. Ecosyst. 2021, 31, 2654–2665. [Google Scholar] [CrossRef]
  8. Nieto, A.; Ralph, G.M.; Comeros-Raynal, M.T.; Kemp, J.; García-Criado, M.; Allen, D.J.; Williams, J.T. European Red List of Marine Fishes; Publications Office of the European Union: Luxembourg, 2015. [Google Scholar]
  9. Perrier, C.; April, J.; Cote, G.; Bernatchez, L.; Dionne, M. Effective number of breeders in relation to census size as management tools for Atlantic salmon conservation in a context of stocked populations. Conserv. Genet. 2016, 17, 31–44. [Google Scholar] [CrossRef]
  10. Nicola, G.G.; Elvira, B.; Jonsson, B.; Ayllón, D.; Almodóvar, A. Local and global climatic drivers of Atlantic salmon decline in southern Europe. Fish Res. 2018, 198, 78–85. [Google Scholar] [CrossRef]
  11. Almodóvar, A.; Ayllón, D.; Nicola, G.G.; Jonsson, B.; Elvira, B. Climate-driven bio-physical changes in feeding and breeding environments explain the decline of southernmost European Atlantic salmon populations. Can. J. Fish. Aquat. Sci. 2019, 76, 1581–1595. [Google Scholar] [CrossRef] [Green Version]
  12. Almodóvar, A.; Leal, S.; Nicola, G.G.; Hórreo, J.L.; García-Vázquez, E.; Elvira, B. Long-term stocking practices threaten the original genetic diversity of the southernmost European populations of Atlantic salmon Salmo salar. Endanger. Species Res. 2020, 41, 303–317. [Google Scholar] [CrossRef]
  13. Gallagher, B.K.; Geargeoura, S.; Fraser, D.J. Effects of climate on salmonid productivity: A global meta-analysis across freshwater ecosystems. Glob. Chang. Biol. 2022, 28, 7250–7269. [Google Scholar] [CrossRef]
  14. Almodóvar, A.; Nicola, G.G.; Ayllón, D.; Trueman, C.N.; Davidson, I.; Kennedy, R.; Elvira, B. Stable isotopes suggest the location of marine feeding grounds of south European Atlantic salmon in Greenland. ICES J. Mar. Sci. 2020, 77, 593–603. [Google Scholar] [CrossRef]
  15. Rikardsen, A.H.; Righton, D.; Strøm, J.F.; Thorstad, E.B.; Gargan, P.; Sheehan, T.; Aarestrup, K. Redefining the oceanic distribution of Atlantic salmon. Sci. Rep. 2021, 11, 12266. [Google Scholar] [CrossRef] [PubMed]
  16. Hórreo, J.L.; de la Hoz, J.; Machado-Schiaffino, G.; Pola, I.G.; García-Vázquez, E. Restoration and enhancement of Atlantic salmon populations: What we have learned from North Iberian rivers. Knowl. Manag. Aquat. Ecosyst. 2011, 402, 23. [Google Scholar] [CrossRef]
  17. Ribeiro, A.; Morán, P.; Caballero, A. Genetic diversity and effective size of the Atlantic salmon Salmo salar L. inhabiting the River Eo (Spain) following a stock collapse. J. Fish Biol. 2008, 72, 1933–1944. [Google Scholar] [CrossRef]
  18. Consuegra, S.; Verspoor, E.; Knox, D.; García de Leániz, C. Asymmetric gene flow and the evolutionary maintenance of genetic diversity in small, peripheral Atlantic salmon populations. Conserv. Genet. 2005, 6, 823–842. [Google Scholar] [CrossRef]
  19. Ciborowski, K.; Jordan, W.C.; García de Leániz, C.; Consuegra, S. Temporal and spatial instability in neutral and adaptive (MHC) genetic variation in marginal salmon populations. Sci. Rep. 2017, 7, 42416. [Google Scholar] [CrossRef] [PubMed] [Green Version]
  20. Ayllón, F.; Martínez, J.L.; García-Vázquez, E. Loss of regional population structure in Atlantic salmon, Salmo salar L. following stocking. ICES J. Mar. Sci. 2006, 63, 1269–1273. [Google Scholar] [CrossRef] [Green Version]
  21. Hórreo, J.L.; Machado-Schiaffino, G.; Ayllón, F.; Griffiths, A.M.; Bright, D.; Stevens, J.R.; García-Vázquez, E. Impact of climate change and human-mediated introgression on southern European Atlantic salmon populations. Glob. Chang. Biol. 2011, 17, 1778–1787. [Google Scholar] [CrossRef]
  22. Blanco, G.; Ramos, M.D.; Vázquez, E.; Sánchez, J.A. Assessing temporal and spatial variation in wild populations of Atlantic salmon with particular reference to Asturias (Northern Spain) rivers. J. Fish Biol. 2005, 67, 169–184. [Google Scholar] [CrossRef]
  23. Campos, J.L.; Posada, D.; Morán, P. Introgression and genetic structure in northern Spanish Atlantic salmon (Salmo salar L.) populations according to mtDNA data. Conserv. Genet. 2008, 9, 157–169. [Google Scholar] [CrossRef]
  24. Palstra, F.P.; O’Connell, M.F.; Ruzzante, D.E. Population structure and gene flow reversals in Atlantic salmon (Salmo salar) over contemporary and long-term temporal scales: Effects of population size and life history. Mol. Ecol. 2007, 16, 4504–4522. [Google Scholar] [CrossRef]
  25. Kaczmarczyk, D. Techniques based on the polymorphism of microsatellite DNA as tools for conservation of endangered populations. Appl. Ecol. Environ. Res. 2019, 17, 1599–1615. [Google Scholar] [CrossRef]
  26. Wenne, R. Microsatellites as molecular markers with applications in exploitation and conservation of aquatic animal populations. Genes 2023, 14, 808. [Google Scholar] [CrossRef]
  27. Gilbey, J.; Coughlan, J.; Wennevik, V.; Prodöhl, P.; Stevens, J.R.; García de Leániz, C.; Verspoor, E. A microsatellite baseline for genetic stock identification of European Atlantic salmon (Salmo salar L.). ICES J. Mar. Sci. 2018, 75, 662–674. [Google Scholar] [CrossRef] [Green Version]
  28. Yue, S.; Wang, C.Y. The Mann-Kendall test modified by effective sample size to detect trend in serially correlated hydrological series. Water Resour. Manag. 2004, 18, 201–218. [Google Scholar] [CrossRef]
  29. Patakamuri, S.K.; O’Brien, N. Modifiedmk: Modified Versions of Mann Kendall and Spearman’s Rho Trend Tests, R Package Version 1.6. 2022. Available online: https://cran.r-project.org/web/packages/modifiedmk/ (accessed on 9 May 2023).
  30. Webster, R. Automatic soil-boundary location from transect data. J. Int. Assoc. Math. Geol. 1973, 5, 27–37. [Google Scholar] [CrossRef]
  31. O’Reilly, P.T.; Hamilton, L.C.; McConnell, S.K.; Wright, J.M. Rapid analysis of genetic variation in Atlantic salmon (Salmo salar) by PCR multiplexing of dinucleotide and tetranucleotide microsatellites. Can. J. Fish. Aquat. Sci. 1996, 53, 2292–2298. [Google Scholar] [CrossRef]
  32. Slettan, A.; Olsaker, I.; Lie, Ø. Atlantic salmon, Salmo salar, microsatellites at the SSOSL25, SSOSL85, SSOSL311, SSOSL417 loci. Anim. Genet. 1995, 26, 281–282. [Google Scholar] [CrossRef] [PubMed]
  33. Slettan, A.; Olsaker, I.; Lie, Ø. Polymorphic Atlantic salmon, Salmo salar L. microsatellites at the SSOSL438, SSOSL439 and SSOSL444 loci. Anim. Genet. 1996, 27, 57–58. [Google Scholar] [CrossRef] [PubMed]
  34. Sánchez, J.A.; Clabby, C.; Ramos, D.; Blanco, G.; Flavin, F.; Vázquez, E.; Powell, R. Protein and microsatellite single locus variability in Salmo salar L. (Atlantic salmon). Heredity 1996, 77, 423–432. [Google Scholar] [CrossRef] [PubMed] [Green Version]
  35. Paterson, S.; Piertney, S.B.; Knox, D.; Gilbey, J.; Verspoor, E. Characterization and PCR multiplexing of novel highly variable tetranucleotide Atlantic salmon (Salmo salar L.) microsatellites. Mol. Ecol. Notes 2004, 4, 160–162. [Google Scholar] [CrossRef]
  36. Van Oosterhout, C.; Hutchinson, W.F.; Wills, D.P.; Shipley, P. MICRO-CHECKER: Software for identifying and correcting genotyping errors in microsatellite data. Mol. Ecol. Notes 2004, 4, 535–538. [Google Scholar] [CrossRef]
  37. Dabrowski, M.J.; Pilot, M.; Kruczyk, M.; Zmihorski, M.; Umer, H.M.; Gliwicz, J. Reliability assessment of null allele detection: Inconsistencies between and within different methods. Mol. Ecol. 2014, 14, 361–373. [Google Scholar] [CrossRef] [Green Version]
  38. Kalinowski, S.T.; Taper, M.L.; Marshall, T.C. Revising how the computer program CERVUS accommodates genotyping error increases success in paternity assignment. Mol. Ecol. 2007, 16, 1099–1106. [Google Scholar] [CrossRef]
  39. Kalinowski, S.T.; Taper, M.L. Maximum likelihood estimation of the frequency of null alleles at microsatellite loci. Conserv. Genet. 2006, 7, 991–995. [Google Scholar] [CrossRef]
  40. Rousset, F. GENEPOP’007: A complete reimplementation of the GENEPOP software for Windows and Linux. Mol. Ecol. Resour. 2008, 8, 103–106. [Google Scholar] [CrossRef] [PubMed]
  41. Belkhir, K.; Borsa, P.; Chikhi, L.; Raufaste, N.; Bonhomme, F. GENETIX 4.05, logiciel sous Windows TM pour la génétique des populations. In Laboratoire Génome, Populations, Interactions, CNRS UMR 5171; Université de Montpellier II: Montpellier, France, 2004. [Google Scholar]
  42. Weir, B.S.; Cockerham, C.C. Estimating F-statistics for the analysis of population structure. Evolution 1984, 38, 1358–1370. [Google Scholar] [CrossRef]
  43. Goudet, J. FSTAT (Version 1.2): A computer program to calculate F-statistics. J. Hered. 1995, 86, 485–486. [Google Scholar] [CrossRef]
  44. Peakall, R.; Smouse, P.E. GENALEX 6: Genetic analysis in Excel. Population genetic software for teaching and research. Mol. Ecol. Notes 2006, 6, 288–295. [Google Scholar] [CrossRef]
  45. Pritchard, J.K.; Stephens, M.; Donnelly, P. Inference of population structure using multilocus genotype data. Genetics 2000, 155, 945–959. [Google Scholar] [CrossRef]
  46. Evanno, G.; Regnaut, S.; Goudet, J. Detecting the number of clusters of individuals using the software STRUCTURE: A simulation study. Mol. Ecol. 2005, 14, 2611–2620. [Google Scholar] [CrossRef] [Green Version]
  47. Earl, D.A.; von Holdt, B.M. STRUCTURE HARVESTER: A website and program for visualizing STRUCTURE output and implementing the Evanno method. Conserv. Genet. Resour. 2012, 4, 359–361. [Google Scholar] [CrossRef]
  48. Jakobsson, M.; Rosenberg, N.A. CLUMPP: A cluster matching and permutation program for dealing with label switching and multimodality in analysis of population structure. Bioinformatics 2007, 23, 1801–1806. [Google Scholar] [CrossRef] [Green Version]
  49. Rosenberg, N.A. DISTRUCT: A program for the graphical display of population structure. Mol. Ecol. Notes 2004, 4, 137–138. [Google Scholar] [CrossRef]
  50. Rousset, F. Genetic differentiation and estimation of gene flow from F-statistics under isolation by distance. Genetics 1997, 145, 1219–1228. [Google Scholar] [CrossRef]
  51. King, T.L.; Kalinowski, S.T.; Schill, W.B.; Spidle, A.P.; Lubinski, B.A. Population structure of Atlantic salmon (Salmo salar L.): A range-wide perspective from microsatellite DNA variation. Mol. Ecol. 2001, 10, 807–821. [Google Scholar] [CrossRef] [Green Version]
  52. Thioulouse, J.; Chessel, D.; Dolédec, S.; Olivier, J. ADE-4: A multivariate analysis and graphical display software. Stat. Comput. 1997, 7, 75–83. [Google Scholar] [CrossRef]
  53. Chessel, D.; DuFour, A.B.; Thioulouse, J. The ade4 Package—I: One-table Methods. R News 2004, 4, 5–10. [Google Scholar]
  54. Oksanen, J.; Blanchet, F.; Guillaume, F.M.; Kindt, R.; Legendre, P.; McGlinn, D.; Wagner, H. Vegan: Community Ecology Package. R Package (Version 2.5-2). 2008. Available online: https://CRAN.R-project.org/package=vegan (accessed on 5 May 2023).
  55. Cornuet, J.M.; Luikart, G. Description and power analysis of two tests for detecting recent population bottlenecks from allele frequency data. Genetics 1996, 144, 2001–2014. [Google Scholar] [CrossRef] [PubMed]
  56. Piry, S.; Luikart, G.; Cornuet, J.M. Computer note. BOTTLENECK: A computer program for detecting recent reductions in the effective size using allele frequency data. J. Hered. 1999, 90, 502–503. [Google Scholar] [CrossRef]
  57. Di Rienzo, A.; Peterson, A.C.; Garza, J.C.; Valdes, A.M.; Slatkin, M.; Freimer, N.B. Mutational processes of simple-sequence repeat loci in human populations. Proc. Natl. Acad. Sci. USA 1994, 91, 3166–3170. [Google Scholar] [CrossRef] [PubMed] [Green Version]
  58. Garza, J.C.; Williamson, E. Detection of reduction in population size using data from microsatellite loci. Mol. Ecol. 2001, 10, 305–318. [Google Scholar] [CrossRef]
  59. Williamson-Natesan, E.G. Comparison of methods for detecting bottlenecks from microsatellite loci. Conserv. Genet. 2005, 6, 551–562. [Google Scholar] [CrossRef]
  60. Perry, M.Z.; Kirby, R.; Reid, B.N.; Stoelting, R.; Doucet-Bëer, E.; Robinson, S.; Palsbøll, P.J. Reliability of genetic bottleneck tests for detecting recent population declines. Mol. Ecol. 2012, 21, 3403–3418. [Google Scholar] [CrossRef] [PubMed]
  61. Wilson, G.A.; Rannala, B. Bayesian inference of recent migration rates using multilocus genotypes. Genetics 2003, 163, 1177–1191. [Google Scholar] [CrossRef] [PubMed]
  62. Rannala, B. BayesAss Edition 3.0 User’s Manual; University of California: Davis, CA, USA, 2011; Available online: https://www.rannala.org/?page_id=245 (accessed on 5 May 2023).
  63. Beerli, P. Comparison of Bayesian and maximum likelihood inference of population genetic parameters. Bioinformatics 2006, 22, 341–345. [Google Scholar] [CrossRef] [Green Version]
  64. Beerli, P.; Palczewski, M. Unified framework to evaluate panmixia and migration direction among multiple sampling locations. Genetics 2010, 185, 313–326. [Google Scholar] [CrossRef] [Green Version]
  65. Rannala, B.; Mountain, J.L. Detecting immigration by using multilocus genotypes. Proc. Natl. Acad. Sci. USA 1997, 94, 9197–9201. [Google Scholar] [CrossRef] [Green Version]
  66. Piry, S.; Alapetite, A.; Cornuet, J.M.; Paetkau, D.; Baudouin, L.; Estoup, A. GENECLASS2: A software for genetic assignment and first-generation migrant detection. J. Hered. 2004, 95, 536–539. [Google Scholar] [CrossRef] [PubMed]
  67. Paetkau, D.; Slade, R.; Burden, M.; Estoup, A. Genetic assignment methods for the direct, real-time estimation of migration rate: A simulation-based exploration of accuracy and power. Mol. Ecol. 2004, 13, 55–65. [Google Scholar] [CrossRef] [PubMed]
  68. Do, C.; Waples, R.S.; Peel, D.; Macbeth, G.M.; Tillett, B.J.; Ovenden, J.R. NeEstimator v2: Re-implementation of software for the estimation of contemporary effective population size (Ne) from genetic data. Mol. Ecol. Resour. 2014, 14, 209–214. [Google Scholar] [CrossRef] [PubMed]
  69. Gómez-Uchida, D.; Knight, T.W.; Ruzzante, D.E. Interaction of landscape and life history attributes on genetic diversity, neutral divergence and gene flow in a pristine community of salmonids. Mol. Ecol. 2009, 18, 4854–4869. [Google Scholar] [CrossRef] [PubMed]
  70. Waples, R.S.; England, P.R. Estimating contemporary effective population size on the basis of linkage disequilibrium in the face of migration. Genetics 2011, 189, 633–644. [Google Scholar] [CrossRef] [PubMed] [Green Version]
  71. Gilbert, K.J.; Whitlock, M.C. Evaluating methods for estimating local effective population size with and without migration. Evolution 2015, 69, 2154–2166. [Google Scholar] [CrossRef] [PubMed]
  72. Whiteley, A.R.; Coombs, J.A.; Donnell, M.J.O.; Nislow, K.H.; Letcher, B.H. Keeping things local: Subpopulation Nb and Ne in a stream network with partial barriers to fish migration. Evol. Appl. 2017, 10, 348–365. [Google Scholar] [CrossRef]
  73. Bernos, T.A.; Yates, M.C.; Fraser, D.J. Fine-scale differences in genetic and census population size ratios between two stream fishes. Conserv. Genet. 2018, 9, 265–274. [Google Scholar] [CrossRef]
  74. Waples, R.S.; Antao, T.; Luikart, G. Effects of overlapping generations on linkage disequilibrium estimates of effective population size. Genetics 2014, 197, 769–780. [Google Scholar] [CrossRef] [Green Version]
  75. Borrell, Y.J.; Bernardo, D.; Blanco, G.; Vázquez, E.; Sánchez, J.A. Spatial and temporal variation of genetic diversity and estimation of effective population sizes in Atlantic salmon (Salmo salar L.) populations from Asturias (Northern Spain) using microsatellites. Conserv. Genet. 2008, 9, 807–819. [Google Scholar] [CrossRef]
  76. Hórreo, J.L.; Machado-Schiaffino, G.; Griffiths, A.M.; Bright, D.; Stevens, J.R.; García-Vázquez, E. Atlantic salmon at risk: Apparent rapid declines in effective population size in southern European populations. Trans. Am. Fish. Soc. 2011, 140, 605–610. [Google Scholar] [CrossRef]
  77. Valiente, A.G.; Beall, E.; García-Vázquez, E. Population genetics of south European Atlantic salmon under global change. Glob. Chang. Biol. 2010, 16, 36–47. [Google Scholar] [CrossRef]
  78. Säisä, M.; Koljonen, M.L.; Gross, R.; Nilsson, J.; Tähtinen, J.; Koskiniemi, J.; Vasemägi, A. Population genetic structure and postglacial colonization of Atlantic salmon (Salmo salar) in the Baltic Sea area based on microsatellite DNA variation. Can. J. Fish. Aquat. Sci. 2005, 62, 1887–1904. [Google Scholar] [CrossRef] [Green Version]
  79. Finnegan, A.K.; Griffiths, A.M.; King, R.A.; Machado-Schiaffino, G.; Porcher, J.P.; García-Vázquez, E.; Stevens, J.R. Use of multiple markers demonstrates a cryptic western refugium and postglacial colonisation routes of Atlantic salmon (Salmo salar L.) in northwest Europe. Heredity 2013, 111, 34–43. [Google Scholar] [CrossRef] [PubMed] [Green Version]
  80. Valiquette, E.; Perrier, C.; Thibault, I.; Bernatchez, L. Loss of genetic integrity in wild lake trout populations following stocking: Insights from an exhaustive study of 72 lakes from Québec, Canada. Evol. Appl. 2014, 7, 625–644. [Google Scholar] [CrossRef] [PubMed]
  81. Gudmundsson, L.A.; Gudjónsson, S.; Marteinsdóttir, G.; Scarnecchia, D.L.; Daníelsdóttir, A.K.; Pampoulie, C. Spatio-temporal effects of stray hatchery-reared Atlantic salmon Salmo salar on population genetic structure within a 21 km-long Icelandic river system. Conserv. Genet. 2013, 14, 1217–1231. [Google Scholar] [CrossRef]
  82. Griffiths, A.M.; Machado-Schiaffino, G.; Dillane, E.; Coughlan, J.; Hórreo, J.L.; Bowkett, A.E.; McGinnity, P. Genetic stock identification of Atlantic salmon (Salmo salar) populations in the southern part of the European range. BMC Genet. 2010, 11, 31. [Google Scholar] [CrossRef] [PubMed] [Green Version]
  83. Vähä, J.P.; Erkinaro, J.; Falkegård, M.; Orell, P.; Niemelä, E. Genetic stock identification of Atlantic salmon and its evaluation in a large population complex. Can. J. Fish. Aquat. Sci. 2016, 74, 327–338. [Google Scholar] [CrossRef] [Green Version]
  84. Vähä, J.P.; Erkinaro, J.; Niemelä, E.; Primmer, C.R. Temporally stable genetic structure and low migration in an Atlantic salmon population complex: Implications for conservation and management. Evol. Appl. 2008, 1, 137–154. [Google Scholar] [CrossRef]
  85. Fraser, D.J.; Lippe, C.; Bernatchez, L. Consequences of unequal population size, asymmetric gene flow and sex-biased dispersal on population structure in brook charr (Salvelinus fontinalis). Mol. Ecol. 2004, 13, 67–80. [Google Scholar] [CrossRef]
  86. Manier, M.K.; Arnold, S.J. Population genetic analysis identifies source-sink dynamics for two sympatric garter snake species (Thamnophis elegans and Thamnophis sirtalis). Mol. Ecol. 2005, 14, 3965–3976. [Google Scholar] [CrossRef]
  87. Hansen, M.M.; Skaala, O.; Jensen, L.F.; Bekkevold, D.; Mensberg, K.L.D. Gene flow, effective population size and selection at major histocompatibility complex genes: Brown trout in the Hardanger Fjord, Norway. Mol. Ecol. 2007, 16, 1413–1425. [Google Scholar] [CrossRef] [Green Version]
  88. Bradbury, I.R.; Hamilton, L.C.; Robertson, M.J.; Bourgeois, C.E.; Mansour, A.; Dempson, J.B. (2014). Landscape structure and climatic variation determine Atlantic salmon genetic connectivity in the Northwest Atlantic. Can. J. Fish. Aquat. Sci. 2014, 71, 246–258. [Google Scholar] [CrossRef]
  89. Sexton, J.P.; Hangartner, S.B.; Hoffman, A.A. Genetic isolation by environment or distance: Which pattern of gene flow is most common? Evolution 2013, 68, 1–15. [Google Scholar] [CrossRef] [Green Version]
  90. Bowlby, H.D.; Fleming, I.A.; Gibson, A.J.F. Applying landscape genetics to evaluate threats affecting endangered Atlantic salmon populations. Conserv. Genet. 2016, 17, 823–838. [Google Scholar] [CrossRef] [Green Version]
  91. Lehnert, S.J.; Kess, T.; Bentzen, P.; Kent, M.P.; Lien, S.; Gilbey, J.; Clément, M.; Jeffery, N.W.; Waples, R.S.; Bradbury, I.R. Genomic signatures and correlates of widespread population declines in salmon. Nat. Commun. 2019, 10, 2996. [Google Scholar] [CrossRef] [PubMed] [Green Version]
  92. Frankham, R.; Bradshaw, C.J.A.; Brook, B.W. Genetics in conservation management: Revised recommendations for the 50/500 rules, red list criteria and population viability analyses. Biol. Conserv. 2014, 170, 56–63. [Google Scholar] [CrossRef]
Figure 1. Location of the study area in Spain.
Fishes 08 00321 g001
Figure 2. Long-term changes in catch per unit effort (CPUE) (3-year moving average) of Atlantic salmon in the study area (left y-axis: captures from study rivers; right y-axis: total captures) from 1950 to 2022. The dashed vertical lines indicate the detected significant shifts in the total capture trend (1972–1973; 1988–1989; 2008–2009). Cantabria includes rivers Nansa, Pas, and Asón.
Fishes 08 00321 g002
Figure 3. Principal coordinate analysis of linearised pairwise FST values in archival samples (the 1950s) of Atlantic salmon populations from Spain.
Fishes 08 00321 g003
Figure 4. Estimation of the percentage of membership to each of three clusters inferred by STRUCTURE in archival samples (the 1950s) of Atlantic salmon from Spain, based on variation at nine microsatellite loci. Each vertical bar represents one individual and each black square delimits a population corresponding to a river. The graphs above and below the main graph represent the first hierarchical level (Evanno test, ΔK = 3), with brackets indicating the correspondence between the populations. Each cluster is represented by one colour: red, green, or blue.
Fishes 08 00321 g004
Figure 5. Graphical representation of migration estimates using BAYESASS in archival samples (the 1950s) of Atlantic salmon from Spain. The circle size for each population is proportional to the adjusted effective size (Ne(adj)). Coloured rectangles correspond to the 1st-level STRUCTURE clusters. Values over 0.1 are represented as thick black arrows (proportional to migration values) and shown above or below them. Values between 0.02 and 0.1 are shown as dashed arrows.
Fishes 08 00321 g005
Table 1. Genetic diversity indices in archival samples (the 1950s) of Atlantic salmon from Spain: sample size (N), observed number of alleles (A), allelic richness (AR), expected (He) and observed heterozygosity (Ho), FIS values, and deviations from Hardy-Weinberg equilibrium (HWE). No deviation from HWE expectation was statistically significant after Bonferroni corrections.
River TotalLocus
Ssa197SSOSL85SSOSL311SSOSL417Sssp2210SsspG7SsaF43SSOSL438
NaviaN484848484848484847
A7.875891188964
AR7.1917.7068.1789.7567.0987.4588.4545.3873.489
Ho0.6230.7080.6250.6460.5630.7920.8130.4790.362
He0.6430.8080.6590.7170.6350.8060.7860.4120.317
FIS0.0400.1330.0620.110.1250.029−0.023−0.154−0.13
HWE0.0810.0470.2680.1320.1120.3910.4480.1150.209
NarceaN484848484848484848
A7.8751079991054
AR7.5159.4336.4548.9188.7018.8379.1164.7293.929
Ho0.6770.7290.7080.7080.6880.7920.8130.6040.375
He0.6870.80.6610.7660.7070.7880.7990.6320.34
FIS0.0240.099−0.0610.0860.0380.005−0.0060.054−0.092
HWE0.1920.0950.2920.1560.8480.5150.5380.3420.278
SellaN494949494949494949
A8.75121191091153
AR8.21711.72710.3048.4059.38.12110.1834.6933
Ho0.7220.7760.7760.7760.8370.8780.6940.5710.469
He0.7310.8530.8140.7580.7610.7940.7790.5440.545
FIS0.0230.1010.057−0.012−0.09−0.0950.119−0.0410.149
HWE0.1940.0610.2280.5410.1410.1110.0480.4160.149
Deva-CaresN464646464646464646
A8.510812129944
AR7.8119.8866.98810.74910.518.8657.7923.9883.706
Ho0.7450.8040.7170.9350.7390.8260.6740.7170.544
He0.6970.8440.6880.8220.7290.7620.6420.6040.488
FIS−0.0570.058−0.032−0.127−0.004−0.073−0.039−0.177−0.102
HWE0.0310.2130.4350.0290.5720.1950.4120.0630.283
NansaN484447484746484847
A710111166543
AR6.7029.74810.34710.3685.9845.5094.72442.937
Ho0.6780.8410.7450.8130.8090.5650.6460.7290.277
He0.6670.8660.770.8550.7150.5990.5840.6730.274
FIS−0.0060.0410.0430.06−0.120.067−0.096−0.0740.002
HWE0.4720.2970.310.2180.1050.2880.2380.2720.638
PasN474647474547474746
A6.125117865552
AR5.9610.6336.6157.7415.9984.9844.9694.7441.997
Ho0.5830.7830.6170.7660.7330.5320.5530.5960.087
He0.6190.8390.6940.8250.7450.6140.5640.5850.083
FIS0.0680.0780.1210.0820.0270.1440.03−0.007−0.034
HWE0.0170.140.1020.1540.4120.0890.4520.5551
AsónN484848484848484848
A7.625971079955
AR7.1918.3786.719.1166.7068.4178.6884.9284.587
Ho0.7030.7920.8130.6670.8540.6880.750.5210.542
He0.6830.7740.7240.7360.7080.7250.8150.4690.516
FIS−0.019−0.012−0.1120.104−0.1960.0620.09−0.101−0.04
HWE0.2890.5390.120.1310.0130.2970.1310.2250.441
BidasoaN403837403540404036
A8.7589121081175
AR8.677.9898.8911.845107.86110.9716.8614.944
Ho0.7160.8680.730.8250.7140.70.90.5750.417
He0.7280.790.7210.8730.7090.7870.8750.630.437
FIS0.029−0.0860.0020.0670.0080.123−0.0160.0990.061
HWE0.1380.1940.5740.1730.5560.0870.5410.1720.391
Table 2. Comparison of average allelic richness (AR), and expected heterozygosity (He), observed heterozygosity (Ho), and effective population size (Ne) between archival (the 1950s) and contemporary (the 1990s and 2000s) samples of Atlantic salmon from Spain.
RiverPeriodAv. ARAv. HeAv. HoAv. NeSources
Navia1950s7.190.6430.623667Present study
1990s----
Narcea1950s6.680.6170.607325Present study
1990s6.320.5360.487114[75]
Sella1950s8.220.7310.7221088Present study
1990s6.650.5320.487107[75]
Deva-Cares1950s7.810.6970.745729Present study
1990s5.970.6890.564-[18,19,75,76]
2000s4.680.6600.690-[19]
Nansa1950s6.700.6670.678197Present study
1990s5.340.7720.62068[18,19]
2000s4.880.6800.710-[19]
Pas1950s5.960.6190.583180Present study
1990s5.150.7690.650-[18,19]
2000s4.480.6700.670-[19]
Asón1950s7.190.6830.7031051Present study
1990s5.200.7730.65042[18,19]
2000s4.990.7000.740-[19]
Bidasoa1950s8.670.7280.716689Present study
2000s-0.8500.750-[77]
Table 3. Private alleles in archival samples (the 1950s) of Atlantic salmon from Spain after comparison with the SALSEA baseline. For each microsatellite locus, the first column indicates the allele and the second its frequency (in percentage) in the river. The number of private alleles in each river and locus (#) are also included.
River# Private
Alleles per River
Ssa197SSOSL85SSOSL311SSOSL417Sssp2210SSspG7SsaF43SSOSL438
Navia3--*2141.0%*1731.0%*2091.0%--------
Narcea1------*1851.0%--------
Sella5*1512.0%----*1591.0%--*1062.0%----
*1107.1%
*1381.0%
Deva-Cares6----*1231.1%*1892.2%*1583.3%----*1281.1%
*1711.1%*1991.1%----
Nansa1--*2163.2%------------
Pas1------------*1286.4%--
Asón3--*2041.0%*1271.0%--*1383.1%------
Bidasoa8----*1372.5%*1752.9%*1701.3%--*1121.3%*1421.4%
*1496.3%*1835.7%
*1633.8%
# Private alleles per locus13773322
Total alleles14151918131597
Table 4. Pairwise FST values in archival samples (the 1950s) of Atlantic salmon from Spain. All values were significant after the Bonferroni correction.
NaviaNarceaSellaDeva-CaresNansaPasAsón
Narcea0.019
Sella0.0540.039
Deva-Cares0.0590.0400.008
Nansa0.0640.0490.0490.035
Pas0.0850.0790.0980.0820.083
Asón0.0520.0480.0360.0440.0520.085
Bidasoa0.0330.0370.0430.0520.0710.0670.052
Table 5. BOTTLENECK tests of archival samples (the 1950s) of Atlantic salmon from Spain. The expected recent bottleneck is presented as p-values from Wilcoxon’s signed-rank test, assuming a two-phase mutation model (TPM) with 80% stepwise mutations (SMM). M-ratio and critical value of M (Mc) assuming pre-bottleneck effective population size (Ne) of 50, 100, 500, and 1000, and a mutation rate (µ) of 5 × 10⁻⁴.
RiverSMMM-ratioMc
Ne = 50Ne = 100Ne = 500Ne = 1000
Naviap = 0.9810.7710.7540.7440.7010.685
Narceap = 0.6800.7810.7540.7440.7010.685
Sellap = 0.4220.7770.7580.7460.7010.683
Deva-Caresp = 0.8750.7820.7560.7480.7030.680
Nansap = 0.2730.7610.7540.7440.7010.685
Pasp = 0.2730.8020.7580.7490.7030.799
Asónp = 0.8090.7760.7540.7440.7010.685
Bidasoap = 0.7270.7650.7560.7490.7000.677
Table 6. Estimates of the census size (Nc), the effective number of breeders (Nb, [CI 95%]), the adjusted number of breeders (Nb(adj)), the adjusted effective size (Ne(adj)), and the effective size ratios Nb(adj)/Nc, and Ne(adj)/Nc in archival samples (the 1950s) of Atlantic salmon from Spain. Populations in the Deva-Cares and Sella were pooled together after considering the 1st-level STRUCTURE clusters.
RiverNcMigrants RemovedNbNb(adj)Ne(adj)Nb(adj)/NcNe(adj)/Nc
[CI 95%][CI 95%][CI 95%]
Navia7011320 [162–∞]285 [145–∞]667 [338–∞]0.4070.951
Narcea12982156 [80–∞]139 [71–∞]325 [166–∞]0.1070.250
Deva-Cares + Sella223821167 [161–∞]1040 [144–∞]2431 [336–∞]0.4651.086
Nansa124095 [54–275]85 [48–245]197 [111–572]0.6811.592
Pas136186 [48–259]77 [43–230]180 [100–538]0.5661.323
Asón10512645 [197–∞]575 [175–∞]1344 [410–∞]0.5471.278
Bidasoa1021331 [83–∞]295 [74–∞]689 [173–∞]2.8906.753
Disclaimer/Publisher’s Note: The statements, opinions and data contained in all publications are solely those of the individual author(s) and contributor(s) and not of MDPI and/or the editor(s). MDPI and/or the editor(s) disclaim responsibility for any injury to people or property resulting from any ideas, methods, instructions or products referred to in the content.

