
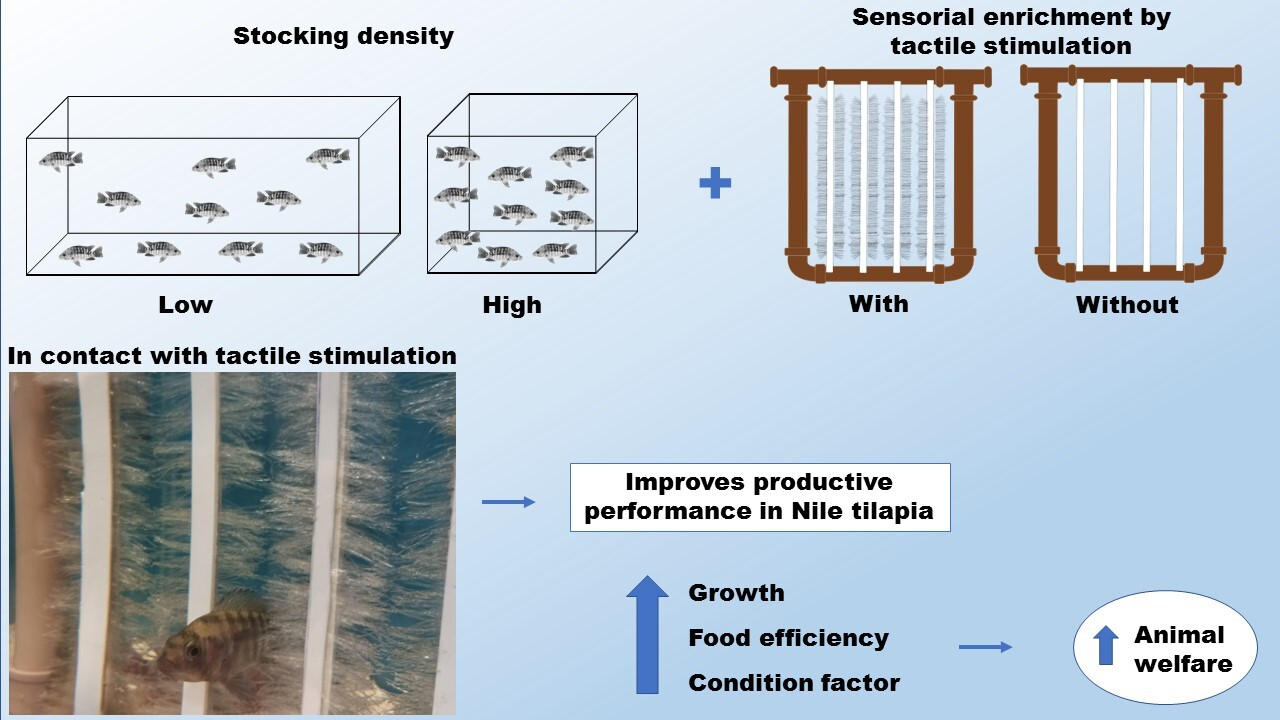
Body Tactile Stimulation Reduces the Effects of High Stocking Density on the Welfare of Nile Tilapia (Oreochromis niloticus)
 ,
,
Abstract

1. Introduction
2. Methods
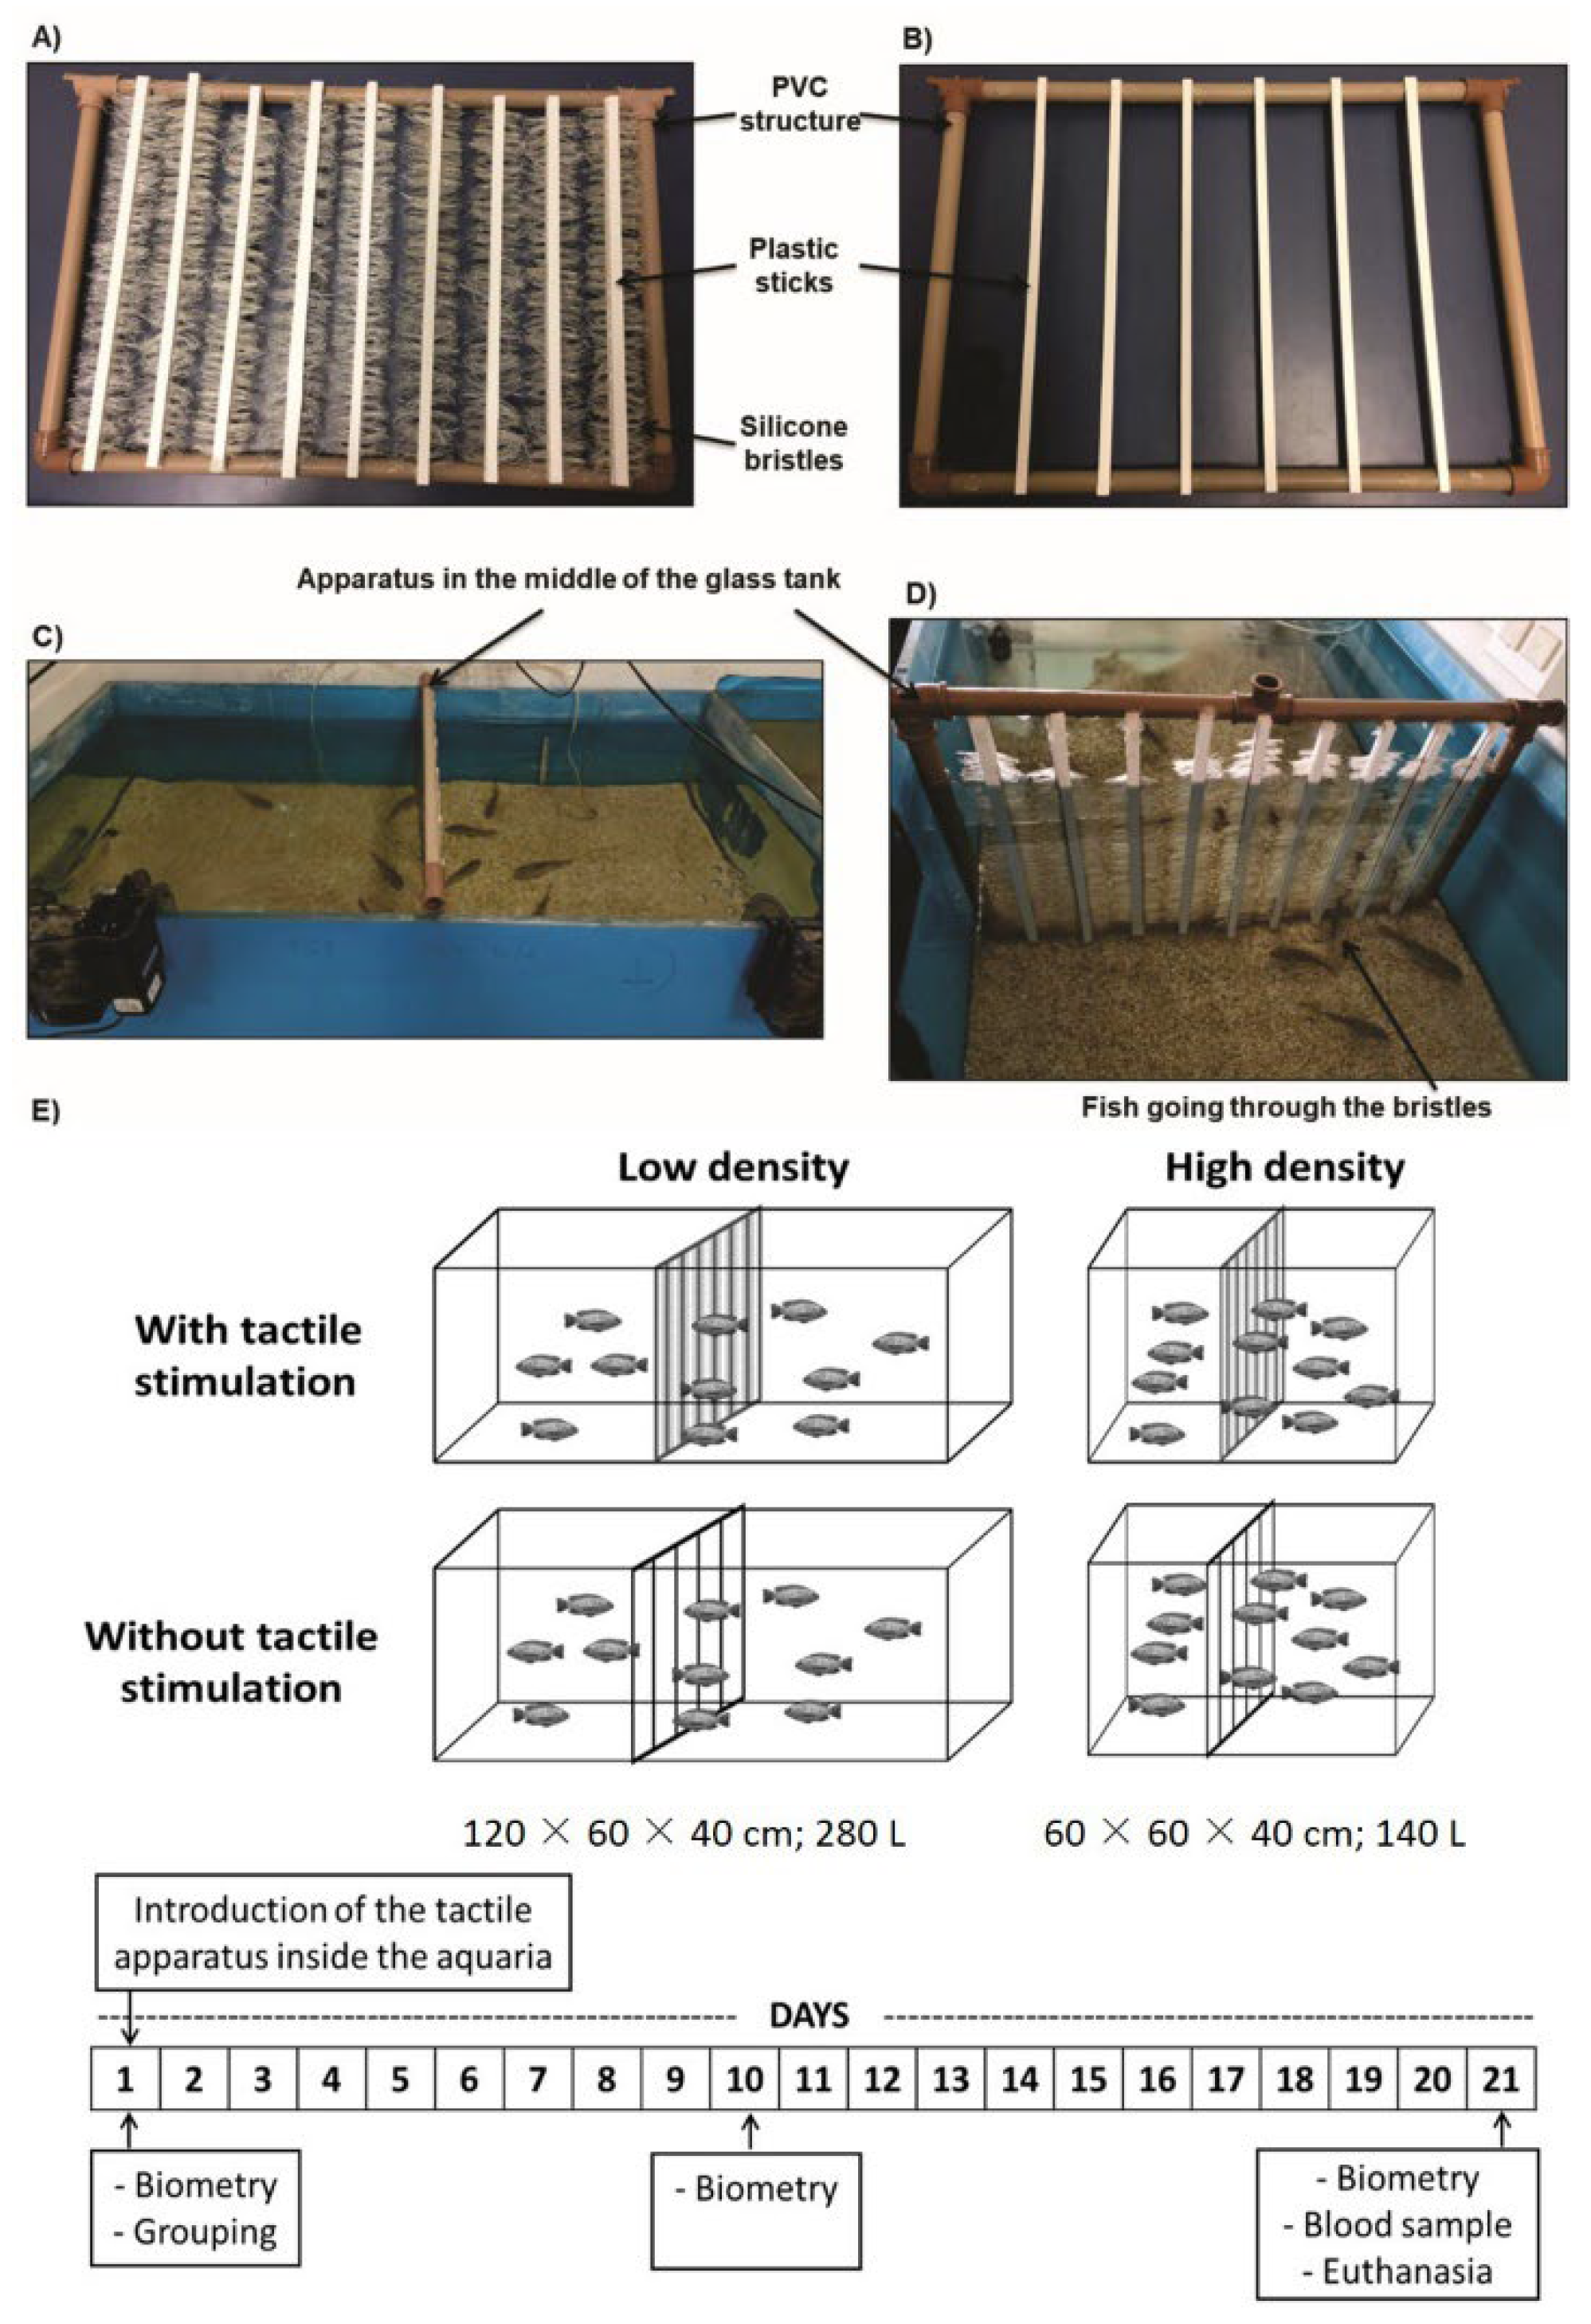
2.1. Fish Housing
2.2. Tactile Stimulation
2.3. Experimental Design
2.4. Feeding Procedures
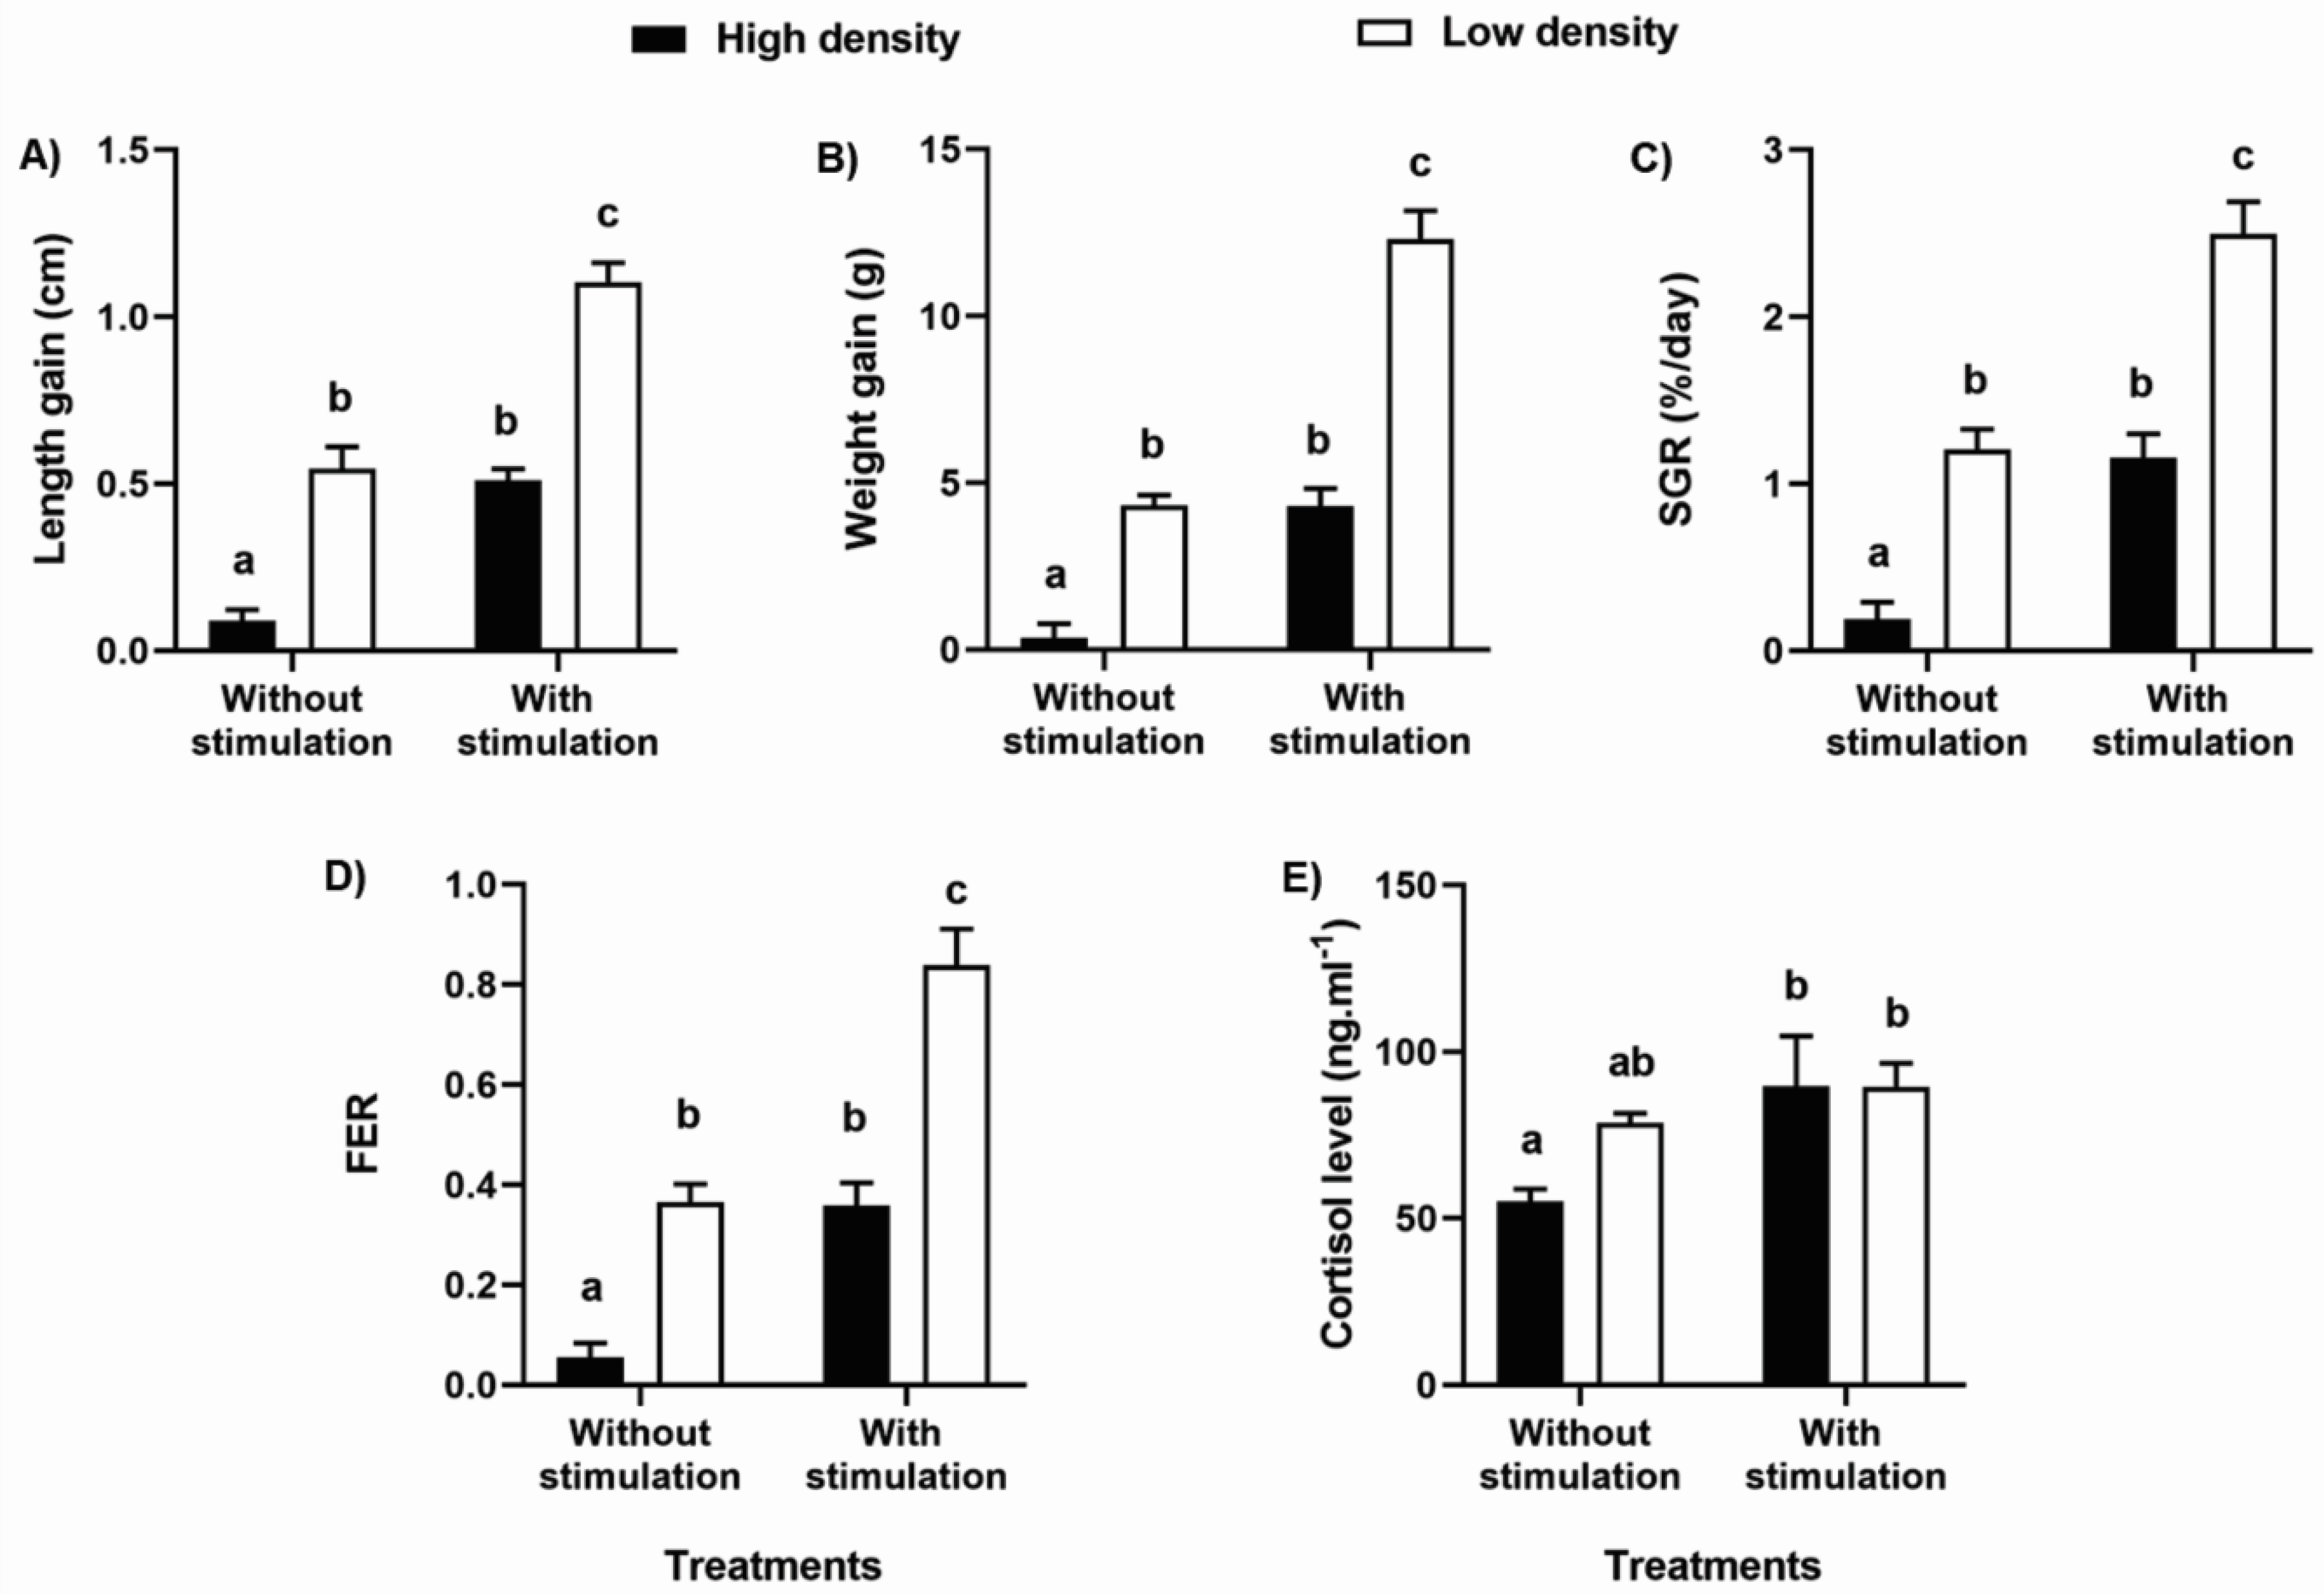
2.5. Productive Performance Parameters
- -
- Length gain = final standard length − initial standard length;
- -
- Weight gain = final weight − initial weight;
- -
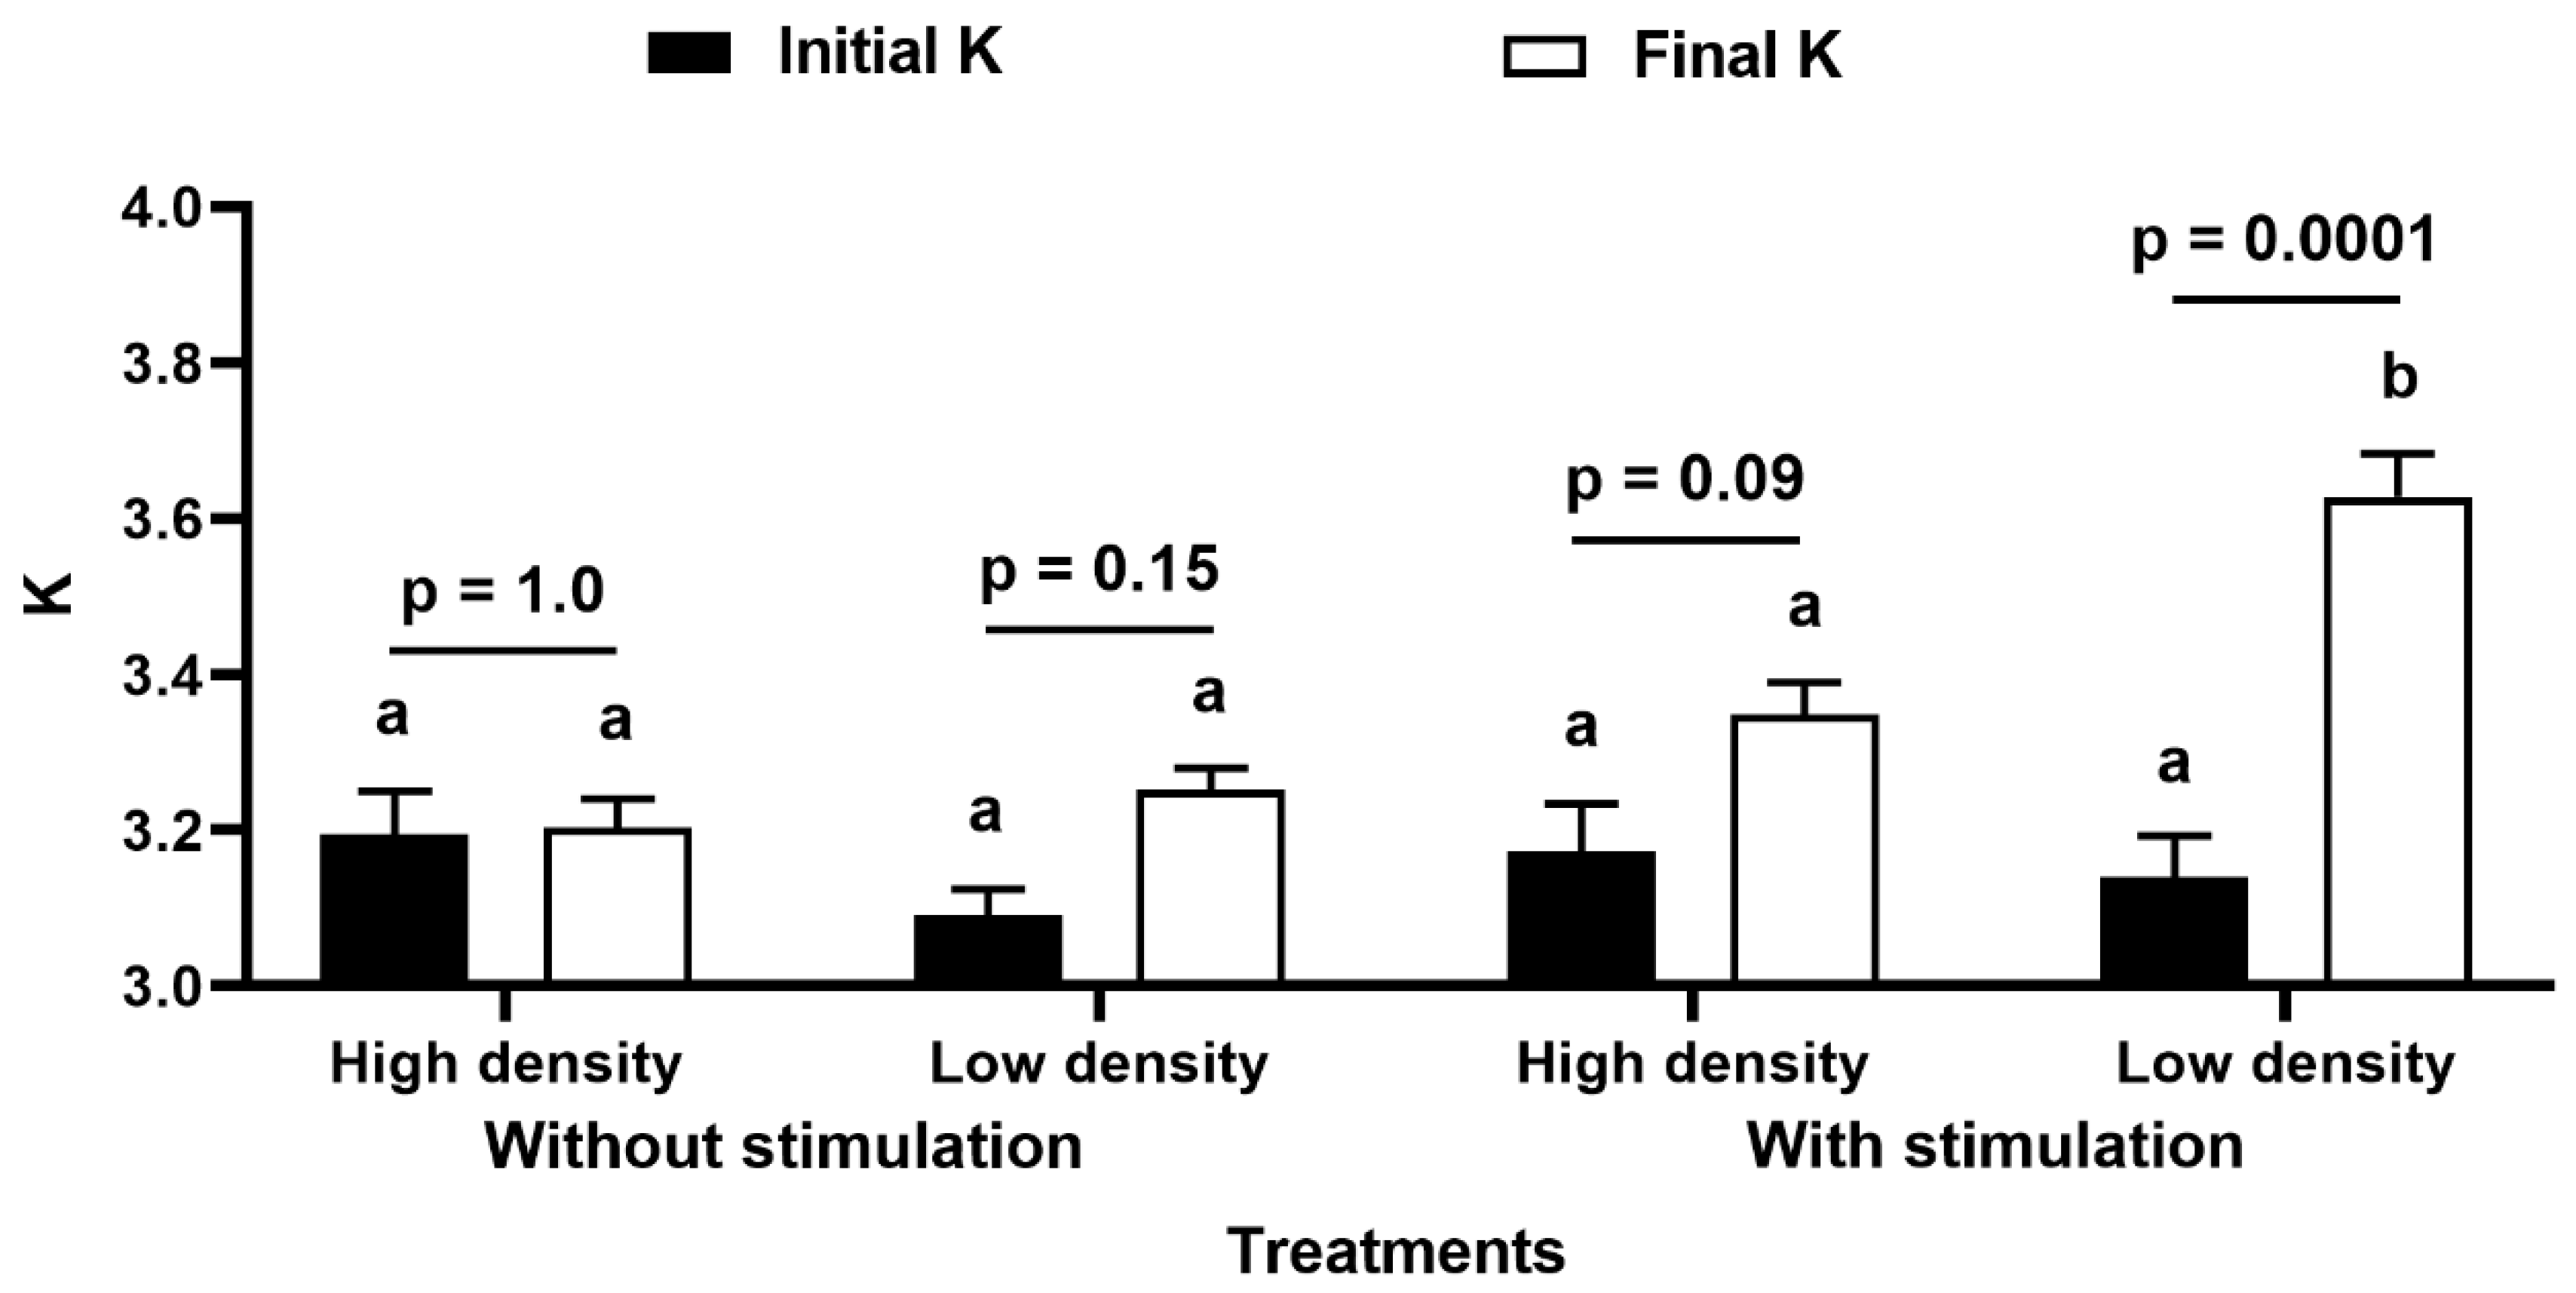
- Coefficient of size variation in the group = (standard deviation/mean) × 100;
- -
- Specific growth rate (SGR) = (ln final weight − ln initial weight/time) × 100;
- -
- Apparent feed efficiency ratio (FER) = weight gain/feed intake, which reflects the association between food consumed and weight gain [35]. As we could not evaluate individual food consumption, we estimated the FER as a proportion of weight gain and food received each day. We assumed that feed efficiency improves with increase in apparent FER [35];
- -
2.6. Blood Sampling and Cortisol Assay
2.7. Control of Abiotic Variables
2.8. Statistical Analysis
2.9. Ethical Note
3. Results
4. Discussion
5. Conclusions
Author Contributions
Funding
Institutional Review Board Statement
Informed Consent Statement
Data Availability Statement
Acknowledgments
Conflicts of Interest
References
- FAO. The State of World Fisheries and Aquaculture 2022: Towards Blue Transformation; Food and Agriculture Organization of the United Nations: Rome, Italy, 2022; p. 236. [Google Scholar] [CrossRef]
- Ellis, T.; Yildiz, H.Y.; López-Olmeda, J.; Spedicato, M.T.; Tort, L.; Øverli, Ø.; Martins, C.I.M. Cortisol and finfish welfare. Fish Physiol. Biochem. 2012, 38, 163–188. [Google Scholar] [CrossRef]
- Ashley, P.J. Fish welfare: Current issues in aquaculture. Appl. Anim. Behav. Sci. 2007, 104, 199–235. [Google Scholar] [CrossRef]
- Saraiva, J.L.; Arechavala-Lopez, P. Welfare of fish-no longer the elephant in the room. Fishes 2019, 4, 39. [Google Scholar] [CrossRef]
- Ellis, T.; North, B.; Scott, A.P.; Bromage, N.R.; Porter, M.; Gadd, D. The relationships between stocking density and welfare in farmed rainbow trout. J. Fish Biol. 2002, 61, 493–531. [Google Scholar] [CrossRef]
- Huntingford, F.A.; Kadri, S. Defining, assessing and promoting the welfare of farmed fish. Rev. Off. Int. Epizoot. 2014, 33, 233–244. [Google Scholar] [CrossRef]
- Saraiva, J.L.; Rachinas-Lopes, P.; Arechavala-Lopez, P. Finding the “golden stocking density”: A balance between fish welfare and farmers’ perspectives. Front. Vet. Sci. 2022, 9, 930221. [Google Scholar] [CrossRef]
- Gonçalves-de-Freitas, E.; Bolognesi, M.C.; Gauy, A.C.S.; Brandão, M.L.; Giaquinto, P.C.; Fernandes-Castilho, M. Social behavior and welfare in Nile tilapia. Fishes 2019, 4, 23. [Google Scholar] [CrossRef]
- Azaza, M.S.; Assad, A.; Maghrbi, W.; El-Cafsi, M. The effects of rearing density on growth, size heterogeneity and inter-individual variation of feed intake in monosex male Nile tilapia Oreochromis niloticus L. Animal 2013, 7, 1865–1874. [Google Scholar] [CrossRef] [PubMed][Green Version]
- Barcellos, L.J.G.; Nicolaiewsky, S.; De Souza, S.M.G.; Lulhier, F. The effects of stocking density and social interaction on acute stress response in Nile tilapia Oreochromis niloticus (L.) fingerlings. Aquac. Res. 1999, 30, 887–892. [Google Scholar] [CrossRef]
- Garcia, F.; Romera, D.M.; Gozi, K.S.; Onaka, E.M.; Fonseca, F.S.; Schalch, S.H.C.; Candeira, P.G.; Guerra, L.O.M.; Carmo, F.J.; Carneiro, D.J.; et al. Stocking density of Nile tilapia in cages placed in a hydroelectric reservoir. Aquaculture 2013, 410–411, 51–56. [Google Scholar] [CrossRef]
- Manduca, L.G.; Silva, M.A.; Alvarenga, E.R.; Alves, G.F.O.; Fernandes, A.F.A.; Assumpção, A.F.; Cardoso, C.C.; Sales, S.C.M.; Teixeira, E.A.; Silva, M.A.; et al. Effects of a zero exchange biofloc system on the growth performance and health of Nile tilapia at different stocking densities. Aquaculture 2020, 521, 735064. [Google Scholar] [CrossRef]
- Moniruzzaman, M.; Uddin, K.B.; Basak, S.; Mahmud, Y.; Zaher, M.; Bai, S.C. Effects of stocking density on growth, body composition, yield and economic returns of Monosex Tilapia (Oreochromis niloticus L.) under cage culture system in Kaptai Lake of Bangladesh. J. Aquac. Res. Dev. 2015, 6, 357–363. [Google Scholar] [CrossRef]
- Wu, F.; Wen, H.; Tian, J.; Jiang, M.; Liu, W.; Yang, C.; Yu, L.; Lu, X. Effect of stocking density on growth performance, serum biochemical parameters, and muscle texture properties of genetically improved farm tilapia, Oreochromis niloticus. Aquac. Int. 2018, 26, 1247–1259. [Google Scholar] [CrossRef]
- Jun, Q.; Hong, Y.; Hui, W.; Didlyn, K.M.; Jie, H.; Pao, X. Physiological responses and HSP70 mRNA expression in GIFT tilapia juveniles, Oreochromis niloticus under short-term crowding. Aquac. Res. 2013, 46, 335–345. [Google Scholar] [CrossRef]
- Qiang, J.; He, J.; Yang, H.; Xu, P.; Habte-Tsion, H.M.; Ma, X.Y.; Zhu, Z.X. The changes in cortisol and expression of immune genes of GIFT tilapia Oreochromis niloticus (L.) at different rearing densities under Streptococcus iniae infection. Aquac. Int. 2016, 24, 1365–1378. [Google Scholar] [CrossRef]
- Manduca, L.G.; Silva, M.A.; Alvarenga, E.R.; Alves, G.F.O.; Ferreira, N.H.; Teixeira, E.A.; Fernandes, A.F.A.; Silva, M.A.; Turra, E.M. Effects of different stocking densities on Nile tilapia performance and profitability of a biofloc system with a minimum water exchange. Aquaculture 2021, 530, 735814. [Google Scholar] [CrossRef]
- Näslund, J.; Johnsson, J.I. Environmental enrichment for fish in captive environments: Effects of physical structures and substrates. Fish Fish. 2016, 17, 1–30. [Google Scholar] [CrossRef]
- Arechavala-Lopez, P.; Cabreba-Álvarez, M.J.; Maia, C.M.; Saraiva, J.L. Environmental enrichment in fish aquaculture: A review of fundamental and practical aspects. Rev. Aquac. 2021, 14, 704–728. [Google Scholar] [CrossRef]
- Brandão, M.L.; Dorigão-Guimarães, F.; Bolognesi, M.C.; Gauy, A.C.S.; Pereira, A.V.S.; Vian, L.; Carvalho, T.B.; Gonçalves-de-Freitas, E. Understanding behaviour to improve the welfare of an ornamental fish. J. Fish Biol. 2021, 99, 726–739. [Google Scholar] [CrossRef]
- Field, T.; Hernandez-Reif, M.; Diego, M.; Schanberg, S.; Kuhn, C. Cortisol decreases and serotonin and dopamine increase following massage therapy. Int. J. Neurosci. 2005, 115, 1397–1413. [Google Scholar] [CrossRef]
- Tallet, C.; Sy, K.; Prunier, A.; Nowak, R.; Boissy, A.; Boivin, X. Behavioural and physiological reactions of piglets to gentle tactile interactions vary according to their previous experience with humans. Livest. Sci. 2014, 167, 331–341. [Google Scholar] [CrossRef]
- Wei, B.; Tai, F.; Liu, X.; Ma, L.; Yang, X.; Jia, R.; Zhang, X. Neonatal tactile stimulation alleviates the negative effects of neonatal isolation on novel object recognition, sociability and neuroendocrine levels in male adult mandarin voles (Microtus mandarinus). Physiol. Behav. 2013, 112–113, 14–22. [Google Scholar] [CrossRef]
- Soares, M.C.; Oliveira, R.F.; Ros, A.F.H.; Grutter, A.S.; Bshary, R. Tactile stimulation lowers stress in fish. Nat. Commun. 2011, 2, 534. [Google Scholar] [CrossRef]
- Bolognesi, M.C.; Gauy, A.C.S.; Gonçalves-de-Freitas, E. Tactile stimulation reduces aggressiveness but does not lower stress in a territorial fish. Sci. Rep. 2019, 9, 40. [Google Scholar] [CrossRef]
- Gauy, A.C.S.; Bolognesi, M.C.; Gonçalves-de-Freitas, E. Long-term body tactile stimulation reduces aggression and improves productive performance in Nile tilapia groups. Sci. Rep. 2022, 12, 20239. [Google Scholar] [CrossRef]
- Huntingford, F.; Kadri, S.; Jobling, M. Introduction: Aquaculture and behavior. In Aquaculture and Behavior; Huntingford, F., Jobling, M., Kadri, S., Eds.; Wiley-Blackwell: Oxford, UK, 2012; pp. 1–35. [Google Scholar]
- Fife-Cook, I.; Franks, B. Positive welfare for fishes: Rationale and areas for future study. Fishes 2019, 4, 31. [Google Scholar] [CrossRef]
- Gonçalves-de-Freitas, E.; Teresa, F.B.; Gomes, F.S.; Giaquinto, P.C. Effect of water renewal on dominance hierarchy of the Nile tilapia. Appl. Anim. Behav. Sci. 2008, 112, 187–195. [Google Scholar] [CrossRef]
- Gauy, A.C.S.; Boscolo, C.N.P.; Gonçalves-de-Freitas, E. Less water renewal reduces effects on social aggression of the cichlid Pterophyllum scalare. Appl. Anim. Behav. Sci. 2018, 198, 121–126. [Google Scholar] [CrossRef]
- Gauy, A.C.S.; Bolognesi, M.C.; Martins, G.D.; Gonçalves-de-Freitas, E. Preference and motivation tests for body tactile stimulation in fish. Animals 2021, 11, 2042. [Google Scholar] [CrossRef] [PubMed]
- Falsarella, L.N.; Brandão, M.L.; Gonçalves-de-Freitas, E. Fish adjust aggressive behavior to audience size with limited information on bystanders’ fighting ability. Behav. Process. 2017, 142, 116–118. [Google Scholar] [CrossRef]
- Maia, C.M.; Volpato, G.L. Environmental light color affects the stress response of Nile tilapia. Zoology 2013, 116, 64–66. [Google Scholar] [CrossRef]
- Mendonça, F.Z.; Volpato, G.L.; Costa-Ferreira, R.S.; Gonçalves-de-Freitas, E. Substratum choice for nesting in male Nile tilapia Oreochromis niloticus. J. Fish Biol. 2010, 77, 1439–1445. [Google Scholar] [CrossRef]
- De Verdal, H.; Komen, H.; Quillet, E.; Chatain, B.; Allal, F.; Benzie, J.A.H.; Vandeputte, M. Improving feed efficiency in fish using selective breeding: A review. Rev. Aquac. 2017, 10, 833–851. [Google Scholar] [CrossRef]
- Ighwela, K.A.; Ahmed, A.B.; Abol-Munafi, A.B. Condition factor as an indicator of growth and feeding intensity of Nile tilapia fingerlings (Oreochromis niloticus) feed on different levels of maltose. Am. Euras. J. Agric. Environ. Sci. 2011, 11, 559–563. [Google Scholar]
- Froese, R. Cube law, condition factor and weight–length relationships: History, meta-analysis and recommendations. J. Appl. Ichthyol. 2006, 22, 241–253. [Google Scholar] [CrossRef]
- Fulton, T.W. The rate of growth of fishes. In Twenty-Second Annual Report; Fisheries Board of Scotland: Edinburgh, UK, 1904; Volume 3, pp. 141–241. [Google Scholar]
- Flores-García, L.; Camargo-Castellanos, J.C.; Pascual-Jímenez, C.; Almazán-Rueda, P.; Monroy-López, J.F.; Albertos-Alpuche, P.J.; Martínez-Yáñez, R. Welfare Indicators in Tilapia: An Epidemiological Approach. Front. Vet. Sci. 2022, 9, 882567. [Google Scholar] [CrossRef]
- Huntingford, F.A.; Adams, C.; Braithwaite, V.A.; Kadri, S.; Pottinger, T.G.; Sandøe, P.; Turnbull, J.F. Current issues in fish welfare. J. Fish Biol. 2006, 68, 332–372. [Google Scholar] [CrossRef]
- Martins, C.I.M.; Galhardo, L.; Noble, C.; Damsgård, B.; Spedicato, M.T.; Zupa, W.; Beauchaud, M.; Kulczykowska, E.; Massabuau, J.C.; Carter, T.; et al. Behavioural indicators of welfare in farmed fish. Fish Physiol. Biochem. 2012, 38, 17–41. [Google Scholar] [CrossRef] [PubMed]
- Pottinger, T.G. The stress response in fish-mechanisms, effects and measurement. In Fish Welfare; Branson, E.J., Ed.; Blackwell Publishing Ltd.: Oxford, UK, 2008; pp. 32–48. [Google Scholar] [CrossRef]
- Boscolo, C.N.P.; Morais, R.N.; Gonçalves-de-Freitas, E. Same-sized fish groups increase aggressive interaction of sex-reversed males Nile tilapia GIFT strain. Appl. Anim. Behav. Sci. 2011, 135, 154–159. [Google Scholar] [CrossRef]
- Ha, R.R.; Ha, J.C. Integrative Statistics for the Social and Behavioral Sciences, 1st ed.; SAGE Publications Inc.: Thousand Oaks, CA, USA, 2011. [Google Scholar]
- Huntingford, F.A.; Turnbull, J.F.; Kadri, S. Methods to increase fish production: Welfare and sustainability implications. In Are We Pushing Animals to Their Biological Limits? Welfare and Ethical Implications; Grandin, T., Whiting, M., Eds.; CAB International: Wallingford, UK, 2018; pp. 89–121. [Google Scholar] [CrossRef]
- White, S.C.; Krebs, E.; Huysman, N.; Voorhees, J.M.; Barnes, M.E. Use of suspended plastic conduit arrays during brown trout and rainbow trout rearing in circular tanks. North Am. J. Aquac. 2019, 81, 101–106. [Google Scholar] [CrossRef]
- Arechavala-Lopez, P.; Diaz-Gil, C.; Saraiva, J.L.; Moranta, D.; Castanheira, M.F.; Nuñez-Velázquez, S.; Ledesma-Corvi, S.; Mora-Ruiz, M.R.; Grau, A. Effects of structural environmental enrichment on welfare of juvenile seabream (Sparus aurata). Aquac. Rep. 2019, 15, 100224. [Google Scholar] [CrossRef]
- Alvarenga, C.M.D.; Volpato, G.L. Agonistic profile and metabolism in alevins of the Nile tilapia. Physiol. Behav. 1995, 57, 75–80. [Google Scholar] [CrossRef] [PubMed]
- Fernandes, M.O.; Volpato, G.L. Heterogeneous growth in the Nile tilapia: Social stress and carbohydrate metabolism. Physiol. Behav. 1993, 54, 319–323. [Google Scholar] [CrossRef] [PubMed]
- Lepage, O.; Larson, E.T.; Mayer, I.; Winberg, S. Serotonin, but not melatonin, plays a role in shaping dominant-subordinate relationships and aggression in rainbow trout. Horm. Behav. 2005, 48, 233–242. [Google Scholar] [CrossRef]
- Vieira, B.R.M.; Guermandi, I.I.; Bellot, M.S.; Camargo-dos-Santos, B.; Favero-Neto, J.; Giaquinto, P.C. The effects of tryptophan supplementation on stress and aggression in Nile tilapia. J. Appl. Ichthyo. 2021, 37, 578–584. [Google Scholar] [CrossRef]
- Wendelaar Bonga, S.E. The stress response in fish. Physiol. Rev. 1997, 77, 591–625. [Google Scholar] [CrossRef]
- Winberg, S.; Höglund, E.; Øverli, Ø. Variation in the neuroendocrine stress response. In Biology of Stress in Fish; Schreck, C.B., Tort, L., Farrell, A.P., Brauner, C.J., Eds.; Elsevier Academic Press: London, UK, 2016; pp. 35–74. [Google Scholar] [CrossRef]
- Deane, E.E.; Woo, N.Y.S. Modulation of fish growth hormone levels by salinity, temperature, pollutants and aquaculture related stress: A review. Rev. Fish Biol. Fish. 2009, 19, 97–120. [Google Scholar] [CrossRef]
- Kajimura, S.; Hirano, T.; Visitacion, N.; Moriyama, S.; Aida, K.; Grau, E.G. Dual mode of cortisol action on GH/IGF-I/IGF binding proteins in the tilapia, Oreochromis mossambicus. J. Endocrinol. 2003, 178, 91–99. [Google Scholar] [CrossRef]
- Sadoul, B.; Vijayan, M.M. Stress and growth. In Biology of Stress in Fish; Schreck, C.B., Tort, L., Farrell, A.P., Brauner, C.J., Eds.; Elsevier Academic Press: London, UK, 2016; pp. 167–205. [Google Scholar] [CrossRef]
- Freitas, D.; Antoniazzi, C.T.D.; Segat, H.J.; Metz, V.G.; Vey, L.T.; Barcelos, R.C.S.; Duarte, T.; Duarte, M.M.M.F.; Burger, M.E. Neonatal tactile stimulation decreases depression-like and anxiety-like behaviors and potentiates sertraline action in young rats. Int. J. Dev. Neurosci. 2015, 47, 192–197. [Google Scholar] [CrossRef]
- Rehn, T.; Handlin, L.; Uvnäs-Moberg, K.; Keeling, L.J. Dog’s endocrine and behavioural responses at reunion are affected by how the human initiates contact. Physiol. Behav. 2014, 124, 45–53. [Google Scholar] [CrossRef]
- Selye, H. Stress and the general adaptation syndrome. Br. Med. J. 1950, 1, 1383–1392. [Google Scholar] [CrossRef]
- Dey, M.M.; Eknath, A.E.; Sifa, L.; Hussain, M.G.; Thien, T.M.; Hao, N.V.; Aypa, S.; Pongthana, N. Performance and nature of genetically improved farmed tilapia: A bioeconomic analysis. Aquac. Econ. Manag. 2000, 4, 83–106. [Google Scholar] [CrossRef]
- Gupta, M.V.; Acosta, B.O. From drawing board to dining table: The success story of the GIFT project. Naga World Fish Cent. Q. 2004, 27, 4–14. Available online: https://hdl.handle.net/20.500.12348/2057 (accessed on 27 April 2023).
- Pottinger, T.G.; Moran, T.A.; Morgan, J.A.W. Primary and secondary indices of stress in the progeny of rainbow trout (Oncorhynchus mykiss) selected for high and low responsiveness to stress. J. Fish Biol. 1994, 44, 149–163. [Google Scholar] [CrossRef]
- Barcellos, L.J.G.; Nicolaiewsky, S.; De Souza, S.M.G.; Lulhier, F. Plasmatic levels of cortisol in the response to acute stress in Nile tilapia, Oreochromis niloticus (L.), previously exposed to chronic stress. Aquac. Res. 1999, 30, 437–444. [Google Scholar] [CrossRef]
- Salonius, K.; Iwama, G.K. Effects of early rearing environment on stress response, immune function, and disease resistance in juvenile Coho (Oncorhynchus kisutch) and Chinook Salmon (O. tshawytscha). Can. J. Fish. Aquat. Sci. 1993, 50, 759–766. [Google Scholar] [CrossRef]
- Corrêa, S.A.; Fernandes, M.O.; Iseki, K.K.; Negrão, J.A. Effect of the establishment of dominance relationships on cortisol and other metabolic parameters in Nile tilapia (Oreochromis niloticus). Braz. J. Med. Biol. Res. 2003, 36, 1725–1731. [Google Scholar] [CrossRef]
- Besson, M.; Aubin, J.; Komen, H.; Poelman, M.; Quillet, E.; Vandeputte, M.; Van Arendonk, J.A.M.; De Boer, I.J.M. Environmental impacts of genetic improvement of growth rate and feed conversion ratio in fish farming under rearing density and nitrogen output limitations. J. Clean. Prod. 2016, 116, 100–109. [Google Scholar] [CrossRef]
- Garcia, F.; Romera, D.M.; Sousa, N.S.; Paiva-Ramos, I.; Onaka, E.M. The potential of periphyton-based cage culture of Nile tilapia in a Brazilian reservoir. Aquaculture 2016, 464, 229–235. [Google Scholar] [CrossRef]
- Godfray, H.C.J.; Beddington, J.R.; Crute, I.R.; Haddad, L.; Lawrence, D.; Muir, J.F.; Toulmin, C. Food security: The challenge of feeding 9 billion people. Science 2010, 327, 812–818. [Google Scholar] [CrossRef]


| Parameters | without TS | with TS | ||
|---|---|---|---|---|
| High Density | Low Density | High Density | Low Density | |
| T (°C) | 27.57 ± 0.06 | 27.34 ± 0.09 | 27.32 ± 0.10 | 27.40 ± 0.09 |
| pH | 7.04 ± 0.03 | 7.05 ± 0.05 | 7.03 ± 0.05 | 7.07 ± 0.03 |
| DO (mg·L−1) | 8.29 ± 0.07 | 8.46 ± 0.07 | 8.47 ± 0.07 | 8.45 ± 0.12 |
| NH4+ (mg·L−1) | 0.12 ± 0.03 | 0.06 ± 0.02 | 0.17 ± 0.05 | 0.08 ± 0.03 |
| NO2− (mg·L−1) | 0.14 ± 0.03 | 0.07 ± 0.02 | 0.13 ± 0.03 | 0.08 ± 0.02 |
| Variables | without TS | with TS | F(1,36) Values | p Values | ||
|---|---|---|---|---|---|---|
| High Density | Low Density | High Density | Low Density | |||
| Initial SL (cm) | 8.07 ± 0.3 | 7.99 ± 0.26 | 8.02 ± 0.3 | 8.29 ± 0.35 | With vs. Without TS: 0.16 | 0.69 |
| High vs. Low density: 0.09 | 0.77 | |||||
| Interaction: 0.34 | 0.56 | |||||
| Final SL (cm) | 8.16 ± 0.28 a | 8.53 ± 0.22 ab | 8.53 ± 0.30 ab | 9.39 ± 0.35 b | With vs. Without TS: 4.35 | 0.04 |
| High vs. Low density: 4.39 | 0.04 | |||||
| Interaction: 0.71 | 0.41 | |||||
| Initial W (g) | 17.78 ± 2.48 | 16.33 ± 1.72 | 17.25 ± 2.17 | 19.02 ± 2.54 | With vs. Without TS: 0.23 | 0.63 |
| High vs. Low density: 0.005 | 0.95 | |||||
| Interaction: 0.51 | 0.48 | |||||
| Final W (g) | 18.13 ± 2.12 a | 20.66 ± 1.72 a | 21.56 ± 2.32 a | 31.02 ± 3.25 b | With vs. Without TS: 8.12 | 0.007 |
| High vs. Low density: 6.13 | 0.02 | |||||
| Interaction: 2.04 | 0.16 | |||||
| CV initial SL (%) | 5.28 ± 0.81 | 4.87 ± 0.52 | 5.04 ± 0.78 | 3.93 ± 0.38 | With vs. Without TS: 0.82 | 0.37 |
| High vs. Low density: 1.35 | 0.25 | |||||
| Interaction: 0.30 | 0.59 | |||||
| CV final SL (%) | 6.69 ± 0.82 | 6.14 ± 0.45 | 7.90 ± 0.82 | 5.45 ± 0.45 | With vs. Without TS: 0.15 | 0.70 |
| High vs. Low density: 5.07 | 0.03 | |||||
| Interaction: 2.05 | 0.16 | |||||
| CV initial W (%) | 18.11 ± 2.28 | 16.98 ± 1.85 | 17.48 ± 2.56 | 14.11 ±1.49 | With vs. Without TS: 0.70 | 0.41 |
| High vs. Low density: 1.17 | 0.29 | |||||
| Interaction: 0.29 | 0.59 | |||||
| CV final W (%) | 21.56 ± 2.54 | 18.75 ± 1.66 | 24.93 ± 2.57 | 17.87 ± 1.54 | With vs. Without TS: 0.34 | 0.57 |
| High vs. Low density: 5.33 | 0.03 | |||||
| Interaction: 0.99 | 0.33 | |||||
| Variables | F(1,36) Values | p Values |
|---|---|---|
| Length gain | With vs. Without TS: 97.03 | <0.0001 |
| High vs. Low density: 110.94 | <0.0001 | |
| Interaction: 1.89 | 0.18 | |
| Weight gain | With vs. Without TS: 109.65 | <0.0001 |
| High vs. Low density: 110.59 | <0.0001 | |
| Interaction: 11.27 | 0.002 | |
| SGR FER | With vs. Without TS: 62.45 | <0.0001 |
| High vs. Low density: 68.03 | <0.0001 | |
| Interaction: 1.26 | 0.27 | |
| With vs. Without TS: 64.40 | <0.0001 | |
| High vs. Low density: 66.67 | <0.0001 | |
| Interaction: 3.07 | 0.08 | |
| Cortisol level | With vs. Without TS: 7.18 | 0.01 |
| High vs. Low density: 1.85 | 0.18 | |
| Interaction: 1.94 | 0.17 |
Disclaimer/Publisher’s Note: The statements, opinions and data contained in all publications are solely those of the individual author(s) and contributor(s) and not of MDPI and/or the editor(s). MDPI and/or the editor(s) disclaim responsibility for any injury to people or property resulting from any ideas, methods, instructions or products referred to in the content. |
© 2023 by the authors. Licensee MDPI, Basel, Switzerland. This article is an open access article distributed under the terms and conditions of the Creative Commons Attribution (CC BY) license (https://creativecommons.org/licenses/by/4.0/).
Share and Cite
Gauy, A.C.d.S.; Bolognesi, M.C.; Gonçalves-de-Freitas, E. Body Tactile Stimulation Reduces the Effects of High Stocking Density on the Welfare of Nile Tilapia (Oreochromis niloticus). Fishes 2023, 8, 320. https://doi.org/10.3390/fishes8060320
Gauy ACdS, Bolognesi MC, Gonçalves-de-Freitas E. Body Tactile Stimulation Reduces the Effects of High Stocking Density on the Welfare of Nile Tilapia (Oreochromis niloticus). Fishes. 2023; 8(6):320. https://doi.org/10.3390/fishes8060320
Chicago/Turabian StyleGauy, Ana Carolina dos Santos, Marcela Cesar Bolognesi, and Eliane Gonçalves-de-Freitas. 2023. "Body Tactile Stimulation Reduces the Effects of High Stocking Density on the Welfare of Nile Tilapia (Oreochromis niloticus)" Fishes 8, no. 6: 320. https://doi.org/10.3390/fishes8060320
APA StyleGauy, A. C. d. S., Bolognesi, M. C., & Gonçalves-de-Freitas, E. (2023). Body Tactile Stimulation Reduces the Effects of High Stocking Density on the Welfare of Nile Tilapia (Oreochromis niloticus). Fishes, 8(6), 320. https://doi.org/10.3390/fishes8060320