Review

Non-Linear Analyses of Fish Behaviours in Response to Aquatic Environmental Pollutants—A Review

by
Harkaitz Eguiraun
1,2,* and
Iciar Martinez
2,3,4
1
Department of Graphic Design & Engineering Projects, Faculty of Engineering in Bilbao, University of the Basque Country UPV/EHU, 48013 Bilbao, Spain
2
Research Center for Experimental Marine Biology and Biotechnology—Plentziako itsas Estazioa (PiE), University of the Basque Country (UPV/EHU), 48620 Plentzia, Spain
3
Department of Zoology and Animal Cell Biology, Faculty of Science and Technology, University of the Basque Country (UPV/EHU), 48940 Leioa, Spain
4
IKERBASQUE, Basque Foundation for Science, 48009 Bilbao, Spain
*
Author to whom correspondence should be addressed.
Fishes 2023, 8(6), 311; https://doi.org/10.3390/fishes8060311
Submission received: 11 May 2023 / Revised: 5 June 2023 / Accepted: 9 June 2023 / Published: 12 June 2023
(This article belongs to the Special Issue Trace Elements, Drugs, Small Compounds and Antioxidants in Fish)

Abstract

:
Analysis of fish behaviour is an effective way to indirectly identify the presence of environmental pollutants that negatively affect fish life, its production and quality. Monitoring individual and collective behaviours produces large amounts of non-linear data that require tailor-suited computational methods to interpret and manage the information. Fractal dimension (FD) and entropy are two groups of such non-linear analysing methods that serve as indicators of the complexity (FD) and predictability (entropy) of the behaviours. Since behavioural complexity and predictability may be modulated by contaminants, the changes in its FD and entropy values have a clear potential to be embedded in a biological early warning system (BEWS), which may be particularly useful in Precision Fish Farming settings and to monitor wild populations. This work presents a review of the effects of a wide range of environmental contaminants, including toxic compounds, cleaning and disinfecting agents, stimulant (caffeine), anaesthetics and antibiotics, heavy metals (lead, cupper, and mercury), selenium, pesticides and persistent environmental pollutants, on the FD and entropy values of collective and individual behavioural responses of different fish species. All the revised studies demonstrate the usefulness of both FD and entropy to indicate the presence of pollutants and underline the need to consider early changes in the trend of the evolution of their values prior to them becoming significantly different from the control values, i.e., while it is still possible to identify the contaminant and preserve the health and integrity of the fish.
Key Contribution: This paper is a review of recent scientific publications assessing the non-linear analyses of fish behavioural responses to environmental pollutants. All the works indicate the value of fractal dimension and entropy analyses of different types of behavioural responses to detect changes induced by contaminants, underlining the need to consider early changes in the trend of evolution of their values prior to them becoming significantly different from the control values, i.e., before the fish has suffered significant damage.

1. Introduction

An estimated 811 million people are hunger stricken and about 3000 million cannot afford healthy diets [1]. Given the fact that human population is expected to grow from the current 7700 million people to 9700 million by 2050 (United Nations World Population Prospects https://population.un.org/wpp/, accessed on 11 May 2023), the need to sustainably increase food production has become imperative. Seafood (fresh- and seawater organisms, animals and algae) is considered to be a key player to ensure the current and future sustainable supply of healthy and nutritious food [1]. Presently, seafood provides about 17% of worldwide animal protein, but in Asia and some African countries this value is over 50% [1]. Additionally, and given the fragile condition of many wild fish stocks and commercial capture fisheries, most of the seafood supply is expected to come from aquaculture production [1].
However, the aquaculture industry faces serious challenges, such as the unpredictability of production and the need to ensure the health and welfare of the fish [2]. Many of these challenges are caused by climate change [3]; emergent diseases; the overuse of antibiotics and consequent increase in antibiotic resistant pathogens [4]; and the increase in the amount and variety of human drugs, chemical and biological aquatic pollutants (i.e., see [5]), including the worldwide presence of micro and nano-plastics with their associated contaminant load [6,7,8], and the challenges in obtaining raw materials for feed manufacture [9]. In addition, pandemics and wars are adversely affecting the stability of the entire production system.
In response to these challenges, European policy [10] and fish farming industries [9] focused their efforts on favouring resilient and green production systems. A recently published report of the European Innovation Council identifying emerging technologies [11] explicitly lists Environmental Intelligence and Monitoring Systems as relevant areas where innovation is required, and one targeted key area for urgent innovations comprises Early Warning Tools and Precision Farming. The aquaculture industry needs to be resilient according to the definition of the term used in the EC Strategic Foresight Report [12]. Paradoxically, a strong industry needs to be able to forecast the quantity and quality of its production, i.e., it must maintain a production system as predictable and stable as possible. In other words, as close as possible to “an equilibrium condition of steady state or stable oscillation” as defined by Holling [13], and we must keep in mind that production optimization and predictability may not be compatible with fishes’ biological resilience to unexpected challenges.

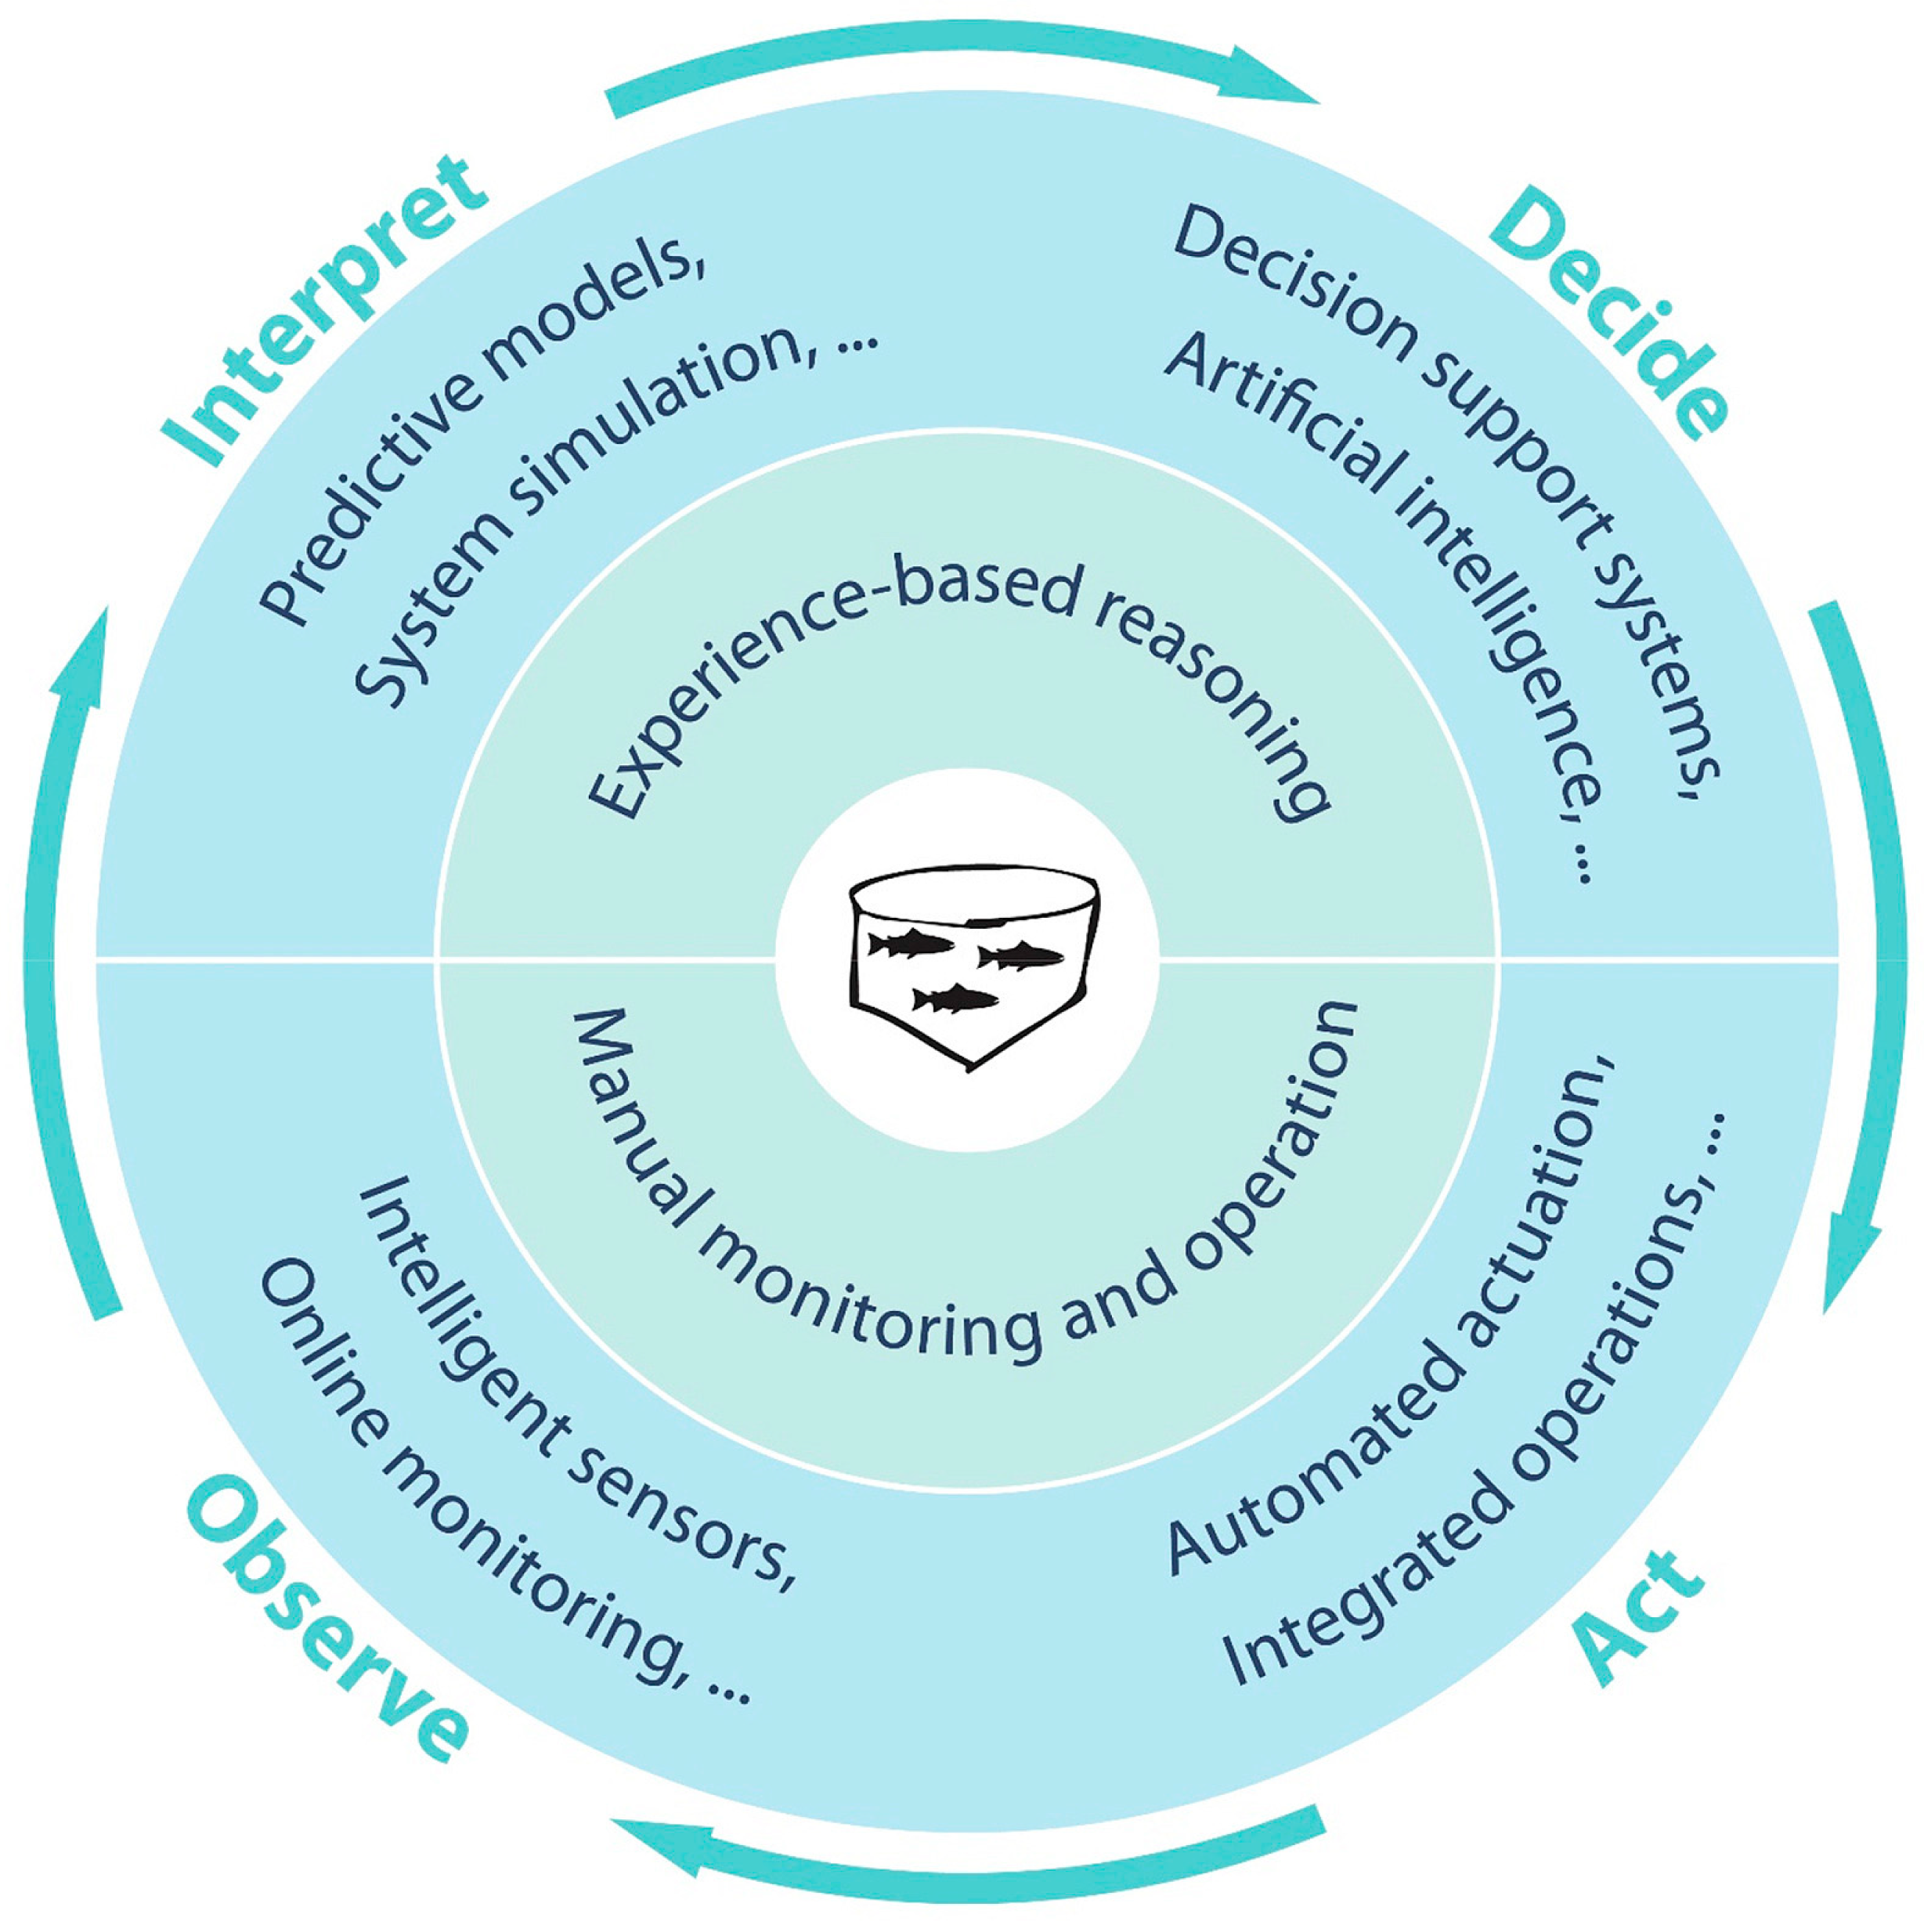
1.1. Precision Fish Farming

The need for increased and controlled fish production led Føre et al. [14] to introduce the concept of Precision Fish Farming (PFF, also referred to as Intelligent Aquaculture) whose aim is “to apply control-engineering principles to fish production, thereby improving the farmer’s ability to monitor, control and document biological processes in fish farms” [14]. Intensive fish farming includes all life stages: from the production of eggs to the market size fish. The hatchery phase takes place indoors under completely controlled conditions. The subsequent ongrowing can take place in recirculating aquaculture systems (RAS) or in outdoor ponds or cages that must be enlarged to accommodate the increasing biomass as the fish grows. Rearing in outdoor cages is the preferred method for seawater species, where the fish is subject to natural fluctuations of environmental variables and, as mentioned above, to the increasing amount and variety of pollutants that act as stressors and may negatively influence their health and welfare resulting in a poorer quality product [14]. Føre et al. [14] conceptualized PFF as consisting of several cyclical operational processes performed in four phases as depicted in Figure 1 (taken from their paper and reproduced with their permission): phase (1) is observation and phase (2) is interpretation of the fishes’ responses that result in the basis for phase (3), that is, decision making, upon which actions are implemented in phase 4. A similar conceptual framework has been successfully applied to other product manufacturing industries (see references in [14].
Currently, most practices in fish farming operations are performed manually, but a competitive industry and particularly PFF require online, fast and accurate methods to monitor fish behaviour and farming operations, such as biomass monitoring and management of critical operations including feeding, crowding, presence of parasites (see review by [14]), and assessment of fish health and welfare (see reviews [15,16]).
Both Føre et al. [14] and Li et al. [17] present a summary of sensors and monitoring methods commonly used in the aquaculture industry and research (Table 1). Roughly, they can be divided into those based on the analysis of sounds/acoustics [18,19], some of which produce images (i.e., [20]) and the more common methods based on the analysis of video images. Both the sensors themselves and their deployment may influence fish behaviour; for example, acoustic telemetry requires the invasive process of tagging a certain number of fish [19,21], the sonar may influence the fishes’ hearing [22], and the use of recording instruments handled by human or robots have been shown to influence their behaviour [23,24].
Fixed sensors (fixed cameras and passive hydroacoustic sensing) interfere least with the behaviour of the fish. However, the former can only record the fish in a certain region and the latter requires the development of large databases containing specific acoustics fingerprints for each relevant parameter (species, sex, type of behaviour, etc.) as well as the possibility of separately analysing the targeted and the background sounds. Although such databases are already being constructed (i.e., https://fishsounds.net/index.js; https://web.uri.edu/gso/research/fish-sounds/, both accessed on 11 May 2023), the approach is still far away from being practically implemented to monitor fishes.
The leap from the human-based observation, interpretation and operation of the system based on the experience of the fish farmer to the automatic monitoring and control of the facilities, requires the handling and automatic interpretation of the large amount of data for which machine learning, artificial intelligence algorithms and decision support systems are applied (see reviews by [17,25,26,27,28,29]). Computer vision models obtained through the application of intelligent methods have been used to study individual and collective fish behaviour [28,30] and for the detection of pain [31], stress responses [17] and unusual/abnormal behaviours in fish schools [17,27,30,32].

1.2. Contaminants as Stressors Influencing Fish Behaviour

The welfare of the farmed fish is central to all current aquaculture practices [33,34] including PFF. Korte et al. [35] proposed to consider fish welfare based on allostasis (achieving stability through change) rather than the more classical homeostasis [36] which involves mechanisms to keep key physiological variables (such as blood O2 and heart rate) within a narrow optimal range of values. Some well-known parameters that determine optimal allostasis, health and welfare, and for which there are sophisticated sensors, monitoring and control systems commercially available, include oxygen and nitrogen/NH4+ concentrations, temperature, type of feed and feeding rate and time [14,28,37]. Optimal welfare implies that the animals are kept under conditions as close as possible to what is normal for them, even though that is very rarely the case [35]. Too high and too low allostatic loads cause loss of welfare and may even results in death. The study and identification of what normal behaviour of each farmed species is, as well as their optimal housing conditions, are still in its infancy, in large part, due to the difficulty of studying the different species in their natural environments. Regarding stress and stressors, we will follow the definitions proposed by Wendelaar Bonga [38] in which “stress is a condition in which the dynamic equilibrium of an animal is threatened or disturbed as a result of the action of intrinsic and/or extrinsic stimuli”, and stressors are the extrinsic stimuli.
New methods are being developed for the fast screening of known drugs, pesticides, toxins, and microorganisms [39,40,41]. Unfortunately, there are still additional stressors that remain unknown and/or whose real effect is not easily measurable particularly when the net effect is the results of several interacting chemicals in the environment [42]. In the last case, changes in the aquatic organisms’ behaviour have been proposed to serve as Biological Early Warning Systems (BEWS), to monitor the presence of environmental contaminants in water resources [43,44,45] and fish production in aquaculture [14,46,47,48,49].
Heavy metals, pesticides, organic persistent contaminants and a whole range of human and veterinary medicinal and recreational drugs are found in increasing amounts in aquatic (particularly in freshwater) systems (see reviews by [50,51]). In 1983, Steele [52] revised the effects on fish behaviour of some waterborne pollutants (mostly pesticides) at concentrations orders of magnitude lower than those inducing morbidity and mortality and referred to previous works [53] proposing that pollutants affecting basic neurological functions would be particularly interesting, since they would most likely also influence the animal’s behaviour. Indeed, we have shown that the decrease in the Shannon entropy (SE, [54,55]) of the collective behaviour of the European seabass induced by the presence of the neurotoxicant methyl mercury (MeHg+) [49] and modulated by the presence of Se [42], was reflected in the biochemical changes in the antioxidant activities of their livers [56], and likely also by the metabolite profile of their brains (unpublished results using individuals from the experiment mentioned in [49] and shown in Figure 2, albeit not confirmed by subsequent studies). Social stresses have also been shown to modulate the individual and collective behaviours of fishes [46].
Additional reviews documented the effects of toxic agents [57,58] and medicinal drugs [44] on the behaviour of different fish species. Toxic substances altered locomotion, avoidance, escape, attraction and alarm reactions, reproductive and feeding behaviour, parental care and the behaviour of developing fish [57] and personality and cognition [58]. Others, such as antidepressants, antihistamines, beta-blockers, non-steroidal anti-inflammatory drugs and psychiatric, antiepileptic and anticholinesterasic drugs induced changes on boldness, aggression, activity, sociality, feeding rate and reproductive behaviour [44] in a species-specific manner. Notably, psychiatric drugs, antidepressants and antihistamines were found to induce behavioural changes at concentrations close to those found in aquatic systems (ng/L to µg/L) [44,58,59]. Changes induced in the individual locomotor activity (distance travelled, sinuosity and number of bursts) of the zebrafish larva by the toxicants cyanide, rodenticide, and organophosphate led Brodin et al. [44] to propose the use of a zebrafish-monitoring biological system for the risk assessment of drinking water. Suryanto et al. [59] have recently shown that 16 out of 20 different antibiotics tested induced changes on swimming, exploratory and/or locomotor behaviours of zebrafish that were reflected in the FD and permutation entropy values of some behavioural parameters keeping a relationship with the antibiotic’s toxicity.
Fish health is further affected when, along with the known environmental pollutants and drugs, we evaluate the negative effects of the micro- and nanoplastics, the toxic substances they contain and release, and their accumulation into the food webs [8,60,61]. Nanoplastic ingestion through the food web has been shown to damage the brain of fishes and induce diminished exploratory behaviour compared to controls [6].
Anthropogenic noise pollution is another source of stress for fishes that influences the physiology and behaviour of individuals, causing temporary or permanent hearing loss, stress and behavioural reactions to the noises [62] as well as changes in their shoaling behaviour [63], and references therein. In addition, noises made by predator species in the environment may also result in a stress response in both wild and farmed fish. The identification of stressful noises will require passive acoustic monitoring devices to identify, firstly, the normal noises produced by the monitored species as well as the noises causing the stress and, subsequently, the noises the fish produce in response to the stressors.

1.3. Fractal Dimension (FD) and Entropy Properties in Biological Systems

Biological systems are complex systems with an inherent and variable dynamic made up of a large amount of information (signals) generated over time that contain stochastic and deterministic components [64]. Typically, the signals processed are video images or echo sounds produced by observing the animal, but classical observation approaches are not able to appraise the complexity of the systems, particularly in real life situations occurring in complex environments with potentially large backgrounds. The use of alternative techniques, which combine linear and non-linear approaches, and the application of mathematical models and novel algorithms, allow to capture more of the complexity innate to biological systems [65,66].
The FD of a system, which is usually not an integer number, is characteristic of fractal structures, i.e., those that show self-similarity [67]. Entropy, the other non-linear property, describes the degree of predictability/chaoticity of a system [54,55,68]. There are different measurements to estimate the FD and entropy (i.e., Rényi, Shannon, Kolmogorov entropy among others) values of a system.
The FD has a direct relationship with the complexity of the signal analysed (such as movement or sound) [69]. Fractal analysis has been successfully applied to signal processing in many scientific fields, including the recognition of patterns in human speech [70] and walk [71] and in fish swimming [72,73,74]. In 1996, Alados et al. [75] found that the FD of the exploratory behaviour of goats was lowered by stress. The authors explained these results based on the fact that, since stress generally increases energy consumption, it would also lead to a reduction in the FD (i.e., complexity) of their exploratory behaviour. In addition, the authors suggested in the same work [75] that most biological structures and behaviour patterns have evolved to allow the organism to explore its environment or to enhance its tolerance for internal and environmental changes; consequently, natural selection should have increased the complexity in social and behavioural structures, i.e., their FD, to maximum possible levels. Studying the collective behaviour of intelligent agents, Mann et al. [76] postulated the causal entropic principle, according to which agents in a group follow behavioural rules that maximize the entropy of the system. The causal entropic principle was found to be able to predict many social interactions in both human and animal groups. According to those works [75,76], optimally functional biological systems should maximize both their FD and entropy values, while stressors should diminish them.

1.4. Aim of the Work

It is not currently possible to know all the relevant parameters acting as stressors, including environmental pollutants, or how each one of them will, both individually and through their interactions, influence the status of a biological system (at any level of complexity, be it an individual fish, shoal, all fish in a cage or the entire production of farm) at any given time. Adequate monitoring of the fish system, measuring the relevant variables that will allow the farmer to take the correct decisions and acting in time to minimize the effects of the undesirable perturbances, are essential activities within PFF. It is in the cases when the stressor is either unknown or not regularly measured, when changes in non-linear properties of the system, such as its entropy and/or FD, find their optimal practical application.
A review of the effect of other stressors (including tagging/pain, number of fish, positive emotional contagion and fear/anxiety) on the entropy and FD values of individual and collective fish behaviours has been recently published by us [46] and will not be dealt with here. The purposes of this work are (i) to give an overview of recent works reporting the effects of relevant environmental contaminants on the FD and entropy on individual and collective behavioural responses of fish, and (ii) to indicate their potential applications to identify the presence of undesirable environmental contaminants in either fish farming settings or natural populations.

2. Materials and Methods

The Web of Science and Scopus databases were used for bibliographic searches. The Web of Science provided a much higher number of hits but most of them were not directly related to our targeted subject and the hits that were relevant were also identified in Scopus. The search strings and number of documents found (updated on the 28 April 2023) are listed in Table 2. After reviewing all the documents, we found only 18 dealing with the exact subject of our study, namely the effect on contaminants on the FD and/or entropy analyses of their individual and/or collective behaviours. A summary of the main data and results from the 18 selected publications, sorted according to the type of toxicants, is shown in Appendix A, Table A1. Table A2 of Appendix A shows the effects of contaminants on the tendencies of the FD and entropy values of individual and collective behavioural patterns.

3. Fractal Dimension and Entropy Analyses of Fish Behavioural Parameters

For a practical review on technical issues we recommend the review of [77]. These authors address the challenges encountered when performing 2D and 3D video behavioural tracking as well as the type of computational analyses (Fourier and wavelet transforms, fractal analysis and permutation entropy) and of machine learning techniques (multilayer perceptron, self-organizing map, hidden Markov model and deep learning) with clear potential to assist in the toxicological monitoring of water quality by BEWS.
In our opinion, the most complete work about the use of aquatic organisms (from bacteria, algae, bivalves and fish to multispecies systems) as BEWS for the continuously detection of pollutants in freshwater systems, is the review by Bae and Park [43]. The purpose of those works was to apply BEWS to effectively monitor drinking water, distribution systems and wastewater effluents in contaminated or restored sites worldwide; however, the same principles can be applied to monitoring the environmental conditions in aquaculture settings. For example, most aquatic organisms are sensitive to the presence of residual chlorine in chlorinated drinking water which may reduce their usefulness as BEWS for drinking water, which is usually chlorinated. However, this very sensitivity is an advantage to monitor the water in freshwater aquaculture, which must obviously be chlorine-free. Additionally, although BEWS are not effective to detect human pathogens, they will most likely detect the presence of fish pathogens and parasites, and therefore serve as a good BEWS to monitor fish welfare in fish production. Many of the works mentioned in the review rely on behavioural monitoring which has many advantages but also certain drawbacks since it is difficult to objectively quantify and interpret behavioural data. Such challenge arise due to the non-linearity of behaviours, variation in individual behaviour and the large amounts of data obtained by continuous monitoring. Accordingly, the work also reviews methods used for non-linear signal processing (e.g., permutation entropy, FD, Fourier transform and wavelet transformation) and for the interpretation of the data, including machine learning techniques, for different species. It must always be kept in mind that BEWS integrate the response to all the stressors/chemicals to which the organism is exposed and does not provide qualitative or quantitative information about each of the potentially present pollutants. Consequently, one must combine the implementation of BEWS with chemical monitoring to identify and quantify the potential toxicants. We do not intend to repeat the information of those reviews in this work and the reader is strongly encouraged to refer to them [43,77] for further information.
The potential use of BEWS based on fractal and entropy analysis of fish behavioural parameters has been successfully tested on highly toxic substances at lethal doses [78], common cleaning and disinfecting agents [79,80], stimulants, antibiotics and anaesthetics, [59,81,82], heavy metals [42,49,83,84,85,86,87] and persistent environmental pollutants and pesticides [87,88,89,90]. Most of the organisms on which they have been tested are freshwater model species, such as zebrafish and medaka, but some works use wild captured fish [82], other fish species relevant for aquaculture [42,49,80,85] and freshwater-farmed shrimps [87]. Thus, the selected studies comprehend all the most relevant types of environmental chemical pollutants and a relevant range of species (model fish, fresh and seawater species and species relevant for aquaculture).

3.1. Effects of Exposure to Toxic Compounds and to Cleaning and Disinfecting Agents

Assessment of the exposure of adult Japanese medaka (Oryzias latipes) to lethal doses of potassium cyanide (KCN 10 mg/mL) and phenol (25 mg/mL) in water was carried out by Fukuda et al. [78] measuring the 3D swimming speed and vertical position of the fish, as well as the uniformity of these two parameters estimated by their Shannon–Weaver entropy [55]. Exposure to both toxicants significantly increased the maximum swimming speed but also significantly decreased their median swimming speed. Interestingly, a decrease in the entropy of the vertical position of the fish took place just after 10–30 min exposure to both chemicals and prior to any mortality. Although there were large individual variations, as it is usual in biological systems, the decrease in SE of the system behaved as a useful indicator for the presence of the pollutants.
A potential BEWS for the detection of sublethal concentrations of sodium hypochlorite (NaClO, from 0.001 to 0.005%) in freshwater has been described by Nimkerdphol et al. [79]. These authors used the FD (estimated using a critical exponent method [91]) of the swimming trajectory of individual male zebrafish obtained using two video cameras via 3D coordinate computation with perspective correction (3DCCPC). The biological activity of zebrafish indeed displayed a fractal structure and responded to the presence of the disinfectant: the value of FD of swimming trajectories trended to increase with the pH and the values of the FD of swimming velocities trended to increase with its concentration. Although the pH value always increased as NaClO was added and the experiments were performed under controlled conditions, the pH value itself varied for a given NaClO concentration. This was attributed to possible reactions of the NaClO with water or other compounds, and it would explain why the pH and behavioural responses do not necessary correlate with the concentration of the pollutant. In addition, it may be reasonable to assume that the effects caused on the fish by the pH alone may be different from those caused by the NaClO alone, reflecting on the observed differences in the FD of the responses to the two parameters.
A commonly used detergent (sodium dodecyl benzene sulfonate, SDBS) also induced species-specific changes in the behaviour of three different freshwater species: zebrafish (Danio rerio), Japanese medaka (Oryzias latipes) and red carp (Cyprinus carpio) [80]. The changes affected their swimming trail and speed and their surface behaviour. In addition, the Shannon–Weaver entropy [55] of these parameters deviated from the “norm”. In the three species, the entropy decreased (i.e., their behaviour became less normal) with increasing concentrations of the detergent, but with different sensitivities: zebrafish was the most sensitive species, responding at the lowest concentration, followed by red carp and medaka, which was the most resistant.

3.2. Effects of Exposure to Stimulants, Anaesthetics and Antibiotics

Toxic substances have also been shown to influence the behaviour and responses of aquatic organisms. Ladu et al. [81] used transfer entropy to assess the response of caffeine-treated zebrafish to a replica shoal of zebrafish. The results showed that, while the transfer entropy was always higher from the replica to the alive fish (to be expected, given that the replica does not have the capacity to react to stimulus by itself), the difference was significant only when the fish had been exposed to at least 25–50 mg caffeine/mL and a smaller dose of 5 mg/mL did not elicit a response different from that of the control.
Kane et al. [82] developed a reproducible, reliable system, claimed to be capable of detecting consistent behavioural alterations over time caused by the exposure to sub-lethal doses of contaminants and other stressors. Their system was developed after studying the behaviour of groups of 12 mummichog killifish (Fundulus heteroclitus) by comparing the initial 30 min base-line recording of the fish groups prior to exposure to 60 mg/L of the commonly used aesthetic tricaine methanesulfonate (MS222), with the subsequent recordings of their behaviour during the 90 min post-exposure. The exposed fish displayed significant increases in percent movement, velocity, distance from centre, and relative burst frequency while its FD decreased significantly between the baseline and the subsequent time periods. Angular change and space utilization were not significantly affected. The authors claimed that with additional modifications (including longer recording times, physiological adaptation responses to contaminants and elimination of background noise), the system has the potential to produce quantifiable and automated recordings in real time, suitable to detect and quantify behavioural differences associated with exposure to additional environmental pollutants, including POPs, pesticides, agricultural waste, metals and harmful toxins.
Of high relevance, due to the current general abuse and misuse of antibiotics, is the work of Suryanto et al. [59], who examined the effect of exposure to 100 ppb of 20 commonly used antibiotics (amikacin, amoxicillin, azithromycin, cefuroxime, ciprofloxacin, doxycycline, erythromycin, gentamycin, norfloxacin, ofloxacin, oxytetracycline, penicillin G potassium salt, streptomycin, sulfamethoxazole, sulfamethazine, sulfapyridine, tetracycline, trimethoprim, tylosin, and vancomycin) on the locomotion complexity of golden zebrafish. From the three-dimensional (3D) video recording of the fish, their swimming movement and direction were analysed using idTracker [92] to identify swimming patterns and responses of the fish to the antibiotics. The FD and entropy of the swimming patterns and responses were calculated as described by Audira et al. [93]. The FD values from the amoxicillin-, penicillin- and tylosin- treated groups were significantly lower than those of the control group. The entropy was also significantly affected in some cases: amikacin, for example, significantly increased the entropy of the behaviour (i.e., induced high randomness in the motion), while oxytetracycline significantly decreased it (the fish moved little and was concentrated in a small area). Principal component analysis (PCA) and hierarchical clustering analysis of the FD and entropy measurements were applied to further examine the relationships between the effects of the antibiotics and revealed that three antibiotics from three different classes (amoxicillin, a lactam; trimethoprim, a sulphonamide; and tylosin, a macrolide) were clustered together and were clearly separated from the control group and the other antibiotics. These three antibiotics also had in common a much higher effect, noticeable even at 1 ppb. Of the 20 antibiotics tested, only azithromycin, cefuroxime, doxycycline and norfloxacin did not cause alterations in the fish’s behaviour at the tested 100 ppb. Thus, even at very small concentrations, most antibiotics may be able to trigger behavioural alterations useful to detect their presence.

3.3. Effects of Exposure to Heavy Metals

The reproductive behaviour of fish presents a long-range self-similar correlation, i.e., it can be considered fractal in nature. Alados et al. [83] showed that fathead minnows (Pimephales promelas) exposed to 0.5 ppm Pb exhibited higher levels of predictability (less complexity) in their reproductive behavioural sequences (i.e., lower FD) but only before secondary sexual characters were evident and not after they were sexually mature. This confirms the successful application of FD to identify the effects of environmental contaminants, but it also indicates that, in addition to the already shown species dependence of the response, the sexual maturity of the fish may be a relevant variable.
Ji et al. [94] analysed the individual and group (n = 4 fish) behavioural responses of medaka (speed, Y-position, stop number, stop duration, turning rate and meandering) as well as their FDs, upon exposure to a low concentration of Cu (1.0 mg/L). They also used the individual responses as training data for a multi-layer perceptron (MLP) artificial neural network (ANN) which revealed an increase in slow- and no-movement responses upon treatment, albeit with a high degree of individual differences. Similarly, the FD (Box counting method) of the responses calculated for individual specimens also decreased consistently after the exposure, although individual differences were still noticeable. The FD of the responses of groups was also significantly lower upon Cu exposure and interestingly, individual variability was larger than inter-group differences. Due to the different kind of information provided by the two methods (MLP and FD), the authors proposed to combine both in real-life situations: MLP analysis for detailed information on explicit response behaviour and FD analysis for a global and more consistent information on the status of the fish.
Eguiraun et al. [49] examined the potential of fractal (calculated according to Higuchi [95], Katz [96] and Katz–Castiglioni [97] and entropy (Shannon [54] and permutation entropy [98]) analyses of the trajectory of the shoal of fish in response to a stochastic event to serve as indicators of 4 μg/L MeHg+ contamination in the water. Katz–Castiglioni FD and particularly, the Shannon entropy (SE) were the most sensitive algorithms to discriminate the responses of the MeHg+-contaminated fish. The intoxicated fish displayed a Katz–Castiglioni FD value slightly higher than the control while the SE in the intoxicated fish and, to a much lower degree, its permutation entropy, were lower than the control group. To perform this experiment, the water of the tanks was not renewed daily, which may have subjected the control fish to an additional degree of stress. This fact made interesting to assess the evolution of the SE during the recovery period after reinitiation of the water circulation [85]. During the 11 days post-exposure, the control group displayed a tendency to increase its SE value. These results can be considered an indication of the fish recuperating when the water flow was reinstated [85]. In contrast, the SE of the MeHg+-treated group did not show a recovery trend; it showed erratic responses with daily fluctuations and lacked a tendency to reach the initial SE values [85]. Exposure of European seabass to 10 μg/L Na2SeO3 only induced a minor decrease in the SE of the schooling response of the fish during a 6 days experimental period [84].
It has been repeatedly demonstrated that Selenium (Se) compounds counteract MeHg+ toxicity [99,100,101,102,103,104,105]. To test whether this protective effect of selenium would reflect on the SE of a MeHg+-treated fish system, Eguiraun et al. [42] fed European seabass different Se:Hg molar ratios and their results did indeed confirm the protective effect of selenium on Hg-induced toxicity. The SE evolution of the fish system showed a tendency to increase during a 14 days exposure to feeds containing molar Se:Hg ratios > 1 (29.6 and 6.6) and a tendency to decrease when exposed to Se:Hg molar ratios < 1 (0.8 and 0.4). It is particularly interesting to note that the results of these non-invasive non-linear measurements agree with those of hepatic biochemical parameters performed on the same fish [56] corroborating the SE tendencies of the fish systems: fish fed molar Se:Hg ratios < 1 grew less, had lower total DNTB- and thioredoxin-reductase (TrxR) activities and lower transcription levels of three redox genes (txn1, txnrd2 and txnrd3) in the liver, than those fed a diet with Se:Hg molar ratio > 1. The results of this study indicated a tendency, and the differences were not significant. The agreement in the trends between the non-linear parameters and the biochemical analysis before the results become significant, and thus significantly affect the health of the fish, confirms the value of the non-linear assessments as warning systems of negative events (toxicity in this case) affecting the fish in the early stages. It is important to stress that none of the results were statistically significant and most likely an external observer would have disregarded them for that reason concluding that the system was working fine. However, we do know that the fish was being intoxicated. Consequently, we wish to emphasize the relevance of considering the trends of evolution of the parameters earlier in their development rather than waiting until the values become statistically significant, when the harm may be irreparable.
The exposure of shoals of 5 zebrafish to a low-dose (50 µg/L) of mercuric chloride (HgCl2) for 24 h was optimally detected by the following school behavioural responses: the entropy of swimming speed, depth during each 3 min interval, and changes in the sum entropy of speed, depth, turning frequency, distance and dispersion [86]. The initial stress response included hyperactivity and aggregation and lasted about 15–20 min to slowly recover and reach pre-exposure levels. The entropy of the swimming speed and of turning, as well as the sum of entropy of five other parameters displayed the same trend: stable values over the unexposed period (albeit with differences between groups), sudden significant increase upon the addition of HgCl2, that lasted about 20 min, and then a fast decrease to low values. The swimming speed, an effective indicator of stress response, was positively correlated to the turning frequency. These phases were similar to those of the time-dependent stepwise behavioural response model proposed by [90] upon exposure of groups of three medaka to six doses of the pesticides (see below).
We have found only one work on the non-linear responses of crustaceans (freshwater shrimps Macrobrachium jelskii) to heavy metals [87]. None of the parameters used by Tenorio et al. [87] to examine their locomotor behaviour (detailed below, since the shrimps were also exposed to the pesticide delmethrin) was affected by a 96 h of exposure to a low concentration, 10 μg/L of HgCl2. However, the locomotor behaviour of the shrimps displayed a multifractal nature based on its generalized dimensions spectrum (Dq calculated according to [106]) for up to the first 4 h of exposure to HgCl2. The treated shrimps had the highest Dq value, significantly higher at 4 h with a subsequent decrease in its value.
It must be borne in mind that these results are not directly comparable to those of Eguiraun et al. [49] or of Huang et al. [86] mentioned above and in which exposure to MeHg+ did induce changes in the SE of the fish trajectory. The differences between the works can be attributed to the use of different concentrations and/or type of mercuric compounds with known different toxicity mechanisms [107] as well as to the use of different species.

3.4. Effects of Exposure to Pesticides and to Persistent Organic Environmental Pollutants

The above-mentioned work on shrimps exposed to HgCl2 [87] also studied their responses to low concentrations of the pesticide deltamethrin (0.15 μg/L). This contaminant did induce changes in the track length, speed and D2P as well as in the fractal (estimated via both box counting and information entropy methods) and multifractal (generalized dimensions spectrum [106]) dimension behaviours of the shrimps’ locomotion behaviour after a minimum exposure of 72 h. This exposure consistently reduced the FDs, counted via the box counting method, and the information entropy values with respect to the control and HgCl2 treated groups, matching the diminished spatial complexity in the locomotion of treated shrimps.
The effects of environmental pollutants on Japanese medaka were reported in two papers by Nakayama et al. [88,89]. In the first work [88], the authors studied the behaviour of pairs of male medaka fish fed tributyltin (TBT, 1 µg/g body weight (bw) per day) or polychlorinated biphenyls (PCBs, 1 µg/g bw per day, no specific compound is mentioned in the paper), or TBT+PCBs (1 µg/g bw of each chemical per day), or a pollutant-free diet (control) during 3 weeks. No mortality or apparent morphological alterations were observed during the exposure period. The general behaviour of the fish (resting, swimming in a straight line and swimming in circles) was assessed via a 2D Image Tracking Analyzer that traced the swimming trajectory of the medaka every 1/3 s and was used to estimate the mean swimming velocity and the position of the fish. From those data, the SE (i.e., the probability that a male was present in a certain area) was calculated to analyse positional dispersion patterns. After the 3 weeks exposure period, none of the toxicant-containing diets had a significant effect on the fishes’ swimming velocity, but PCBs frequently altered swimming behaviour to produce patterns suggestive of hyperactivity and TBT increased the entropy of the fish’s position. The higher entropy in the TBT-treated fish with respect to the controls indicated a loss of their preference for a given swimming area, i.e., an increase in the unpredictability of their position. Thus, both toxicants affect the general behaviour of mature male medaka but in different manners.
In their second work [89], the researchers also used Japanese medaka but they added PCB Kanechlor 400 to the feed at 3% of bw and up to 125 µg/g feed during 3 weeks. They studied several parameters of the collective behaviour of groups of three sexually immature fish as well as the FD of the trajectory of the groups (to characterize its straightness) and the FDs of swimming velocity and turning angle (to quantify the time-series variation). Fish exposed to the PCB displayed altered schooling behaviour, including a shortened schooling time and also increased (i) the frequency of change of the behavioural patterns in the school, (ii) the disintegration of schools and (iii) the frequency of collision between individuals. These results confirm the authors’ previous suggestion [88] of hyperactivity induced by PCBs. The FDs of the swimming trajectory and turning angle increased significantly but only in the group exposed to the highest concentration of the PCB. Analysis of the schooling behaviour in groups (n = 6) made up by mixing three treated fish and three control fish revealed that Kanechlor 400-exposed medaka influenced the behaviour of the unexposed fish in the same school [89]. This result is particularly interesting and resembles those of Burbano Lombana et al. [108] who showed, using transfer entropy analysis, the directional behavioural contagion (positive emotional contagion) elicited by Citalopram-treated zebrafish onto non-treated conspecifics in the same group.

4. General Discussion

Direct comparison of the results from the reviewed works is not straightforward due to not only the differences in the species, size/age, sexual maturity and sex of the animals used but also due to the experimental set-ups. As summarized in Table A2, some works measured the behaviours of fish individually placed in tanks, others the individual behaviours of fish in groups (usually of only two or three individuals) and some measured the collective behaviours of groups of fish with also a variable number of individuals (from three to eighty-seven). In addition, the response of the fish to the stressors and contaminants must surely be influenced by the personality traits of the individuals themselves [109,110,111,112,113,114,115]. Therefore, experiments on the individual responses of fish, particularly when performed also on individually housed fish must be interpreted with care. The personality of the individuals must surely also influence the response of the group. In fact, the only work studying both individual behaviour in groups and the behaviour of the group demonstrated that the responses of the group displayed less variability that those of individuals [94]. Moreover, based on the results by Eguiraun et al. [48], most of the fish in these published works were probably subjected to the additional stressor of either being alone or in small groups, regardless of their individual personalities. Thus, for BEWS implementation, the use of collective behaviour of groups of fish should probably be selected among those behaviours that rely more heavily on the presence of the contaminant and less on the individual character of each fish. This is particularly important for most farmed fish species, which are gregarious in nature and cultivated in large schools.
The only case when a contaminant did not change the value of a parameter was the Katz FD of MeHg+-treated seabass, but that was due to an issue with the Katz algorithm. A problem with that algorithm had previously been reported and it was eliminated when the Castiglioni’s correction was implemented [42]. Another important issue in the usefulness of FD or entropy parameters is the relevance of exclusively considering statistically significant differences. Obviously, significant differences between contaminated and non-contaminated fish indicate a stronger effect of the contaminant on the fish system, but the lack of statistical significance, particularly when a clear trend is showing up, must not be discarded. Moreover, it can be considered as a really early warning system when it starts to change and measures the incipient fish responses [42,56,88,89]. Waiting until a difference becomes significant may imply allowing the system to go over values where it may be unable to recuperate swiftly, or not be able to go back to desirable levels at all. In addition, we hypothesize that behavioural changes chemically induced on a subgroup but reflecting on the entire group (demonstrated by the emotional/behavioural contagion induced by fish whose behaviour has been changed upon exposure to chemical substances, such as Kanechlor 400 [89] and Citalopram [108]), and reflected by control, unexposed fish) will likely be less evident (i.e., changes in the FD or entropy values of the system would be smaller) than those of a group in which all the fish had been contaminated, further underlining the need to consider early changes in the trends of evolution of non-linear behavioural parameters values.
When using changes in the FD or entropy values of behavioural fish response parameters upon exposure to contaminants, what is more important than whether their values increase or decrease (which will depend on the type of response, physiological/behavioural response) is the fact that they do change, i.e., an indication of an abnormality being introduced in the system. Indeed, the response of fish systems to the simultaneous exposure to more than one stressor is neither synergistic nor linear, but complex and non-linear [42,48,53,88]. In addition, the use of FD or entropy to identify particular contaminants is not recommended, as has been previously stressed [42,43]. Thus, alterations in FD or entropy must never be considered as indicators of a given contaminant, but only of the fact that something unexpected is affecting the fish. It is then when the farmer should first halt the harvesting of those fish (which may be contaminated, for example) and initiate a process to identify the stressor, which in addition to the chemical ones addressed by this work, may also be social or physical in nature as shown in [46].

5. Conclusions and Perspectives

Taking all the above considerations into account, we conclude that probably both FD and entropy parameters applied to the collective animal behaviour will serve best to implement BEWS to detect abnormalities, including the presence of contaminants, particularly in fish farms following an intelligent aquaculture/PFF approach for on-line monitoring and control of the production. On the other hand, there are a few algorithms to compute the FD and the entropy of systems. The particular FD or entropy algorithm which is optimal for a given practical application must be tested and selected for that particular set up. Furthermore, in our opinion, more than one technique should be implemented, given the unexpected nature of the contaminants and that the response of a given system may vary according to the contaminant. Finally, the most difficult part (particularly from a technical point of view) to implement this kind of BEWS is to achieve a good, reliable signal (from either video images, or echo sounds of RIFs) to be further processed. Once the signal is good and reliable, the application of one or several algorithms on the same signal should be easier to implement. Consequently, it should be possible to obtain a wealth of valuable information from the same raw data with marginal extra input in computing cost.
We believe the implementation of non-linear methods of monitoring to control fish farming is already being used in the present and that further interesting developments will take place in the near future. We are also of the opinion that for farm control purposes, the monitoring of the collective behaviour will be more useful than the monitoring of individuals, even if they are in the shoal. This is because, as mentioned, the individual character will modulate the individual response while the farmer is probably more interested in obtaining information about the status of the entire production than about the status of the selected tag-carrying fish. As indicated above, the most challenging part of the work is to obtain a clear, reliable signal, i.e., the raw data of the collective behaviours of the fishes. A substantial amount of effort needs to be put towards this activity as a first step to continue with the monitoring and interpretation of the SE and entropy data.

Author Contributions

Conceptualization, H.E. and I.M.; methodology, H.E. and I.M.; formal analysis of information, H.E. and I.M.; writing of the original draft preparation, subsequent revisions and editing, H.E. and I.M. Funding acquisition and project administration, H.E. and I.M. All authors have read and agreed to the published version of the manuscript.

Funding

The work was supported by the Spanish Ministerio de Economía y Competitividad MINECO (Grant RTC-2014–2837-2 “SELATUN: Minimización de la problemática del mercurio del atún y valorización del atún como alimento saludable, Programa Retos-Colaboración 2014”. The funding source had no involvement in the preparation of this manuscript. I. Martinez is supported by IKERBASQUE (Basque Foundation for Science).

Institutional Review Board Statement

Not applicable.

Informed Consent Statement

Not applicable.

Data Availability Statement

All the works cited are either public, open access or available upon request from the authors.

Acknowledgments

We wish to express our gratitude to Martin Føre (Department of Engineering Cybernetics, Norwegian University of Science and Technology-NTN; 7491-Trondheim, Norway) for allowing us to reproduce their work in Figure 1 and information complied in Table 1 of our study, and to Daniel Padro (Molecular Imaging Unit, CICBiomaGUNE, Parque Científico y Tecnológico de Gipuzkoa; 20014-Donostia/San Sebastián Gipuzkoa Spain) for performing HR 1HNMR of the European seabass brain extracts.

Conflicts of Interest

The authors declare no conflict of interest. The funders had no role in the design of the study; in the collection, analyses, or interpretation of data; in the writing of the manuscript; or in the decision to publish the results.

Appendix A

Table A1. Summary of the main findings of the 18 publications studying the application of fractal dimension and entropy-based methods to the fishes’ behavioural responses with potential to serve as BEWS in aquaculture. FD, fractal dimension; SE, Shannon entropy.
ReferenceSpeciesMethodSubject of the StudyMain Findings
Review Papers
[43]Review paper. Bacteria, algae, Daphnia, bivalves, fish and multispecies systems.The methodology followed to perform the review is not stated.Review of behavioural monitoring and computational methods as potential BEWSs to monitor drinking water. Continuous detection of many pollutants for effective water quality monitoring and management. The authors review several computational and mathematical methods that have been widely used to study the structural characteristics of behavioural changes. The methods include algorithms for signal processing (e.g., permutation entropy, fractal dimension, Fourier transform and wavelet transformation) and for interpretation, i.e., machine learning (e.g., multilayer perceptron, self-organizing map, and hidden Markov model).
[77]Review paper. Addresses examples with many different species. The methodology followed to perform the review is not stated.BEWS—Review paper of the technical issues involved in 2D and 3D video tracking of fish and the computational analyses (Fourier and wavelet transforms, fractal analysis and permutation entropy) and of machine learning techniques (multilayer perceptron, self-organizing map, hidden Markov model and deep learning) with clear potential to detect abnormal behavioural patterns and toxicological monitoring.Video tracking methods need to be improved for reliable, real-life toxicity monitoring. All the computational and machine learning analyses considered have shown acceptable results to detect abnormal behaviours induced by toxic substances.
Toxic compounds, cleaning and disinfecting agents
[78]Japanese medaka
(Oryzias latipes)
Three-dimensional (3D) video recording of the fish and calculation of their speed, vertical position in the test chamber and the Shannon–Weaver entropy [55] of both parameters.Testing the entropy of swimming behavioural parameters of individual adult fish for the early detection of lethal doses of cyanide (KCN 10 mg/mL) and phenol (25 mg/mL) in water.There were large individual differences. A significant decrease in the entropy of vertical position of the fish was noted after 10–30 min exposure to the toxicants and prior to any mortality.
[79]Zebrafish (Danio rerio)FD of the swimming trajectory of individual fish in a tank via 3D coordinate computation with perspective correction (3DCCPC), carried out using two video cameras.Individual male behavioural responses of zebrafish to different sublethal concentrations of sodium hypochlorite.The FD of the swimming trajectories trended to increase with increasing pH (i.e., increasing sodium hypochlorite concentration).
[80]Zebrafish (D. rerio), Japanese medaka (Oryzias latipes) and red carp (Cyprinus carpio).Quantification of swimming behavioural changes induced upon exposure to a common detergent (sodium dodecyl benzene sulfonate, SDBS) by three parameters: swimming trail, swimming speed, surface behaviour and their uniformity assessed by their Shannon–Weaver entropy.Assessment of the uniformity of individual fish swimming behavioural responses to different concentrations of SDBS.The entropy of the three species decreased (i.e., their behaviour became less “normal”) with increasing concentrations of the detergent, but with different sensitivities: zebrafish was the most sensitive species, responding at the lowest concentration, followed by red carp and medaka, which was the most resistant.
Stimulants, anaesthetics and antibiotics
[81]Zebrafish (D. rerio)The interaction between the fish and a replica by transfer entropy.Effect of caffeine on the interaction between individual zebrafish and a replica of a shoal of conspecifics.The transfer entropy was always higher from the replica to the fish but only in fish exposed to at least 25–50 mg caffeine/mL the difference was significant.
[82]Mummichog killifish (Fundulus heteroclitus)Velocity, total distance travelled, angular change, percent movement, space utilization, and path complexity (FD).In-tank modelling of alterations in individual fish behaviour exposed to contaminants and stresses of the system, namely a reference toxicant (tricane methanesulfonae (m-aminobenzoic acid ethyl ester methansulfonate, MS222)Development of a remotely controlled transportable system to detect sublethal stress- and contaminant-induced behaviour in fish.
[59]Golden zebrafish (D. rerio)3D video recording, idTracking the trajectories and analysis of swimming, exploratory behaviour, fractal dimension and permutation entropy of the behavioural data, and PCA and hierarchical clustering of the FD and entropy data.Analysis of the effects on the behaviour of fish in shoals of seven adult and mixed-gender fish after exposure to 20 antibiotics from eight classes.Only azithromycin, cefuroxime, doxycycline and norfloxacin did not cause alterations in the fish behaviour at the tested 100 ppb. All other antibiotics did cause changes in behaviour. Amoxicillin, trimethoprim, and tylosin caused alterations even at 1ppb.
Heavy metals (Pb, Cu, Hg) and selenium (Se)
[83]Fathead minnows (Pimephales promelas)Video recording their behaviour, calculating four individual specific reproductive behaviours and their fractal dimension.Effect of the exposure of immature male–female pairs to sub-lethal concentrations of Pb on their individual specific reproductive behaviour. Exposure induces less complexity (lower FD) in the fishes’ behavioural sequences, but only prior to secondary sexual characters being evident.
[94]Medaka
(O. latipes)
Video recording of individual and group (n = 4) responses (speed, Y-position, stop number, stop duration, turning rate and meandering) their multi-layer perception and FD. and their upon exposure to Cu 1 mg/L.Effect of the exposure to sub-lethal concentrations of Cu on individual (MLP and FD) and collective (FD) behavioural parameters to assess their usefulness to detect the contaminant.Exposure induces less complex behaviour and significantly decreases the FD in both groups and individual behaviours but the response is more consistent when analysing groups of fish.
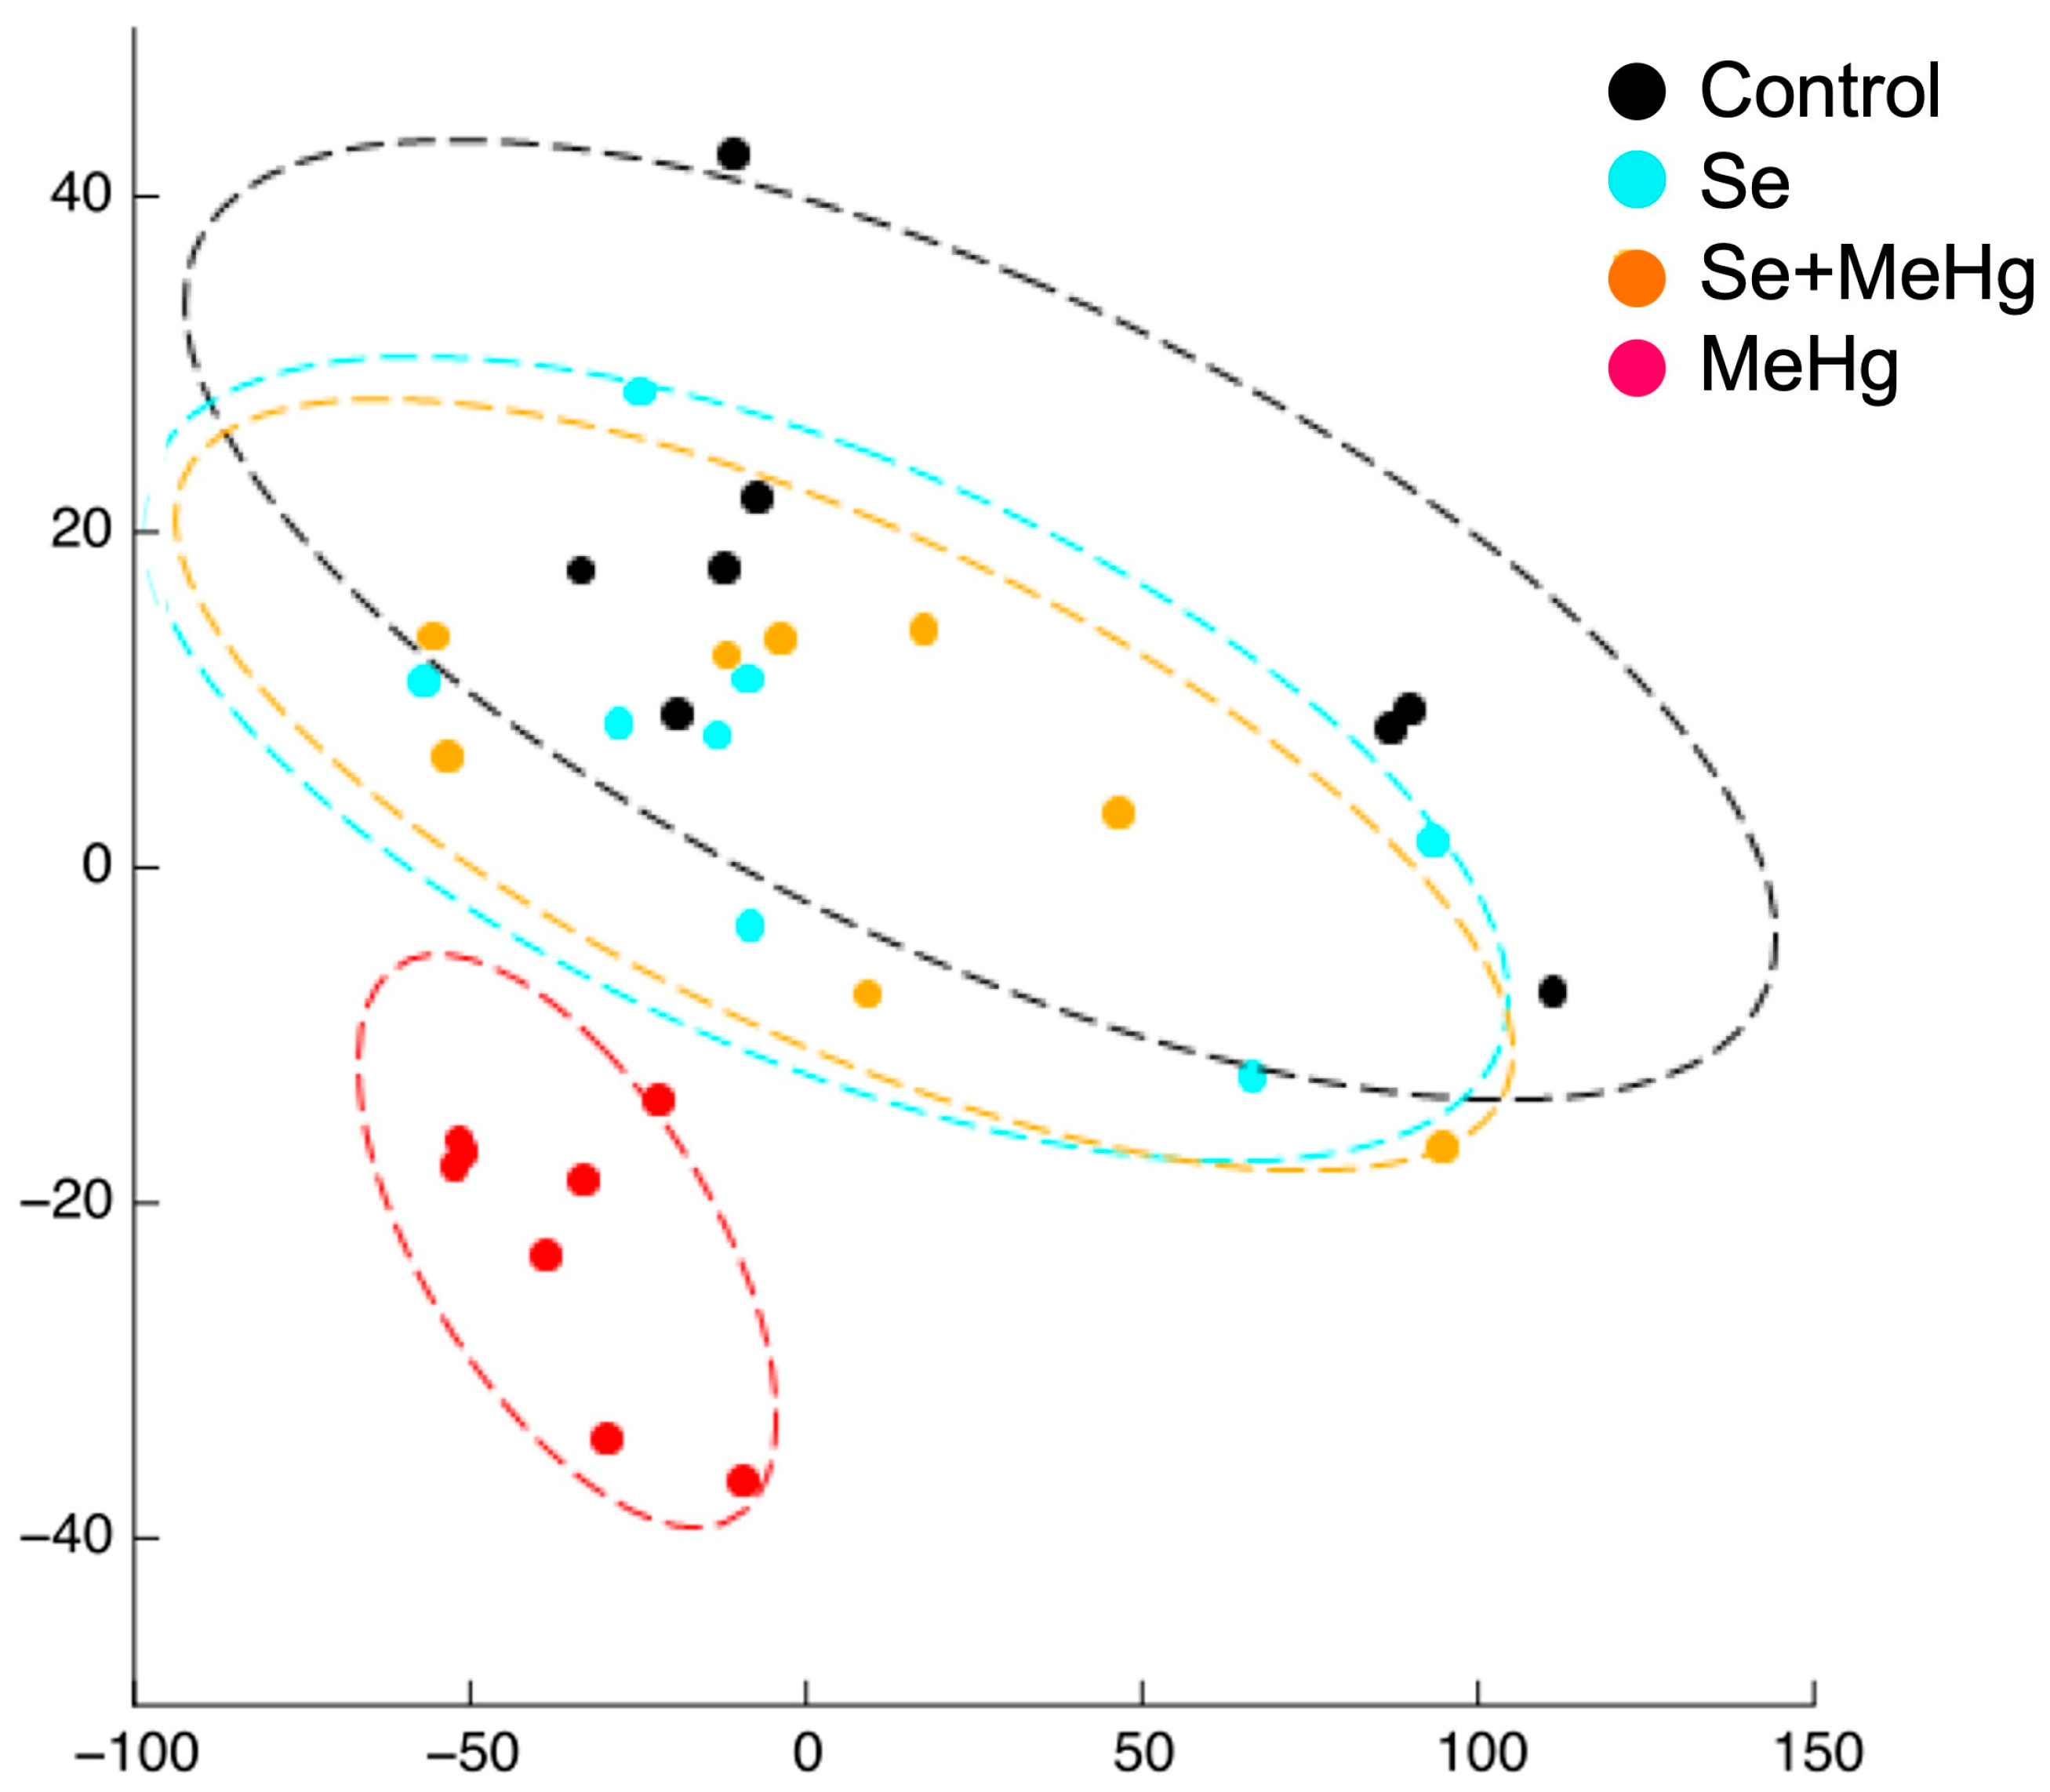
[49]European seabass (Dicentrarchus labrax).The FD and SE of the trajectory following the response to a stochastic event of fish treated with MeH+ 4 μg m/L for 9 days.Changes in the shoals’ behaviour in response to an event (FD and SE) upon exposure to MeHg+ in the water.The Katz–Castiglioni FD and particularly the SE were the most sensitive algorithms to discriminate the responses of MeHg+-contaminated fish, indicating a potential value to develop a non-invasive method for the identification and quantification of behavioural differences.
[85]European seabass
(D. labrax)
SE of the schooling behaviour during recovery after exposure to MeHg+ 4 μg m/L for 9 days.Quantification of the changes in the shoals’ behaviour by its SE, after exposure to MeHg+ in the water.During the 11 days post-exposure period, the SE of the control fish trended to increase, while the SE of MeHg+-treated fish did not show a recovery trend.
[84]European seabass (D. labrax)SE of the shoaling and schooling behaviour after exposure to (Na2SeO3) 10 μg/L for 6 days.Changes in the shoals’ behaviour (by SE) upon exposure to sodium selenite (Na2SeO3) in the water for 6 days.The SE of the schooling response of the exposed group was only slightly lower than that of the control group.
[42]European seabass (D. labrax)SE of the video recorded trajectory of the shoal of fish fed with Se:Hg molar ratios of 29.5, 6.6, 0.8 and 0.4 for 14 days.Testing the effect of feeding the fish different molar Se:Hg ratios on the SE of their trajectory.The basal SE of fish fed with molar Se:Hg > 1 trended to increase. The basal SE of fish fed with molar Se:Hg < 1 tended to decrease.
[86]Zebrafish (D. rerio)Video recording of school behavioural responses and calculation of the Shannon–Weaver entropy of eight parameters after a 24 h exposure to a low dose (0.05 mg/L) of mercuric chloride (HgCl2).Analyses of linear and non-linear measurements of the collective behaviour of exposed fish.The use of eight parameters (the entropy of swimming speed, depth during each 3 min interval, and changes in the sum entropy of speed, depth, turning frequency, distance and dispersion) was optimal to detect low levels of the HgCl2 in 15–20 min.
[87]Freshwater shrimps (Macrobrachium jelskii)Video recording of individual shrimps’ behaviour in groups of three animals, exposed to HgCl2 10 μg/L.Testing whether mathematical (linear parameters) and non-linear (fractal, information entropy and multifractal parameters) methods applied to video tracking of shrimps exposed to HgCl210 μg/L can adequately describe changes in their locomotion behaviour.None of the methods detected the effect of a 96 h exposure to 10 μg/L mercuric chloride on either linear or non-linear locomotion parameters.
Pesticides and persistent environmental pollutants
[87]Freshwater shrimps (Macrobrachium jelskii)Video recording of individual shrimps’ behaviour in groups of three animals, exposed 0.15 μg/L of the pesticide deltamethrin.Testing whether mathematical (linear parameters) and non-linear (fractal, information entropy and multifractal parameters) methods applied to video tracking of shrimps exposed to 0.15 μg/L of the pesticide deltamethrin can adequately describe changes in their locomotion behaviour.72 h of exposure to 0.15 μg/L of deltamethrin altered the values of some linear (e.g., the track length) and non-linear (fractal dimension (box counting or information entropy) and multifractal analysis) parameters of their locomotion behaviour.
[88]Japanese medaka
(O. latipes)
Resting, swimming (in a straight line and in circles) and SE of individual fish placed in pairs in the tanks and exposed to tributyltin (TBT), polychlorinated biphenyls (PCBs), or a mixture (at 1 µg/g bw/day) of each for 3 weeks.Changes in the behaviour of individual fish reflected in the SE of the mean swimming velocity and the position of individual fish estimated from data on the resting, swimming in a straight line and swimming in circles.PCBS induced swimming patterns consistent with hyperactivity and TBT increased the entropy of fish’s position.
[89]Japanese medaka
(O. Latipes)
Video recording of the swimming trajectories of medaka fed (at 3% of bw) the PCB Kanechlor-400 during 3 weeks in doses up to 125 µg/g feed.Effects of Kanechlor-400 on the collective behaviour of groups of three sexually immature of fish and in groups of mixed-treated and untreated fish. Analysis of the fractal dimension of the trajectory and the fractal dimensions of swimming velocity and turning angle.Kanechlor-400 induced a shortened schooling time, increased frequency of behavioural pattern change changed, disintegration of schools and increased the frequency of collisions (hyperactivity). When mixed in the same group, Kanechlor 400-exposed medaka influenced the behaviour of unexposed fish in the same school. FDs of the swimming trajectory and turning angle significantly increased but only in the highest PCB-exposed group.
Table A2. Effects of contaminants on the tendencies of the Fractal dimension and entropy values of individual or collective behavioural patterns. FD, fractal dimension; SE, Shannon entropy.
ReferenceToxicantFD/EntropyIndividual/Collective BehaviourModification upon Exposure
Fractal dimension analyses
[79]Sublethal NaClO and pH FD of swimming trajectories and FD of swimming velocities.IndividualThe FD of the trajectories increased with pH while the FD of the velocities increased with NaClO.
[89]3 weeks exposure to the PCB Kanechlor-400 in the feed (3% of body wt and doses up to 125 µg/g feed).Effects of Kanechlor-400 on the several parameters of collective behaviour of groups of three sexually immature of fish. The fractal dimension of the trajectory and the fractal dimensions of swimming velocity and turning angle.Collective (n = 3 immature fish)The FDs of the swimming trajectory and turning angle increased significantly, but only in the highest PCB-exposed group.
[87]Up to 96 h exposure to HgCl2 (10 μg/L).Track length, speed and D2P as well as the non-linear fractal dimension, box counting or information entropy and multifractal analysis methods.Individual behaviour in groups (n = 3)The multifractal nature of locomotion was initially significantly higher in HgCl2-treated fish. It decreased later to the same values as the control. Other parameters did not change.
[82]MS222 IndividualThe FD decreased.
[83]Exposure to 0.5 ppm PbFD of specific reproductive behaviours.Individual behaviour in groups (n = 2)The FD decreased (decreased the complexity of the behavioural reproductive sequences) but only before secondary sexual characters were evident.
[94]Cu, sublethalFD (individual and group) of speed, Y-position, stop number, stop duration, turning rate and meandering.Individual and collective (n = 4)The FD decreased for both individual and collective responses.
The FD of group responses were less variable than those of individual fish.
[87]Up to 96 h exposure to deltamethrin (0.15 μg/L).Track length, speed and D2P as well as the non-linear fractal dimension (estimated via box counting and information entropy) and multifractal analysis methods.Individual behaviour in groups (n = 3)The fractal and multifractal dimensions of the behaviour decreased after 72 h of exposure.
Fractal and Entropy analyses
[59]Acute exposure to 20 antibiotics from 8 families.FD and entropy of the swimming trajectory of the collective response.Collective (n = 7)The FD decreased upon exposure to amoxicillin, penicillin and tylosin (the most effective antibiotics). Permutation entropy decreased with oxytetracycline and increased with amikacin.
[49]MeHg+ 4 μg /LThe Higuchi FD [96], Katz FD [97] Katz- Castiglioni FD [98] and SE [54] and Permutation entropy [99] of the trajectory following the response to a stochastic event of fish intoxicated with MeHg+ in the water.Collective (n = 81, 41)Upon exposure to MeHg+, the Higuchi FD suffered a small decrease.; Katz FD no change and Katz–Castiglioni FD trended to increase; the SE clearly decreased and permutation entropy showed only a small decrease.
Entropy analyses
[81]Caffeine up to 50 mg/mLTransfer entropy between a zebrafish to a replica shoal of zebrafish.IndividualThe transfer entropy from the replica to the alive fish increased.
[88]3 weeks exposure to tributyltin (TBT), polychlorinated biphenyls (PCBs), or a mixture (at 1 µg/g bw/day of each chemical).The SE of the mean swimming velocity and the position of individual fish estimated from data on the resting, swimming in a straight line and swimming in circles behaviours of individual fish.Individual behaviour in groups (n = 2)The SE of TBT- and PCB-treated fish increased, only the former did so significantly.
[85]11 days recuperation after exposure to MeHg+ 4 μg /L SE of the control and MeHg+ exposed fish groups, stressed by halting the water flow during the experiment in both tanks.Collective (n = 26 and n = 19)The SE trended to increase in control fish group and to decrease slightly in the treated group.
[42]14 days exposure to feeds containing Se:Hg molar ratios > 1 (29.6 and 6.6) and <1 (0.8 and 0.4).SE of the shoaling (basal) and schooling (response) behaviours of the group of fish.Collective (n = 7)The basal SE of fish fed with molar Se:Hg > 1 trended to increase. The basal SE of fish fed with molar Se:Hg < 1 trended to decrease.
[86]24 h exposure to HgCl2 (50 μg/L mg/L). Eight parameters (the entropy of swimming speed, depth during each 3 min interval, and changes in the sum entropy of speed, depth, turning frequency, distance and dispersion) was optimal to detect low levels of the contaminant in 15–20 min.Collective (n = 5)Shannon–Weaver entropy displayed stable values over the pre-exposure period, a sudden significant increase upon the addition of HgCl2 for 15 min and then a fast decrease to low values.
[78]Lethal concentrations of phenol and KCN. SE of the vertical position of the fish.IndividualThe SE decreased with increasing amounts of toxicant.
[80]Detergent SDBSShannon–Weaver entropy of swimming trail and speed and their surface behaviour.IndividualThe Shannon–Weaver entropy decreased with increasing concentrations of the detergent with species-specific sensitivities: zebrafish was the most sensitive of the three, followed by red carp and medaka.
[84]Na2SeO3, 10 μg/L, 6 daysSE of the schooling responses of control and treated groups.Collective (n = 76)The SE of the treated group was only slightly lower than the SE of the control.

References

  1. FAO. The State of World Fisheries and Aquaculture 2022. SOFIA. Towards Blue Transformation; FAO: Rome, Italy, 2022. [Google Scholar]
  2. Stentiford, G.D.; Sritunyalucksana, K.; Flegel, T.W.; Williams, B.; Withyachumnarnkul, B.; Itsathitphaisarn, O.; Bass, D. New Paradigms to Help Solve the Global Aquaculture Disease Crisis. PLoS Pathog. 2017, 13, e1006160. [Google Scholar] [CrossRef] [PubMed]
  3. Suryan, R.M.; Arimitsu, M.L.; Coletti, H.A.; Hopcroft, R.R.; Lindeberg, M.R.; Barbeaux, S.J.; Batten, S.D.; Burt, W.J.; Bishop, M.A.; Bodkin, J.L.; et al. Ecosystem response persists after a prolonged marine heatwave. Sci. Rep. 2021, 11, 6235. [Google Scholar] [CrossRef] [PubMed]
  4. Santos, L.; Ramos, F. Antimicrobial resistance in aquaculture: Current knowledge and alternatives to tackle the problem. Int. J. Antimicrob. Agents 2018, 52, 135–143. [Google Scholar] [CrossRef] [PubMed]
  5. Ledford, H. Anti-anxiety drug makes river fish more aggressive. Nature 2013, 815, 814–815. [Google Scholar] [CrossRef]
  6. Mattsson, K.; Johnson, E.V.; Malmendal, A.; Linse, S.; Hansson, L.-A.; Cedervall, T. Brain damage and behavioural disorders in fish induced by plastic nanoparticles delivered through the food chain. Sci. Rep. 2017, 7, 11452. [Google Scholar] [CrossRef] [PubMed] [Green Version]
  7. Alimi, O.S.; Farner Budarz, J.; Hernandez, L.M.; Tufenkji, N. Microplastics and Nanoplastics in Aquatic Environments: Aggregation, Deposition, and Enhanced Contaminant Transport. Environ. Sci. Technol. 2018, 52, 1704–1724. [Google Scholar] [CrossRef]
  8. Andrady, A.L. Microplastics in the marine environment. Mar. Pollut. Bull. 2011, 62, 1596–1605. [Google Scholar] [CrossRef]
  9. EATiP. A Review of the Strategic Research and Innovation Agenda. Our Vision for the Future of European Aquaculture. European Aquaculture Technology and Innovation Platform 2017. Available online: https://eatip.eu/wp-content/uploads/2018/02/EATIP-SRIA-2017.pdf (accessed on 11 May 2023).
  10. Science Advice for Policy by European Academies (SAPEA). A Sustainable Food System for the European Union; SAPEA: Berlin, Germany, 2020; Available online: https://www.sapea.info/wp-content/uploads/sustainable-food-system-report.pdf (accessed on 11 May 2023)ISBN 978-3-9820301-7-3.
  11. European Commission; European Innovation Council and SMEs Executive Agency. Identification of Emerging Technologies and Breakthrough Innovations. Lopatka, M., Pólvora, A., Manimaaran, S., Eds.; Publications Office of the European Union: Luxenbourgh, 2022. [Google Scholar]
  12. European Commission 2020 Strategic Foresight Report. Charting the Course Towards a More Resilient Europe; 2020. Available online: https://commission.europa.eu/system/files/2021-04/strategic_foresight_report_2020_1_0.pdf (accessed on 11 May 2023).
  13. Holling, C.S. Resilience and Stability of Ecological Systems. Annu. Rev. Ecol. Syst. 1973, 4, 1–23. [Google Scholar] [CrossRef] [Green Version]
  14. Føre, M.; Frank, K.; Norton, T.; Svendsen, E.; Alfredsen, J.A.; Dempster, T.; Eguiraun, H.; Watson, W.; Stahl, A.; Sunde, L.M.; et al. Precision fish farming: A new framework to improve production in aquaculture. Biosyst. Eng. 2018, 173, 176–193. [Google Scholar] [CrossRef]
  15. Arechavala-Lopez, P.; Cabrera-Álvarez, M.J.; Maia, C.M.; Saraiva, J.L. Environmental enrichment in fish aquaculture: A review of fundamental and practical aspects. Rev. Aquac. 2021, 14, 704–728. [Google Scholar] [CrossRef]
  16. Barreto, M.O.; Planellas, S.R.; Yang, Y.; Phillips, C.; Descovich, K. Emerging indicators of fish welfare in aquaculture. Rev. Aquac. 2021, 14, 343–361. [Google Scholar] [CrossRef]
  17. Li, D.; Wang, G.; Du, L.; Zheng, Y.; Wang, Z. Recent advances in intelligent recognition methods for fish stress behavior. Aquac. Eng. 2021, 96, 102222. [Google Scholar] [CrossRef]
  18. Marques, T.A.; Thomas, L.; Martin, S.W.; Mellinger, D.K.; Ward, J.A.; Moretti, D.J.; Harris, D.; Tyack, P.L. Estimating animal population density using passive acoustics. Biol. Rev. 2012, 88, 287–309. [Google Scholar] [CrossRef] [PubMed] [Green Version]
  19. Føre, M.; Svendsen, E.; Alfredsen, J.; Uglem, I.; Bloecher, N.; Sveier, H.; Sunde, L.; Frank, K. Using acoustic telemetry to monitor the effects of crowding and delousing procedures on farmed Atlantic salmon (Salmo salar). Aquaculture 2018, 495, 757–765. [Google Scholar] [CrossRef]
  20. Rose, C.S.; Stoner, A.W.; Matteson, K. Use of high-frequency imaging sonar to observe fish behaviour near baited fishing gears. Fish. Res. 2005, 76, 291–304. [Google Scholar] [CrossRef]
  21. Gesto, M.; Zupa, W.; Alfonso, S.; Spedicato, M.T.; Lembo, G.; Carbonara, P. Using acoustic telemetry to assess behavioral responses to acute hypoxia and ammonia exposure in farmed rainbow trout of different competitive ability. Appl. Anim. Behav. Sci. 2020, 230, 105084. [Google Scholar] [CrossRef]
  22. Halvorsen, M.B.; Zeddies, D.G.; Ellison, W.T.; Chicoine, D.R.; Popper, A.N. Effects of mid-frequency active sonar on hearing in fish. J. Acoust. Soc. Am. 2012, 131, 599–607. [Google Scholar] [CrossRef]
  23. Kruusmaa, M.; Gkliva, R.; Tuhtan, J.A.; Tuvikene, A.; Alfredsen, J.A. Salmon behavioural response to robots in an aquaculture sea cage. R. Soc. Open Sci. 2020, 7, 191220. [Google Scholar] [CrossRef] [Green Version]
  24. Kruusmaa, M.; Rieucau, G.; Montoya, J.C.C.; Markna, R.; Handegard, N.O. Collective responses of a large mackerel school depend on the size and speed of a robotic fish but not on tail motion. Bioinspiration Biomim. 2016, 11, 056020. [Google Scholar] [CrossRef]
  25. Zhao, S.; Zhang, S.; Liu, J.; Wang, H.; Zhu, J.; Li, D.; Zhao, R. Application of machine learning in intelligent fish aquaculture: A review. Aquaculture 2021, 540, 736724. [Google Scholar] [CrossRef]
  26. Gladju, J.; Kamalam, B.S.; Kanagaraj, A. Applications of data mining and machine learning framework in aquaculture and fisheries: A review. Smart Agric. Technol. 2022, 2, 100061. [Google Scholar] [CrossRef]
  27. Saberioon, M.; Gholizadeh, A.; Cisar, P.; Pautsina, A.; Urban, J. Application of machine vision systems in aquaculture with emphasis on fish: State-of-the-art and key issues. Rev. Aquac. 2016, 9, 369–387. [Google Scholar] [CrossRef]
  28. Yang, L.; Liu, Y.; Yu, H.; Fang, X.; Song, L.; Li, D.; Chen, Y. Computer Vision Models in Intelligent Aquaculture with Emphasis on Fish Detection and Behavior Analysis: A Review. Arch. Comput. Methods Eng. 2021, 28, 2785–2816. [Google Scholar] [CrossRef]
  29. Wei, Y.; Wei, Q.; An, D. Intelligent monitoring and control technologies of open sea cage culture: A review. Comput. Electron. Agric. 2020, 169, 105119. [Google Scholar] [CrossRef]
  30. Sadoul, B.; Mengues, P.E.; Friggens, N.; Prunet, P.; Colson, V. A new method for measuring group behaviours of fish shoals from recorded videos taken in near aquaculture conditions. Aquaculture 2014, 430, 179–187. [Google Scholar] [CrossRef]
  31. Deakin, A.G.; Spencer, J.W.; Cossins, A.R.; Young, I.S.; Sneddon, L.U. Welfare Challenges Influence the Complexity of Movement: Fractal Analysis of Behaviour in Zebrafish. Fishes 2019, 4, 8. [Google Scholar] [CrossRef] [Green Version]
  32. Zhao, J.; Bao, W.; Zhang, F.; Zhu, S.; Liu, Y.; Lu, H.; Shen, M.; Ye, Z. Modified motion influence map and recurrent neural network-based monitoring of the local unusual behaviors for fish school in intensive aquaculture. Aquaculture 2018, 493, 165–175. [Google Scholar] [CrossRef]
  33. Van De Vis, J.W.; Poelman, M.; Lambooij, E.; Begout, M.-L.; Pilarczyk, M. Fish welfare assurance system: Initial steps to set up an effective tool to safeguard and monitor farmed fish welfare at a company level. Fish Physiol. Biochem. 2012, 38, 243–257. [Google Scholar] [CrossRef]
  34. Ashley, P.J. Fish welfare: Current issues in aquaculture. Appl. Anim. Behav. Sci. 2007, 104, 199–235. [Google Scholar] [CrossRef]
  35. Korte, S.M.; Olivier, B.; Koolhaas, J.M. A new animal welfare concept based on allostasis. Physiol. Behav. 2007, 92, 422–428. [Google Scholar] [CrossRef] [Green Version]
  36. Sterling, P.; Eyer, J. Allostasis: A New Paradigm to Explain Arousal Pathology. In Handbook of Life Stress, Cognition and Health; Fisher, S., Reason, J., Eds.; John Wiley & Sons Ltd.: Hoboken, NJ, USA, 1988; pp. 629–639. ISBN 0471912697. [Google Scholar]
  37. Kristiansen, T.S.; Madaro, A.; Stien, L.H.; Bracke, M.B.M.; Noble, C. Theoretical Basis and Principles for Welfare Assessment of Farmed Fish, 1st ed.; Elsevier Inc.: Amsterdam, The Netherlands, 2020; Volume 38. [Google Scholar]
  38. Bonga, S.E.W. The stress response in fish. Physiol. Rev. 1997, 77, 591–625. [Google Scholar] [CrossRef] [PubMed]
  39. Rapini, R.; Marrazza, G. Electrochemical aptasensors for contaminants detection in food and environment: Recent advances. Bioelectrochemistry 2017, 118, 47–61. [Google Scholar] [CrossRef]
  40. Ejeian, F.; Etedali, P.; Mansouri-Tehrani, H.-A.; Soozanipour, A.; Low, Z.-X.; Asadnia, M.; Taheri-Kafrani, A.; Razmjou, A. Biosensors for wastewater monitoring: A review. Biosens. Bioelectron. 2018, 118, 66–79. [Google Scholar] [CrossRef] [PubMed]
  41. Fernández-Baca, C.P.; Spirito, C.M.; Bae, J.S.; Szegletes, Z.M.; Barott, N.; Sausele, D.J.; Brooks, Y.M.; Weller, D.L.; Richardson, R.E. Rapid qPCR-Based Water Quality Monitoring in New York State Recreational Waters. Front. Water 2021, 3, 711477. [Google Scholar] [CrossRef]
  42. Eguiraun, H.; Casquero, O.; Martinez, I. The Shannon Entropy Trend of a Fish System Estimated by a Machine Vision Approach Seems to Reflect the Molar Se:Hg Ratio of Its Feed. Entropy 2018, 20, 90. [Google Scholar] [CrossRef] [PubMed] [Green Version]
  43. Bae, M.-J.; Park, Y.-S. Biological early warning system based on the responses of aquatic organisms to disturbances: A review. Sci. Total. Environ. 2014, 466–467, 635–649. [Google Scholar] [CrossRef] [PubMed]
  44. Brodin, T.; Piovano, S.; Fick, J.; Klaminder, J.; Heynen, M.; Jonsson, M. Ecological effects of pharmaceuticals in aquatic systems—Impacts through behavioural alterations. Philos. Trans. R. Soc. B Biol. Sci. 2014, 369, 20130580. [Google Scholar] [CrossRef] [PubMed] [Green Version]
  45. Wang, B.; Zhu, J.; Wang, A.; Wang, J.; Wu, Y.; Yao, W. Early detection of cyanide, organophosphate and rodenticide pollution based on locomotor activity of zebrafish larvae. PeerJ 2021, 9, e12703. [Google Scholar] [CrossRef]
  46. Eguiraun, H.; Martinez, I. Entropy and Fractal Techniques for Monitoring Fish Behaviour and Welfare in Aquacultural Precision Fish Farming—A Review. Entropy 2023, 25, 559. [Google Scholar] [CrossRef]
  47. Eguiraun, H.; Izagirre, U.; Martinez, I. A paradigm shift in safe seafood production: From contaminant detection to fish monitoring—Application of biological warning systems to aquaculture. Trends Food Sci. Technol. 2015, 43, 104–113. [Google Scholar] [CrossRef]
  48. Eguiraun, H.; Casquero, O.; Sørensen, A.J.; Martinez, I. Reducing the Number of Individuals to Monitor Shoaling Fish Systems—Application of the Shannon Entropy to Construct a Biological Warning System Model. Front. Physiol. 2018, 9, 493. [Google Scholar] [CrossRef] [PubMed] [Green Version]
  49. Eguiraun, H.; López-De-Ipiña, K.; Martinez, I. Application of Entropy and Fractal Dimension Analyses to the Pattern Recognition of Contaminated Fish Responses in Aquaculture. Entropy 2014, 16, 6133–6151. [Google Scholar] [CrossRef] [Green Version]
  50. Gavrilescu, M.; Demnerová, K.; Aamand, J.; Agathos, S.; Fava, F. Emerging pollutants in the environment: Present and future challenges in biomonitoring, ecological risks and bioremediation. New Biotechnol. 2015, 32, 147–156. [Google Scholar] [CrossRef]
  51. Brausch, J.M.; Connors, K.A.; Brooks, B.W.; Rand, G.M. Human Pharmaceuticals in the Aquatic Environment: A Review of Recent Toxicological Studies and Considerations for Toxicity Testing. Rev. Environ. Contam. Toxicol. 2012, 218, 1–99. [Google Scholar] [CrossRef]
  52. Steele, C.W. Open field exploratory behaviour of fish: An underutilized tool for behavioural toxicology. Mar. Pollut. Bull. 1983, 14, 124–125. [Google Scholar] [CrossRef]
  53. Kleerekoper, H. Effects of Sublethal Concentrations of Pollutants on the Behavior of Fish. J. Fish. Res. Board Can. 1976, 33, 2036–2039. [Google Scholar]
  54. Shannon, C.E. A Mathematical Theory of Communication. Bell Syst. Tech. J. 1948, 27, 379–423. [Google Scholar] [CrossRef] [Green Version]
  55. Shannon, C.E.; Weaver, W.W. The Mathematical Theory of Communications; University of Illinois Press: Urbana, IL, USA, 1963. [Google Scholar]
  56. Espino, M.; Eguiraun, H.; de Cerio, O.D.; Carrero, J.A.; Etxebarria, N.; Martinez, I. Antioxidant Activities and Selenogene Transcription in the European Sea Bass (Dicentrarchus labrax) Liver Depend, in a Non-linear Manner, on the Se/Hg Molar Ratio of the Feeds. Biol. Trace Element Res. 2021, 200, 2365–2379. [Google Scholar] [CrossRef]
  57. Døving, K.B. Assessment of animal behaviour as a method to indicate environmental toxicity. Comp. Biochem. Physiol. Part C Comp. Pharmacol. 1991, 100, 247–252. [Google Scholar] [CrossRef] [PubMed]
  58. Jacquin, L.; Petitjean, Q.; Côte, J.; Laffaille, P.; Jean, S. Effects of Pollution on Fish Behavior, Personality, and Cognition: Some Research Perspectives. Front. Ecol. Evol. 2020, 8, 86. [Google Scholar] [CrossRef] [Green Version]
  59. Suryanto, M.E.; Yang, C.-C.; Audira, G.; Vasquez, R.D.; Roldan, M.J.M.; Ger, T.-R.; Hsiao, C.-D. Evaluation of Locomotion Complexity in Zebrafish after Exposure to Twenty Antibiotics by Fractal Dimension and Entropy Analysis. Antibiotics 2022, 11, 1059. [Google Scholar] [CrossRef]
  60. Okoye, C.O.; Addey, C.I.; Oderinde, O.; Okoro, J.O.; Uwamungu, J.Y.; Ikechukwu, C.K.; Okeke, E.S.; Ejeromedoghene, O.; Odii, E.C. Toxic Chemicals and Persistent Organic Pollutants Associated with Micro-and Nanoplastics Pollution. Chem. Eng. J. Adv. 2022, 11, 100310. [Google Scholar] [CrossRef]
  61. Llorca, M.; Farré, M. Current Insights into Potential Effects of Micro-Nanoplastics on Human Health by in-vitro Tests. Front. Toxicol. 2021, 3, 752140. [Google Scholar] [CrossRef]
  62. Weilgart, L. The impacts of anthropogenic ocean noise on cetaceans and implications for management. Can. J. Zool. 2007, 85, 1091–1116. [Google Scholar] [CrossRef]
  63. Herbert-Read, J.E.; Kremer, L.; Bruintjes, R.; Radford, A.N.; Ioannou, C.C. Anthropogenic Noise Pollution from Pile-Driving Disrupts the Structure and Dynamics of Fish Shoals. Proceeding R. Soc. B 2017, 84, 20171627I. [Google Scholar] [CrossRef] [PubMed] [Green Version]
  64. Costa, M.; Goldberger, A.L.; Peng, C.-K. Multiscale entropy analysis of biological signals. Phys. Rev. E Stat. Nonlin. Soft Matter. Phys. 2005, 71, 021906. [Google Scholar] [CrossRef] [PubMed] [Green Version]
  65. Kitano, H. Computational Systems Biology. Nature 2002, 420, 206–210. [Google Scholar] [CrossRef]
  66. Spasic, S.; Savic, A.; Nikolic, L.; Budimir, S.; Janosevic, D.; Mitrovic, A. Applications of Higuchi’s Fractal Dimension in the Analysis of Biological Signals. In Proceedings of the 2012 20th Telecommunications Forum, TELFOR, Belgrade, Serbia, 20–22 November 2012; pp. 639–641. [Google Scholar] [CrossRef]
  67. Mandelbrot, B. How Long Is the Coast of Britain? Statistical Self-Similarity and Fractional Dimension. Science 1967, 156, 636–638. [Google Scholar] [CrossRef] [Green Version]
  68. Zmeskal, O.; Dzik, P.; Vesely, M. Entropy of fractal systems. Comput. Math. Appl. 2013, 66, 135–146. [Google Scholar] [CrossRef]
  69. Kith, K.; Sourina, O.; Kulish, V.; Khoa, N.M. An Algorithm for Fractal Dimension Calculation Based on Renyi Entropy for Short Time Signal Analysis. In Proceedings of the 2009 7th International Conference on Information, Communications and Signal Processing, ICICS 2009, Macau, China, 8–10 December 2009; pp. 1–5. [Google Scholar] [CrossRef]
  70. Ezeiza, A.; de Ipiña, K.L.; Hernández, C.; Barroso, N. Enhancing the Feature Extraction Process for Automatic Speech Recognition with Fractal Dimensions. Cogn. Comput. 2012, 5, 545–550. [Google Scholar] [CrossRef]
  71. Sekine, M.; Tamura, T.; Akay, M.; Fujimoto, T.; Togawa, T.; Fukui, Y. Discrimination of walking patterns using wavelet-based fractal analysis. IEEE Trans. Neural Syst. Rehabil. Eng. 2002, 10, 188–196. [Google Scholar] [CrossRef]
  72. Inada, Y.; Kawachi, K. Order and Flexibility in the Motion of Fish Schools. J. Theor. Biol. 2002, 214, 371–387. [Google Scholar] [CrossRef] [Green Version]
  73. Tikhonov, D.; Enderlein, J.; Malchow, H.; Medvinsky, A.B. Chaos and fractals in fish school motion. Chaos Solitons Fractals 2001, 12, 277–288. [Google Scholar] [CrossRef]
  74. Tikhonov, D.; Malchow, H. Chaos and fractals in fish school motion, II. Chaos Solitons Fractals 2003, 16, 287–289. [Google Scholar] [CrossRef]
  75. Alados, C.L.; Escós, J.M.; Emlen, J.M. Fractal structure of sequential behaviour patterns: An indicator of stress. Anim. Behav. 1996, 51, 437–443. [Google Scholar] [CrossRef] [Green Version]
  76. Mann, R.P.; Garnett, R. The entropic basis of collective behaviour. J. R. Soc. Interface 2015, 12, 20150037. [Google Scholar] [CrossRef] [PubMed]
  77. Xia, C.; Fu, L.; Liu, Z.; Liu, H.; Chen, L.; Liu, Y. Aquatic Toxic Analysis by Monitoring Fish Behavior Using Computer Vision: A Recent Progress. J. Toxicol. 2018, 2018, 2591924. [Google Scholar] [CrossRef] [PubMed]
  78. Fukuda, S.; Kang, I.J.; Moroishi, J.; Nakamura, A. The application of entropy for detecting behavioral responses in Japanese medaka (Oryzias latipes) exposed to different toxicants. Environ. Toxicol. 2010, 25, 446–455. [Google Scholar] [CrossRef] [PubMed]
  79. Nimkerdphol, K.; Nakagawa, M. Effect of sodium hypochlorite on zebrafish swimming behavior estimated by fractal dimension analysis. J. Biosci. Bioeng. 2008, 105, 486–492. [Google Scholar] [CrossRef] [Green Version]
  80. Zhang, Y.; Ma, J.; Zhou, S.; Ma, F. Concentration-dependent toxicity effect of SDBS on swimming behavior of freshwater fishes. Environ. Toxicol. Pharmacol. 2015, 40, 77–85. [Google Scholar] [CrossRef] [Green Version]
  81. Ladu, F.; Mwaffo, V.; Li, J.; Macrì, S.; Porfiri, M. Acute caffeine administration affects zebrafish response to a robotic stimulus. Behav. Brain Res. 2015, 289, 48–54. [Google Scholar] [CrossRef] [PubMed] [Green Version]
  82. Kane, A.S.; Salierno, J.D.; Gipson, G.T.; Molteno, T.C.; Hunter, C. A video-based movement analysis system to quantify behavioral stress responses of fish. Water Res. 2004, 38, 3993–4001. [Google Scholar] [CrossRef] [PubMed]
  83. Alados, C.L.; Weber, D.N. Lead effects on the predictability of reproductive behavior in fathead minnows (pimephales promelas): A mathematical model. Environ. Toxicol. Chem. 1999, 18, 2392–2399. [Google Scholar] [CrossRef] [PubMed]
  84. Eguiraun, H.; Lopez-De-Ipiña, K.; Martinez, I. Evolution of Shannon Entropy in a Fish System (European Seabass, Dicentrarchus labrax) during Exposure to Sodium Selenite (Na2SeO3). In Proceedings of the 2nd International Electronic Conference on Entropy and its Applications, Online, 15–30 November 2015; MDPI: Basel, Switzerland, 2015. Sciforum Electronic Conference Series, Session Complex Systems (C006). Volume 2. [Google Scholar] [CrossRef] [Green Version]
  85. Eguiraun, H.; López-De-Ipiña, K.; Martinez, I. Shannon Entropy in a European Seabass (Dicentrarchus labrax) System during the Initial Recovery Period after a Short-Term Exposure to Methylmercury. Entropy 2016, 18, 209. [Google Scholar] [CrossRef] [Green Version]
  86. Huang, Y.; Zhang, J.S.; Mi, F.J.; Zhang, G.H.; Sun, J. Monitoring low-level mercury contamination by zebrafish school behavioral responses. IOP Conf. Series Earth Environ. Sci. 2020, 612, 012077. [Google Scholar] [CrossRef]
  87. Tenorio, B.M.; Filho, E.A.D.S.; Neiva, G.S.M.; da Silva, V.A.; Tenorio, F.D.C.A.M.; Silva, T.D.J.D.; e Silva, E.C.S.; Nogueira, R.D.A. Can fractal methods applied to video tracking detect the effects of deltamethrin pesticide or mercury on the locomotion behavior of shrimps? Ecotoxicol. Environ. Saf. 2017, 142, 243–249. [Google Scholar] [CrossRef]
  88. Nakayama, K.; Oshima, Y.; Hiramatsu, K.; Honjo, T. Alteration of General Behavior of Male Medaka, oryzias latipes, Exposed to Tributyltin and/or Polychlorinated Biphenyls. J. Fac. Agric. Kyushu Univ. 2004, 49, 85–92. [Google Scholar] [CrossRef]
  89. Nakayama, K.; Oshima, Y.; Hiramatsu, K.; Shimasaki, Y.; Honjo, T. Effects of polychlorinated biphenyls on the schooling behavior of japanese medaka (Oryzias latipes). Environ. Toxicol. Chem. 2005, 24, 2588–2593. [Google Scholar] [CrossRef]
  90. Zhang, G.; Chen, L.; Chen, J.; Ren, Z.; Wang, Z.; Chon, T.-S. Evidence for the Stepwise Behavioral Response Model (SBRM): The effects of Carbamate Pesticides on medaka (Oryzias latipes) in an online monitoring system. Chemosphere 2012, 87, 734–741. [Google Scholar] [CrossRef]
  91. Nakagawa, M. A Critical Exponent Method to Evaluate Fractal Dimensions of Self-Affine Data. J. Phys. Soc. Jpn. 1993, 62, 4233–4239. [Google Scholar] [CrossRef]
  92. Pérez-Escudero, A.; Vicente-Page, J.; Hinz, R.C.; Arganda, S.; de Polavieja, G.G. idTracker: Tracking individuals in a group by automatic identification of unmarked animals. Nat. Methods 2014, 11, 743–748. [Google Scholar] [CrossRef]
  93. Audira, G.; Suryanto, M.E.; Chen, K.H.-C.; Vasquez, R.D.; Roldan, M.J.M.; Yang, C.-C.; Hsiao, C.-D.; Huang, J.-C. Acute and Chronic Effects of Fin Amputation on Behavior Performance of Adult Zebrafish in 3D Locomotion Test Assessed with Fractal Dimension and Entropy Analyses and Their Relationship to Fin Regeneration. Biology 2022, 11, 969. [Google Scholar] [CrossRef]
  94. Ji, C.W.; Lee, S.K.H.; Kwak, I.S.; Cha, E.Y.; Lee, S.K.H.; Chon, T.S. Computational Analysis of Movement Behaviors of Medaka (Oryzias latipes) after the Treatments of Copper by Using Fractal Dimension and Artificial Neural Networks. WIT Trans. Biomed. Health 2006, 10, 93–107. [Google Scholar] [CrossRef] [Green Version]
  95. Higuchi, T. Approach to an irregular time series on the basis of the fractal theory. Phys. D Nonlinear Phenom. 1988, 31, 277–283. [Google Scholar] [CrossRef]
  96. Katz, M.J. Fractals and the analysis of waveforms. Comput. Biol. Med. 1988, 18, 145–156. [Google Scholar] [CrossRef] [PubMed]
  97. Castiglioni, P. What is wrong in Katz’s method? Comments on: “A note on fractal dimensions of biomedical waveforms”. Comput. Biol. Med. 2010, 40, 950–952. [Google Scholar] [CrossRef]
  98. Bandt, C.; Pompe, B. Permutation Entropy: A Natural Complexity Measure for Time Series. Phys. Rev. Lett. 2002, 88, 174102. [Google Scholar] [CrossRef] [PubMed]
  99. Ganther, H.E.; Goudie, C.; Sunde, M.L.; Kopecky, M.J.; Wagner, P.; Oh, S.-H.; Hoekstra, W.G. Selenium: Relation to Decreased Toxicity of Methylmercury Added to Diets Containing Tuna. Science 1972, 175, 1122–1124. [Google Scholar] [CrossRef] [Green Version]
  100. Ralston, N.V.C.; Ralston, C.R.; Raymond, L.J. Selenium Health Benefit Values: Updated Criteria for Mercury Risk Assessments. Biol. Trace Element Res. 2015, 171, 262–269. [Google Scholar] [CrossRef] [PubMed] [Green Version]
  101. Ralston, N.V.; Raymond, L.J. Mercury’s neurotoxicity is characterized by its disruption of selenium biochemistry. Biochim. Biophys. Acta Gen. Subj. 2018, 1862, 2405–2416. [Google Scholar] [CrossRef]
  102. Ralston, N.V.C.; Blackwell, J.L.; Raymond, L.J. Importance of Molar Ratios in Selenium-Dependent Protection Against Methylmercury Toxicity. Biol. Trace Element Res. 2007, 119, 255–268. [Google Scholar] [CrossRef]
  103. Yamashita, M.; Imamura, S.; Yamashita, Y. Methylmercury and Selenium in Seafood. Kagaku Seibutsu 2012, 50, 807–817. [Google Scholar] [CrossRef] [Green Version]
  104. Yamashita, M.; Yamashita, Y.; Suzuki, T.; Kani, Y.; Mizusawa, N.; Imamura, S.; Takemoto, K.; Hara, T.; Hossain, A.; Yabu, T.; et al. Selenoneine, a Novel Selenium-Containing Compound, Mediates Detoxification Mechanisms against Methylmercury Accumulation and Toxicity in Zebrafish Embryo. Mar. Biotechnol. 2013, 15, 559–570. [Google Scholar] [CrossRef] [PubMed] [Green Version]
  105. Yamashita, Y.; Yabu, T.; Yamashita, M. Discovery of the strong antioxidant selenoneine in tuna and selenium redox metabolism. World J. Biol. Chem. 2010, 1, 144–150. [Google Scholar] [CrossRef] [PubMed]
  106. Costa, E.V.L.; Nogueira, R.D.A. Multifractal dimension and lacunarity of yolk sac vasculature after exposure to magnetic field. Microvasc. Res. 2015, 99, 1–7. [Google Scholar] [CrossRef] [PubMed]
  107. Bernhoft, R.A. Mercury Toxicity and Treatment: A Review of the Literature. J. Environ. Public Health 2012, 2012, 460508. [Google Scholar] [CrossRef]
  108. Lombana, D.A.B.; Macrì, S.; Porfiri, M. Collective Emotional Contagion in Zebrafish. Front. Behav. Neurosci. 2021, 15, 730372. [Google Scholar] [CrossRef]
  109. Millot, S.; Bégout, M.-L.; Chatain, B. Exploration behaviour and flight response toward a stimulus in three sea bass strains (Dicentrarchus labrax L.). Appl. Anim. Behav. Sci. 2009, 119, 108–114. [Google Scholar] [CrossRef] [Green Version]
  110. Millot, S.; Cerqueira, M.; Castanheira, M.-F.; Øverli, Ø.; Oliveira, R.F.; Martins, C.I.M. Behavioural Stress Responses Predict Environmental Perception in European Sea Bass (Dicentrarchus labrax). PLoS ONE 2014, 9, e108800. [Google Scholar] [CrossRef] [Green Version]
  111. Millot, S.; Péan, S.; Labbé, L.; Kerneis, T.; Quillet, E.; Dupont-Nivet, M.; Begout, M.-L. Assessment of Genetic Variability of Fish Personality Traits using Rainbow Trout Isogenic Lines. Behav. Genet. 2014, 44, 383–393. [Google Scholar] [CrossRef] [Green Version]
  112. Kortet, R.; Vainikka, A.; Janhunen, M.; Piironen, J.; Hyvärinen, P. Behavioral variation shows heritability in juvenile brown trout Salmo trutta. Behav. Ecol. Sociobiol. 2014, 68, 927–934. [Google Scholar] [CrossRef]
  113. Giacomini, A.C.V.V.; de Abreu, M.S.; Koakoski, G.; Idalêncio, R.; Kalichak, F.; Oliveira, T.A.; da Rosa, J.G.S.; Gusso, D.; Piato, A.L.; Gil Barcellos, L.J. My stress, our stress: Blunted cortisol response to stress in isolated housed zebrafish. Physiol. Behav. 2015, 139, 182–187. [Google Scholar] [CrossRef] [PubMed]
  114. Villegas-Ríos, D.; Réale, D.; Freitas, C.; Moland, E.; Olsen, E.M. Individual level consistency and correlations of fish spatial behaviour assessed from aquatic animal telemetry. Anim. Behav. 2017, 124, 83–94. [Google Scholar] [CrossRef]
  115. Mikheev, V.N.; Pasternak, A.F.; Taskinen, J. Personality Influences Risk of Parasitism in Fish. Dokl. Biol. Sci. 2019, 488, 141–144. [Google Scholar] [CrossRef]
Figure 1. Cyclical representation of Precision Fish Farming (PFF) where operational processes are divided into four phases: Observe, Interpret, Decide and Act. The inner cycle represents the present state-of-the-art in industry, with manual actions and monitoring, and experience-based interpretation and decision-making. The outer cycle illustrates how the introduction of PFF may influence the different phases of the cycle. Figure credits: Andreas Myskja Lien, SINTEF Ocean. Taken from Føre et al. [14] with permission from the authors.
Fishes 08 00311 g001
Figure 2. Partial least squares-discriminant analysis (PLS-DA) of spectra from HR 1H-NMR analysis from perchloric acid extracts of European seabass brains that were untreated (black dots), treated for 6 days with 10 µg/L of Na2SeO3 followed by 2 weeks in seawater (blue dots), pretreated with 10 µg/L of Na2SeO3 (6 days) followed by 2 weeks of exposure to MeHg+ (4 µg/L) (orange dots) and fish exposed for 2 weeks to 4 µg/L MeHg+ (red dots). Each dot corresponds to one fish and the color corresponds to the treatment as explained above and in the figure. The broken line’s circles represent the 95% of confident bounds for each group of the same treatment. The same color code has been used for the samples and the circles. Unpublished results. HR H1NMR analyses, by courtesy of Dr Daniel Padro (Molecular Imaging Unit, CICBiomaGUNE, Donostia, Spain).
Fishes 08 00311 g002
Table 1. Summary of the most common sensor types and monitoring methods used in aquaculture production and research. Taken from Føre et al. [14] according to CC BY Licence. For further information on additional applications of the sensors please refer to the original publication.
Sensor TypeSensor ImplementationAnimal Behavioural VariablesInformation Level
SonarSingle-beam sonarBiomass depth distribution within beamGroup
SonarSplit-beam sonarBiomass depth distributionIndividual-based group
SonarMulti-beam sonarMovement dynamics (position, and speed) within beamGroup
Hydroacoustic TelemetryIndividual fish tagsBiomass depth distributionIndividual
Passive hydroacoustic sensingHydrophoneMovement dynamics (position, and speed) within entire cage volumeGroup
CameraSurface camerae.g., depth, position, acceleration and spatial orientationGroup
CameraFeeding camera (submerged)Sound emitted from fish population, general soundscapeIndividual-based group
CameraStereo camera (submerged)Surface activity (jumping/splashing)Individual-based group
Table 2. Search strings used in the Scopus database and number of hits on 28 April 2023.
QueryDocuments
(TITLE-ABS-KEY (entropy) AND TITLE-ABS-KEY (fish) AND TITLE-ABS-KEY (“biological warning system” OR bws))5
(TITLE-ABS-KEY (entropy) AND TITLE-ABS-KEY (fish) AND TITLE-ABS-KEY (“biological early warning system” OR bews))3
(TITLE-ABS-KEY (fish AND behav*) AND TITLE-ABS-KEY (fractal* OR entropy))147
(TITLE-ABS-KEY (aquacult*) AND TITLE-ABS-KEY (fractal* OR entropy))94
(TITLE-ABS-KEY (“Fish behavio*”) AND TITLE-ABS-KEY (entropy))12
(TITLE-ABS-KEY (“Fish behavio*”) AND TITLE-ABS-KEY (fractal))10
(TITLE-ABS-KEY (“collective behaviour” OR “collective behavior”) AND TITLE-ABS-KEY (fish) AND TITLE-ABS-KEY (welfare OR stress* OR health OR disease))25
(TITLE-ABS-KEY ((collective AND behavio*) AND fish) AND TITLE-ABS-KEY (contaminant* OR welfare OR stress* OR health OR disease))62
Disclaimer/Publisher’s Note: The statements, opinions and data contained in all publications are solely those of the individual author(s) and contributor(s) and not of MDPI and/or the editor(s). MDPI and/or the editor(s) disclaim responsibility for any injury to people or property resulting from any ideas, methods, instructions or products referred to in the content.

