Article

Identification of Growth-Related SNPs and Genes in the Genome of the Pearl Oyster (Pinctada fucata) Using GWAS

1
College of Fisheries, Guangdong Ocean University, Zhanjiang 524088, China
2
Laboratory of Fish Immunology and Nutrigenomics, Applied Animal and Aquatic Sciences Research Unit, Division of Fisheries, Faculty of Technology, Mahasarakham University, Khamriang Sub-District, Kantarawichai, Mahasarakham 44150, Thailand
3
Guangdong Provincial Key Laboratory of Aquatic Animal Disease Control and Healthy Culture, Zhanjiang 524088, China
*
Author to whom correspondence should be addressed.
Fishes 2023, 8(6), 296; https://doi.org/10.3390/fishes8060296
Submission received: 4 April 2023 / Revised: 25 May 2023 / Accepted: 25 May 2023 / Published: 1 June 2023

Abstract

:
Pinctada fucata, the pearl oyster, is a bivalve primarily cultivated for the production of saltwater pearls. In this study, the genome-wide association study (GWAS) for the growth-related traits and a principal components analysis (PCA) in P. fucata were performed. Genomic parameters of 6 growth-related traits in 60 individuals were estimated by using 4,937,162 single-nucleotide polymorphisms (SNPs). A total of 45 SNPs associated with growth traits were thus identified. Furthermore, 165 candidate genes were identified, including collagen alpha-3 (VI), serine/threonine-protein kinase mos-like harboring significant markers, and histidine-rich protein PFHRP-III-like, which may influence growth-related traits associated with various biological processes. The results of this study can facilitate marker-assisted selection and breeding programs designed to enhance growth and also offer a theoretical foundation for the further development and utilization of genomic resources in P. fucata.
Key Contribution: The results of this study can facilitate marker-assisted selection and breeding programs designed to enhance growth and also offer a theoretical foundation for the further development and utilization of genomic resources in P. fucata.

1. Introduction

Pinctada fucata, the pearl oyster, is a bivalve primarily cultivated for the production of saltwater pearls [1]. Since the successful hatchery production in 1965, this species has played a crucial role in the country’s economy [2,3]. However, in recent years, saltwater pearl farming has faced some challenges, including lower growth rates, weak disease resistance, and decreased mariculture production [4]. To address these issues, it has been suggested that improving breeding programs would be an effective solution. Improving production has always been a top priority for the pearl oyster farming sector. To this end, genetic breeding with the objective of enhancing growth rates is a crucial aspect of pearl oyster culture. Determining genomic loci and genes related to economically relevant traits can not only play a vital role in facilitating and speeding up the breeding process, but also increase production of pearl oyster.
With the advancement of high-throughput sequencing techniques, the exploration of growth-related genes in pearl oysters has become more comprehensive [1]. RNA-seq databases constructed from the mantle tissue of diploid and triploid P. fucata have revealed a total of 11 growth-related genes, including N151, shematrin-partial, mantle gene 2, mantle 11 and paramyosin-like isoform X1 [5]. The identification of these genes provides markers and candidate genes associated with six growth-related traits for the selective breeding of pearl oysters. Currently, various techniques are being employed to identify more growth-related SNPs and genes in P. fucata, yet studies in this area remain limited, hindering the application of selective breeding. Furthermore, the absence of a systematic screening of the entire genome makes it challenging to identify the essential genes regulating the growth of cultured pearl oysters.
A genome-wide association study (GWAS) is an efficient approach to identify the markers and genes associated with specific traits by the levels of linkage disequilibrium (LD) between causal genetic variation and markers [6]. GWAS has been used successfully in several bivalve species, including P. maxima, P. fucata, and Chlamys farreri, to find candidate genes and associations with growth traits using high-density SNP arrays [7,8,9,10], thereby outstandingly promoting the development of marker-assisted selection of these organisms. Recently, GWAS has also applied to studies regarding complex quantitative traits in aquatic animal, and these included heat stress-related functions, disease resistance, growth and fatty acid content [11,12,13,14]. Finding out genes associated with economic traits and the genomic loci has been a way to accelerate and assist breeding progress. Currently, selective breeding in aquaculture principally focuses on growth [15] and disease resistance [16]. Most GWAS in aquatic animals have mainly concentrated on the examination of potential genes that may be linked to genetic control of characteristics. Previous research has demonstrated that genomic forecasts are more dependable when pre-selected SNPs are employed [17,18]. Bayesian models generally improved accuracy with only 54 k single-nucleotide polymorphism (SNP) array data compared to genomic BLUP, but reliability gains were relatively smaller when QTL markers were included. Therefore, significant SNP verification is important to the breeding programs, as marker-assisted selection should base on effective loci.

2. Materials and Methods

2.1. Sample Collection

A total of 60 pearl oysters were collected from two breeding lines constructed for growth selection on a commercial farm at Liusha Bay, Zhanjiang, Guangdong Province, China. The oysters were divided into two groups (Group L: 30 individuals from one breeding line with larger body size; Group S: 30 individuals from another breeding line with smaller body size), kept in 80 L aerated seawater tanks and fed daily with Spirulina powder for a week prior to processing. Six growth-related traits—shell length (sl, mm), shell width (SW, mm), shell height (sh, mm), total weight (tw, g), shell weight (sw, g), and soft tissue weight (stw, g)—were used to represent the phenotype.

2.2. DNA Extraction and Sequencing

The adductor muscle was collected from each pearl oyster, and frozen in liquid nitrogen for DNA extraction. Genomic DNA was extracted using the CTAB (cetyltrimethylammonium bromide) method, described in detail in [19]. Agarose 1.5% gel electrophoresis was used to analyze degradation and contamination. Qubit and Nanodrop (Thermo Fisher Scientific, Waltham, MA, USA) were used to assess DNA purity and quantity, respectively. Only high-quality DNA samples with optical density (OD) 260/280 between 1.8 and 2.0 were used for library construction. Using Illumina Inc.’s Illumina NovaSeq 6000 platform (San Diego, CA, USA) at Genedenovo (Guangzhou, China), paired-end libraries of 500 bp insert size were constructed for each sample, utilizing genomic DNA and the Paired-End DNA Sample Prep Kit.

2.3. SNP Discovery and Genotyping

To obtain high-quality data, strict filtering criteria were applied to the raw data (GenBank accession:GCA_002216045.1) [20] using FASTP (version 0.18.0, Beijing, China) [21], including removing reads with ≥10% uncalled nucleotides (N), medium–low-quality reads (those where >50% of all bases had Phred quality scores ≤20), removing reads aligned to the barcode adapter. SNP and Indel discovery was performed using the Burrows–Wheeler Aligner (BWA) [21] and GATK’s Unified Genotyper [22]. The BWA mem tool, with parameters (-k 32-M−k being the minimum seed length, -M being an option to denote shorter split alignment hits as secondary alignments) [23] was employed to align the clean reads to the pearl oyster genome. GATK’s Variant Filtration module (-Window 4, -filter “QD < 4.0|| FS > 60.0|| MQ < 40.0”, -G _filter “GQ < 20”, QD: Variant Confidence/Quality by Depth; FS: Fisher’s exact test-scaled p-value to detect strand bias; MQ: RMS Mapping Quality; GQ: Genotype Quality) was employed to filter SNPs and Indels. Those displaying segregation distortion or sequencing errors were then discarded. Uniquely, SNPs placed in well-assembled chromosomes were retained. ANNOVAR was employed to ascertain the physical position of SNPs and indels in the genome by aligning and annotating them [24].

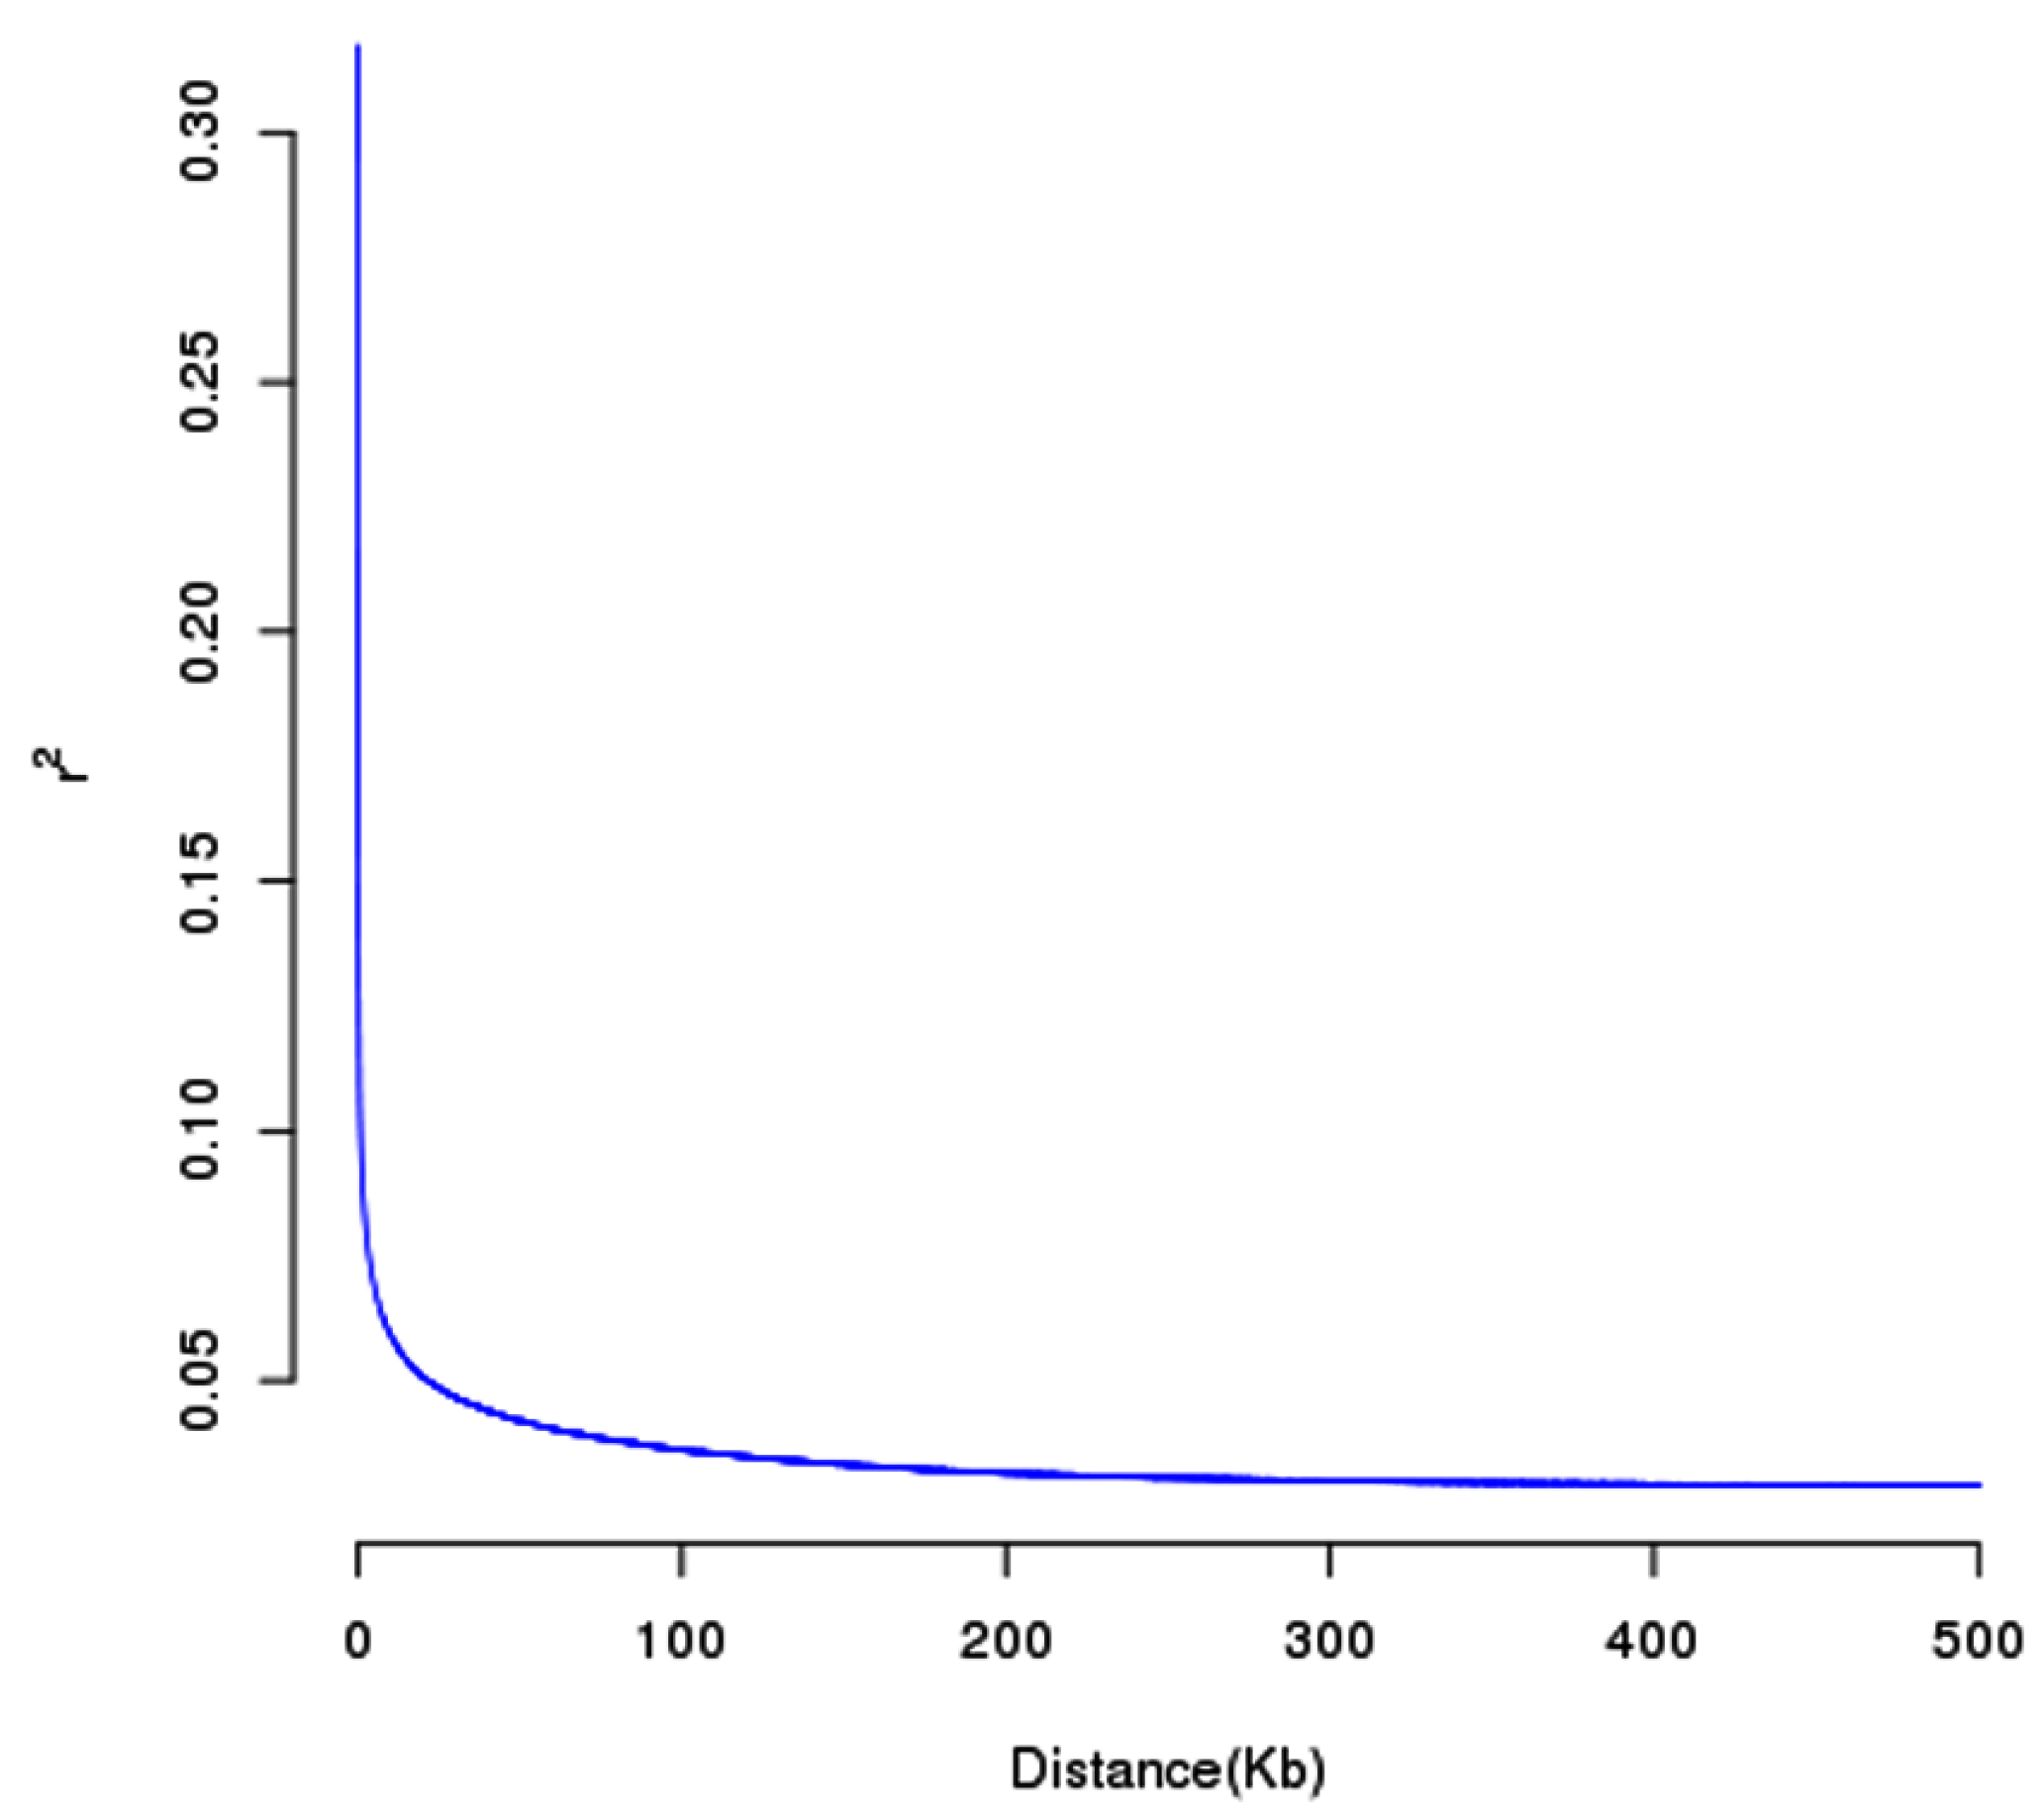
2.4. Analysis of Population Structure and Linkage Disequilibrium (LD) Decay

Subjecting the phenotypic data to principal component analysis (PCA) to minimize redundancy, GCTA (v1.94.1, GCTA, Phoenix, AZ, USA) software was employed to perform the PCA of all samples to understand the community structure of P. fucata based on SNP markers obtained from screening [25]. The samples were also subjected to kinship analysis by GCTA software to avoid false positives, the resulting kinship matrix was added to the GWAS model as the K matrix. Linkage disequilibrium (LD) decay of the population was analyzed using PopLDdecay software (version 3.40 Beta, Wuhan, China) [26] to calculate the LD size and intensity between markers in terms of D’ or r2 (Dab = (ΠAB-ΠAΠB), |D’| = ( Dab ) 2 min   ( Π A Π b , Π a Π B ) for Dab < 0, |D’| = ( Dab ) 2 min   ( Π A Π B , Π a Π b ) for Dab > 0, r2 = ( Dab ) 2 Π A Π a Π B Π b ) ), the resulting LD coefficients were then fitted at various distance levels to ascertain the pattern of LD decay. Plink software (v1.07, Santa Monica, CA, USA) [27] removed marker pairs with r2 greater than 0.2 according to a step size of 100 kb and a window size of 10 nt (lower physical location loci were removed).

2.5. Statistical Analyses

Data analysis was performed with R package stats software version 3.5.0 [28]. The significance of differences between L group and S group was assessed through a one-way ANOVA with the Bonferroni post hoc test. Statistically significant correlations were considered to be present when p-value < 0.05.
Genome-wide association analyses were conducted using TASSEL 3.0 (San Francisco, CA, USA) [29], which gained a mixed liner model (MLM) by the Q + K method. Admixture V1.3.0 software (Los Angeles, CA, USA) [30], which is based on the admixture model, was also used for the estimation of the population structure (Q matrix). The SPAGeDi V 1.5 software (Paris, France) [31] was used to calculate the kinship matrix (K-matrix) using the method of Loiselle et al. [32]. The correlation between genotypes and growth traits were assessed using the Q + K method, where Q is the optimal value of K (corresponding to the population structure matrix), K is the genetic relationship matrix between samples. The mixed linear model was established by the Q + K method, which could be specified as follows:
y = Xα + Qβ + Kµ + eα
y, the phenotype vector, X, the genotype matrix, α, the genotype effect vector, Q, the fixed effect matrix, β, the fixed effect vector, K, the random effect matrix, mainly the kinship matrix, and e, the residuals vector, all constitute the random effect vector.
For each SNP site, we test if α is equal to 0 and use the p-value, which represents the probability of α being 0, to assess the degree of association between the marker genotype and phenotype. The smaller the p-value, the lower the probability of α being 0, the stronger the likelihood of the marker is associated with the trait. The p-value obtained was transformed to -log10 and displayed in Manhattan and Q–Q plots, being the significant threshold a -log10(p-value) of 6. The Manhattan plot was generated using the software MATLAB (R2012a v7.14.0.739, Mathworks, Natick, MA, USA) (http://www.mathworks.com/products/matlab, accessed on 29 April 2020).

2.6. Selection of Candidate Gene

The relationship between significant SNPs and growth-related traits was further verified through the resequencing of 60 collected from two breeding lines constructed for growth selection selected P. fucata individuals. Sequences of key SNPs centered markers were identified in the GWAS dataset based on the mixed linear model (MLM). Further, in the case of a reference genome, the QTL regions were defined as the most strongly associated SNP (lead SNP) of each significant peak plus 50 kb upstream and 50 kb downstream regions. The genes within QTL regions were defined as candidate-related genes.

2.7. KEGG Enrichment Analysis

Further, KEGG enrichment analysis was also performed to investigate the potential functional categories and metabolic pathways associated with candidate genes. Based on the KEGG annotation and classification, genes in selected regions were classified and analyzed in terms of their biological pathways, leading to the identification of six growth traits associated to growth traits. Pathway enrichment analysis, when compared to the entire genome background, revealed significantly enriched metabolic or signal transduction pathways in candidate associated genes. The p-value is: p = 1 − i = 0 m 1 m i N M n i N n (N is the number of all genes that with KEGG annotation, n the number of candidate associated genes in N, M the amount of genes annotated to particular pathways, and m the number of candidate associated genes in M). The calculated p-value was corrected for false discovery rate (FDR), using FDR < 0.05 as threshold. Pathways meeting this condition were defined as significantly enriched pathways in candidate associated genes.

3. Results

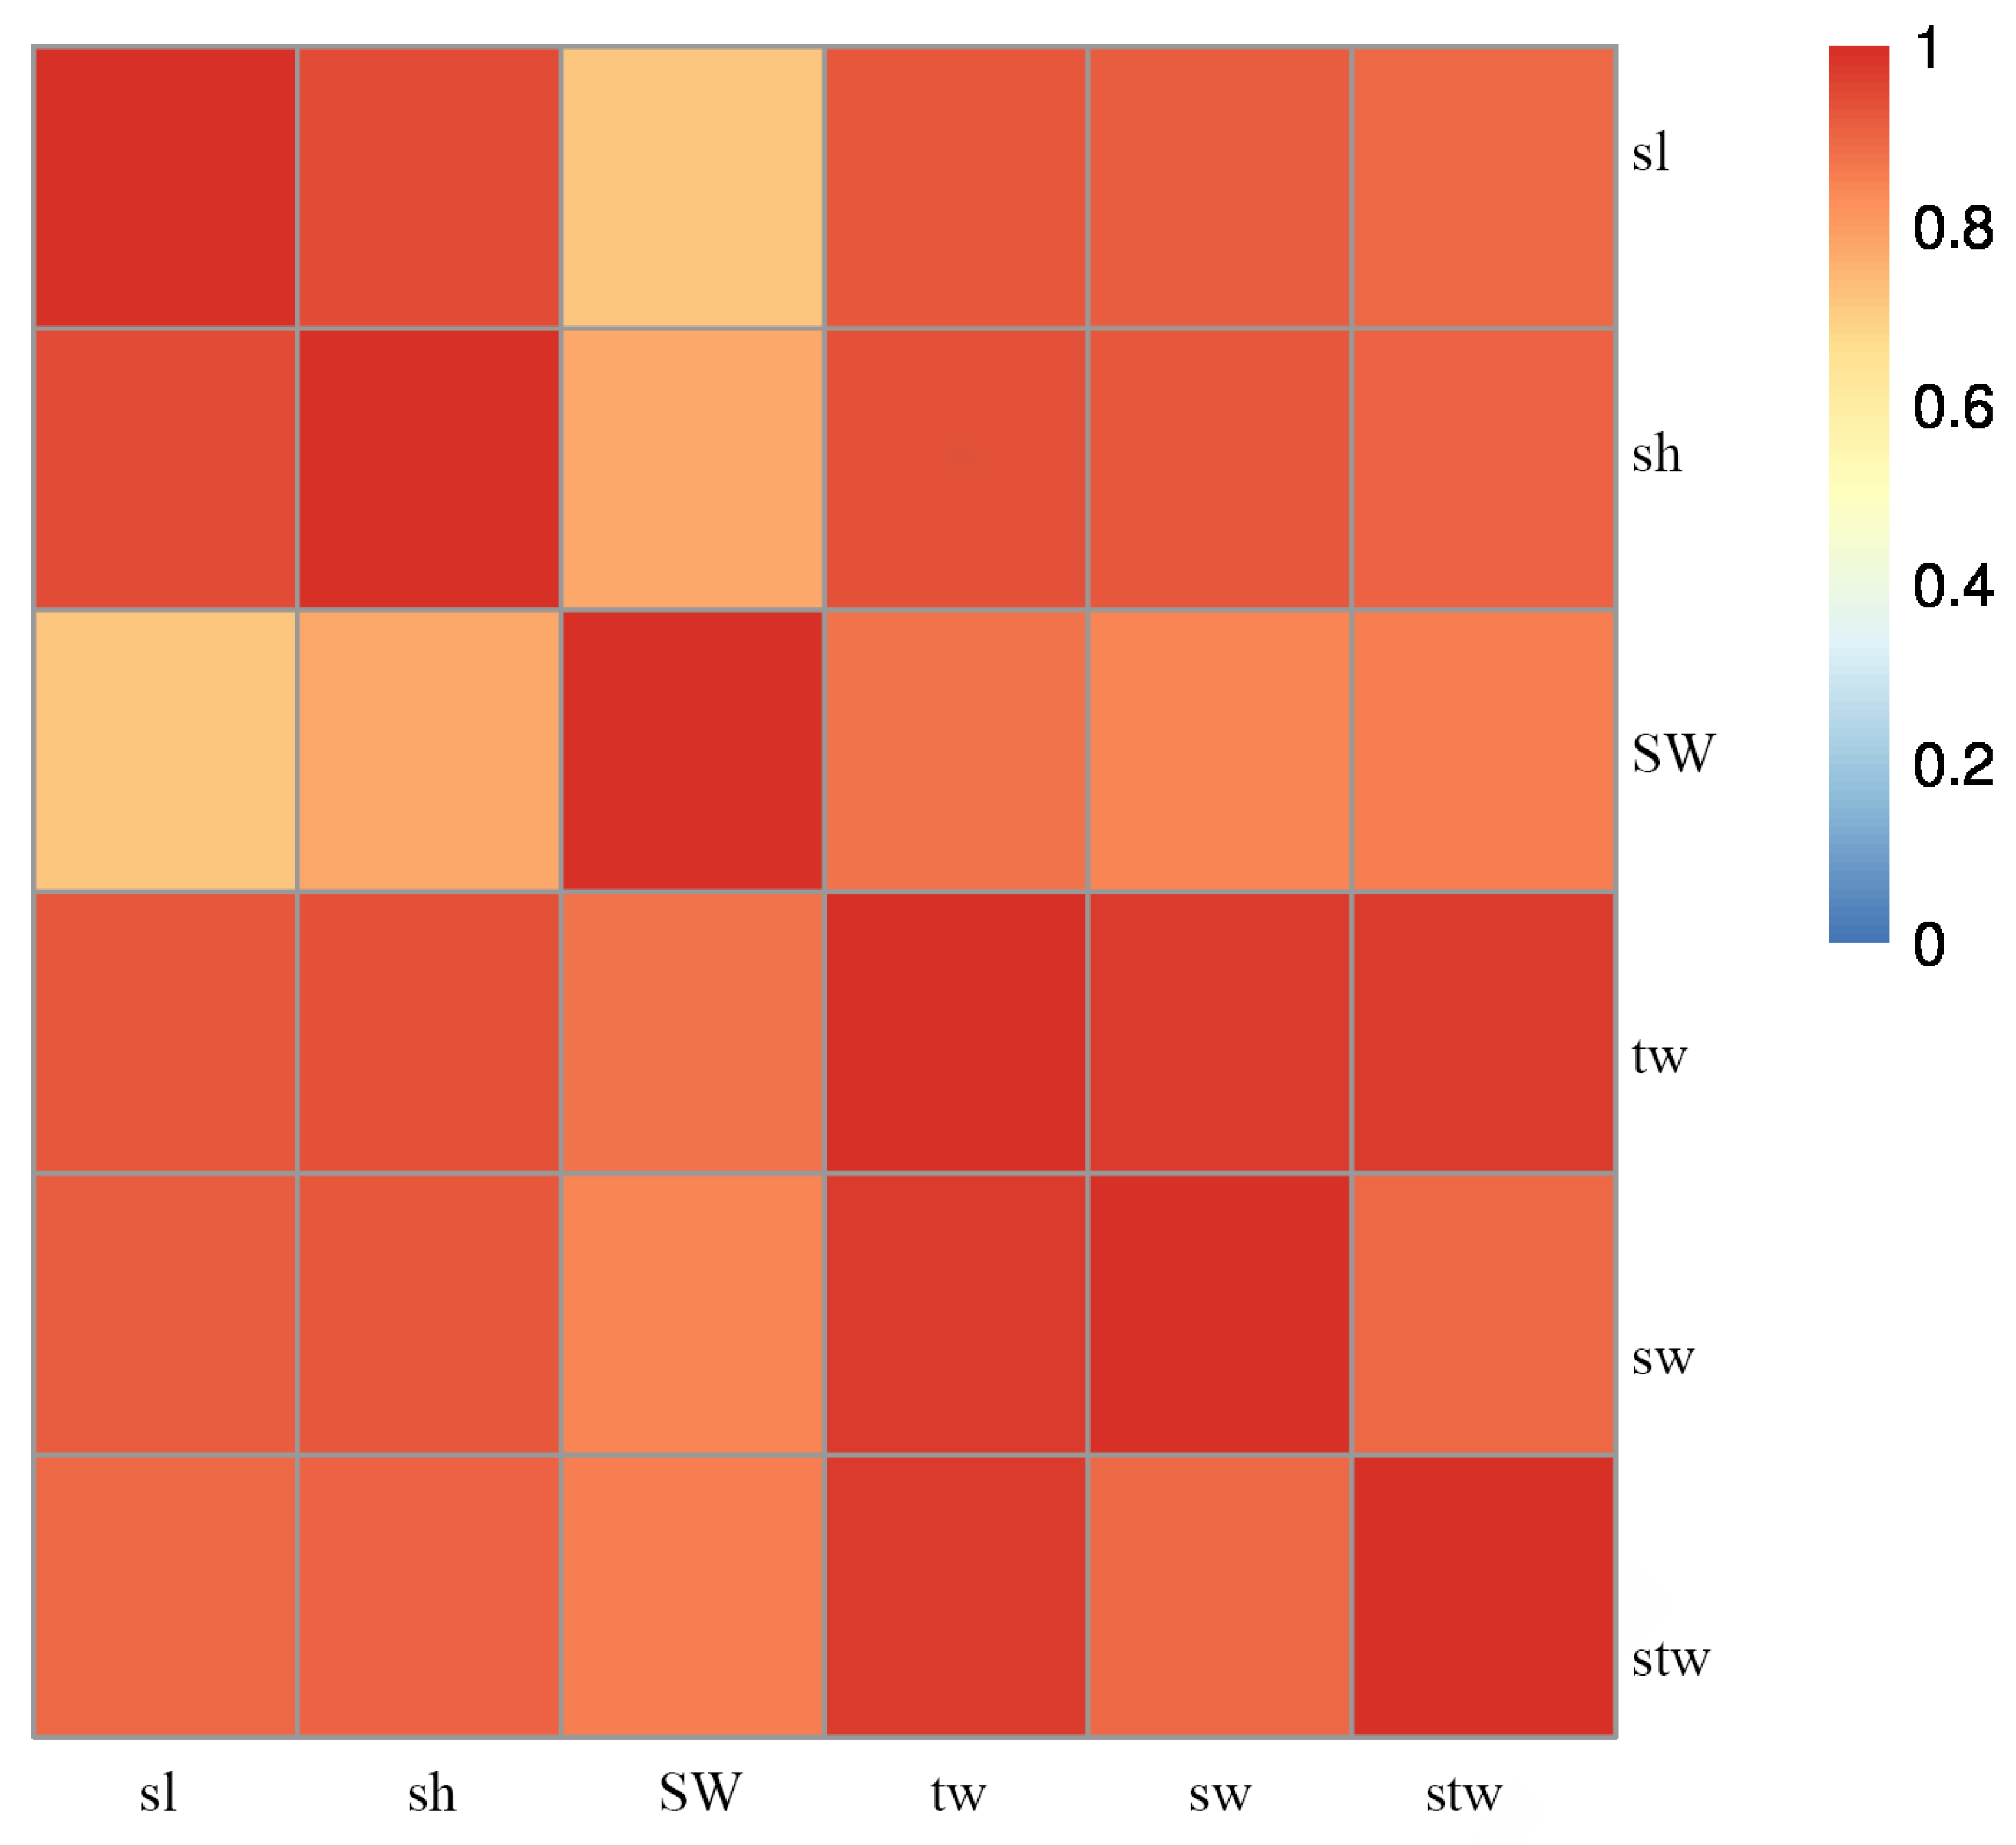
3.1. Descriptive Statistics of Growth-Related Traits

The growth traits of shell length varied from 46.64 mm to 70.68 mm, with a mean of 57.88 mm and a CV of 14.65. The shell height ranged from 48.22 mm to 75.06 mm, with a mean of 60.10 mm and a CV of 13.52%. The shell width spanned from 16.69 mm to 25.02 mm, with a mean of 20.39 mm and a CV of 9.80. The shell weight was between 7.47 g and 20.53 g, with a mean of 13.38 g and a CV of 30.20. The soft tissue weight had a mean of 13.05 g and a CV of 33.80, with a minimum of 5.92 g and a maximum of 22.69 g. The total weight ranged from 15.12 to 39.75 g, with an average of 26.44 g and a CV of 31.20. (Table 1 and Table 2). The correlation between growth-related traits was illustrated in Figure 1. (All correlations were significant.) The results indicated that the six growth-related traits basically followed a bimodal distribution using two breeding lines. The correlation, measured as the Pearson correlation coefficient, between sl and SW, as well as between sh and SW, was estimated to be within the range of 0.75 to 0.80. In addition, a significant correlation was observed between stw and tw, as well as between sw and tw. The results showed that the growth traits were the expression of the morphological, structure, physiological and ecological characteristics of P. fucata, and all the traits were related to each other.

3.2. Quality Control of the Sequencing Data

The whole-genome resequencing of the 60 pearl oyster individuals generated a total of 510 Gb raw data. The sequencing depth for each sample and SNP was 9.5× and 6.5×, respectively. After the elimination of low-quality reads, 500 Gb of pristine data were left. The average clean data for samples ± SD was 8.2 Gb ± 0.6 Gb. The SNP call identified a total of 12,270,990 SNPs. After the site-based filtration and screening, 4,937,162 SNPs were retained for GWAS analysis.

3.3. Analysis of Population Structure and Genetic Relationship

The results of the PCA showed that PC1, PC2 and PC3 accounted for 13.8% of the total phenotypic variation (Figure 2). Specifically, PC1 explained 5.61% of the total genetic variation and was found to divide the samples into two distinct clusters. Meanwhile, PC2 and PC3 accounted for 4.29% and 3.9% of the total genetic variation, respectively.

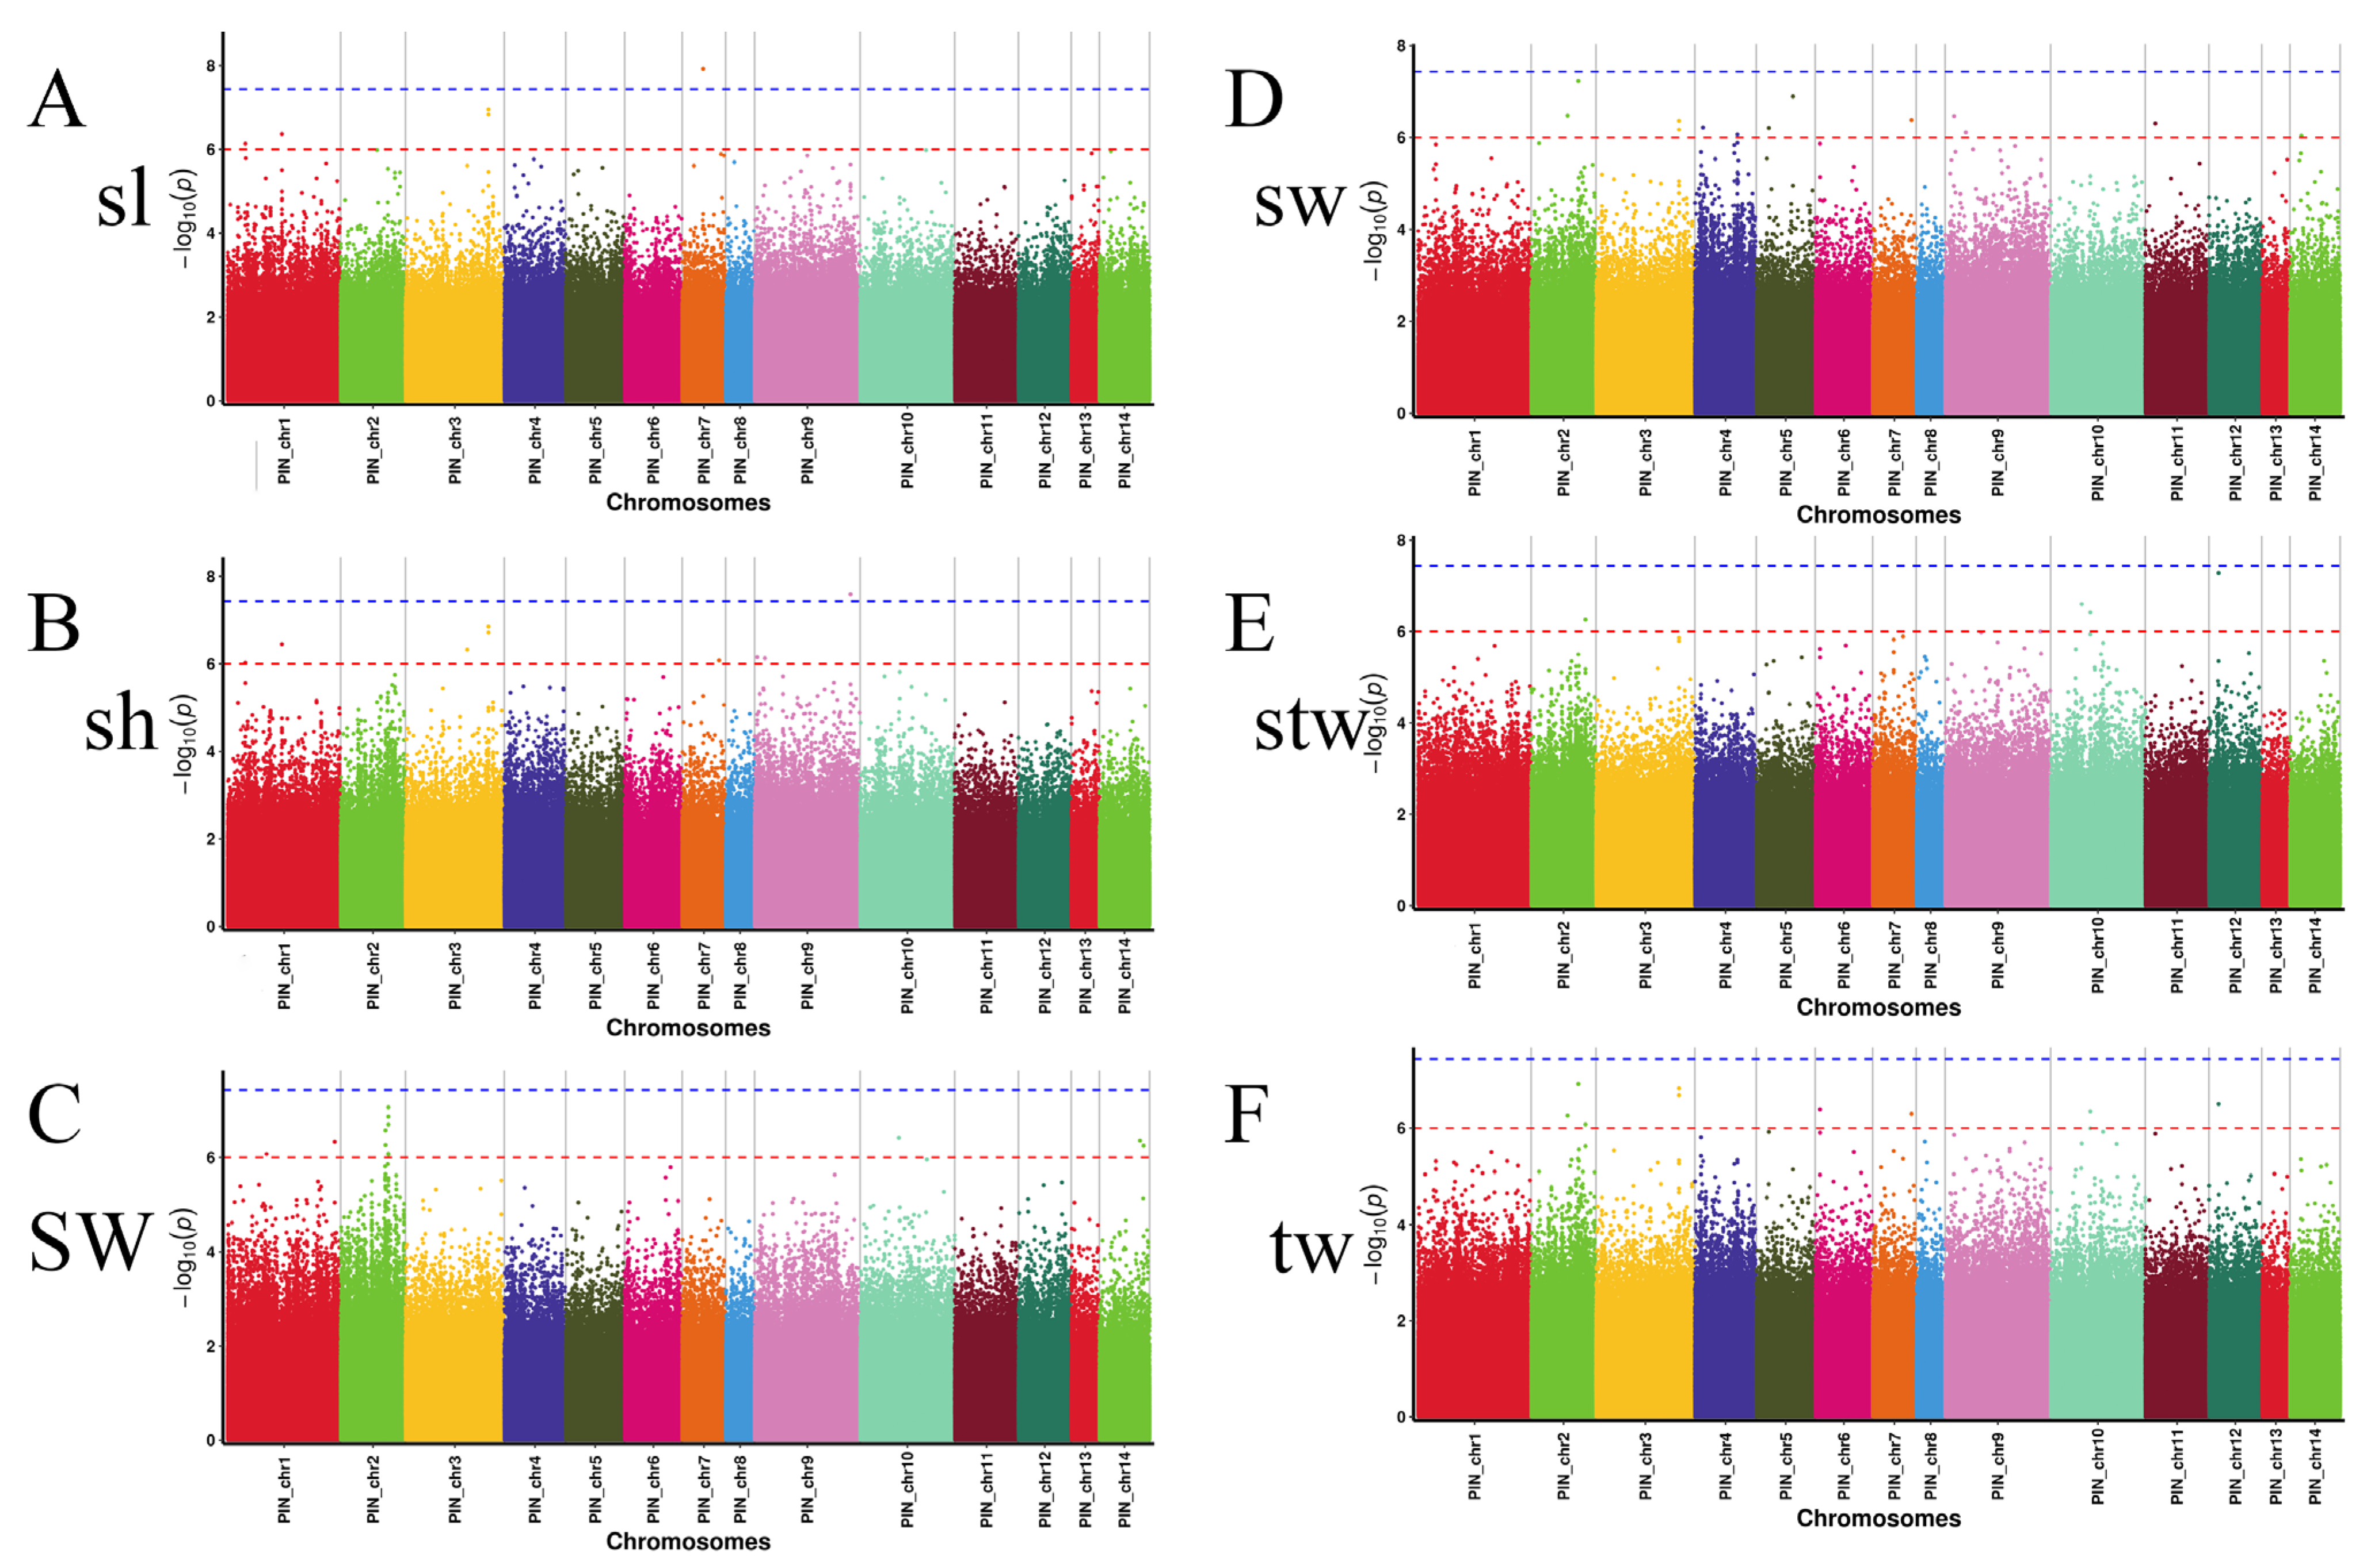
3.4. GWAS of Growth Traits

The GWAS of the 6 growth-related traits was conducted using TASSEL3.0 with 4,937,162 SNPs and 60 samples. A total of 45 genome-wide significant SNPs (−log10 p > 6) were identified across all traits, located on 1–14 (Figure 3 and Table S1), with 7 of them significant for multiple traits. These SNPs were mainly located on chromosomes 1, 2, 3, 4, 5, 6, 7, 9, 10, 11, 14. Among them, PIN_chr3_76865070 and PIN_chr3_76865288 were significant for sl, sh, sw, and tw, with SNP effects ranging from 0.27 to 0.32. PIN_chr10_36697210 and PIN_chr12_8906589 were significant for stw and tw, with SNP effects of 0.24, 0.34, and 0.30, respectively. PIN_chr2_43686383 and PIN_chr7_35952421 were significant for sw and tw, with SNP effects of 0.23 and 0.30, respectively. Finally, PIN_chr2_50316499 was significant for stw and tw, with SNP effects of 0.19 and 0.18, respectively. Some markers or SNPS are associated with two or more traits at the same time, indicating that there may be a certain degree of genetic correlation between traits.
The statistical analysis revealed a significant association between these markers and growth-related traits.

3.5. Identification of Candidate Genes and KEGG Pathway Analysis

As presented in Figure 4, the squared allele frequency correlation (r2) declined drastically in the experimental group, with the overall mean at a distance approximately 80 kb. The KEGG database revealed the top 20 enriching pathways, which are mainly linked to the glycosphingolipid biosynthesis-globo and the isoglobo series, glycosphingolipid biosynthesis-lacto and neolacto series, ECM–receptor interaction, protein digestion and absorption, purine metabolism, the Toll and lmd signaling pathway, and the TNF signaling pathway, as illustrated in Figure 5 and beyond. A total of 165 genes were identified across all significant SNPs of the six traits, with a subset of these genes presented in Table S2.

4. Discussion

The pearl oyster, P. fucata, is a crucial tropical aquaculture species that is widely farmed for its highly prized “South Sea” pearls. It has been estimated that P. fucata accounts for approximately 90% of the total marine pearl production in China [33]. Despite this, the pearl culture industry is still in its early stages when compared to terrestrial animal production systems and has not yet established advanced selective breeding programs. Among the primary objectives of selective breeding programs is improvement of growth rates, which could potentially reduce the culture cycle. Decades of artificial breeding have drastically enhanced shellfish, particularly scallops, abalone and pacific oysters, through selective breeding [34,35,36]. In this study, the growth traits of P. fucata were detected by GWAS and phenotypic correlation analysis, the results revealed that the six growth traits exhibited normal or biased normal distribution and demonstrated positive correlation in pairwise comparisons between traits. The findings suggested that these traits may be jointly regulated, which is consistent with the results of the GWAS. Therefore, it is necessary to carefully consider the mutual influence of various traits and make a comprehensive judgment in the breeding process of P. fucata.
Previous investigations have concentrated on the genetic mapping and trait location examination of P. fucata. For instance, genetic linkage maps were constructed utilizing 230 and 189 markers, including 15 and 10 microsatellites, respectively [37]. Although preliminary, the genetic maps can be employed for genome-wide scanning of QTLs. Li et al. using restriction-site associated DNA sequencing (RAD-seq), a genetic mapping and QTL analysis of growth-related traits was conducted. Subsequently, single-marker analysis and a non-parametric mapping Kruskal–Wallis (KW) test were employed to identify thirty-nine QTL-peak loci for seven growth-related traits [38]. These previous studies employed AFLP, SSR, or RAD-seq techniques to identify markers. One shared characteristic among these techniques is the identification is the limited number of detected markers. In 2015, Brondum and associates [17] showed that the use of QTL markers taken from whole-genome sequence data augmented the dependability of genomic forecasts. Likewise, Bentley [39] emphasized the need for whole-genome resequencing data in reference groups to obtain abundant genetic information and gene resources. Here, LD analysis revealed a rapid LD decay in a set of 60 samples of P. fucata, with an r2 value falling below 0.1 within 1 kb, which indicated that LD levels were low in the investigated populations. Consequently, markers of high density are indispensable for capturing markers in close proximity to the actual causal mutations in this species.
GWAS is an efficient way to uncover the genetic variation associated with complex quantitative traits and identify the corresponding candidate gene [40]. In this study, we screened 45 SNPs that were significant for six growth-related traits (-log10p > 6). Some of these SNPs were linked to multiple traits, suggesting coordinated regulatory mechanisms. Our results, consistent with previous studies, indicated that growth traits are polygenic in the pearl oyster [41].
Interactions between genes, enabling coordinated expression, are the basis of the coordination of various biological functions in biology. In our study, the candidate genes significantly enriched into a variety of pathways. The pathways were mainly in glycan biosynthesis and metabolism, ECM–receptor interaction, oocyte meiosis, the C-type lectin receptor signaling pathway and metabolic pathways. These are related to growth and development, including Sec1, FUT2, PTPN11 (tyrosine-protein phosphatase non-receptor type 11), and COL6A (collagen, type VI, alpha). It is previously reported that transcriptome analysis was used to analyze the molecular mechanism of the different growth rates of the knockout layer in the shell of P. martensii, and a large number of traits and genes were significantly enriched in many pathways, such as glycan biosynthesis and metabolism and the ECM–receptor interaction pathway, and the genes (C1q, C-type lectin) may be involved in the process of nacres formation [1]. Moreover, some studies also pointed out that the ECM–receptor interaction pathway was significantly enriched in the group with fast growth, and all the genes in it were considerably up-regulated, indicating that this pathway exerted a crucial role in the growth of nacres and participated in nacres formation [42]. These results provide theoretical basis and a new perspective for studying P. fucata growth traits.
In this study, 165 candidate genes with significant SNPs were identified. Among the identified genes, ColVI, belongs to the collagen family and represents a primary component of connective tissues. In vertebrates, ColVI has been implicated in the process of bone calcification, and collagen alpha-3 (VI) has also been associated with the growth of P. fucata in other studies [43]. Previous work has demonstrated that collagen VI-like gene (PmColVI) displays significant expression levels within the pallial mantle tissue and is responsible for nacre layer formation in shells through the VWA domain interacting with a variety of matrix proteins [44]. The association of the PTPN11 (tyrosine-protein phosphatase non-receptor type 11) gene with growth-related traits has been investigated. Du et al. [20] have done WGCNA analysis on 234 matrix proteins and found that 27 genes were located in important sites, including VWAP, tyrosinase, and HSP70. These genes were found in the transcriptome of different growth rates in P. fucata. Other candidate genes, such as nacreserine protease inhibitor 2, serine/threonine-protein kinase mos-like, and histidine-rich protein PFHRP-III-like, have not yet been studied in P. fucata. Nevertheless, these genes have been shown to exert an impact on traits associated with growth through a multitude of biological processes such as digestion, activation of the complement system, cell differentiation, and hemostasis [45,46,47,48,49,50,51,52,53]. Serine/threonine-protein kinase mos-like, also known as MASTL, is an enzyme that plays a crucial role in cell cycle regulation. To our knowledge, no study has demonstrated a direct association between serine/threonine-protein kinase mos-like and growth traits. Nevertheless, serine/threonine-protein kinase mos-like relevant to vitellogenesis and oocyte maturation was validated by qRT-PCR in Chinese mitten crab (Eriocheir sinensis) [54]. We identified candidate genes that are associated with growth-related traits in P. fucata, which gives valuable insights into the genetic mechanisms of its growth. These results will help us understand the genetic structures and molecular mechanisms of the growth phenotype, and provide useful SNPs loci for marker-assisted selection and breeding of P. fucata.

5. Conclusions

Crucial for the breeding program of P. fucata and the pearl industry is the creation of dependable markers linked to growth and the augmentation of growth-related characteristics. In this study, the growth traits of P. fucata were detected by GWAS and phenotypic correlation analysis, and the results revealed that the six growth traits exhibited normal or biased normal distribution and demonstrated positive correlation in pairwise comparisons between traits. In addition, a total of 45 SNPs and 165 candidate genes related to growth traits were identified. In this study, we found the relationship between multiple multi-effect loci and traits, which provided reference for explaining the genes and heredity associations among different traits. The findings of this study may advance the marker-assisted selection and breeding aimed at improving growth, providing a theoretical foundation for the further development and utilization of gnomic resources in P. fucata.

Supplementary Materials

The following are available online at https://www.mdpi.com/article/10.3390/fishes8060296/s1, Table S1 reveals genome-wide significant SNPs associated with growth traits; Table S2 details candidate genes identified through GWAS.

Author Contributions

M.Z., designed the experiments and wrote this paper. W.T., data management and analysis. Y.H., Z.Y., Z.C., M.J. and A.Z., sampling. B.W., investigation. Z.W., supervision, funding acquisition, and reviewed this paper. All authors have read and agreed to the published version of the manuscript.

Funding

This work was supported by grants from the International Science and Technology Cooperation Project of Science and Technology Planning Project of Guangdong Province, China (2019A050510044), the Guangdong General Universities Characteristic Innovation Project (2021KTSCX044; 2021ZDZX1031), The Natural Science Foundation of Guangdong Province, China (2019A1515011875), the “First-class” provincial financial special fund construction project of Guangdong Ocean University (CYL2019; 231419015), the National College Student Innovation and Entrepreneurship Training Program (CXXL2020002), the Undergraduate Innovation Team of Guangdong Ocean University (CXTD2021001), and the Innovation Team Project of General Universities in Guangdong Province (2021KCXTD026 and 2022KCXTD013).

Institutional Review Board Statement

The Guangdong Ocean University Research Council, after an exhaustive review, gave its approval for the animal protocols in this study, as declared by the Institutional Review Board; approval no. GDOU-LACUC-2022-A3122.

Data Availability Statement

The data underlying this article are available in the NCBI, and can be accessed with GenBank accession: PRJNA962298.

Acknowledgments

Thanks to Zhongliang Wang and all the fish seed engineering and breeding laboratory teachers for their guidance and valuable opinion. We express our gratitude to Guangzhou Genedenovo Biotechnology Co, Ltd. for their aid in sequencing and bioinformatics analysis.

Conflicts of Interest

The authors declare no conflict of interest.

References

  1. Hao, R.J.; Du, X.D.; Yang, C.Y.; Deng, Y.W.; Zheng, Z.; Wang, Q.H. Integrated application of transcriptomics and metabolomics provides insights into unsynchronized growth in pearl oyster Pinctada fucata martensii. Sci. Total Environ. 2019, 666, 46–56. [Google Scholar] [CrossRef] [PubMed]
  2. Yang, C.Y.; Hao, R.J.; Du, X.D.; Wang, Q.H.; Deng, Y.W.; Sun, R.J.; Zheng, Z. GC-TOF/MS-based metabolomics studies on the effect of protein sources in formulated diet for pearl oyster Pinctada fucata martensii. Aquaculture 2018, 486, 139–147. [Google Scholar] [CrossRef]
  3. Zhang, J.B.; Xiong, X.W.; Deng, Y.W.; Zheng, Z.; Yang, C.Y.; Du, X.D. Integrated application of transcriptomics and metabolomics provides insights into the larval metamorphosis of pearl oyster (Pinctada fucata martensii). Aquaculture 2021, 532, 736067. [Google Scholar] [CrossRef]
  4. Yu, D.H.; Chu, K.H. Genetic variation in wild and cultured populations of the pearl oyster Pinctada fucata from southern China. Aquaculture 2006, 258, 220–227. [Google Scholar] [CrossRef]
  5. Guan, Y.; He, M.; Wu, H. Differential mantle transcriptomics and characterization of growth-related genes in the diploid and triploid pearl oyster Pinctada fucata. Mar. Genom. 2017, 33, 31–38. [Google Scholar] [CrossRef]
  6. Krina, T.Z.; Lon, R.C. The complex interplay among factors that influence allelic association. Nat. Rev. Genet. 2004, 5, 89–100. [Google Scholar] [CrossRef]
  7. Jiao, W.; Fu, X.; Dou, J.; Li, H.; Su, H.; Mao, J.; Yu, Q.; Zhang, L.; Hu, X.; Huang, X.; et al. High-resolution linkage and quantitative trait locus mapping aided by genome survey sequencing: Building up an integrative genomic framework for a bivalve mollusc. DNA Res. 2014, 21, 85–101. [Google Scholar] [CrossRef]
  8. Jones, D.B.; Jerry, D.R.; Khatkar, M.S.; Moser, G.; Raadsma, H.W.; Taylor, J.J.; Zenger, K.R. Determining genetic contributions to host oyster shell growth: Quantitative trait loci and genetic association analysis for the silver-lipped pearl oyster, Pinctada maxima. Aquaculture 2014, 434, 367–375. [Google Scholar] [CrossRef]
  9. Shi, Y.H.; Wang, S.; Gu, Z.F.; Lv, J.; Zhan, X.; Yu, C.C.; Bao, Z.M.; Wang, A.M. High-density single nucleotide polymorphisms linkage and quantitative trait locus mapping of the pearl oyster, Pinctada fucata martensii Dunker. Aquaculture 2014, 434, 376–384. [Google Scholar] [CrossRef]
  10. Tian, M.; Li, Y.; Jing, J.; Mu, C.; Du, H.; Dou, J.; Mao, J.; Li, X.; Jiao, W.; Wang, Y.; et al. Construction of a High-Density Genetic Map and Quantitative Trait Locus Mapping in the Sea Cucumber Apostichopus japonicus. Sci. Rep. 2015, 5, 14852. [Google Scholar] [CrossRef]
  11. Coltell, O.; Sorli, J.V.; Asensio, E.M.; Barragan, R.; Gonzalez, J.I.; Gimenez-Alba, I.M.; Zanon-Moreno, V.; Estruch, R.; Ramirez-Sabio, J.B.; Pascual, E.C.; et al. Genome-Wide Association Study for Serum Omega-3 and Omega-6 Polyunsaturated Fatty Acids: Exploratory Analysis of the Sex-Specific Effects and Dietary Modulation in Mediterranean Subjects with Metabolic Syndrome. Nutrients 2020, 12, 310. [Google Scholar] [CrossRef] [PubMed]
  12. Tan, S.X.; Zhou, T.; Wang, W.W.; Jin, Y.L.; Wang, X.Z.; Geng, X.; Luo, J.; Yuan, Z.H.; Yang, Y.J.; Shi, H.T.; et al. GWAS analysis using interspecific backcross progenies reveals superior blue catfish alleles responsible for strong resistance against enteric septicemia of catfish. Mol. Genet. Genom. 2018, 293, 1107–1120. [Google Scholar] [CrossRef] [PubMed]
  13. Yu, F.; Peng, W.Z.; Tang, B.; Zhang, Y.F.; Wang, Y.; Gan, Y.; Luo, X.; You, W.W.; Gwo, J.C.; Chen, N.; et al. A genome-wide association study of heat tolerance in Pacific abalone based on genome resequencing. Aquaculture 2021, 536, 736436. [Google Scholar] [CrossRef]
  14. Zhou, Z.X.; Han, K.H.; Wu, Y.D.; Bai, H.Q.; Ke, Q.Z.; Pu, F.; Wang, Y.L.; Xu, P. Genome-Wide Association Study of Growth and Body-Shape-Related Traits in Large Yellow Croaker (Larimichthys crocea) Using ddRAD Sequencing. Mar. Biotechnol. 2019, 21, 655–670. [Google Scholar] [CrossRef] [PubMed]
  15. Gutierrez, A.P.; Matika, O.; Bean, T.P.; Houston, R.D. Genomic Selection for Growth Traits in Pacific Oyster (Crassostrea gigas): Potential of Low-Density Marker Panels for Breeding Value Prediction. Front. Genet. 2018, 9, 391. [Google Scholar] [CrossRef]
  16. Zhao, J.; Bai, H.; Ke, Q.; Li, B.; Zhou, Z.; Wang, H.; Chen, B.; Pu, F.; Zhou, T.; Xu, P. Genomic selection for parasitic ciliate Cryptocaryon irritans resistance in large yellow croaker. Aquaculture 2021, 531, 735786. [Google Scholar] [CrossRef]
  17. Brondum, R.F.; Su, G.; Janss, L.; Sahana, G.; Guldbrandtsen, B.; Boichard, D.; Lund, M.S. Quantitative trait loci markers derived from whole genome sequence data increases the reliability of genomic prediction. J. Dairy Sci. 2015, 98, 4107–4116. [Google Scholar] [CrossRef]
  18. Dong, L.; Xiao, S.; Wang, Q.; Wang, Z. Comparative analysis of the GBLUP, emBayesB, and GWAS algorithms to predict genetic values in large yellow croaker (Larimichthys crocea). BMC Genom. 2016, 17, 460. [Google Scholar] [CrossRef]
  19. Chakraborty, S.; Saha, A.; Neelavar Ananthram, A. Comparison of DNA extraction methods for non-marine molluscs: Is modified CTAB DNA extraction method more efficient than DNA extraction kits? 3 Biotech 2020, 10, 69. [Google Scholar] [CrossRef]
  20. Du, X.; Fan, G.; Jiao, Y.; Zhang, H.; Guo, X.; Huang, R.; Zheng, Z.; Bian, C.; Deng, Y.; Wang, Q.; et al. The pearl oyster Pinctada fucata martensii genome and multi-omic analyses provide insights into biomineralization. GigaScience 2017, 6, gix059. [Google Scholar] [CrossRef]
  21. Chen, S.; Zhou, Y.; Chen, Y.; Gu, J. fastp: An ultra-fast all-in-one FASTQ preprocessor. Bioinformatics 2018, 34, i884–i890. [Google Scholar] [CrossRef] [PubMed]
  22. McKenna, A.; Hanna, M.; Banks, E.; Sivachenko, A.; Cibulskis, K.; Kernytsky, A.; Garimella, K.; Altshuler, D.; Gabriel, S.; Daly, M.; et al. The Genome Analysis Toolkit: A MapReduce framework for analyzing next-generation DNA sequencing data. Genome Res. 2010, 20, 1297–1303. [Google Scholar] [CrossRef]
  23. Li, H.; Durbin, R. Fast and accurate short read alignment with Burrows-Wheeler transform. Bioinformatics 2009, 25, 1754–1760. [Google Scholar] [CrossRef] [PubMed]
  24. Wang, K.; Li, M.; Hakonarson, H. ANNOVAR: Functional annotation of genetic variants from high-throughput sequencing data. Nucleic Acids Res. 2010, 38, e164. [Google Scholar] [CrossRef]
  25. Yang, J.A.; Lee, S.H.; Goddard, M.E.; Visscher, P.M. GCTA: A Tool for Genome-wide Complex Trait Analysis. Am. J. Hum. Genet. 2011, 88, 76–82. [Google Scholar] [CrossRef] [PubMed]
  26. Zhang, C.; Dong, S.S.; Xu, J.Y.; He, W.M.; Yang, T.L. PopLDdecay: A fast and effective tool for linkage disequilibrium decay analysis based on variant call format files. Bioinformatics 2019, 35, 1786–1788. [Google Scholar] [CrossRef]
  27. Purcell, S.; Neale, B.; Todd-Brown, K.; Thomas, L.; Ferreira, M.A.R.; Bender, D.; Maller, J.; Sklar, P.; de Bakker, P.I.W.; Daly, M.J.; et al. PLINK: A tool set for whole-genome association and population-based linkage analyses. Am. J. Hum. Genet. 2007, 81, 559–575. [Google Scholar] [CrossRef]
  28. Team, R. R: A Language and Environment for Statistical Computing. R Foundation for Statistical Computing, Vienna, Austria. Computing 2009, 14, 12–21. [Google Scholar]
  29. Bradbury, P.J.; Zhang, Z.; Kroon, D.E.; Casstevens, T.M.; Ramdoss, Y.; Buckler, E.S. TASSEL: Software for association mapping of complex traits in diverse samples. Bioinformatics 2007, 23, 2633–2635. [Google Scholar] [CrossRef]
  30. Alexander, D.H.; Novembre, J.; Lange, K. Fast model-based estimation of ancestry in unrelated individuals. Genome Res. 2009, 19, 1655–1664. [Google Scholar] [CrossRef]
  31. Hardy, O.J.; Vekemans, X. spagedi: A versatile computer program to analyse spatial genetic structure at the individual or population levels. Mol. Ecol. Notes 2002, 2, 618–620. [Google Scholar] [CrossRef]
  32. Loiselle, B.; Sork, V.; Nason, J.; Graham, C.; Loiselle, B.A.; Sork, V.L.; Nason, J.; Graham, C. Spatial genetic-structure of a tropical understory shrub, Psychotria Officinalis (Rubiaceae). Am. J. Bot. 1995, 82, 1420–1425. [Google Scholar] [CrossRef]
  33. Fan, S.; Wang, J.; Huang, G.; Liu, B.; Yu, D. Identification of twenty novel polymorphic microsatellite DNA markers from transcripts of the pearl oyster Pinctada fucata using next-generation sequencing approach. J. Genet. 2014, 93, e82–e85. [Google Scholar] [CrossRef] [PubMed]
  34. Dou, J.; Li, X.; Fu, Q.; Jiao, W.; Li, Y.; Li, T.; Wang, Y.; Hu, X.; Wang, S.; Bao, Z. Evaluation of the 2b-RAD method for genomic selection in scallop breeding. Sci. Rep. 2016, 6, srep19244. [Google Scholar] [CrossRef]
  35. Li, C.; Wang, J.; Song, K.; Meng, J.; Xu, F.; Li, L.; Zhang, G. Construction of a high-density genetic map and fine QTL mapping for growth and nutritional traits of Crassostrea gigas. BMC Genom. 2018, 19, 626. [Google Scholar] [CrossRef] [PubMed]
  36. Liu, X.; Liu, X.; Guo, X.; Gao, Q.; Zhao, H.; Zhang, G. A preliminary genetic linkage map of the Pacific abalone Haliotis discus hannai Ino. Mar. Biotechnol. 2006, 8, 386–397. [Google Scholar] [CrossRef]
  37. Shi, Y.H.; Kui, H.; Guo, X.M.; Gu, Z.F.; Wang, Y.; Wang, A.M. Genetic linkage map of the pearl oyster, Pinctada martensii (Dunker). Aquac. Res. 2009, 41, 35–44. [Google Scholar] [CrossRef]
  38. Li, Y.G.; He, M.X. Genetic Mapping and QTL Analysis of Growth-Related Traits in Pinctada fucata Using Restriction-Site Associated DNA Sequencing. PLoS ONE 2014, 9, 0111707. [Google Scholar] [CrossRef]
  39. Bentley, D.R. Whole-genome re-sequencing. Curr. Opin. Genet. Dev. 2006, 16, 545–552. [Google Scholar] [CrossRef]
  40. Balding, D.J. A tutorial on statistical methods for population association studies. Nat. Rev. Genet. 2006, 7, 781–791. [Google Scholar] [CrossRef]
  41. Yang, J.; Luo, S.; Li, J.; Zheng, Z.; Du, X.; Deng, Y. Transcriptome analysis of growth heterosis in pearl oyster Pinctada fucata martensii. FEBS Open Bio 2018, 8, 1794–1803. [Google Scholar] [CrossRef] [PubMed]
  42. Yu, Z.; Guo, X. Identification and mapping of disease-resistance QTLs in the eastern oyster, Crassostrea virginica Gmelin. Aquaculture 2006, 254, 160–170. [Google Scholar] [CrossRef]
  43. Myllyharju, J.; Kivirikko, K.I. Collagens, modifying enzymes and their mutations in humans, flies and worms. Trends Genet. 2004, 20, 33–43. [Google Scholar] [CrossRef]
  44. Liang, J.; Zheng, Z.; Huang, R.; Wang, Q.; Deng, Y.; Jiao, Y.; Du, X. Cloning and expression analysis of PmCOLVIA6 gene of Pinctada martensii. Genom. Appl. Biol. 2016, 35, 811–819. [Google Scholar]
  45. Bonaldo, P.; Russo, V.; Bucciotti, F.; Doliana, R.; Colombatti, A. Structural and functional features of the alpha 3 chain indicate a bridging role for chicken collagen VI in connective tissues. Biochemistry 1990, 29, 1245–1254. [Google Scholar] [CrossRef] [PubMed]
  46. Burg, M.A.; Tillet, E.; Timpl, R.; Stallcup, W.B. Binding of the NG2 proteoglycan to type VI collagen and other extracellular matrix molecules. J. Biol. Chem. 1996, 271, 26110–26116. [Google Scholar] [CrossRef] [PubMed]
  47. Doane, K.J.; Yang, G.; Birk, D.E. Corneal cell-matrix interactions: Type VI collagen promotes adhesion and spreading of corneal fibroblasts. Exp. Cell Res. 1992, 200, 490–499. [Google Scholar] [CrossRef]
  48. Heino, J. The collagen family members as cell adhesion proteins. Bioessays 2007, 29, 1001–1010. [Google Scholar] [CrossRef]
  49. Keene, D.R.; Engvall, E.; Glanville, R.W. Ultrastructure of type VI collagen in human skin and cartilage suggests an anchoring function for this filamentous network. J. Cell Biol. 1988, 107, 1995–2006. [Google Scholar] [CrossRef]
  50. Kuo, H.J.; Maslen, C.L.; Keene, D.R.; Glanville, R.W. Type VI collagen anchors endothelial basement membranes by interacting with type IV collagen. J. Biol. Chem. 1997, 272, 26522–26529. [Google Scholar] [CrossRef]
  51. McDevitt, C.A.; Marcelino, J.; Tucker, L. Interaction of intact type VI collagen with hyaluronan. FEBS Lett. 1991, 294, 167–170. [Google Scholar] [CrossRef] [PubMed]
  52. Pfaff, M.; Aumailley, M.; Specks, U.; Knolle, J.; Zerwes, H.G.; Timpl, R. Integrin and Arg-Gly-Asp dependence of cell adhesion to the native and unfolded triple helix of collagen type VI. Exp. Cell Res. 1993, 206, 167–176. [Google Scholar] [CrossRef] [PubMed]
  53. Wiberg, C.; Klatt, A.R.; Wagener, R.; Paulsson, M.; Bateman, J.F.; Heinegard, D.; Morgelin, M. Complexes of matrilin-1 and biglycan or decorin connect collagen VI microfibrils to both collagen II and aggrecan. J. Biol. Chem. 2003, 278, 37698–37704. [Google Scholar] [CrossRef]
  54. Zheng, X.C.; Zhang, L.; Jiang, W.B.; Abasubong, K.P.; Zhang, C.Y.; Zhang, D.D.; Li, X.F.; Jiang, G.Z.; Chi, C.; Liu, W.B. Effects of dietary icariin supplementation on the ovary development-related transcriptome of Chinese mitten crab (Eriocheir sinensis). Comp. Biochem. Phys. D 2021, 37, 100756. [Google Scholar] [CrossRef] [PubMed]
Figure 1. Heat map of trait correlations.
Fishes 08 00296 g001
Figure 2. Principal component analysis of six growth-related traits of P. fucata. PC1, PC2, and PC3 accounted for 13.8% of the total variance.
Fishes 08 00296 g002
Figure 3. Manhattan plots of six growth-related traits. The red line in the Manhattan plots of six growth-related traits represents the genome-wide significance threshold (-log10(1e − 6) = 6), and the dotted line indicates the mean chromosome-wide significance threshold (-log10(3.67541e − 08) = 8.57).
Fishes 08 00296 g003
Figure 4. Linkage disequilibrium (LD) decay in the experimental group.
Fishes 08 00296 g004
Figure 5. The KEGG annotation pathway.
Fishes 08 00296 g005
Table 1. Descriptive statistics of six growth-related traits.
TraitNMeanSDMaxMinCV
Shell length (sl, mm)6057.888.4870.6846.6414.65
Shell width (SW, mm)6020.392.0025.0216.699.80
Shell height (sh, mm)6060.108.1275.0648.2213.52
Total weight (tw, g)6026.448.2439.7515.1231.20
Shell weight (sw, g)6013.384.0420.537.4730.20
Soft tissue weight (stw, g)6013.054.4122.695.9233.80
N, number of samples; Min, minimum; Max, maximum; SD, standard deviation; CV, coefficient of variation.
Table 2. The statistics of growth-related traits between two groups.
GroupsslSWshtwswstw
L65.85 ± 3.44 a21.97 ± 1.3567.81 ± 2.89 a34.15 ± 3.40 a17.14 ± 1.84 a17.01 ± 2.26
S49.92 ± 1.79 b18.81 ± 1.0752.39 ± 1.73 b18.73 ± 1.8 b9.63 ± 0.80 b9.10 ± 1.44
p-value0.0040.1660.030.00010.0010.075
The rows’ letters represent significant differences (p-value < 0.05). Results are articulated as the mean ± standard error (M ± SE). Significant disparities exist between values not having the same superscripts.
Disclaimer/Publisher’s Note: The statements, opinions and data contained in all publications are solely those of the individual author(s) and contributor(s) and not of MDPI and/or the editor(s). MDPI and/or the editor(s) disclaim responsibility for any injury to people or property resulting from any ideas, methods, instructions or products referred to in the content.

