Article

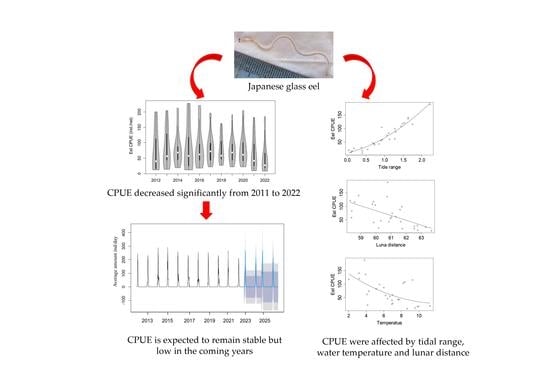
Temporal Pattern of the Occurrence of Japanese Glass Eels (Anguilla japonica) in the Pearl River Estuary

1
Pearl River Fisheries Research Institute, Chinese Academy of Fishery Sciences, Guangzhou 510380, China
2
Key Laboratory of the Pearl River Estuary Regulation and Protection of Ministry of Water Resources, Pearl River Hydraulic Scientific Research Institute, Guangzhou 510611, China
3
Key Laboratory of Ecological Environment and Resources of Inland Fisheries, Freshwater Fisheries Research Center, Chinese Academy of Fishery Sciences, Wuxi 214081, China
*
Author to whom correspondence should be addressed.
Fishes 2023, 8(5), 256; https://doi.org/10.3390/fishes8050256
Submission received: 10 April 2023 / Revised: 4 May 2023 / Accepted: 8 May 2023 / Published: 11 May 2023
(This article belongs to the Special Issue Biology and Ecology of Eels)

Abstract

:
Japanese eels (Anguilla japonica) are a typical migratory fish species with high commercial importance. The Pearl River estuary in southern China is an important natural growing ground for Japanese glass eels, but limited information on Japanese glass eel population characteristics is available, despite their ecological importance. In this paper, we examined the annual patterns of the occurrence of Japanese glass eels in the Pearl River estuary from 2011 to 2022. The most frequently occurring Japanese glass eel’s total length is 5.3 cm. The collecting period extended from December to February, and the collection catch-per-unit-effort (CPUE) decreased significantly from 2011 to 2022. The generalized linear model (GLM) indicated that daily changes in Japanese glass eel collection were significantly affected by tidal range, water temperature, and lunar distance. The catch peak appeared when the tidal range rose to 1.7 m, and the water temperature dropped below 8 °C on the full moon days. Overall CPUE analysis showed no significant periodic and inter-annual variability in the period 2011–2022, with the ARIMA model suggesting that the CPUE is expected to remain stable but low in the coming years (2023–2026), although recruitment ultimately depends on the overall spawning stock.
Key Contribution: A low but stable abundance of glass eels was recorded in the Pearl River estuary over the period 2001–2022. The collection catch-per-unit-effort (CPUE) decreased significantly. Daily changes in Japanese glass eel collection were significantly affected by tidal range, water temperature, and lunar distance.

Graphical Abstract

1. Introduction

Global fishery resources are being increasingly threatened by environmental stressors and habitat deterioration, which result from various human activities [1,2,3]. Migratory fishes, in particular, are facing increased human threats worldwide (such as loss of habitat and the obstruction of migration pathways) that affect their migration and population characteristics. Thus, understanding migration dependency, including the number of offspring ultimately contributing to population regeneration, is essential to clarify population replenishment mechanisms and is crucial for refining the stock protection of Anguilla species [4,5,6].
The Japanese eel is widely distributed throughout East Asia, from south-eastern China, Korea, and North to the Pacific coast of the Hokkaido Island of Japan [7]. Japanese eels migrate to their fixed spawning grounds (at the southern West Mariana Ridge) [8,9] after reaching sexual maturity. After hatching, the Japanese glass eels (called leptocephali) are transported by the westward North Equatorial Current (NEC) and the northward Kuroshio Current toward the continental shelf, where they metamorphose into glass eels, becoming pigmented elvers in estuaries [10,11]. However, the Japanese eels have sharply dropped in many different regions due to overfishing (including growth overfishing and recruitment overfishing) and habitat loss [12,13,14]. The Japanese eel (Anguilla japonica) is an occasional species in the Pearl River water system, from the estuary to the upper reaches of the Hongshuihe River.
The Japanese eel is considered to be a luxury food in China. Thus, it is an important aquaculture species with high commercial importance due to its palatability and resulting popularity with consumers. China is one of the largest aquaculture and export countries of Japanese eel in the world. The annual output of Japanese eel in China is about 220,000 tons, accounting for about 70% of the world’s total output, and thus, this species supports an important fishery industry in China [15].
However, artificial breeding technologies for this species have not yet been established due to their complicated life cycle, although some success has been achieved recently [16,17]. The glass eels required for aquaculture are all dependent on the exploitation of wild resources, which has led to unsustainable glass eel fishing patterns in different Asian estuaries and coastal waters [18]. As a result, continuous high-pressure seedling fishing has led to further depletion of the natural Japanese glass eel population. Wild populations have drastically decreased, or disappeared completely, from most estuaries since the 1960s [12,19,20]. Since approximately 2010, annual recruitment has decreased by as much as 90% compared to catches in the 1960s. Japanese eel has also been listed as endangered on the International Union for Conservation of Nature (IUCN) Red List of Threatened Species [21].
As Japanese eel resources continue to diminish in aquatic ecosystems worldwide, it is necessary to understand the recruitment dynamics and the environmental factors that affect the annual abundance of Japanese eels. Obtaining such knowledge is a crucial step towards effectively managing, conserving, and restoring Japanese eel resources. Local monitoring of annual glass eels arrivals is an essential step to understanding the recruitment trend.
The Pearl River estuary is characterized by an average annual temperature of 23 °C, with diverse and abundant aquatic resources, and is an important pathway for glass eels to enter the Pearl River for their continental life phase [22]. However, the Pearl River estuary has experienced numerous anthropogenic disturbances due to the massive increase in the human population and overexploitation of the coastline. Such disturbances are known to negatively impact the upstream migration of glass eels [18]. However, research on glass eels in the Pearl River estuary is scarce, with few studies reported on their populations in local journals [18].
Therefore, based on an 11-year survey of the Pearl River estuary from 2011 to 2022, the purpose of this study was to (1) identify the temporal pattern of the occurrence of glass eels in the Pearl River estuary; (2) detect the relationships between abiotic factors and the CPUE of glass eels; and (3) describe future migration trends of Japanese glass eel in the Pearl River Estuary for this species to achieve early management knowledge using advanced mathematical methods. The main objective of this study was to improve the understanding of the recruitment patterns of glass eels in the Pearl River estuary and put forward targeted conservation strategies to ultimately contribute to the sustainable use of this species.

2. Materials and Methods
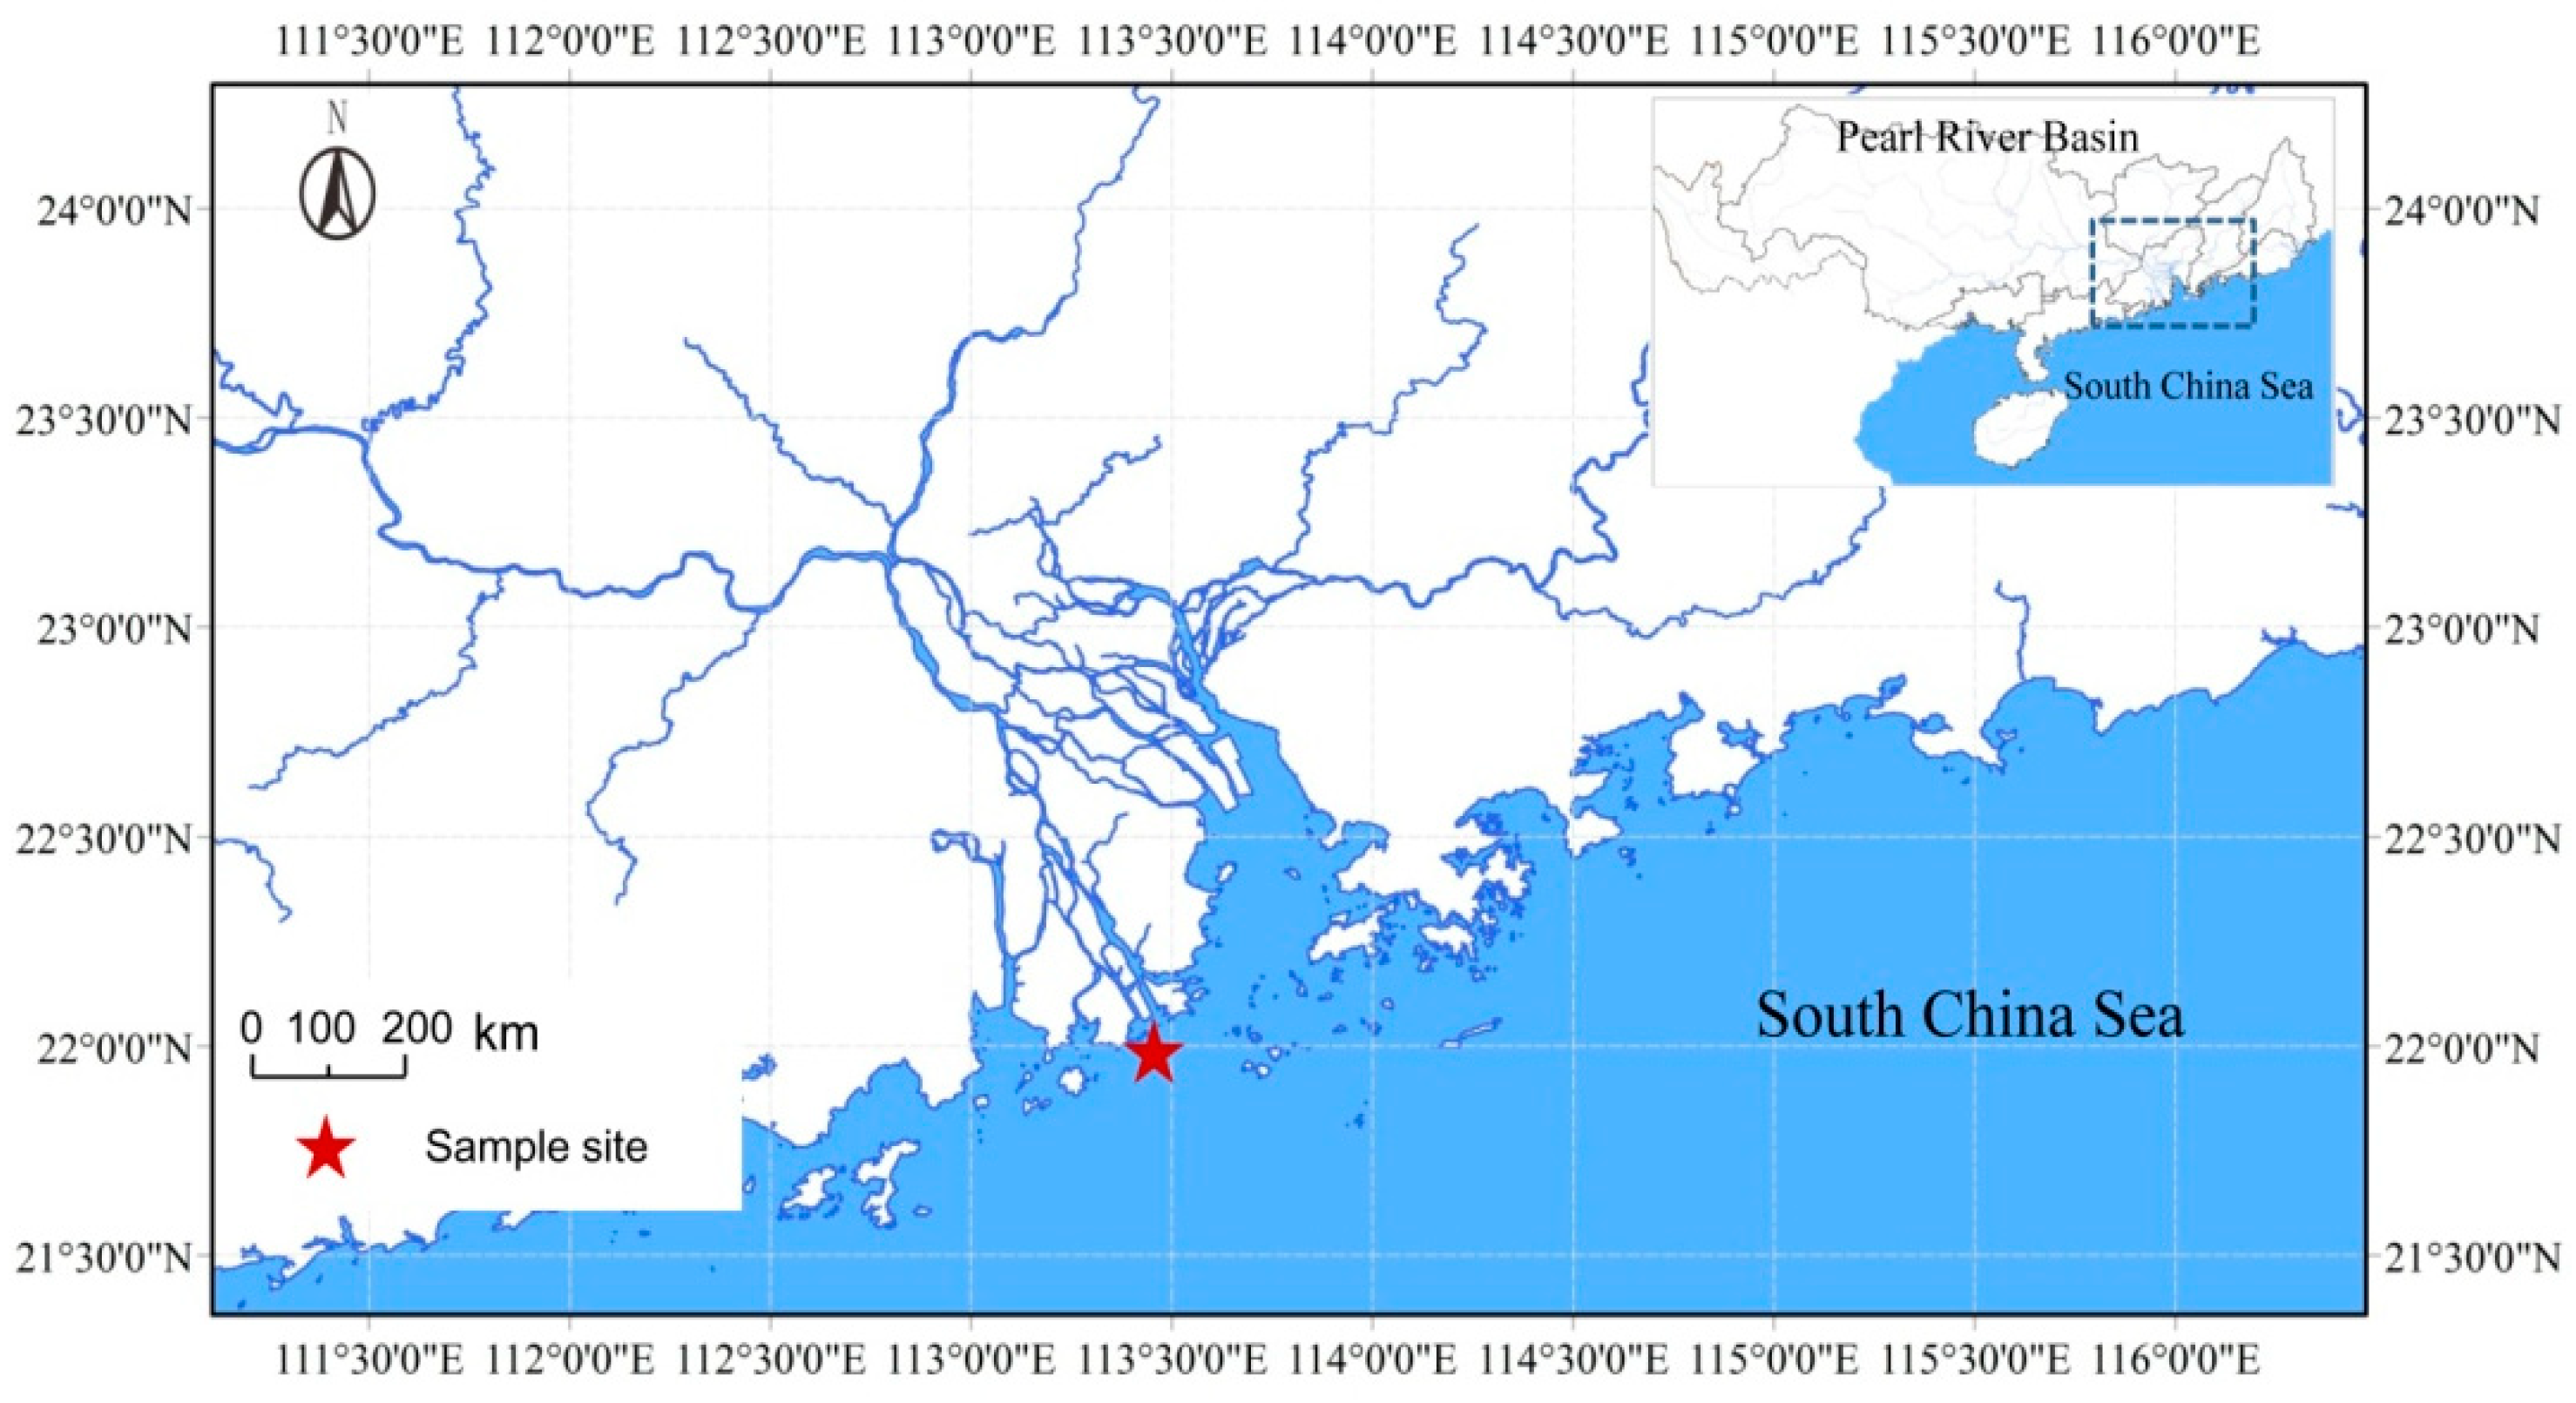
2.1. Study Site

Our study site was located in a traditional Japanese glass eel collecting zone of the Pearl River estuary in Jiwan District, Zhuhai (21°59′52″ N, 113°28′31″ E) (Figure 1). This area is an important pathway for glass eels to migrate upstream to the Pearl River for their continental life phase. The study site is also characterized by an irregular semidiurnal tidal cycle, experiencing two ebb and two flood tides each day, with a tidal range of 0.95–3.41 m.

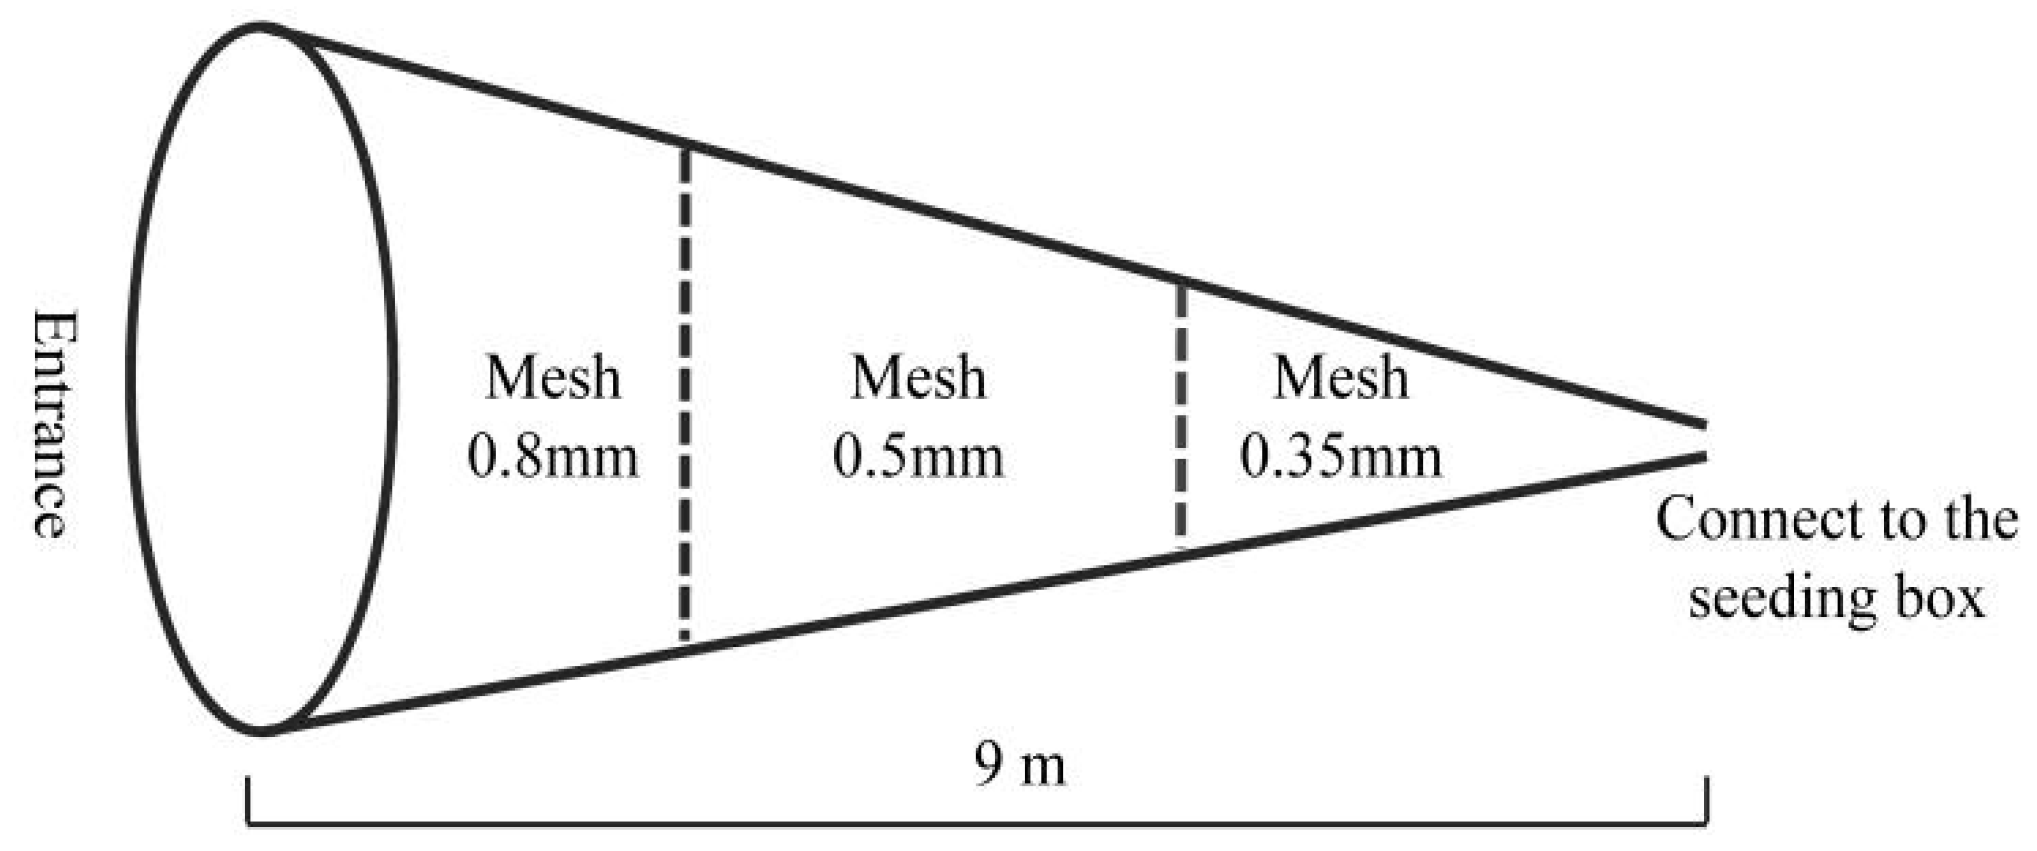
2.2. Data Collection

Japanese glass eel samples were collected from the study site during the migration season (from 1 December to 28 February) from 2011 to 2022 using a custom-made set net. The fixed set net was made of polyethylene thread and was in the shape of a tapered, gradually shrinking from the net mouth to the rear end. The net was 9 m long and consisted of three sections with different mesh sizes (from the entrance to the Japanese glass eel-collecting box, mesh 0.8 mm, 0.5 mm, and 0.355 mm were used, respectively). The tail end of the net mouth was connected with a floating seedling collecting box (Figure 2). The net mesh of the seedling collecting box was made of 0.25 mm mesh. This type of net is widely used in southern China to catch glass eels. Two expanded polystyrene floats were installed at the net mouth so that the net mouth was always oriented to face toward the current, and the fishing efficiency was the same during the ebb and flood tide. The fishing depth varied according to the state of the tide but was usually midwater, ranging from 0.5–1.2 m below the surface, as tidal currents flowed past due to the upward buoyancy of the expanded polystyrene floats.
Because Japanese glass eel migration occurs nearly exclusively at night with the rising tide [7], surveys were conducted on a rising tide at night. For each year of the study, the net was set 2 h before high water in the early evening, with the nets fishing until the tide turned to ebb every day.
The collected individuals were immediately measured for their total length (TL, to the nearest 1 mm) and wet body weight (BW, to the nearest 1 mg) on the day they were harvested. The catch depends on how much water passes through the net. At a constant abundance with high current speed, the catch will be large. With the same abundance and lower current speed, the catch will be lower. Thus, the CPUE of Japanese glass eel was quantified as the average number of individuals collected per net each day over a full moon cycle in this study. This will lead to a relatively constant and comparable effort and can be a useful measurement of changes in the abundance of Japanese glass eel over longer time periods, thus stably reflecting the long-term time series data for glass Japanese recruitment in this location, allowing us to compare and assess the time series of recruitment in south China.
We used a method for the staging of the glass eels according to Tesch and White (2008) [23] and Fukuda et al. (2013) [24]. That is, the glass eel stage has the following characteristics: pigmentation on top of the brain, the surface behind the eyes, the anterior surface reaches the eyes, rostral pigment develops to post brain, clear preanal development of mediolateral pigment, postanally over almost entire dorsum, mediolateral pigment reaches middle of the tail, clear development of preanal ventrolateral pigmentation. The elver stage has the following characteristics: Pigment rows along the myosepta are becoming indistinct, the lateral line is still recognizable, the individual melanophores on the head, behind and below the eyes, and the lower jaw are becoming indistinct.
Tide level (m) data were collected from http://global-tide.nmdis.org.cn// (accessed on 14 May 2022). In this analysis, we used the tidal level range data, which were the differences between the highest and the lowest tidal level values on each day. Dissolved oxygen (DO, mg∙L−1), pH, chemical oxygen demand (COD, mg∙L−1), inorganic nitrogen (IN, mg∙L−1), active phosphate (AP, mg∙L−1) and petroleum oil (Oil, mg∙L−1) were selected as water quality parameters of the local habitat, and the data were collected from https://www.mee.gov.cn/ (accessed on 20 May 2022). River discharge (m3/s) data were obtained through automatic measurement at a gauging station from the Information Center of the Ministry of Water Resources (available at http://xxfb.mwr.cn/index.html) (accessed on 22 May 2022). Salinity levels (mg∙L−1) were converted from the water chlorine content, and the conversion formula was: Salinity = 1.81 × Chlorine content. Water chlorine content (mg∙L−1) and water temperature (T, °C) were determined by a real-time online chlorine ion detector and a real-time online temperature detector (MADSUR -B6710Cl).
We also analyzed the effect of the lunar distance on the CPUE of glass eels. The lunar distance is the distance between the moon and the earth, represented by the units of earth radii, referring to the moon’s perigee (at about 56 earth radii) and apogee (at about 63.8 earth radii). Lunar distance data were collected from the lunar package of the R language. All environment data were organized on a 1-day basis to match the Japanese glass eel collecting time.
The glass eel migration period was defined as the interval in days between the first day that a Japanese glass eel was collected and the last day that a Japanese glass eel was collected in a given year. The date of maximum yield was defined as the date on which the most glass eels were collected each year. We used Spearman rank correlation to evaluate the changes in the CPUE and arrival season each year.

2.3. Data Analysis

A generalized linear model (GLM) was used to assess how environmental factors impact the CPUE of glass eels by selecting the CPUE of glass eels as an independent variable and selecting the tidal range, salinity, DO, pH, COD, IN, AP, Oil, temperature, and lunar distance as response variables. As glass eels are only active at night, GLM analyses were only performed for the night during the main periods of Japanese glass eel entrance in the Pearl River estuary each studied year. Multi-collinearity among environmental factors was tested based on variance-inflation (VIF) < 5, and the model was optimized to: glass eels CPUE ~ log10Salinity + tide range + lunar distance + pH + DO + COD + IN + AP + Oil + Temperature.

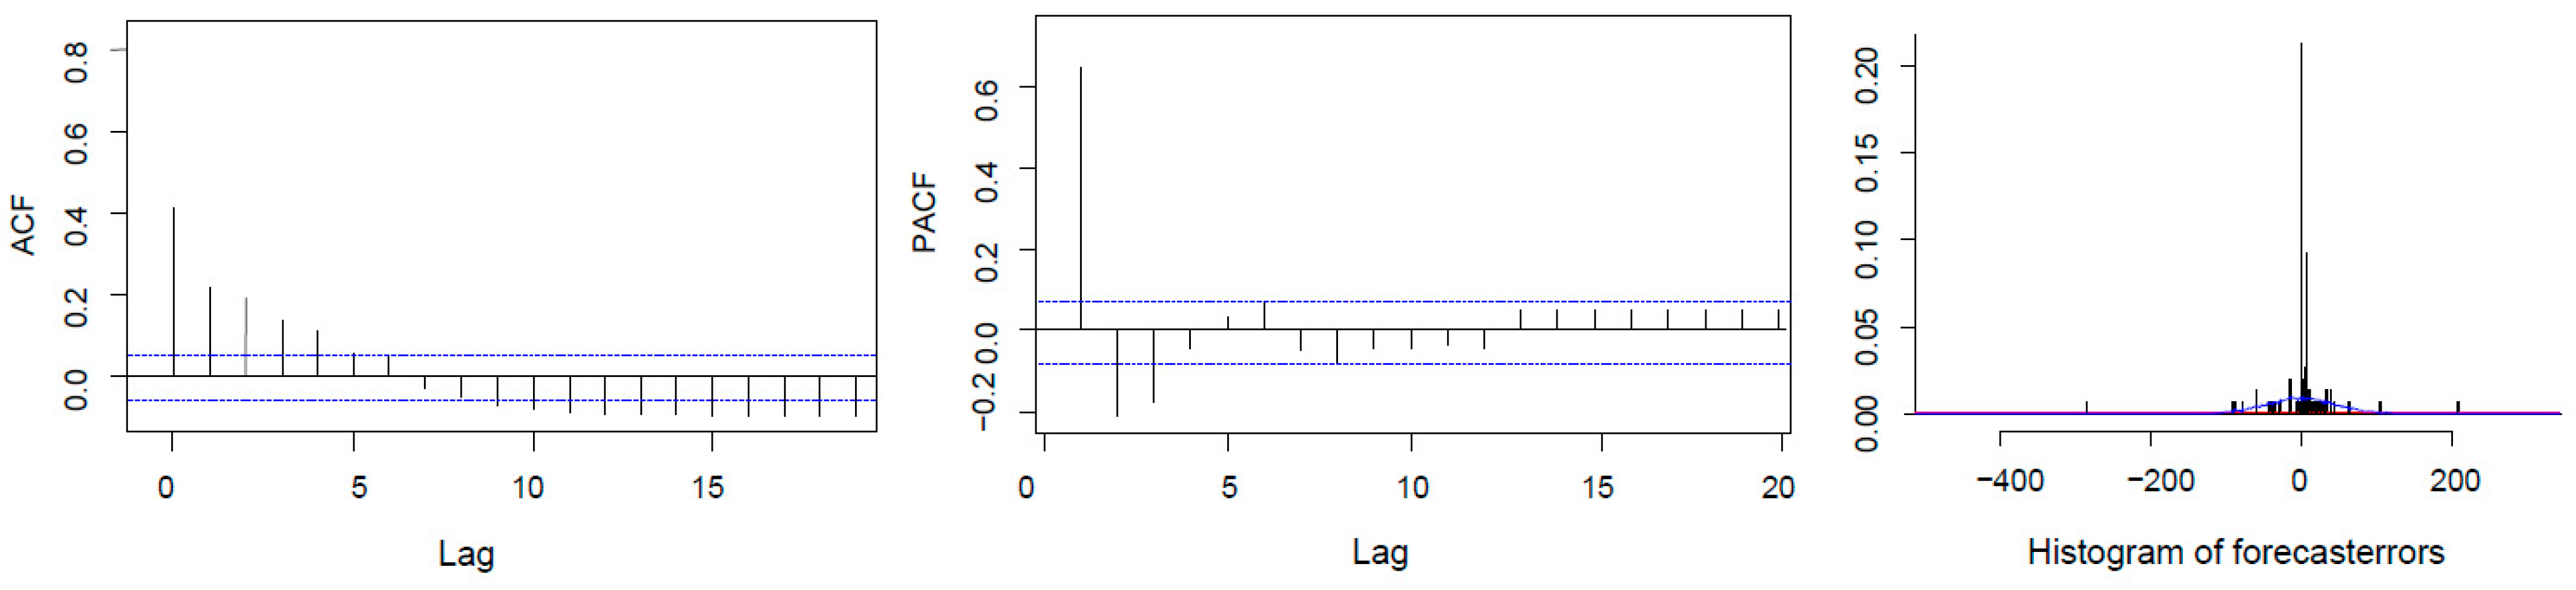
2.4. Time Series Analyses

The Auto Regressive Integrated Moving Average (ARIMA) model is the most general class of model for forecasting a time series [25]. ARIMA can be viewed as a “filter” that tries to separate the signal from the noise, and the signal is then extrapolated into the future to obtain forecasts. ARIMA is based on the assumption that the response series is stationary; that is, the mean and variances of the series are independent of time. It can provide more accurate projections than the ones obtained using weights. The ARIMA model is particularly suitable for predicting nonlinear data and can provide accurate operational forecasts of annual commercial catches. Thus, this model has been an important tool for forecasting fish populations for decades [26].
In this study, we employed a seasonal ARIMA model to analyze the complex Japanese glass eel data that were characterized by an obvious seasonality and non- linear regression. The seasonal ARIMA models were ARIMA(p,d,q) (P,D,Q)m, where p indicates the autoregressive (AR) order, d is the value of differencing orders, q is the moving average (MA) order, and P, D, and Q indicate the seasonal order of AR, differencing, and MA, respectively [26,27].
We differentiated the series until it was stationary. The seasonality period was 52. The Japanese glass eel data were not stationary and presented a high degree of seasonality. Therefore, the series was decomposed separately into the trend effect, seasonal effects, and random variability. We selected the appropriate AR and MA order based on the Autocorrelation function (ACF) and Partial Autocorrelation Function (PACF) [26], and selected the most appropriate prediction model based on the smallest Akaike’s Information Criterion (AIC) value.
Autocorrelation is the correlation between a time series and the same time series lag. ACF measures the amount of linear dependence between observations in a time series. While partial autocorrelations are the correlation coefficients between the basic time series and the same time series lag, PACF gives an unrestricted parametrization and represents the plot of partial coefficients of correlation of time series and lags of itself. Both ACF and PACF are commonly used in evaluating a time series variable’s dependency on its past. The number of AR and MA terms of the stationary time series is determined by examining the patterns of the graphs of ACFs and PACFs. The confidence limits are provided when ACF or PACF are significantly different from zero [26].
Akaike information criterion is defined as AIC = nlog(MSE) + 2k, where n is the sample size, MSE is the mean square error, and k is the total number of estimable parameters. It provides guidelines for choosing the best possible model from a set of competing models. The established model should be parsimonious and use as few model parameters as possible so that the model fulfills all the diagnostic checks [28]. Hence, the model with minimum AIC is closer to the best possible choice, and the minimum AIC is selected as the optimal model fit to a given data. The sample autocorrelation function (ACF) and partial autocorrelation function (PACF) are useful qualitative tools to assess the presence of autocorrelation at individual lags. The Ljung–Box test is a more quantitative way to test for autocorrelation at multiple lags jointly. In this study, the Ljung Box test was mainly used to evaluate the assumptions of ARIMA models to ensure that the residuals are independent of each other.
Because the samples were collected over two years (December of the previous year, January and February of the following year), we classify the samples collected in the previous year into the next year and take them as the number of samples in the next year when making ARIMA predictions. For example, the samples collected in December in the year 2011 are classified as 2012 samples. All analyses were performed using R 4.1.13 Software [28]. Variables were considered statistically significant at p ˂ 0.05.

3. Results

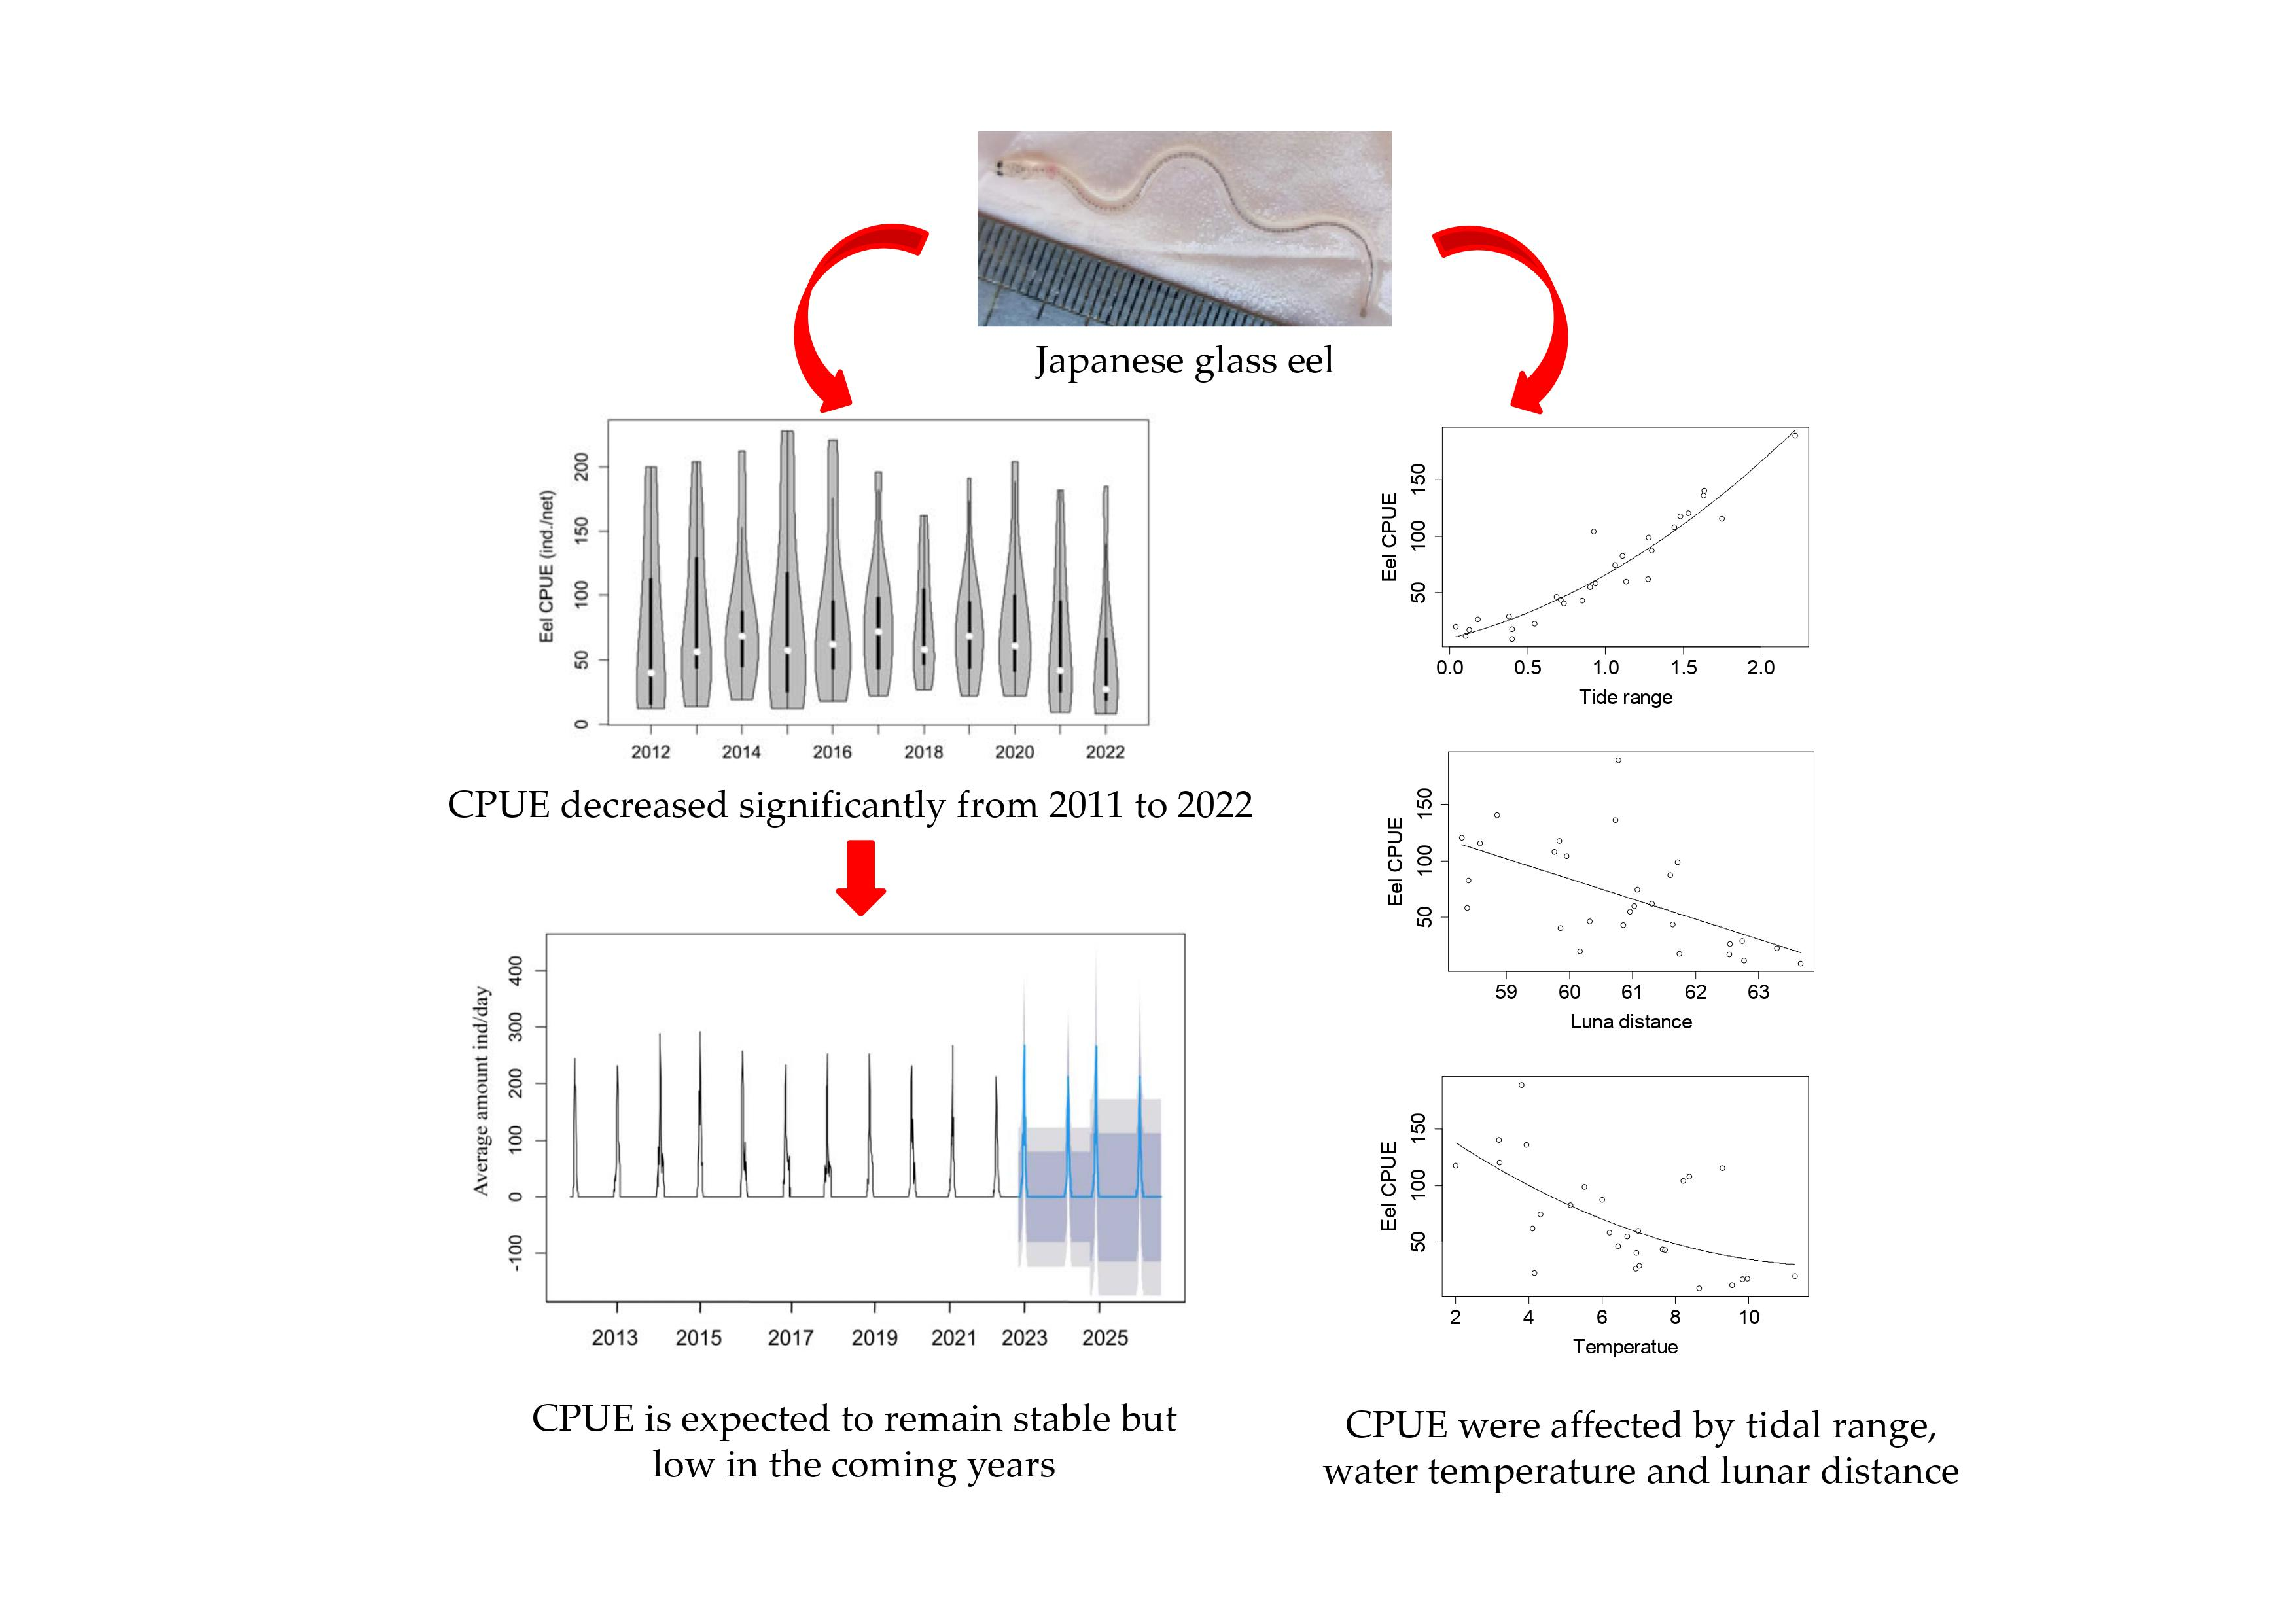
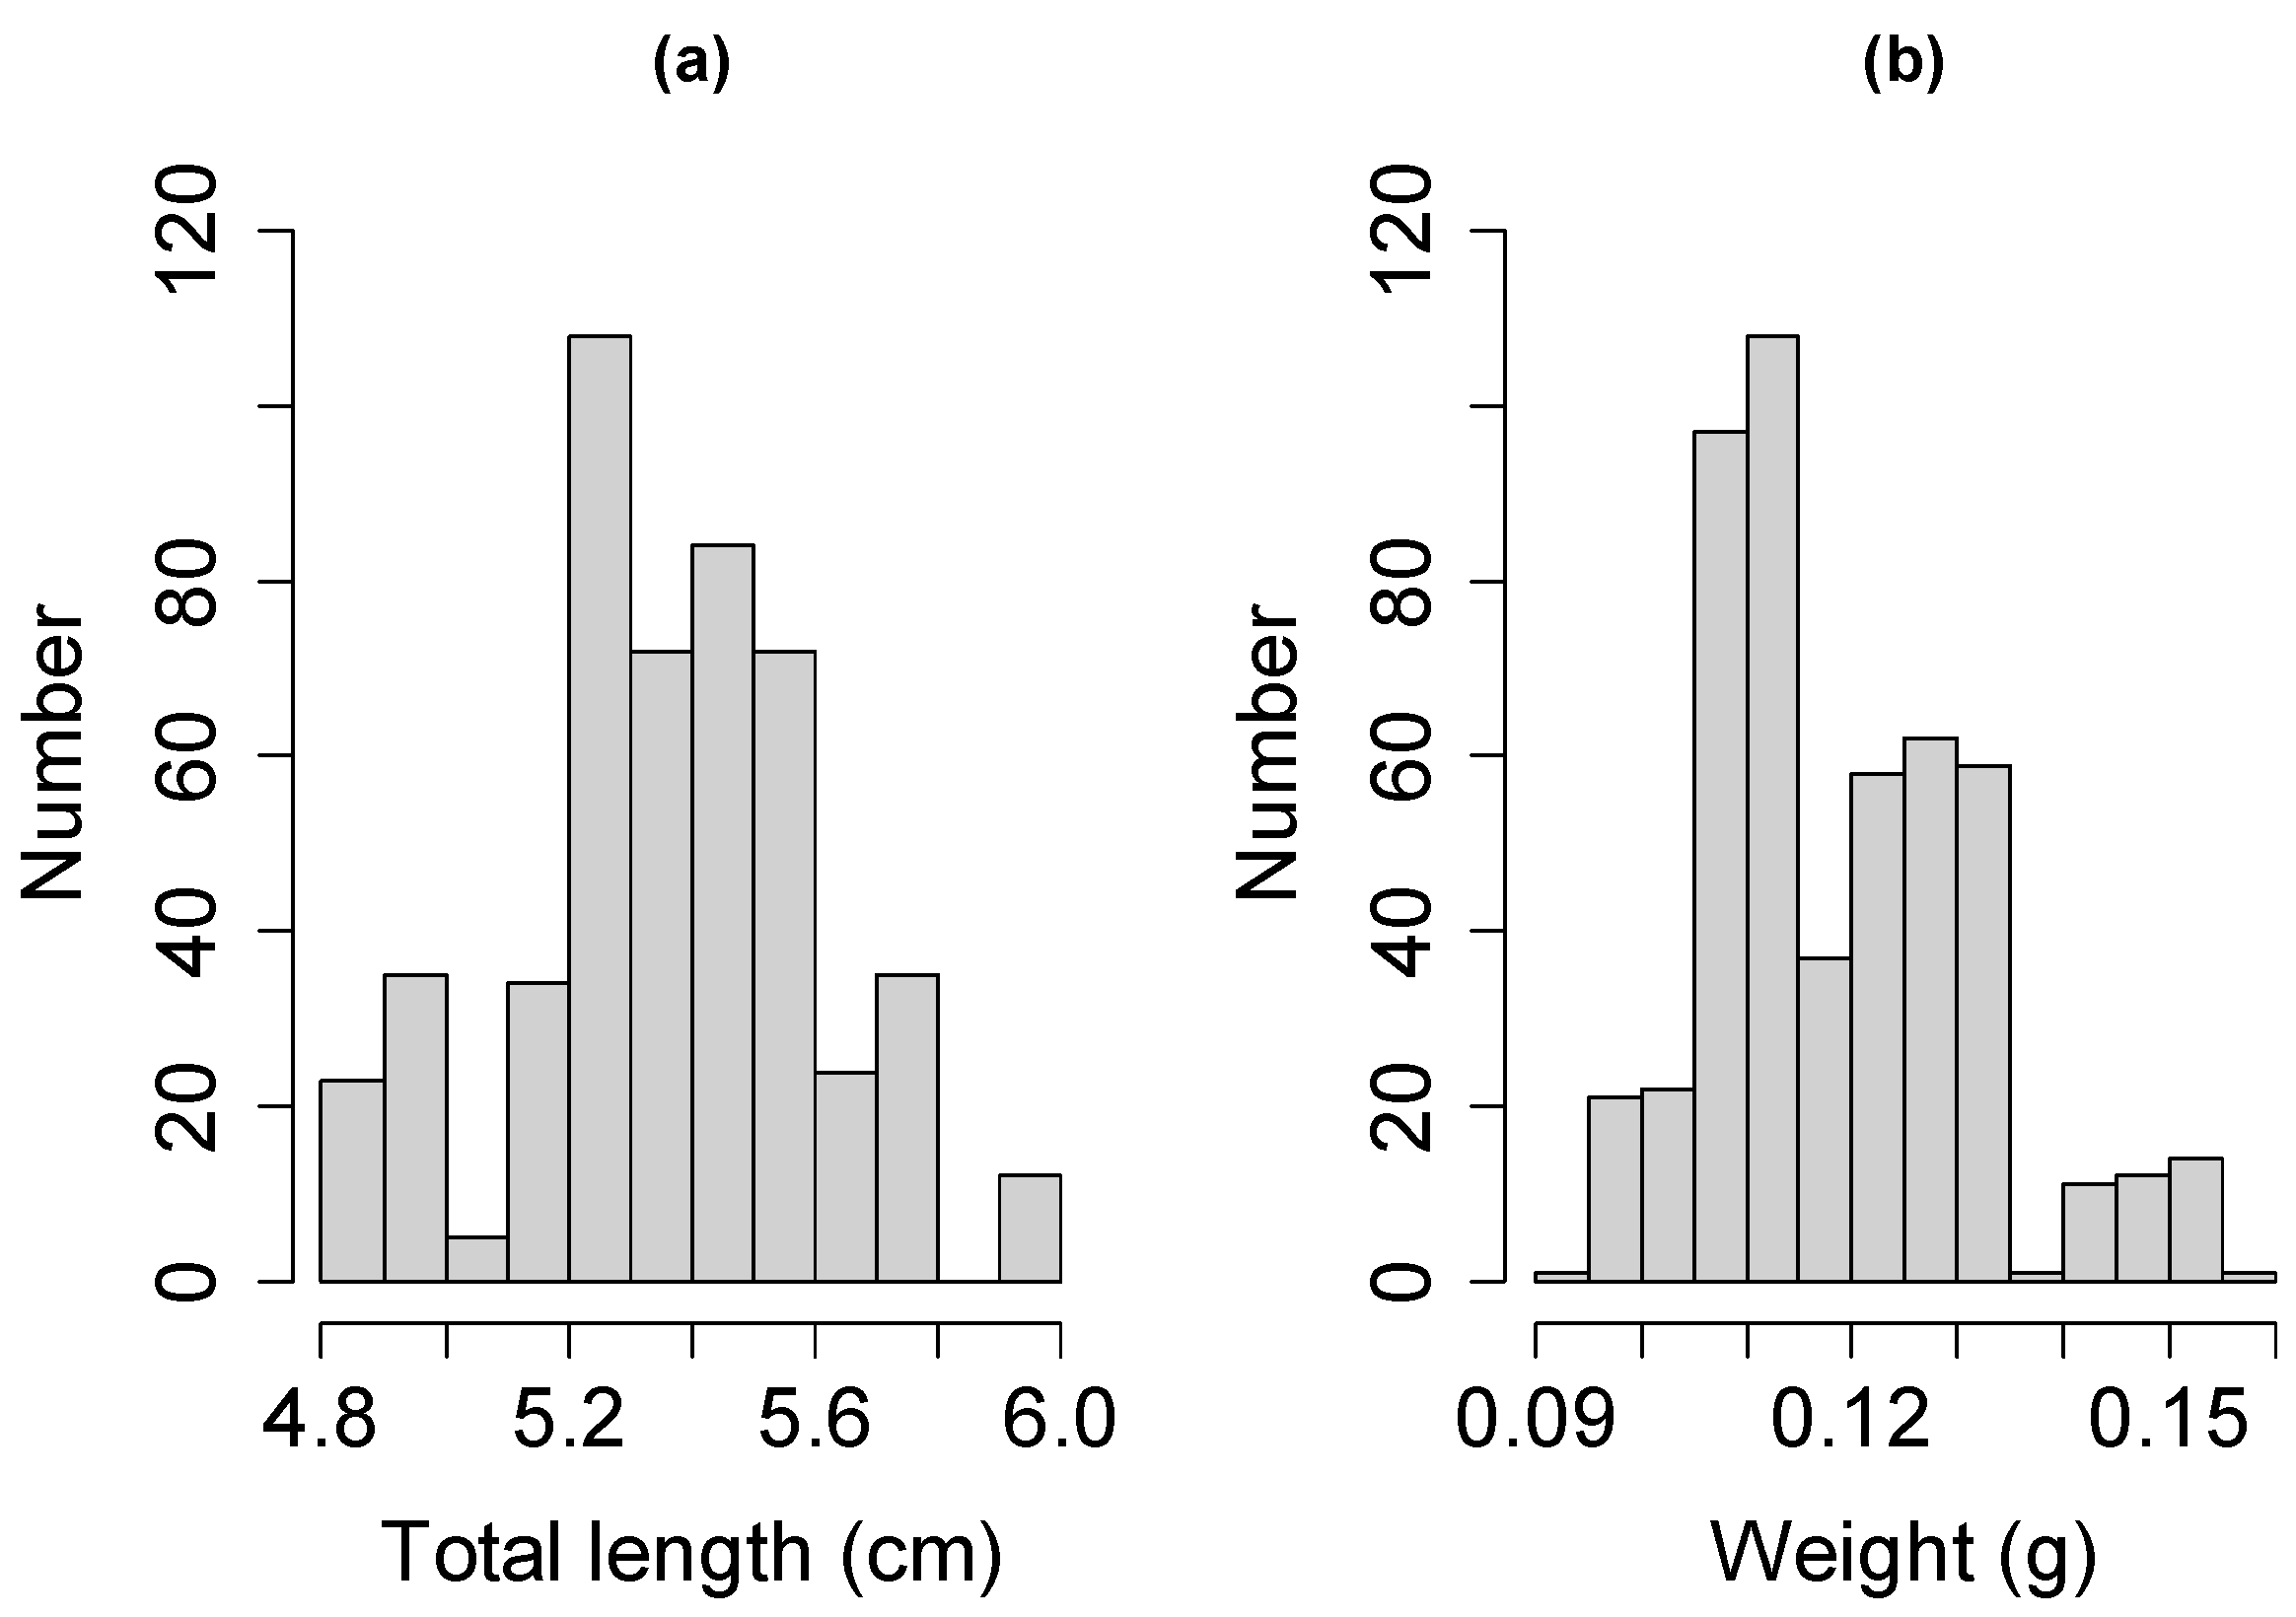
3.1. Population Characteristics of Glass Eels

A total of 42,974 individual glass eels were sampled during the present study. The glass eels collected in our sample ranged in size from 4.8 to 6.0 TL cm with a mean of 5.4 ± 0.3 cm (SE; Figure 3a). The most frequently occurring Japanese glass eel size was 5.3 cm. Weight ranged from 0.092 to 0.157 g, with a mean of 0.119 ± 0.02 g (SE; Figure 3b). The most frequently occurring Japanese glass eel weight is 0.11 g. The body color was transparent and not easy to observe with the naked eye, although the pigment began to appear (Figure 4). It can be inferred that the collected glass eels are between glass eels and elver eels.
Based on the data collected between 2011 and 2022, there was a recurring pattern and steady seasonality within each year. The collection period of glass eels in the Pearl River estuary extended from December of the previous year to February of the subsequent year. The earliest occurrence of glass eels was on 20 December 2021, and the latest was on 5 March 2014. The annual catch of glass eels in each net fluctuated substantially, ranging from 8014 individuals in 2013 to 2256 in 2019. The peak catches lasted for about 15 days, primarily from 10 January to 30 January, and the daily catch remained high (>200 individuals per net). The CPUE of glass eels collected among these peak days accounting for more than 50% of the total amount collected in the whole year. In addition, low catches always appeared toward the start or end of the fishing season, and it appeared that the tidal range had less influence on Japanese glass eel catches during those times. Japanese glass eel CPUE varied significantly from year to year (Figure 5). The CPUE decreased significantly from 2011 to 2022 (Spearman’s rho, one-tailed, p = 0.03).

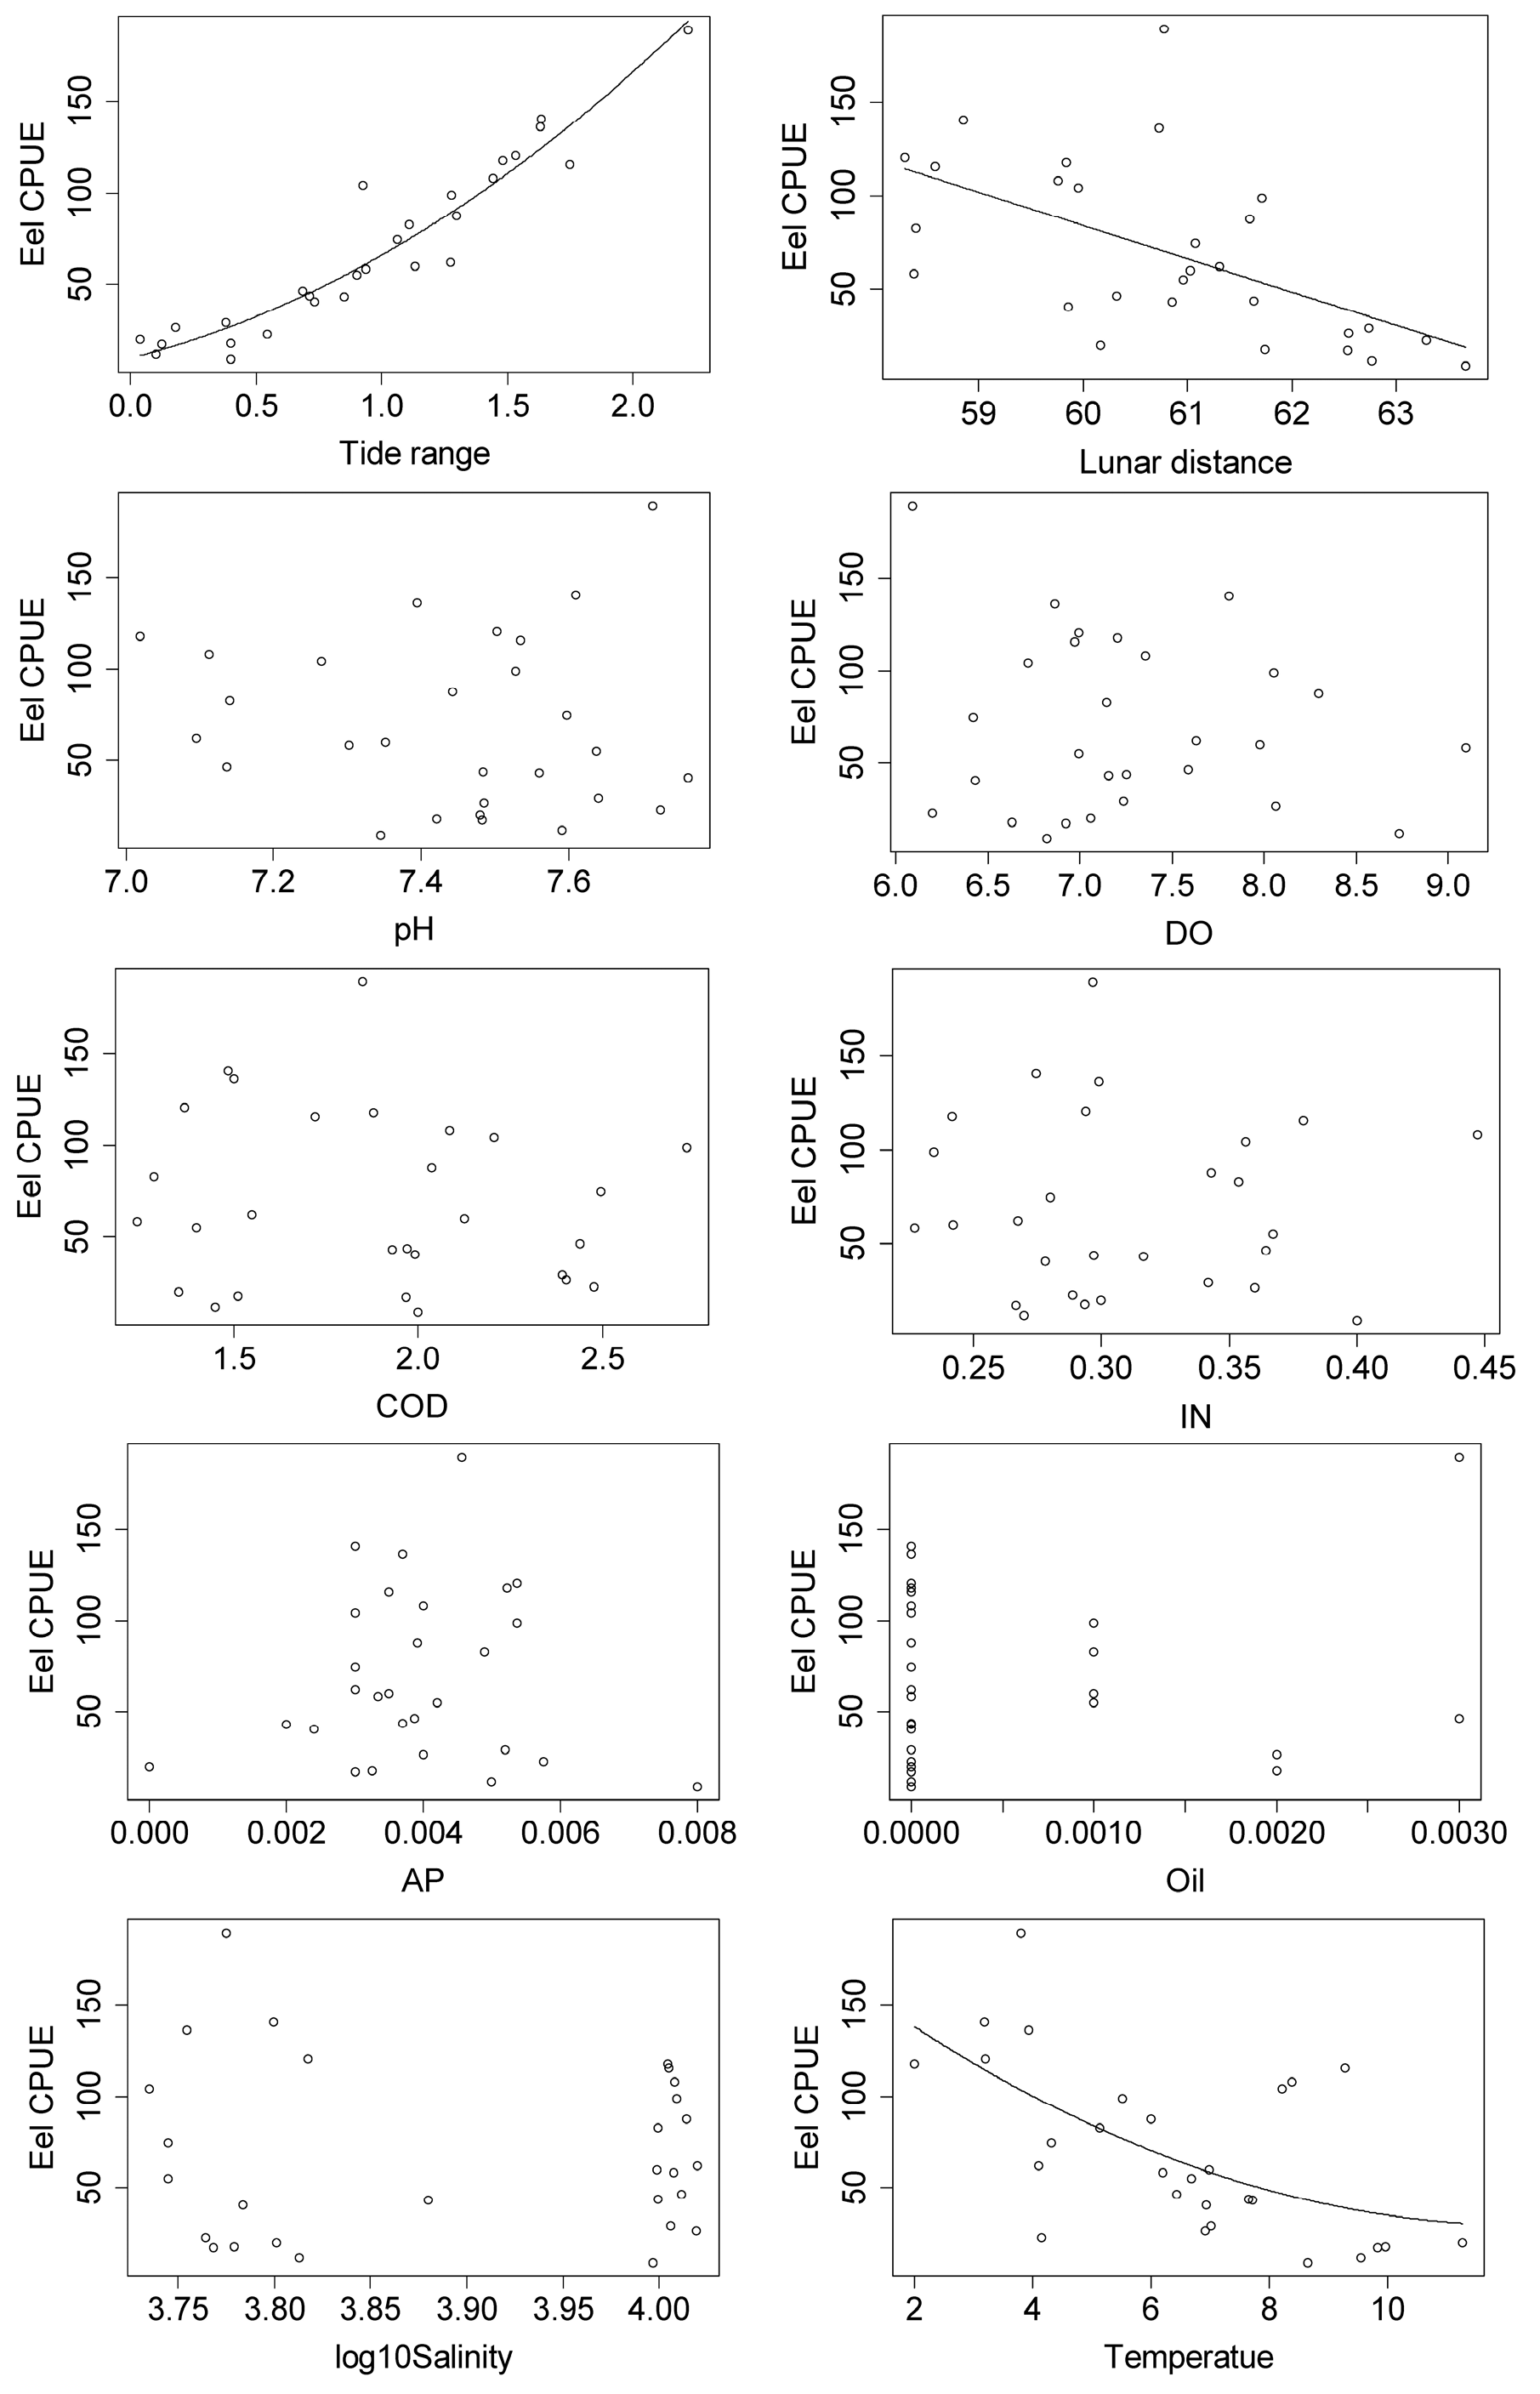
3.2. Relationships between Japanese Glass Eel CPUE and Environmental Factors

The GLM model showed that the CPUE was significantly affected by the tidal range (p = 0.044), water temperature (p < 0.001), and lunar distance (p = 0.037), while the impact of other environmental factors (including local water quality; i.e., salinity, DO, pH, COD, inorganic nitrogen, active phosphate, and Oil) was not significant (Figure 6). Thus, tidal range, water temperature and lunar distance contributed to the CPUE of glass eels in the Pearl River estuary.
The study revealed that the catch peak often occurred with a sharp rise in the tidal range when it was close to 1.7 m. The lunar distance was also a significant variable, showing a negative relationship with CPUE. Thus, there will be a large number of glass eels on the full moon days with smaller lunar distances in the Pearl River estuary. Water temperature also exhibited a negative relationship with Japanese eel CPUE. When the water temperature was below 8 °C, glass eels were collected in large numbers (more than 50 individuals per net per day) (Figure 6).

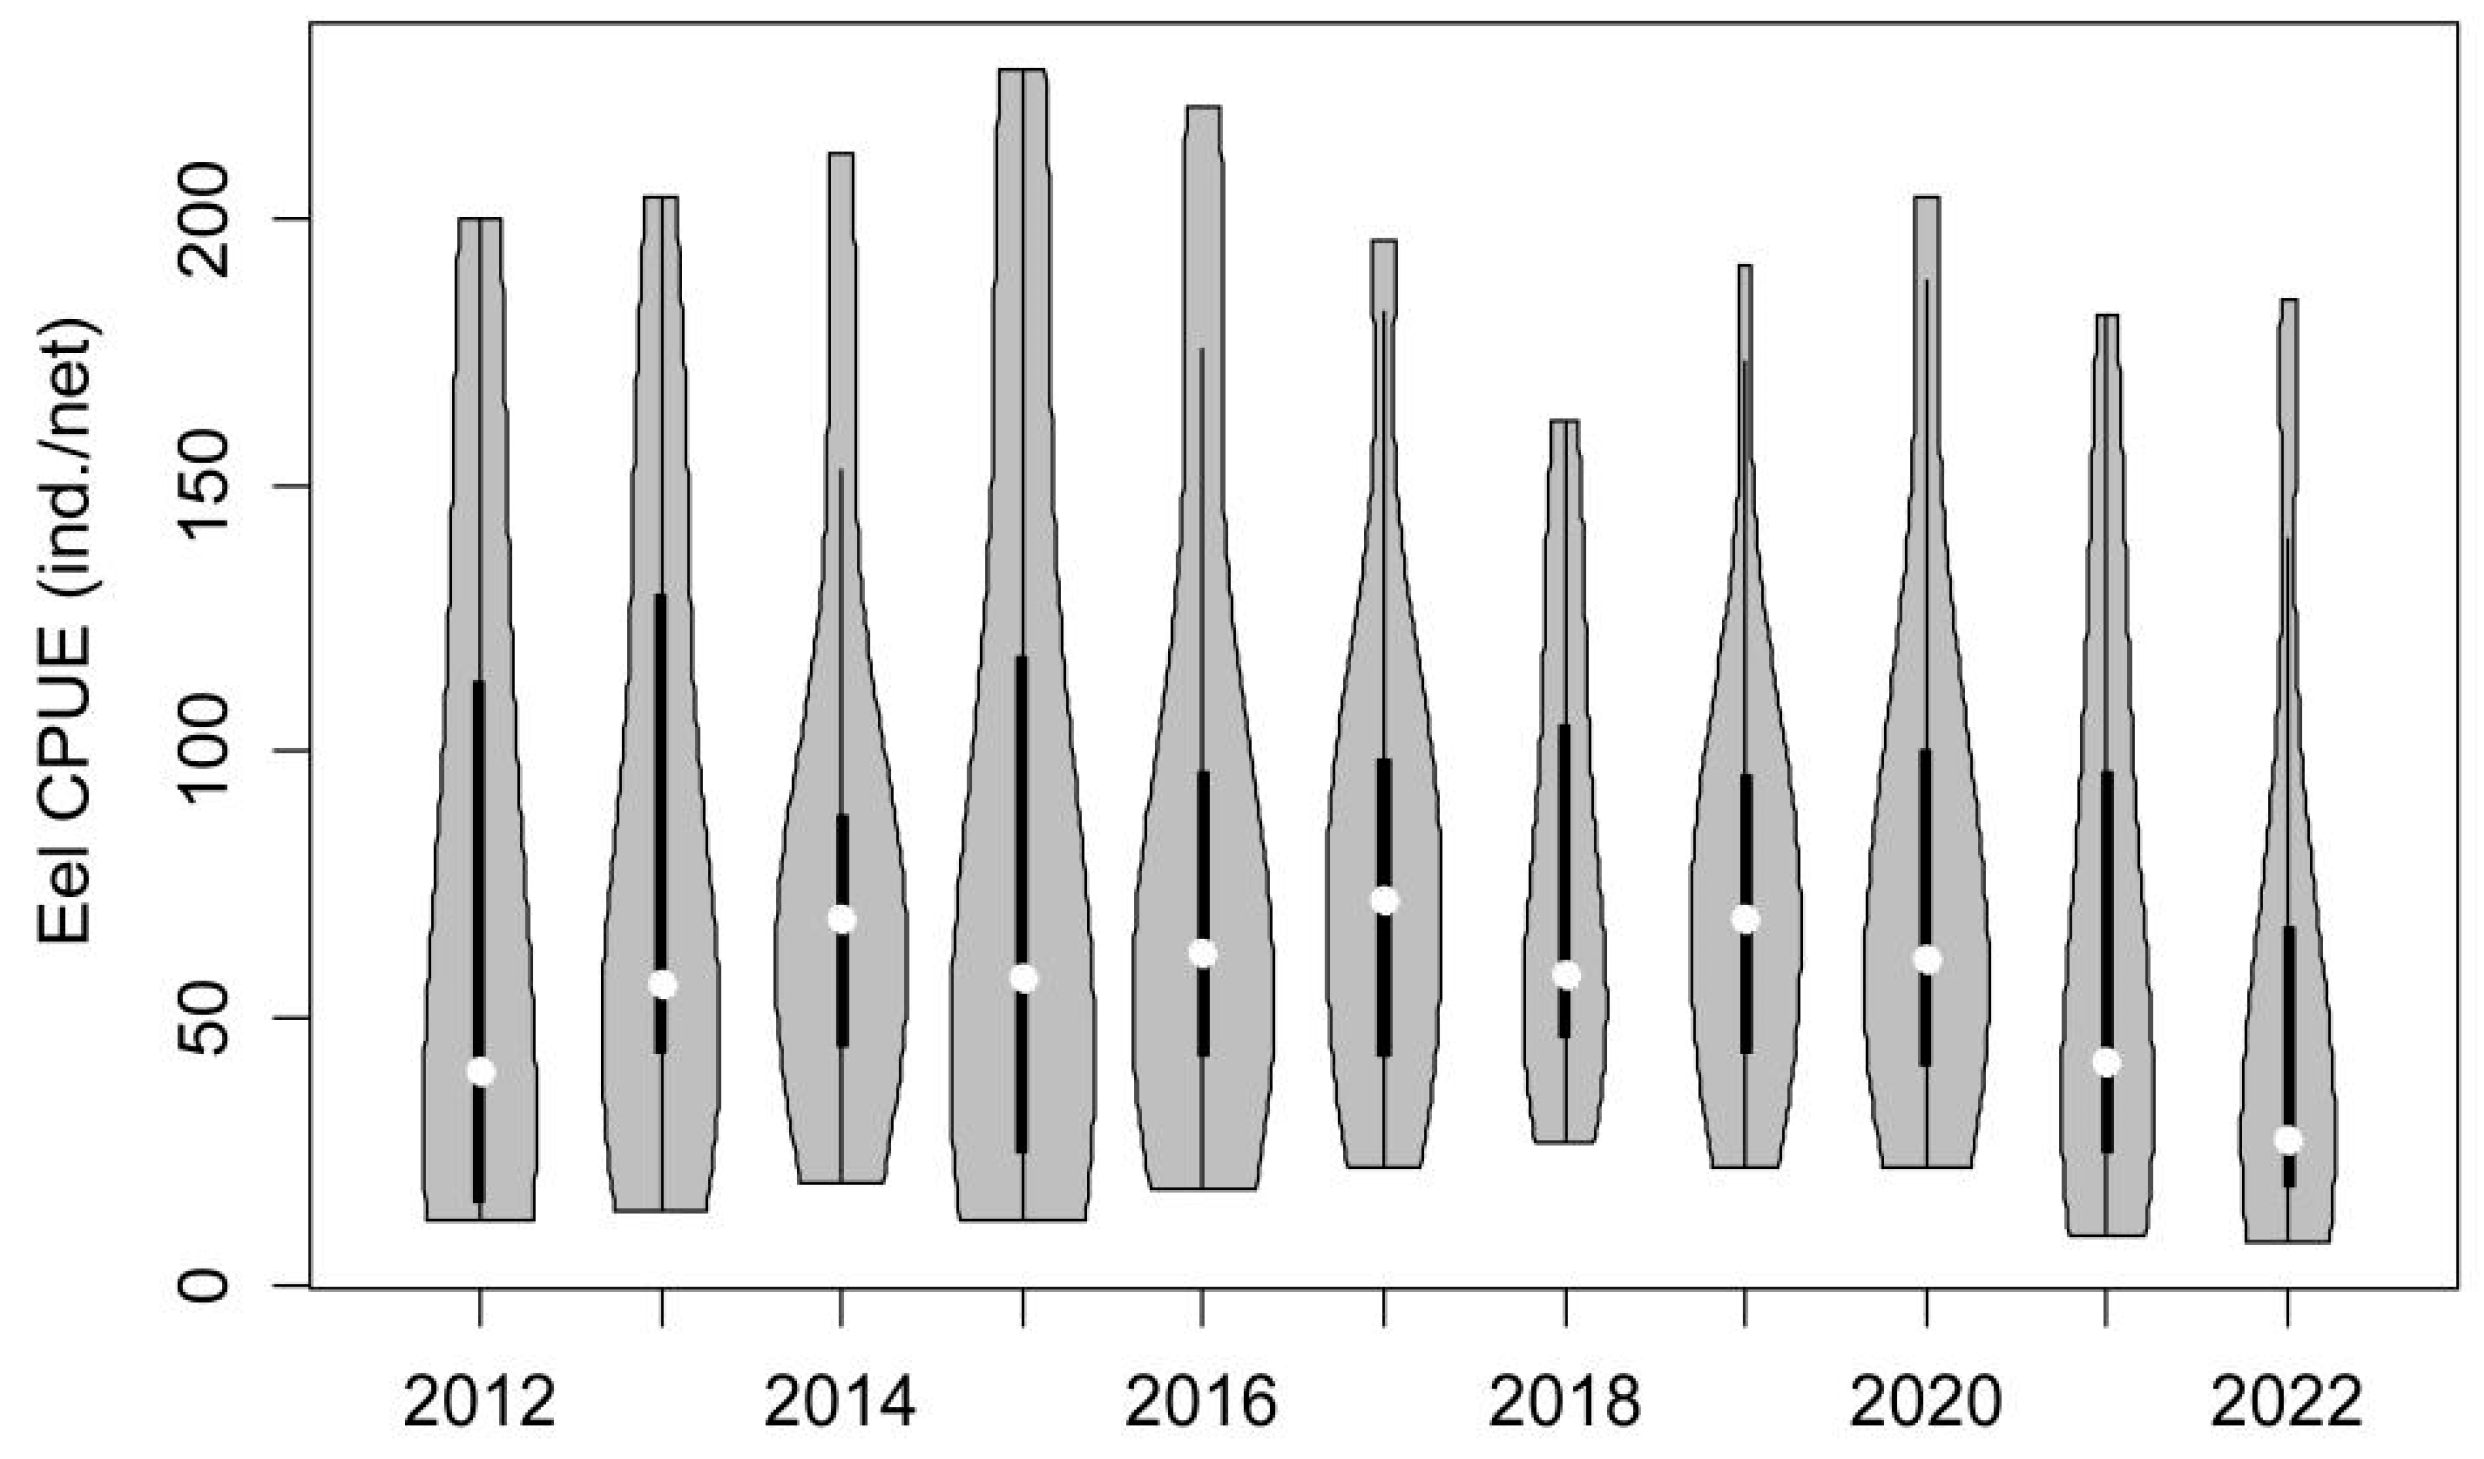
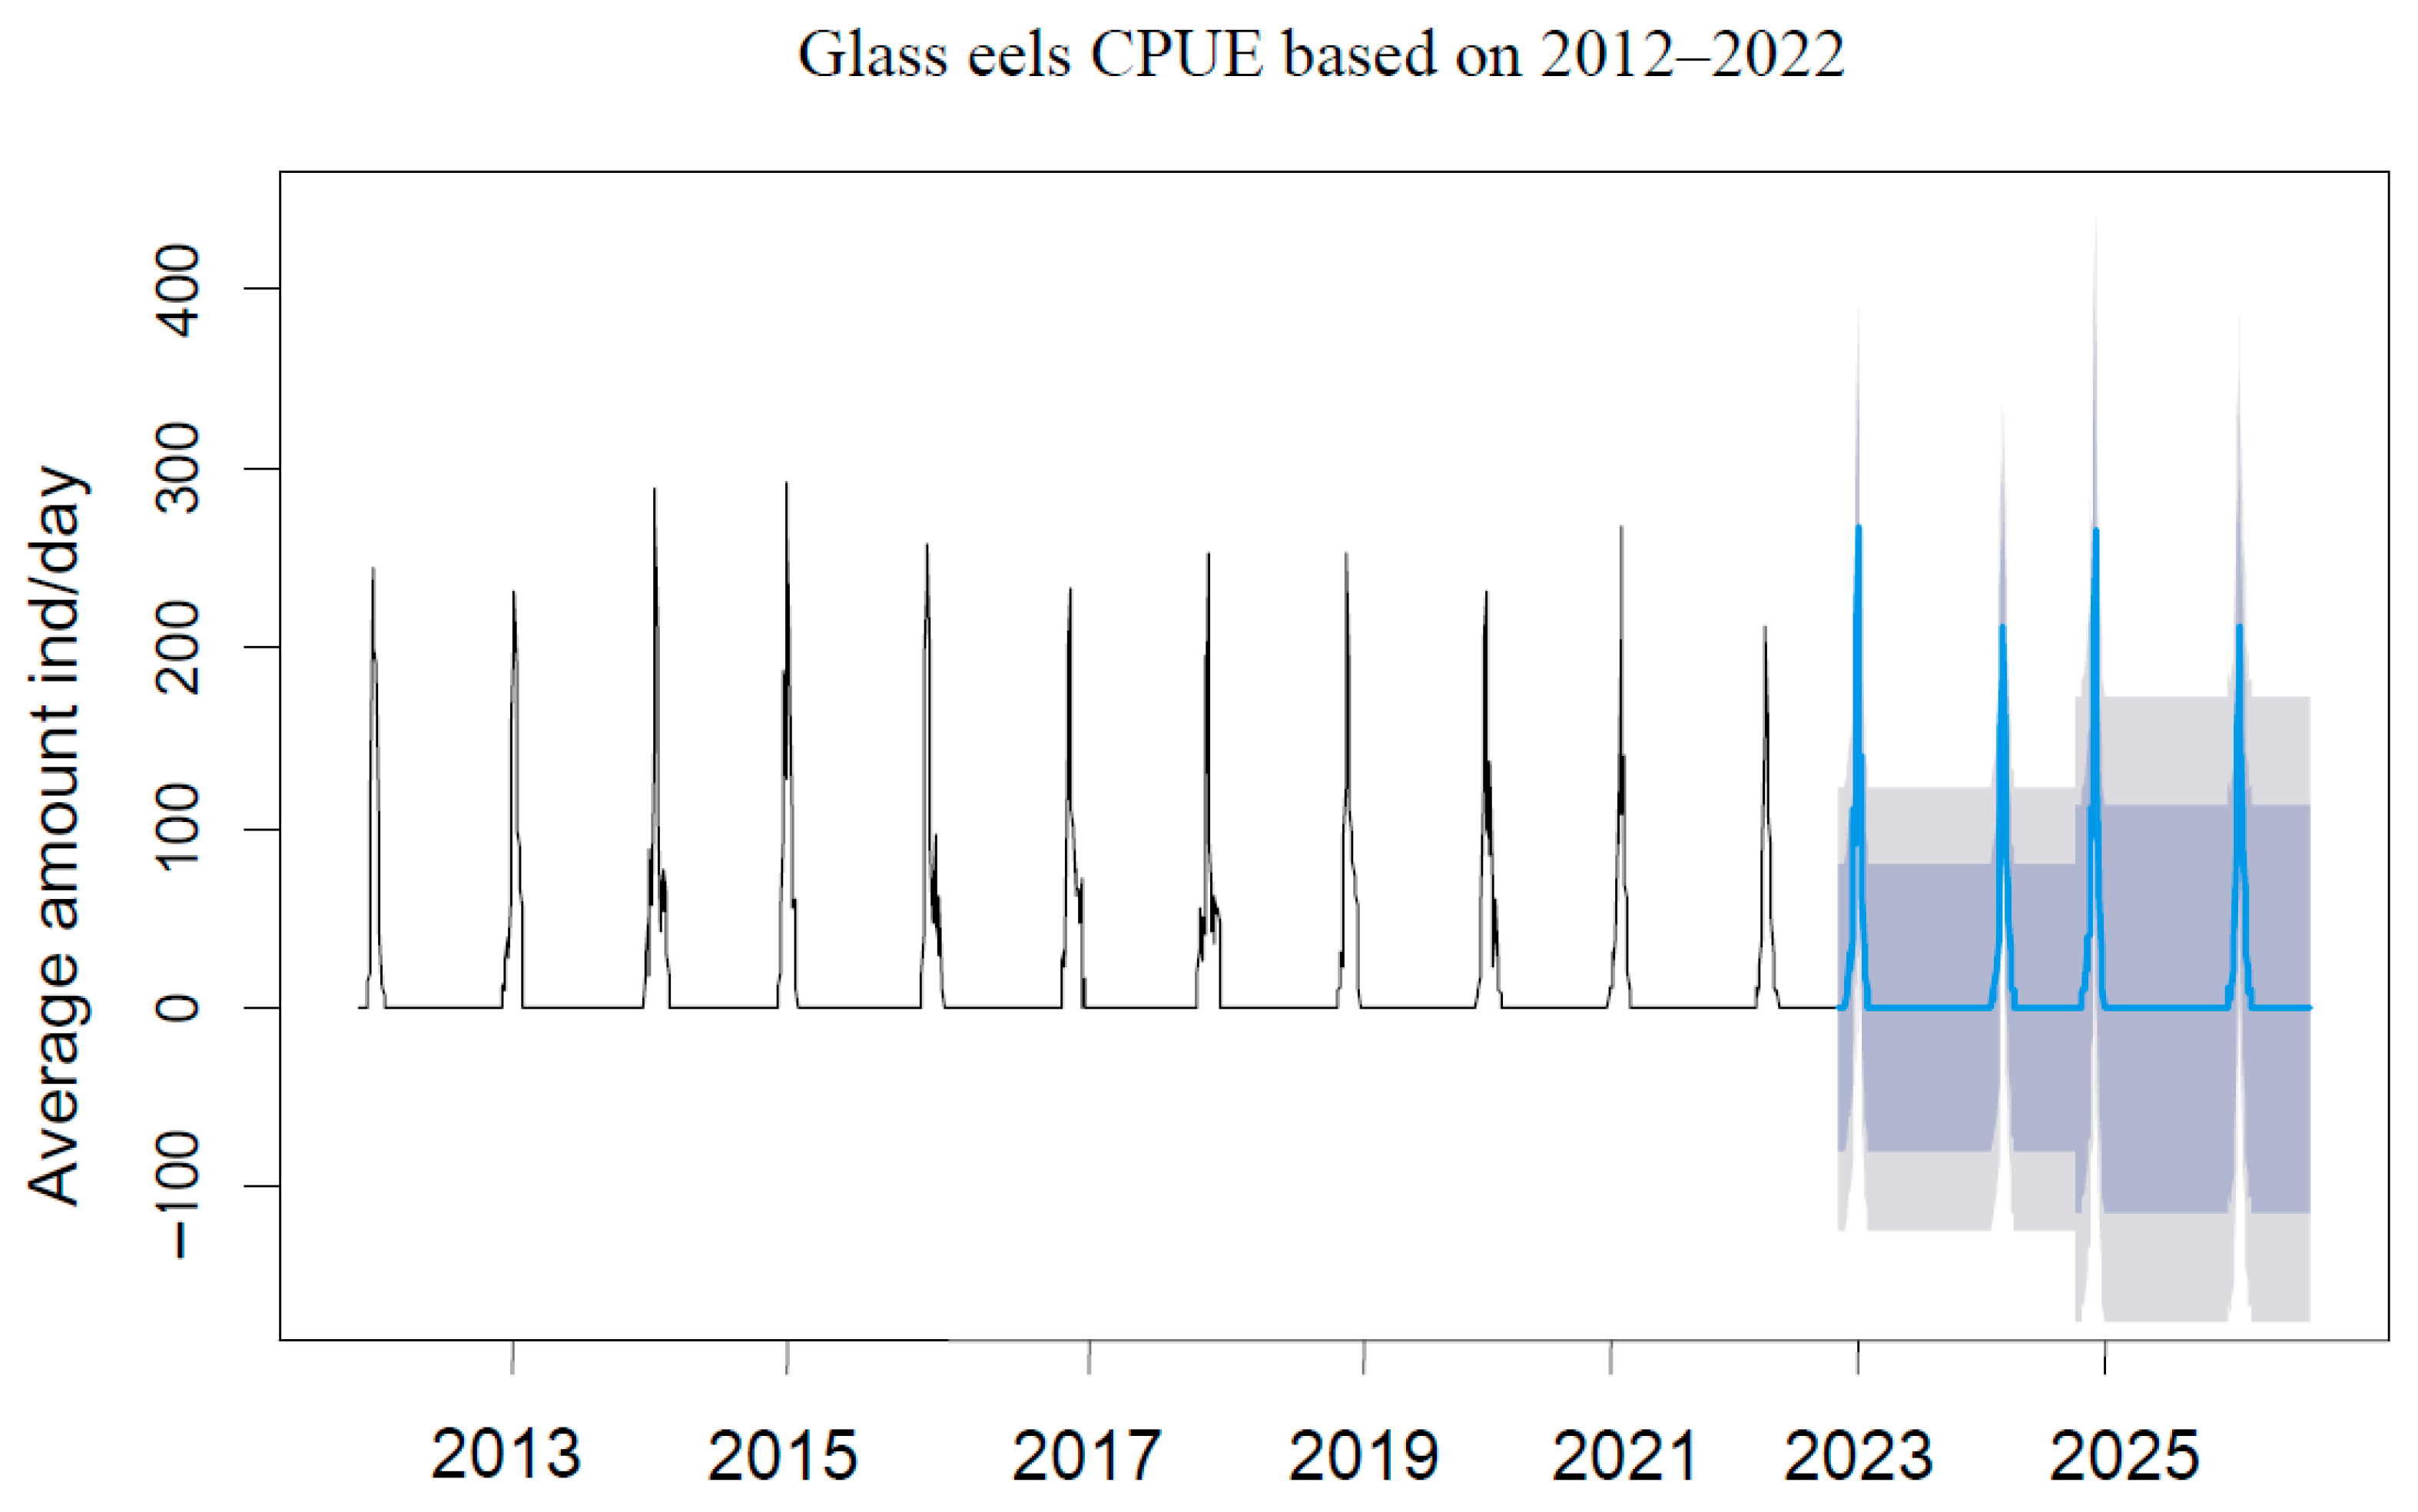
3.3. Recruitment Dynamics Forecasting

The histogram of forecast errors is stochastic, and their distributions fluctuate around zero (Figure 7). The two horizontal lines in the ACF and PACF plots designate the 95% confidence intervals for the estimated autocorrelation and partial autocorrelation coefficients. The significant spike at lag 0 in the ACF is indicative of a regression AR(0) component. A significant spike at lag 1 in the PACF indicates that an additional non-seasonal term, the MA(1) component, needs to be included in the model (Figure 7). Thus, we select an ARIMA ( 0 , 0 , 1 ) ( 0 , 1 , 0 ) 208 model as our prediction model based on the smallest AIC value. The forecast errors are shown in Figure 7. Nearly all of the spikes were within the significance limits, and thus, the residuals appear to be white noise. A Ljung–Box test also showed that the residuals have no remaining autocorrelations, and the forecast errors exhibited a normal distribution. All such data indicated that the model worked well.
Forecasts from the model for the next four years (2023–2026) are shown in Figure 8. We found that the CPUE of glass eels is expected to remain the same as the collection abundance in recent years (2019–2022). Overall, the CPUE of glass eels showed no significant periodic and inter-annual variability and is expected to remain in a stable state at a very low level in the near future (2023–2026). However, the predicted time of the highest daily count of glass eels will occur later each year (Spearman’s rho, one-tailed, p = 0.04) (Figure 9).

4. Discussion

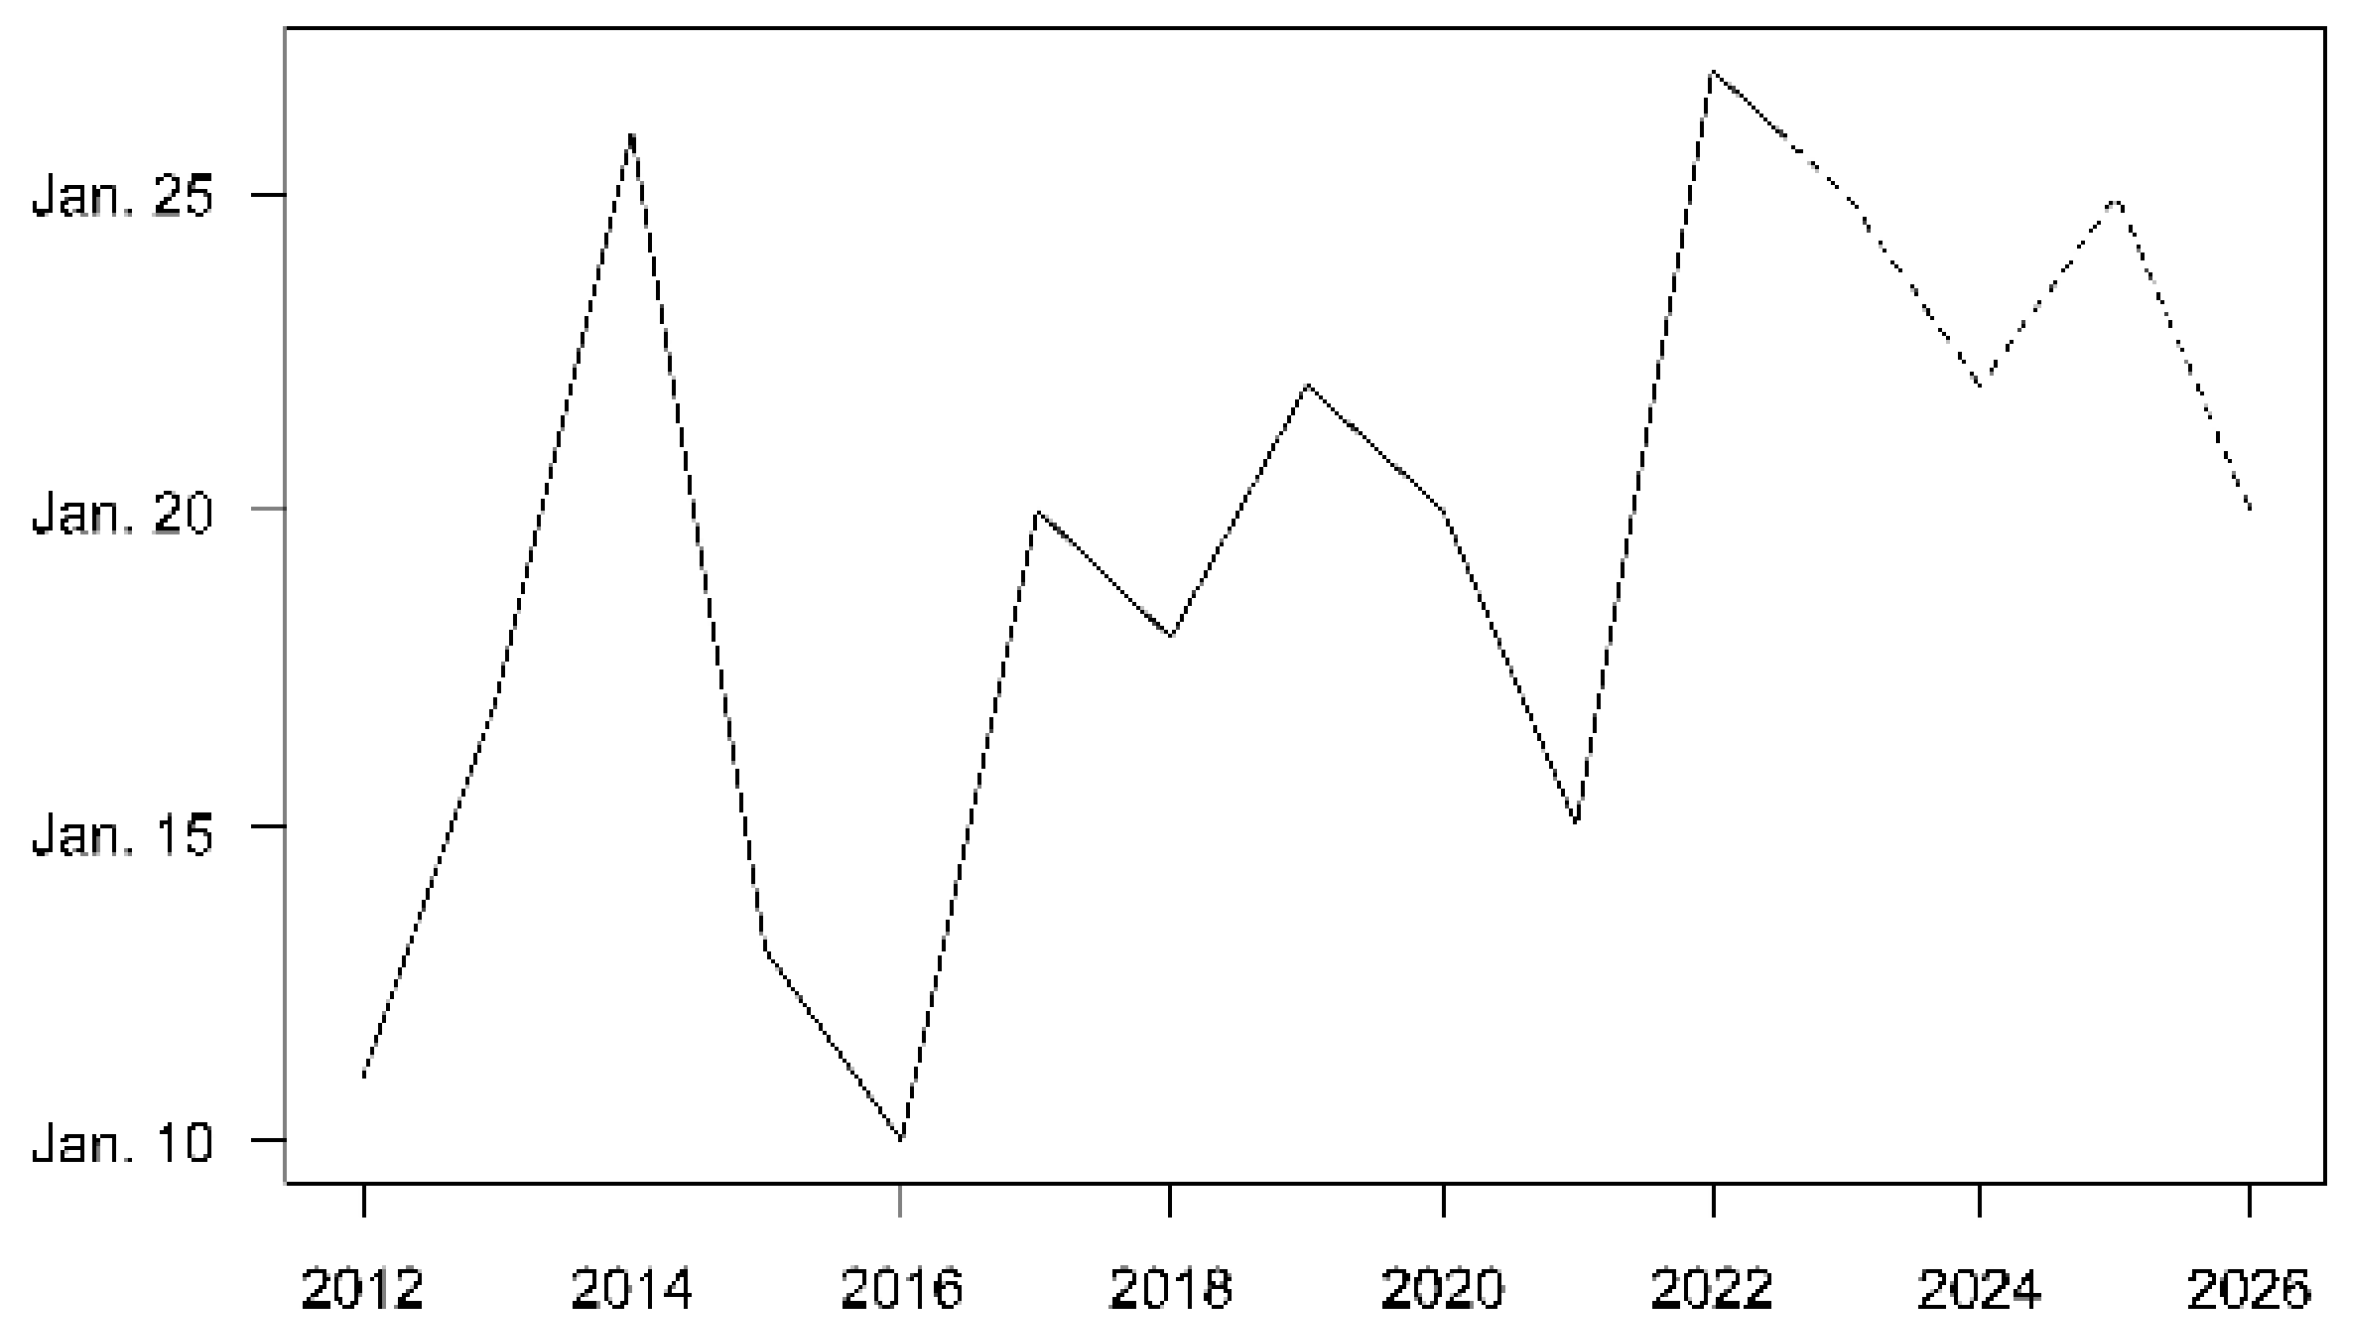
4.1. Synchronization of Spawning with the New Moon

It has been widely reported that lunar phase, tidal cycle, day–night rhythm, moonlight, water temperature, salinity, turbidity, water odor, and rainfall can affect the recruitment dynamic of glass eels [29,30], although contradictory results exist between studies [31]. Our results indicated that daily changes in glass eel CPUE were significantly affected by lunar distance, tide range, and water temperature. Under the “New Moon Hypothesis”, glass eels do not arrive continuously but in pulses or batches that follow the new moon [32], as has been observed in Taiwan [33], with peaks occurring between the last quarter and first quarter moon periods, with a near one-month periodicity.
Our results indicated that Japanese glass eels exhibited a negative preference for the lunar distance during the migrating season. In our study, CPUE was high during small lunar distances (full moon) and low during large lunar distances (quarter moon). Early studies on A. japonica showed that early developmental glass eels stages (VA and VB) were light-sensitive and did not migrate under a full moon [30]. However, a recent study by Cresci [34] on European eels showed that glass eels use lunar cues for orientation and that the arrival of glass eels is lunar dependent on new and full moons. Therefore, the photopathic behavior of glass eels may play an important role in catching abundance. However, moon and half-moon catches seem to differ across studies. In Grey River, New Zealand, the study of Laffaille et al. [31] showed higher catches of A. japonica and A. marmorata in most months during the new moon relative to the full moon. However, in some months, glass eels collected during the full moon were much higher than during the new moon at Yakushima Island, Japan [35]. This might be due to glass eels at early development stages being non-pigmented and lucifugous, highly influenced by light levels, and hence, showing a tendency to avoid the strong moonlight during the full moon period [36]. On the other hand, glass eels at late development stages are pigmented and with some phototaxis [37]. Accordingly, horizontal distribution experiments found a clear negative phototaxis in leptocephali and metamorphosing glass eels, but no phototaxis was detected after metamorphosis into glass eels [38]. Besides, the effect of the lunar cycle and hence moonlight intensity is modulated by cloud cover and turbidity; the lunar effect is not observed in highly turbid estuaries [20,39], such as in the Yangtze Estuary, China [40].
In regards to tidal range, CPUE peaks often appeared at times corresponding to the full moon. A large tidal range means that there is a large hydrodynamic force, which can easily send glass eels (with weak swimming ability) from tidal flat areas into the freshwater environment [35]. This is a critical step during which glass eels move to freshwater and exchange orientation and depth as the tide changes [34]. However, the daily catch was not always proportional to the increased tidal range at the beginning or end of the fishing season. At the end of the fishing season, in particular, older and more-pigmented glass eels with swimming ability are able to migrate into freshwater without the aid of tides.
Many studies have also shown that water temperature is an important factor that affects eel migration [30,31,40,41,42]. For instance, glass eels migrating upstream in a New Zealand river showed a clear preference for water temperatures between 12 and 20 °C, with an optimum of 16.5 °C [41]. The results of our study show that larger migrations occur in winter when the water temperature drops below 8 °C, which triggers the migration of glass eels from the sea to the Pearl River estuary. Our finding is quite similar to the results of previous studies with glass eel catches peaking in winter when the temperature was 6–7 °C in the Geum River Estuary, South Korea [30], and 6.2–8.5 °C in the Yangtze Estuary, China [43]. On the other hand, sea surface temperatures in the South China Sea have increased up to 0.44 °C/decade in recent decades [44,45], which might cause glass eels to migrate later in the season. Interestingly, our modeling approach suggested a shift to a later recruitment season, which could be explained by this temperature increase. This is because cold seawater is essential to induce early sexual development in catadromous migratory eels, such as for the increased proliferation and differentiation of specific spermatogonial cells [46]. Eels require cold seawater to promote the activity of the brain–pituitary–gonad (BPG) axis, which induces silvering (eels transform from yellow to silver) [47]. Hence the delay in Yellow eel migration due to increased water temperature might be detrimental as it could indirectly affect reproduction. In addition, the increased temperature has the potential to decrease larval numbers. Some studies have reported that the survival of glass eels declined with the progression of the migratory season [48,49]. Late-season glass eels did not have sufficient energy reserves to transition effectively to the new environment [50].

4.2. Stable but Low Recruitment of Japanese Eel in the Pearl River Estuary

The present study analyzed the daily variation in the catch of Japanese glass eels over 11 successive recruitment seasons (2001–2022) in the Pearl River estuary in China. CPUE analysis suggested a low but stable abundance of glass eels in the Pearl River estuary in the period 2001–2022, with no significant variability within years and across years. Moreover, ARIMA modeling suggested that in the next four years (2023–2026), abundance will also remain low, although recruitment ultimately depends on the overall spawning stock, and future recruitment cannot be predicted on the basis of local recruitment alone. While catches were stable in the period studied, in comparison with historical data, the observed drop in CPUE is apparent.
What are the causes of the low recruitment of Japanese eels in the area? The decline of eel stocks is a global phenomenon affecting not only Japanese eels but also European and American eels [51,52,53,54]. Many causes have been put forward to explain the declining trend in eel populations, mostly anthropogenic, including habitat destruction, construction of dams, fishing, and human-introduced parasites and viruses [55,56,57,58]. One of the plausible causes of the decline of Japanese eels might be the construction of dams along the Pearl River. At present, there are 32 hydropower stations, each with an installed capacity greater than 100 MW, located in the Pearl River system. The issue with dams is that they might block and impede the spawning migration of adults. The yellow eels live in the rivers for approximately 5–8 years [59]. Later in life, they have a second metamorphosis into silver eels and then migrate back to the spawning site in the waters west of the Mariana Islands, 15° N 140° E [8]. If dams impede the spawning migration, they might contribute that fewer individuals reach the spawning site, resulting in lower recruitment. The fact that dams can stop the spawning migration of silver eels has been observed in European eels, for instance, the dams in the Sardinian rivers’ network, Sardinia (Italy) [60], in the River Fremur of northern Brittany (France) [61] and in the Rance estuary (Brittany, France) [62]. Those dams disrupt river connectivity, consequently impeding fish movements to reach feeding and spawning habitats.
In addition, while usually regarded as a tough species that can survive in poor-quality waters, as a fatty fish, eels are particularly sensitive to contamination. Because of its high-fat content and local benthic feeding behavior, the feeding stage is considered extremely prone to the bioaccumulation of pollutants. Most contaminants are highly concentrated in lipid stores [63] and affect lipid metabolism [64,65,66]. Apart from acute fish toxicity, i.e., the effects of short-term exposure to a chemical, often associated with sudden fish casualties, bioaccumulation of chemicals inside the fish may result in chronic fish toxicity, with sublethal effects being apparent only at specific periods of the fish life (e.g., during maturation of the gonads (endocrine disruption), starvation, reproduction and offspring development) [67]. In particular, heavy metals seriously impact the fitness of eels. In European eels, a significant negative correlation between heavy metal pollution load and condition was observed, suggesting an impact of pollution on the health of sub-adult eels [68].
In our study area, the Pearl River estuary is enriched in nutrients during the high inflows. The concentrations of dissolved inorganic nitrogen and dissolved inorganic phosphorus have gradually increased over the past two decades [69]. High levels of Cu, As, Pb, Cr, and Hg are found, and Cu and Cd pose ecological risks in the Pearl River estuaries [70]. These heavy metals are genotoxic for European eels [71]. Using transcriptomics, the study of Pujolar et al. (2012) [72] on European eels comparing animals from polluted and non-polluted areas suggested that bioaccumulation of pollutants, including heavy metals, can seriously impair the spawning migration of adults. Individuals from polluted environments showed an up-regulation of genes related to detoxification but a down-regulation of metabolic genes involved in the mitochondrial respiratory chain and oxidative phosphorylation. Although the authors did not measure metabolism, the study suggests that pollutants might have a significant effect, possibly resulting in a low energetic status of the fish, pointing to a poor quality of spawners that could jeopardize spawning migration and reproduction. A high contaminant burden could also impair normal reproduction or affect larval development since lipids and lipophilic contaminants are mainly mobilized toward the gonads during the spawning migration [73].
Moreover, the main anthropogenic factor put forward to explain the declining global trend in stocks of American, European and Japanese eels is over-fishing [52,56,74]. In the case of Japanese eels, the average annual eel fishing catch in Japan dropped from 130 tons each year in the 1960s to 7 tons each year in the 1990s [19]. Wild populations have drastically decreased or disappeared completely from most estuaries since the 1960s [12]. Japanese eel has been listed as endangered on the International Union for Conservation of Nature (IUCN) Red List of Threatened Species [21]. In the case of the Pearl River, fisheries have also experienced long-term overfishing, as well as many other numerous anthropogenic disturbances since the 1950s. The current status of the Japanese eel stock is worrying [75].
Currently, in the Pearl River, there are two fishing ban periods, one for freshwater (from 1 March to 30 June) and one for marine (from 1 May to 15 August). Those do not coincide with the time at which glass eels migrate into the Pearl River (December–February). What could be done to alleviate the situation? One alternative would be to ban fishing completely. However, this is not realistic because Japanese eels are important aquaculture species in China. The annual output of eel in China is about 220,000 tons, accounting for about 70% of the world’s total output. Japanese eels support an important fishery industry in China [15]. It is also difficult to alter the banning period so that it covers the migration period (December–February), as the current bans are 1 March to 30 June in freshwater and 1 May to 15 August in oceans. These times are quite remote from the glass eels’ migrating time. Another solution could be the introduction of quotas, limiting the number of fish that can be caught. In the case of New Zealand’s freshwater eel stocks, Maori, New Zealand’s indigenous people, were allocated 20% of the commercial quota, with an additional quota set for customary take [76]. In the case of European eels, quotas have been used since 2004, and apart from small catches of glass eels for research purposes, it has not been legal in the EU to import and export eels since 2010 [54].

Author Contributions

Conceptualization, F.S. and J.Y.; methodology, validation, investigation, F.S.; data curation, F.S. and S.Y.; writing—original draft preparation, F.S.; writing—review and editing, J.L. and J.Y.; visualization, F.S.; supervision, J.L. and J.Y.; funding acquisition, F.S. and J.L. All authors have read and agreed to the published version of the manuscript.

Funding

This research was funded by the National Natural Science Foundation of China (31870527), the Science and Technology Program of Guangzhou, China (202201010761), the China-ASEAN Maritime Cooperation Fund (CAMC–2018F) and the Project of Innovation Team of Survey and Assessment of the Pearl River Fishery Resources (2020TD-10).

Institutional Review Board Statement

The collection and use of glass eels complied with the Laws of the People’s Republic of China on the Protection of Wildlife. It is approved by Laboratory Animal Ethics Committee Pearl River Fisheries Research Institute, CAFS. (No. LAEC-PRFRI-2023-03- 14).

Data Availability Statement

The data that support the findings of this study are available through the Pearl River Fisheries Research Institute, Chinese Academy of Fishery Sciences (contact: Fangmin Shuai; [email protected]).

Acknowledgments

We are deeply grateful to Zhuhai Detachment of the Guangdong Fishing Administrative Brigade for their assistance in the field sample collection.

Conflicts of Interest

The authors declare no conflict of interest.

References

  1. Sala, O.E.; Chapin, F.S.; Armesto, J.J.; Berlow, E.; Bloomfield, J.; Dirzo, R.; Huber-Sanwald, E.; Huenneke, L.F.; Jackson, R.B.; Kinzig, A.; et al. Global biodiversity scenarios for the year 2100. Science 2000, 287, 1770–1774. [Google Scholar] [CrossRef] [PubMed]
  2. Dulvy, N.K.; Sadovy, Y.; Reynolds, J.D. Extinction vulnerability in marine populations. Fish Fish. 2003, 4, 25–64. [Google Scholar] [CrossRef]
  3. Stenseth, N.C.; Rouyer, T. Ecology: Destabilized fish stocks. Nature 2008, 452, 825–826. [Google Scholar] [CrossRef] [PubMed]
  4. Anderson, C.N.; Hsieh, C.H.; Sandin, S.A.; Hewitt, R.; Hollowed, A.; Beddington, J.; May, R.M.; Sugihara, G. Why fishing magnifies fluctuations in fish abundance. Nature 2008, 452, 835–839. [Google Scholar] [CrossRef]
  5. Mangel, M.; Brodziak, J.; DiNardo, G. Reproductive ecology and scientific inference of steepness: A fundamental metric of population dynamics and strategic fisheries management. Fish Fish. 2010, 11, 89–104. [Google Scholar] [CrossRef]
  6. Righton, D.; Piper, A.; Aarestrup, K.; Amilhat, E.; Belpaire, C.; Casselman, J.; Castonguay, M.; Díaz, E.; Dörner, H.; Faliex, E.; et al. Important questions to progress science and sustainable management of anguillid eels. Fish Fish. 2021, 22, 762–788. [Google Scholar] [CrossRef]
  7. Tesch, F.W. The Eel, 5th ed.; Wiley-Blackwell: Oxford, UK, 2003; p. 436. [Google Scholar]
  8. Tsukamoto, K. Discovery of the spawning area for Japanese eel. Nature 1992, 356, 789–791. [Google Scholar] [CrossRef]
  9. Kurogi, H.; Okazaki, M.; Mochioka, N.; Jinbo, T.; Hashimoto, H.; Takahashi, M.; Tawa, A.; Aoyama, J.; Shinoda, A.; Tsukamoto, K.; et al. First capture of post-spawning female of the Japanese eel Anguilla japonica at the southern West Mariana Ridge. Fish. Sci. 2011, 77, 199–205. [Google Scholar] [CrossRef]
  10. Cheng, P.; Tzeng, W. Timing of metamorphosis and estuarine arrival across the dispersal range of the Japanese eel Anguilla japonica. Mar. Ecol. Prog. Ser. 1996, 131, 87–96. [Google Scholar] [CrossRef]
  11. Tsukamoto, K. Oceanic migration and spawning of Anguillid eels. J. Fish. Biol. 2009, 74, 1833–1852. [Google Scholar] [CrossRef]
  12. Sullivan, M.C.; Able, K.W.; Hare, J.A.; Walsh, H.J. Anguilla rostrata glass eel ingress into two, US east coast estuaries: Patterns, processes and implications for adult abundance. J. Fish Biol. 2006, 69, 1081–1101. [Google Scholar] [CrossRef]
  13. Tanaka, E. Stock assessment of Japanese eels using Japanese abundance indices. Fish. Sci. 2014, 80, 1129–1144. [Google Scholar] [CrossRef]
  14. Kaifu, K.; Yokouchi, K. Increasing or decreasing?—Current status of the Japanese eel stock. Fish. Res. 2019, 220, 105348. [Google Scholar] [CrossRef]
  15. MARA (Ministry of Agriculture and Rural Affairs of the People’s Republic of China). Chinese Fishery Statistical Yearbook; China Agriculture Press: Beijing, China, 2018–2022.
  16. Masuda, Y.; Imaizumi, H.; Oda, K. Artificial completion of the Japanese eel, Anguilla japonica, life cycle: Challenge to mass production. Bull. Fish. Res. Agency 2012, 35, 111–117. [Google Scholar]
  17. Tanaka, H. Progression in artificial seedling production of Japanese eel Anguilla japonica. Fish. Sci. 2015, 81, 11–19. [Google Scholar] [CrossRef]
  18. Shuai, F.M.; Li, Z.Q.; Liu, G.W.; Li, X.H.; Li, Y.F.; Yang, J.P.; Li, J. Resource status of Japanese eel (Anguilla japonica) in the Pearl River Estuary. South China Fish. Sci. 2015, 11, 85–89. (In Chinese) [Google Scholar]
  19. Tatsukawa, K. Eel Resources in East Asia. Eel Biology; Springer: Berlin/Heidelberg, Germany, 2003; pp. 293–298. [Google Scholar]
  20. Harrison, A.J.; Walker, A.M.; Pinder, A.C.; Briand, C.; Aprahamian, M.W. A review of glass eel migratory behaviour, sampling techniques and abundance estimates in estuaries: Implications for assessing recruitment, local production and exploitation. Rev. Fish Biol. Fish. 2014, 24, 967–983. [Google Scholar] [CrossRef]
  21. Jacoby, D.M.P.; Casselman, J.M.; Crook, V.; DeLucia, M.B.; Ahn, H.; Kaifu, K.; Kurwie, T.; Sasal, P.; Silfvergrip, A.M.C.; Smith, K.G.; et al. Synergistic patterns of threat and the challenges facing global anguillid eel conservation. Glob. Ecol. Conserv. 2015, 4, 321–333. [Google Scholar] [CrossRef]
  22. Lu, K.X. Fishery Resources in the Pearl River System; Guangdong Science and Technology Press: Guangzhou, China, 1990. [Google Scholar]
  23. Tesch, F.W.; White, R.J. The Eel; Blackwell Publishing: London, UK, 2008; pp. 9–24. [Google Scholar]
  24. Fukuda, N.; Miller, M.J.; Aoyama, J.; Shinoda, A.; Tsukamoto, K. Evaluation of the pigmentation stages and body proportions from the glass eel to yellow eel in Anguilla japonica. Fish. Sci. 2013, 79, 425–438. [Google Scholar] [CrossRef]
  25. Kim, J.Y.; Jeong, H.C.; Kim, H.; Kang, S. Forecasting the monthly abundance of anchovies in the South Sea of Korea using a univariate approach. Fish. Res. 2015, 161, 293–302. [Google Scholar] [CrossRef]
  26. Box, G.E.; Jenkins, G.M.; Reinsel, G.C.; Ljung, G.M. Time Series Analysis: Forecasting and Control, 5th ed.; John Wiley & Sons: Hoboken, NJ, USA, 2015. [Google Scholar]
  27. Tsitsika, E.V.; Maravelias, C.D.; Haralabous, J. Modeling and forecasting pelagic fish production using univariate and multivariate ARIMA models. Fish. Sci. 2007, 73, 979–988. [Google Scholar] [CrossRef]
  28. R Development Core Team. R: A Language and Environment for Statistical Computing; R Foundation for Statistical Computing: Vienna, Austria, 2021; Available online: http://www.r-project.org/ (accessed on 1 January 2022).
  29. Tzeng, W.N. Immigration timing and activity rhythms of the eel, Anguilla japonica, elvers in the estuary of northern Taiwan, with emphasis on environmental influences. Bull. Jap. Soc. Fish. Oceanogr. 1985, 47, 11–28. [Google Scholar]
  30. Hwang, S.D.; Lee, T.W.; Choi, I.S.; Hwang, S.W. Environmental factors affecting the daily catch levels of Anguilla japonica glass eels in the Geum River estuary, South Korea. J. Coast. Res. 2014, 297, 954–960. [Google Scholar] [CrossRef]
  31. Jellyman, D.; Lambert, P. Factors affecting recruitment of glass eels into the Grey River, New Zealand. J. Fish Biol. 2003, 63, 1067–1079. [Google Scholar] [CrossRef]
  32. Tsukamoto, K.; Otake, T.; Mochioka, N.; Lee, T.W.; Fricke, H.; Inagaki, T.; Aoyama, J.; Ishikawa, S.; Kimura, S.; Miller, M.J.; et al. Seamounts, new moon and eel spawning: The search for the spawning site of the Japanese eel. Environ. Biol. Fish. 2003, 66, 221–229. [Google Scholar] [CrossRef]
  33. Han, Y.S.; Wu, C.R.; Iizuka, Y. Batch-like Arrival Waves of Glass Eels of Anguilla japonica in Offshore Waters of Taiwan. Zool. Stud. 2016, 55, e36. [Google Scholar]
  34. Cresci, A.A. Comprehensive hypothesis on the migration of European glass eels (Anguilla anguilla). Biol. Rev. 2020, 95, 1273–1286. [Google Scholar] [CrossRef]
  35. Yamamoto, T.; Mochioka, N.; Nakazono, A. Seasonal occurrence of anguillid glass eels at Yakushima Island, Japan. Fish. Sci. 2001, 67, 530–532. [Google Scholar] [CrossRef]
  36. Helme, H.; Bertucci, F.; Moussa, R.M.; Wolff, Y.; Sasal, P. Temporal dynamics of the recruitment of glass eels in two valleys of French Polynesia (Tahiti and Moorea Islands). Cybium 2018, 42, 341–348. [Google Scholar]
  37. Chow, S.; Masuda, Y.; Satomi, M.; Kamoshida, M.; Takahashi, M. A method to separate eel leptocephalus larvae from turbid water by controlling the light environment. Nippon Suisan Gakkaishi 2019, 85, 585–590. [Google Scholar] [CrossRef]
  38. Yamada, Y.; Okamura, A.; Mikawa, N.; Utoh, T.; Horie, N.; Tanaka, S.; Miller, M.J.; Tsukamoto, K. Ontogenetic changes in phototactic behavior during metamorphosis of artificially reared Japanese eel Anguilla japonica larvae. Mar. Ecol. Prog. Ser. 2009, 379, 241–251. [Google Scholar] [CrossRef]
  39. Laffaille, P.; Caraguel, J.M.; Legault, A. Temporal patterns in the upstream migration of European glass eels (Anguilla anguilla) at the Couesnon estuarine dam. Estuar. Coast. Shelf Sci. 2007, 73, 81–90. [Google Scholar] [CrossRef]
  40. Guo, H.Y.; Zhang, X.G.; Zhang, Y.; Tang, W.Q.; Wu, J.M. Effects of environmental variables on recruitment of Anguilla japonica glass eels in the Yangtze Estuary, China. Fish. Sci. 2017, 83, 333–341. [Google Scholar] [CrossRef]
  41. August, S.M.; Hicks, B.J. Water temperature and upstream migration of glass eels in New Zealand: Implications of climate change. Environ. Biol. Fishes 2008, 81, 195–205. [Google Scholar] [CrossRef]
  42. Jellyman, D.; Booker, D.; Watene, E. Recruitment of Anguilla spp. glass eels in the Waikato River, New Zealand. Evidence of declining migrations? J. Fish Biol. 2009, 74, 2014–2033. [Google Scholar] [CrossRef] [PubMed]
  43. Zhang, H.; He, W.; Tong, C.; Lu, J. The effect of fishing the anguillid elver (Anguilla japonica) on the fishery of the Yangtze estuary. Estuar. Coast. Shelf Sci. 2008, 76, 902–908. [Google Scholar] [CrossRef]
  44. Belkin, I.M. Rapid warming of large marine ecosystems. Prog. Oceanogr. 2009, 81, 207–213. [Google Scholar] [CrossRef]
  45. Yao, Y.; Wang, C. Variations in summer marine heatwaves in the South China Sea. J. Geophys. Res. Oceans 2021, 126, e2021JC017792. [Google Scholar] [CrossRef]
  46. Rozenfeld, C.; García-Carpintero, V.; Pérez, L.; Gallego, V.; Herranz-Jusdado, J.G.; Tveiten, H.; Johnsen, H.K.; Fontaine, R.; Weltzien, F.; Cañizares, J.; et al. Cold seawater induces early sexual developmental stages in the BPG axis of European eel males. BMC Genom. 2019, 20, 597. [Google Scholar] [CrossRef]
  47. Sudo, R.; Yada, T. Anguillid eels as a model species for understanding endocrinological influences on the onset of spawning migration of fishes. Biology 2022, 11, 934. [Google Scholar] [CrossRef]
  48. Desaunay, Y.; Guerault, D. Seasonal and long-term changes in biometrics of eel larvae: A possible relationship between recruitment variation and North Atlantic ecosystem productivity. J. Fish. Biol. 1997, 51, 317–339. [Google Scholar] [CrossRef]
  49. Kawakami, Y.; Mochioka, N.; Kimura, R.; Nakazono, A. Seasonal changes of the RNA/DNA ratio, size and lipid contents and immigration adaptability of Japanese glass-eels, Anguilla japonica, collected in northern Kyushu, Japan. J. Exp. Mar. Biol. Ecol. 1999, 238, 1–19. [Google Scholar] [CrossRef]
  50. Kearney, M.; Jeffs, A.; Lee, P. Seasonal differences in the quality of shortfin glass eel, Anguilla australis, and subsequent effects on growth and survival in captivity. N. Z. Nat. Sci. 2011, 36, 45–55. [Google Scholar]
  51. Belpaire, C.G.J.; Goemans, G.; Geeraerts, C.; Quataert, P.; Parmentier, K.; Hagel, P.; De Boer, J. Decreasing eel stocks: Survival of the fattest? Ecol. Freshw. Fish 2009, 18, 197–214. [Google Scholar] [CrossRef]
  52. Arai, T. Do we protect freshwater eels or do we drive them to extinction? Springerplus 2014, 3, 534. [Google Scholar] [CrossRef]
  53. Kahn, D.M. Trends in abundance and fishing mortality of american eel. Fisheries 2018, 44, 129–136. [Google Scholar] [CrossRef]
  54. Sonne, C.; Peng, W.X.; Alstrup, A.K.O.; Lam, S.S. European eel population at risk of collapse. Science 2021, 372, 1271. [Google Scholar] [CrossRef]
  55. Feunteun, E. Management and restoration of european eel population (Anguilla anguilla): An impossible bargain. Ecol. Eng. 2002, 18, 575–591. [Google Scholar] [CrossRef]
  56. Dekker, W. Did lack of spawners cause the collapse of the European eel, Anguilla anguilla? Fish. Manag. Ecol. 2003, 10, 365–376. [Google Scholar] [CrossRef]
  57. Leone, C.; Zucchetta, M.; Capoccioni, F.; Gravina, M.F.; Franzoi, P.; Ciccotti, E. Stage-specific distribution models can predict eel (Anguilla anguilla) occurrence during settlement in coastal lagoons. Estuar. Coast. Shelf Sci. 2016, 170, 123–133. [Google Scholar] [CrossRef]
  58. Shuai, F.M.; Liu, Q.F.; Liu, Y.Q.; Wu, Z.; Lek, S.; Chen, Y.S. Spatial Distribution Patterns of Japanese Eel (Anguilla japonica) in a Large Subtropical River (Pearl), China. N. Am. J. Fish. Manag. 2021, 41, 929–938. [Google Scholar] [CrossRef]
  59. Tzeng, W.N.; Lin, H.R.; Wang, C.H.; Xu, S.N. Differences in size and growth rates of male and female migrating Japanese eels in Pearl River, China. J. Fish Biol. 2000, 57, 1245–1253. [Google Scholar] [CrossRef]
  60. Podda, C.; Palmas, F.; Pusceddu, A.; Sabatini, A. When the Eel Meets Dams: Larger Dams’ Long-Term Impacts on Anguilla anguilla (L., 1758). Front. Environ. Sci. 2022, 10, 876369. [Google Scholar] [CrossRef]
  61. Acou, A.; Laffaille, P.; Legault, A.; Feunteun, E. Migration pattern of silver eel (Anguilla anguilla, L.) in an obstructed river system. Ecol. Freshw. Fish 2008, 17, 432–442. [Google Scholar] [CrossRef]
  62. Trancart, T.; Teichert, N.; Lamoureux, J.; Gharnit, E.; Acou, A.; Oliveira, E.D.; Roy, R.; Feunteun, E.; Feunteun, E. A possible strong impact of tidal power plant on silver eels’ migration. Estuar. Coast. Shelf Sci. 2022, 278, 108116. [Google Scholar] [CrossRef]
  63. Robinet, T.T.; Feunteun, E.E. Sublethal effects of exposure to chemical compounds: A cause for the decline in atlantic eels? Ecotoxicology 2002, 11, 265–277. [Google Scholar] [CrossRef]
  64. Corsi, I.; Mariottini, M.; Badesso, A.; Caruso, T.; Borghesi, N.; Bonacci, S.; Iacocca, A.; Focardi, S. Contamination and sub-lethal toxicological effects of persistent organic pollutants in the European eel (Anguilla anguilla) in the Orbetello lagoon (Tuscany, Italy). Hydrobiologia 2005, 550, 237–249. [Google Scholar] [CrossRef]
  65. Sancho, E.; Fernandez-Vega, C.; Sanchez, M.; Ferrando, M.D.; Andreu-Moliner, E. Alterations on ache activity of the fish Anguilla anguilla as response to herbicide-contaminated water. Ecotoxicol. Environ. Saf. 2000, 46, 57–63. [Google Scholar] [CrossRef] [PubMed]
  66. Pierron, F.; Baudrimont, M.; Bossy, A.; Bourdineaud, J.; Brèthes, D.; Elie, P.; Massabuau, J. Impairment of lipid storage by cadmium in the european eel (Anguilla anguilla). Aquat. Toxicol. 2007, 81, 304–311. [Google Scholar] [CrossRef]
  67. Belpaire, C.; Reyns, T.; Geeraerts, C.; Loco, J.V. Toxic textile dyes accumulate in wild european eel Anguilla anguilla. Chemosphere 2015, 138, 784–791. [Google Scholar] [CrossRef]
  68. Maes, G.E.; Raeymaekers, J.A.M.; Pampoulie, C.; Seynaeve, A.; Goemans, G.; Belpaire, C.; Volckaert, F.A.M. The catadromous European eel Anguilla anguilla (L.) as a model for freshwater evolutionary ecotoxicology: Relationship between heavy metal bioaccumulation, condition and genetic variability. Aquat. Toxicol. 2005, 73, 99–114. [Google Scholar] [CrossRef] [PubMed]
  69. Tao, W.; Niu, L.; Dong, Y.; Fu, T.; Lou, Q. Nutrient Pollution and Its Dynamic Source-Sink Pattern in the Pearl River Estuary (South China). Front. Mar. Sci. 2021, 8, 713907. [Google Scholar] [CrossRef]
  70. Niu, L.; Cai, H.; Jia, L.; Luo, X.; Tao, W.; Dong, Y.; Yang, Q. Metal pollution in the Pearl River Estuary and implications for estuary management: The influence of hydrological connectivity associated with estuarine mixing. Ecotoxicol. Environ. Saf. 2021, 225, 112747. [Google Scholar] [CrossRef] [PubMed]
  71. Garcia-Vazquez, S.; Linde, A.R.; Ayllon, F.; Garcia-Vazquez, E. Induction of micronuclei in eel (Anguilla anguilla L.) by heavy metals. Ecotox Environ. Saf. 2001, 49, 139–143. [Google Scholar]
  72. Pujolar, J.M.; Marino, I.A.; Milan, M.; Coppe, A.; Maes, G.E.; Capoccioni, F.; Ciccotti, E.; Bervoets, L.; Covaci, A.; Belpaire, C.; et al. Surviving in a toxic world: Transcriptomics and gene expression profiling in response to environmental pollution in the critically endangered European eel. BMC Genom. 2012, 13, 507. [Google Scholar] [CrossRef]
  73. Palstra, A.P.; Ginneken, V.; Murk, A.J.; Thillart, G.E.E.J.M. Are dioxin-like contaminants responsible for the eel (Anguilla anguilla) drama? Naturwissenschaften 2006, 93, 145–148. [Google Scholar] [CrossRef] [PubMed]
  74. Dekker, W.; Casselman, J.M.; Cairns, D.K.; Tsukamoto, K.; Jellyman, D.; Lickers, H. Worldwide decline of eel resources necessitates immediate action: Québec Declaration of Concern. Fisheries 2003, 28, 28–30. [Google Scholar]
  75. Shuai, F.M.; Li, H.Y.; Li, J.; Jiang, T.; Yang, J.; Yang, W.L. Unravelling the life-history patterns and habitat preferences of the Japanese eel (Anguilla japonica) in the Pearl River, China. J. Fish Biol. 2023. early view. [Google Scholar] [CrossRef]
  76. Jellyman, D.J. Status of New Zealand fresh-water eel stocks and management initiatives. ICES J. Mar. Sci. 2007, 64, 1379–1386. [Google Scholar] [CrossRef]
Figure 1. Location of the glass eel collecting site in the Pearl River estuary.
Fishes 08 00256 g001
Figure 2. Schematic of the investigation set net.
Fishes 08 00256 g002
Figure 3. Length frequency distribution (a) and weight frequency distribution (b) of glass eels collected from the Pearl River Estuary. The measured number of glass eels is 503.
Fishes 08 00256 g003
Figure 4. Photo of Japanese glass eel collected in the Pearl River estuary.
Fishes 08 00256 g004
Figure 5. Violin plot of the occurrence of glass eels. The vertical length of each violin graph represents the duration of the Japanese glass eel collection time. The horizontal width of the graph represents the probability of the occurrence of a certain CPUE value. White dots represent the median of CPUE, and the small black rectangular boxes represent the quantiles of CPUE.
Fishes 08 00256 g005
Figure 6. The effects of environmental factors on the catches of glass eels during 2011–2022.
Fishes 08 00256 g006
Figure 7. Residuals and forecast errors from the fitted ARIMA ( 0 , 0 , 1 ) ( 0 , 1 , 0 ) 208 model for glass eels trends.
Fishes 08 00256 g007
Figure 8. Forecasts of the CPUE of glass eels from 2012 to 2026. The bright blue line is the forecast, and the dark gray area and the light gray area are the 80% and 95% confidence levels, respectively.
Fishes 08 00256 g008
Figure 9. The days on which the maximum number of glass eels were collected. The solid line represents the actual collection data, while the dotted line represents the predicted data.
Fishes 08 00256 g009
Disclaimer/Publisher’s Note: The statements, opinions and data contained in all publications are solely those of the individual author(s) and contributor(s) and not of MDPI and/or the editor(s). MDPI and/or the editor(s) disclaim responsibility for any injury to people or property resulting from any ideas, methods, instructions or products referred to in the content.

