Article

Relationship between Jaw Malformations and Long-Chain PUFA’s in Seriola lalandi Larvae during the Spawning Season at a Commercial Hatchery

1
Programa de Doctorado en Ciencias Agropecuarias, Escuela de Acuicultura, Laboratorio de Nutrición y Fisiología de Peces, Universidad Católica de Temuco, Temuco 4781312, Chile
2
Tierra del Sol Consultores, Vallenar 1610000, Chile
3
Botania SpA, Gestión de Proyectos Sector Agroalimentario, Santiago 8320000, Chile
4
Favet-Inbiogen, Faculty of Veterinary Sciences, University of Chile, Avda. Santa Rosa 11735, Casilla 2 Correo 15, Santiago 8320000, Chile
5
Centro de Investigación, Innovación y Creación UCT, Facultad de Recursos Naturales, Universidad Católica de Temuco, Temuco 4801057, Chile
6
Departamento de Ciencia Agropecuarias y Acuícolas, Facultad de Recursos Naturales, Universidad Católica de Temuco, Temuco 4781312, Chile
7
Núcleo de Investigación en Producción Alimentaria, Universidad Católica de Temuco, Rudecindo Ortega 02950, Temuco 4780694, Chile
*
Authors to whom correspondence should be addressed.
Fishes 2023, 8(4), 200; https://doi.org/10.3390/fishes8040200
Submission received: 6 March 2023 / Revised: 30 March 2023 / Accepted: 10 April 2023 / Published: 13 April 2023
(This article belongs to the Special Issue Feed and Nutrition Research in Aquaculture)

Abstract

:
Jaw malformations imply an important problem during the commercial production of Seriola lalandi larvae and juvenile fish in Chile and New Zealand. Since the rate of malformations in other fish species has been associated with the content of long-chain PUFA (LC-PUFA) in neutral lipids of the diet, the relationship between body LC-PUFA and the rate of malformations, together with a transcriptomic analysis of genes related to the metabolism and transport of lipids in commercially produced S. lalandi larvae have been investigated in the present work. A total of 10 batches of S. lalandi larvae were obtained and cultured at about 22 °C following the protocols of a Chilean commercial hatchery during the spawning season. There were three larval batches that were collected in August (austral winter), three batches that were obtained in October (spring), and finally four spawning events that were obtained in December-January (spring-summer). The rate and type of jaw malformations, the profile of long-chain PUFA (LC-PUFA) of total lipids during larval culture, and the distribution of LC-PUFA were analyzed. Additionally, a transcriptome analysis related to lipid metabolism in 40-day-old larvae was performed. As a result, a decrease in the rate of malformations was recorded from August to December. DHA showed a steep decrease between days 1 and 10 of culture, probably due to the consumption of yolk sac lipids, but a higher proportional change was noted in larvae that hatched during August. The DHA content in polar lipids (PL) and neutral lipids (NL) of 40-day-old larvae increased from August to December, so that the abundance of DHA was higher in PL in larvae that hatched in December, but it was higher in NL in those larvae that hatched in October. In conclusion, the rate of jaw malformations was associated with the rapid decline in DHA during early larval life and the highest abundance of DHA in neutral lipids at the end of the larval life.
Key Contribution: Changes in the quality of the broodstock diet during the spawning season affect the rate of mandibular malformations in S. lalandi larvae.

1. Introduction

The high incidence of skeletal deformities is an unsolved issue affecting the quality of hatchery-produced larvae and juveniles for a wide range of marine fish species [1,2]. Deformed fish have reduced biological performance in terms of growth rate and survival, and their presence increases production costs and losses for the industry as they require manual removal [1,3]. The rate of skeletal deformities varies widely among species, being particularly important in marine species, such as the yellowtail kingfish (YTK) (Seriola lalandi (Valenciennes, 1833)) and striped trumpeter (Latris lineata (Forster, 1801)), with values up to 95% [2]. Among the many different types of malformation described, the most severe are jaw deformities, which are present during the larval phase of cultured fishes [4]. Jaw deformities are manifested in several forms such as shortening, twisting and bending of the upper or lower jaw among other phenotypes [5,6,7,8,9].
The origin of malformations in farmed fish has received increasing attention over recent past years. Abiotic factors such as temperature, water flow rates, light intensity, salinity and biotic factors such as nutritional imbalances during larvae growth, have been proposed as causes for skeletal malformations [10,11,12]. It is clear that unbalanced levels of micronutrients such as vitamin A, vitamin D, and vitamin C affect the morphogenesis of marine fish larvae resulting in a higher incidence of larval deformities [10,13,14,15]. However, there is strong evidence supporting a close relationship between dietary long-chain polyunsaturated fatty acids (LC-PUFA) and skeletal health in marine fishes [16,17,18]. LC-PUFAs are commonly defined as polyunsaturated fatty acids with ≥C20 and ≥3 double bonds. This definition includes eicosapentaenoic acid (EPA, 20:5n-3), docosahexaenoic acid (DHA, 22:6n-6), arachidonic acid (ARA, 20:4n-6), and docosapentaenoic acid (DPA, 22:5n-3) [19,20]. LC-PUFAs are essential for normal growth development, behavior, stress response, and survival of marine fish larvae. Since marine fish are not able to synthesize LC-PUFAs, they need to obtain them from diet [16,21,22,23,24,25].
In milkfish (Chanos chanos), the use of live prey enriched with DHA increases larval survival and reduces operculum deformities by 50% in 85-day-old fingerlings [17]. In red porgy larvae, a 50% reduction in deformed fish (vertebral fusions and cranial malformations) was obtained when the larvae were fed with higher DHA levels [23,26]. Similar results have been obtained in Sparus aurata larvae of 34 days post hatching (dph); those fed with low DHA-enriched rotifers showed the highest incidence of lordosis and kyphosis, and retarded mineralization of the vertebrae [27]. Larvae fed with rotifers enriched with medium DHA show the lowest percentage of total deformities, while larvae fed with rotifers enriched with high levels of DHA (5.2%) presented increased maxillary and mandibular deformity and neural spine anomalies [27].
Additionally, the evidence suggests that the ratio of the LC-PUFAs is important as well as their individual dietary concentration. For instance, the balance of DHA/EPA in enriched live food or formulated inert food seems to be more important than the amount of each LC-PUFA by itself [18,28]. Since little is known about the optimal DHA/EPA ratio for feeding marine larvae, the lipid composition of eggs and yolk sac larvae, and its variation during development is utilized so far as an indicator for determining the appropriate composition of nutritional elements. Most of the research about the role of nutrition in fish skeletal malformation has been performed at the larval and juvenile stages of development. However, craniofacial development begins at early stages of embryonic development when a cell population named neural crest is induced and differentiates into craniofacial cartilage which develop later into the pharyngeal bones and skull [29]. S. lalandi deformed larvae have been observed before first feeding (4 dph), suggesting that both nutritional factors present in the embryonic yolk and broodstock diets needs to be studied as possible causative factors of deformities [6,9].
As a summary, dietary fatty acids are known as an essential factor that greatly affects spawning performance, fatty acid composition of eggs, and larval quality [30,31,32], and they have been related to the rate of larval malformations in some species of marine fish [33]. Based on these facts, the present work is aimed at disclosing the potential relationships between the content of body LC-PUFA and the differential expression of lipid-related genes on the one hand, and the rate of jaw malformations in S. lalandi larvae produced under commercial conditions on the other hand,.

2. Materials and Methods

2.1. Broodstock and Egg Collection

The experiments were carried out at the Acuícola del Norte company’s facilities (ACUINOR), Caldera, Chile (26°54′55″ S; 70°48′52″ W). The broodstock comprised of 24 adult individuals and were kept at a male to female ratio of 1:1.2, in indoor cylindrical concrete tanks of 85 m3 in a recirculating aquaculture system (RAS) with controlled photoperiod and temperature. The broodstocks were subjected to a 15L:9D photoperiod, water temperatures of 19 °C, 6.5 mg L−1 O2 concentration, and feeding three times per week at 1% of body weight according to regular productive protocols of the company. The spawning events occurred during the reproductive window spontaneously [34]. Within a single spawning season, we studied three phases, early, middle, and late spawning. Selecting 3 spawning events for early spawn (August), 3 for middle spawn (October), and 4 for late spawn (December) (Figure 1). The spawned eggs were channeled from a skimmer on the surface of the concrete tank into a separate 0.1 m3 egg collector.

2.2. Embryos and Larval Rearing

The fertilized eggs that were collected before were incubated in 0.35 m3 tanks at 19 °C until hatching (72 h later). The larvae that hatched from the fertilized eggs earlier were reared in 0.6 m3 tanks at 21.75 ± 1 °C with a density of 60–100 larvae L−1 until 40 dph. There were ten tanks that were supplied with open water to a maximal flow rate of 7 L min−1, with a 12L:12D photoperiod and constant temperature. Water temperature and dissolved oxygen were measured daily using an oxygen meter (Handy Polaris, OxyGuard, Birkerød, Denmark). From start feeding (3 to 9 dph), larvae were fed with rotifers (Brachionus plicatilis) two times per day (09:00 and 15:30 h), with an initial concentration of 15–20 individuals per ml. From 10 to 40 dph, feeding with artemia (Artemia salina) was applied at a density of 2–4 artemia per ml, both enriched with commercial product (Artikol, Nutra-kol, Perth, Western Australia) according to the feeding protocol of the company. Green water (Nannochloropsis microalgae) was maintained during the rotifers and artemia feeding period. Commercial pellets (cPe) were introduced at 15 dph and were maintained until 40 dph. Particle size offered to 15–25 dph larvae was 0.3 mm and to 25–40 dph larvae was 0.5 mm.

2.3. Broodstock Feed and Proximal Analysis

Broodstock were fed with three diets, Diet A (dA), Diet B (dB), and a commercial pellet (cP). Additionally fresh food (mackerel fresh fish) was added occasionally during the period of July-December (Table 1). Diets A and B were prepared with a commercial moist feed based on Broodstock Dry Mix (Skretting Chile) and by mixing ingredients such as fish oil, soy lecithin, and gelatin. However, Diet A, but not Diet B had vitamin E and C. After the ingredients were well mixed, the dA and dB were delivered in the form of a sausage. The third diet was a cP (Skretting, Puerto Montt, Chile) that was specially designated for S. lalandi broodstock. Finally, fresh food (mackerel fresh fish), dA, dB, and cP were provided according to the feeding protocols of the company (Table 1).

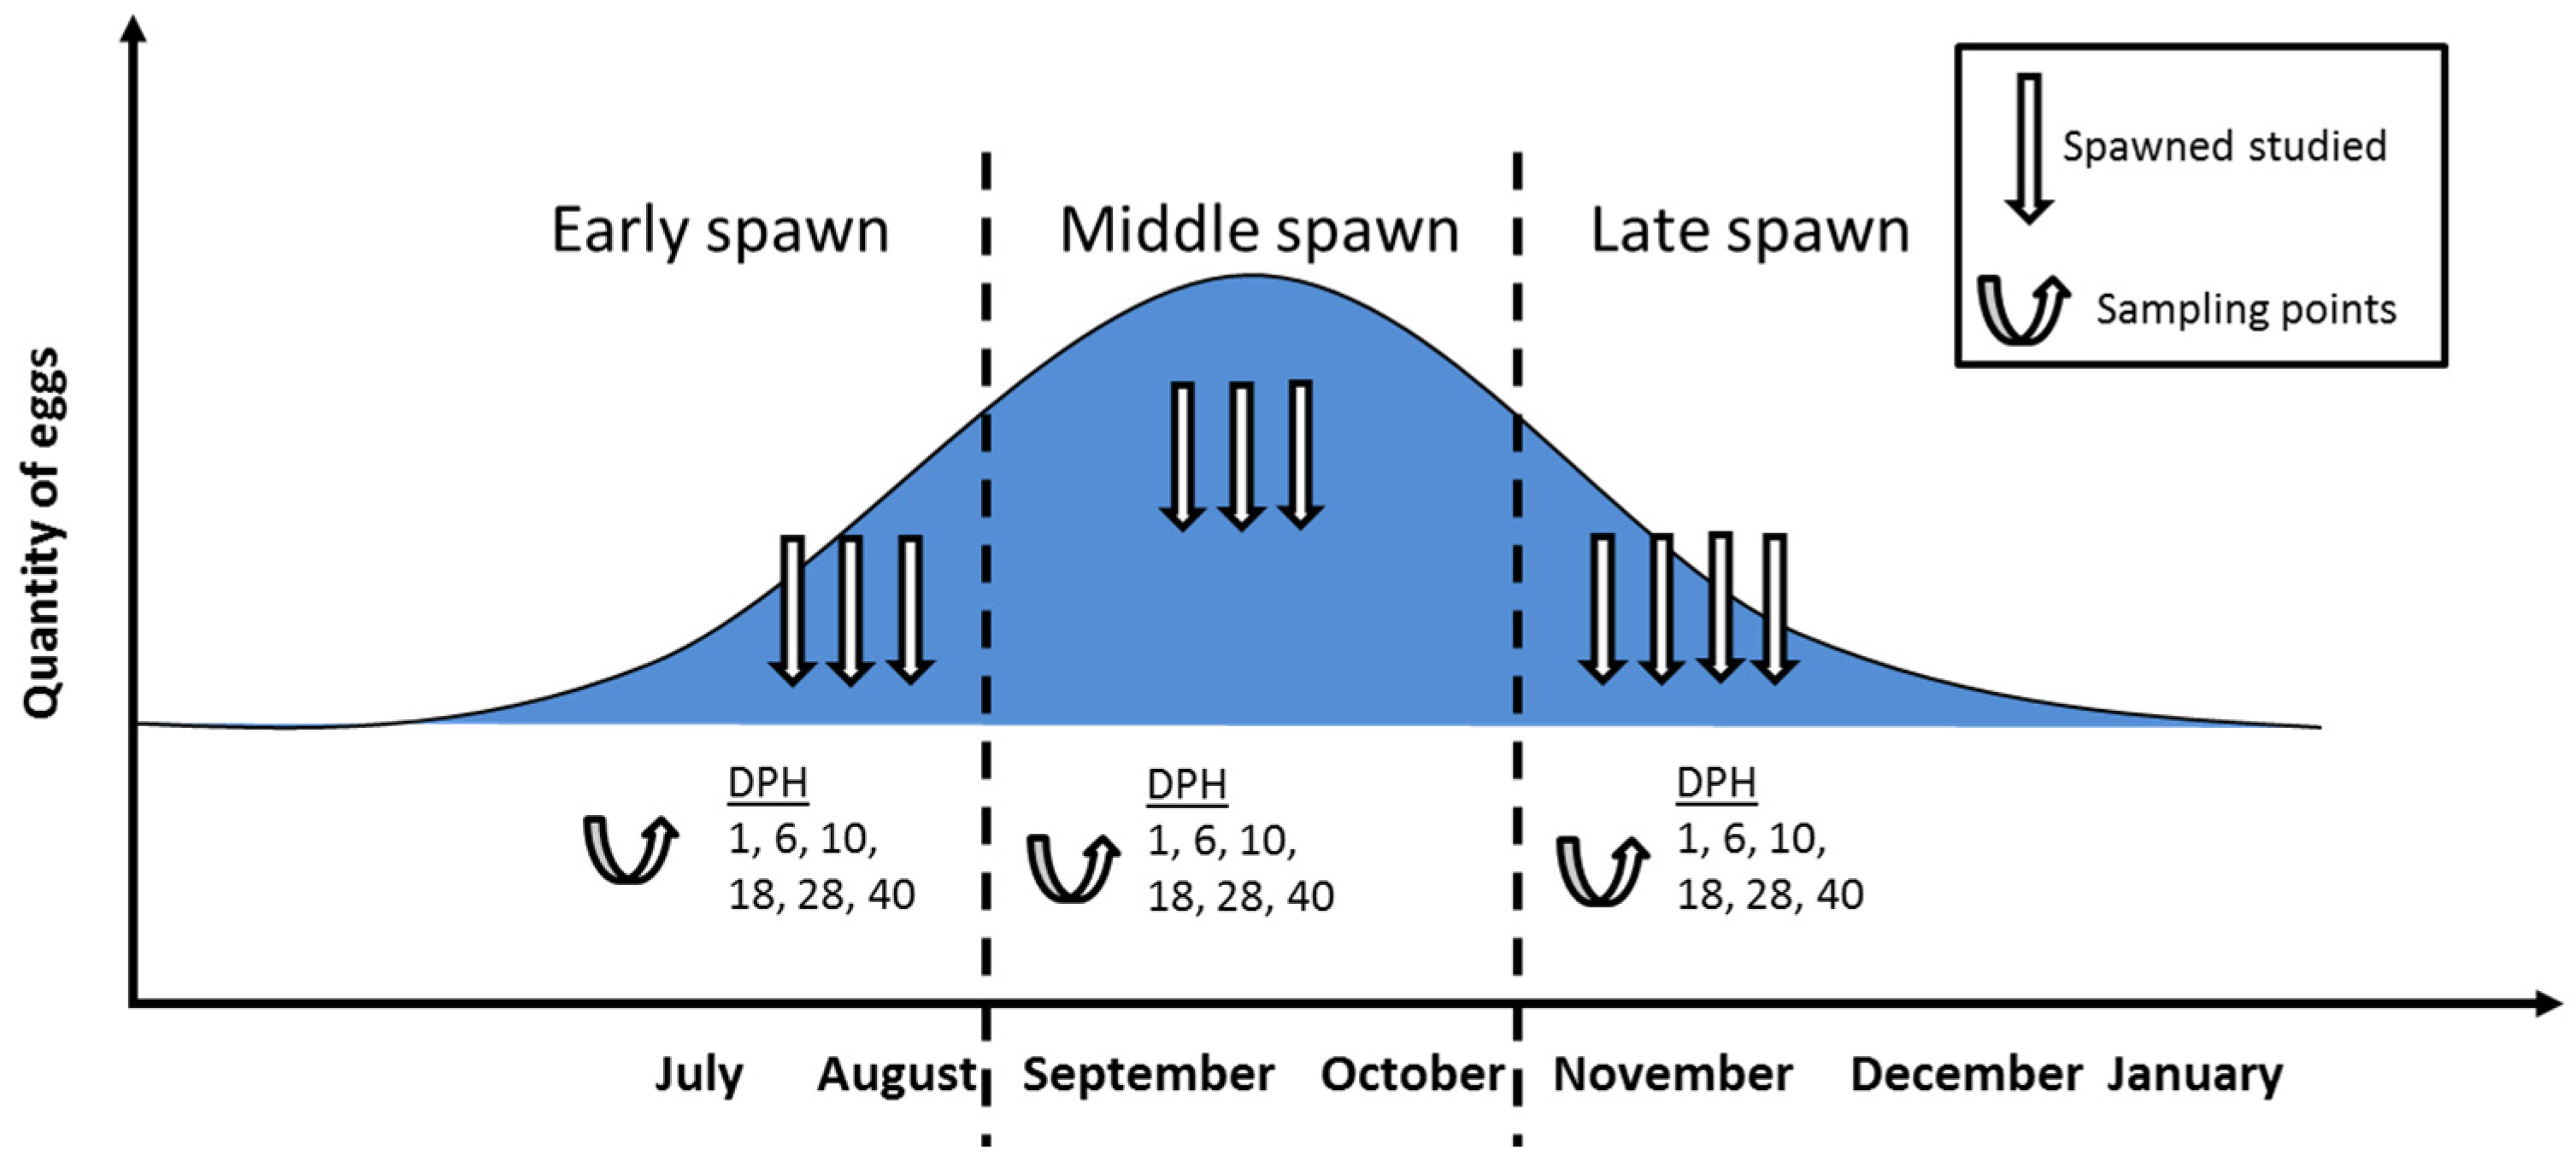
2.4. Sample Collection

Larvae samples were randomly collected at 1, 6, 10, 18, 28, and 40 dph from ten tanks corresponding to different spawning events in August, October, and December as shown previously (Figure 1 and Table 1). For lipid analysis of these larval samples which represents each dph and each spawning event (early, middle, and later), three samples of 1 g were collected, washed with fresh water, and immediately stored at −80 °C until analysis.
The crude protein, moisture, and ash content were analyzed following A.O.A.C. methods [35] (Table 2).

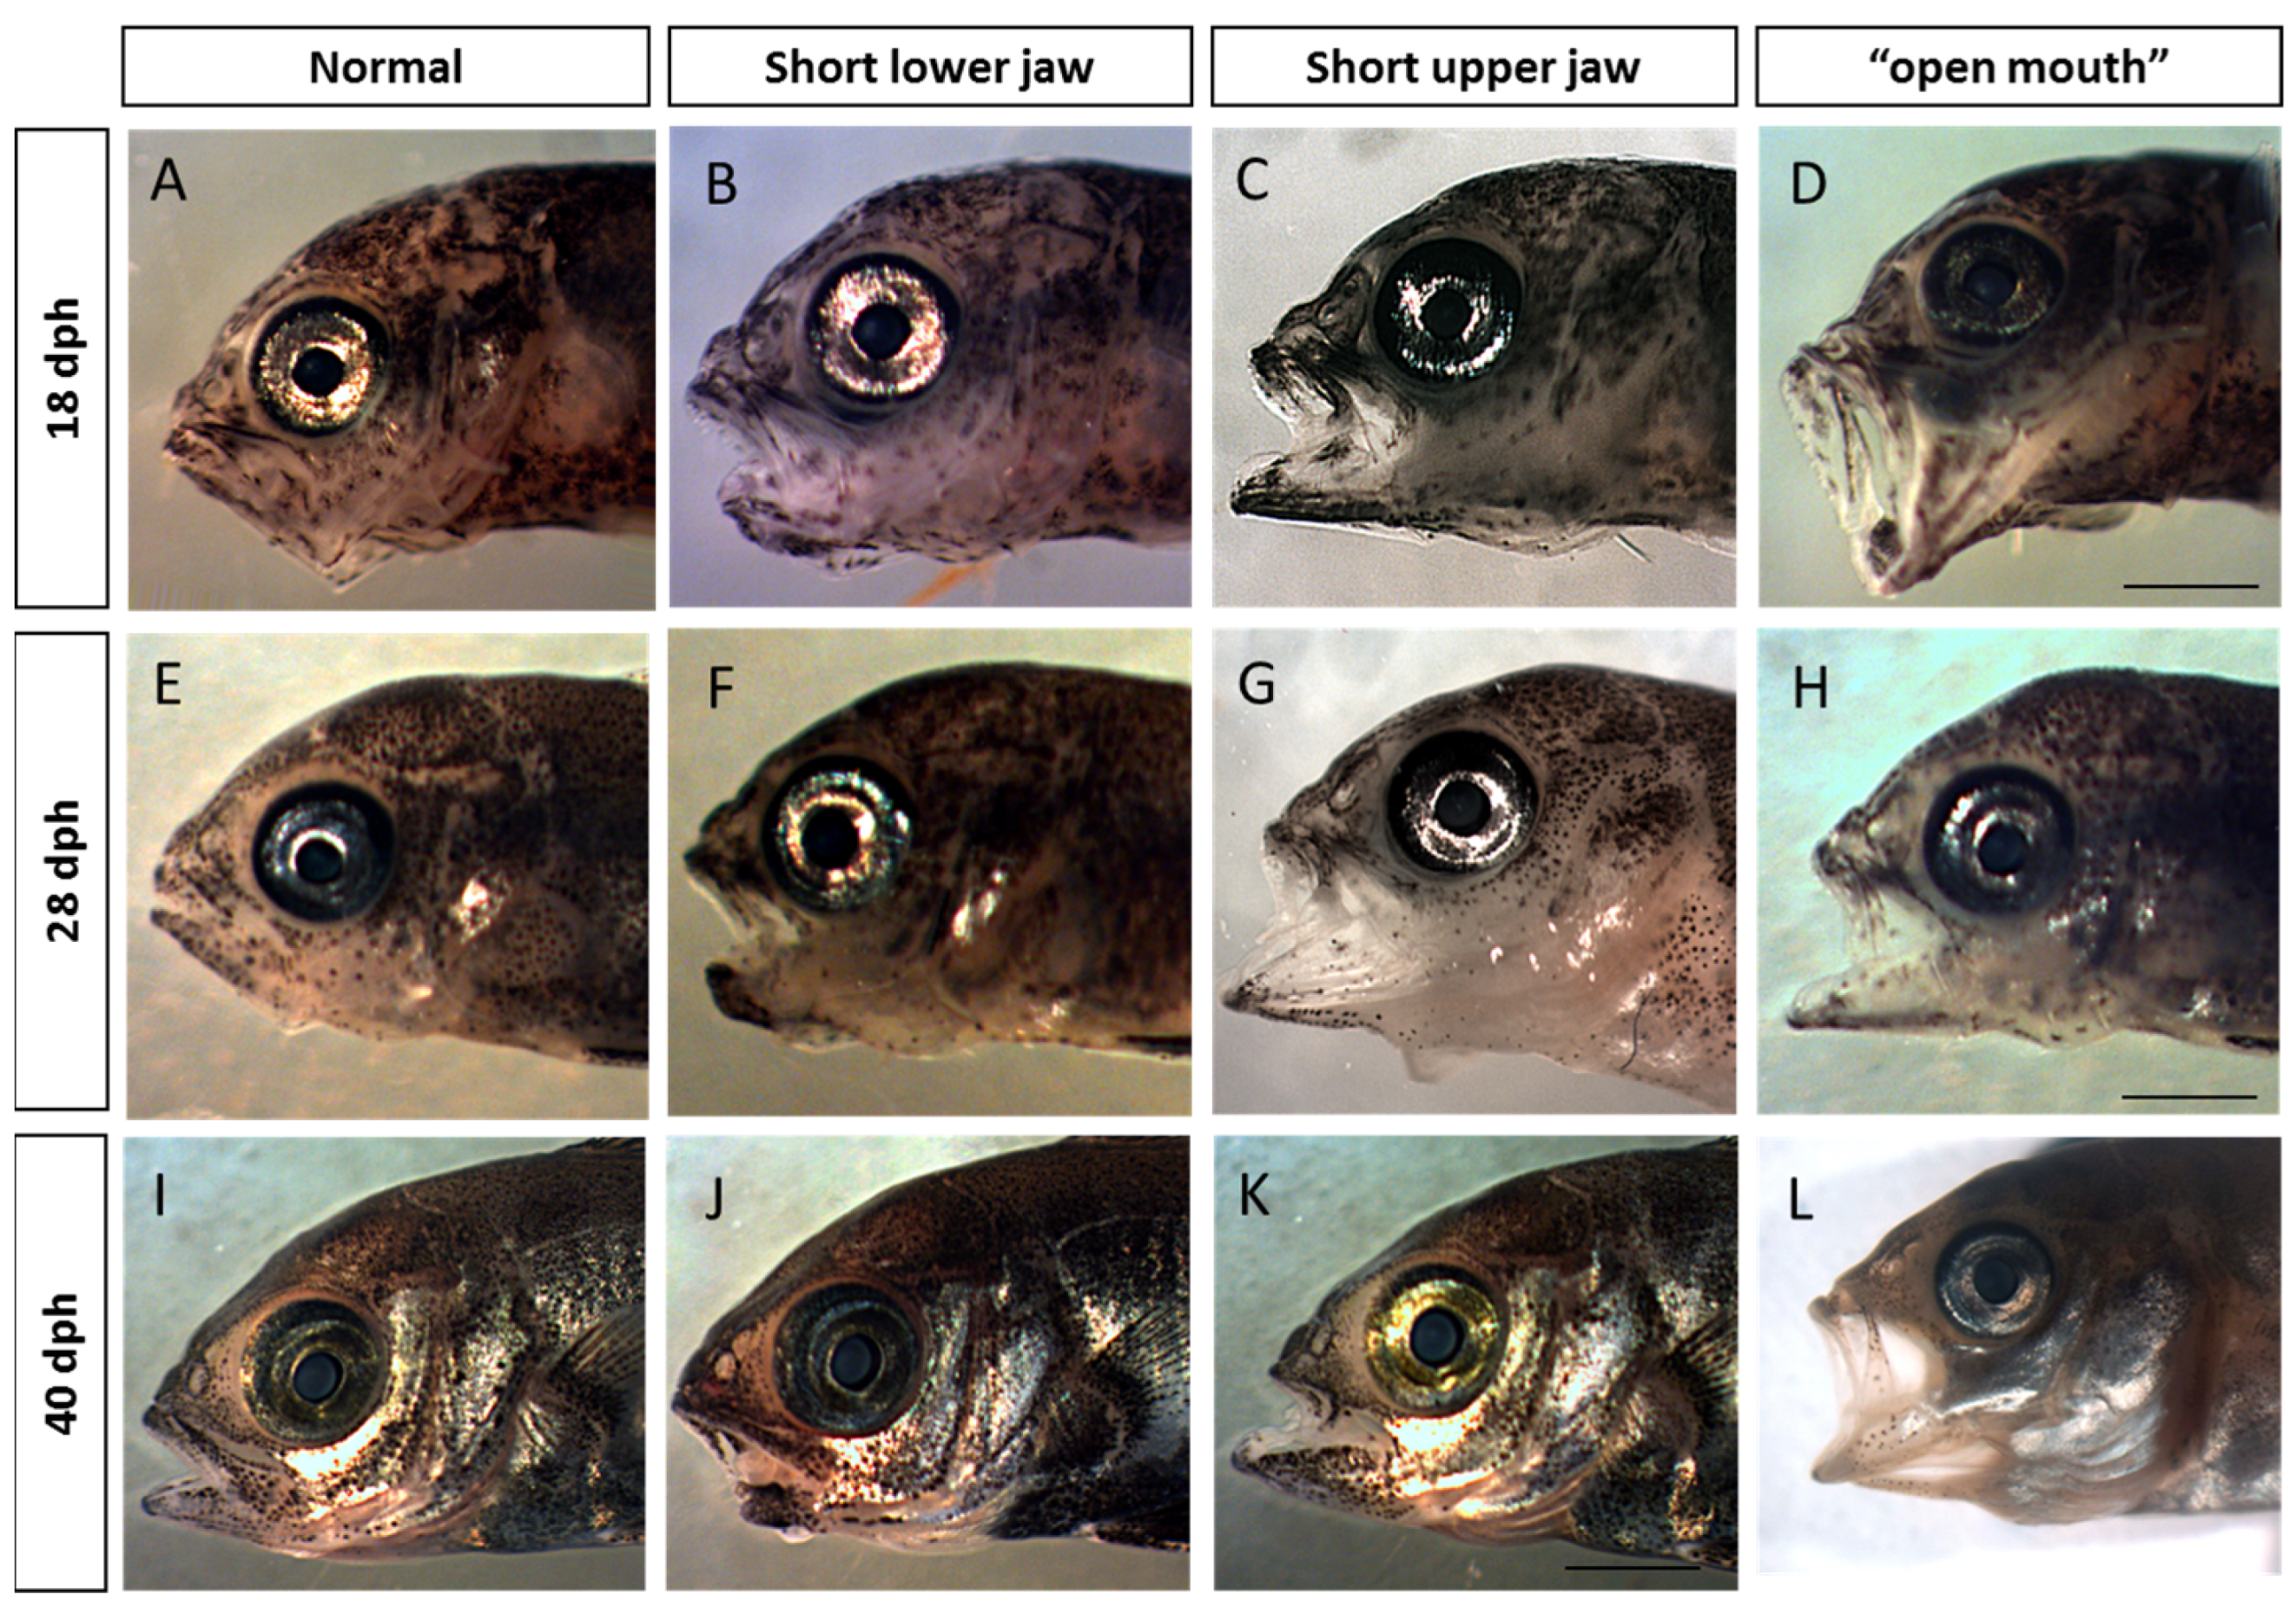
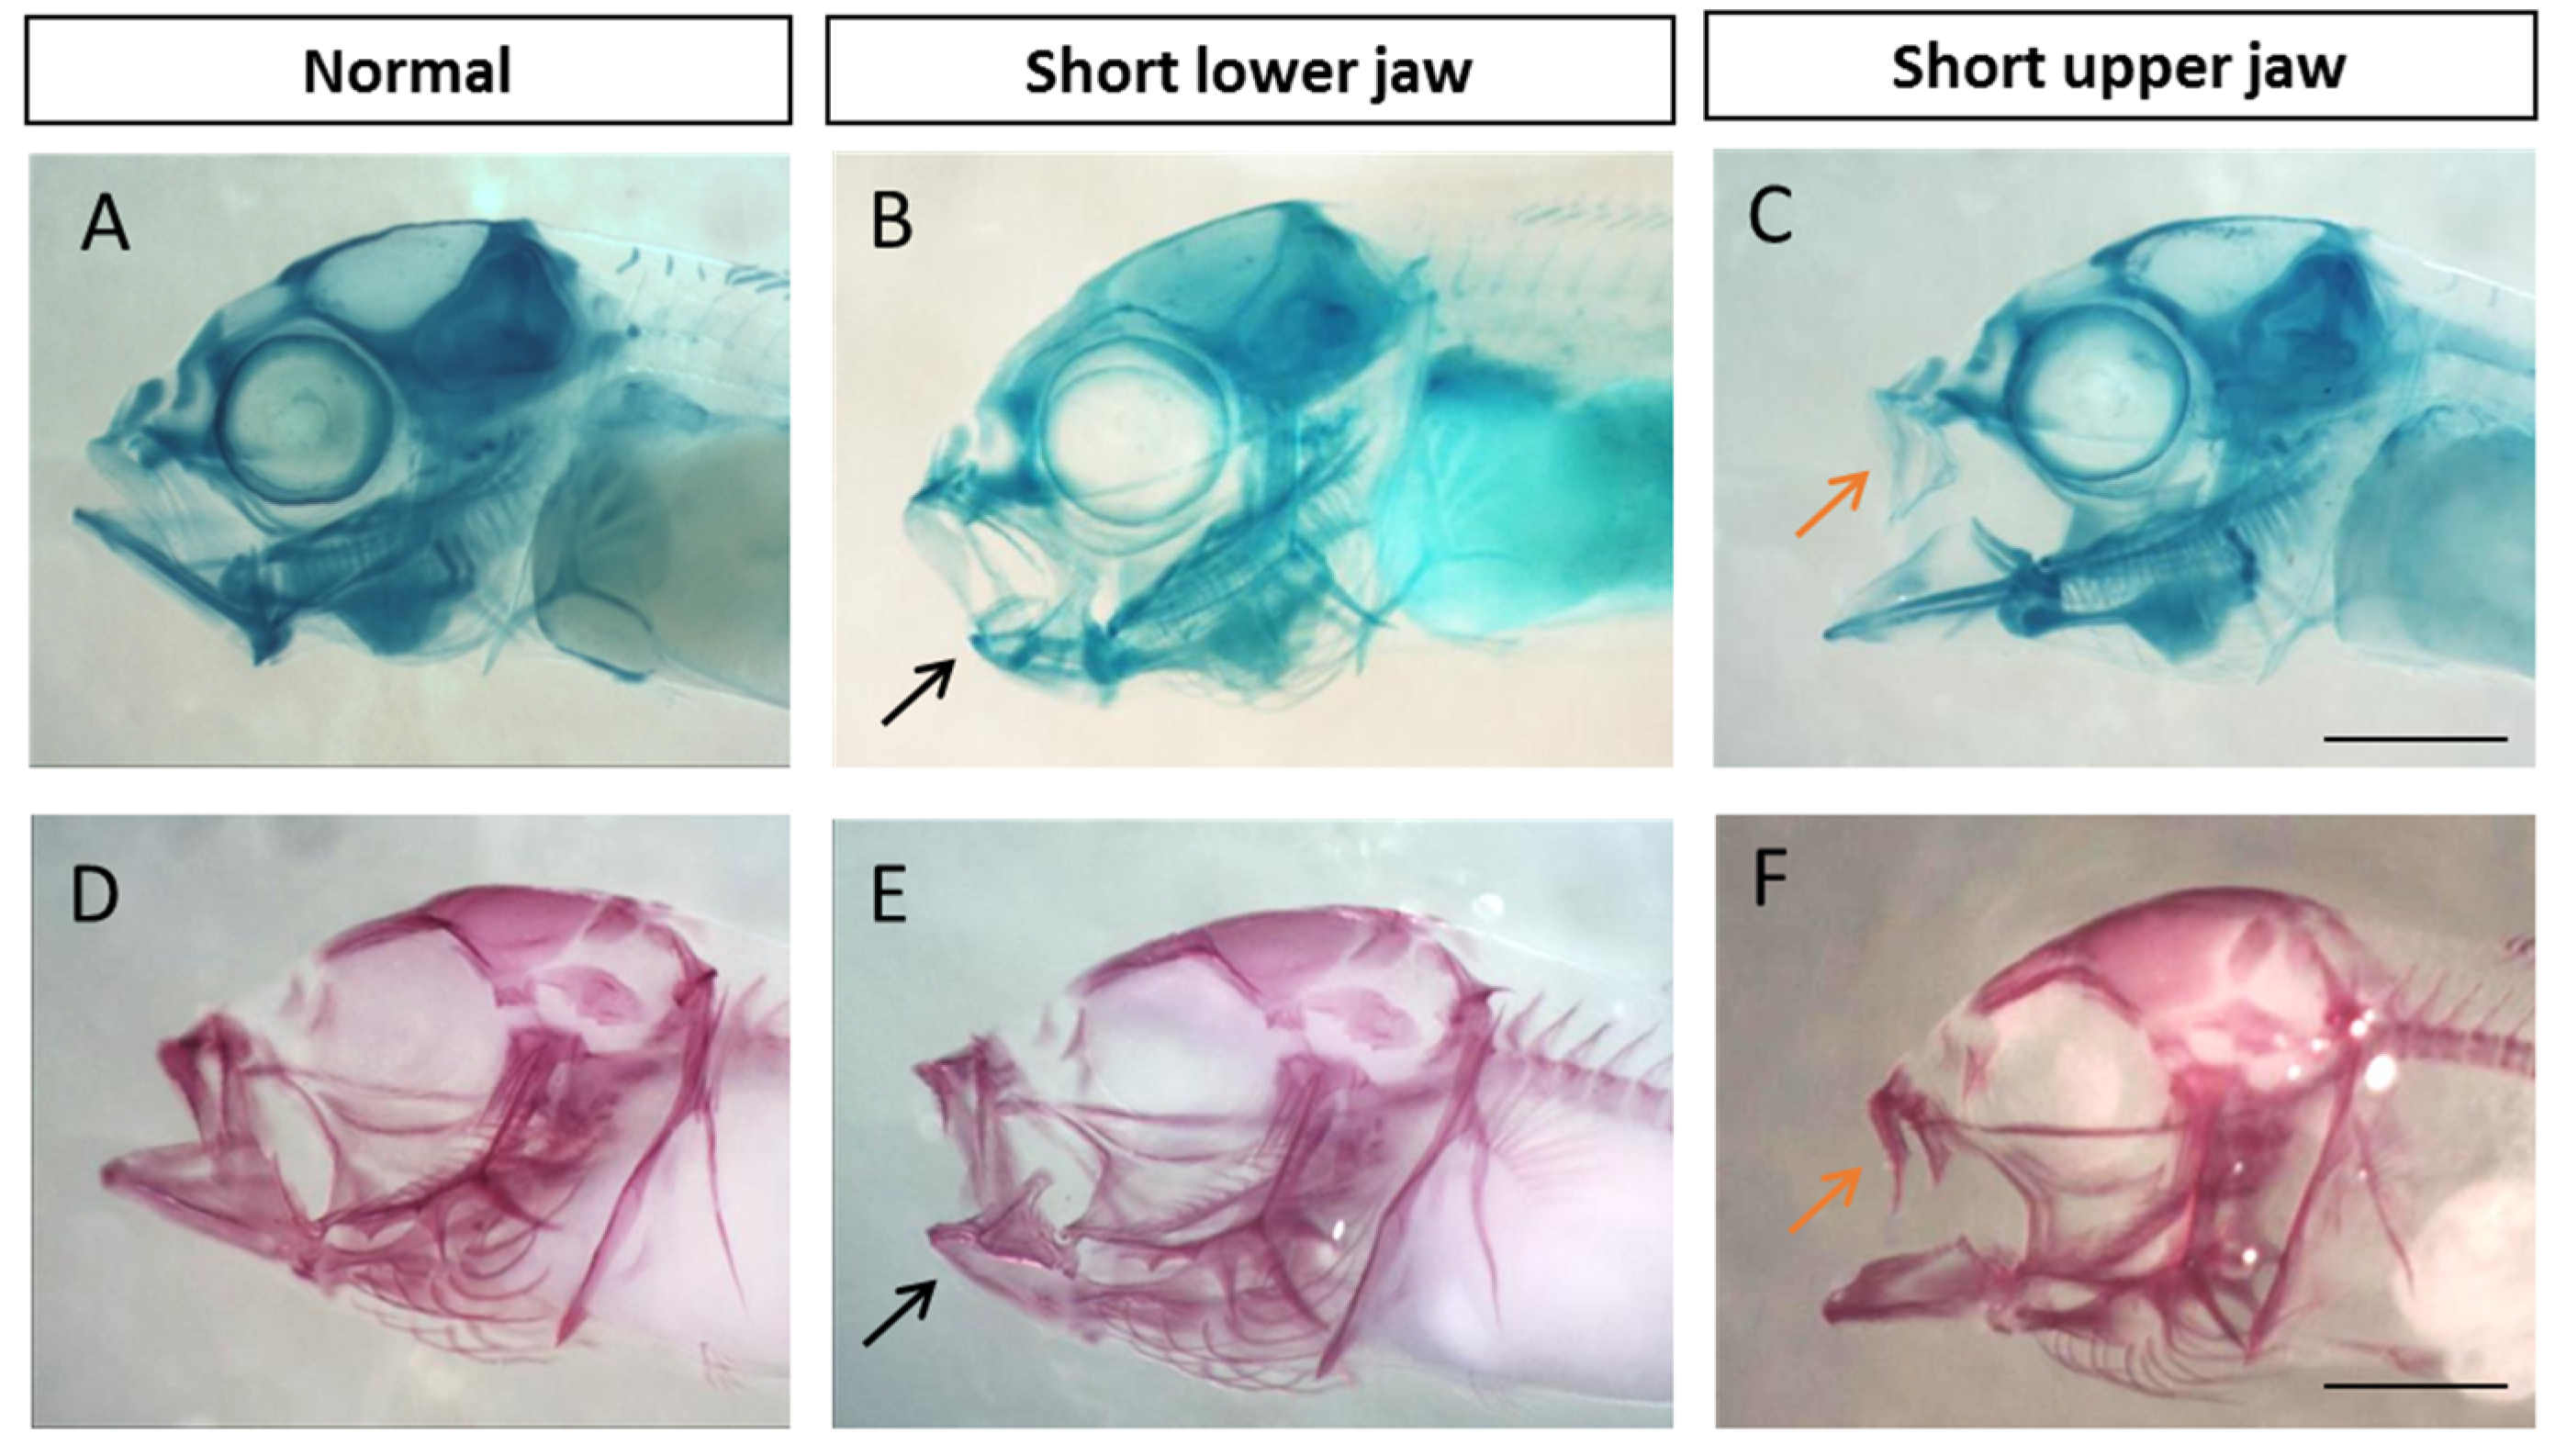
2.5. Visualization and Malformation Analysis

To survey jaw deformities, a sample of 100 larvae were collected from each spawning event at 18 and 28 dph, anaesthetized with 1% benzocaine, and fixed overnight in 4% paraformaldehyde.
Each larva was examined for jaw and opercula deformities by visual assessment under stereomicroscope. The incidence of all deformity types was recorded. The classification of cranial malformation was performed according to [6,9]. The types of deformities were as follows: shortened lower jaw, shortened upper jaw, elongated lower jaw, open mouth, and short operculum. The larvae were cleared in hydrogen peroxide solution and incubated overnight in 0.1% alcian blue or in 2% alizarin red for cartilage staining [36] or bone staining, respectively.

2.6. Lipid and Fatty Acid Analysis of Whole Body

In every spawning studied (early, middle, and late), lipids were extracted from 150–200 mg homogenized whole body sample with a mix of chloroform and methanol (2:1) containing 0.01% BHT as antioxidant [37]. Methyl esters from fatty acids obtained from lipids were prepared as described by Morrison and Smith (1986) [38]. Fatty acids methyl esthers (FAME) were separated by gas-liquid chromatography (Hewlett Packard 6890 series II Plus, Wilmington, DE, USA) and identified by comparison with a well characterized standard. The FAME from the whole-body larvae were analyzed by comparison with a well characterized standard such as SUPELCOTM 37 component FAME Mix (Sigma-Aldrich, St. Louis, MO, USA). Fatty acids were expressed as the percentage of total identified FAME (wet basis). FAME with percentages close to 0% were discarded.

2.7. Gene Expression Analysis Based on Transcriptomic Data

2.7.1. RNA Isolation

The total RNA was extracted from normal and deformed jaws of 40 dph juveniles (fish showing an abnormal jaw were classified as deformed phenotype and the no obvious deformities were classified as normal) using TRIzol™ Reagent (Invitrogen Life Technologies, Carlsbad, CA 92008, USA) according to the manufacturer’s instructions. Quantification of RNA was performed with the Qubit® RNA quantification assay (Life Technologies, Carlsbad, CA 92008, USA). RNA integrity assessed as the RNA Quality Number (RQN) was calculated for each sample and only those with an RQN higher than 8 were used for the elaboration of genomic libraries.

2.7.2. cDNA Library Preparation, Sequencing, and Mapping for Transcriptome Analysis

RNA pools from jaws were used for genomic library preparation, where four normal and deformed jaw juveniles formed each pool, with an input of 1 µg total RNA for the elaboration of each genomic libraries. A total of four libraries, two for each phenotype, were prepared using KAPA Stranded mRNA-Seq kit (Illumina® platform) according to the manufacturer’s instructions. The quality of the libraries (fragment average size) was evaluated with Fragment Analyzer™ using High Sensitivity NGS Fragment Analysis Kits (Advanced Analytical Technologies, Inc., Tappan, NY, USA). We quantified libraries by qPCR using the KAPA Library Quantification Kit Illumina® platforms (Kapa Biosystems, Boston, MA, USA). Libraries were sequenced on the MiSeq System (Illumina, Inc., San Diego, CA, USA) using a MiSeq Reagent Kit v3 of 150 cycles in paired-end at the Favet-Inbiogen, University of Chile, Chile.

2.7.3. Differential Expression Analysis of Lipid Metabolism-Related Genes

After removing low-quality reads, remaining adapters, and short length reads (less than 50 bp), we used the S. lalandi reference transcriptome to map reads using the CLC genomics workbench [39]. The parameters used for mapping were a mismatch cost of 2, insertion cost of 3, deletion cost of 3, a minimum contig length of 180 base pairs (bp), and a similarity of 0.8. The expression values were estimated in total counts and analyzed with EdgeR [40]. We considered genes as significantly differentially expressed when the corrected p-value (FDR) was <0.05 between groups, and expression values differed by more than two-fold. The enrichment of significant genes was carried out using human as the best matching species with shinygo (https://doi.org/10.1093/bioinformatics/btz931 (accessed on 25 March 2023)).

2.8. Statistical Analysis

Data on the total rate of jaw malformation were analyzed with a repeated measures ANOVA (RM Anova) by sampling month and culture day (the repetition factor). Data on the larval proportion of LC-HUFA over culture time were similarly analyzed. Data on the proportion of LC-HUFA in neutral lipids (NL) and polar lipids (PL) of 40-day-old larvae were analyzed by a RM ANOVA where the repetition factor was the polar fraction, and the between-subjects factor was the sampling month. The relationships between the percentage of LC-HUFA in NL and PL and the rates of jaw malformations in 18-day-old and 40-day-old larvae were explored measuring the Spearman’s rho correlation coefficient of each pair of variables. The transcriptome analysis was analyzed with EdgeR, a package for the analysis of RNA-Seq data in studies of differential gene expression. Assumptions for each statistical test were checked and the data were subjected to transformations suitable to meet those assumptions. The significance level was set at 0.05.

3. Results

3.1. Malformation Types and Frequency during Early, Middle, and Late Spawning Events

During the phases of spawning (Figure 1), three deformed phenotypes were clearly recognizable in comparison with normal individuals (Figure 2A,E,I and Figure 3A,E). These phenotypes are short lower jaw (Figure 2B,F,J and Figure 3B,E), short upper jaw (Figure 2C,G,K and Figure 3C,F), and open mouth (Figure 2D,H,L). Shortening of the lower jaw consists of the severe reduction in dentary and angular components of the lower jaw between the retroarticular and the anterior point of the jaw (Figure 2B,F,J and Figure 3B,E). Shortening of the upper jaw comprises the malformation of the premaxilla and maxilla bones. The maxilla is not completely developed and extended to the ventral direction towards the dentary and angular bones (Figure 2C,G,K and Figure 3C,F). Lower jaws are projected to the anterior and extensive soft tissue is developed between the upper and lower jaws (Figure 2G). The open mouth phenotype is characterized by the inability of the larva to articulate the jaw. Opercular shortening is frequently observed in 28 and 40 dph larvae (Figure 2I,H).
The frequency of occurrence of each phenotype in 18 and 40 dph for each sampling point is shown in Figure 4. The frequency of total jaw malformations was not significantly different between 18 dph and 40 dph (p = 0.07). The maximum percentage of deformities was observed during August, with 20% and 25% deformed larvae at 18 and 40 dph, respectively. The lower percentage of total abnormalities was observed during December (p = 0.001), affecting only 10% of the total larvae at 40 dph. In the same period, the short lower jaw phenotype was not observed in any of the four spawnings analyzed. The Spearman’s rank correlation between the rate of total jaw malformations at day 18 and at day 40 was not significant (p = 0.150).

3.2. Proximate Composition of Diets Used to Feed S. lalandi Broodstock

During the spawning period the feeding of broodstock changed over time (Table 1). In July they were fed only with semi-moist diet A. From August to October, they were fed with semi-moist diet A supplemented with fresh fish. In November, the fish were fed with a mixture of semi-moist diets A and B (with similar composition and moisture) (Table 2) and supplemented with commercial pellets. In December, they were fed exclusively with commercial diet (cP). Since the cP diet was found to contain a much lower portion of water than diets A and B (Table 2) and the feeding rate per week during the entire study was constant, the feeding scheme implemented by the commercial farm resulted in an increase of lipids and proteins ingestion by the broodstock fish at the end of the spawning season. The ingestion of lipids was particularly increased because the protein:lipids ratio was close to 2 in the commercial diet whereas it was 7–10 in the semi-moist diets and fresh fish (Table 1).

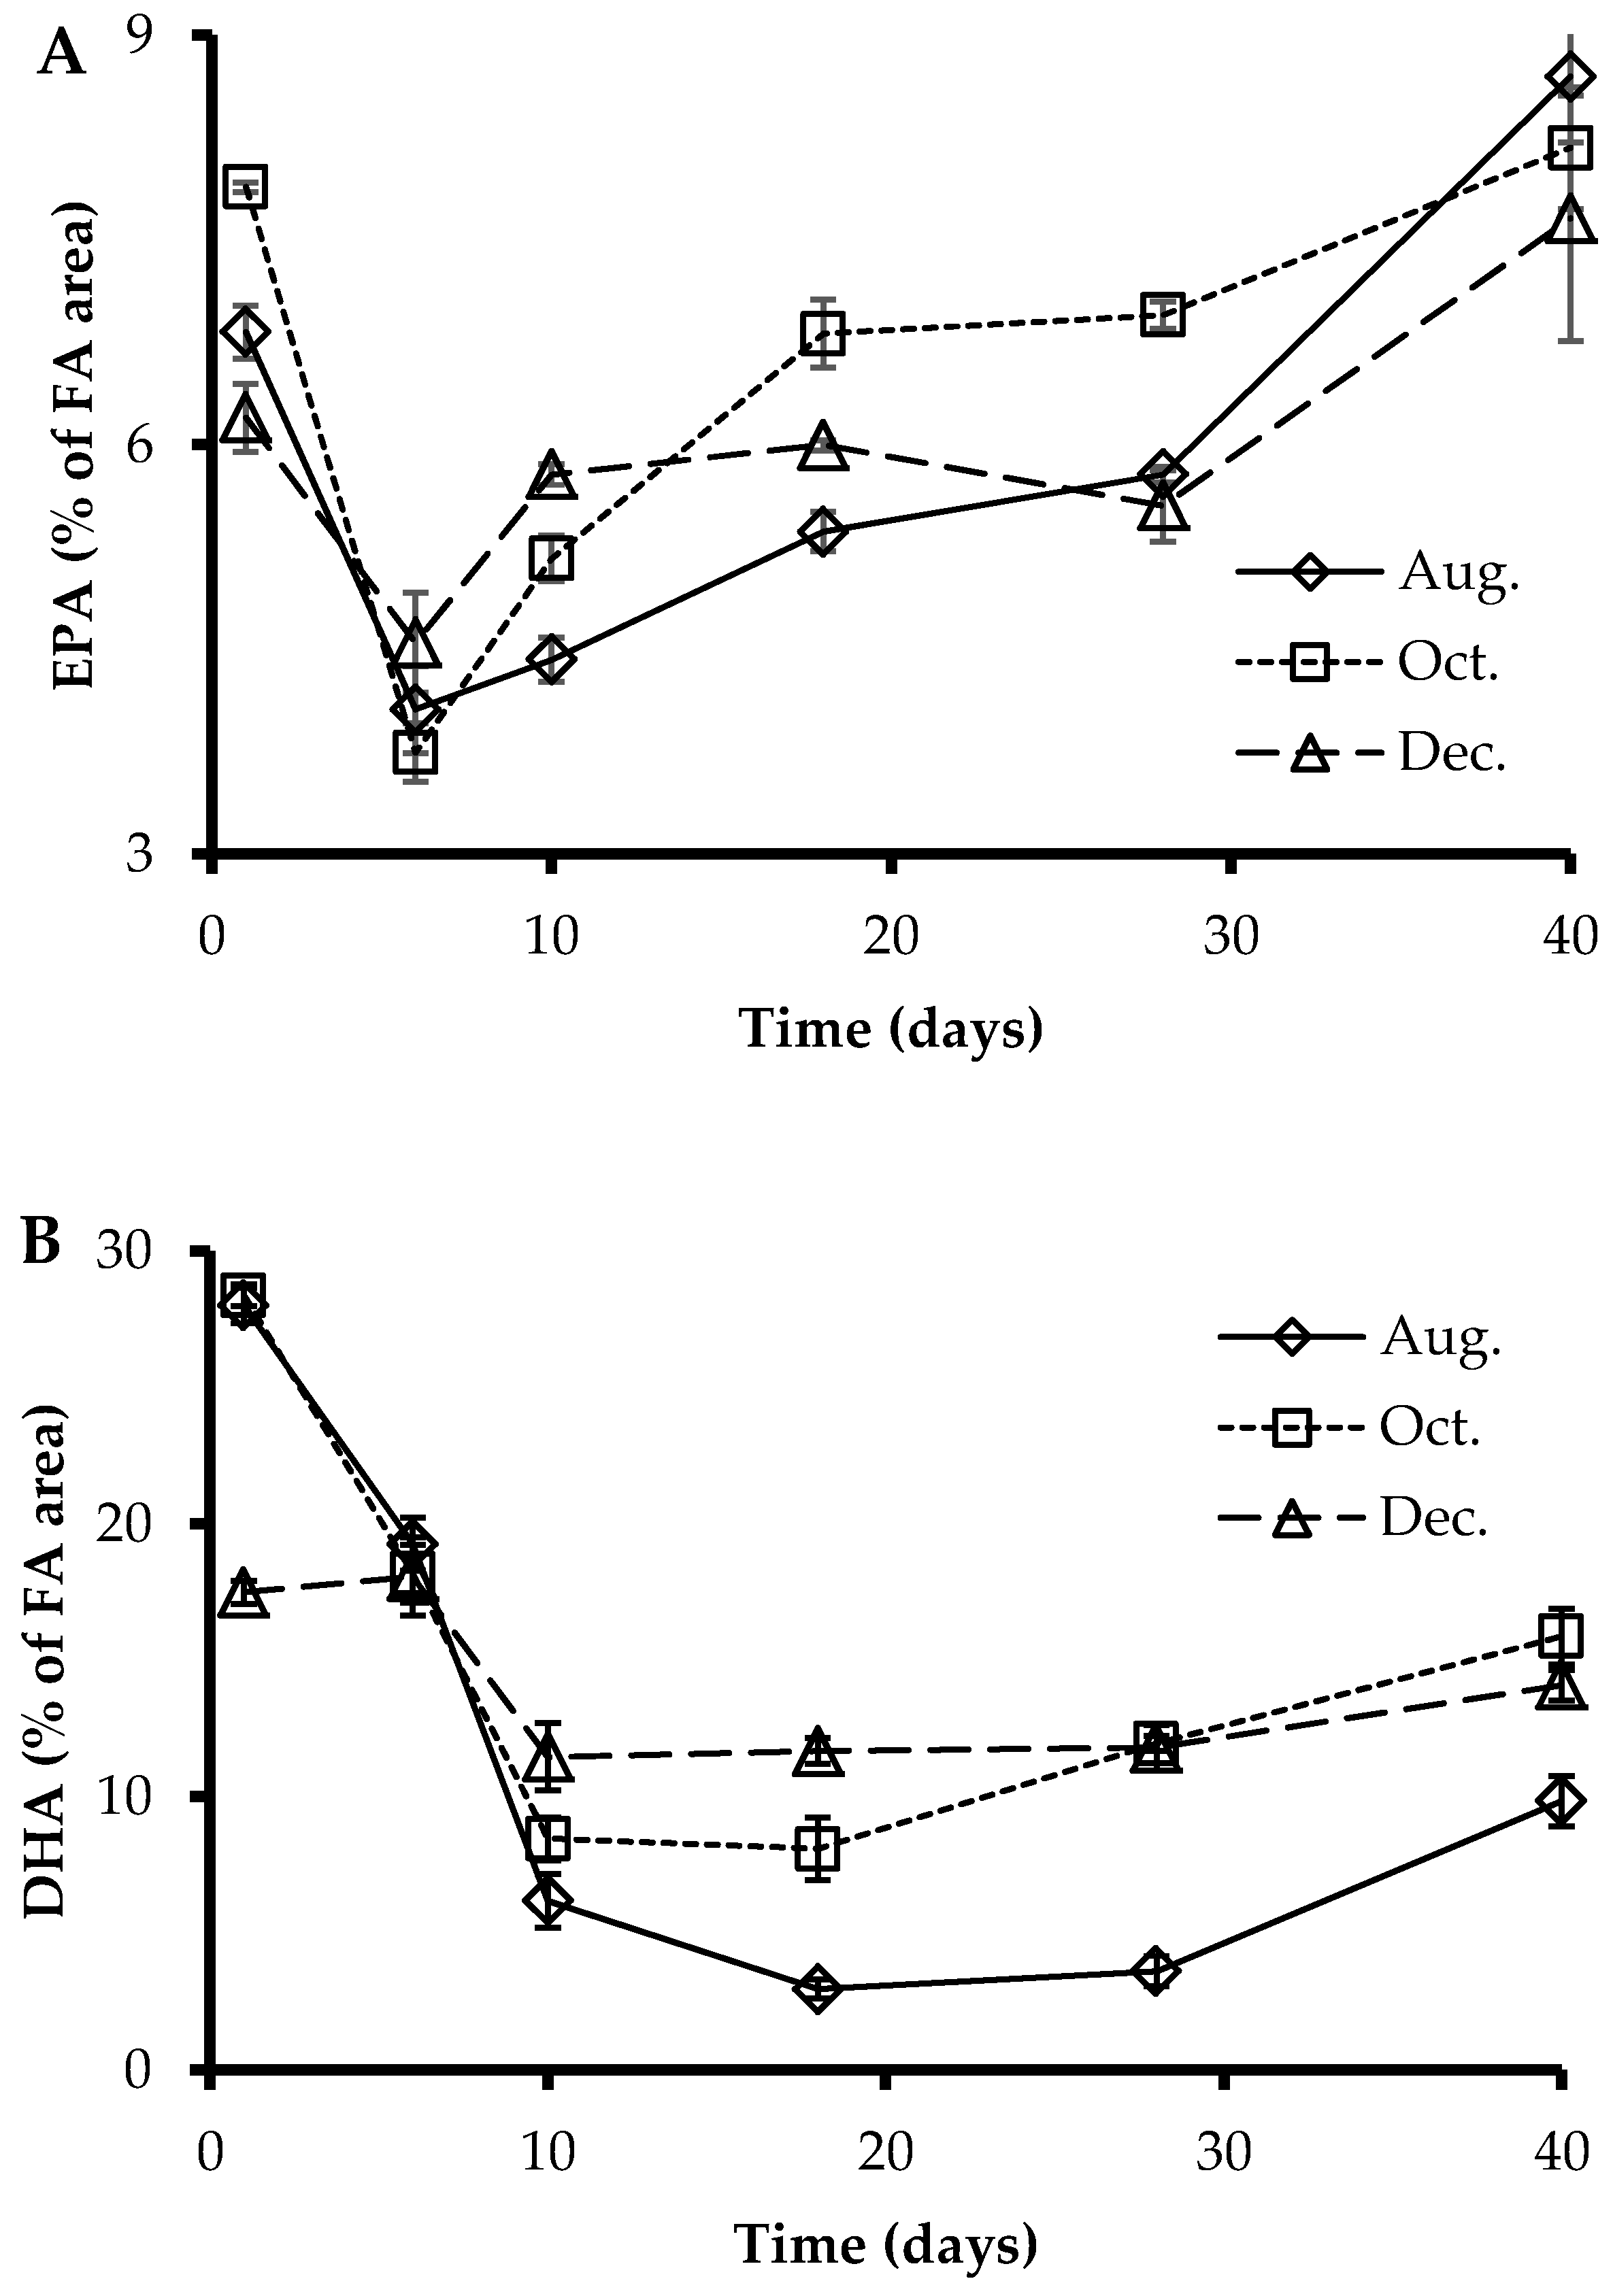
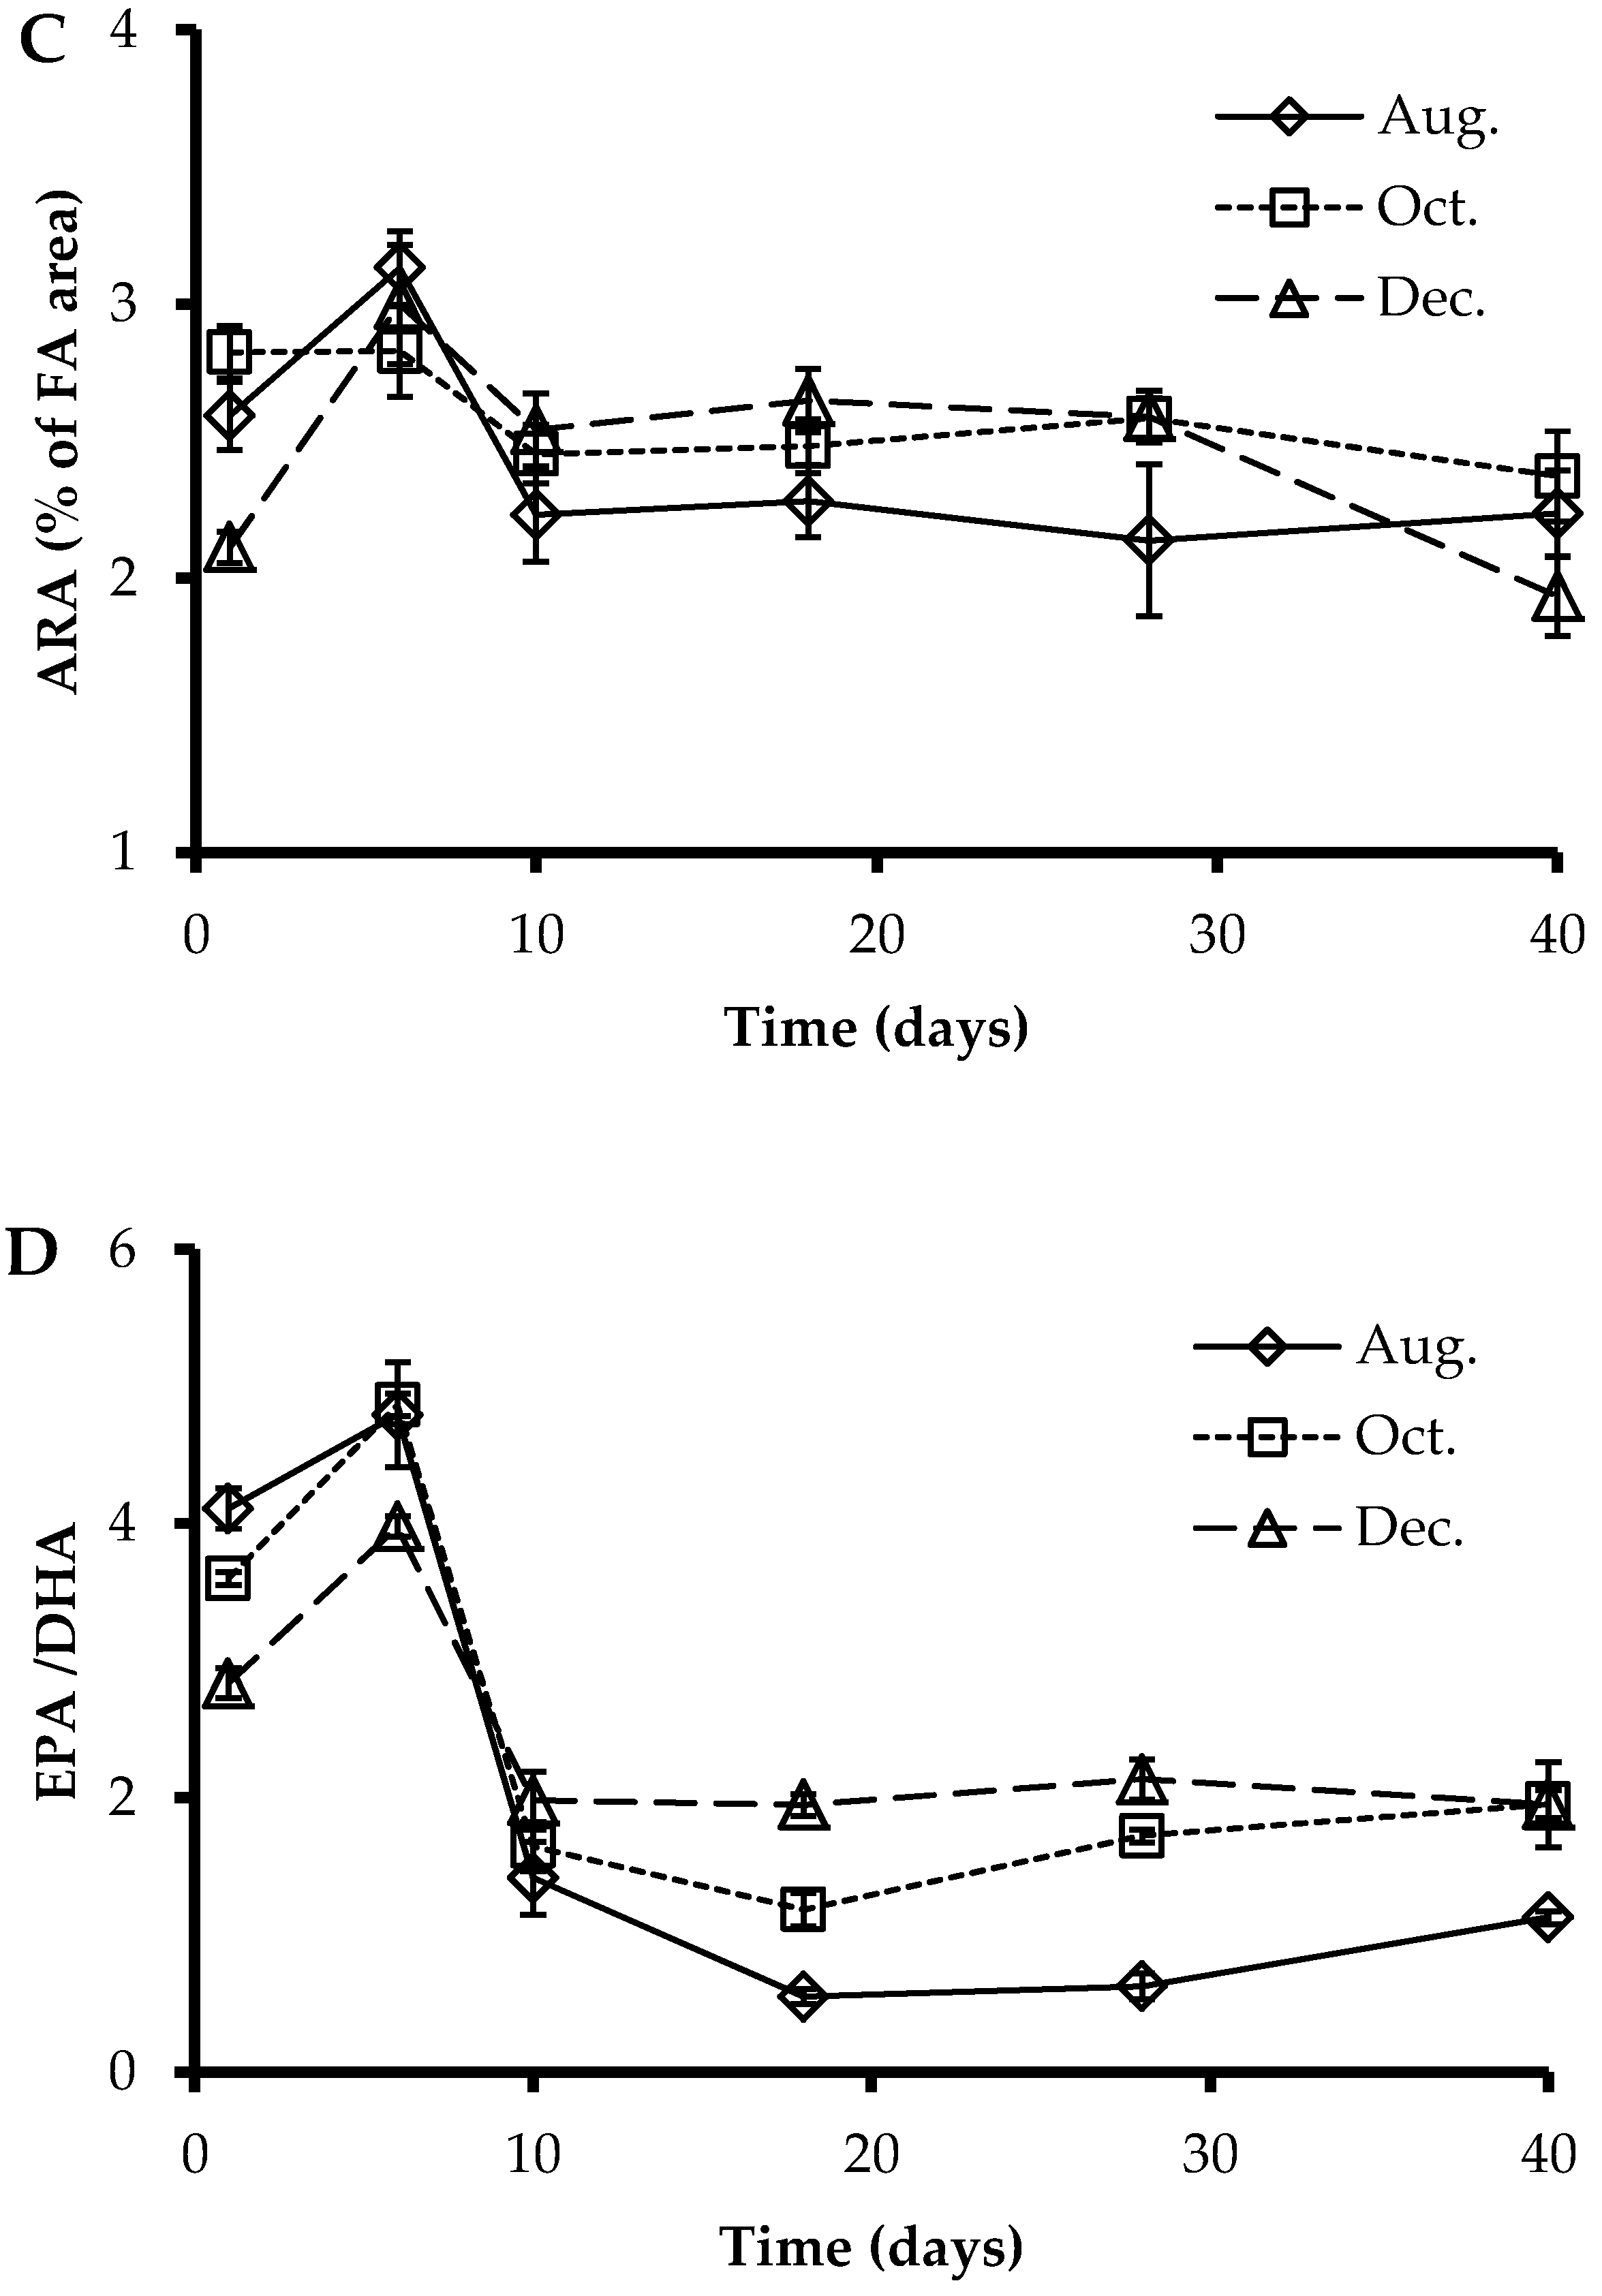
3.3. Fatty Acids Profile of Larvae at Sampling Points

The larvae composition of EPA, DHA, and ARA throughout the culture time is shown for each sampling month in Figure 5. In the case of EPA, sampling month exerted a weak effect (p = 0.044), but the effect of culture time was very noticeable (p < 0.001) with a general decrease between days 1 and 6 post-hatching, and a more gradual decrease in the 6–40 dph. Although the interaction (month x culture time) was also highly significant (p < 0.001), the quantitative differences of temporal patterns among the larval batches were very limited. For DHA, all sources of variation, sampling month (p < 0.001), culture time (p < 0.001), and interaction (p < 0.001), showed an effect. The proportion of DHA decreased at the beginning of the culture until day 10, which was a significant decrease. It then stabilized for most of the culture time, from day 10 to day 40, but the stable level depended on the month of sampling. It was lowest for larvae collected during August and highest for larvae collected in December. It is also interesting to note that the reverse pattern is true for newly hatched larvae (day 1), with the DHA proportion being highest for animals sampled during August and October, and lowest for those sampled during December. As a consequence of temporal changes in the percentages of EPA and DHA, the effects on the ratio DHA:EPA resembled those found for DHA, with significant effects for sampling month (p = 0.018), culture time (p < 0.001), and the interaction term (month × culture time) (p < 0.001). The ration DHA:EPA peaked at day 5, but suffered an important drop from day 5 to day 10, and maintained a nearly constant value for the last 30 days of culture. That constant level was associated with the month of larval hatching, so that it was minimal (about 0.9) for fish hatched during August, medium (about 1.6) for fish hatched during October, and maximal (about 2.0) for fish hatched during December. Lastly, the proportion of ARA was affected by the culture time (p < 0.001) and the interaction term (p = 0.006), but only tiny differences among culture days were apparent, the most interesting perhaps being a clear increase from day 1 to day 6 in larval batches collected during December.

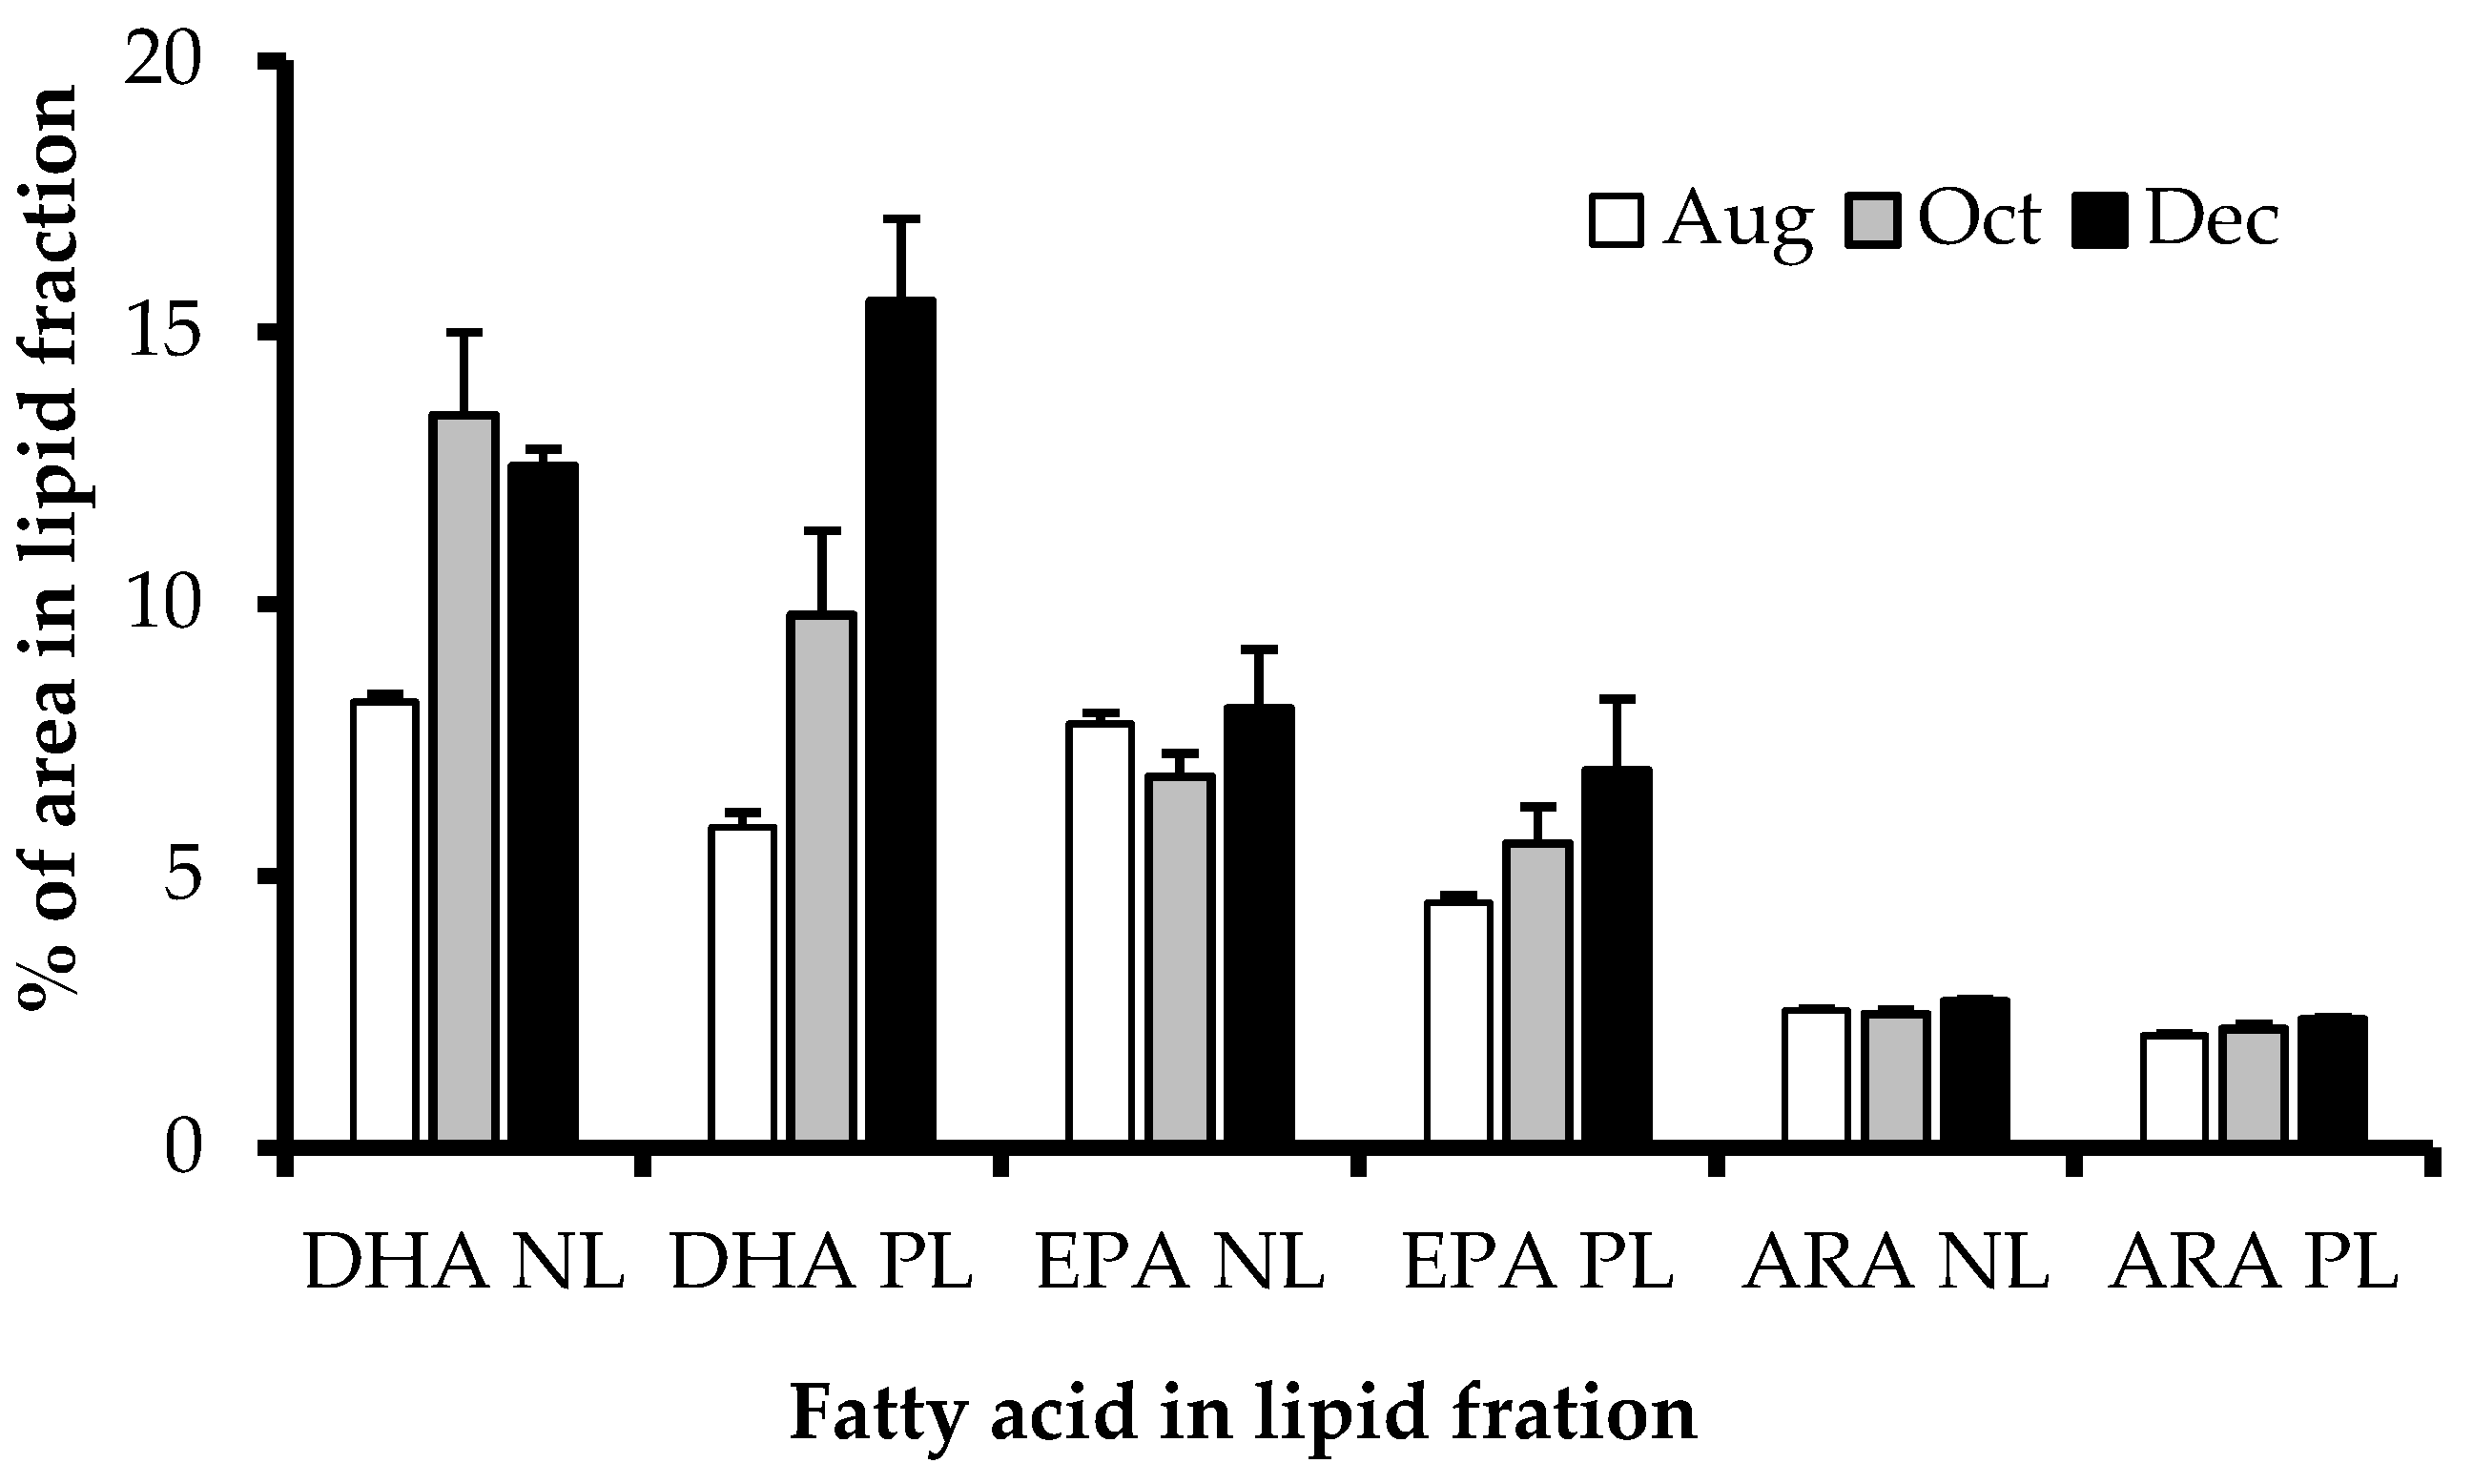
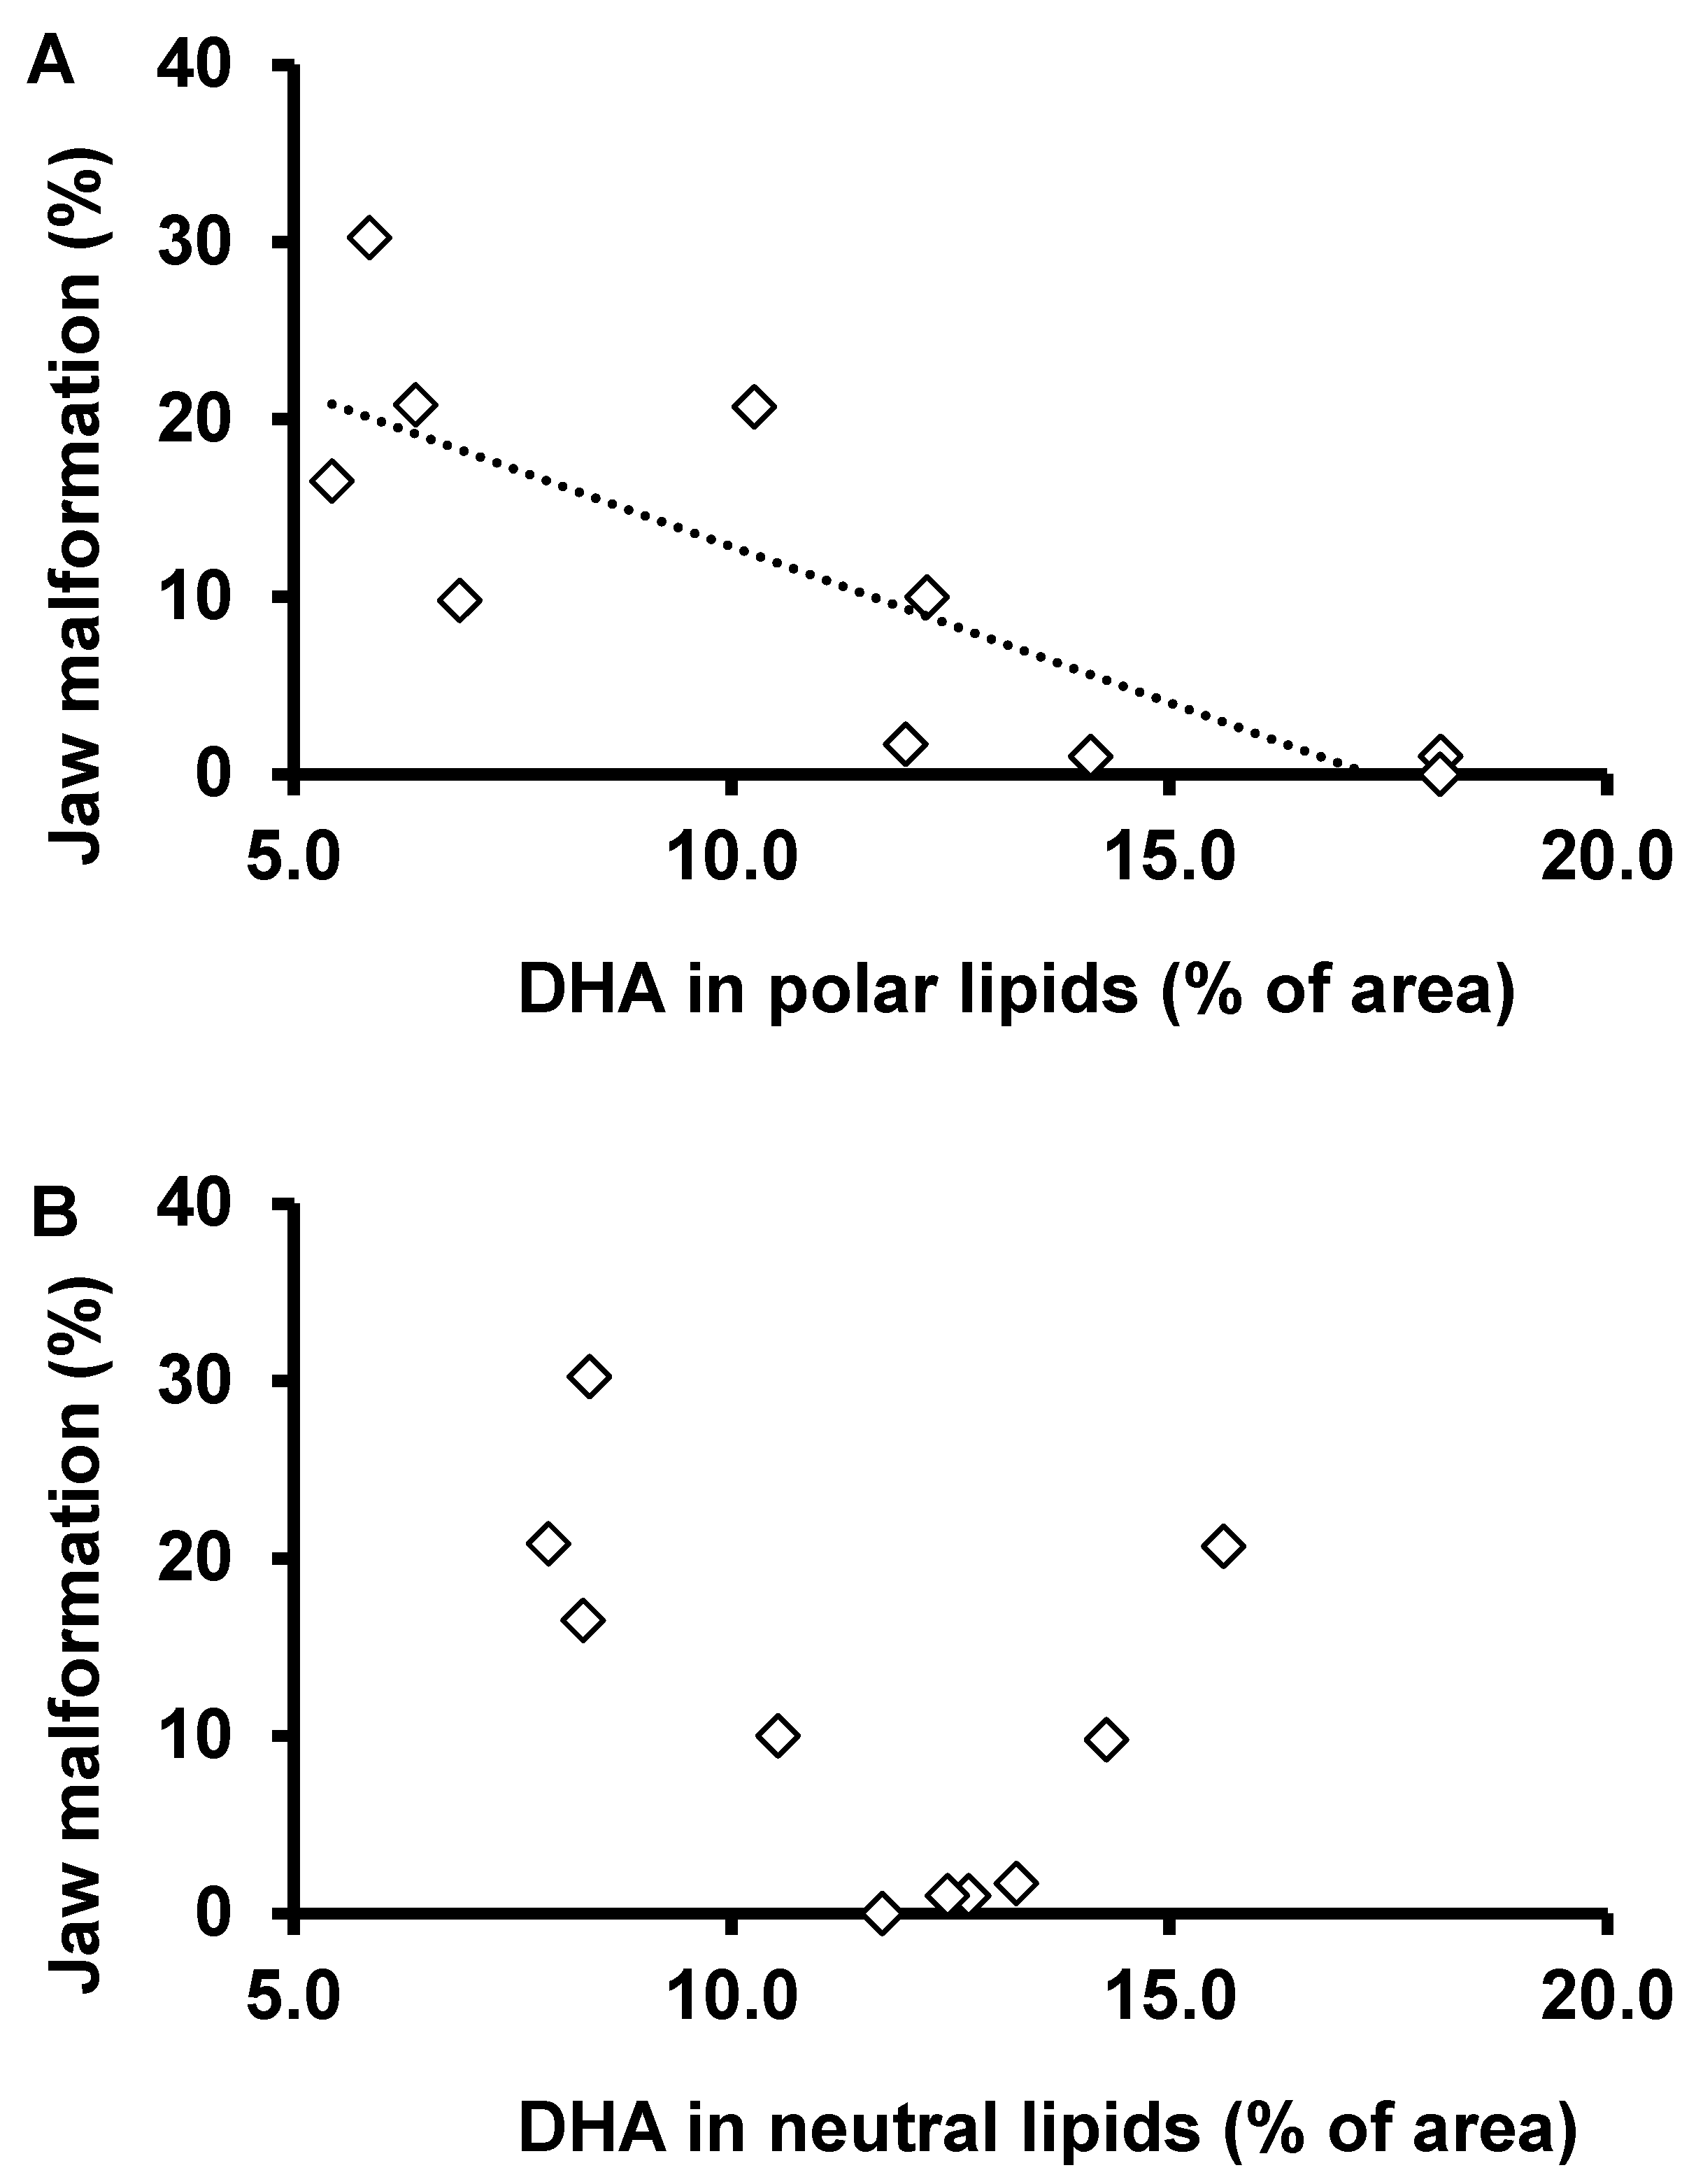
3.4. EPA, DHA, and ARA Content in Polar and Neutral Lipid Fraction

The proportional contents of long-chain PUFA within neutral and polar lipids in 40-day-old larvae from spawns collected at different months are presented in Figure 6. In the case of EPA, it was more abundant in the neutral lipid fraction (p = 0.004) irrespective of the sampling month so that no significant effect of this factor was found (p = 0.761). On the other hand, the percentage of DHA did depend on the sampling month, being more abundant within both neutral and polar lipids at the end of the spawning season (p < 0.001). However, an interaction between the lipid fraction and the sampling month was slightly significant (p = 0.042), supporting that in 40-day-old larvae hatched in August, the neutral lipids were enriched in DHA in relation to polar lipids whereas in 40-day-old larvae hatched in December, polar lipids were enriched in DHA in relation to neutral ones. At last, the ARA proportion attained a small increase in December with respect to the values observed in August (p = 0.024), and it was clearly affected by the lipid fraction (p < 0.001), being more abundant in neutral lipids, although it was just a small difference. No interaction between the two factors was detected. In general, the ARA proportions were quite stable, but the small changes that were observed were significant.
The only LC-PUFA in 40-day-old larvae that showed a clear relationship to the rate of jaw malformations was DHA in the polar fraction (Figure 7A,B), which was negatively correlated with the malformation rate at day 18 (Spearman’s rho = −0.833, p = 0.003), but only marginally correlated with the malformation rate at day 40 (Spearman’s rho = −0.571, p = 0.084).

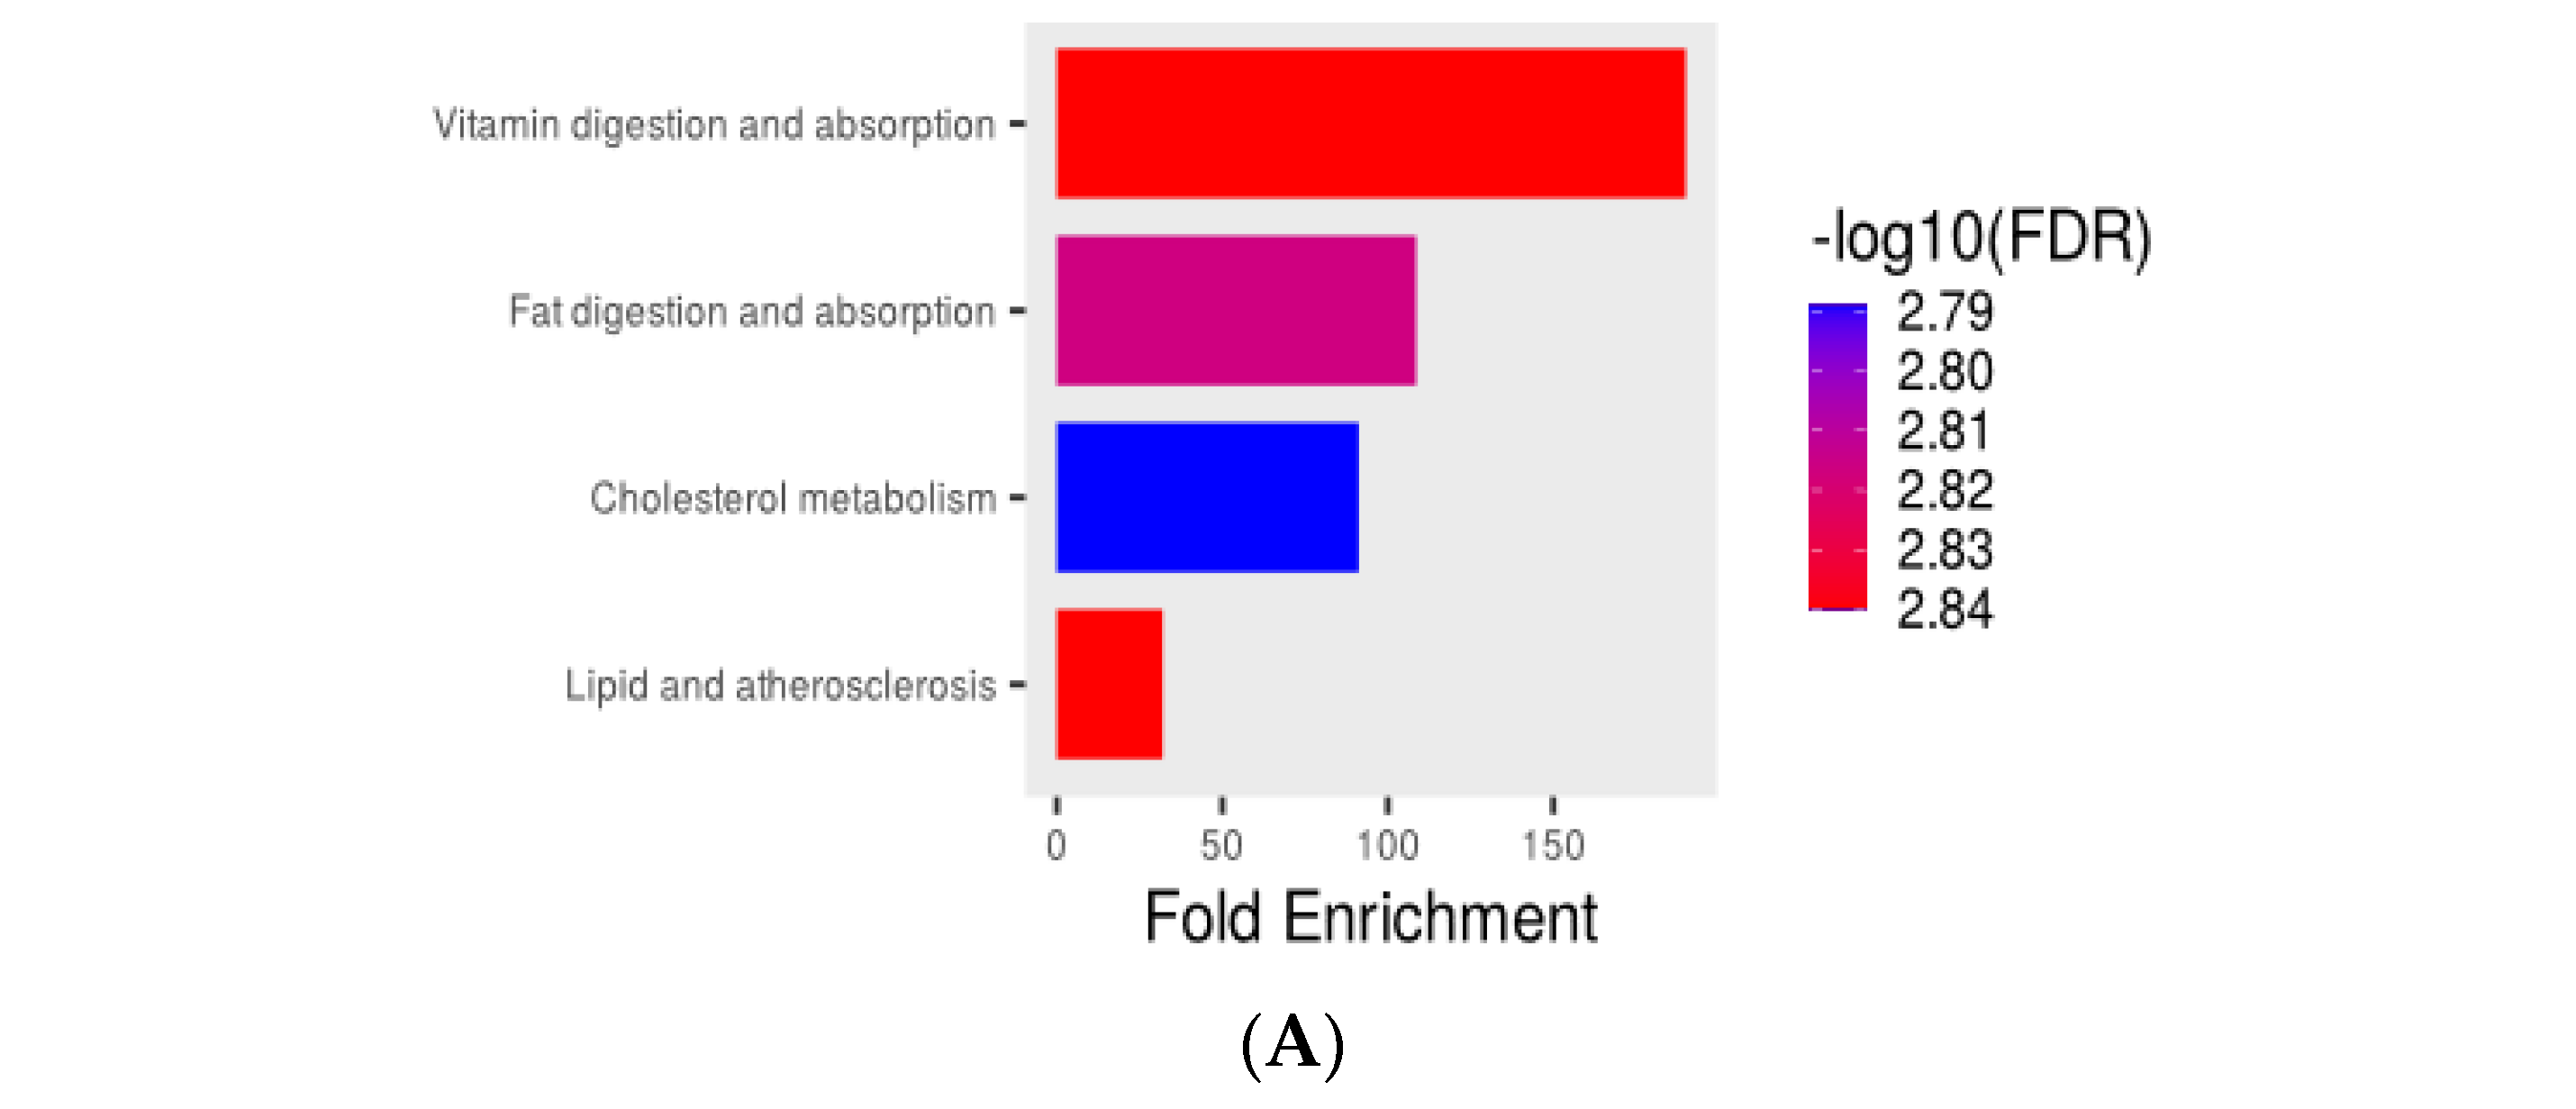
3.5. Transcriptome Analysis

Figure 8 shows the volcano plot of the transcriptome analysis in the jaw tissue of 40 dph larvae (only significant genes are shown). The significant enrichment of the different pathways is explained by three genes, APOA (apolipoprotein A-I gene), APOB (apolipoprotein B gene), and NFATC2 (Nuclear Factor Of Activated T-Cells 2). The significant pathways are vitamin digestion and absorption (KEGG:HSA04977; p-value = 1.4 × 10³; genes APOB and APOA1), fat digestion and absorption (KEGG: HSA hsa04975; p-value = 1.5 × 10³; genes APOB APOA1), cholesterol metabolism. (KEGG:hsa04979; p-value = 1.6 × 10³; genes APOB, APOA1), and lipid and atherosclerosis (KEGG:hsa05417; p-value = 1.4 × 10³; genes APOB, NFATC2 and APOA1), which are particularly related with the genes APOA and APOB, show large positive fold changes (Figure 8), indicating up-regulation in the deformed larvae. These lipoproteins are involved in lipid transport, storage, and degradation. Relatively low fold changes were obtained for NFATC2 (fold change = −2.7).
The results indicate an up-regulation of genes associated with the transport and storage of lipids, and also for the absorption of retinol, sterols, and fatty acids, more than 10 times for TBT-P1 and FABP1 genes (Figure 8). The tbt-bp1 gene encodes for a highly hydrophobic extracellular protein associated with sterol and retinol transport, the lepb1 gene translates to a peptide hormone produced by adipocytes, and fabp1 for a long-chain fatty acid binding protein.

4. Discussion

4.1. Malformation Types and Frequency during Early, Middle, and Late Spawning Events

Jaw malformations comprise an important portion of the abnormalities that appear during the larval culture of Seriola lalandi [6,9,41], and are one of the concerns for the commercial production of the species [2]. The proportion of cultured larvae with jaw abnormalities reported for S. lalandi are quite variable, for example, Crobcoft et al. found a 7% at day 4 and 38% at day 16, whereas Jara et al. found 44–47% at day 4 and 33–55% at day 9. In comparison, the percentages reported herein are somehow lower, 1–21% at day 18 and 9–25% at day 40. It showed a potential increase with culture time and a clear decrease with the advance of the spawning season. The poor correlation between the rate of jaw malformations at days 18 and 40 pointed to different causes of malformations for the intervals 1–18 dph and 18–40 dph. Considering the results presented, it is possible to propose that mandibular malformations were generated during the first two weeks of life and increased during larval development or became more visible.

4.2. Fatty Acids Profile and Deformities

The proposed factors for skeletal anomalies in larvae of marine fish are diverse [1], but two of them are more frequently investigated in Seriola sp.: nutritional and behavioral causes. In the case of Seriola dumerili, cranial abnormalities were reported to be scarce by Roo et al., but they correlate positively with dietary n-3 HUFA and, at the same time, larval DHA reflects dietary composition [42]. Sawada et al. reported much higher rates of jaw malformation in S. dumerili, 10–30%, and found that positive phototaxis also contributed to jaw malformations by triggering wall-nosing behavior until day 22 dph [12]. On the other hand, cranial malformations seemed to be relatively infrequent in the weaned larvae of Seriola rivoliana, and they did not correlate with dietary DHA but the sum of skeletal abnormalities did [43].
A difficulty with nutritional studies is the ontogenetic variation of body composition. For example, in S. lalandi larvae cultured at 20 °C, temporal patterns of lipid classes differ from each other. Wax esters deplete before 8 dph; phospholipids and triacylglycerols drop to nearly zero values until day 8 and then increase from 12 dph; and phospholipids, sterols, and free fatty acids maintain their levels as low values until day 10 and then suffer a sharp increase from 12 dph onwards [44]. Our finding that larval batches with the lowest rate of jaw malformations (animals from December spawns) also had the lowest percentage of DHA at 1 dph (17%) but the highest percentage of DHA (≈12%) from 10 to 40 dph could be explained in light of Hilton et al.’s results. Since those authors demonstrated that only neutral lipids are catabolized in large quantities during the first week of life, the depletion of DHA that we found between day 1 and day 10 probably indicates that a major portion of this fatty acid was contained in neutral lipids of 1-day-old larvae hatched during August, and that this portion was lower in 1-day-old larvae hatched during December. In this way, high levels of DHA in neutral lipids of newly hatched S. lalandi would be associated with subsequent jaw malformations. According to this hypothesis, the rate of larval jaw malformations in marine fish is not only dependent on the dietary level of n-3 long-chain HUFA [27,33], but also on its localization within the dietary lipid classes, being more effective when EPA + DHA are supplied as neutral lipids [33]. Based on our results, two questions about the lipid composition in newly hatched S. lalandi can be proposed for future research: whether the content of DHA in neutral lipids varies through the spawning season, and if those batches with a higher share of DHA in the neutral fraction at day 1 are also more prone to suffer from jaw malformation.

4.3. Polar and Neutral Lipid Fraction

The increase in the specific activity of lipase during the first week of life, together with the development of gastric glands (by day 15 at 24–25 °C) [45] improves the digestive efficiency and makes the accretion of new lipid reserves possible [44] after the exhaustion of the yolk sac. The fatty acid composition of neutral (NL) and polar lipids (PL) in 40-day-old larvae, investigated herein, should be a consequence of this accumulation process. The localization of DHA was worth exploring because it was particularly abundant within PL in 40-day-old larvae hatched in December, whereas it is more abundant in NL in August and October larvae. Although DHA in NL of the diet has been particularly related to the emergence of bone malformations in larvae of the European sea bass as per Villeneuve et al. (2005), in our case there was not a clear correlation between the abundance of DHA in larval NL and the rate of malformation (Figure 7). On the contrary, there is a negative correlation between the proportion of DHA in PL (ranging 5–20%) and the rate of jaw abnormalities, suggesting a problem with the incorporation of DHA in the polar lipids of the August and October larvae. Since all larval batches were fed the same sequence of diets, this problem can be associated with the larval batch. There is evidence that, at least in larvae of the Atlantic cod Gadus morhua, the main pathway for the synthesis of body phospholipids is the re-acylation of dietary phospholipids, so that body phospholipids retain the HUFA present in dietary phospholipids [46]. In this regard, it is interesting to note that the EPA percentage in NL was marginally correlated with the EPA percentage in PL (not shown, Spearman’s rho = 0.624, p = 0.06), but there was not a similar correlation in the case of DHA (not shown, Spearman’s rho = 0.382, p = 0.279). Therefore, it is possible that larvae of S. lalandi hatched at the beginning of the spawning season suffered from problems related to phospholipid re-acylation in larval enterocytes, and/or from a deficient transport of DHA to growing tissues, as suggested by the overexpression of APO genes in jaw-malformed larvae reported herein (Figure 8).

5. Conclusions

As a conclusion, the rate of jaw malformations in larval Seriola lalandi under the conditions of a commercial hatchery decreased over the spawning season and can be associated with the percentage of DHA in larval lipids, in particular, the higher the DHA in polar lipids the lower the jaw malformation rate.

Author Contributions

C.T.: Formal analysis, investigation, data curation, writing—original draft preparation, writing—review and editing, visualization. E.R.: Investigation. J.D.: Investigation. L.M. (Lorena Marchant): Methodology, writing—original draft preparation, writing—review and editing, supervision. L.M. (Lorenzo Márquez): Formal analysis, writing—original draft preparation, writing—review and editing, visualization. V.M.: Conceptualization, writing—review and editing, supervision. P.D.: Conceptualization, writing original—draft preparation, writing—review and editing, supervision, funding acquisition. All authors have read and agreed to the published version of the manuscript.

Funding

This study was supported by funding from FONDEF (ANID—Chile), grant number ID14I10125 and by Catholic University of Temuco, Temuco, Chile through a PhD grant for C. Toledo.

Institutional Review Board Statement

This study has been approved by the Ethics Committee of Investigation of Universidad Católica de Temuco (CEIUCT031701/23) for studies involving animals. All experimental protocols were conducted per the committee’s comments and approval.

Data Availability Statement

The data that support the findings of this study are available on reasonable request from the corresponding author, P. Dantagnan.

Acknowledgments

We would like to thank Acuinor SA Company for their generous collaboration in providing us the access to the broodstock and spawned eggs and the company’s facilities to carry out the feeding trial for this study. We would also like to thank Juan Enrique Gaete and Arzomina Jiménez of Acuinor SA, for their assistance during this assay.

Conflicts of Interest

The authors declare no conflict of interest.

References

  1. Boglione, C.; Gavaia, P.; Koumoundouros, G.; Gisbert, E.; Moren, M.; Fontagné, S.; Witten, P.E. Skeletal Anomalies in Reared European Fish Larvae and Juveniles. Part 1: Normal and Anomalous Skeletogenic Processes. Rev. Aquac. 2013, 5, S99–S120. [Google Scholar] [CrossRef] [Green Version]
  2. Cobcroft, J.M.; Battaglene, S.C. Skeletal Malformations in Australian Marine Finfish Hatcheries. Aquaculture 2013, 396, 51–58. [Google Scholar] [CrossRef]
  3. ZhenHua, M.; Tan AikYang [Tan, A.Y.D.; Qin, J.G. Jaw Deformities in the Larvae of Yellowtail Kingfish (Seriola Lalandi Valenciennes, 1833) from Two Groups of Broodstock. Indian J. Fish. 2014, 61, 138–141. [Google Scholar]
  4. Silbernagel, C.; Shane, M.; Drawbridge, M. Quality Considerations and Malformation Surveillance in a Marine Stocking Program. Bull. Mar. Sci. 2021, 97, 559–574. [Google Scholar] [CrossRef]
  5. Battaglene, S.C.; Cobcroft, J.M. Advances in the Culture of Striped Trumpeter Larvae: A Review. Aquaculture 2007, 268, 195–208. [Google Scholar] [CrossRef]
  6. Cobcroft, J.M.; Pankhurst, P.M.; Poortenaar, C.; Hickman, B.; Tait, M. Jaw Malformation in Cultured Yellowtail Kingfish (Seriola lalandi) Larvae. N. Z. J. Mar. Freshw. Res. 2004, 38, 67–71. [Google Scholar] [CrossRef] [Green Version]
  7. Cobcroft, J.M.; Pankhurst, P.M.; Sadler, J.; Hart, P.R. Jaw Development and Malformation in Cultured Striped Trumpeter Latris lineata. Aquaculture 2001, 199, 267–282. [Google Scholar] [CrossRef]
  8. Cobcroft, J.M.; Battaglene, S.C. Jaw Malformation in Striped Trumpeter Latris Lineata Larvae Linked to Walling Behaviour and Tank Colour. Aquaculture 2009, 289, 274–282. [Google Scholar] [CrossRef]
  9. Jara, B.; Abarca, M.; Wilson, R.; Krapivka, S.; Mercado, A.; Guiñez, R.; Marchant, L. Qualitative Analysis of Cartilaginous Jaw Element Malformation in Cultured Yellowtail Kingfish (Seriola lalandi) Larvae. Aquac. Res. 2017, 48, 4420–4428. [Google Scholar] [CrossRef]
  10. Cahu, C.; Infante, J.Z.; Takeuchi, T. Nutritional Components Affecting Skeletal Development in Fish Larvae. Aquaculture 2003, 227, 245–258. [Google Scholar] [CrossRef] [Green Version]
  11. Lall, S.P.; Lewis-McCrea, L.M. Role of Nutrients in Skeletal Metabolism and Pathology in Fish—An Overview. Aquaculture 2007, 267, 3–19. [Google Scholar] [CrossRef]
  12. Sawada, Y.; Sasaki, T.; Nishio, K.; Kurata, M.; Honryo, T.; Agawa, Y. Positive Phototaxis as the Cause of Jaw Malformations in Larval Greater Amberjack, Seriola dumerili (Risso, 1810): Mitigation by Rearing in Tanks with Low-Brightness Walls. Aquac. Res. 2020, 51, 2261–2274. [Google Scholar] [CrossRef]
  13. Darias, M.J.; Mazurais, D.; Koumoundouros, G.; Cahu, C.L.; Zambonino-Infante, J.L. Overview of Vitamin D and C Requirements in Fish and Their Influence on the Skeletal System. Aquaculture 2011, 315, 49–60. [Google Scholar] [CrossRef]
  14. Fernández, I.; Gisbert, E. The Effect of Vitamin A on Flatfish Development and Skeletogenesis: A Review. Aquaculture 2011, 315, 34–48. [Google Scholar] [CrossRef]
  15. Negm, R.K.; Cobcroft, J.M.; Brown, M.R.; Nowak, B.F.; Battaglene, S.C. Performance and Skeletal Abnormality of Striped Trumpeter Latris Lineata Larvae and Post Larvae Fed Vitamin A Enriched Artemia. Aquaculture 2014, 422, 115–123. [Google Scholar] [CrossRef]
  16. Dâmaso-Rodrigues, M.L.; Pousao-Ferreira, P.; Ribeiro, L.; Coutinho, J.; Bandarra, N.M.; Gavaia, P.J.; Narciso, L.; Morais, S. Lack of Essential Fatty Acids in Live Feed during Larval and Post-Larval Rearing: Effect on the Performance of Juvenile Solea senegalensis. Aquac. Int. 2010, 18, 741–757. [Google Scholar] [CrossRef]
  17. Gapasin, R.S.J.; Duray, M.N. Effects of DHA-Enriched Live Food on Growth, Survival and Incidence of Opercular Deformities in Milkfish (Chanos chanos). Aquaculture 2001, 193, 49–63. [Google Scholar] [CrossRef]
  18. Tocher, D.R. Omega-3 Long-Chain Polyunsaturated Fatty Acids and Aquaculture in Perspective. Aquaculture 2015, 449, 94–107. [Google Scholar] [CrossRef]
  19. Glencross, B.D. Exploring the Nutritional Demand for Essential Fatty Acids by Aquaculture Species. Rev. Aquac. 2009, 1, 71–124. [Google Scholar] [CrossRef]
  20. Tocher, D.R.; Bendiksen, E.Å.; Campbell, P.J.; Bell, J.G. The Role of Phospholipids in Nutrition and Metabolism of Teleost Fish. Aquaculture 2008, 280, 21–34. [Google Scholar] [CrossRef] [Green Version]
  21. Bessonart, M.; Izquierdo, M.S.; Salhi, M.; Hernandez-Cruz, C.M.; Gonzalez, M.M.; Fernandez-Palacios, H. Effect of Dietary Arachidonic Acid Levels on Growth and Survival of Gilthead Sea Bream (Sparus aurata L.) Larvae. Aquaculture 1999, 179, 265–275. [Google Scholar] [CrossRef]
  22. Dantagnan, P.; Hernández, A.; Borquez, A.; Mansilla, A. Inclusion of Macroalgae Meal (Macrocystis pyrifera) as Feed Ingredient for Rainbow Trout (Oncorhynchus mykiss): Effect on Flesh Fatty Acid Composition. Aquac. Res. 2009, 41, 87–94. [Google Scholar] [CrossRef] [Green Version]
  23. Izquierdo, M.S.; Socorro, J.; Arantzamendi, L.; Hernández-Cruz, C.M. Recent Advances in Lipid Nutrition in Fish Larvae. Fish Physiol. Biochem. 2000, 22, 97–107. [Google Scholar] [CrossRef]
  24. Koven, W.; Tandler, A.; Kissil, G.W.; Sklan, D. The Importance of N-3 Highly Unsaturated Fatty Acids for Growth in Larval Sparus Aurata and Their Effect on Survival, Lipid Composition and Size Distribution. Aquaculture 1992, 104, 91–104. [Google Scholar] [CrossRef]
  25. Koven, W.M.; Tandler, A.; Kissil, G.W.; Sklan, D.; Friezlander, O.; Harel, M. The Effect of Dietary (N−3) Polyunsaturated Fatty Acids on Growth, Survival and Swim Bladder Development in Sparus aurata Larvae. Aquaculture 1990, 91, 131–141. [Google Scholar] [CrossRef]
  26. Roo, F.J.; Hernández-Cruz, C.M.; Socorro, J.A.; Fernández-Palacios, H.; Montero, D.; Izquierdo, M.S. Effect of DHA Content in Rotifers on the Occurrence of Skeletal Deformities in Red Porgy Pagrus pagrus (Linnaeus, 1758). Aquaculture 2009, 287, 84–93. [Google Scholar] [CrossRef]
  27. Izquierdo, M.S.; Scolamacchia, M.; Betancor, M.; Roo, J.; Caballero, M.J.; Terova, G.; Witten, P.E. Effects of Dietary DHA and α-Tocopherol on Bone Development, Early Mineralisation and Oxidative Stress in Sparus aurata (Linnaeus, 1758) Larvae. Br. J. Nutr. 2013, 109, 1796–1805. [Google Scholar] [CrossRef] [Green Version]
  28. Sargent, J.; McEvoy, L.; Estevez, A.; Bell, G.; Bell, M.; Henderson, J.; Tocher, D. Lipid Nutrition of Marine Fish during Early Development: Current Status and Future Directions. Aquaculture 1999, 179, 217–229. [Google Scholar] [CrossRef]
  29. Le Douarin, N.M.; Dupin, E. Multipotentiality of the Neural Crest. Curr. Opin. Genet. Dev. 2003, 13, 529–536. [Google Scholar] [CrossRef]
  30. Abi-ayad, S.M.E.A.; Melard, C.; Kestemont, P. Effects of N-3 Fatty Acids in Eurasian Perch Broodstock Diet on Egg Fatty Acid Composition and Larvae Stress Resistance. Aquac. Int. 1997, 5, 161–168. [Google Scholar]
  31. Li, Y.; Chen, W.; Sun, Z.; Chen, J.; Wu, K. Effects of N-3 HUFA Content in Broodstock Diet on Spawning Performance and Fatty Acid Composition of Eggs and Larvae in Plectorhynchus cinctus. Aquaculture 2005, 245, 263–272. [Google Scholar] [CrossRef]
  32. Vassallo-Agius, R.; Watanabe, T.; Yoshizaki, G.; Satoh, S.; Takeuchi, Y. Quality of Eggs and Spermatozoa of Rainbow Trout Fed an N-3 Essential Fatty Aciddeficient Diet and Its Effects on the Lipid and Fatty Acid Components of Eggs, Semen and Livers. Fish. Sci. 2001, 67, 818–827. [Google Scholar] [CrossRef]
  33. Villeneuve, L.; Gisbert, E.; Zambonino-Infante, J.L.; Quazuguel, P.; Cahu, C.L. Effect of Nature of Dietary Lipids on European Sea Bass Morphogenesis: Implication of Retinoid Receptors. Br. J. Nutr. 2005, 94, 877–884. [Google Scholar] [CrossRef]
  34. Dettleff, P.; Hernandez, E.; Partridge, G.; Lafarga-De la Cruz, F.; Martinez, V. Understanding the Population Structure and Reproductive Behavior of Hatchery-Produced Yellowtail Kingfish (Seriola lalandi). Aquaculture 2020, 522, 734948. [Google Scholar] [CrossRef]
  35. Association of Official Analytical Chemists. Official Methods of Analysis, 17th ed.; Association of Official Analytical Chemists: Washington, DC, USA, 2000. [Google Scholar]
  36. Taylor, W.R.; Van Dyke, G.C. Revised Procedures for Staining and Clearing Small Fishes and other Vertebrates for Bone and Cartilage Study. Cybium 1985, 9, 107–119. [Google Scholar]
  37. Folch, J.; Lees, M.; Sloane Stanley, G.H. A Simple Method for the Isolation and Purification of Total Lipides from Animal Tissues. J. Biol. Chem. 1957, 226, 497–509. [Google Scholar] [CrossRef]
  38. Morrison, W.R.; Smith, L.M. Preparation of Fatty Acid Methyl Esters and Dimethylacetals from Lipids with Boron Fluoride--Methanol. J. Lipid Res. 1964, 5, 600–608. [Google Scholar] [CrossRef]
  39. Patel, A.; Dettleff, P.; Hernandez, E.; Martinez, V. A Comprehensive Transcriptome of Early Development in Yellowtail Kingfish (Seriola lalandi). Mol. Ecol. Resour. 2016, 16, 364–376. [Google Scholar] [CrossRef]
  40. Robinson, M.D.; McCarthy, D.J.; Smyth, G.K. EdgeR: A Bioconductor Package for Differential Expression Analysis of Digital Gene Expression Data. Bioinformatics 2010, 26, 139–140. [Google Scholar] [CrossRef] [Green Version]
  41. Moran, D.; Smith, C.K.; Gara, B.; Poortenaar, C.W. Reproductive Behaviour and Early Development in Yellowtail Kingfish (Seriola lalandi Valenciennes 1833). Aquaculture 2007, 262, 95–104. [Google Scholar] [CrossRef]
  42. Roo, J.; Hernández-Cruz, C.M.; Mesa-Rodriguez, A.; Fernández-Palacios, H.; Izquierdo, M.S. Effect of Increasing N-3 HUFA Content in Enriched Artemia on Growth, Survival and Skeleton Anomalies Occurrence of Greater Amberjack Seriola dumerili Larvae. Aquaculture 2019, 500, 651–659. [Google Scholar] [CrossRef]
  43. Mesa-Rodriguez, A.; Hernández-Cruz, C.M.; Betancor, M.B.; Fernández-Palacios, H.; Izquierdo, M.S.; Roo, J. Effect of Increasing Docosahexaenoic Acid Content in Weaning Diets on Survival, Growth and Skeletal Anomalies of Longfin Yellowtail (Seriola rivoliana, Valenciennes 1833). Aquac. Res. 2018, 49, 1200–1209. [Google Scholar] [CrossRef] [Green Version]
  44. Hilton, Z.; Poortenaar, C.W.; Sewell, M.A. Lipid and Protein Utilisation during Early Development of Yellowtail Kingfish (Seriola lalandi). Mar. Biol. 2008, 154, 855–865. [Google Scholar] [CrossRef]
  45. Chen, B.N.; Qin, J.G.; Kumar, M.S.; Hutchinson, W.G.; Clarke, S.M. Ontogenetic Development of Digestive Enzymes in Yellowtail Kingfish Seriola Lalandi Larvae. Aquaculture 2006, 260, 264–271. [Google Scholar] [CrossRef]
  46. Olsen, Y.; Evjemo, J.O.; Kjørsvik, E.; Larssen, H.; Li, K.; Overrein, I.; Rainuzzo, J. DHA Content in Dietary Phospholipids Affects DHA Content in Phospholipids of Cod Larvae and Larval Performance. Aquaculture 2014, 428–429, 203–214. [Google Scholar] [CrossRef] [Green Version]
Figure 1. Sampling scheme of Seriola lalandi larvae from three different spawning phases (early, middle, and late spawn) during the spawning season. Fatty acid profile: 1-6-10-18-28-40 dph. Malformation rate: 18 and 28 dph. Trascriptomic analysis: 40 dph.
Fishes 08 00200 g001
Figure 2. Normal and deformed larval phenotypes. Lateral view of 18, 28, and 40 dph normal larvae (A,E,I), larvae with short lower jaw (B,F,J), larvae with short upper jaw (C,G,K), and larvae with open mouth (D,H,L). Scale bar: (AD) 1000 μm, (EH) 2000 μm (2 mm), and (IL) 3500 μm (3.5 mm).
Fishes 08 00200 g002
Figure 3. Cartilage and bone structures of normal (A,D) and jaw deformed (BC,EF) fish at 28 days post-hatch larvae. Cartilage stain (AC) and bone stain (DF). Dentary bone shorter (black arrow) in comparison to normal fish. Maxillary bone atrophied or non-developed does not connect to the dentary bone of the lower jaw (orange arrow). Scale bar: 2000 μm (2 mm).
Fishes 08 00200 g003
Figure 4. Quantification of normal and deformed phenotypes in 18 dph larvae and 40 dph juvenile fish. OM, open mouth; SUJ, short upper jaw; SLJ, short lower jaw.
Fishes 08 00200 g004
Figure 5. (AC) The percentage of EPA, DHA, and ARA composition in larvae sampled in 1, 6, 10, 18, 28, and 40 dph in August, October, and December spawning events. (D) The percentage of DHA/EPA ratio is shown.
Fishes 08 00200 g005aFishes 08 00200 g005b
Figure 6. EPA, DHA, and ARA content in polar and neutral fraction of different spawning seasons at day 40 of larval culture.
Fishes 08 00200 g006
Figure 7. Relationship between the proportion of DHA within polar (A) and neutral (B) lipids of 40-day-old larvae and the total rate of jaw malformation in cultured Seriola lalandi. The dotted line in figure a represents the linear regression line.
Fishes 08 00200 g007
Figure 8. (A) Bar chart of −log10 of significantly enriched pathways. (B) Volcano plots showing significant genes between the normal individuals and the deformed individuals. Each point in the plots represents a gene, with its log2 fold change (FC) in the x-axis and its −log10 p-value in the y-axis. Positive fold change means upregulated in deformed samples. Only genes with an adjusted p-value  <  0.05 and log2 fold change between −2 and 2 are shown.
Fishes 08 00200 g008aFishes 08 00200 g008b
Table 1. Feeding scheme and nutrients ingested by Seriola lalandi broodstock during the spawning period studied.
Feeding Scheme of Spawning Period
JulyAugustSeptemberOctoberNovemberDecember
Broodstock food (%) *
Diet A1005071.85013.20
Diet B000040.80
Commercial pellet000046100
Fresh fish05028.25000
Nutrients supplied **
Protein33.225.929.125.937.344.4
Lipid4.73.33.93.312.723.3
Ash4.13.84.03.85.48.2
Spawnings analyzed 3 3 4
* Diets A and B were prepared by mixing the same ingredients according to Acuinor protocols: Broodstock Dry Mix (Skretting, Chile), fish oil, soy lecithin, and gelatin. However, Diet A, but not Diet B had vitamin E and C at 50%. Commercial pellets (cP) specially designated for S. lalandi broodstock were provided by Skretting, Puerto Montt, Chile. ** Expressed in wet weight.
Table 2. Proximate composition of different diets that were used to feed S. lalandi broodstock during the spawning period studied.
Diet ADiet BFishCommercial Pellet
Proximal (%)
Dry matter544724.591.8
Protein61.5265.2818.5448.21
Lipid8.717.281.8225.36
Ash7.625.763.578.90
Disclaimer/Publisher’s Note: The statements, opinions and data contained in all publications are solely those of the individual author(s) and contributor(s) and not of MDPI and/or the editor(s). MDPI and/or the editor(s) disclaim responsibility for any injury to people or property resulting from any ideas, methods, instructions or products referred to in the content.

