Abstract
We newly sequenced complete mitochondrial genomes (mitogenome) of two gudgeon species Saurogobio dabryi and S. punctatus, and we downloaded 49 gudgeon mitogenomes from GenBank to investigate the phylogeny of the Pseudogobionini group and analyze selection pressure of the genes. With genera Gobio, Acanthogobio, and Romanogobio as outgroups, the phylogeny of the Pseudogobionini group was revealed as ((Xenophysogobio + Gobiobotia) + (Saurogobio + (Abbottina + (Pseudogobio + Biwia complex)))) based on the concatenated nucleotide sequences of 13 protein-coding genes (PCGs). Based on the molecular phylogeny and morphological or osteological characters, we proposed a classification system of the Pseudogobionini group. Moreover, five pairs of sister taxa were selected for gene selection pressure analyses to explore the link of mitochondrial gene evolution to group differentiation and adaptations. We detected significantly different dN/dS values in 11 out of 13 (excluding ND3 and ND4L) PCGs in five pairs of clades, significantly different mean dN/dS, dN, and/or dS values in 8 out of 13 PCGs (excluding ND2, ATP8, ND3, ND4L, and ND6) in three pairs of sub-clades and seven positively selected sites in another three pairs of sub-clades. These results indicated that mitochondrial gene evolution might have contributed to group differentiation and adaptations especially for river or lake environments.
Key Contribution:
This work reveals the molecular phylogeny of the Pseudogobionini group based on mitogenomic data, and provides evidence that mitochondrial gene evolution may have contributed to group differentiation and adaptations to river and lake environments.
1. Introduction
Due to its compactness (16–17 kb), absence of paralogs, and ease of sequencing [1,2,3], vertebrate mitogenomes have been used as an effective tool for molecular phylogenetic and evolution analysis in fish [4,5,6,7,8]. Mitochondria are the centers of energy metabolism in eukaryotic organisms and provide 95% of cellular energy via oxidative phosphorylation [9]. The evolution of mitochondrial genes may have played important roles in organism adaptive evolution and diversification [10,11,12]. Adaptive evolution is usually detected as higher nonsynonymous to synonymous substitution rate ratios (dN/dS, denoted omega) in protein coding genes (PCGs) [13]. Previous studies reported higher dN/dS ratios in some PCGs in loaches living in fast-flowing rivers or subtropical waters [10] and higher evolutionary rates in vertebrates living in high altitudes [12]. Therefore, analysis of mitochondrial DNA evolution may help us understand the mechanism of organism differentiation and adaptation to different habitats.
The family Cyprinidae is the most diverse family of freshwater fishes in the world, with about 367 genera and about 3006 species [14]. The Pseudogobionini is a group of rheophilic and benthic freshwater fishes [15,16], belonging to the group Cypriniformes, Cyprinidae, Gobioninae, with approximately 77 species [17,18]. They are distributed mainly in East Asia, extending to Europe, and exhibit great morphological, ecological, and behavioral variations [19,20,21]. They may have a pair of barbels, or they may be absent [22,23]; some species possess four pairs of barbels [19,20,21]. These fishes predominantly inhabit freshwater ecosystems, with a few that enter brackish environments [24].
There are a few reports on the phylogeny of the Pseudogobionini group based on morphological and molecular data. Hosoya [25] analyzed variations of the cephalic lateral line system and osteological characters of the Gobioninae and proposed Pseudogobionini as “true bottom dwellers”, with the relationship suggested as (Gobiobotia + ((Pseudogobio + Abbottina) + (Saurogobio + (Microphysogobio + Biwia)))), while Yu and Yue [16] revealed Pseudogobionini phylogeny as (Pseudogobio + (Saurogobio + (Abbottina + (Biwia + (Rostrogobio + (Microphysogobio + (Platysmacheilus + Huigobio))))))). Based on mitogenomic data, the phylogeny was elucidated as ((Xenophysogobio + Gobiobotia) + (Saurogobio + (Abbottina + (Pseudogobio + Biwia complex)))) by Chen [26] or as ((Xenophysogobio + Gobiobotia) + (Saurogobio + (Pseudogobio + (Abbottina complex + Biwia complex)))) by Zhang et al. [27]. Thus far, due to insufficient taxon sampling, phylogenetic investigations of the Pseudogobionini are rather preliminary and controversial.
In the present study, we first sequenced and annotated five complete mitochondrial genomes of two gudgeon species, Saurogobio dabryi and S. punctatus. Then, we reconstructed the phylogeny of the Pseudogobionini group based on the concatenated nucleotide sequences of 13 PCGs. Finally, we analyzed the selection pressure and investigated the contributions of mitochondrial gene evolution to group differentiation and adaptations of the Pseudogobionini fishes.
2. Materials and Methods
2.1. Samples Collection and DNA Extraction
In this study, five individuals of two gudgeon species S. dabryi and S. punctatus were newly sequenced for complete mitogenomes. Forty-nine mitogenomes of gudgeon species, including six outgroups species, were downloaded from GenBank (https://www.ncbi.nlm.nih.gov/genbank/, accessed on 12 November 2021). Detailed information, including the GenBank accession numbers, is listed in Table 1. Four individuals of S. dabryi1–4 (samples of S. dabryi in the Yangtze River Basin were composed of four highly divergent lineages based on mitochondrial Cyt b gene, corresponding to S. dabryi1–4 (unpublished data)) were collected from Hukou County, Jiangxi Province (116°11′39″ E, 29°43′02″ N); Chishui City, Guizhou Province; Yibin City, Sichuan Province (104°32′32″ E, 28°41′31″ N); and Panzhihua City, Sichuan Province (101°30′18″ E, 26°35′38″ N). One S. punctatus sample was collected from Chishui City, Guizhou Province (105°41′21″ E, 28°34′19″ N). Muscle tissues from these samples were preserved in 95% ethanol and stored at 4 °C until DNA extraction. Total genomic DNA was extracted from muscle tissues following the salt-extraction procedure of Aljanabi and Martinez [28] as modified in Tang et al. [29]. All experimental protocols with animals were approved by the Institutional Animal Care and Use Committee of the Institute of Hydrobiology, Chinese Academy of Sciences (Approval code: IHB/LL/2022028).

Table 1.
The detailed information of species used in the present study.
2.2. PCR Amplification and Sequencing
We designed 16 pairs of primers to amplify the complete mitogenomes of S. dabryi and S. punctatus based on the published complete mitochondrial genome sequence of S. dabryi (GenBank accession number: KF612272) [30]. Furthermore, we designed four species-specific primer pairs to amplify gaps in the mitogenome of S. punctatus. Primers used in this study are listed in Table S1. Polymerase Chain Reaction (PCR) amplifications were performed in a 30 μL reaction volume containing 22.5 μL sterile H2O, 1 μL dNTPs (each 2.5 mM), 3 μL of 10× reaction buffer, 1 μL of each primer (each 10 μM), 0.5 μL (5 U/μL) of Taq polymerase, and 1 μL template DNA. The cycling parameters were set as follows: 94 °C for 4 min; 35 cycles of 94 °C denaturation for 45 s, annealing temperate for 45 s (Table S1), 72 °C extension for 1 min, and a final 72 °C extension for 10 min. The PCR products were checked by electrophoresis through 1% agarose gel, and the target products were sequenced by Sangon Biotech Co., Ltd. (Shanghai, China).
2.3. Sequence Assembly and Analysis
For each individual, the nucleotide sequences were aligned, calibrated, and edited using the MEGA X program [31] with the published complete mitogenome of S. dabryi as reference. Mitogenomes were assembled by the SeqMan software [32] of DNASTAR’s Lasergene. Nucleotide composition was analyzed using the MEGA X program. The following formulas were used to calculate the values of AT-skew = (A − T)/(A + T) and GC-skew = (G − C)/(G + C) [33].
2.4. Phylogenetic Analysis
Based on the principle of out-group selection [34] and previous molecular phylogenetic studies on the Gobioninae [24,35], the genera Gobio, Acanthogobio, and Romanogobio were selected as outgroups. We reconstructed the Bayesian Inference (BI) and Maximum Likelihood (ML) trees of the Pseudogobionini group in the PhyloSuite v1.2.2 program [36] based on the concatenated nucleotide sequences of 13 PCGs. The best-fit nucleotide substitution models were estimated by ModelFinder [37] for MrBayes and IQ-TREE with the Bayesian Information Criterion (BIC) [38] and Corrected Akaike Information Criterion (AICc) [37]. The BI tree was performed in MrBayes 3.2.6 [39]. For BI analyses, two independent analyses with four simultaneous Markov Chain Monte Carlo (MCMC) chains were run for 5,000,000 generations with tree sampling every 1000 generations, and runs were stopped after the standard deviation of split frequencies fell below 0.01. The first 25% of trees were discarded as burn-in. A 50% majority-rule consensus tree was obtained from the remaining 75% of trees. Posterior probabilities (PP) values of phylogenetic inferences were determined from the remaining trees. The ML tree was performed using IQ-TREE v1.6.8 [40]. The support values of each node were estimated using the ultrafast bootstrapping algorithm with 10,000 replicates [41].
2.5. Selection Pressure Analysis
Based on the molecular phylogeny, five pairs of sister taxa (between Gobiobotia subgroup and Pseudogobio subgroup, between Saurogobio tribe and Pseudogobio tribe, between Saurogobio branch A and Saurogobio branch B, between Abbottina branch and Pseudogobio branch, and between Pseudogobio subbranch and Biwia complex subbranch) were selected for genes selection pressure analysis. We used the branch model in the paml X [42,43] and the site model in the EasyCodeML [44] program for analyzing gene selection pressure, respectively. The following four steps were performed: (1) dN/dS values were estimated for each of the 13 PCGs, where one-ratio (all branches have the same dN/dS values) and two-ratio (‘foreground’ branch and ‘background’ branch have different dN/dS values) models were employed to conduct likelihood ratio tests (LRTs) [45] assessing the significant variation between each of the five pairs clades, and in total 65 tests were conducted (13 PCGs are multiplied by five pairs of clades; (2) genes detected with the significant difference in dN/dS values in step one were subsequently estimated further for this pair using the free-ratio model; (3) the mean dN/dS, dN, and dS values from step two were compared between so-called ‘foreground’ and ‘background’ pair comparison to assess possible changes in selection pressure; (4) furthermore, the site model [46] was applied to detect the potential selection among sites and allow for different ω ratios in different sites, codons, or amino acids [47]. We also used LRTs to assess these models and Bayes Empirical Bayes (BEB) method [13] to evaluate the posterior probability of positively selected sites. For analysis of changes in dN/dS, only those that were without dS = 0 were used in the analysis or were discarded if dS = 0 [48]. All statistical analyses were finished in SPSS 20.0.
3. Results
3.1. Mitogenome Characteristics and Sequence Variation of the Pseudogobionini Group
In this study, the length of the mitogenomes of the Pseudogobionini group varied from 16,568 (Microphysogobio alticorpus) to 16,988 (Saurogobio immaculatus) base pairs (bp) (Table 1). All of them were composed of 13 PCGs, 22 transfer RNA genes, two ribosomal RNA genes, and one control region (CR). The average nucleotide composition was 30.0%, 26.3%, 17.0%, and 26.7% for A, T, G, and C, respectively, with higher A + T content (56.3%) than G + C (43.7%) and exhibited positive (0.066) AT-skew and negative (−0.222) GC-skew. The newly sequenced five gudgeon complete mitogenomes of two species were deposited in GenBank under the accession numbers ON533884-ON533888 (Table 1). Gene arrangements and organization were displayed in Table S2. Our newly sequenced mitogenomes were 16,600–16,604 bp in length, and the average total base composition was 29.7%, 26.4%, 16.8%, and 27.1% for A, T, G, and C, respectively. Among the Pseudogobionini species, most of the PCGs used ATG as the start codon except for the COXI gene, which used GTG as the initiation codon. In addition, stop codons varied among the 13 PCGs, some PCGs terminated with complete stop codons, including TAA or TAG, and other PCGs ended with incomplete stop codons, either TA or T.
3.2. Phylogenetic Analysis
We reconstructed BI and ML trees of the Pseudogobionini group based on the concatenated nucleotide sequences of 13 PCGs. The topological structures of BI and ML trees were almost consistent and supported by high support values. The bootstrap values and posterior probabilities were displayed on the nodes (Figure 1). The results showed that the genera Biwia, Microphysogobio, and Platysmacheilus were not monophyletic, but mixed, which was named as Biwia complex. The Pseudogobionini group was monophyletic, and the phylogeny was revealed as ((Xenophysogobio + Gobiobotia) + (Saurogobio + (Abbottina + (Pseudogobio + Biwia complex)))). The genus Saurogobio was divided into two major lineages, which we named Saurogobio branch A and Saurogobio branch B, respectively. The phylogeny among the species of Saurogobio was (((S. dabryi + (S. gracilicaudatus + S. xiangjiangensis)) + S. punctatus) + (((S. gymnocheilus + S. immaculatus) + S. lissilabris) + S. dumerili)) (Figure 1).
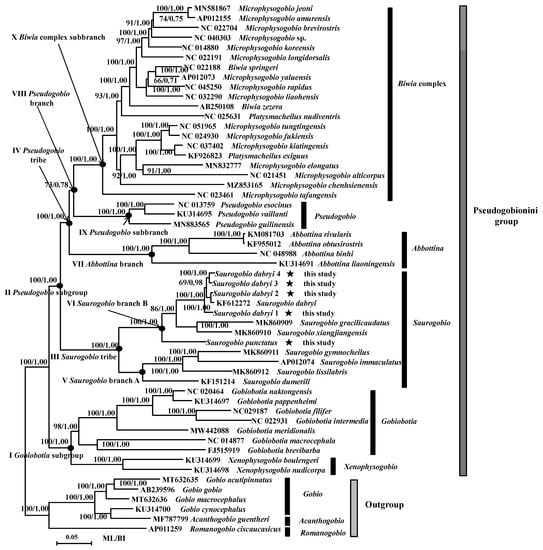
Figure 1.
Phylogenetic relationships of the Pseudogobionini group in ML and BI analysis based on the concatenated nucleotide sequences of 13 PCGs. Numbers on nodes before/after represent bootstrap values and posterior probabilities, respectively. The asterisks (★) represent sequences determined in this study. The black dots (●) indicate that nodes were used for selection pressure analysis. Definitions of the classification system and sequences of GenBank accession numbers were shown in the figure. Saurogobio branch A contains four species: S. dumerili, S. immaculatus, S. lissilabris, and S. gymnocheilus; Saurogobio branch B includes four species: S. dabryi, S. gracilicaudatus, S. xiangjiangensis, and S. punctatus.
Finally, based on the molecular phylogeny and morphological or osteological characters (Table 2), we proposed a classification system for the Pseudogobionini group.
Table 2.
The morphological or osteological characters for classification of the Pseudogobionini group.
3.3. Selection Pressure Analyses
The one ratio model M0 analysis revealed that the average ω values of the 13 PCGs were less than 0.10, indicating that the average selection pressure affecting each gene has been negative (or purifying). Comparisons of LRTs detected significant variations in dN/dS values in 20 of 65 tests. Among them, 15 were with lower values in the foreground branch, and 5 with higher values in the foreground branch (detailed information is displayed in Tables S3–S7).
The further analysis detected significant differences in mean dN/dS, dN, and/or dS values in 8 out of 13 PCGs (excluding ND2, ATP8, ND3, ND4L, and ND6) in three pairs of sub-clades (between Gobiobotia subgroup and Pseudogobio subgroup, between Saurogobio branch A and Saurogobio branch B as well as between Abbottina branch and Pseudogobio branch). No significant differences were detected between Saurogobio tribe and Pseudogobio tribe as well as between Pseudogobio subbranch and Biwia complex subbranch (Table 3). Among the detected significant differences, the mean dS value of the ND4 gene in the Gobiobotia subgroup was significantly higher than that of Pseudogobio subgroup (p = 0.032). The mean dN/dS value for the COXII gene in the Saurogobio branch A was remarkably greater than that of Saurogobio branch B (p = 0.001). The mean dN values for ND1, COXII, ND5, and Cyt b genes, and mean dS values for ND1, ATP6, COXII, ND5, and Cyt b genes in the Saurogobio branch A were notably greater than that of Saurogobio branch B (Table 3). The mean dN/dS values of the COXI, COXII, and Cyt b genes in the Abbottina branch were notably higher than that of Pseudogobio branch. The mean dN values of COXI, COXII, COXIII, and Cyt b genes, and the mean dS value of the COXII gene in the Abbottina branch were significantly greater than that of Pseudogobio branch (Table 3).
Table 3.
Statistical analyses of mean dN/dS, dN, and dS values under branch model for genes among five pairs of clades in the Pseudogobionini group.
Under the site model applied for detecting the positively selected sites from 13 PCGs, seven positively selected sites were detected in the ND2, ND4, and ND5 genes. The residue 193 S (0.952 *) in the ND4 gene between Saurogobio branch A and Saurogobio branch B (Table 4); residues 34 Q (0.972 *) and 525 H (0.997 **) in the ND5 gene between Abbottina branch and Pseudogobio branch; residue 274 D (0.960 *) in the ND2 gene; residue 26 A (0.975 *) in the ND4 gene; and residues 34 P (0.952 *) and 525 S (0.988 *) in the ND5 gene between Pseudogobio subbranch and Biwia complex subbranch (Tables S8 and S9).
Table 4.
Parameter estimates and log-likelihood values under models among sites for ND4 gene between Saurogobio branch A and Saurogobio branch B.
4. Discussion
4.1. Structural Features of Mitogenomes of the Pseudogobionini Group
All mitogenomes of the Pseudogobionini group are with the same gene arrangements and organization as found in other Cypriniformes species [5,26]. The average A + T content of these mitogenomes in this group was 56.3%, such an A + T rich pattern reflects the typical sequence feature of the vertebrate mitogenome [49]. Among the PCGs of this group, 12 out of 13 PCGs used ATG as the start codon except for the COXI gene, whose initiation codon was GTG. This is a typical phenomenon in fish mitogenomes [26,50]. In addition, incomplete stop codons (T or TA) were commonly found in these mitogenomes, which would be completed as TAA by post-transcriptional polyadenylation [51].
4.2. Phylogenetic Relationships of the Pseudogobionini Group
Our results supported that the Pseudogobionini group is monophyletic. This conclusion was consistent with previous studies on Gobioninae [8,24,26,27,35,52]. In our study, molecular phylogenetic relationships of the Pseudogobionini group showed that Pseudogobio had a closer relationship with Biwia complex, and that the Saurogobio was branch sister to the branch comprising three genera Pseudogobio, Abbottina, and Biwia complex. Our result was similar to a molecular phylogeny [26] but inconsistent with another molecular work [27] in which the Abbottina and Biwia complex were monophyletic. Although the Pseudogobio and Biwia complex share morphological characters (supraorbital bones present and wing-like lateral expansion end of 4th vertebral pleural rib) supporting our results, when considering the higher support value (97/1.00) on the node containing Abbottina complex and Biwia complex by Zhang et al. [27] than in our study (73/0.78) on the node involving Pseudogobio and Biwia complex, we suggest that further work is needed to resolve these relationships. Our phylogenetic relationships of the genus Saurogobio were congruent with the molecular evidence [53] in which the phylogeny was revealed by the mitochondrial Cyt b gene and strongly supported the monophyly of the genus Saurogobio.
4.3. Classification of the Pseudogobionini Group
Based on the molecular phylogeny and morphological or osteological [16,21,25] characters (Table 2), we proposed a classification system for the Pseudogobionini group as follows:
- Pseudogobionini group
- ●
- Gobiobotia subgroup
- ●
- Pseudogobio subgroup
- ■
- Saurogobio tribe
- ◆
- Saurogobio branch A
- ◆
- Saurogobio branch B
- ■
- Pseudogobio tribe
- ◆
- Abbottina branch
- ◆
- Pseudogobio branch
- ➢
- Pseudogobio subbranch
- ➢
- Biwia complex subbranch
Our classification results showed that the Pseudogobionini group is monophyletic. This conclusion supported Hosoya’s [25] and Yu and Yue’s [16] views. However, the generic relationships within the Pseudogobionini are significantly different from previous studies [16,25]. Hosoya [25] proposed that the Biwia complex was the most specialized group, followed by Saurogobio, and they together formed sister groups with the branch composed of the genera Abbottina and Pseudogobio. Yu and Yue [16] revealed that the Biwia complex was the most specialized group, followed by Abbottina, then Saurogobio; Pseudogobio was the most primitive genus. We found that the Biwia complex has the highest phylogenetic position, followed by Pseudogobio, then Abbottina, and Saurogobio located at the base position based on mitogenomic data. The differences in the generic relationships within the Pseudogobionini suggested that the diversification and complication of this group and its phylogeny need to be resolved in the future via more extensive sampling and more comprehensive characters analysis. Although the Gobiobotia subgroup (including Gobiobotia and Xenophysogobio) was not included in Yu and Yue’s [16] study, based on our results and Hosoya’s [25] results, we proposed that the Gobiobotia subgroup was the most primitive genus among the Pseudogobionini genera.
4.4. Mitochondrial Gene Evolution and Group Differentiation and Adaptations of the Pseudogobionini Fishes
Mitochondrial gene evolution has been recognized playing important roles in animal adaptation to different environments and showing different dN/dS values [10,11,12,54]. In this study, we detected significantly different dN/dS values in 11 out of 13 (excluding ND3 and ND4L) PCGs in five pairs of clades (Tables S3–S7), and significantly different mean dN/dS, dN, and/or dS values in 8 out of 13 PCGs (excluding ND2, ATP8, ND3, ND4L, and ND6) in three pairs of sub-clades (Table 3). We suggested that those mitochondrial gene evolution may have contributed to group differentiation to different habitats. For example, the Abbottina branch and Biwia complex subbranch mainly lives in lakes (standing water) spawning very sticky eggs [55] with very short and blunt snout [21,22,23], while the Pseudogobio subbranch mainly inhabits rivers (flowing water) spawning adhesive eggs [56] with a relatively depressed and elongated snout [21,57]. The Saurogobio branch A mainly lives in flowing water and smooth lips or with degenerated papillae, while the Saurogobio branch B mainly inhabits relatively standing water and lips with developed papillae [21,53]. We think that living in different habitats may result in the adaptation to different environments with different dissolved oxygen concentrations leading to different feeding and breeding methods.
Positive selections over the mitochondrial genes have been found contributing to high-altitude birds [54] and vertebrates [12] adaptation to the harsh environment. In our study, we detected one positively selected site in the ND4 gene between Saurogobio branch A and Saurogobio branch B, two positively selected sites in the ND5 gene between Abbottina branch and Pseudogobio branch, one positively selected site in the ND2 gene and one in the ND4 gene, as well as two positively selected sites in the ND5 gene between Pseudogobio subbranch and Biwia complex subbranch. (Table 4, Tables S8 and S9). These three genes belong to NADH dehydrogenase, which is the first and the largest enzyme complex in the respiratory chain [9,58]. Positively selected sites may change or affect the electron transport of the respiratory chain and thereby change the mitochondrial oxidative phosphorylation process. We speculated that positive selection over the mitochondrial gene might be associated with group differentiation and adaptations to lake or river environments in our investigated groups.
5. Conclusions
This study provides information on newly sequenced complete mitochondrial genomes of two gudgeon species S. dabryi and S. punctatus, well-supported phylogeny of the East Asia predominant fish group of Pseudogobionini, and gives hints that mitochondrial gene evolution might have contributed to group differentiation and adaptations of the Pseudogobionini fishes. This study promotes our understanding of the molecular phylogeny of the Pseudogobionini group and can serve as a valuable reference for further analysis of selection pressure in different taxa.
Supplementary Materials
The following supporting information can be downloaded at: https://www.mdpi.com/article/10.3390/fishes8040201/s1. Table S1: Primers used for the amplification in the mitochondrial genomes of Saurogobio dabryi and S. punctatus in this study; Table S2: Characteristics of the mitochondrial genomes of two gudgeon species S. dabryi1–4 and S. punctatus; Table S3–S7: Likelihood ratio tests and parameter estimates under branch model for genes between Gobiobotia subgroup and Pseudogobio subgroup, between Saurogobio tribe and Pseudogobio tribe, between Saurogobio branch A and Saurogobio branch B, between Abbottina branch and Pseudogobio branch, as well as between Pseudogobio subbranch and Biwia complex subbranch; Table S8: Parameter estimates and log-likelihood values under models among sites for ND5 gene between Abbottina branch and Pseudogobio branch; Table S9: Parameter estimates and log-likelihood values under models among sites for ND2, ND4, and ND5 genes between Pseudogobio subbranch and Biwia complex subbranch.
Author Contributions
Conceptualization, H.L. and L.C.; methodology, H.L. and L.C.; statistical analysis, L.C. and X.Z.; investigation, L.C.; data curation, H.L., L.C. and X.Z.; writing—original draft preparation, L.C.; writing—review and editing, H.L. and L.C. All authors have read and agreed to the published version of the manuscript.
Funding
This study was funded by the National Key R & D Program of China (No. 2018YFD0900806); the Strategic Priority Research Program of the Chinese Academy of Sciences under Grant (No. XDB31040000); the National Natural Science Foundation of China under Grant (No. 31872234); and the Sino BON–Inland Water Fish Diversity Observation Network.
Institutional Review Board Statement
This study was approved by the Institutional Animal Care and Use Committee of the Institute of Hydrobiology, Chinese Academy of Sciences (Approval code: IHB/LL/2022028).
Data Availability Statement
The five newly sequenced data have been deposited in GenBank (https://www.ncbi.nlm.nih.gov/genbank/, accessed on 25 March 2023) under the accession numbers ON533884-ON533888, the other published mitogenomic data can be downloaded from GenBank, and the remaining data was contained in the article and Supplement Materials.
Acknowledgments
We thank Dan Yu, Mingzheng Li, and Qiang Qin for the assistance in field sampling. We thank Dan Yu and Huanshan Wang for their valuable advice on the manuscript. We also thank three anonymous reviewers for their valuable comments on the manuscript.
Conflicts of Interest
The authors declare no conflict of interest.
References
- Boore, J.L. Animal mitochondrial genomes. Nucleic Acids Res. 1999, 27, 1767–1780. [Google Scholar] [CrossRef]
- Brown, K. Fish mitochondrial genomics: Sequence, inheritance and functional variation. J. Fish Biol. 2008, 72, 355–374. [Google Scholar] [CrossRef]
- Satoh, T.P.; Miya, M.; Mabuchi, K.; Nishida, M.J. Structure and variation of the mitochondrial genome of fishes. BMC Genom. 2016, 17, 1–20. [Google Scholar] [CrossRef]
- Miya, M.; Nishida, M. The mitogenomic contributions to molecular phylogenetics and evolution of fishes: A 15-year retrospect. Ichthyol Res 2015, 62, 29–71. [Google Scholar] [CrossRef]
- Saitoh, K.; Sado, T.; Mayden, R.; Hanzawa, N.; Nakamura, K.; Nishida, M.; Miya, M. Mitogenomic evolution and interrelationships of the Cypriniformes (Actinopterygii: Ostariophysi): The first evidence toward resolution of higher-level relationships of the world’s largest freshwater fish clade based on 59 whole mitogenome sequences. J. Mol. Evol. 2006, 63, 826–841. [Google Scholar] [CrossRef] [PubMed]
- Tabata, R.; Kakioka, R.; Tominaga, K.; Komiya, T.; Watanabe, K. Phylogeny and historical demography of endemic fishes in Lake Biwa: The ancient lake as a promoter of evolution and diversification of freshwater fishes in western Japan. Ecol. Evol. 2016, 6, 2601–2623. [Google Scholar] [CrossRef] [PubMed]
- Yu, P.; Zhou, L.; Yang, W.T.; Miao, L.J.; Li, Z.; Zhang, X.J.; Wang, Y.; Gui, J.F. Comparative mitogenome analyses uncover mitogenome features and phylogenetic implications of the subfamily Cobitinae. BMC Genom. 2021, 22, 1–19. [Google Scholar] [CrossRef]
- Zhao, J.; Xu, D.; Zhao, K.; Diogo, R.; Yang, J.; Peng, Z. The origin and divergence of Gobioninae fishes (Teleostei: Cyprinidae) based on complete mitochondrial genome sequences. J. Appl. Ichthyol. 2016, 32, 32–39. [Google Scholar] [CrossRef]
- Da Fonseca, R.R.; Johnson, W.E.; O’Brien, S.J.; Ramos, M.J.; Antunes, A. The adaptive evolution of the mammalian mitochondrial genome. BMC Genom. 2008, 9, 1–22. [Google Scholar] [CrossRef]
- Liu, S.Q.; Mayden, R.L.; Zhang, J.B.; Yu, D.; Tang, Q.Y.; Deng, X.; Liu, H.Z. Phylogenetic relationships of the Cobitoidea (Teleostei: Cypriniformes) inferred from mitochondrial and nuclear genes with analyses of gene evolution. Gene 2012, 508, 60–72. [Google Scholar] [CrossRef]
- Noll, D.; Leon, F.; Brandt, D.; Pistorius, P.; Le Bohec, C.; Bonadonna, F.; Trathan, P.N.; Barbosa, A.; Raya Rey, A.; Dantas, G.P.M.; et al. Positive selection over the mitochondrial genome and its role in the diversification of gentoo penguins in response to adaptation in isolation. Sci. Rep. 2022, 12, 3767. [Google Scholar] [CrossRef]
- Wang, X.; Zhou, S.; Wu, X.; Wei, Q.; Shang, Y.; Sun, G.; Mei, X.; Dong, Y.; Sha, W.; Zhang, H.; et al. High-altitude adaptation in vertebrates as revealed by mitochondrial genome analyses. Ecol. Evol. 2021, 11, 15077–15084. [Google Scholar] [CrossRef]
- Yang, Z.; Wong, W.S.; Nielsen, R. Bayes empirical Bayes inference of amino acid sites under positive selection. Mol. Biol. Evol. 2005, 22, 1107–1118. [Google Scholar] [CrossRef]
- Nelson, J.S.; Grande, T.C.; Wilson, M.V.H. Fishes of the World, 5th ed.; John Wiley and Sons, Inc.: Hoboken, NJ, USA, 2016. [Google Scholar]
- Yu, L.R.; Yue, P.Q. Origin and evolution of the Pseudogobiini fishes in Eastern Asia. Acta Hydrobiol. Sin. 1996, 20, 1–7. (In Chinese) [Google Scholar]
- Yu, L.R.; Yue, P.Q. Studies on phylogeny of the Pseudogobiini fishes (Cypriniformes: Cyprinidae). Acta Zootaxon. Sin. 1996, 21, 244–255. (In Chinese) [Google Scholar]
- Fricke, R.; Eschmeyer, W.N.; Van der Laan, R. (Eds.) Eschmeyer’s Catalog of Fishes: Genera, Species, References. Available online: http://researcharchive.calacademy.org/research/ichthyology/catalog/fishcatmain.asp (accessed on 17 March 2022).
- Froese, R.; Pauly, D.; FishBase. World Wide Web Electronic Publication. Available online: www.fishbase.org (accessed on 16 March 2022).
- Bănărescu, P. A critical updated checklist of Gobioninae (Pisces, Cyprinidae). Trav. Du Muséum D’histoire Nat. “Grigore Antipa” 1992, 32, 303–330. [Google Scholar]
- Bănărescu, P.; Nalbant, T. Pisces Teleostei Cyprinidae (Gobioninae); Das Tierreich, Lieferung 93; Walter de Guryter: Berlin, Germany, 1973; pp. 1–304. [Google Scholar]
- Yue, P.Q. Gobioninae. In Fauna Sinica, Osteichthyes, Cypriniformes (II); Chen, Y.Y., Ed.; Science Press: Beijing, China, 1998; pp. 232–389. (In Chinese) [Google Scholar]
- Jordan, D.S.; Fowler, H.W. A review of the cyprinoid fishes of Japan. Proc. U.S. Natl. Mus. 1903, 26, 811–862. [Google Scholar] [CrossRef]
- Kawase, S.; Hosoya, K. Biwia yodoensis, a new species from the Lake Biwa/Yodo River Basin, Japan (Teleostei: Cyprinidae). Ichthyol. Explor. Freshw. 2010, 21, 1–7. [Google Scholar]
- Tang, K.L.; Agnew, M.K.; Chen, W.J.; Vincent Hirt, M.; Raley, M.E.; Sado, T.; Schneider, L.M.; Yang, L.; Bart, H.L.; He, S.; et al. Phylogeny of the gudgeons (Teleostei: Cyprinidae: Gobioninae). Mol. Phylogenet. Evol. 2011, 61, 103–124. [Google Scholar] [CrossRef]
- Hosoya, K. Interrelationships of the Gobioninae (Cyprinidae). In Indo-Pacific Fish Biology: Proceedings of the Second International Conference on Indo-Pacific Fishes; Uyeno, T., Arai, R., Taniuchi, T., Matsuura, K., Eds.; Ichthyological Society of Japan: Tokyo, Japan, 1986; pp. 484–501. [Google Scholar]
- Chen, A.H. Studies on Molecular Phylogeny of the Gobioninae (Teleostei: Cyprinidae) (Unpublished Data). Master’s Thesis, Fudan University, Shanghai, China, 2014. [Google Scholar]
- Zhang, R.Y.; Tang, Q.; Deng, L. The complete mitochondrial genome of Microphysogobio elongatus (Teleostei, Cyprinidae) and its phylogenetic implications. ZooKeys 2021, 1061, 57. [Google Scholar] [CrossRef]
- Aljanabi, S.M.; Martinez, I. Universal and rapid salt-extraction of high quality genomic DNA for PCR-based techniques. Nucleic Acids Res. 1997, 25, 4692–4693. [Google Scholar] [CrossRef] [PubMed]
- Tang, Q.Y.; Freyhof, J.; Xiong, B.X.; Liu, H.Z. Multiple invasions of Europe by East Asian cobitid loaches (Teleostei: Cobitidae). Hydrobiologia 2008, 605, 17–28. [Google Scholar] [CrossRef]
- Xu, H.; Xue, Y.; Li, X.Y.; Luo, X.; Li, Y.; Li, Y. Complete mitochondrial genome of the Chinese lizard gudgeon, Saurogobio dabryi (Teleostei: Cypriniformes: Cyprinidae). Mitochondrial DNA 2015, 26, 840–841. [Google Scholar] [CrossRef] [PubMed]
- Kumar, S.; Stecher, G.; Li, M.; Knyaz, C.; Tamura, K. MEGA X: Molecular evolutionary genetics analysis across computing platforms. Mol. Biol. Evol. 2018, 35, 1547–1549. [Google Scholar] [CrossRef]
- Swindell, S.R.; Plasterer, T.N. Seqman. In Sequence Data Analysis Guidebook; Humana Press: New York, NY, USA, 1997; pp. 75–89. [Google Scholar] [CrossRef]
- Perna, N.; Kocher, T. Patterns of nucleotide composition at fourfold degenerate sites of animal mitochondrial genomes. J. Mol. Evol. 1995, 41, 353–358. [Google Scholar] [CrossRef]
- Watrous, L.E.; Wheeler, Q.D. The out-group comparison method of character analysis. Syst. Biol. 1981, 30, 1–11. [Google Scholar] [CrossRef]
- Yang, J.Q.; He, S.P.; Freyhof, J.; Witte, K.; Liu, H.Z. The phylogenetic relationships of the Gobioninae (Teleostei: Cyprinidae) inferred from mitochondrial cytochrome b gene sequences. Hydrobiologia 2006, 553, 255–266. [Google Scholar] [CrossRef]
- Zhang, D.; Gao, F.; Jakovlic, I.; Zou, H.; Zhang, J.; Li, W.X.; Wang, G.T. PhyloSuite: An integrated and scalable desktop platform for streamlined molecular sequence data management and evolutionary phylogenetics studies. Mol Ecol Resour. 2020, 20, 348–355. [Google Scholar] [CrossRef]
- Kalyaanamoorthy, S.; Minh, B.Q.; Wong, T.K.F.; von Haeseler, A.; Jermiin, L.S. ModelFinder: Fast model selection for accurate phylogenetic estimates. Nat. Methods 2017, 14, 587–589. [Google Scholar] [CrossRef]
- Luo, A.; Qiao, H.; Zhang, Y.; Shi, W.; Ho, S.Y.; Xu, W.; Zhang, A.; Zhu, C. Performance of criteria for selecting evolutionary models in phylogenetics: A comprehensive study based on simulated datasets. BMC Evol. Biol. 2010, 10, 1–13. [Google Scholar] [CrossRef] [PubMed]
- Ronquist, F.; Teslenko, M.; Van Der Mark, P.; Ayres, D.L.; Darling, A.; Höhna, S.; Larget, B.; Liu, L.; Suchard, M.A.; Huelsenbeck, J.P. MrBayes 3.2: Efficient Bayesian phylogenetic inference and model choice across a large model space. Syst. Biol. 2012, 61, 539–542. [Google Scholar] [CrossRef] [PubMed]
- Nguyen, L.T.; Schmidt, H.A.; von Haeseler, A.; Minh, B.Q. IQ-TREE: A fast and effective stochastic algorithm for estimating maximum-likelihood phylogenies. Mol. Biol. Evol. 2015, 32, 268–274. [Google Scholar] [CrossRef] [PubMed]
- Minh, B.Q.; Nguyen, M.A.T.; von Haeseler, A. Ultrafast approximation for phylogenetic bootstrap. Mol. Biol. Evol. 2013, 30, 1188–1195. [Google Scholar] [CrossRef]
- Xu, B.; Yang, Z. PAMLX: A graphical user interface for PAML. Mol. Biol. Evol. 2013, 30, 2723–2724. [Google Scholar] [CrossRef] [PubMed]
- Yang, Z.H. PAML: A program package for phylogenetic analysis by maximum likelihood. Comput. Appl. Biosci. 1997, 13, 555–556. [Google Scholar] [CrossRef]
- Gao, F.; Chen, C.; Arab, D.A.; Du, Z.; He, Y.; Ho, S.Y. EasyCodeML: A visual tool for analysis of selection using CodeML. Ecol. Evol. 2019, 9, 3891–3898. [Google Scholar] [CrossRef] [PubMed]
- Yang, Z.H. Likelihood ratio tests for detecting positive selection and application to primate lysozyme evolution. Mol. Biol. Evol. 1998, 15, 568–573. [Google Scholar] [CrossRef] [PubMed]
- Yang, Z.; Swanson, W.J. Codon-substitution models to detect adaptive evolution that account for heterogeneous selective pressures among site classes. Mol. Biol. Evol. 2002, 19, 49–57. [Google Scholar] [CrossRef] [PubMed]
- Yang, Z.H. PAML 4: Phylogenetic analysis by maximum likelihood. Mol. Biol. Evol. 2007, 24, 1586–1591. [Google Scholar] [CrossRef]
- Sun, Y.B.; Shen, Y.Y.; Irwin, D.M.; Zhang, Y.P. Evaluating the roles of energetic functional constraints on teleost mitochondrial-encoded protein evolution. Mol. Biol. Evol. 2011, 28, 39–44. [Google Scholar] [CrossRef]
- Peng, R.; Zeng, B.; Meng, X.; Yue, B.; Zhang, Z.; Zou, F. The complete mitochondrial genome and phylogenetic analysis of the giant panda (Ailuropoda melanoleuca). Gene 2007, 397, 76–83. [Google Scholar] [CrossRef] [PubMed]
- Li, J.; Peng, Y.; Zhang, S.; Liu, Y.; Zhang, K.; Chen, J.; Zhang, H.; Zhang, C.; Liu, B.J. The complete mitochondrial genome of Parachiloglanis hodgarti and its phylogenetic position within Sisoridae. J. Oceanol. Limnol. 2023, 41, 267–279. [Google Scholar] [CrossRef]
- Wang, Z.L.; Li, C.; Fang, W.Y.; Yu, X.P. The complete mitochondrial genome of two Tetragnatha spiders (Araneae: Tetragnathidae): Severe truncation of tRNAs and novel gene rearrangements in Araneae. Int. J. Biol. Sci. 2016, 12, 109–119. [Google Scholar] [CrossRef] [PubMed]
- Liu, H.Z.; Yang, J.Q.; Tang, Q.Y. Estimated evolutionary tempo of East Asian gobionid fishes (Teleostei: Cyprinidae) from mitochondrial DNA sequence data. Chin. Sci. Bull. 2010, 55, 1501–1510. [Google Scholar] [CrossRef]
- Tang, Q.Y.; Li, X.B.; Yu, D.; Zhu, Y.R.; Ding, B.Q.; Liu, H.Z.; Danley, P.D. Saurogobio punctatus sp. nov., a new cyprinid gudgeon (Teleostei: Cypriniformes) from the Yangtze River, based on both morphological and molecular data. J. Fish Biol. 2018, 92, 347–364. [Google Scholar] [CrossRef]
- Zhou, T.; Shen, X.; Irwin, D.M.; Shen, Y.; Zhang, Y. Mitogenomic analyses propose positive selection in mitochondrial genes for high-altitude adaptation in galliform birds. Mitochondrion 2014, 18, 70–75. [Google Scholar] [CrossRef]
- Nakamura, M. Cyprinid Fishes of Japan—Studies on the life history of cyprinid fishes of Japan, Special Publications of the Research Institute for Natural Resources, No. 4; Research Institute for Natural Resources: Tokyo, Japan, 1969; 1–455. (In Japanese)
- Nakajima, J.; Onikura, N. Spawning behaviour and male mating success of Pike Gudgeon, Pseudogobio esocinus (Cypriniformes, Cyprinidae), in an experimental tank. Ichthyol. Res. 2016, 63, 39–45. [Google Scholar] [CrossRef]
- Tominaga, K.; Kawase, S. Two new species of Pseudogobio pike gudgeon (Cypriniformes: Cyprinidae: Gobioninae) from Japan, and redescription of P. esocinus (Temminck and Schlegel 1846). Ichthyol. Res. 2019, 66, 488–508. [Google Scholar] [CrossRef]
- Vercellino, I.; Sazanov, L.A. The assembly, regulation and function of the mitochondrial respiratory chain. Nat. Rev. Mol. Cell Biol. 2022, 23, 141–161. [Google Scholar] [CrossRef]

Disclaimer/Publisher’s Note: The statements, opinions and data contained in all publications are solely those of the individual author(s) and contributor(s) and not of MDPI and/or the editor(s). MDPI and/or the editor(s) disclaim responsibility for any injury to people or property resulting from any ideas, methods, instructions or products referred to in the content. |
© 2023 by the authors. Licensee MDPI, Basel, Switzerland. This article is an open access article distributed under the terms and conditions of the Creative Commons Attribution (CC BY) license (https://creativecommons.org/licenses/by/4.0/).