Article

Beneficial Effects of Graded Levels of Fish Protein Hydrolysate (FPH) on the Growth Performance, Blood Biochemistry, Liver and Intestinal Health, Economics Efficiency, and Disease Resistance to Aeromonas hydrophila of Pabda (Ompok pabda) Fingerling

by
Afrina Yeasmin Suma
1,
Shishir Kumar Nandi
1,
Zulhisyam Abdul Kari
2,3,*,
Khang Wen Goh
4,
Lee Seong Wei
2,3,
Albaris B. Tahiluddin
5,
Paul Seguin
6,
Mikael Herault
6,
Abdullah Al Mamun
7,
Guillermo Téllez-Isaías
8 and
Muhammad Anamul Kabir
1,3,*
1
Department of Aquaculture, Sylhet Agricultural University, Sylhet 3100, Bangladesh
2
Department of Agricultural Sciences, Faculty of Agro-Based Industry, Universiti Malaysia Kelantan, Jeli Campus, Jeli 17600, Malaysia
3
Advanced Livestock and Aquaculture Research Group, Faculty of Agro-Based Industry, Universiti Malaysia Kelantan, Jeli Campus, Jeli 17600, Malaysia
4
Faculty of Data Science and Information Technology, INTI International University, Nilai 71800, Malaysia
5
College of Fisheries, Mindanao State University-Tawi-Tawi College of Technology and Oceanography, Sanga-Sanga, Bongao 7500, Tawi-Tawi, Philippines
6
Symrise Aqua Feed of Taste, Nutrition & Health Segment of the Symrise AG Group, 35700 Rennes, France
7
Department of Fish Health Management, Sylhet Agricultural University, Sylhet 3100, Bangladesh
8
Department of Poultry Science, University of Arkansas, Fayetteville, AR 72701, USA
*
Authors to whom correspondence should be addressed.
Fishes 2023, 8(3), 147; https://doi.org/10.3390/fishes8030147
Submission received: 27 January 2023 / Revised: 23 February 2023 / Accepted: 28 February 2023 / Published: 2 March 2023
(This article belongs to the Special Issue Feed and Nutrition Research in Aquaculture)

Abstract

:
Fish protein hydrolysate (FPH) is the enzymatic hydrolysis of protein into smaller peptide and free amino acids, which has recently captured considerable attention as a supplementary ingredient in the aqua-feed industry sector. The present research aimed to observe the physiological, biochemical, and bacteriological study of FPH-treated diets and its effects on growth, hematology, plasma biochemistry, liver and gut histopathology, and resistance to Aeromonas hydrophila infection in Pabda (Ompok pabda). Four experimental diets (35% crude protein) were formulated with graded FPH supplementation (0, 0.5, 1, and 2%). The feed physiological parameters such as expansion ratio, bulk density, water stability, and floatability were not significantly affected by dietary FPH levels (p > 0.05), except for the pellet durability index (PDI). Furthermore, the diets with 1% and 2% FPH were more palatable to fish than other treatment diets. The total bacteria (TB) in fish diets and guts followed an increasing trend with the increase in various levels of FPH in diets. The significantly highest body weight, specific growth rate (SGR), total biomass (TB), survival rate (SR), condition factor (CF), and hepatosomatic index (HSI) were noted in 2% FPH-fed fish when compared with other treatment groups (p < 0.05). The feed intake of fish was significantly increased when increasing the FPH in diets (p < 0.05). The fish fed with a 2% FPH diet had significantly higher neutrophil, monocyte, lymphocyte, red blood cell, and platelet levels (p < 0.05). The blood glucose, creatinine, total protein, and globulin were significantly lower in control fish compared to other treatment groups (p < 0.05). The histopathological observation of mid intestine tissues displayed that 2% of FPH-diet-fed fish had a well-anchored epithelial wall with well-arranged goblet cells, a long villus structure, stratum compactum, and tunica muscularis compared to other treatments of FPH. The inclusion of FPH in diets up to 2% significantly improved the liver health of fish. The fish fed with 2% FPH had a significantly lower cumulative percent mortality (16.67%) against A. hydrophila infection in the bacterial challenge test (p < 0.05). Therefore, the present results suggested that using 2% FPH in the aqua-feed industry improves the growth performance, health status, and disease resistance of Pabda fingerlings in captivity.
Key Contribution: Fish protein hydrolysate (FPH) at approximately 2% in aqua-feed industries could be suggested for the better growth; health status; disease resistance; and dietary cost effectiveness of Pabda catfish.

1. Introduction

Pabda (O. pabda) is a strong candidate as a commercially important catfish species in the aquaculture industry of Bangladesh. The fast growth rate and high market demand are triggering Pabda catfish culture to gain rapid popularity in Bangladesh as well as many parts of South Asia. The species is thought to be the most delicious to eat due to its fine flesh with a soft meat texture. Alam et al. [1] stated that Pabda flesh is a great source of amino acids, fatty acids, minerals, and vitamins. However, Pabda farming in captivity is sometimes problematic due to its cannibalistic nature [2] and thus may require necessary approaches to overcome this problem, such as the maintenance of species homogeneity, optimum feed, and precise feeding intervals. Additionally, poor growth and survival rates, disease epidemics, high prices as well as a lack of good-quality feeds pose significant barriers to the sustainable production of Pabda. As a result, the search for alternative bioactive compounds and immunostimulants can greatly improve the growth performance and immune status of fish and also minimize the feed cost by replacing a highly valued fish meal in diets [3,4]. Siddik et al. [5] reported that the supplementation of fish protein hydrolysate (FPH) in diets significantly boosts the productivity and defense mechanism of fish and also offers less susceptibility to disease occurrence.
It has been reported that the seafood processing industries generate a considerable amount of waste products annually [6,7,8]. The conversion of these by-products into protein-based aqua-feed ingredients through enzymatic processes can potentially reduce the cost of waste disposal and also offer a strategy for waste management in the fish processing industry sector. Zamora-Sillero et al. [9] documented that the enzymatic hydrolysis of such by-products produces very high-quality fish protein hydrolysate while preserving its nutritional value. Fish protein hydrolysate contains a very rich amount of soluble protein, making it more digestible and absorbable in comparison with whole protein [10,11]. According to previous findings, it has been proven that FPH promotes the nutrient intake and biological activity of fish by providing free amino acids, di-tri peptides, and medium-sized peptides [12,13]. In addition, the peptides found in FPH had antioxidant, antimicrobial, antihypertensive, immunomodulatory, and anticancer properties [14,15].
Numerous studies have evaluated the effects of low doses of FPH inclusion in diets on the growth performance, feed efficiency, immune mechanism, and specific disease resistance in various commercially important fish species such as Paralichthys olivaceus [16], Lates calcarifer [5,17,18], Pagrus major [19], Acipenser persicus L. [20], Dicentrarchus labrax [21], Oncorhynchus mykiss [22], and Anguilla japonica [23]. In contrast, the very high inclusion of dietary FPH in diets has detrimental effects on the growth performance of fish [24,25]. It is worth noting that the enzymatic process of protein hydrolysis produces some peptides and amino acids, causing a bitter taste to develop in fish diets [26]. The elimination of hydrophobic peptides [27,28] and the selection of appropriate enzymes are possible solutions for the debittering of FPH [29]. At present, FPH is effectively used in the diets of many fish, but there is little information available on the use of FPH in Pabda catfish diets. In an effort to diversify the application of FPH in the aquaculture industry sector, in this study, a method was designed to identify the suitable level of dietary FPH to maximize the growth performance, health status, and disease resistance for the feed formulation of Pabda (O. pabda) catfish production.

2. Materials and Methods

2.1. Diet Formulation and Proximate Composition Analyses

The experimental feed ingredients and the proximate composition are presented in Table 1. Except FPH, all the ingredients were bought from Bandar Bazar, Sylhet, Bangladesh. The commercially available liquid FPH was provided by Symrise Aqua Feed, Specialities Pet Food (226-FR-SPF), France. Four experimental diets (35% crude protein) were prepared with different FPH inclusion levels at 0% (control diet), 0.5%, 1%, and 2%. Briefly, all the ingredients were finely ground and mixed homogenously with FPH for 45 min and then extruded to make pellets 2 mm in size. The pelleted diets were oven-dried at 60 °C for 8 h, packed in pre-labeled airtight bags, and stored in a cool and dry place until the feeding trial commenced. Proximate composition analyses of test diets were performed according to AOAC [30] with three replicates each.

2.2. Experimental Fish Collection and Husbandry Method

A total of 2000 Pabda catfish fry (mean weight: 2.00 ± 0.09 g) were purchased from a commercial fish farm. The fish were acclimatized for two weeks in a large hapa (8 feet × 6 feet × 4 feet, length × width × depth) and fed a basal diet (ACI Godrej Agrovet Private Limited, Bangladesh) containing 35% crude protein and 8% crude lipid. When the experimental feeding trial began, 1200 fish were individually weighed and distributed at random into 12 cages (1 m × 1 m × 1.5 m, length × width × depth) with 100 fish in each cage. All the cages were set up in the same pond to conduct the experiment. The experimental design was fully randomized, which consisted of 4 treatments with 3 replicates each. The feeding trial was conducted for 90 days, and the fish were fed twice daily at 9.15 a.m. and 5.15 p.m. until apparent satiation.

2.3. Physical Characteristics and Palatability Observation of Experimental Diets

2.3.1. Physical Parameters of Experimental Diets

The physiological properties of triplicate diets were determined according to the standard method and formulae described previously by Zulhisyam et al. [31] with few modifications.
  • Expansion ratio (%) = 100 × (Mean of FPH treated pellet diameter—Mean of original commercial feed diameter)/Mean of original commercial feed diameter;
  • Bulk density (kg/m3) = Weight of feeds in measuring cylinder (kg)/Total volume occupy (m3);
  • PDI (%) = 100 × (Weight of feeds remaining on the sieve after tumbling over the period/Initial total weight of feeds);
  • Water stability (%) = 100 × (Weight of retained whole pellets/Initial weight of pelleted diet);
  • Floatability (%) = 100 × (Mean value of floating feed in the beaker after the given time/Mean initial numbers of feed).

2.3.2. Palatability Test of FPH-Treated Diets

The palatability of FPH diets was determined according to Zulhisyam et al.’s [31] method with minor alterations. Briefly, observations on the palatability of the experimental diets were visually made by offering the feed sample on the surface of the water once, as far from the cage containing the experimental fish as possible. As soon as the pellets of FPH diets hit the water, the fish began to swim towards the diets. It was noticed that the response of the fish to the test diets was associated with a particular estimated product that the fish had a well-linked preference for. The experiment was conducted 3 times.

2.4. Analysis of Hydro-Ecological Variables

The cage water hydrological variables such as temperature, pressure, conductivity, TDS, salinity, and DO contents were monitored at 1-week intervals over the experimental period by employing a YSI Multiparameter probe (HI 9828, YSI Incorporation, Yellow Spring, OH, USA). Every week, the ammonia, nitrite, and nitrate levels in the holding cage water were examined with HACH test kits (HI 28049, HACH, Loveland, OH, USA).

2.5. Evaluation of Growth Performance

At the termination of the experimental feeding trial, all the fish from each replica cage were caught and immediately moved to the laboratory. After anesthesia with MS222, the total biomass of the fish was calculated. From this, about 30 fish per replication were randomly taken to measure the individual fish’s body weight and total length. The target inner organs of each fish were carefully removed after dissection, and the following formulae were used to determine the Pabdas’ growth performance:
  • Survival rate (%) = 100 × Number of fish survived/Total number of fish at the start of the experiment;
  • Weight gain (%) = 100 × (Final weight—Initial weight)/Initial weight;
  • Specific growth rate (%/day) = 100 × (ln (final weight)—ln (initial weight))/Days of experiment;
  • Total biomass gain (kg) = (Final biomass weight—Initial biomass weight);
  • Total yield (kg/m2) = Total biomass gain/Cage area;
  • Feed conversion ratio, FCR = Total feed intake/Live weight gain;
  • Feed conversion efficiency, FCE = Live weight gain/Total feed intake;
  • Protein efficiency ratio, PER = Live weight gain/Crude protein intake;
  • Hepatosomatic index, HSI = 100 × Liver weight/Final weight;
  • Visceral somatic index, VSI = 100 × Viscera weight/Final weight;
  • Intraperitoneal fat, IPF = 100 × Fat weight/Final weight;
  • Condition factor (CF) = 100 × Weight of fish body (g)/(Total length of fish, cm)3.

2.6. Biochemical Composition Analysis

The proximate composition of experimental diets, liver, intestine, and muscle was assessed according to AOAC [30], and each sample was analyzed in triplicate. Briefly, 3 fish from each replica cage were randomly taken, and tissue samples were collected and then frozen at −20 °C until subsequent analysis. The crude protein (% N × 6.25) was estimated with the Kjeldahl method; the crude lipid was measured by n-hexane extraction employing the Soxhlet apparatus; ash content was evaluated using a Muffle furnace at 550 °C for 6 h; and moisture content was calculated by oven-drying the samples at 105 °C for 24 h.

2.7. Estimation of Total Bacteria in Diets and Fish Gut

The total bacteria in fish diets and intestines were estimated according to the modification of Nandi et al.’s [32] method. In short, about 1 g of each sample was homogenized with 9 mL of sterile solution, and the suspension was then diluted serially to 10−8. After that, 10 µL of each test solution was spread onto Tryptic Soy Agar (TSA, HiMedia, Mumbai, India) in triplicate plates to enumerate the total bacterial load. The plates were then incubated at 37 °C for 36 h, and the number of colonies was quantified.

2.8. Assessment of Hematological and Biochemical Indices

The blood hematological and biochemical assays were performed according to some modifications of the methods by Abdul Kari et al. [33] and Nandi et al. [32]. After 90 days of feeding, 12 fish from each treatment were sampled and anesthetized using MS222 at a dose of 0.1 g/L water. A volume of 150 μL of blood from each treatment was collected from the caudal puncture of fish by function with a 1 mm heparinized syringe and then kept separately in EDTA K3 tubes. An automated hematology analyzer (Mythic 18 Vet, Corway diagnostics, USA) was employed to measure the hematological indices. Additionally, the plasma was separated by centrifuging the remaining blood sample at 3000 rpm for 15 min and then preserved at −20 °C until analysis. The biochemical parameters were determined by drawing plasma, 150 μL per treatment, onto pipette tips and dropping it into the cassettes, which contained the reagents for the measurement of each parameter (brand name: IDEXX, USA). A VetTest chemistry analyzer (Brand name: IDEXX, USA) was used to determine the biochemical parameters, except globulin. Globulin was calculated by subtracting the albumin content from the total protein in plasma.

2.9. Histopathology of Mid Gut and Liver

For the histopathological observation of fish tissues, a total of 4 fish per replication were taken at random and anesthetized with MS222. The fish were cut ventrally to take out the mid gut and liver portions and then fixed in a 10% neutral buffered formalin solution. After that, the collected samples were dehydrated in graded ethanol before being equilibrated in xylene, embedded in paraffin, sectioned into 5 to 8 μm slices, mounted on glass slides and stained in Hematoxylin and Eosin solution for histological examination under a light microscope (Leica DMIL-LED, Germany). Microphotographs of all fish intestine and liver sections were taken by employing an image capture analysis system (V1.18 64bit, Cellsens software, The Netherlands).

2.10. Experimental Infection with Aeromonas hydrophila

2.10.1. Collection and Maintenance of A. hydrophila

A. hydrophila (strain name: BDAH01, procured from Laboratory of Fish Disease Diagnosis and Pharmacology, Dept. of Fish Health Management, Sylhet Agricultural University, Bangladesh) was isolated from diseased catfish, Clarias batrachus [34], later confirmed by PCR and gene sequence (GB Accession number MZ046725.1). Subcultures were maintained on nutrient agar slants at 4°C. Bacteria were inoculated in tryptone soya broth (Himedia). The broth was incubated overnight in a shaker for 12 h at 37 °C and harvested at 0.8 optical density (OD) at 600 nm, and stock culture was preserved in 1.5% TSB with 20% glycerol at −20 °C until use.

2.10.2. LD50 of Aeromonas hydrophila

The mean lethal dose (LD50) was determined in O. pabda (15 ± 5.50 g) according to Reed and Muench [35]. The Pabda fingerlings were maintained in a rectangular glass aquaria (73 × 35 × 38 cm) containing 70 L of water (10 fish/tank) with aeration. Waste was siphoned from the bottom of the tanks once in two days; subsequently, 20% of the water was replaced. Water quality parameters were measured using YSI professional multiparameter and were found to be suitable for fish growth (the temperature ranged from 28.20 to 29.10 °C, the pH ranged from 7.20 to 7.90, ammonia and nitrogen were less than 0.03 mg/L, and the DO ranged from 6.20 to 6.90 mg/L). The experiment was carried out in duplicate. The isolate was grown overnight on 1.5% tryptic soya broth (TSB, Himedia, India) medium at 37°C, and cell suspensions were prepared by centrifugation at 10,000 rpm for 5 min with phosphate-buffered saline (PBS). Later, serial 10-fold dilution was maintained in order to obtain 109 to 102 CFU/mL. Each fish was injected intraperitoneally with 0.1 mL of A. hydrophila inoculate ranging from 102 to 109 CFU/mL. A control fish group was injected with 0.1 mL of phosphate-buffered saline (PBS). Mortality was recorded daily for ten days.

2.10.3. Challenge Study

At the end of the feeding trial, 30 fish from each treatment group, including the positive control, were injected with 0.1 mL of A. hydrophila (LD50–2.3 × 10⁷ CFU/mL) and fed with a basal diet. Fishes injected with 0.1 mL of phosphate-buffered saline (PBS) served as a negative control. The survival rate was recorded daily for ten days. Fresh blood from moribund fish was collected, and streaking was carried out from kidneys on RS (Rimlar Shots) media (Specific for A. hydrophila isolation) for the confirmation of fish death. The cumulative percent mortality of fish was calculated according to Rathore et al. [36].

2.11. Economic Efficiency

Feed component, as an input, is usually the main cost in a farm, especially when investments in rearing facilities are moderate, as this is the case for Pabda farming in Bangladesh. Feed raw material costs were calculated by summing the costs of the different raw materials and ingredients making each experimental diet. Farm feed costs were then calculated per unit of produced biomass as follows:
  • FFC (USD/kg) = FCR × diet raw material cost.
  • Farm revenues were calculated on an expected farm gate price of 3.15 USD/kg of Pabda: FR (USD/m2): Total Yield × 3.15.
  • Farm raw margins were calculated as follows:
  • FRM (USD/m2): FR—Total Yield × FFC.
  • Return on Investment (ROI) was calculated as follows:
  • ROI (%) = 100 × FPRM/(Total Yield × FFC).

2.12. Statistical Analysis

All statistical data were analyzed using IBM SPSS software 20.1 for Windows. One-way analysis of variance (ANOVA) was performed to estimate the average of each variable, with the significant differences (p < 0.05) detected by using Duncan’s multiple range test. The results are presented as mean ± standard deviation (SD).

3. Results

3.1. Physical Properties and Palatability of Experimental Diets

The physiological and palatability characteristics of experimental diets are summarized in Table 2. The FPH-treated diet’s physical parameters, such as expansion ratio, bulk density, floatability, and water stability, were not significantly different among the treatment groups in this study (p > 0.05). However, the significantly lowest pellet durability index was found in the diet of 2% FPH (p < 0.05). On the other hand, the palatability data of the experimental diets revealed that the fish fed with 0% and 0.5% FPH diets consumed less than 75% of the given feed within 5 min, whereas the fish groups fed 1% and 2% FPH consumed less than 100% of the given feed sample within 5 min.

3.2. Hydro-Ecological Variables of Water

Table 3 illustrates the hydrological parameters of fish-holding cage water. The water pressure was significantly varied among the treatments (p < 0.05), but no obvious trend was observed. A significantly (p < 0.05) higher dissolved oxygen level was recorded in the 2% FPH diet in comparison with other treatment groups. Conversely, other hydrological parameters in this investigation, especially water temperature, conductivity, TDS, salinity, pH, ammonia, nitrite, and nitrate level, displayed no remarkable variances among the treatment groups (p > 0.05).

3.3. Zootechnical Performance of Pabda

The zootechnical performance of fish fed with graded supplementations of FPH diets is illustrated in Table 4. There were significant differences in the fish growth and feed utilization indices in terms of final weight (FW), percent weight gain (WG), specific growth rate (SGR), total biomass (TB), survival rate (SR), feed conversion ratio (FCR), feed conversion efficiency (FCE), protein efficiency rate (PER), condition factor (CF), hepatosomatic index (HSI), intraperitoneal fat (IPF), and visceral somatic index (VSI) among the test diets (p < 0.05). The significantly highest FW, WG, SGR, TB, SR, FCE, PER, CF, and HSI values occurred in the fish fed 2% FPH levels in comparison with other treatment diets (p < 0.05). The FCR was significantly lowered with the increase in dietary FPH inclusion in test diets (p < 0.05). The values of IPF and VSI significantly differed among the FPH treatment groups (p < 0.05) but did not follow any certain trend.

3.4. Biochemical Composition of Fish Body Tissues

The experimental fish tissues’ proximate composition is shown in Table 5. The protein percentage of the fish intestine, liver, and muscle followed an increasing trend with the increase in dietary FPH in diets, but there were no significant differences between the diets containing 0% and 0.5% FPH within each organ (p > 0.05). The lipid level in the liver was significantly influenced by FPH inclusion in test pellets (p < 0.05); however, no obvious noteworthy variations were observed in the lipid content of the intestine among the diet treatments. Furthermore, the lipid deposition in the muscle was significantly affected by various levels of FPH in diets (p < 0.05) but did not follow any certain trend among the test groups in this study. The ash contents in the liver and intestine were statistically different (p < 0.05), whilst no discernible variation was found in the muscle ash content among the various treatments. On the other hand, the fish fed with the control diet had a significantly higher moisture level in the liver and muscle when compared with other FPH diets (p < 0.05). However, the intestinal moisture content remained unchanged among the different treatment levels of FPH.

3.5. Total Bacteria (TB) in FPH Diets and Intestine

The results of total bacteria (TB) in test samples are listed in Table 6. The TB in fish diets and intestines followed a rising trend with the increase in FPH supplementation in diets, whilst significantly higher TB counts were recorded in 2% FPH as compared with other test groups (p < 0.05). However, the significantly lowest mean values of total bacteria in fish feed and intestines were found in the control group (p < 0.05).

3.6. Hematological Parameters of Pabda (O. pabda)

Blood hematological indices of Pabda fed with graded levels of FPH are presented in Table 7. The mean values of WBC, EOS, MCV, MCH, RDW-CV, RDW-SD, and MPV in the fish displayed no significant differences between the treatment diets (p > 0.05). Nonetheless, the NEU, BAS, RBC, HGB, HCT, MCHC, PDW, and PCT values were significantly influenced by different levels of FPH in diets (p < 0.05) but did not follow any certain trend. In addition, the LYM, MON, and PLT values were substantially increased with the rise in FPH inclusion in diets (p < 0.05). The fish that were fed with 2% FPH had significantly higher NEU, LYM, MON, RBC, PLT, and PCT counts compared to those fed the other test diets (p < 0.05). Conversely, the control fish had a significantly higher BAS and HGB content in comparison with other FPH diet groups (p < 0.05).

3.7. Plasma Biochemical Parameters

Table 8 demonstrates the Pabda blood biochemical parameters among the various FPH diet treatments. In this study, the blood glucose and total protein were significantly elevated with the increase in FPH supplementation in the Pabda diet (p < 0.05). The mean values of creatinine, bilirubin, serum glutamic pyruvic transaminase (SGPT), urea, serum glutamic oxaloacetic transaminase (SGOT), alkaline phosphatase, cholesterol, and globulin were significantly different among the treatments (p < 0.05), although no specific trend was investigated. However, the albumin level in plasma did not show any remarkable variances among the FPH-treated diets (p > 0.05).

3.8. Histopathology of Mid Gut and Liver

According to the distal intestine histomorphological observation, the mid gut of fish fed 0, 0.5, 1, and 2% FPH diets displayed alterations of the lamina propria, lamina epithelial mucosae, tunica muscularis, stratum compactum, villus structure as well as goblet cell arrangements (Figure 1). The 2%-FPH diet-fed fish were found to have a well-anchored epithelial wall with well-arranged goblet cells, long villus structures, stratum compactum, and tunica muscularis when compared with those fed with other treatment diets. Moreover, 0.5%- and 1%-FPH-treated fish guts showed some histological development compared to those fed the control diet, although lamina epithelial mucosa, tunica muscularis, and numerous goblet cells were often distributed among all the fish groups.
Figure 2 depicts the morphological changes in the Pabda liver fed various FPH diets, including the nucleus, vacuole, erythrocyte, and sinusoid. The results revealed that the liver health of fish was significantly improved with the increase in FPH levels in test diets. Increasing the levels of FPH up to 2% in diets showed an increase in nuclei numbers and decreased the vacuolar cytoplasm as well. However, many vacuoles and disorders of the liver cell were observed in the fish fed the control diet rather than other FPH diets.

3.9. LD50 of A. hydrophila

The mean lethal dose (LD50) estimated in Ompok pabda, according to Reed and Muench [35], was 2.3 × 10⁷ CFU/mL.

Challenge Study against A. hydrophila

Fish from all the treatments, including the positive control, were injected with 0.1 mL of a bacterial suspension at 2.3 × 10⁷ CFU/mL. Fishes injected with 0.1 mL of phosphate-buffered saline (PBS) served as a negative control. The highest cumulative percent mortality (CPM) was shown in basal-diet-fed fish (66.67 ± 3.33%) compared to other treatments (Figure 3). Fish feed mixed with 2% FPH showed a lower level of cumulative percent mortality (16.67 ± 3.80%) followed by 1% FPH (20.00 ± 3.55%) and 0.5% FPH (33.33 ± 4.70%).

3.10. Economic Efficiency

As illustrated in Table 9, graded dietary supplementations of protein hydrolysate resulted in improved economics by significantly increasing the total yield and farm revenue as expressed per area unit (m2), while they contributed to reducing farm feed costs as expressed per unit of produced biomass (kg). As a result, the margin per rearing area (m2) was four times higher at 1% dietary supplementation of a protein hydrolysate, and the ROI was almost five times higher at 2% supplementation.

4. Discussion

Fish protein hydrolysate is one of the most promising feed ingredients in the aquaculture business sector due to its great nutritional profile, its status as a bioactive peptide, and its free amino acids. However, the identification of the optimum levels of FPH in diets is a critical issue that promotes the growth performance and health of fish. Therefore, this study examined the physical, biochemical, and bacteriological properties of FPH diets, intestinal microbiota, hematological and serum biochemical indices, liver and gut histopathology, and the disease resistance of O. pabda, aiming to provide more reliable data to identify the suitable FPH levels for practical application in the field of aquaculture.
The measurement of the physical properties of a diet is one of the prerequisites required to develop and commercialize any aqua-feed. Khater et al. [37] stated that feed pellets with good physiological characteristics reduce dust production during transportation, handling, and pneumatic conveyance. The present results revealed that except PDI, other physical parameters of feeds were not influenced by the various levels of FPH. These outcomes might be due to the identical pellet sizes. However, the significantly lowest PDI in the 2% diet indicated that this FPH level improves the binding capacity of the diet and minimizes the dust and debris production during transportation. Previous reports noted that the feed expansion ratio, bulk density, and water stability tended to increase with increasing feed diameter [31,37,38,39], whereas PDI and floatability had an opposite relationship [31,37]. Additionally, fish preferred the 1 and 2% FPH diets as compared to the 0 and 0.5% diets due to their greater palatability. This result specified that the feed palatability was highly affected by the dietary FPH inclusion levels in diets. Similar outcomes were found by many previous authors [40,41,42]. Small peptides and free amino acids in FPH make the feed more palatable and acceptable.
Successful aquaculture production greatly relies on the hydrological variables of water. In this research, water quality indices, including water pressure and DO content, significantly differed among the test groups but remained in the fishes’ comfort zone. However, other hydrological parameters were analogous among all treatments over the study period. As this experiment took place in the same pond, water variables did not vary to a great extent. In addition, the water quality standards recorded in this study met the optimum requirements for Pabda aquaculture [43,44,45,46].
From the current research, it was shown that the fish growth and feed efficiency indices were greatly affected by different levels of FPH. The results proved that increasing the levels of FPH from 0 to 2% in diets significantly enhanced the final weight, percent weight gain, SGR, total biomass, and condition factor and also improved the FCR, FCE, and PER values. Based on these parameters, it is summarized that the fish fed diets containing 2% FPH are suited better for outstanding growth and feed utilization. These results are in correspondence with many previous findings [5,17,19,20,47,48,49,50,51,52,53]. As a result of protein hydrolysis, the large-sized polypeptide chain breaks down into smaller peptides and free amino acids that are readily digested and absorbed by fish, leading to an improvement in fish growth and feed intake. Many studies have suggested that the presence of biologically active peptides appears to increase the functional properties of FPH [20,54,55]. Chotikachinda et al. [40] also reported that protein hydrolysis produces peptides with small molecular weights that can serve as attractants for fish. Furthermore, the highest survival rate was recorded in 1%- and 2%-FPH-fed fish compared to other FPH diets in this study. Numerous scientists have claimed that FPH supplementation in diets also strengthens fishes’ defensive mechanisms [5,19,52]. These could be the possible reasons why the survival of 1%- and 2%-FPH fed-fish was boosted. In general, HSI denotes fat and glycogen deposition in the liver [32], whilst VSI reflects the meat content of fish [33]. This is why the highest HSI and the lowest VSI in a 2% FPH diet indicate those fish livers and bodies contained greater fat and meat content, respectively. Contrary to our findings, numerous studies found no discernible differences in these parameters when fish were fed various FPH proportions [52,56,57]. The IPF was significantly higher in the control fish even though no evident difference was identified in the IPF of 1% and 2% diets, showing that those fish had more fat deposited in their body than those fed a 0.5% FPH diet.
Fish tissue’s biochemical composition showed remarkable variation when the fish were fed with graded levels of FPH, except for some cases. The present outcomes also revealed that the fish muscle contained richer amounts of protein than the intestine and liver, which corroborate with the results obtained by previous researchers [33,58,59]. Upon reaching maturity, the protein is mobilized to the muscle from the liver and intestine. Therefore, the protein deposition in the muscle becomes higher as compared to other tissues. Additionally, the protein percentage of each tissue followed a rising trend with increasing FPH levels and reached its highest levels at up to 2%. The lipid was deposited more in the liver, while muscle had a comparatively lower lipid level. Abdul Kari et al. [33] reported a similar result in African catfish. Wee and Tacon [60] stated that muscle with higher protein and lower fat is considered a food of excellent quality. Overall, the results indicated that graded FPH supplementation levels might have significant positive impacts on increasing and decreasing protein and lipid levels.
The bacteriological outcomes of this report demonstrated that FPH had a strong positive impact on raising the bacterial population in fish diets and guts. The dietary incorporation of FPH at levels from 0 to 2% increased the total bacterial counts in diets. These findings are in agreement with those obtained by Zulhisyam et al. [31] and Nandi et al. [32], who found similar results when fish feeds were formulated with microbial fermentations of plant-based ingredients. A similar increase in FPH in diets is also associated with an increase in fish guts’ total bacteria. Ebrahimnezhadarabi et al. [61] reported parallel results while using canola protein hydrolysate at varying percentages in Beluga, Huso huso diets. Correspondingly, the dietary administration of fermented plant protein at approximately 50% significantly improved gut microbiota in African catfish [33,62] and Stinging catfish [32]. Kotzamanis et al. [63] documented that FPH acts as a culture media for bacterial proliferation, and, therefore, it influences the bacterial load. A higher bacterial load in a 2%-FPH-fed fish gut might imply the improved growth, intestinal health, nutrient digestion, and disease resistance of fish against pathogenic bacteria.
This study’s findings demonstrated that dietary FPH supplementation levels had a considerable impact on red blood cell (RBC) but little impact on white blood cell (WBC) counts. Ebrahimnezhadarabi et al. [61] cited that incorporating different amounts of canola protein hydrolysate in fish diets contributed to the increase and decrease in RBC and WBC numbers, respectively. Abdul Kari et al. [33] stated that WBCs and RBCs are two major components of the blood, and their increased levels are associated with an improved health condition of fish. Additionally, higher neutrophil, lymphocyte, and monocyte levels in 2% FPH fish showed improved immune systems. Hemoglobin (HGB), mean corpuscular hemoglobin concentration (MCHC), and platelet distribution width (PDW) were greatly influenced by different FPH levels. These outcomes are corroborated by the study of Abdul Kari et al. [33], Nandi et al. [32], and Zakaria et al. [64]. Acar and Türker [65] also found similar alterations in HGB and MCHC values when peanut meal diets were used in rainbow trout aquaculture. Various levels of FPH have been shown to affect hematocrit (HCT) levels. Ribeiro et al. [66] published results of a similar effect. Conversely, when fish were fed tuna hydrolysate in diets at different percentages, this had no effect on hemoglobin and hematocrit levels [57]. The mean corpuscular volume (MCV) and mean corpuscular hemoglobin (MCH) concentrations in the current study were unaffected by different FPH supplementation dosages. Arapaima gigas fry fed with various FPH-treated diets showed identical results [66]. Additionally, the procalcitonin (PCT) content significantly differed among tested fish. However, Abdul Kari et al. [33] and Nandi et al. [32] reported opposite results. In general, the overall variation in the blood hematological parameters of this catfish species reflects the changes in physiological and health conditions.
This study showed that increasing the FPH levels in diets resulted in a considerable rise in blood sugar and total protein. Recent studies also reported a similar increasing trend of glucose when the fish fed with fermented soy pulp [33] and fermented water spinach meal-based diets [32]. High blood glucose indicates environmental stressors in fish, while high content of total protein denotes a superior innate immune system [67]. When the fish are properly nourished, their plasma total protein levels tend to be more consistent [68]. Moreover, the creatinine, urea, and cholesterol levels in plasma varied widely among the treatments, although no obvious trend was followed. Nandi et al. [32] found corresponding results in Stinging catfish. In contrast, Chaklader et al. [18,52] observed that varying degrees of tuna hydrolysate had no effects on these parameters. In parallel to our study, the fish fed the control diet had lower bilirubin in plasma [18,52]. Bilirubin is an important biomarker that reflects kidney disorders. That is why the lowest bilirubin in 2% FPH fish indicates better kidney health. Serum glutamic pyruvic transaminase, serum glutamic oxaloacetic transaminase, alkaline phosphatase, and globulin content are also indicators of health, and their remarkable variations in this study also indicate significant alterations in the health state of fish.
The liver and intestine are two important accessory body organs involved in nutrient digestion and absorption [
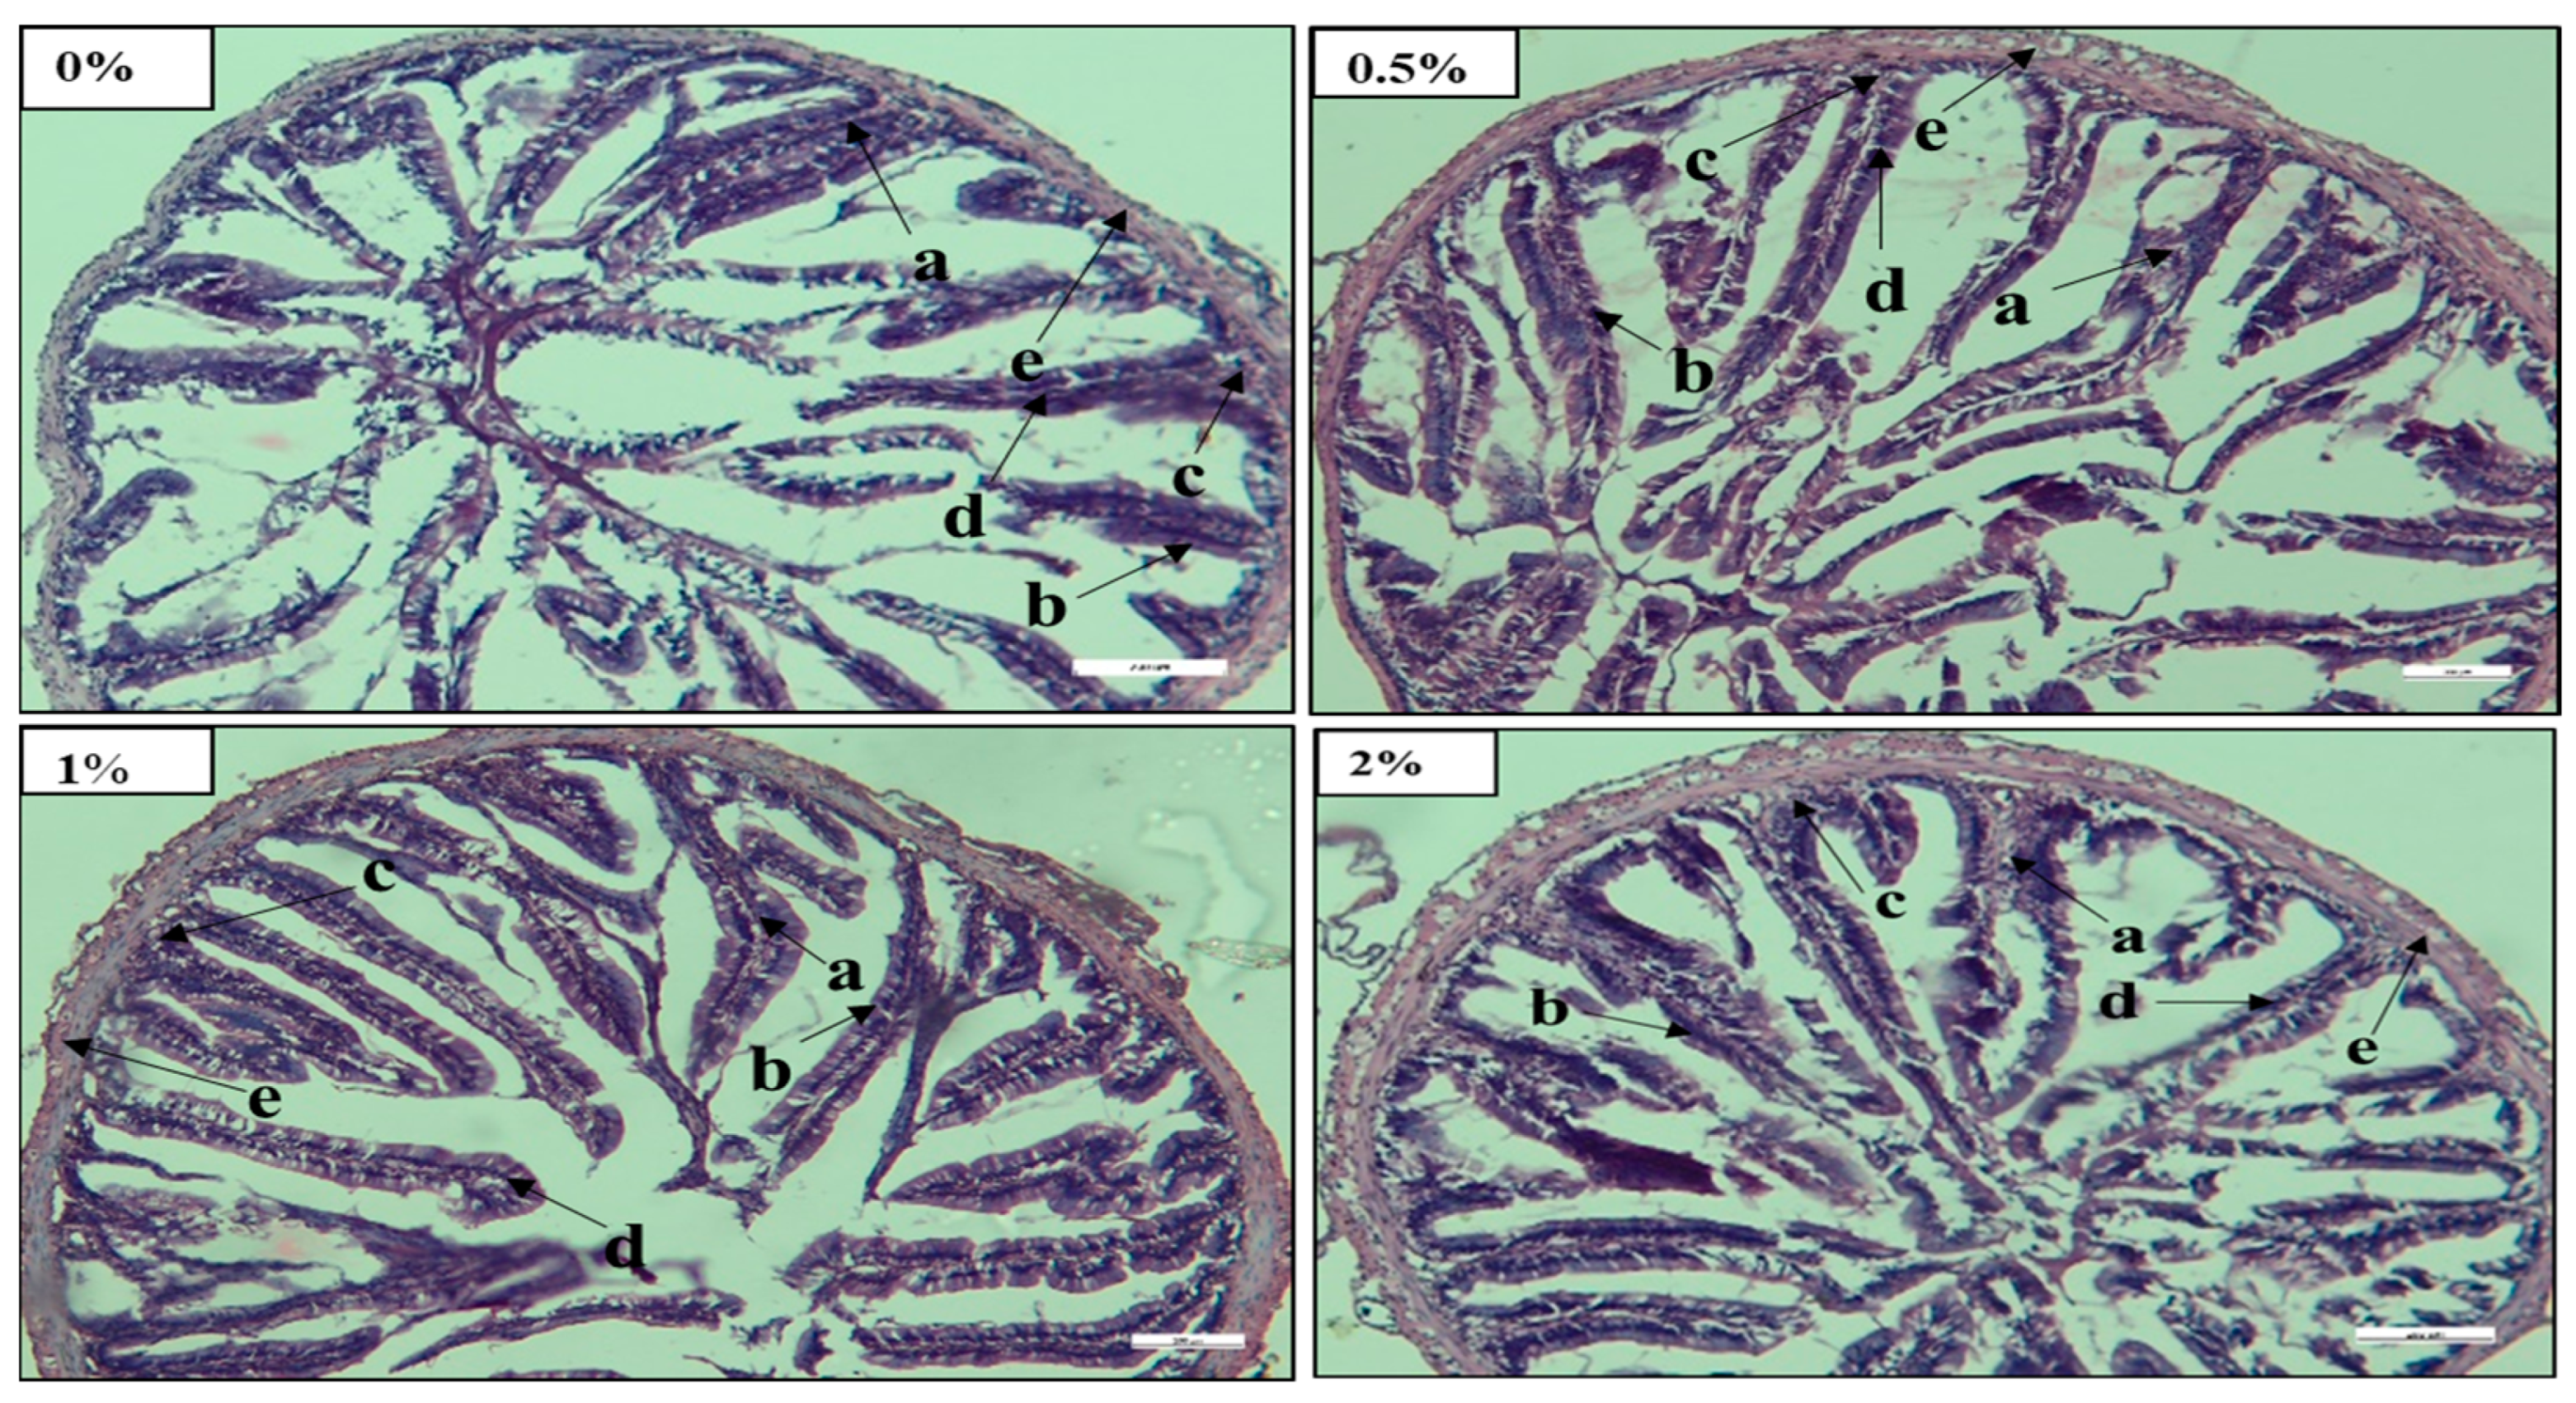
69]. In this study, the mid intestine of fish fed with 2% FPH had a well-anchored epithelial wall with well-arranged goblet cells, a large villi structure, and tunica muscularis compared to those fed other FPH diets (Figure 1). This result indicated that fish fed a 2% FPH diet showed better nutrient absorption capacity and improved gut health compared to all other fish groups. Similar outcomes were investigated when various levels of FPH were incorporated into fish diets [5,17,52,70]. Siddik et al. [17] noted that the inclusion of up to 75% poultry by-product meals in diets as an alternative to FM greatly increased intestinal microvilli density. Another study discovered that when gilthead sea bream were fed protein hydrolysate or autolyzed yeast instead of FM, they had considerably more goblet cells in their gut [49]. Similar histological changes were demonstrated in the gut of striped catfish [58] and female Stinging catfish [32].
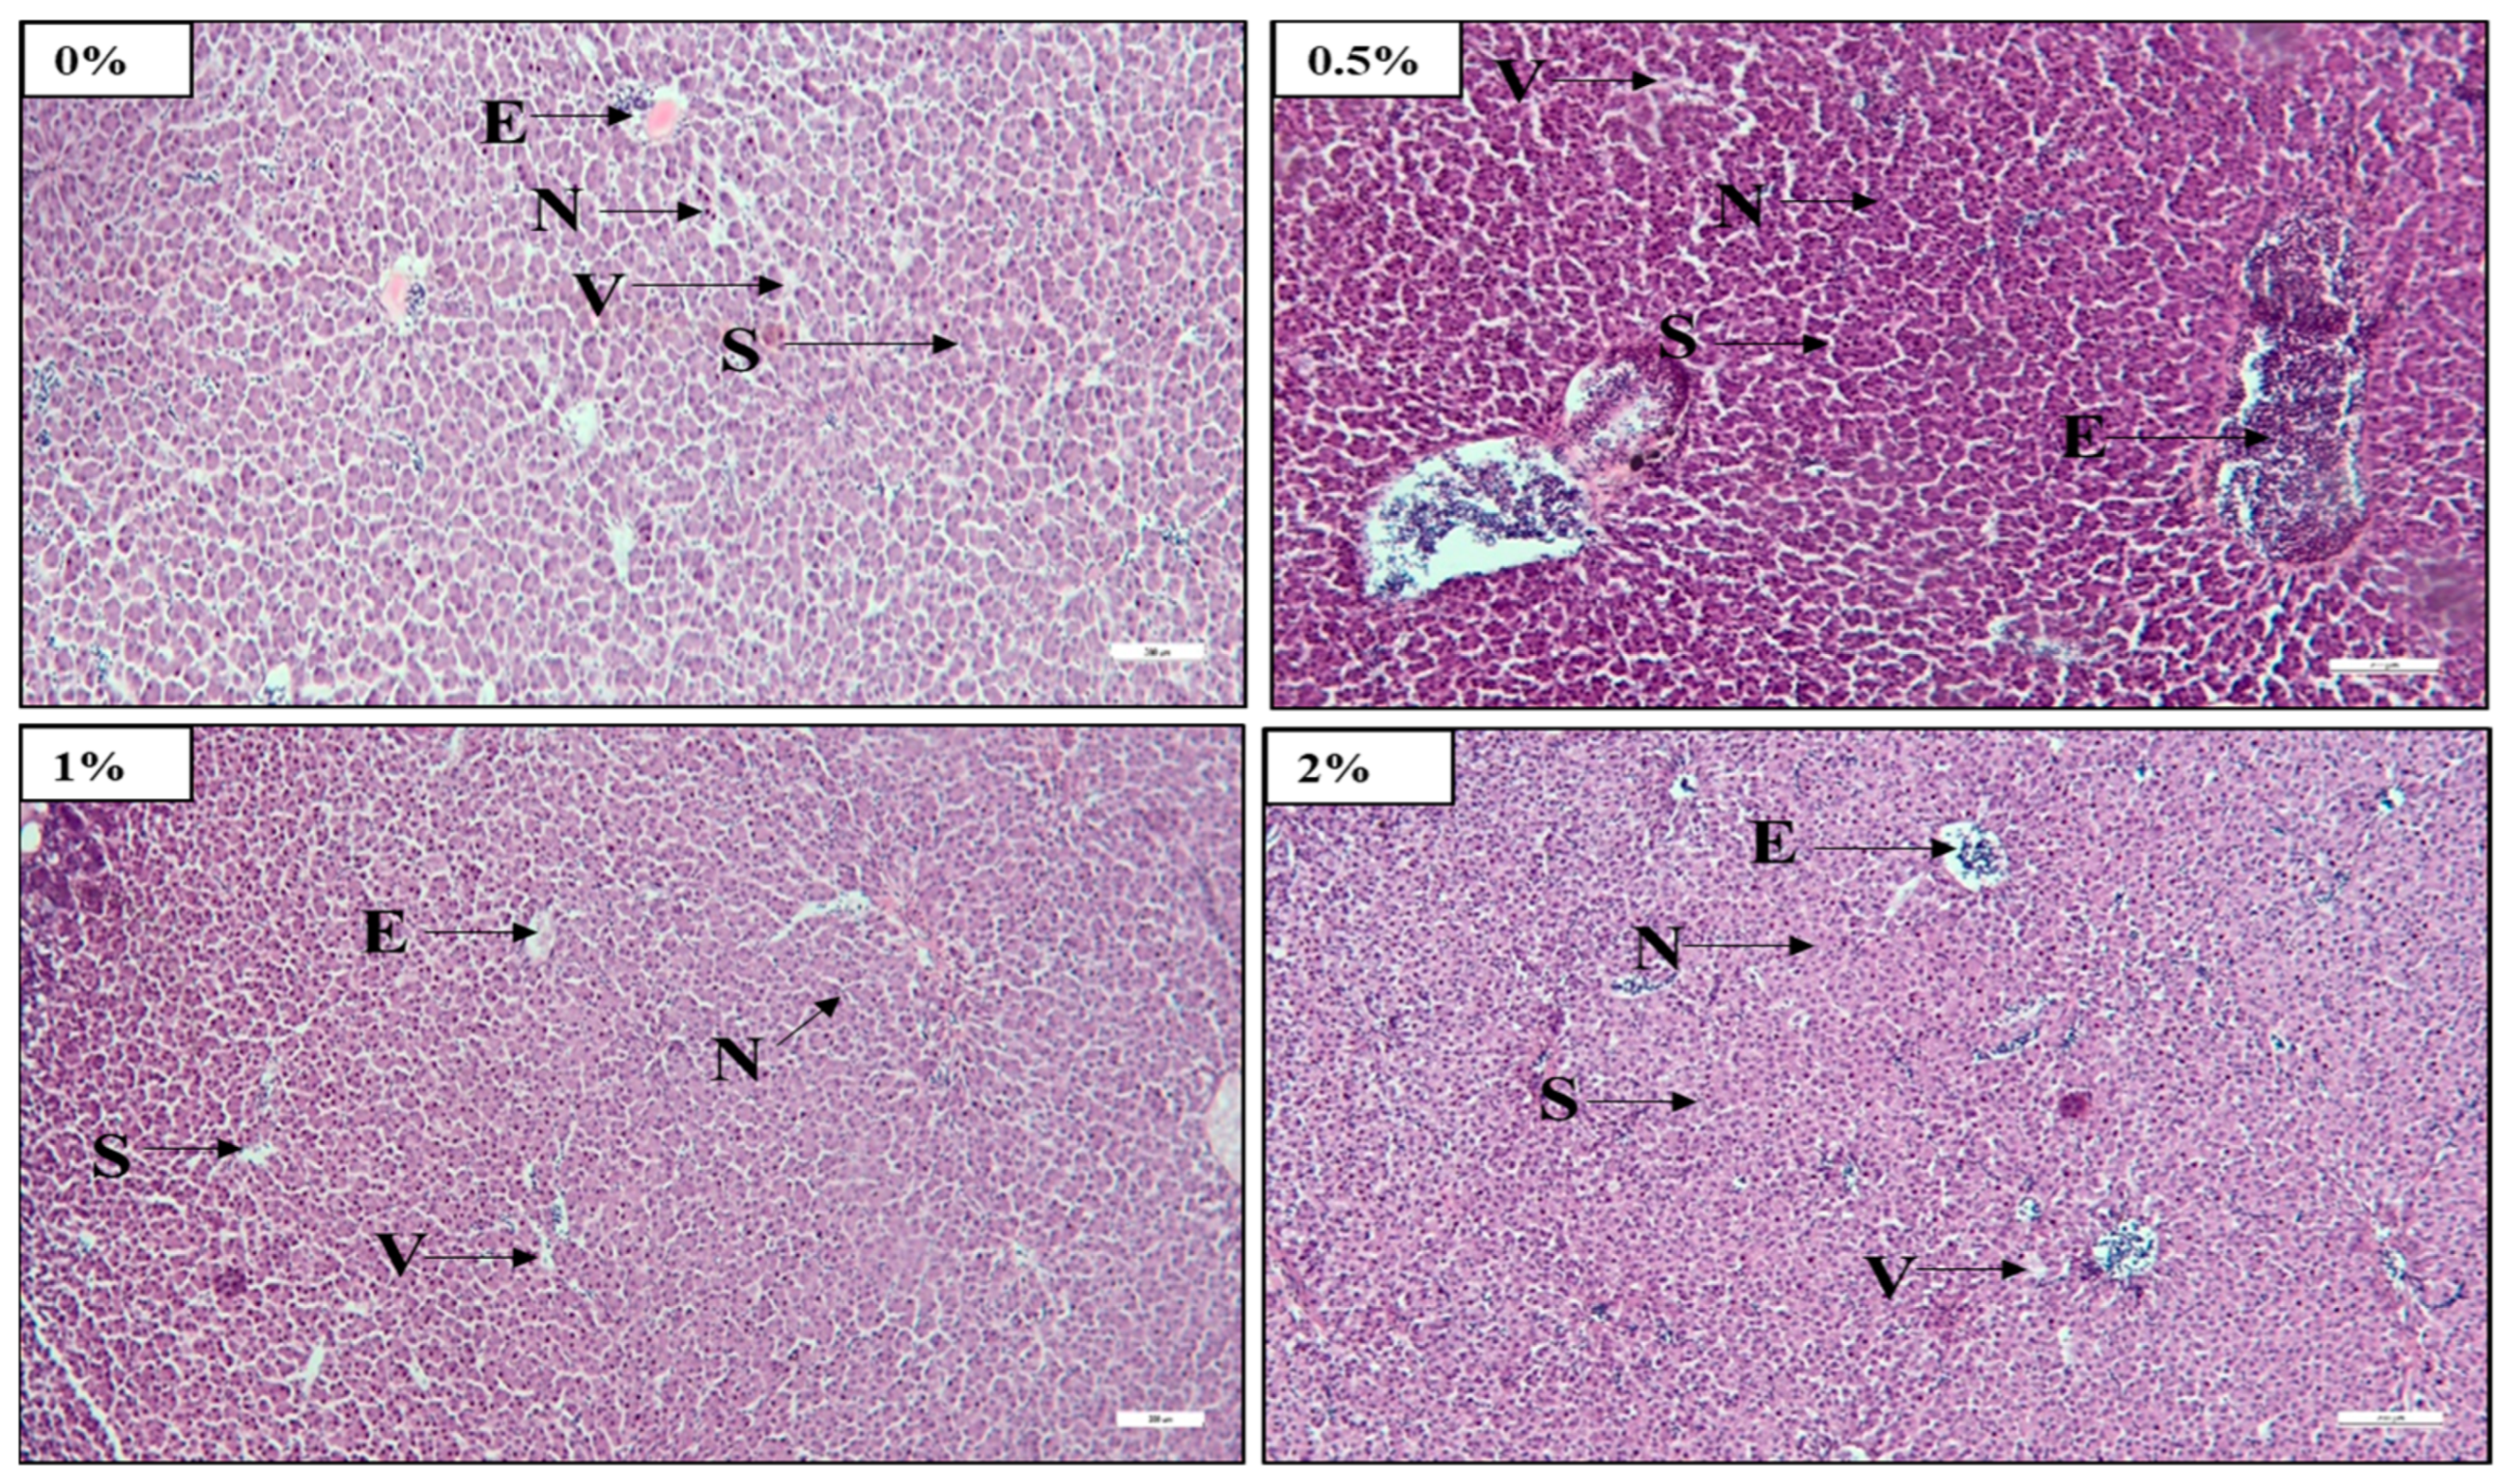
The liver is an excellent indicator of a fish’s nutritional status [71]. The light microscopic observation of histological slides showed that raising the FPH levels in test diets resulted in a notable increase in nuclei and erythrocyte numbers and decreased vacuolar cytoplasm in the liver. This result specified that 2%-FPH-fed fish groups had improved liver health compared to other treatment fish. When FM was substituted with fermented soy pulp at levels of 50% in the diet of African catfish, a similar observation was recorded by Abdul Kari et al. [33]. Pham et al. [72] similarly observed a commensurate reduction in the vacuole numbers when using tuna hydrolysate at 60 g/kg in a poultry by-product meal diet. However, another finding has shown that a very high amount of FPH increased liver tissue necrosis, fat deposition, and vacuolar cytoplasm [57].
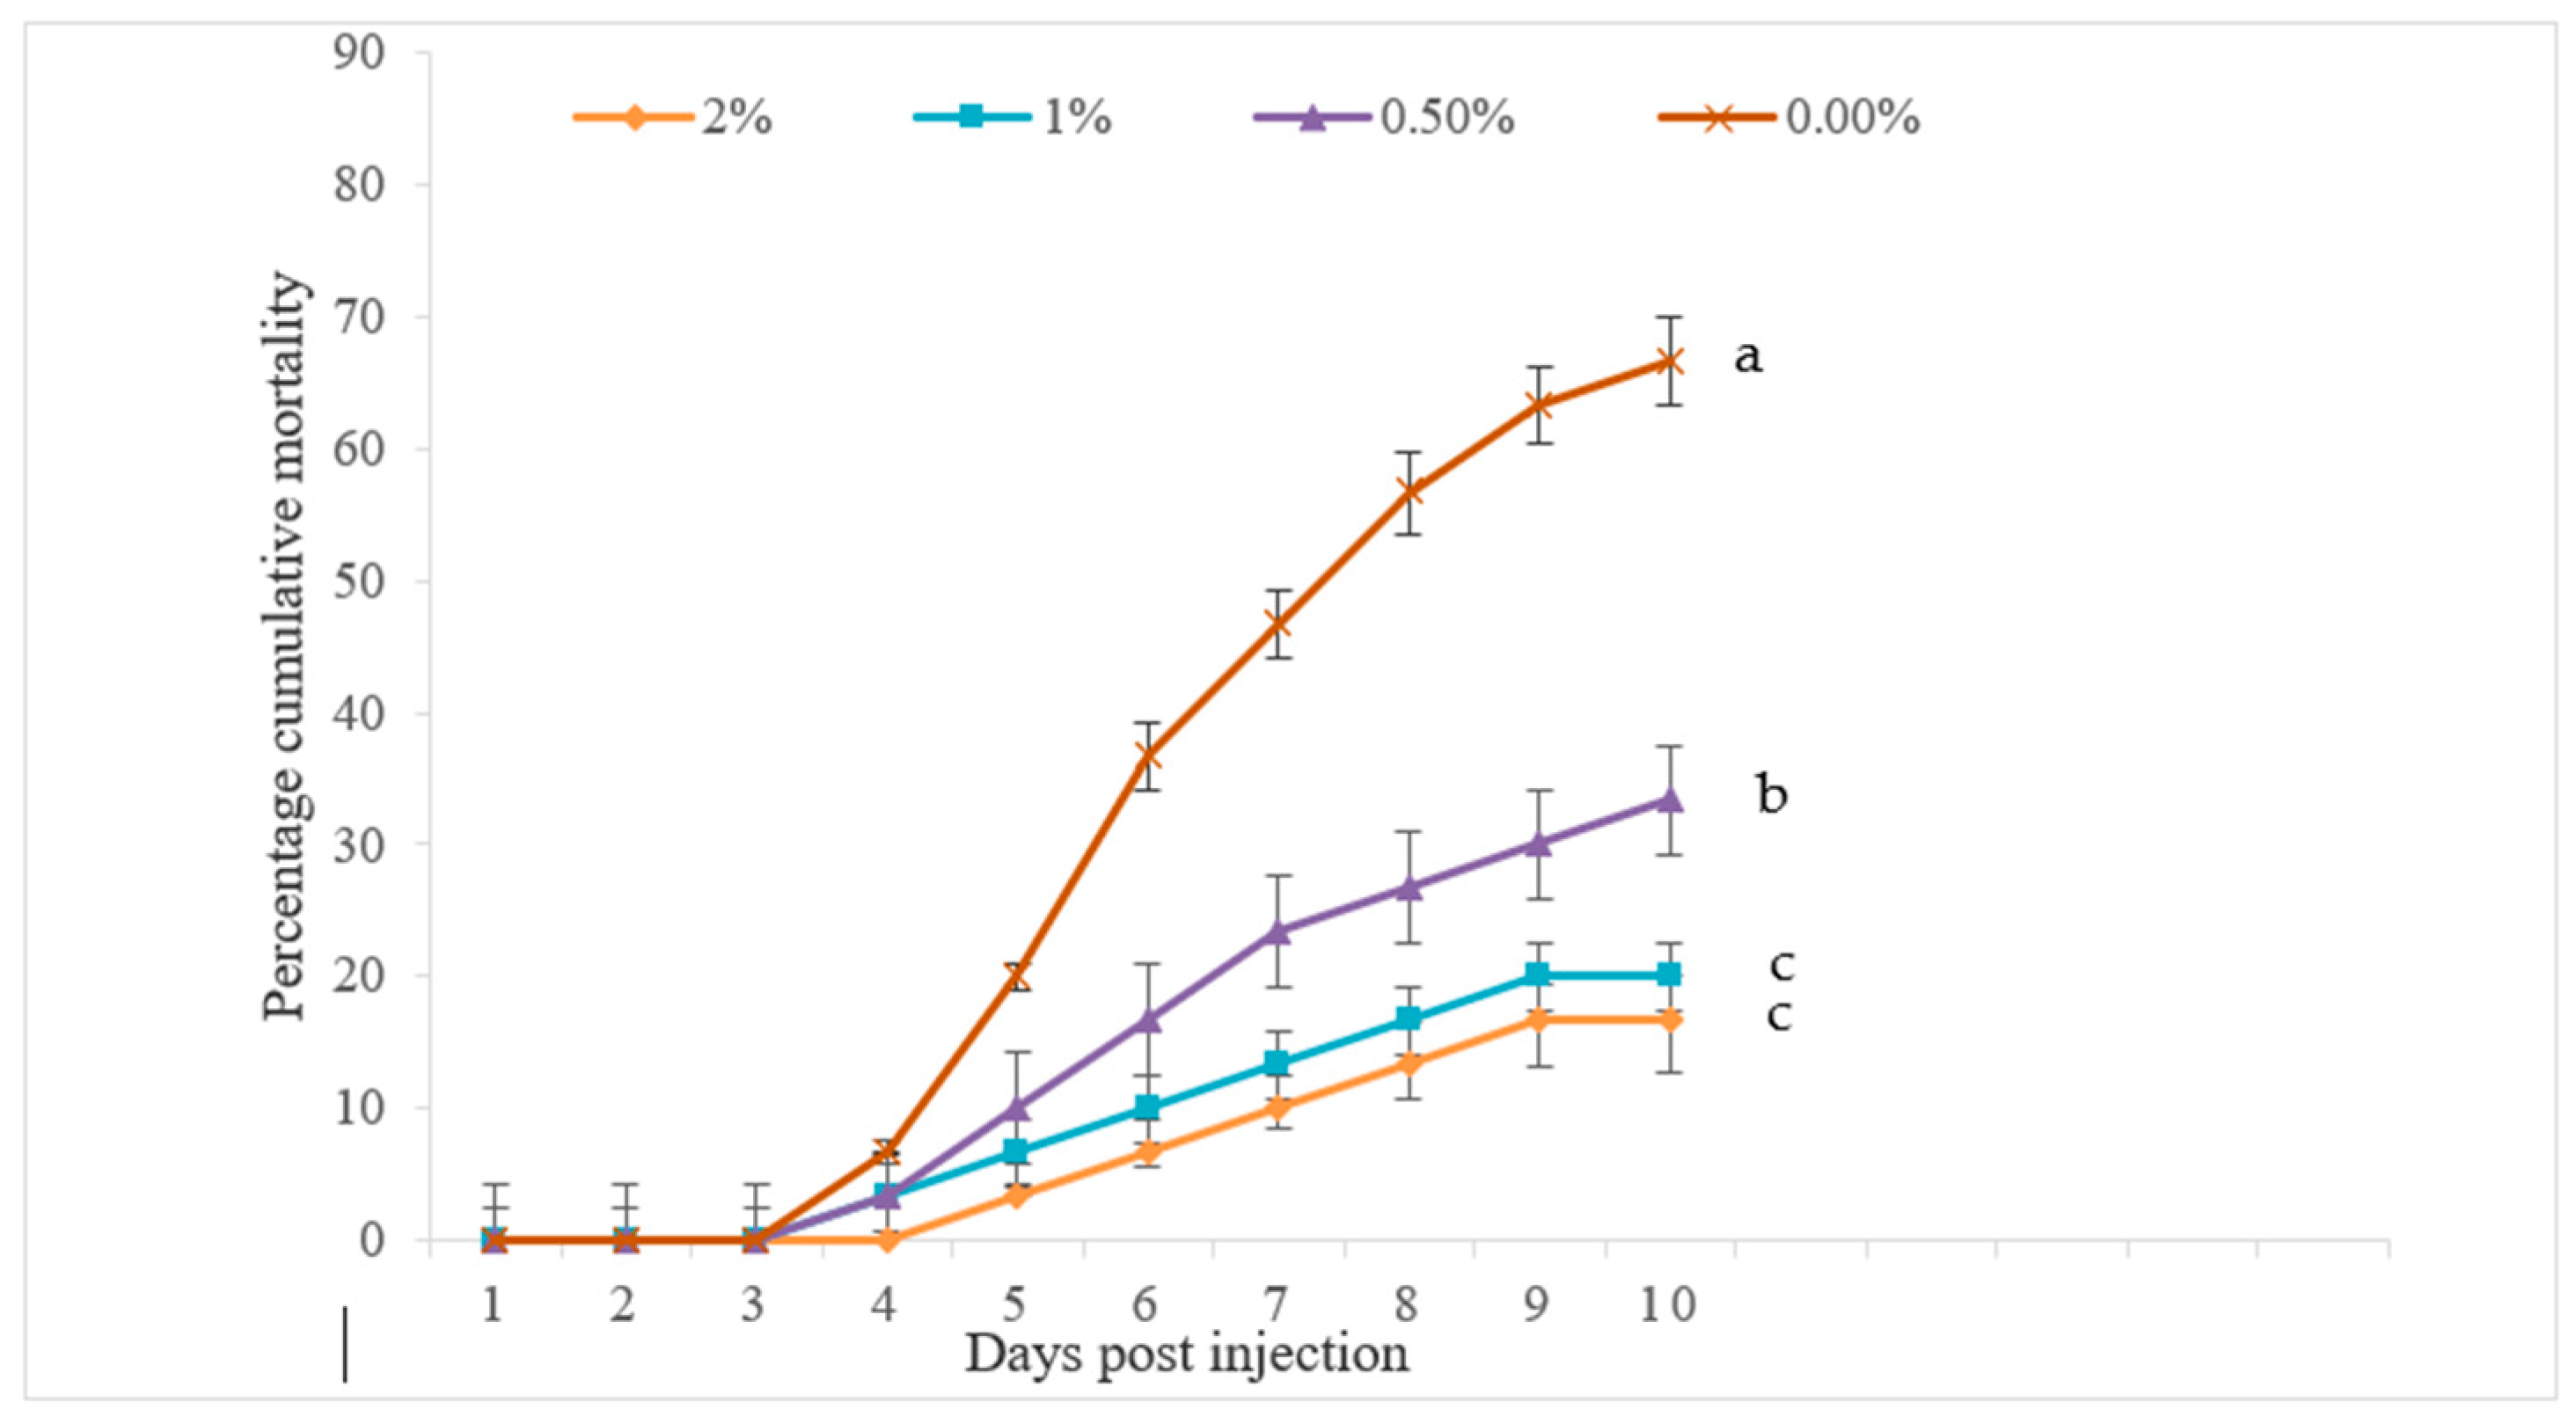
The challenge study discovered that the cumulative percent mortality (CPM) of Pabda against A. hydrophila was significantly decreased as dietary FPH levels increased, with a 2% FPH diet resulting in the lowest CPM value (Figure 3). Thus, the basal-diet-fed fish experienced significantly higher CPMs than other treatments. These findings indicated that the dietary supplementation of fish protein hydrolysate could enhance the specific disease resistance of fish by improving defense mechanisms. Siddik et al. [5] reported similar observations with the disease resistance of Lates calcarifer following a challenge trial with S. iniae, which considerably increased in 10% tuna-hydrolysate-fed fish in comparison with other tested fish. Likewise, multiple previous studies observed that the supplementation of FPH in diets at various percentages increased the specific disease resistance of fish, including red sea bream, Pagrus major against E. tarda [19,56] and barramundi juveniles, Lates calcarifer against Vibrio harveyi [17].
This study demonstrated the commercial farm benefit in supplementing Pabda feeds with protein hydrolysate. By enhancing the fish growth rate and feed assimilation, farm economic data are widely improved at higher levels than those observed for zootechnical data. For instance, while fish SGR was maximally improved by 21% and FCR reduced by 35%, the farm raw margin was folded by 2.13 and ROI by 2.09 with 2% dietary supplementation of protein hydrolysate.

5. Conclusions

In summary, the dietary supplementation of fish protein hydrolysate in diets could significantly increase the growth performance, health status, intestinal microbiota, and disease resistance of O. pabda in captivity and its economics. Based on these findings, using FPH at approximately 2% in aqua-feed industries could be suggested for the better growth, health status, disease resistance, and dietary cost-effectiveness of Pabda catfish and possibly other freshwater fish species.

Author Contributions

Writing—original draft, writing—review, A.Y.S.; writing—review and editing, S.K.N.; writing—review and editing, funding, Z.A.K., A.B.T. and L.S.W.; formal analysis, writing—review and editing, K.W.G. and A.A.M.; writing—review, funding and editing, P.S. and M.H.; project administration, conceptualization, writing—review and editing, funding, M.A.K. and G.T.-I. All authors have read and agreed to the published version of the manuscript.

Funding

The authors would like to thank the Symrise Aqua Feed research grant of France for the financial support along with Adyanagro-Bangladesh for the feed preparation logistic facilities used to conduct this research under the Aquaculture Department at Sylhet Agricultural University, Bangladesh. Research was supported in part by funds provided by USDA-NIFA Sustainable Agriculture Systems, Grant No. 2019-69012-29905. Title of Project: Empowering US Broiler Production for Transformation and Sustainability USDA-NIFA (Sustainable Agriculture Systems): No. 2019-69012-29905.

Institutional Review Board Statement

This study has been approved by the Animal Ethics Committee of Faculty of Agro-Based Industry, Universiti Malaysia Kelantan (UMK/FIAT/ACUE/UG/034/2021). All experiment protocol was conducted per the committee’s comments and approval.

Informed Consent Statement

Not applicable.

Data Availability Statement

The data that support the findings of this study are available on request from the corresponding author.

Acknowledgments

This research article is a collaboration between Universiti Malaysia Kelantan, Sylhet Agricultural University, INTI International University, Symrise Aqua Feed of Taste, Nutrition & Health Segment of the Symrise AG group, France and Mindanao State University-Tawi-Tawi College of Technology, Oceanography, Sanga-Sanga, Bongao, Tawi-Tawi 7500 Philippines and University of Arkansas. This collaboration is a part of the planning by Advanced Livestock and Aquaculture Research Group—ALAReG under Faculty of Agro-Based Industry, Universiti Malaysia Kelantan, Jeli Campus.

Conflicts of Interest

The authors declare no conflict of interest.

References

  1. Alam, S.M.D.; Karim, M.H.; Chakrabortty, A.; Amin, R.; Hasan, S. Investigation of nutritional status of the butter catfish Ompok bimaculatus: An important freshwater fish species in the diet of common Bangladeshi people. Int. J. Nutr. Food Sci. 2016, 5, 62–67. [Google Scholar] [CrossRef]
  2. Bhattacharjee, P.; Pal, P. Study on length weight relationship and feeding habits of a threaten fish Ompok pabda from Tripura, India. J. Entomol. Zool. Stud. 2020, 8, 1971–1975. [Google Scholar] [CrossRef]
  3. Dawood, M.A.O.; Habotta, O.A.E.; Elsabagh, M.; Azra, M.N.; Van Doan, H.; Kari, Z.A.; Sewilam, H. Fruit processing by-products in the aquafeed industry: A feasible strategy for aquaculture sustainability. Rev. Aquac. 2022, 14, 1945–1965. [Google Scholar] [CrossRef]
  4. Maulu, S.; Langi, S.; Hasimuna, O.J.; Missinhoun, D.; Munganga, B.P.; Hampuwo, B.M.; Gabriel, N.N.; Elsabagh, M.; Van Doan, H.; Abdul Kari, Z.; et al. Recent advances in the utilization of insects as an ingredient in aquafeeds: A review. Anim. Nutr. 2022, 11, 334–349. [Google Scholar] [CrossRef]
  5. Siddik, M.A.B.; Howieson, J.; Partridge, G.J.; Fotedar, R.; Gholipourkanani, H. Dietary tuna hydrolysate modulates growth performance, immune response, intestinal morphology and resistance to Streptococcus iniae in juvenile barramundi, Lates calcarifer. Sci. Rep. 2018, 8, 15942. [Google Scholar] [CrossRef] [Green Version]
  6. Yang, P.; Ke, H.; Hong, P.; Zeng, S.; Cao, W. Antioxidant activity of bigeye tuna (Thunnus obesus) head protein hydrolysate prepared with Alcalase. Int. J. Food Sci. Technol. 2011, 46, 2460–2466. [Google Scholar] [CrossRef]
  7. Chalamaiah, M.; Dinesh Kumar, B.; Hemalatha, R.; Jyothirmayi, T. Fish protein hydrolysates: Proximate composition, amino acid composition, antioxidant activities and applications: A review. Food Chem. 2012, 135, 3020–3038. [Google Scholar] [CrossRef]
  8. Venugopal, V. Chapter Three—Enzymes from Seafood Processing Waste and Their Applications in Seafood Processing. In Advances in Food and Nutrition Research; Kim, S.-K., Toldrá, F., Eds.; Academic Press: Cambridge, MA, USA, 2016; Volume 78, pp. 47–69. [Google Scholar]
  9. Zamora-Sillero, J.; Ramos, P.; Monserrat, J.M.; Prentice, C. Evaluation of the Antioxidant Activity In Vitro and in Hippocampal HT-22 Cells System of Protein Hydrolysates of Common Carp (Cyprinus carpio) By-Product. J. Aquat. Food Prod. Technol. 2018, 27, 21–34. [Google Scholar] [CrossRef]
  10. Abraha, B.; Mahmmud, A.; Samuel, M. Production of fish protein hydrolysate from silver catfish (Arius thalassinus). MOJ Food Process. Technol. 2017, 5, 328–335. [Google Scholar] [CrossRef] [Green Version]
  11. Irianto, H.; Fawzya, Y.N. Fish protein hydrolysates: Their potential application for prevention of stunting. Med. Res. Innov. 2018, 2, 1–2. [Google Scholar] [CrossRef]
  12. Saidi, S.; Deratani, A.; Belleville, M.-P.; Amar, R.B. Production and fractionation of tuna by-product protein hydrolysate by ultrafiltration and nanofiltration: Impact on interesting peptides fractions and nutritional properties. Food Res. Int. 2014, 65, 453–461. [Google Scholar] [CrossRef]
  13. Ospina-Salazar, G.H.; Ríos-Durán, M.G.; Toledo-Cuevas, E.M.; Martínez-Palacios, C.A. The effects of fish hydrolysate and soy protein isolate on the growth performance, body composition and digestibility of juvenile pike silverside, Chirostoma estor. Anim. Feed Sci. Technol. 2016, 220, 168–179. [Google Scholar] [CrossRef]
  14. Kang, H.K.; Lee, H.H.; Seo, C.H.; Park, Y. Antimicrobial and Immunomodulatory Properties and Applications of Marine-Derived Proteins and Peptides. Mar. Drugs 2019, 17, 350. [Google Scholar] [CrossRef] [PubMed] [Green Version]
  15. Yaghoubzadeh, Z.; Peyravii Ghadikolaii, F.; Kaboosi, H.; Safari, R.; Fattahi, E. Antioxidant Activity and Anticancer Effect of Bioactive Peptides from Rainbow Trout (Oncorhynchus mykiss) Skin Hydrolysate. Int. J. Pept. Res. Ther. 2020, 26, 625–632. [Google Scholar] [CrossRef]
  16. Zheng, K.; Xu, T.; Qian, C.; Liang, M.; Wang, X. Effect of low molecular weight fish protein hydrolysate on growth performance and IGF-I expression in Japanese flounder (Paralichthys olivaceus) fed high plant protein diets. Aquac. Nutr. 2014, 20, 372–380. [Google Scholar] [CrossRef]
  17. Siddik, M.A.B.; Howieson, J.; Fotedar, R. Beneficial effects of tuna hydrolysate in poultry by-product meal diets on growth, immune response, intestinal health and disease resistance to Vibrio harveyi in juvenile barramundi, Lates calcarifer. Fish Shellfish Immunol. 2019, 89, 61–70. [Google Scholar] [CrossRef]
  18. Chaklader, M.R.; Fotedar, R.; Howieson, J.; Siddik, M.A.B.; Foysal, M.J. The ameliorative effects of various fish protein hydrolysates in poultry by-product meal based diets on muscle quality, serum biochemistry and immunity in juvenile barramundi, Lates calcarifer. Fish Shellfish Immunol. 2020, 104, 567–578. [Google Scholar] [CrossRef]
  19. Bui, H.T.D.; Khosravi, S.; Fournier, V.; Herault, M.; Lee, K.-J. Growth performance, feed utilization, innate immunity, digestibility and disease resistance of juvenile red seabream (Pagrus major) fed diets supplemented with protein hydrolysates. Aquaculture 2014, 418–419, 11–16. [Google Scholar] [CrossRef]
  20. Ovissipour, M.; Abedian Kenari, A.; Nazari, R.; Motamedzadegan, A.; Rasco, B. Tuna viscera protein hydrolysate: Nutritive and disease resistance properties for Persian sturgeon (Acipenser persicus L.) larvae. Aquac. Res. 2014, 45, 591–601. [Google Scholar] [CrossRef]
  21. Delcroix, J.; Gatesoupe, F.J.; Desbruyères, E.; Huelvan, C.; Le Delliou, H.; Le Gall, M.M.; Quazuguel, P.; Mazurais, D.; Zambonino-Infante, J.L. The effects of dietary marine protein hydrolysates on the development of sea bass larvae, Dicentrarchus labrax, and associated microbiota. Aquac. Nutr. 2015, 21, 98–104. [Google Scholar] [CrossRef] [Green Version]
  22. Aksnes, A.; Hope, B.; Jönsson, E.; Björnsson, B.T.; Albrektsen, S. Size-fractionated fish hydrolysate as feed ingredient for rainbow trout (Oncorhynchus mykiss) fed high plant protein diets. I: Growth, growth regulation and feed utilization. Aquaculture 2006, 261, 305–317. [Google Scholar] [CrossRef]
  23. Masuda, Y.; Jinbo, T.; Imaizumi, H.; Furuita, H.; Matsunari, H.; Murashita, K.; Fujimoto, H.; Nagao, J.; Kawakami, Y. A step forward in development of fish protein hydrolysate-based diets for larvae of Japanese eel Anguilla japonica. Fish. Sci. 2013, 79, 681–688. [Google Scholar] [CrossRef]
  24. Cahu, C.L.; Zambonino Infante, J.L.; Quazuguel, P.; Le Gall, M.M. Protein hydrolysate vs. fish meal in compound diets for 10-day old sea bass Dicentrarchus labrax larvae. Aquaculture 1999, 171, 109–119. [Google Scholar] [CrossRef]
  25. Kolkovski, S.; Tandler, A. The use of squid protein hydrolysate as a protein source in microdiets for gilthead seabream Sparus aurata larvae. Aquac. Nutr. 2000, 6, 11–16. [Google Scholar] [CrossRef]
  26. FitzGerald, R.J.; O’Cuinn, G. Enzymatic debittering of food protein hydrolysates. Biotechnol. Adv. 2006, 24, 234–237. [Google Scholar] [CrossRef] [PubMed]
  27. Fu, Y.; Chen, J.; Bak, K.H.; Lametsch, R. Valorisation of protein hydrolysates from animal by-products: Perspectives on bitter taste and debittering methods: A review. Int. J. Food Sci. Technol. 2019, 54, 978–986. [Google Scholar] [CrossRef]
  28. Idowu, A.T.; Benjakul, S. Bitterness of fish protein hydrolysate and its debittering prospects. J. Food Biochem. 2019, 43, e12978. [Google Scholar] [CrossRef]
  29. Aspevik, T.; Totland, C.; Lea, P.; Oterhals, Å. Sensory and surface-active properties of protein hydrolysates based on Atlantic salmon (Salmo salar) by-products. Process Biochem. 2016, 51, 1006–1014. [Google Scholar] [CrossRef]
  30. AOAC, M. Association of official analytical chemists. Official methods of analysis. AOAC Off. Methods Anal. 1990, 1, 69–90. [Google Scholar]
  31. Zulhisyam, A.K.; Kabir, M.A.; Munir, M.B.; Wei, L.S. Using of fermented soy pulp as an edible coating material on fish feed pellet in African catfish (Clarias gariepinus) production. Aquac. Aquar. Conserv. Legis. 2020, 13, 296–308. [Google Scholar]
  32. Nandi, S.K.; Suma, A.Y.; Rashid, A.; Kabir, M.A.; Goh, K.W.; Abdul Kari, Z.; Van Doan, H.; Zakaria, N.N.A.; Khoo, M.I.; Seong Wei, L. The Potential of Fermented Water Spinach Meal as a Fish Meal Replacement and the Impacts on Growth Performance, Reproduction, Blood Biochemistry and Gut Morphology of Female Stinging Catfish (Heteropneustes fossilis). Life 2023, 13, 176. [Google Scholar] [CrossRef] [PubMed]
  33. Abdul Kari, Z.; Kabir, M.A.; Mat, K.; Rusli, N.D.; Razab, M.K.A.A.; Ariff, N.S.N.A.; Edinur, H.A.; Rahim, M.Z.A.; Pati, S.; Dawood, M.A.O.; et al. The possibility of replacing fish meal with fermented soy pulp on the growth performance, blood biochemistry, liver, and intestinal morphology of African catfish (Clarias gariepinus). Aquac. Rep. 2021, 21, 100815. [Google Scholar] [CrossRef]
  34. Rahman, M.; Hossain, A.; Rahman, M.; Nasren, S.; Mamun, M.; Khalil, S.; Alam, M. Molecular identification of Aeromonas hydrophila isolate with sensitivity and resistance to antibiotics for its different strains. Adv. Anim. Vet. Sci. 2021, 9, 2062–2068. [Google Scholar]
  35. Reed, L.J.; Muench, H. A simple method of estimating fifty per cent endpoints. Am. J. Epidemiol. 1938, 27, 493–497. [Google Scholar] [CrossRef]
  36. Rathore, S.S.; Hanumappa, S.M.; Yusufzai, S.I.; Suyani, N.K.; Abdullah-Al-Mamun, M.; Nasren, S.; Sidiq, M.J.; Hanumanthappa, S.K.; Kalyani, R. Dietary Administration of Engineered Nano-selenium and Vitamin C Ameliorates Immune Response, Nutritional Physiology, Oxidative Stress, and Resistance Against Aeromonas hydrophila in Nile Tilapia (Oreochromis niloticus). Biol. Trace Elem. Res. 2022. [Google Scholar] [CrossRef]
  37. Khater, E.-S.G.; Bahnasawy, A.H.; Ali, S.A. Physical and Mechanical Properties of Fish Feed Pellets. J. Food Process. Technol. 2014, 5, 1–6. [Google Scholar]
  38. Saalah, S.; Shapawi, R.; Othman, N.A.; Bono, A. Effect of formula variation in the properties of fish feed pellet. J. Appl. Sci. 2010, 10, 2537–2543. [Google Scholar] [CrossRef] [Green Version]
  39. Syamsu, J.A.; Yusuf, M.; Abdullah, A. Evaluation of physical properties of feedstuffs in supporting the development of feed mill at farmers group scale. J. Adv. Agric. Technol. 2015, 2, 147–150. [Google Scholar] [CrossRef] [Green Version]
  40. Chotikachinda, R.; Tantikitti, C.; Benjakul, S.; Rustad, T.; Kumarnsit, E. Production of protein hydrolysates from skipjack tuna (Katsuwonus pelamis) viscera as feeding attractants for Asian seabass (Lates calcarifer). Aquac. Nutr. 2013, 19, 773–784. [Google Scholar] [CrossRef]
  41. Sanches-Alves, D.R.; Silva, T.C.d.; Rocha, J.; Oliveira, S.R.D.; Señor, A.; Boscolo, W.R. Compelling palatability of protein hydrolysates for Nile tilapia juveniles. Lat. Am. J. Aquat. Res. 2019, 47, 371–376. [Google Scholar] [CrossRef] [Green Version]
  42. Hattori, J.F.D.A.; Alves, D.R.S.; Oliveira, S.R.D.; Almeida, A.A.D.S.; Boscolo, W.R. Attractiveness and palatability of liquid hydrolysates for Dourado (Salminus brasiliensis) fingerlings. Aquac. Res. 2021, 52, 5682–5690. [Google Scholar] [CrossRef]
  43. Bhatnagar, A.; Jana, S.; Garg, S.; Patra, B.; Singh, G.; Barman, U. Water quality management in aquaculture. Course Man. Summer Sch. Dev. Sustain. Aquac. Technol. Fresh Saline Waters CCS Haryana Agric. Hisar 2004, 3, 203–210. [Google Scholar]
  44. Santhosh, B.; Singh, N. Guidelines for water quality management for fish culture in Tripura. ICAR Res. Complex NEH Reg. Tripura Cent. Publ. 2007, 29, 10. [Google Scholar]
  45. Bhatnagar, A.; Singh, G. Culture fisheries in village ponds: A multi-location study in Haryana, India. Agric. Biol. J. N. Am. 2010, 1, 961–968. [Google Scholar] [CrossRef]
  46. Ekubo, A.; Abowei, J. Review of some water quality management principles in culture fisheries. Res. J. Appl. Sci. Eng. Technol. 2011, 3, 1342–1357. [Google Scholar]
  47. Zheng, K.; Liang, M.; Yao, H.; Wang, J.; Chang, Q. Effect of size-fractionated fish protein hydrolysate on growth and feed utilization of turbot (Scophthalmus maximus L.). Aquac. Res. 2013, 44, 895–902. [Google Scholar] [CrossRef]
  48. Xu, H.; Mu, Y.; Zhang, Y.; Li, J.; Liang, M.; Zheng, K.; Wei, Y. Graded levels of fish protein hydrolysate in high plant diets for turbot (Scophthalmus maximus): Effects on growth performance and lipid accumulation. Aquaculture 2016, 454, 140–147. [Google Scholar] [CrossRef]
  49. Fronte, B.; Abramo, F.; Brambilla, F.; De Zoysa, M.; Miragliotta, V. Effect of hydrolysed fish protein and autolysed yeast as alternative nitrogen sources on gilthead sea bream (Sparus aurata) growth performances and gut morphology. Ital. J. Anim. Sci. 2019, 18, 799–808. [Google Scholar] [CrossRef] [Green Version]
  50. Ha, N.; Jesus, G.F.A.; Gonçalves, A.F.N.; de Oliveira, N.S.; Sugai, J.K.; Pessatti, M.L.; Mouriño, J.L.P.; El Hadi Perez Fabregat, T. Sardine (Sardinella spp.) protein hydrolysate as growth promoter in South American catfish (Rhamdia quelen) feeding: Productive performance, digestive enzymes activity, morphometry and intestinal microbiology. Aquaculture 2019, 500, 99–106. [Google Scholar] [CrossRef]
  51. Khieokhajonkhet, A.; Surapon, K. Effects of fish protein hydrolysate on the growth performance, feed and protein utilization of Nile tilapia (Oreochromis niloticus). Int. J. Agric. Technol. 2020, 16, 641–654. [Google Scholar]
  52. Chaklader, M.R.; Howieson, J.; Siddik, M.A.; Foysal, M.J.; Fotedar, R. Supplementation of tuna hydrolysate and insect larvae improves fishmeal replacement efficacy of poultry by-product in Lates calcarifer (Bloch, 1790) juveniles. Sci. Rep. 2021, 11, 4997. [Google Scholar] [CrossRef] [PubMed]
  53. Kwasek, K.; Gonzalez, C.; Wick, M.; Molinari, G.S.; Wojno, M. Fish muscle hydrolysate obtained using largemouth bass Micropterus salmoides digestive enzymes improves largemouth bass performance in its larval stages. PLoS ONE 2022, 16, e0261847. [Google Scholar] [CrossRef] [PubMed]
  54. Harnedy, P.A.; FitzGerald, R.J. Bioactive peptides from marine processing waste and shellfish: A review. J. Funct. Foods 2012, 4, 6–24. [Google Scholar] [CrossRef]
  55. Halim, N.R.A.; Yusof, H.M.; Sarbon, N.M. Functional and bioactive properties of fish protein hydolysates and peptides: A comprehensive review. Trends Food Sci. Technol. 2016, 51, 24–33. [Google Scholar] [CrossRef]
  56. Khosravi, S.; Rahimnejad, S.; Herault, M.; Fournier, V.; Lee, C.-R.; Dio Bui, H.T.; Jeong, J.-B.; Lee, K.-J. Effects of protein hydrolysates supplementation in low fish meal diets on growth performance, innate immunity and disease resistance of red sea bream Pagrus major. Fish Shellfish Immunol. 2015, 45, 858–868. [Google Scholar] [CrossRef]
  57. Siddik, M.A.; Howieson, J.; Ilham, I.; Fotedar, R. Growth, biochemical response and liver health of juvenile barramundi (Lates calcarifer) fed fermented and non-fermented tuna hydrolysate as fishmeal protein replacement ingredients. PeerJ 2018, 6, e4870. [Google Scholar] [CrossRef] [Green Version]
  58. Akter, M.N.; Sutriana, A.; Talpur, A.D.; Hashim, R. Dietary supplementation with mannan oligosaccharide influences growth, digestive enzymes, gut morphology, and microbiota in juvenile striped catfish, Pangasianodon hypophthalmus. Aquac. Int. 2016, 24, 127–144. [Google Scholar] [CrossRef]
  59. Kabir, M.A.; Ghaedi, A.; Talpur, A.D.; Hashim, R. Effect of dietary protein levels on reproductive development and distribution of amino acids in the body tissues of female Pangasianodon hypophthalmus (Sauvage, 1878) broodstock in captivity. Aquac. Res. 2015, 46, 1736–1747. [Google Scholar] [CrossRef]
  60. Wee, K.L.; Tacon, A.G. A preliminary study on the dietary protein requirement of juvenile snakehead. 日本水産学会誌 1982, 48, 1463–1468. [Google Scholar] [CrossRef]
  61. Ebrahimnezhadarabi, M.; Changizi, R.; Hoseinifard, S.; Vatandoust, S.; Ghobadi, S. Effects of canola protein hydrolysate (CPH) on growth performance, blood biochemistry, immunity, and gastrointestinal microbiota of beluga (Huso huso) juveniles. Iran. J. Fish. Sci. 2021, 20, 1165–1178. [Google Scholar]
  62. Kari, Z.A.; Kabir, M.A.; Dawood, M.A.O.; Razab, M.K.A.A.; Ariff, N.S.N.A.; Sarkar, T.; Pati, S.; Edinur, H.A.; Mat, K.; Ismail, T.A.; et al. Effect of fish meal substitution with fermented soy pulp on growth performance, digestive enzyme, amino acid profile, and immune-related gene expression of African catfish (Clarias gariepinus). Aquaculture 2022, 546, 737418. [Google Scholar] [CrossRef]
  63. Kotzamanis, Y.P.; Gisbert, E.; Gatesoupe, F.J.; Zambonino Infante, J.; Cahu, C. Effects of different dietary levels of fish protein hydrolysates on growth, digestive enzymes, gut microbiota, and resistance to Vibrio anguillarum in European sea bass (Dicentrarchus labrax) larvae. Comp. Biochem. Physiol. Part A Mol. Integr. Physiol. 2007, 147, 205–214. [Google Scholar] [CrossRef] [PubMed] [Green Version]
  64. Zakaria, M.K.; Kari, Z.A.; Van Doan, H.; Kabir, M.A.; Che Harun, H.; Mohamad Sukri, S.A.; Goh, K.W.; Wee, W.; Khoo, M.I.; Wei, L.S. Fermented Soybean Meal (FSBM) in African Catfish (Clarias gariepinus) Diets: Effects on Growth Performance, Fish Gut Microbiota Analysis, Blood Haematology, and Liver Morphology. Life 2022, 12, 1851. [Google Scholar] [CrossRef] [PubMed]
  65. Acar, Ü.; Türker, A. The effects of using peanut meal in rainbow trout (Oncorhynchus mykiss) diets on the growth performance and some blood parameters. Aquac. Stud. 2018, 18, 5–13. [Google Scholar] [CrossRef]
  66. Ribeiro, M.d.S.; Fonseca, F.A.L.d.; Queiroz, M.N.d.; Affonso, E.G.; Conceição, L.E.C.d.; Gonçalves, L.U. Fish protein hydrolysate as an ingredient in diets for Arapaima gigas juveniles. Bol. Do Inst. De Pesca 2017, 43, 1–10. [Google Scholar]
  67. Rebl, A.; Goldammer, T. Under control: The innate immunity of fish from the inhibitors’ perspective. Fish Shellfish Immunol. 2018, 77, 328–349. [Google Scholar] [CrossRef]
  68. Peres, H.; Santos, S.; Oliva-Teles, A. Blood chemistry profile as indicator of nutritional status in European seabass (Dicentrarchus labrax). Fish Physiol. Biochem. 2014, 40, 1339–1347. [Google Scholar] [CrossRef]
  69. Rašković, B.; Stanković, M.; Marković, Z.; Poleksić, V. Histological methods in the assessment of different feed effects on liver and intestine of fish. J. Agric. Sci. 2011, 56, 87–100. [Google Scholar]
  70. Egerton, S.; Wan, A.; Murphy, K.; Collins, F.; Ahern, G.; Sugrue, I.; Busca, K.; Egan, F.; Muller, N.; Whooley, J.; et al. Replacing fishmeal with plant protein in Atlantic salmon (Salmo salar) diets by supplementation with fish protein hydrolysate. Sci. Rep. 2020, 10, 4194. [Google Scholar] [CrossRef] [Green Version]
  71. Lozano, A.R.; Borges, P.; Robaina, L.; Betancor, M.; Hernández-Cruz, C.M.; García, J.R.; Caballero, M.J.; Vergara, J.M.; Izquierdo, M. Effect of different dietary vitamin E levels on growth, fish composition, fillet quality and liver histology of meagre (Argyrosomus regius). Aquaculture 2017, 468, 175–183. [Google Scholar] [CrossRef]
  72. Pham, H.D.; Siddik, M.A.B.; Phan, U.V.; Le, H.M.; Rahman, M.A. Enzymatic tuna hydrolysate supplementation modulates growth, nutrient utilisation and physiological response of pompano (Trachinotus blochii) fed high poultry-by product meal diets. Aquac. Rep. 2021, 21, 100875. [Google Scholar] [CrossRef]
Figure 1. Histopathological examination of the Pabda catfish distal intestinal images of fish fed different FPH levels at 0%, 0.5%, 1%, and 2% under the light microscope (Olympus BX43). All pictures were captured at 10X and 200 μm scale bar investigated in (a) lamina propria, (b) lamina epithelial mucosae, (c) stratum compactum, (d) goblet cells, and (e) tunica muscularis.
Fishes 08 00147 g001
Figure 2. Histological images of Pabda liver fed with various proportions of FPH diets at 0%, 0.5%, 1%, and 2% under the light microscope (Olympus BX43). All microphotographs were taken at 10X and 200 μm scale bar. The morphological alterations were detected from the observation of nucleus (N), sinusoid (S), erythrocytes (E), and vacuole (V).
Fishes 08 00147 g002
Figure 3. Effects of dietary protein hydrolysate on the cumulative percent mortality (CPM) of Pabda catfish (O. pabda) after being challenged with A. hydrophila. Results are presented as means ± SE (n = 3). Means with different superscripts are significantly different (p < 0.05).
Fishes 08 00147 g003
Table 1. Composition and proximate analysis (% dry matter basis) of experimental diets fed to O. pabda for 90 days.
Ingredients (g/100 g) Diets (% FPH)
00.512
Fish meal10.09.59.08.0
FPH 10.00.51.02.0
CGM 23.53.53.53.5
DDGS 33.03.03.03.0
Poultry meal3.53.53.53.5
Rice bran17.517.517.517.5
Wheat 20.020.020.020.0
Soybean meal30.030.030.030.0
Soybean oil3.03.03.03.0
Palm oil3.53.53.53.5
Vitamin and mineral premix 43.03.03.03.0
Binder3.03.03.03.0
Total100100100100
Feed raw material costs (USD/mT)613.08616.33619.58626.08
Proximate composition
Crude protein35.0135.0835.5835.97
Crude lipid7.857.938.058.21
Crude ash12.1212.1012.0111.93
Moisture11.5512.2411.2311.02
NFE 533.4733.6533.1632.87
1 Fish protein hydrolysate (FPH); 2 corn germ meal (CGM); 3 distillery dry grain soluble (DDGS);4 g/kg vitamin and mineral premix: vitamin A, C, D, E, K, B1, B2, B6, B12, KCL, 90; KI, 0.04; CaHPO4.2H2O, 500; NaCl, 40; CuSO4.5H2O, 3; ZnSO4. 7H2O, 4; CoO4, 121 0.02; FeSO4.7H20, 20; MnSO4.H2O, 3: CaCo3, 215; MgOH, 124: Na2SeO3, 0.03; NaF, 1; 5 nitrogen-free extract (NFE).
Table 2. Physical properties and palatability test of experimental diets (n = 3). Results are presented as mean ± standard deviation.
Parameters Diets (% FPH)
00.512
Feed diameter (mm)2.03 ± 0.022.02 ± 0.022.02 ± 0.022.03 ± 0.02
ER (%)1.94 ± 0.032.37 ± 0.424.13 ± 2.204.69 ± 2.51
Bulk density (kg/m3)455.00 ± 3.00456.67 ± 3.51460.00 ± 4.36462.33 ± 5.13
PDI (%)99.74 ± 0.05 a99.62 ± 0.12 ab99.61 ± 0.09 ab99.55 ± 0.09 b
Floatability (%)100.00 ± 0.00100.00 ± 0.00100.00 ± 0.00 99.33 ± 1.15
Water stability (%)78.75 ± 1.7279.69 ± 0.7778.88 ± 1.3479.85 ± 0.48
Palatability++++++++++++++
ER, expansion ratio; PDI, pellet durability index. Means with different superscripts are significantly different (p < 0.05). +++: fish consumed less than 75% of the given feed in 5 min; ++++: fish consumed less than 100% of the given feed in 5 min.
Table 3. Hydrological variables of the fish-holding cage water in the different experimental diet groups (n = 3). Results are presented as mean ± standard deviation.
Parameter Diets (% FPH)
00.512
Temperature (°C)30.82 ± 0.0730.91 ± 0.1030.92 ± 0.0630.78 ± 0.13
Pressure, mm (Hg)750.51 ± 0.03 ab750.10 ± 0.67 b751.76 ± 1.17 a750.50 ± 0.05 ab
DO (mg/L)5.06 ± 0.08 b5.03 ± 0.03 b5.10 ± 0.07 b5.23 ± 0.03 a
Conductivity (Siemens/meter)61.14 ± 0.4360.97 ± 0.2160.71 ± 0.3460.84 ± 0.06
TDS (mg/L)27.68 ± 0.1727.61 ± 0.0827.66 ± 0.0627.58 ± 0.04
Salinity (ppt)0.03 ± 0.000.03 ± 0.000.03 ± 0.000.03 ± 0.00
pH6.91 ± 0.046.94 ± 0.056.93 ± 0.056.95 ± 0.05
NH3 (mg/L)0.08 ± 0.040.07 ± 0.030.06 ± 0.030.06 ± 0.02
NO2- (mg/L)0.08 ± 0.000.09 ± 0.010.09 ± 0.010.09 ± 0.01
NO3- (mg/L)0.82 ± 0.090.82 ± 0.090.82 ± 0.090.77 ± 0.00
Means with different superscripts are significantly different (p < 0.05).
Table 4. Growth performance of Pabda fed different experimental diets for 90 days (n = 30). Results are presented as mean ± standard deviation.
Parameters Diets (% FPH)
00.512
IW (g)3.01 ± 0.023.01 ± 0.013.02 ± 0.023.01 ± 0.01
FW (g)17.14 ± 1.94 c18.24 ± 1.18 c20.92 ± 0.56 b24.50 ± 1.18 a
WG (%)469.09 ± 65.89 c506.58 ± 41.35 c592.26 ± 20.54 b715.06 ± 38.18 a
SGR (%)1.93 ± 0.14 c2.00 ± 0.07 bc2.15 ± 0.04 b2.33 ± 0.05 a
TB (g)1412.20 ± 194.60 c1523.13 ± 118.65 c1789.67 ± 56.82 b2149.60 ± 118.05 a
SR (%)97.33 ± 0.58 b98.00 ± 0.00 b99.33 ± 0.58 a99.67 ± 0.58 a
FCR1.43 ± 0.21 a1.32 ± 0.11 ab1.12 ± 0.04 bc0.93 ± 0.05 c
FCE0.70 ± 0.10 c0.76 ± 0.06 c0.89 ± 0.03 b1.07 ± 0.06 a
PER2.02 ± 0.27 c2.17 ± 0.17 bc2.44 ± 0.05 b2.91 ± 0.16 a
CF (%)0.51 ± 0.02 b0.53 ± 0.05 ab0.55 ± 0.03 ab0.58 ± 0.02 a
HSI (%)0.70 ± 0.05 ab0.63 ± 0.09 b0.83 ± 0.21 ab0.95 ± 0.14 a
IPF (%)0.97 ± 0.26 a0.66 ± 0.07 b0.94 ± 0.03 ab0.95 ± 0.14 ab
VSI (%)1.44 ± 0.05 ab1.52 ± 0.04 a1.34 ± 0.07 bc1.31 ± 0.08 c
IW, initial weight; FW, final weight; WG, weight gain; SGR, specific growth rate; TB, total biomass; SR, survival rate; FCR, feed conversion ratio; FCE, feed conversion efficiency; PER, protein efficiency ratio; CF, condition factor; HSI, hepatosomatic index; IPF, intraperitoneal fat; VSI, visceral somatic index. Means with different superscripts are significantly different (p < 0.05).
Table 5. Proximate composition of intestine, liver, and muscle (wet basis) of fish fed with different experimental diets (n = 3). Results are presented as mean ± standard deviation.
Parameters Diets (% FPH)
00.512
Intestine
Protein16.74 ± 0.20 b16.48 ± 1.06 b17.23 ± 0.75 ab18.24 ± 0.49 a
Lipid11.08 ± 0.8311.13 ± 0.1611.25 ± 0.1510.73 ± 0.26
Ash2.00 ± 0.02 b2.35 ± 0.13 ab2.33 ± 0.29 ab2.60 ± 0.18 a
Moisture68.06 ± 0.8767.96 ± 0.9867.39 ± 1.1666.76 ± 0.46
Liver
Protein12.59 ± 0.66 b13.64 ± 0.44 b15.71 ± 0.88 a16.24 ± 0.45 a
Lipid11.72 ± 0.41 a11.24 ± 1.07 ab10.60 ± 0.35 ab10.13 ± 0.15 b
Ash2.03 ± 0.08 b2.51 ± 0.30 ab2.83 ± 0.28 a2.49 ± 0.30 ab
Moisture71.62 ± 1.41 a71.15 ± 1.37 ab68.91 ± 1.38 b69.71 ± 0.78 ab
Muscle
Protein21.48 ± 0.53 b21.94 ± 1.33 b22.99 ± 0.53 ab23.81 ± 0.70 a
Lipid8.11 ± 0.16 a7.09 ± 0.20 b6.81 ± 0.04 b8.12 ± 0.19 a
Ash2.17 ± 0.282.60 ± 0.192.57 ± 0.182.60 ± 0.19
Moisture66.47 ± 0.56 a66.02 ± 1.00 a65.33 ± 0.45 a63.78 ± 0.93 b
Means with different superscripts are significantly different (p < 0.05).
Table 6. Total bacteria (TB) quantity in fish diets and intestines (n = 3). Results are presented as mean ± standard deviation (SD).
Parameter Diets (% FPH)
00.512
TB (CFU/g feed) × 1067.07 ± 0.81 d8.63 ± 0.50 c10.14 ± 0.21 b12.73 ± 0.57 a
TB (CFU/g intestine) × 1077.47 ± 0.47 d9.23 ± 0.64 c16.53 ± 0.45 b18.43 ± 0.31 a
Means with different superscripts are significantly different (p < 0.05).
Table 7. Hematological parameters of Pabda fed with dietary FPH supplementation levels for 90 days (n = 3). Results are presented as mean ± standard deviation.
Parameters Diets (% FPH)
00.512
WBC (109/L)542.29 ± 0.02542.30 ± 0.16542.29 ± 0.08542.39 ± 0.09
NEU (%)0.58 ± 0.02 ab0.54 ± 0.03 b0.54 ± 0.03 b0.59 ± 0.01 a
LYM (%)0.33 ± 0.01 c0.55 ± 0.05 b0.78 ± 0.03 a0.83 ± 0.02 a
MON (%)0.01 ± 0.00 b0.02 ± 0.00 b0.02 ± 0.01 b0.05 ± 0.01 a
EOS (%)0.01 ± 0.000.01 ± 0.000.01 ± 0.00 0.01 ± 0.00
BAS (%)0.05 ± 0.01 a0.01 ± 0.01 b0.01 ± 0.00 b0.01 ± 0.00 b
RBC (1012/L)2.76 ± 0.31 b1.63 ± 0.49 c1.45 ± 0.15 c7.01 ± 0.53 a
HGB (g/L)95.00 ± 8.72 a18.00 ± 2.65 c21.00 ± 9.54 c52.67 ± 10.97 b
HCT (%)0.22 ± 0.03 b0.62 ± 0.05 a0.10 ± 0.02 c0.13 ± 0.03 c
MCV (fL)85.33 ± 4.0285.20 ± 5.5476.27 ± 3.2983.37 ± 4.92
MCH (pg)34.03 ± 0.3533.31 ± 3.5731.60 ± 5.0334.47 ± 5.59
MCHC (g/L)411.00 ± 16.64 bc517.83 ± 25.42 a369.35 ± 2.30 c422.00 ± 34.04 b
RDW-CV (fL)0.18 ± 0.010.18 ± 0.020.17 ± 0.020.19 ± 0.01
RDW-SD (fL)61.70 ± 3.8657.47 ± 7.8854.43 ± 5.8862.33 ± 2.50
PLT (109/L)285.27 ± 27.08 b269.33 ± 6.35 b267.67 ± 13.32 b338.00 ± 28.00 a
MPV (fL)7.70 ± 0.627.93 ± 1.426.57 ± 0.387.63 ± 0.42
PDW (%)17.37 ± 0.81 ab18.30 ± 1.05 a16.40 ± 0.52 b17.40 ± 0.50 ab
PCT (ml/L)2.22 ± 0.23 b1.60 ± 0.14 c1.80 ± 0.14 c2.73 ± 0.19 a
WBC, white blood cell; NEU, neutrophil; LYM, lymphocytosis; MON, monocytes; EOS, eosinophil; BAS, basophil; RBC, red blood cell; HGB, hemoglobin; HCT, hematocrit; MCV, mean corpuscular volume; MCH, mean corpuscular hemoglobin; MCHC, mean corpuscular hemoglobin concentration; RDW-CV, red cell distribution width–coefficient of variation; RDW-SD, red cell distribution width–standard deviation, PLT, platelet; MPV, mean platelet volume; PDW, platelet distribution width; PCT, procalcitonin. Means with different superscripts are significantly different (p < 0.05).
Table 8. Plasma biochemical parameters of fish fed different dietary FPH supplementations for 90 days (n = 3). Results are presented as mean ± standard deviation.
Parameters Diets (% FPH)
00.512
Blood Glucose (mg/dL)64.67 ± 1.53 d72.67 ± 2.08 c82.00 ± 2.65 b89.33 ± 2.08 a
S. Creatinine (mg/dL)0.40 ± 0.10 c0.70 ± 0.10 b0.90 ± 0.10 a0.60 ± 0.10 b
S. Bilirubin (mg/dL)0.79 ± 0.01 a0.52 ± 0.03 c0.58 ± 0.03 b0.41 ± 0.02 d
SGPT (u/L)31.67 ± 3.06 c52.33 ± 3.06 b32.67 ± 1.53 c72.67 ± 2.08 a
S. Urea (mg/dL)18.67 ± 1.53 c22.00 ± 2.65 bc30.33 ± 2.08 a24.67 ± 4.04 b
SGOT (u/L)39.00 ± 1.73 b66.00 ± 3.61 a39.67 ± 1.53 b67.33 ± 2.52 a
Albumin (u/L)3.01 ± 0.263.07 ± 0.213.17 ± 0.312.80 ± 0.10
S. Alkaline Phosphatase (u/L)371.00 ± 10.15 a80.33 ± 5.03 c62.67 ± 2.08 d137.67 ± 4.16 b
S. Cholesterol (mg/dL)174.33 ± 7.64 c302.00 ± 2.65 a283.33 ± 4.93 ab265.33 ± 24.11 b
Total Protein (g/dL)5.37 ± 0.45 c5.77 ± 0.45 c6.70 ± 0.201 b8.73 ± 0.21 a
Globulin (g/dL)2.30 ± 0.20 d3.00 ± 0.10 c5.53 ± 0.25 a3.53 ± 0.35 b
SGPT, serum glutamic pyruvic transaminase; SGOT, serum glutamic oxaloacetic transaminase. Means with different superscripts are significantly different (p < 0.05).
Table 9. Economics resulting from the 90-day feeding trial in Pabda (n = 3). Results are presented as mean ± standard deviation.
Parameters Diets (% FPH)
00.512
TY (kg/m2)1.41 ± 0.11 d1.52 ± 0.07 c1.79 ± 0.03 b2.15 ± 0.07 a
FFC (USD/kg)0.88 ± 0.08 a0.81 ± 0.04 b0.69 ± 0.01 c0.58 ± 0.02 d
FR (USD/m2)2.22 ± 0.18 d2.40 ± 0.11 c2.82 ± 0.05 b3.39 ± 0.11 a
FRM (USD/m2)1.00 ± 0.18 d1.17 ± 0.11 c1.58 ± 0.05 b2.13 ± 0.11 a
ROI (%)81.4 ± 14.4 d94.6 ± 8.8 c127.5 ± 4.2 b170.4 ± 8.6 a
TY, total yield; FFC, farm feed costs; FR, farm revenue; FRM, farm raw margin; ROI, return on investment. Mean values with various superscript letters represent statistical significance (p < 0.05).
Disclaimer/Publisher’s Note: The statements, opinions and data contained in all publications are solely those of the individual author(s) and contributor(s) and not of MDPI and/or the editor(s). MDPI and/or the editor(s) disclaim responsibility for any injury to people or property resulting from any ideas, methods, instructions or products referred to in the content.

