Article

Space and Time Use of European Eel Restocked in Upland Continental Freshwaters, a Long-Term Telemetry Study

1
Laboratory of Fish Demography and Hydroecology, Management of Aquatic Resources and Aquaculture Unit, Freshwater and Oceanic Science Unit of Research-FOCUS, University of Liège, 22 Quai E. Van Beneden, B-4020 Liège, Belgium
2
SPWARNE-DNF-Public Service of Wallonia-Fisheries Service, 15 Avenue Prince de Liège, B-5100 Jambes, Belgium
3
SPWARNE-DNF-Public Service of Wallonia-Agriculture, Natural Ressources & Environnement, Wildlife & Forestry Department, 15 Avenue Prince de Liège, B-5100 Jambes, Belgium
*
Author to whom correspondence should be addressed.
Fishes 2023, 8(3), 137; https://doi.org/10.3390/fishes8030137
Submission received: 26 January 2023 / Revised: 21 February 2023 / Accepted: 24 February 2023 / Published: 27 February 2023
(This article belongs to the Special Issue Advances in Anguillid Eel Biology and Ecology)

Abstract

:
There is a lack of information on many biological and ecological aspects of the critically endangered European eel during its growth phase in inland waters, such as when the sedentary life stage begins, mobility according to age and response to habitat alteration. We used mobile radio frequency identification (RFID) telemetry technology to track tagged eels over 6 years after their restocking as glass eels in six typologically different rivers. We also cross-referenced telemetry data with those of several electrofishing monitoring sessions to better understand the mobility and behaviour of eels. The relative abundance (maximum 52 individuals km−1) and detection rate (maximum 28%) of eels were not significantly correlated with the time/age after restocking. Eels were present in all restocked rivers, but their abundance was low and mobility was high in a slightly acidified, oligotrophic river that had experienced a great loss of fish habitat heterogeneity. This loss of habitat heterogeneity was due to flooding events and machinery works in riverbeds to restore the altered riverbanks. Four years after glass eel release, restocked eels became sedentary and moved from shallow to deep microhabitats with riverbeds dominated by blocks as the bottom substrate. After this age, they exhibited high fidelity to the residence site. This study provides new insights concerning the biology and ecology of eels restocked as glass eels in freshwaters, which should lead to improved management plans for the species through the implementation of more effective conservation measures and strategies.

Graphical Abstract

1. Introduction

Eel restocking is applied in many European countries [1,2,3,4,5,6,7]. It corresponds to the reallocation of naturally recruited eels from high-density zones to recipient freshwater habitats where there is poor or no natural colonisation [8,9,10]. The utility of restocking is debated, but it is the only solution to enhance riverine eel stocks in countries that are far from the sea and located within the natural distribution area of the species [7,8,9,10,11,12]. Some studies have demonstrated its effectiveness [1,9,10,11,12]. However, the practice is still dependent on wild-caught glass eels and elvers, as reproduction of the species in captivity has not yet been achieved [5]. The species breeds at a spawning area located in the Sargasso Sea [13,14,15]. As a facultative catadromous species, some young individual eels migrate from spawning grounds to inland waters, where they grow before returning as adult spawners to breed in the sea. Since around 1980, the drastic decline in the species’ stocks due to numerous and likely cumulative causes—including unsustainable fisheries, barriers to upstream and downstream migration, habitat loss, pollution and pathogens—has raised serious concerns [16,17,18,19,20]. Consequently, eels have been listed on the International Union for Conservation of Nature’s Red List as Critically Endangered [21].
The species colonises continental waters by population density pressure [22,23]. Consequently, the eel stock decline is most visible in inland areas far from the sea due to the massive decline in juvenile recruitment at sea and the cessation of the upstream colonisation process of young eels from the sea. Some of these areas once hosted abundant local stocks of eels, which have either completely disappeared or have been greatly reduced to the presence of a few old individuals close to their return breeding journey to the sea [9,12,23,24,25,26,27]. In the Belgian Meuse River basin (>320 km upstream of the North Sea), the state of local eel stocks is critical as they have drastically declined. The number of wild yellow eels ascending the Meuse River from the North Sea via the Dutch Meuse has decreased by about 3.6% per year from 1992 to 2020; in 2020, this number was 0.6% of the level recorded in 1992 [9,10,12,23,27,28]. Several rivers that have hosted abundant stocks of eels in the past are currently emptied of their eels. This decline is due to the decrease in glass eel recruitment in the North Sea, which fell in 2019 to 1.4% of the mean level of 1960–1979 [29]. Without restocking, eels will probably disappear from the Belgian Meuse basin within the next decade [9,10,27]. It is therefore urgent to optimise the eel restocking practice, but also to understand the biological benefits associated with this practice. Biological and ecological knowledge of restocked eels during the continental life phase should help to better understand how restocking could sustainably increase and maintain local stocks. Over time, this should lead to achieving the silver eel biomass escapement goal target of the Eel Recovery Plan of Europe and increasing recruitment of future catadromous offspring moving upriver [10,30]. This knowledge would be particularly useful for improving eel management and conservation plans.
Recent encouraging outcomes from restocking have been reported in continental freshwaters in terms of dispersal and habitat use [12]; survival [1,28,31,32]; growth [3,7,8,9,11]; and sex ratio production, fat content and pathogen and pollutant loads [10,20]. As a catadromous fish, an eel has a complex life cycle, a long life and undiscovered habits, behaviours and habitat use dynamics, which make the species very difficult to study and monitor over a long time. The recently reported outcomes have been possible thanks to studies using electrofishing to catch eels in selected areas of shallow freshwaters to assess their growth, survival, sex and health [7,8,9,10,28]. Telemetry has also been used to accurately evaluate individual mobility patterns and dynamics of habitat use in eels [12]. However, many biological and ecological aspects of the species during its growth phase in inland waters after restocking—such as initiation of the sedentary life stage, mobility and habitat preference according to age, and resilience after extreme environmental events—are still insufficiently understood.
In Belgium, restocking for scientific purposes has taken place and there is long-term monitoring of restocked eels. This monitoring has made it possible to highlight the significant growth and survival performance of restocked eels; the production of female-dominated stocks; and the low viral, parasite and pollutant loads [9,10,11,12,28]. Conversely, until this stage, little was known about the biological and ecological aspects of the strategies of time and space use of restocked eels on a long-term time scale. Therefore, the present study performed over a 6-year period of telemetry (2017–2022) aimed (1) to assess the relative abundance and detection rate of restocked eels according to time after restocking; (2) to accurately identify the age from which the biological process of sedentarisation is initiated in restocked eels; (3) to characterise the dynamics of habitat use as restocked eels age; (4) to examine eel mobility in relation to age post-restocking as well as in relation to the ecological diversity of the recipient rivers; and (5) to analyse the response of restocked eels to an extreme flood event that occurred in the summer of 2021.

2. Materials and Methods
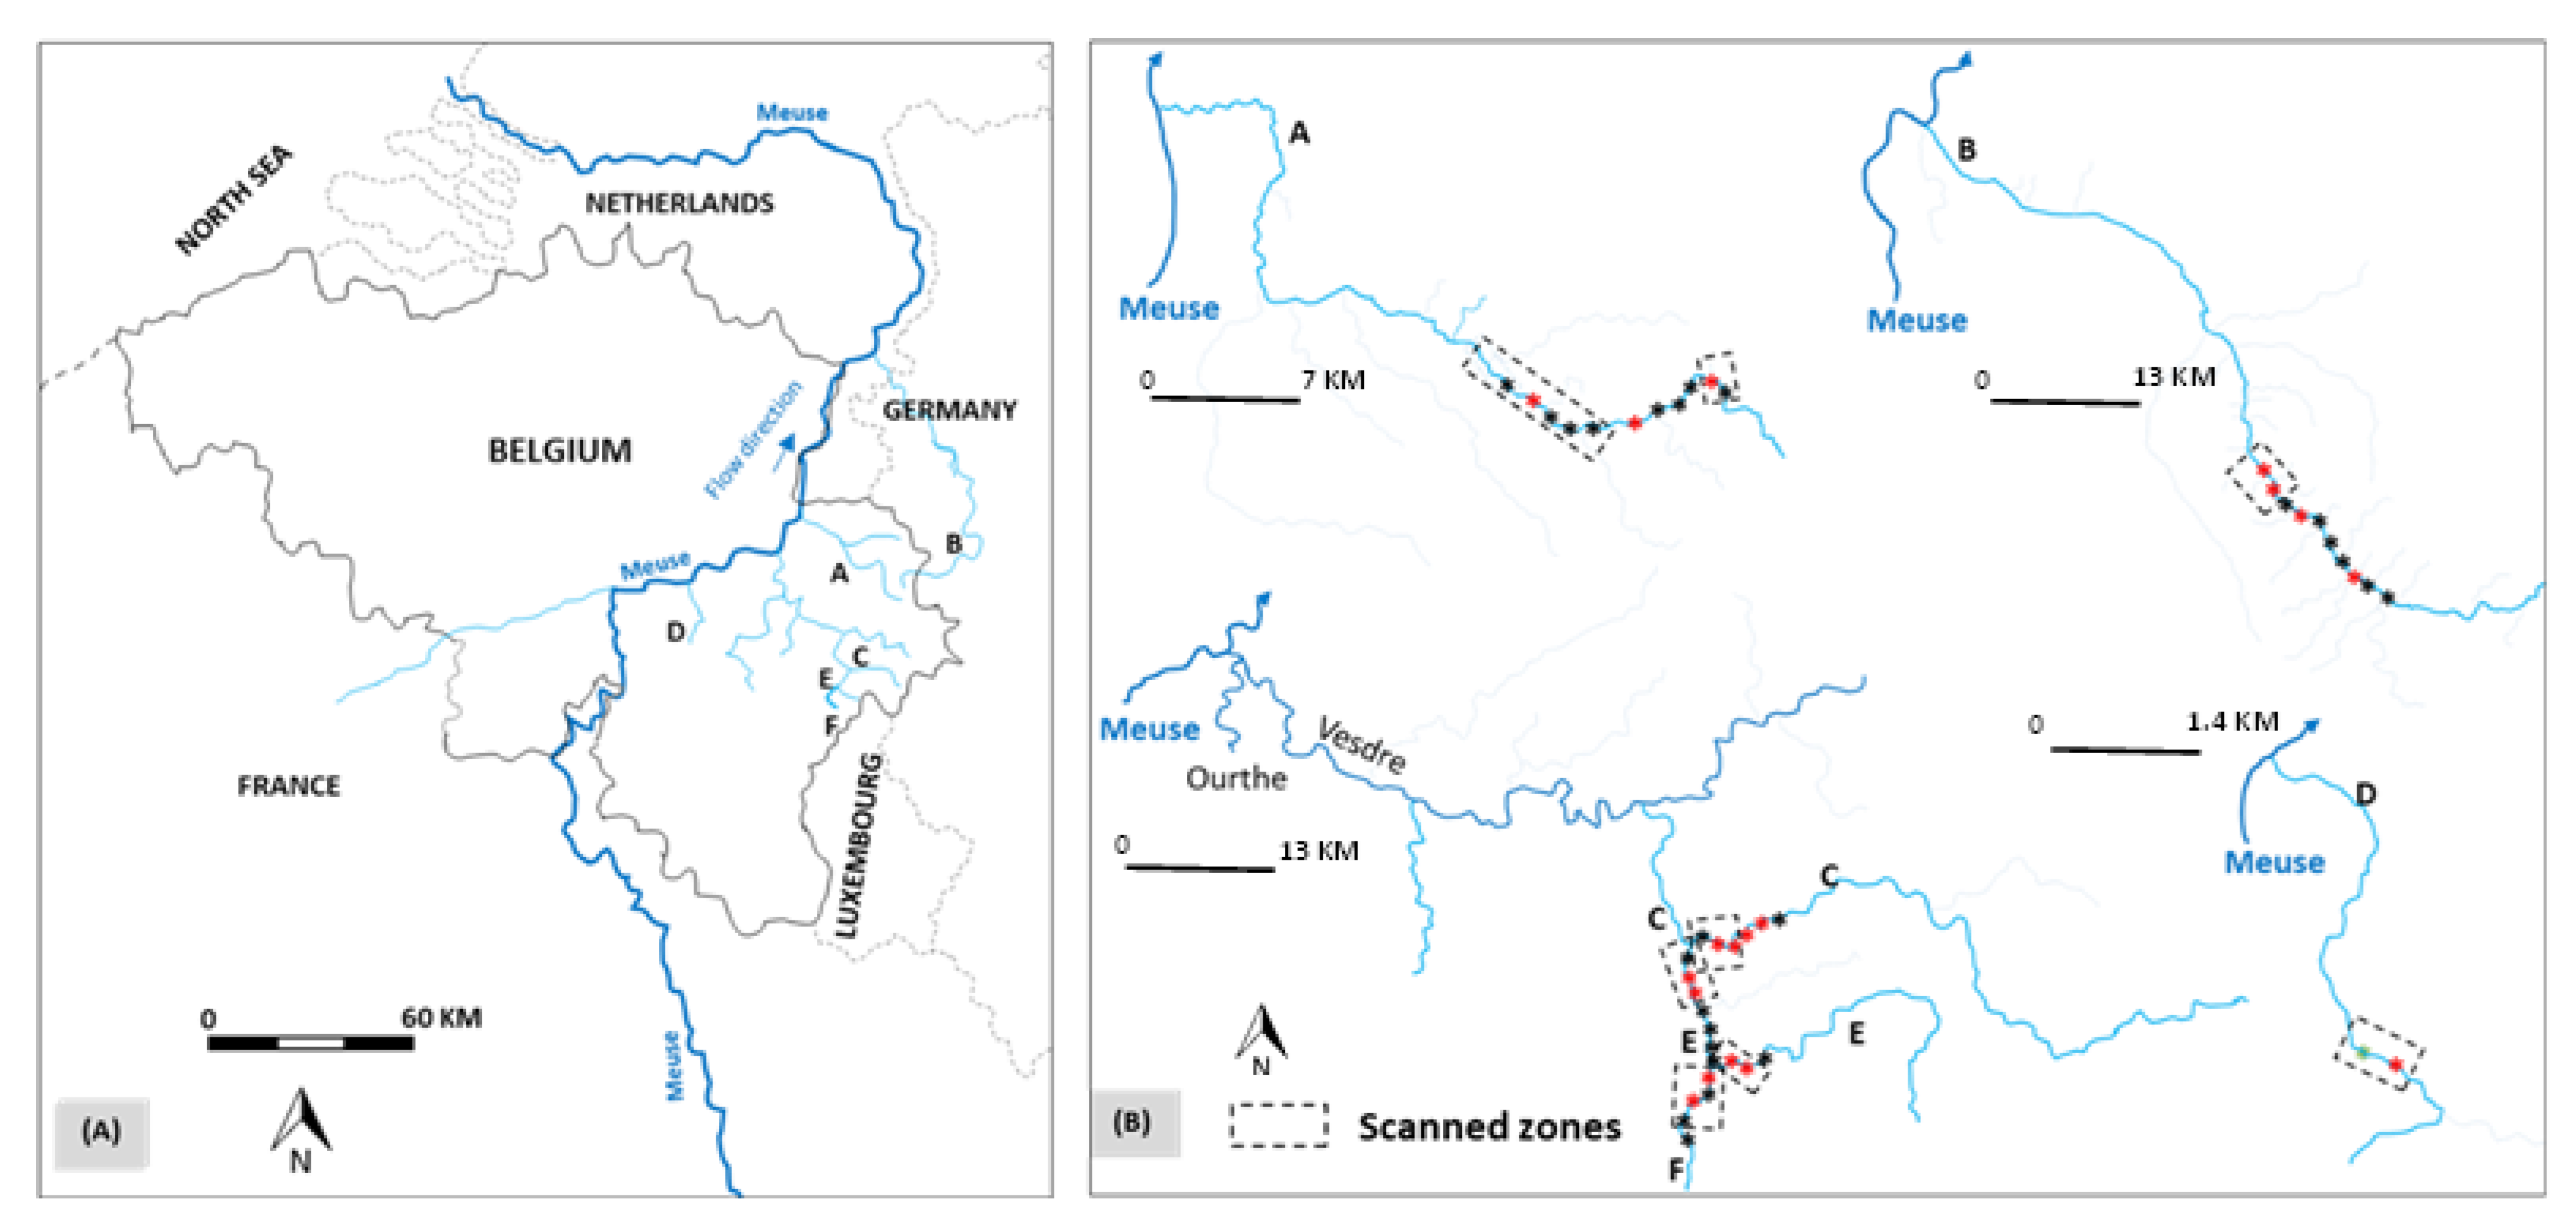
2.1. Study Sites

This study was performed in Southern Belgium, in six rivers that are part of the Belgian Meuse River basin and located >320 km from the North Sea (Figure 1 and Table 1). These rivers are: Berwinne (A), Gueule (B), Hoegne (C), Oxhe (D), Wayai (E) and Winamplanche (F). They have a similar thermal regime with an eel growing period (>8 °C) occurring mainly from April to late October [9,12,33,34]. The glass eel stage is naturally absent in these rivers, but some of them have previously hosted abundant stocks of wild yellow eels in the past [24,25,26,27]. However, these eel stocks have either completely disappeared or have been reduced to the presence of a few old individuals due to the cessation of the natural immigration of eels from the Belgian Meuse, which is already far from the sea [9,12,23,24,25,26,27]. Rivers A and D are direct tributaries of the Meuse with their confluences located in Belgium. Rivers A and D have a similar width and a flow facies characterised by a succession of run, pool and riffle and are typical of the brown trout Salmo trutta fish zone [35]. River A is eutrophic with large stones and blocks as the predominant substrate of the riverbed, whereas river D is oligotrophic with abundant large and fine stones in the riverbed. River B is also a direct eutrophic tributary of the Meuse with its confluence located in the Netherlands. It is deeper and typical of the lower grayling Thymallus thymallus fish zone [35], with very abundant riparian vegetation, abundant lentic channel-type habitat, a bottom substrate dominated by fine stone and coarse gravel and a high species richness. River F drains into river E that is a direct tributary of river C, which flows into the Vesdre River, a direct tributary of the Ourthe River that flows into the Meuse in Belgium. Rivers C, E and F are oligotrophic with an abundant run-type habitat and a high density of brown trout, which is considered the most dominant predator of young, restocked eels [9]. Rivers C and E have riverbeds dominated by boulders and blocks and are typical of the upper and lower brown trout fish zones, respectively [35]. River F is typical of the brown trout fish zone [35] with boulders and coarse pebbles as the dominant bottom substrates. Rivers C and F flow through bottom substrates that are poor in alkaline cations and are slightly acidified.

2.2. Eel Capture and Tagging

Following the technique described by Ovidio et al. [11], we used DC electrofishing (EFKO, 3.0 kVA FEG 5000, 150–300/300–600 volt DC, according to VDE 0686, IEC 60335-2-86, Leutkrich im Allgäu), with hand nets 40 × 40 cm in diameter and 2 × 2 mm mesh, to capture the restocked eels. Restocking in the six rivers (a total of 43 sites) occurred on 21 March 2017 at a density of 2.4 kg ha−1 from 17.3 kg of glass eels caught on France’s Atlantic coast that were imported through a commercial trade company (SAS Gurruchaga Marée, France) (Figure 1). These glass eels had a mean value (±standard error) of 67.0 (±3.6) mm for the total length and 0.23 (±0.04) g for the weight. They demonstrated an excellent sanitary status and were free of pathogens [20]. We electrofished a 200 m stretch per site each autumn from 2017 to 2021, for a total of five electrofishing sessions [9]. An additional electrofishing session was conducted in autumn 2022 on more productive habitats of eels (a 2550 m total stretch of rivers) previously identified during a telemetry session performed in spring 2022. At each electrofishing session, we anesthetised the captured eels with a 1:10 ratio of eugenol to alcohol (0.5 mL L−1) and then measured (total length [TL] to the nearest 1 mm) and weighed (to the nearest 0.01 g) the eels [9,10,11,12]. We identified the tagged eels, and the untagged eels received their first small biocompatible radio frequency identification (RFID) tags (half duplex, 134.2 kHz, size/weight in air: 12 × 2 mm/0.095 g; Texas Instruments Inc., Dallas, TX, USA), respecting the rule that the tag-to-body weight ratio should not exceed 2% [36]. We made incisions 2 mm in length in the pre-anal position in the visceral cavity of the anaesthetised eels using a scalpel to insert the tags [9,12]. After a recovery period and when all anaesthetic effects had worn off, we released the eels in the same place where we had captured them. There was no mortality due to tagging.

2.3. Eel RFID Tracking

We performed mobile RFID tracking in the six rivers during the daytime following Nzau Matondo et al. [9,12]. The tracking system involved a submerged antenna sweeping near the river bottom to detect tagged eels. We connected this antenna (mobile RFID reader with 48.0 × 58.6 cm antenna diameter, Oregon RFID, Portland, OR, USA) to a backpack electronic recorder and a reader using Blueterm software. Its detection range and efficiency have already been studied [9,28]. We scanned 450–2120 m per river (mean 1220 m, total 7693 m) involving 2–4 sites for both fishing and tagging eels per river (mean 2 sites, total 14 sites) (Figure 1). Tracking sessions took place each spring from 2018 to 2022, for a total of five telemetry sessions during the study. For each detected eel, we recorded the date, the substrate of the physical habitat, the water depth, the cover, its individual code and its precise location in the study site [12]. We identified the riverbed substrate by using the Wentworth particle size classification system (the diameter perpendicular to the longest axis: boulders >102 cm, blocks 26–102 cm and large stones 13–25 cm [37]). This identification also included other habitat categories such as submerged roots [38,39].
In the summer of 2021, from 14 to 16 July, extreme floods occurred, which have severely degraded aquatic ecosystems. Based on the data available for the studied rivers, the mean annual flow of rivers C and E was 1.349 m³ s−1; however, it reached a peak of 108.858 m³ s−1 during the floods, corresponding to nearly 81 times the normal annual flow (data provided by the Wallonia Public Service of Hydrological Studies). We assessed degradation levels of stretches scanned in the studied rivers by using the following qualitative assessment scale: category I (undegraded river) is characterised by a total absence of any apparent riverine degradation sign. Category II (little degraded river) is characterised by displacement of some block-type bottom substrates. Category III (degraded river) is characterised by important displacement of the block-type bottom substrates, filling of certain water holes and slight modification of flow facies but without the loss of eel habitat diversity. Finally, category IV (heavily degraded river) is characterised by complete loss of eel habitat diversity and the presence of a new aquatic environment destroyed by floods and reconstituted by construction machinery working directly in the riverbed to restore altered riverbanks. In this last category, we observed an important displacement of the bottom substrate (block loss), a loss of the riparian forest, a standardisation of the flow facies with a remarkable loss of its diversity and a standardisation of the water depth (a loss of fish habitat heterogeneity that characterises a natural river undisturbed by man).

2.4. Behavioural Metrics Related to Tracking

Telemetry monitoring of restocked eels has allowed us to define the following quantitative behavioural measures of mobility, which we calculated as described previously [12,39]:
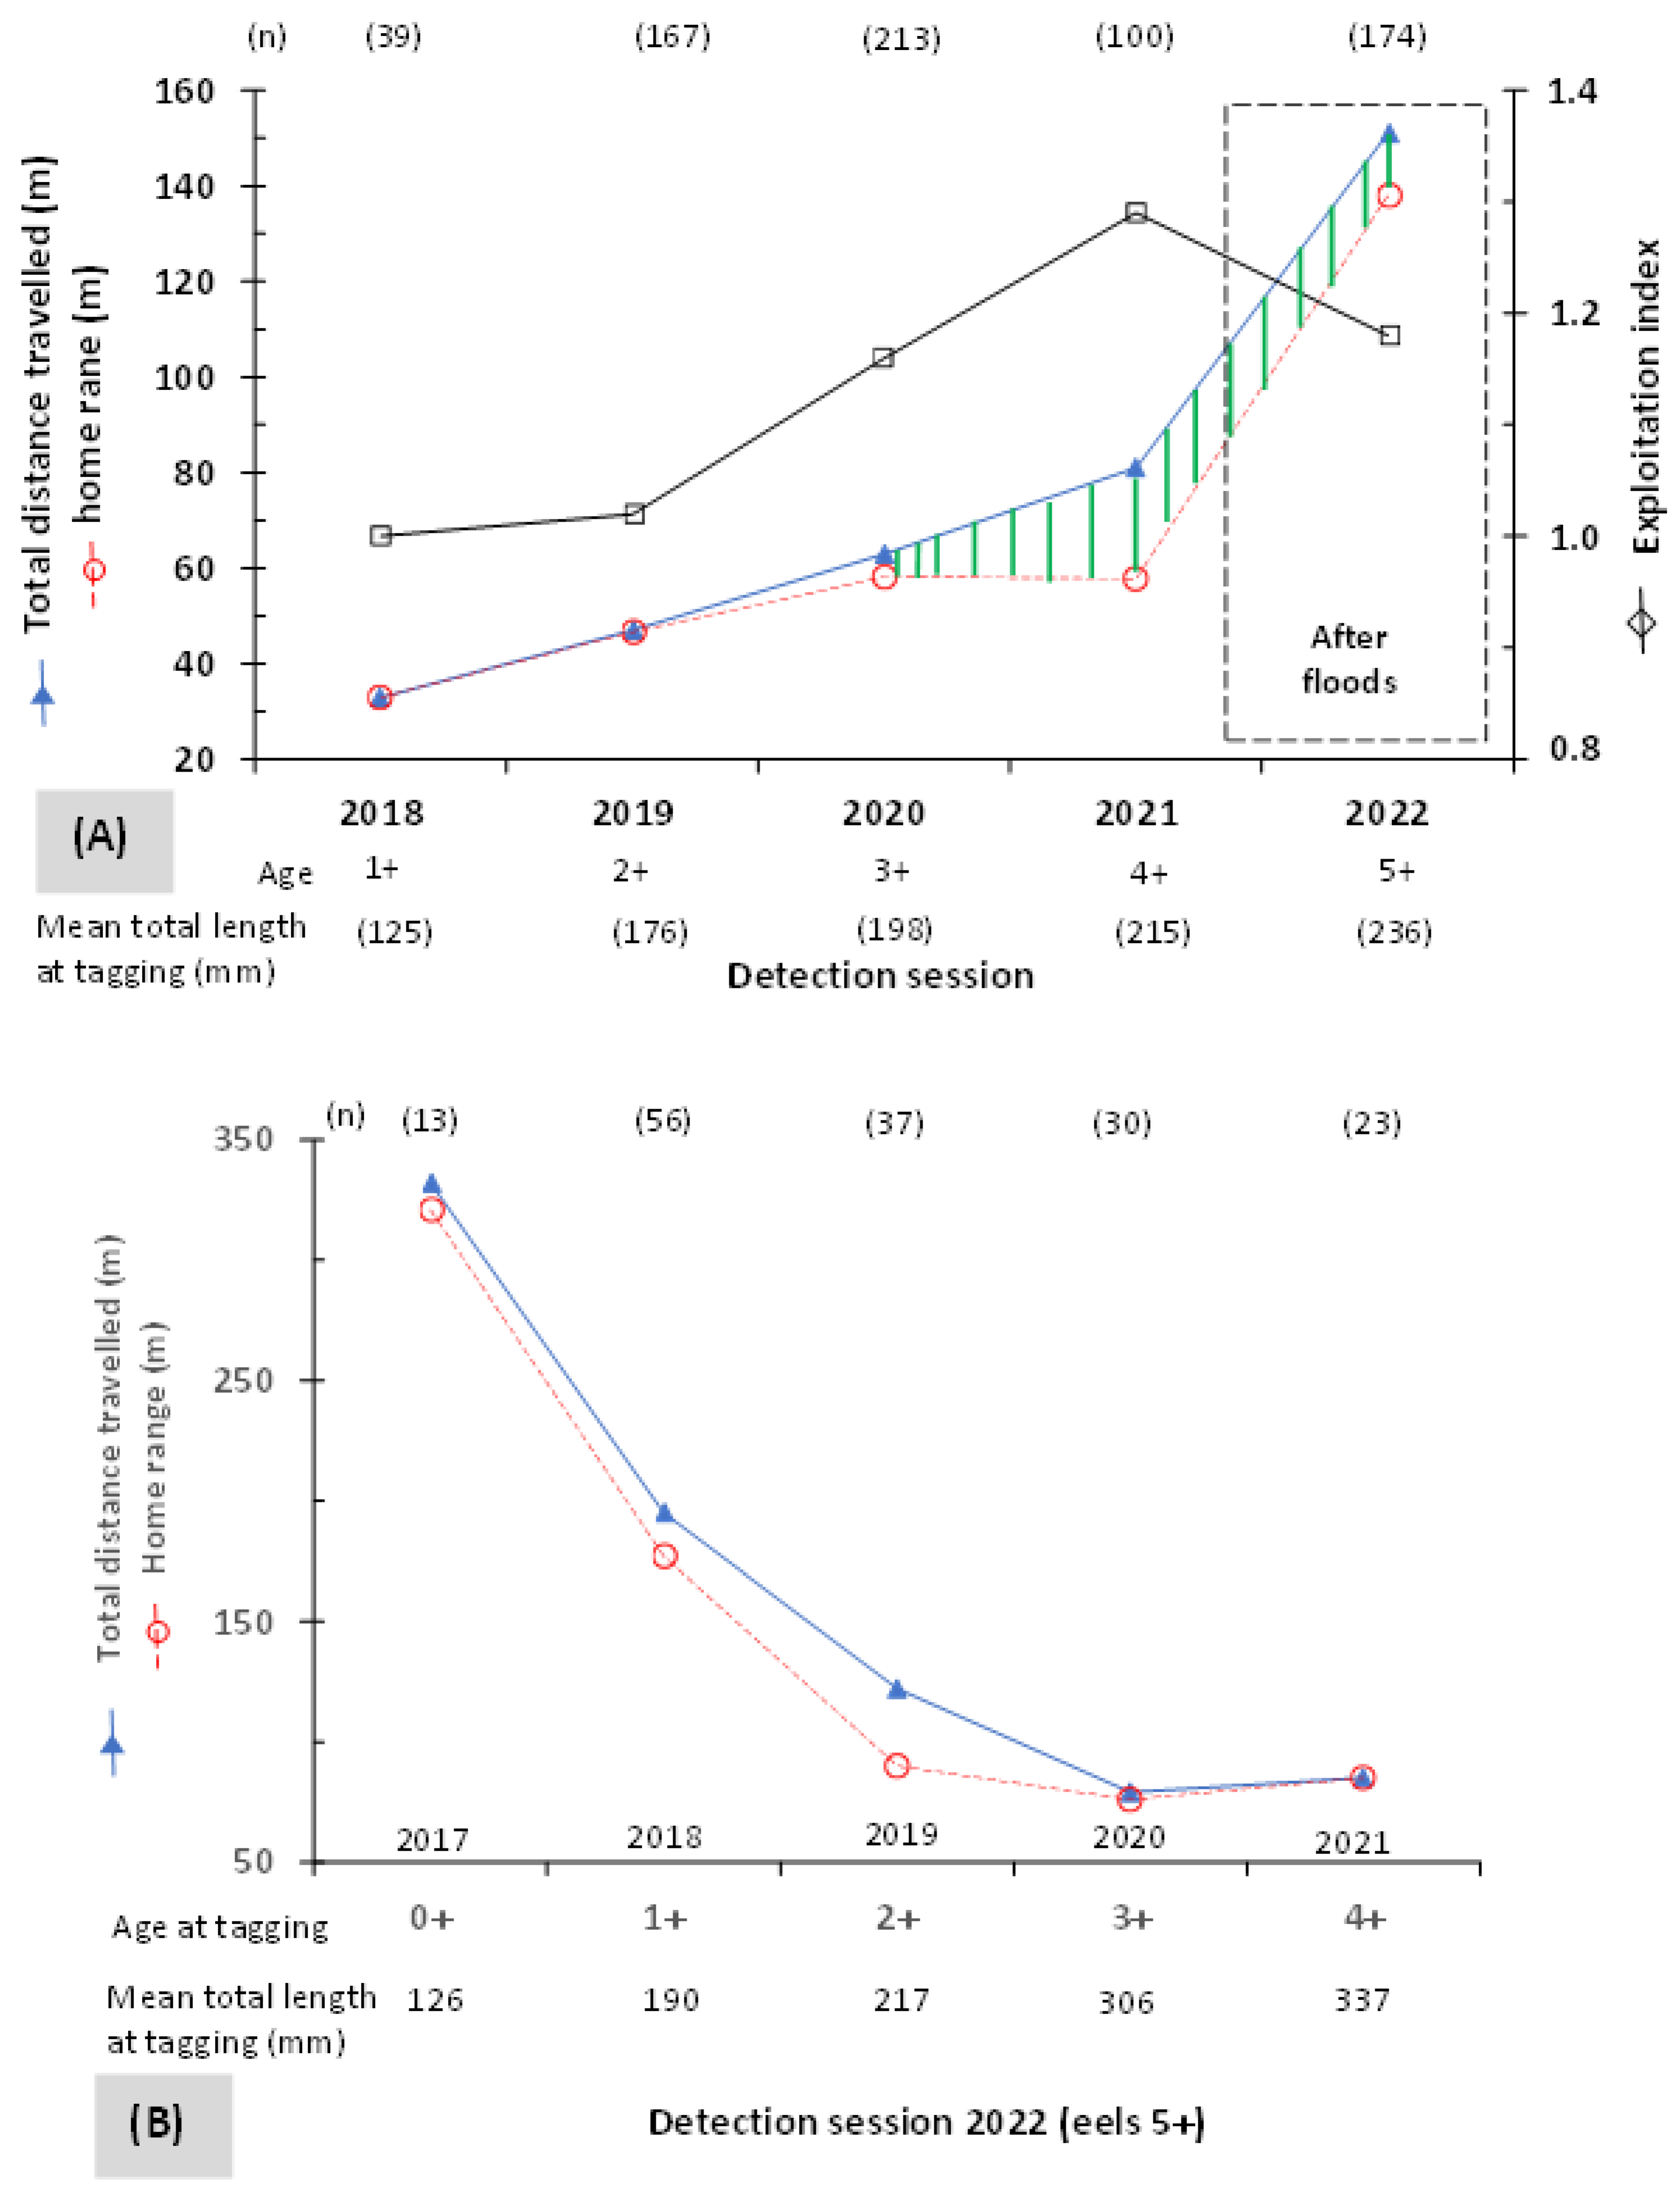
  • Total distance travelled (TD) is expressed as the sum of the net distance travelled, which is the straight-line distance between two consecutive positions of the tagged eel.
  • Home range (HR) is the distance between the most upstream and downstream positions of the tagged eel.
  • The exploitation index (EI) of the HR is the ratio calculated by dividing TD by HR.
  • Longitudinal dispersal (LD) is the straight-line distance between two consecutive positions of the tagged eel, one before and one other after the floods.
  • Net distance travelled (ND) under flood events is the position of eels 5+ on the longitudinal profile of the river, which is the straight-line distance between the glass eel release point in spring 2017 and the detection point of eels in autumn 2022.

2.5. Statistical Analyses

We calculated Pearson’s correlation coefficients (r) to assess the potential relationships between the time/age after restocking and eels’ relative abundance, detection rate and cumulative TL at tagging. Relative abundance is expressed as: (the number of detected eels × 100)/(total distance scanned at each eel age). We defined the detection rate as: (the number of detected eels × 100)/(the cumulative number of eels tagged since 2017 for each eel age). We also used this coefficient to evaluate the relationships between the age after restocking and eel use of water depth, block and vegetation cover as well as between the age at tagging and the eels’ TD and HR.
We evaluated the eels’ relative abundance and detection rate between the six studied rivers as well as eel use of water depth, block and vegetation cover between the five post-restocking age classes by using Fisher’s exact test (FET). We used the nonparametric Kruskal–Wallis (KW) test and the post hoc Dunn’s test (PD) with the Bonferroni correction for multiple pairwise comparisons of mean rank sums to compare the TD, HR, EI, ND, LD and TL between the eels age groups at tagging, post-restocking age classes and recipient rivers. We used the Rcmdr 2.3.2, Hmisc and dunn.test packages of R statistical software version 3.3.2 for all statistical analyses [40,41,42]. We considered a result to be statistically significant when the estimated probability of error (p) was <0.05.

3. Results

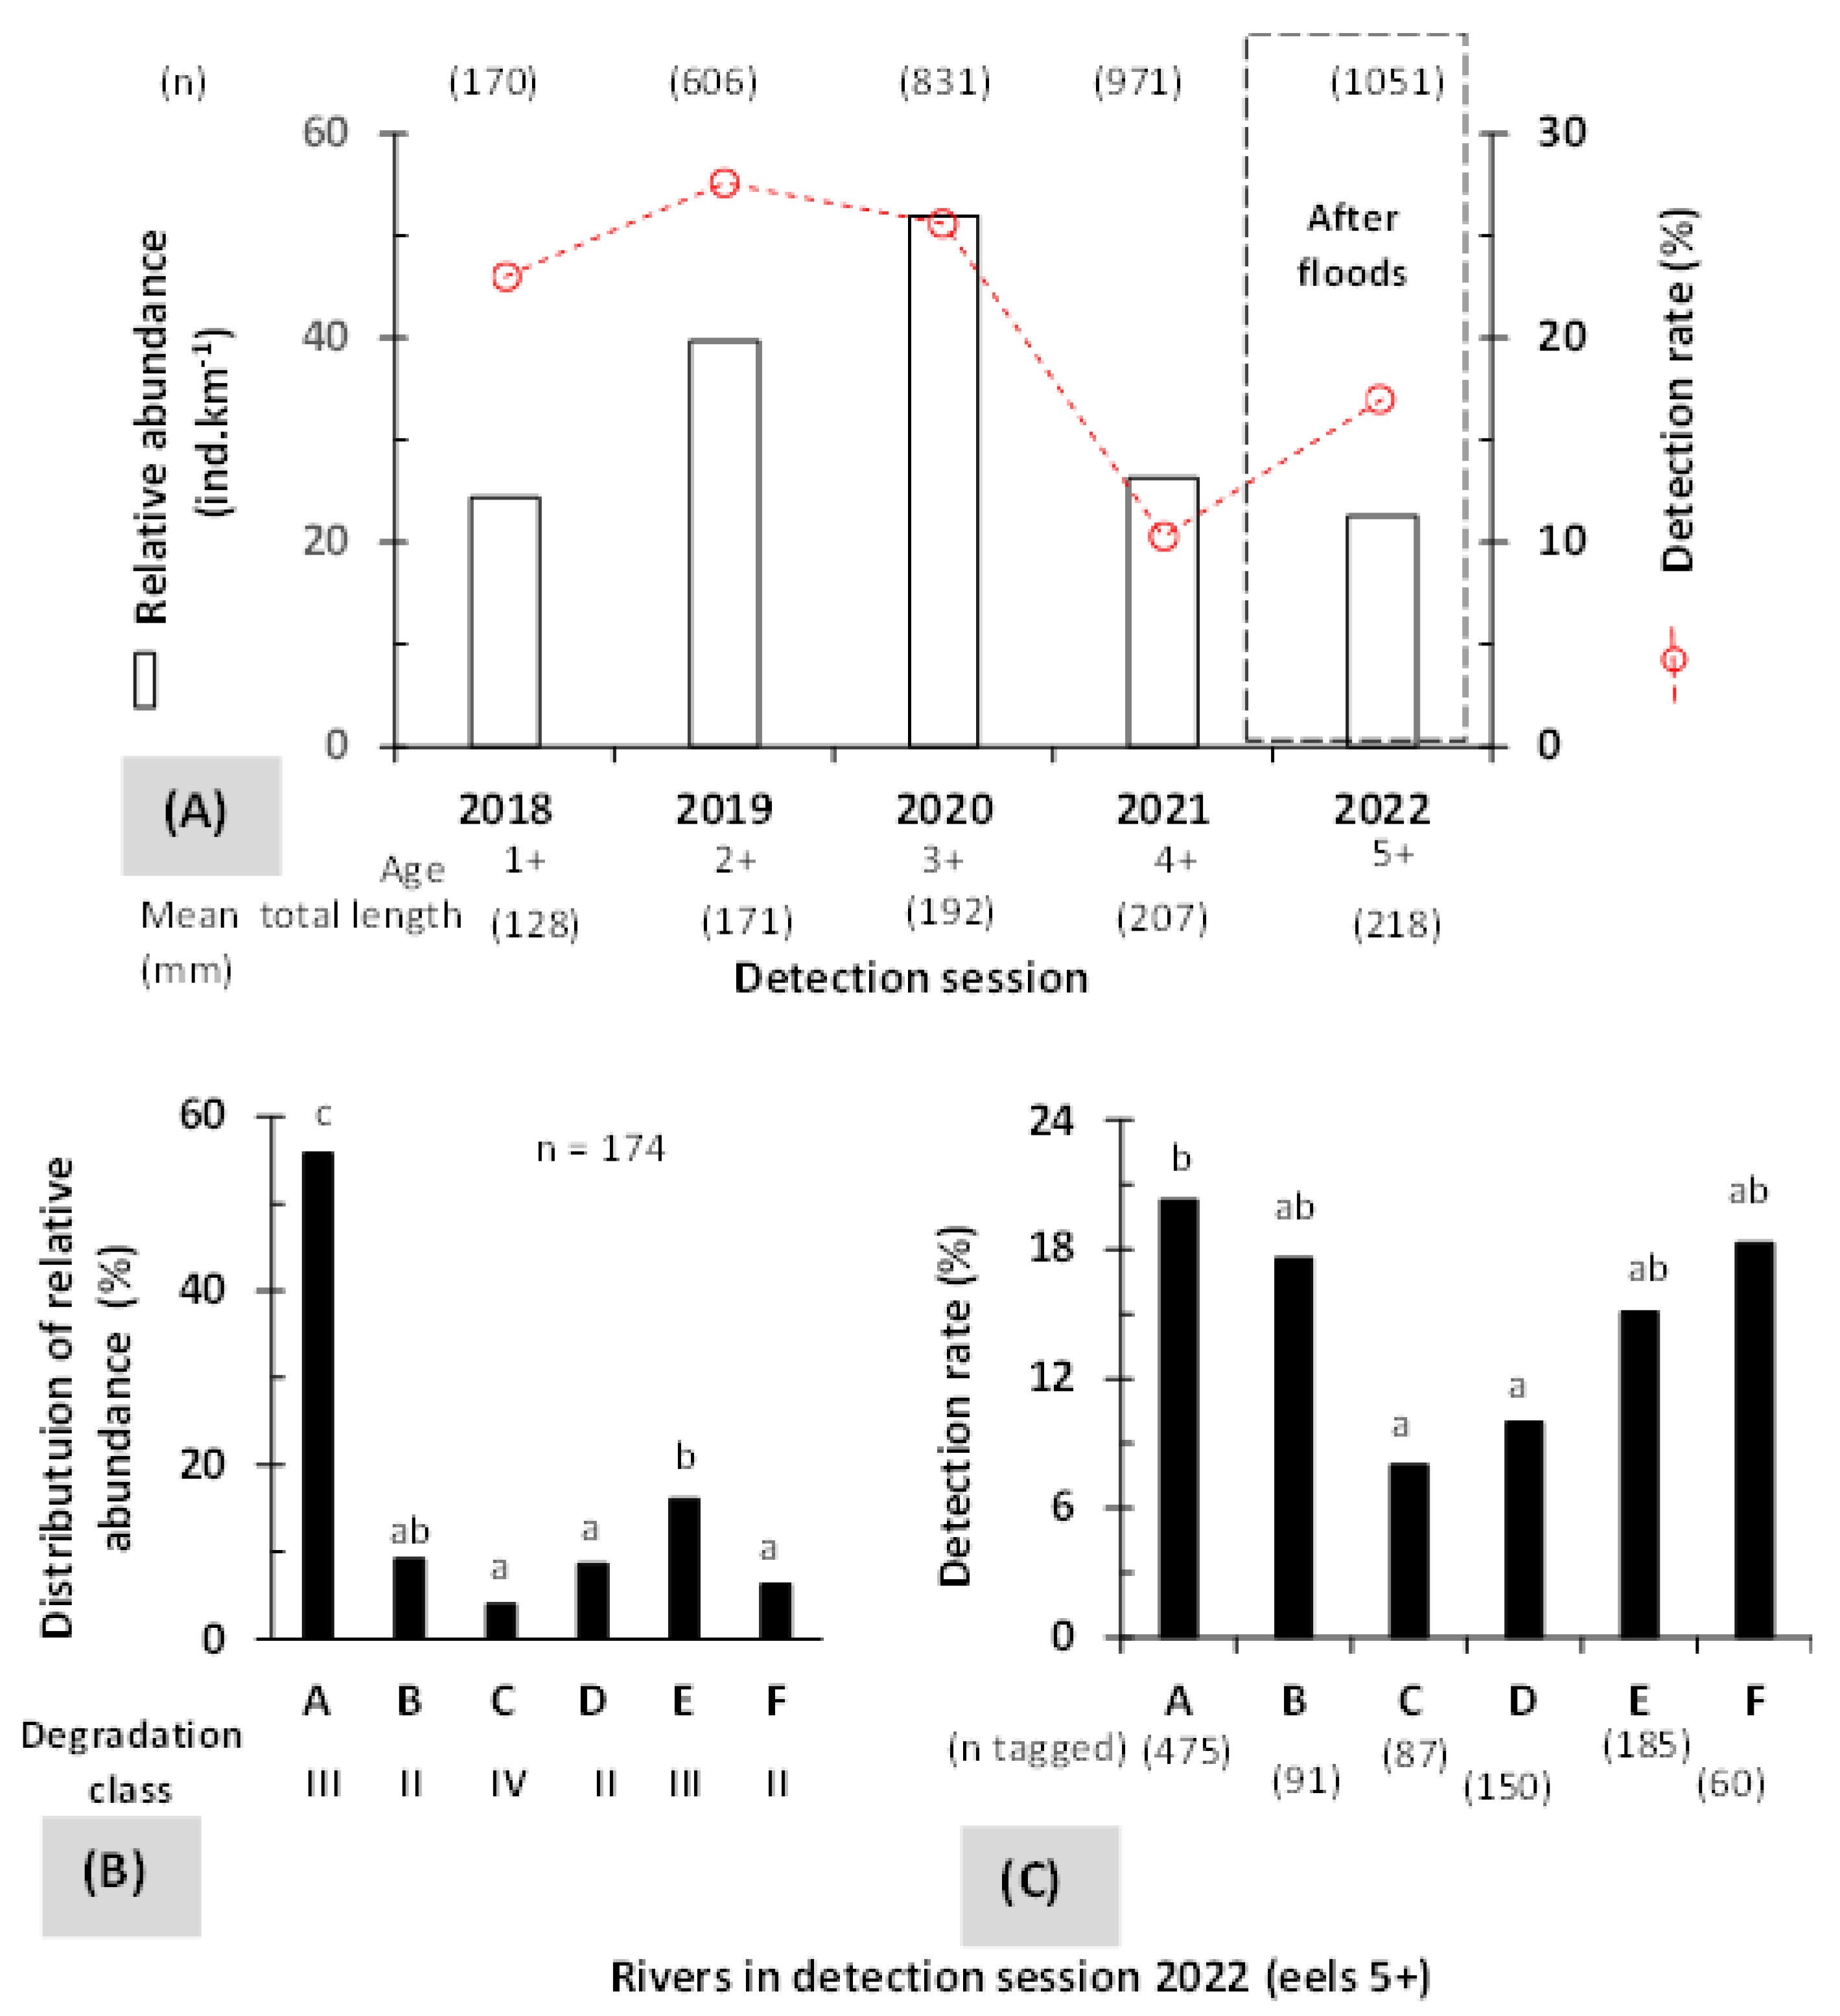
3.1. Relative Abundance and Detection Rate

Using RFID mobile telemetry based on tagged eel detection, we detected 66% of the 1051 tagged eels, corresponding to 693 eels or positions over five detection sessions performed from 2018 to 2022. The number of detected eels varied between sessions from 39 for a 1.6 km stretch of river during the 2018 session (eels 1+) to 213 for a 4.1 km stretch during the 2020 session (eels 3+). When pooling the five detection sessions, the number of eels also varied between the rivers, from 22 in river F to 387 in river A. The relative abundance and the detection rate of eels were not significantly correlated with the time/age after restocking in inland freshwaters (Pearson’s correlation coefficients: r = −0.657 to −0.214, p = 0.228 to 0.730) (Figure 2). The relative abundance varied between 23 (eels 5+, after flooding events) and 52 (eels 3+) individuals km−1, and the detection rate ranged from 10.3% (eels 4+) to 27.6% (eels 2+). The post-flooding detection rate (eels 5+) was 17%, which did not differ significantly from the detection rates of all other age groups of eels (FET, p > 0.05). In contrast, the mean cumulative TL of the eels at tagging increased over time (r = 0.961, p = 9.152 × 10⁻³), and was significantly higher for eels 5+ (TL, mean value = 218 mm, KW test: degrees of freedom [df] = 4, χ2 = 524.13, p = 2.2 × 10⁻¹⁶; PD test: p < 0.001).
We detected eels 5+ in all restocked rivers, but we found more than half of these eels in river A (FET, p = 9.007 × 10⁻¹⁵ to <2.200 × 10⁻¹⁶). The abundance and the detection rate of eels 5+ were lower in the heavily degraded river C than in the less degraded river A (FET, p = 2.367 × 10⁻² to <2.200 × 10⁻¹⁶). River C also showed a lower abundance of eels 5+ than the less degraded river E (FET, p = 2.557 × 10⁻⁴). Of the 174 eels 5+ detected, we recaptured 28.7 % (n = 50) at least once after their tagging and first detection. In addition, we recaptured 12.6% (n = 22) of eels 5+ during the autumn 2022 electrofishing session when considering a few of the most productive habitats, as identified by their high number of eels detected during the spring 2022 telemetry session, which corresponded to a total stretch of 2550 m rivers fished in autumn 2022.

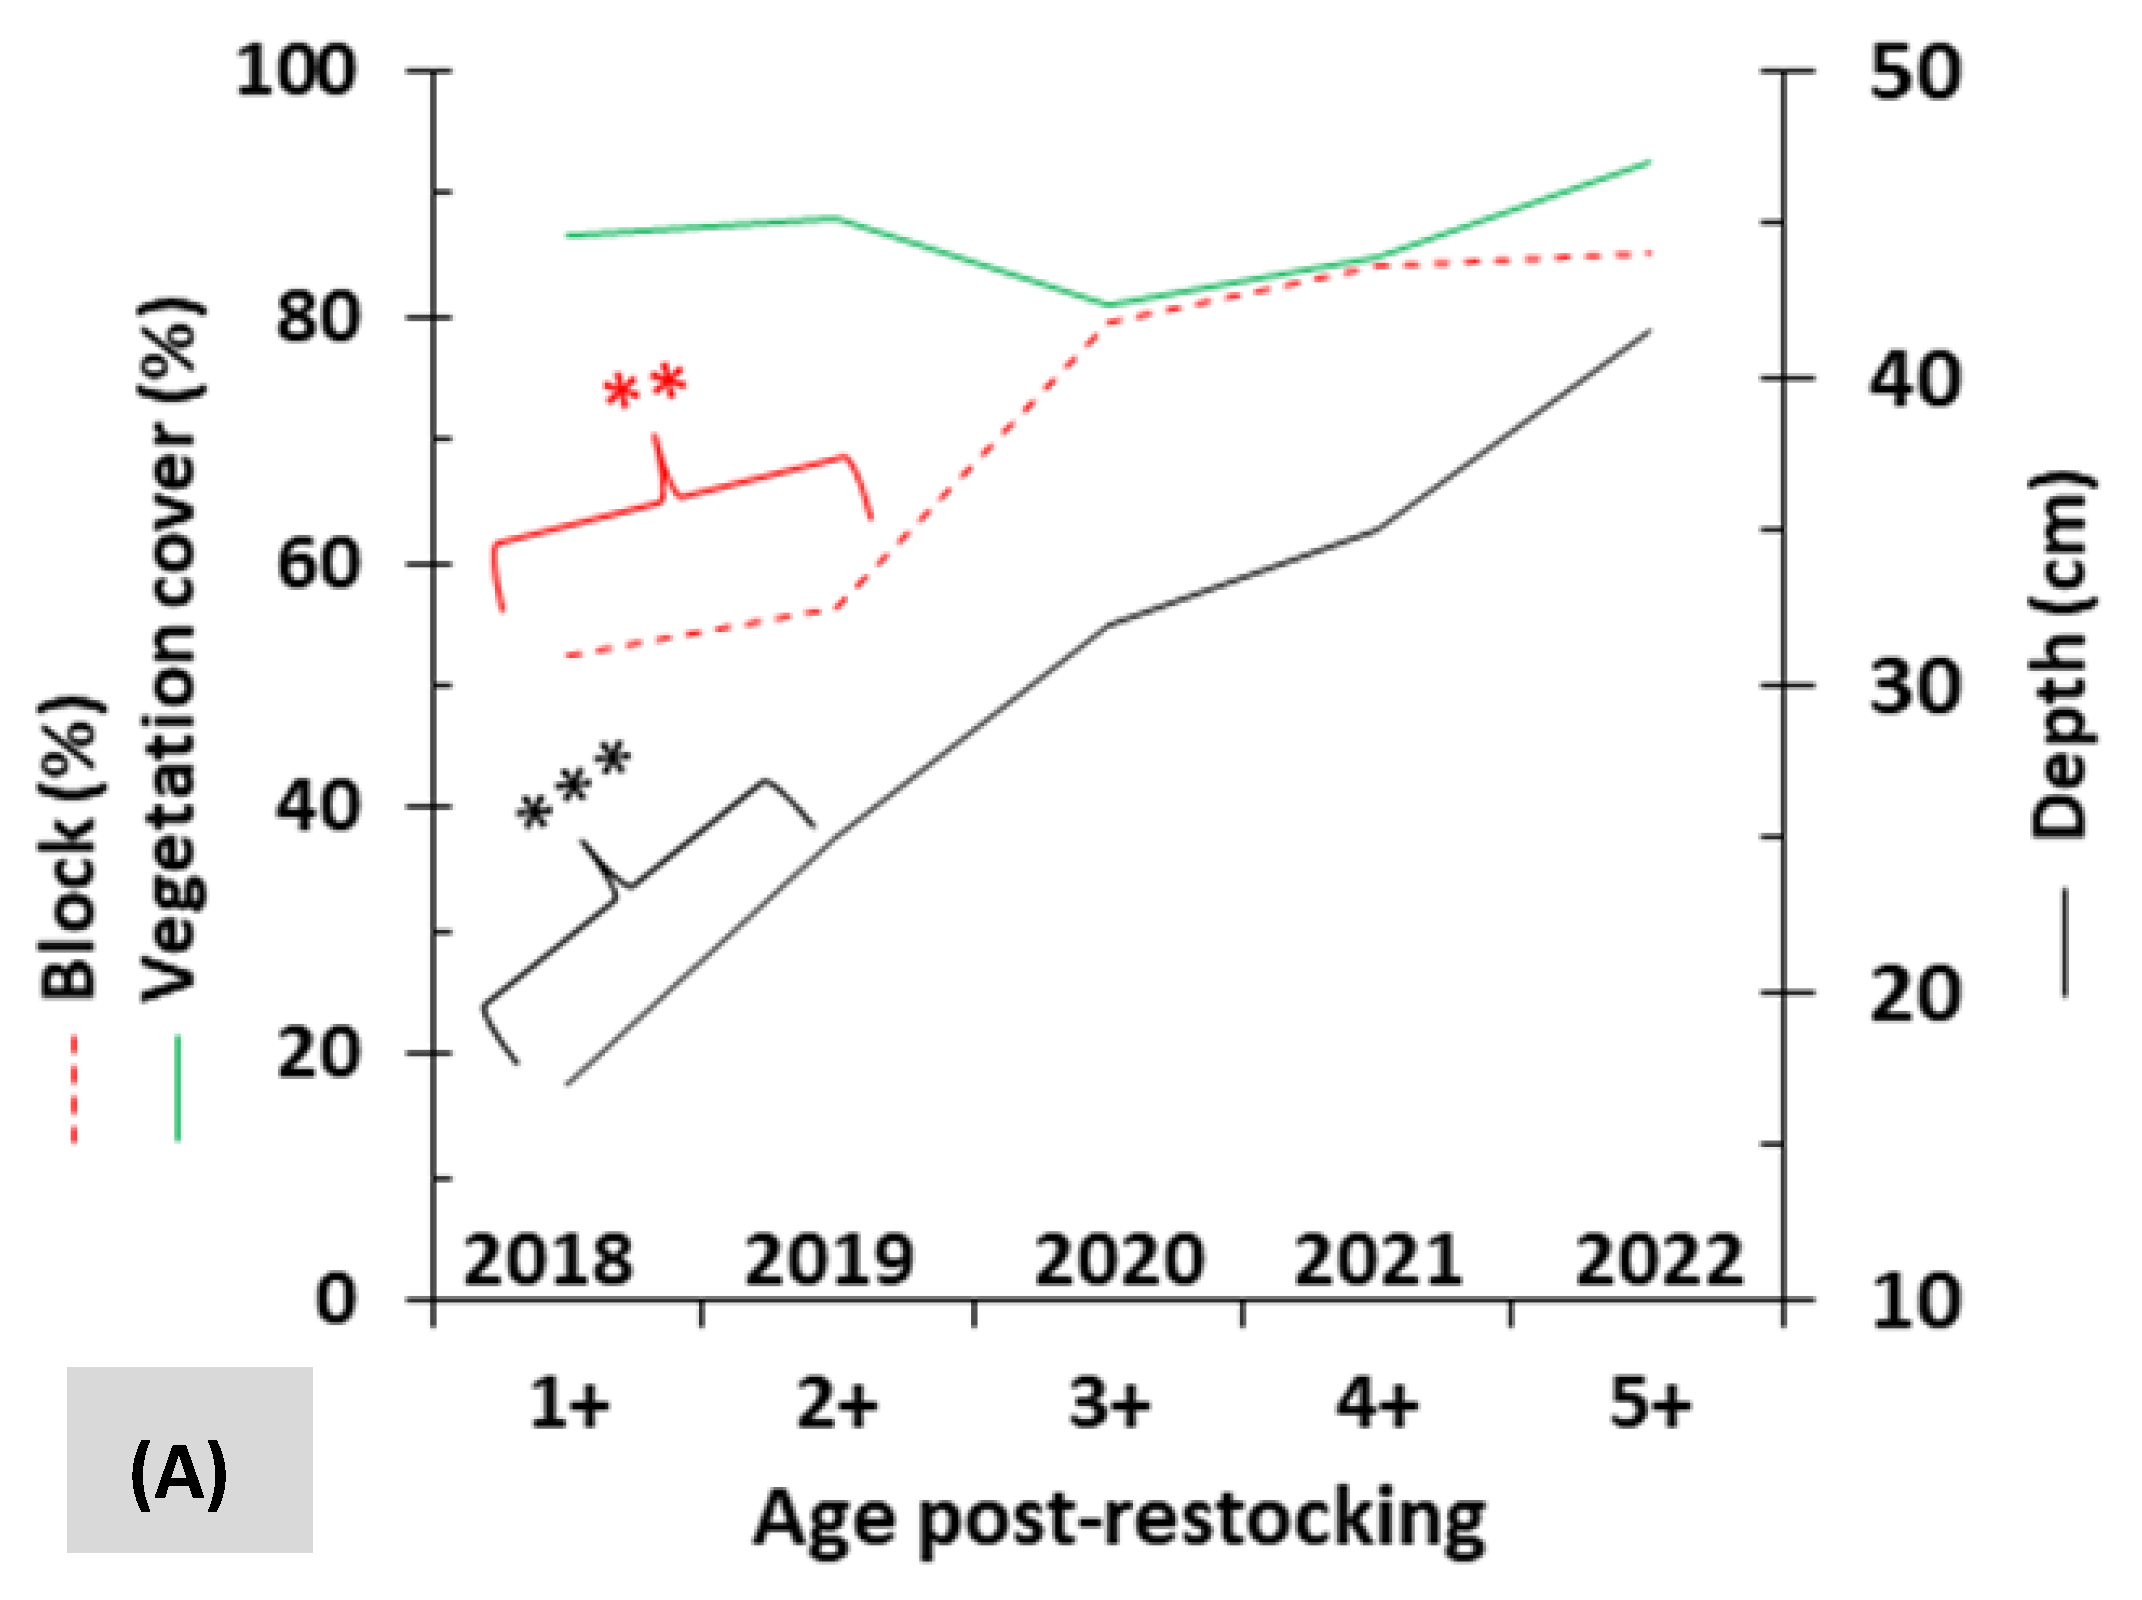
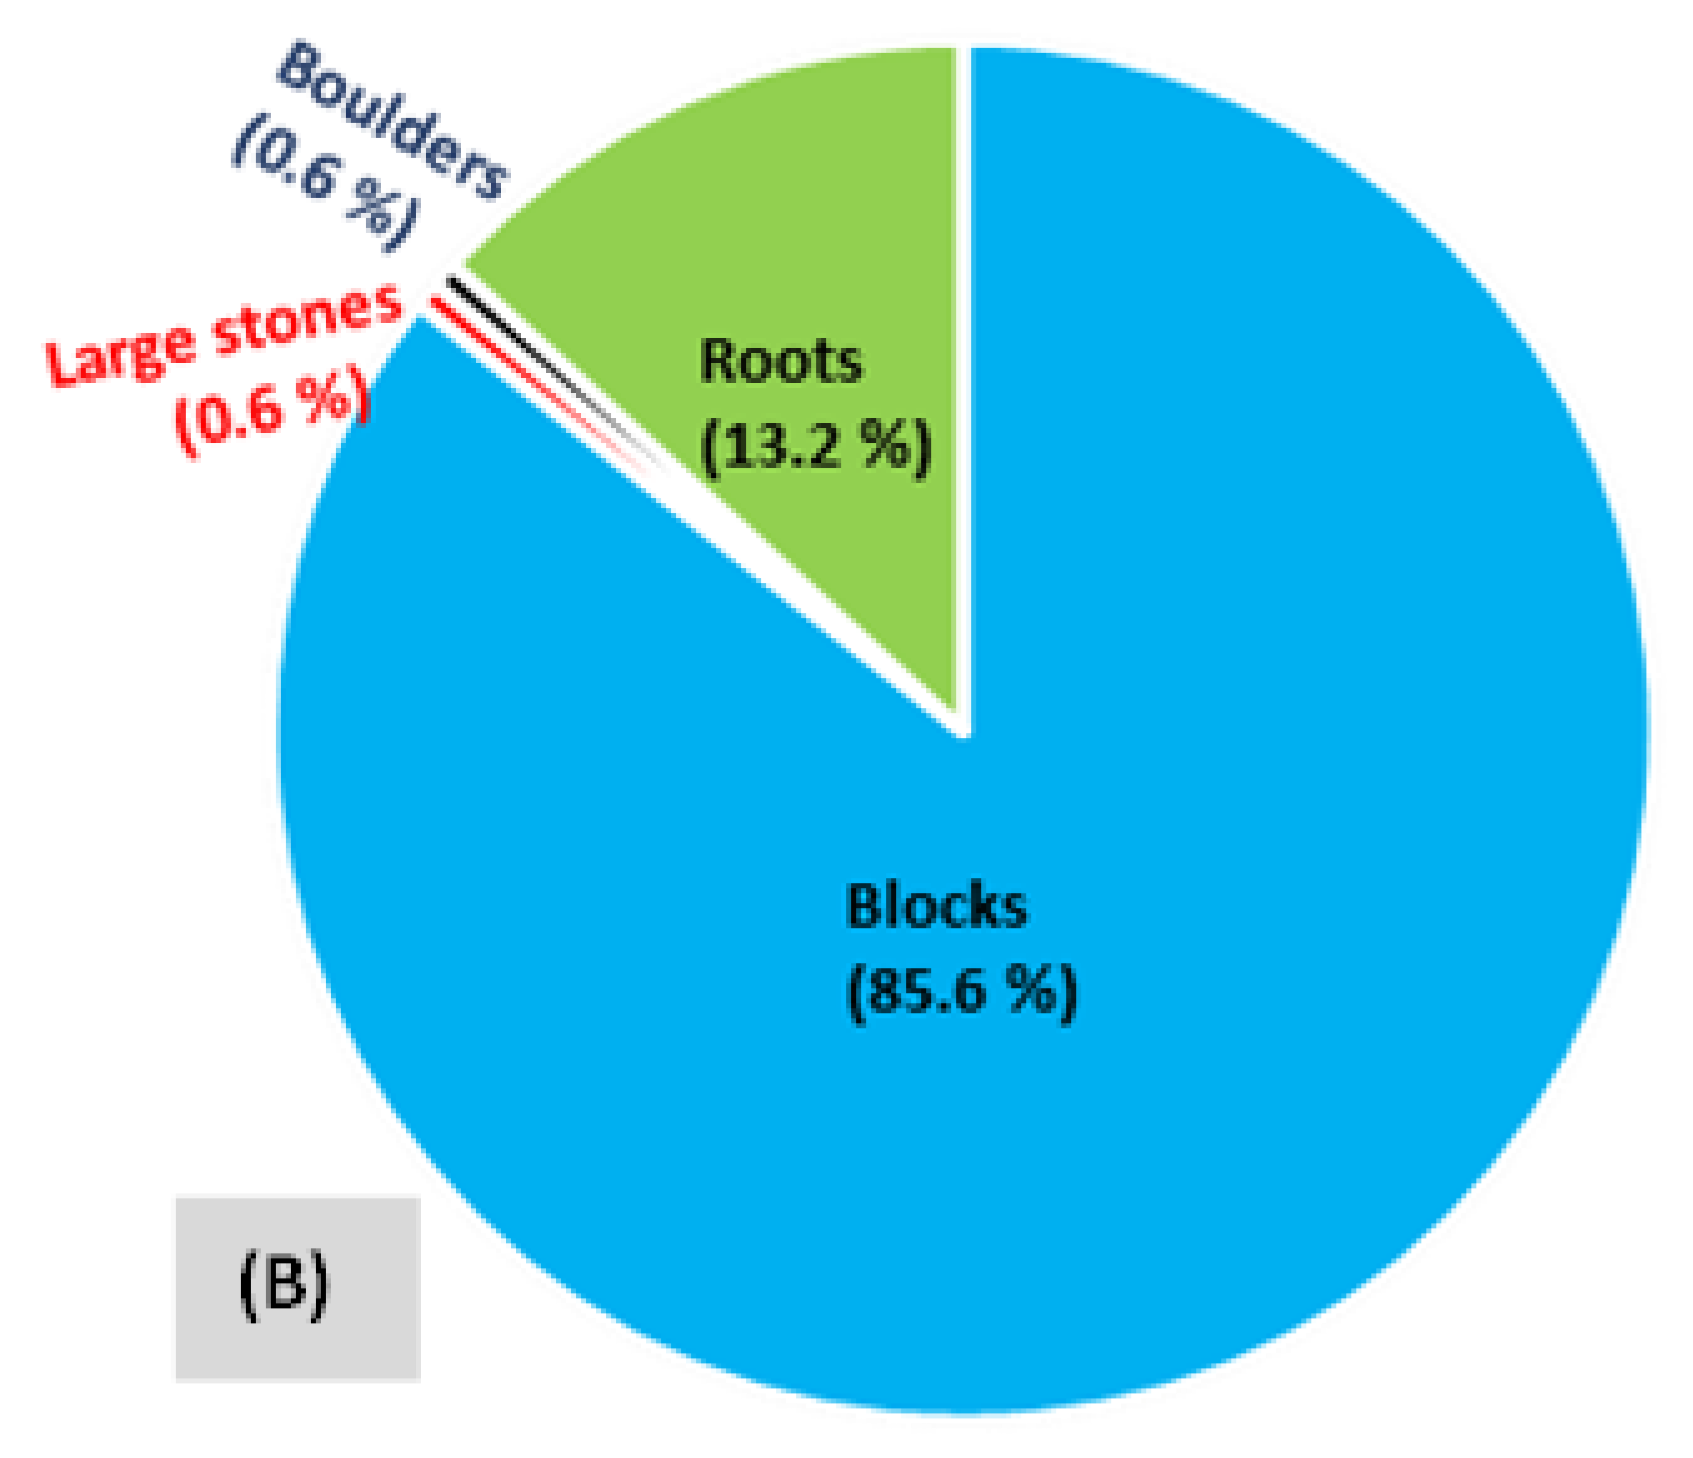
3.2. Mobility and Microhabitat Characteristics

From age 1+ to 2+ after restocking, tracked eels showed an HR similar to the TD with an EI equal to 1 (Figure 3A). From age 3+ to 5+, the HR was lower than the TD, and the EI was >1. The difference between the HR and TD was greatest at age 4+ and the EI peaked at this age, reflecting better habitat use by this age group. The difference between the HR and TD as well as the EI decreased at age 5+ (after flooding events), at which time the HR and TD were at their peak and were significantly higher than at all other ages (for the HR, KW test: df = 4, χ2 = 30.226, p = 4.403 × 10⁻⁶; PD test: p = 2.522 × 10⁻³ to 1.321 × 10⁻⁷; for TD, KW test: df = 4, χ2 = 39.642, p = 5.134 × 10⁻⁸; PD test: p = 2.522 × 10⁻³ to 1.321 × 10⁻⁷). The EI was significantly higher at age 4+ compared with the other ages (KW test: df = 4, χ2 = 88.806, p = 2.2 × 10⁻¹⁶; PD test: p = 2.141 × 10⁻⁴ to 4.678 × 10⁻¹¹). Only the TD was significantly correlated with the time/age after restocking (r = 0.926, p = 2.396 × 10⁻²).
Fine analysis of the two important mobility parameters according to age at tagging for eels 5+ revealed that both the HR and TD decreased with increasing age at eel tagging (r = −0.871, p = 4.548 × 10⁻² for HR and r = −0.915, p = 2.916 × 10⁻² for TD) (Figure 3B). Conversely, the TL increased with increasing age at eel tagging (r = 0.992, p = 7.981 × 10⁻⁴). We observed high mobility when the eels were tagged as very young individuals (eels 0+) with the smallest body sizes (for the HR, KW test: df = 4, χ2 = 30.614, p = 3.669 × 10⁻⁶; PD test: p = 7.915 × 10⁻³ to 1.662 × 10⁻³; for the TD, KW test: df = 4, χ2 = 30.496, p = 3.878 × 10⁻⁶; PD test: p = 6.420 × 10⁻³ to 1.662 × 10⁻³; for TL, KW test: df = 4, χ2 = 91.401, p < 2.2 × 10⁻¹⁶; PD test: p = 6.403 × 10⁻³ to 1.656 × 10⁻⁷), and then steadily decreased to the lowest levels at age 3+. At this age, the eels reached a mean TL of 306 mm (range, 188–571 mm). At ages 3+ and 4+, the TD was similar to the HR and there was a shift in the use of microhabitats from shallow to deep with a bottom substrate strongly dominated by blocks (Figure 4). Utilisation of deep habitats with block bottom substrates increased with age (r = 0.990, p = 1.207 × 10⁻³ for water depth and r = 0.930, p = 2.214 × 10⁻² for block uses, respectively). Eels 1+ and 2+ used shallow habitats and showed less exploitation of block-type bottom substrate than older eels (water depth, KW test: df = 4, χ2 = 120.92, p = 2.200 × 10⁻¹⁶; PD test: p = 1.035 × 10⁻⁵ to 5.041 × 10⁻¹¹; block, FET: p = 2.747 × 10⁻⁴ to 7.264 × 10⁻⁷). Compared with the other eel ages, microhabitats of eels 5+ were deeper and the bottom substrate was mainly blocks (Figure 4). We found that the deepest microhabitats consisted of submerged root substrates from riparian plants; we observed them in river B, where we recorded the lowest mobility values at each eel age (Table 2). Over time, the microhabitat of eels remained heavily covered with riparian trees (>80% of eels, each age: r = 0.350, p = 0.564) (Figure 4).

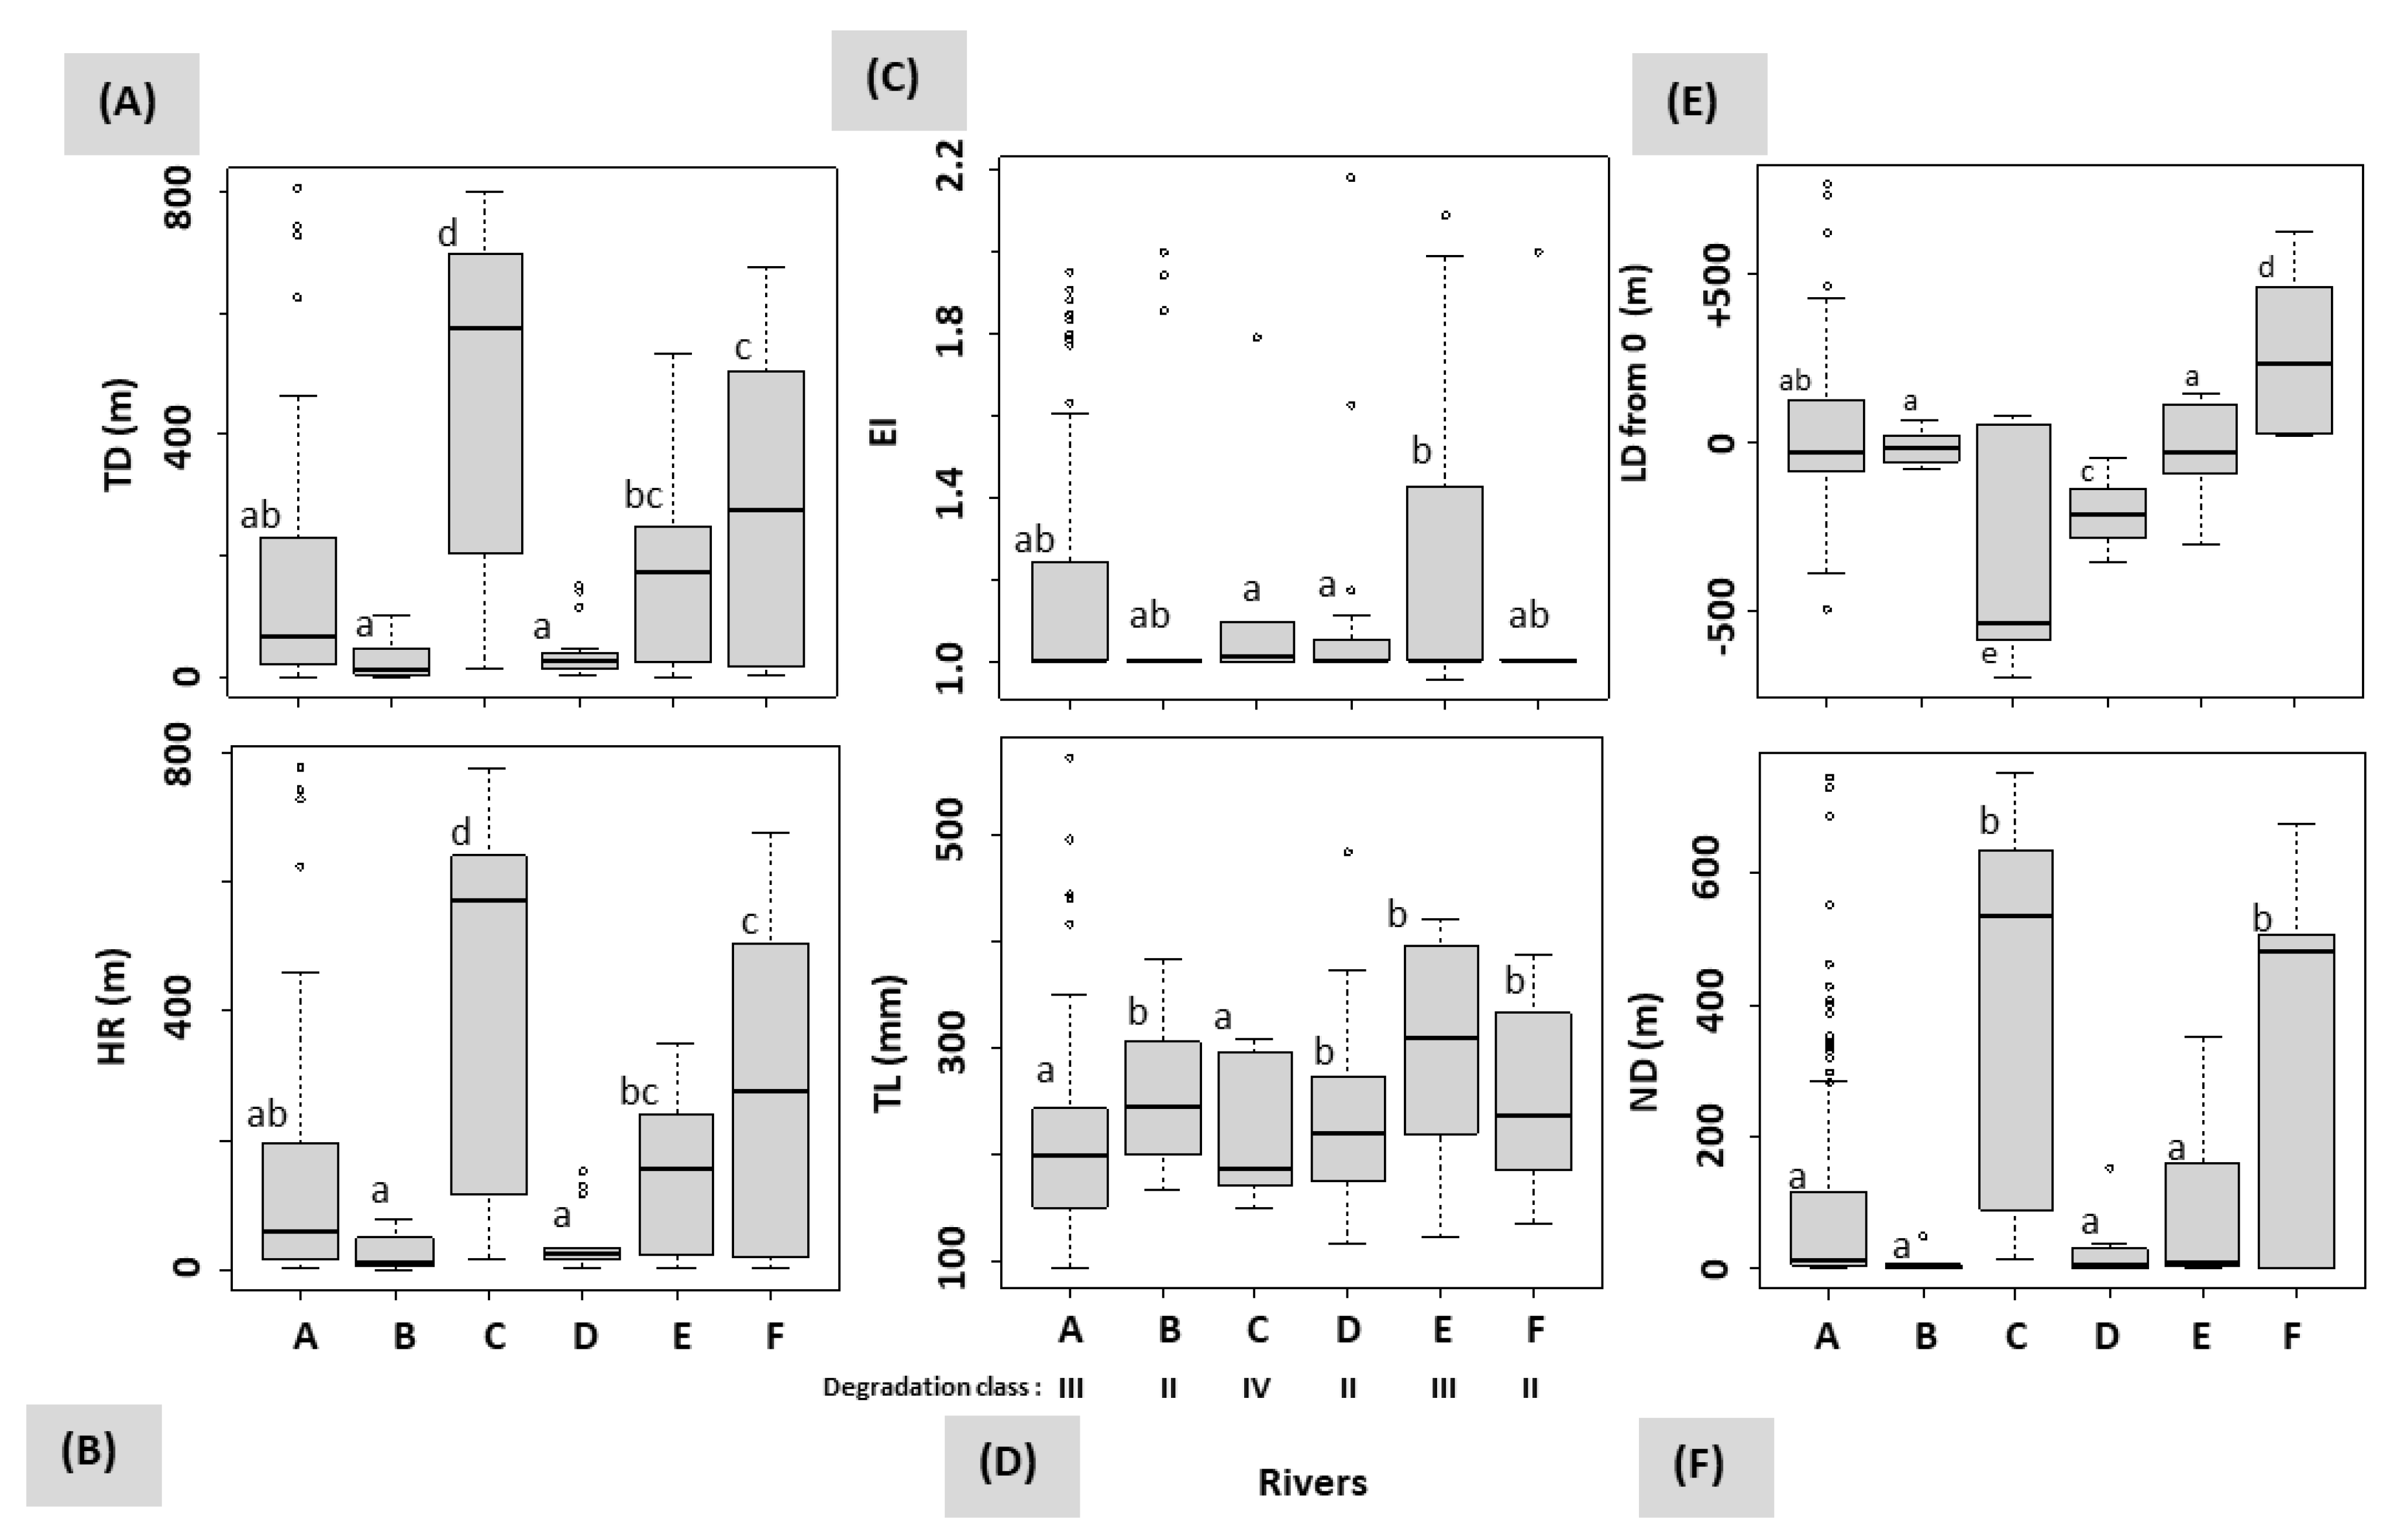
3.3. Influence of Rivers and Floods on Mobility

Recipient rivers also affected the mobility of the detected restocked eels (Figure 5, Table 2). We observed significantly higher mobility of eels in the heavily degraded river C (for the HR, KW test: df = 5, χ2 = 21.67, p = 6.049 × 10⁻⁴; PD test: p = 2.871 × 10⁻² to 4.133 × 10⁻³; for the TD, KW test: df = 5, χ2 = 22.29, p = 4.611 × 10⁻⁴; PD test: p = 4.675 × 10⁻² to 3.484 × 10⁻³). Conversely, the EI was lower in river C than in the less degraded river E (KW test: df = 5, χ2 = 88.806, p = 2.2 × 10⁻¹⁶; PD test: p = 3.418 × 10⁻²). The TL at the tagging of eels was smaller in river C than in all other rivers except river A (KW test: df = 5, χ2 = 19.936, p = 1.285 × 10⁻³; PD test: p < 0.05). ND assessed from data before and after flooding events also revealed greater movement of eels in river C than in all other rivers except F (KW test: df = 5, χ2 = 18.838, p = 2.206 × 10⁻³; PD test: p < 0.05). Many tracked eels 5+ were located downstream of the glass eel release site, point ‘0’, in all rivers except the river F. Positions of eels 5+ were further downstream in river C than those observed in all other rivers (LD, KW test: df = 5, χ2 = 33.192, p = 3.446 × 10⁻⁶; PD test: p < 0.05).

4. Discussion

Our study is original, particularly because of the studied biological material (the restocked eels), the diversity of the ecological models involving six typologically different rivers, the fact that we tagged the eels early and monitored them since their first year in freshwaters, the long duration of the study (6 years after restocking as glass eels), the cross-referencing of telemetry data with those of several electrofishing monitoring campaigns, and the impact of flooding events during the summer of 2021, which were greatly destructive for fish habitats in the rivers. The study has provided new insights into the behaviour and habitat use of eels during their first years of the continental life phase. We have shown the occurrence, the mobility and the microhabitat preference of the restocked eels in a wide diversity of upland riverine ecosystems, and even when habitats were degraded by flooding events. Given the context of the drastic decline in the upstream natural colonisation process of wild eels, glass eel restocking practice in upland rivers can be deemed an original solution as well as a source of hope for countries further from the sea and located within the species’ natural distribution area [9,10,28]. This practice can enhance the local eel stocks and probably, in the long term, increase silver eel escapement rates through greater contribution of upland freshwaters to the production of restocked-origin silver eels [7,8,9,10,11,12].
Based on the detection performance achieved in 2022—174 eels 5+ detected from a 7.7 km stretch of rivers and a 17% detection rate—our tracking method as well as our restocking technique of releasing glass eels in inland freshwaters has provided detailed insights on eel behaviour in the investigated rivers. Mobile RFID telemetry has been adapted to search for restocked eels that have been tagged and dispersed over years, including after extreme flooding events. Although this methodology is very tedious, it appears to be effective in terms of sustained long-term monitoring, but it does not allow very long movements to be highlighted. Our high recapture levels—28.7% after both eel tagging and their first detection, and 12.6% after the last detection session in 2022—reinforce the reliability of our data and therefore the validity of this telemetry study. These recapture levels could increase further if we were to fully fish the scanned areas. We carried out recaptures on very short sections of rivers (e.g., 2.6 km stretches of rivers fished in autumn 2022), which were much lower than the sections scanned during the telemetry sessions (7.7 km stretches of rivers scanned in spring 2022). The detection rate (17%) in this study is within the upper performance limits associated with the use of the capture-mark-recapture technique (recapture rates of 0–18.5% [24,43,44,45,46]). This high performance could be associated with the possibility offered by mobile telemetry to detect all tagged eels, both mobile and immobile buried under substrates, present in the scanned areas. In contrast, our detection rate is lower than those mentioned in other telemetry studies that used fixed antennas (27.6–37.5% [23,46]). Fixed antennas were continuously active and detected mobile wild yellow eels during their active phase of upward colonisation from the sea. The mobile antenna used in this study detected eels only during the daytime when users were available. This could suggest the usefulness of combining these two telemetry systems to gain more information on the eel’s biology and ecology such as movement, behaviour, habitat use, lifespan and downstream migration phenology during its continental phase. Above all, fixed antennas would make it possible to highlight the eels that leave the studied aquatic ecosystems, unlike radiotelemetry, which is more effective for studying qualitative behavioural traits. For a discreet fish with cryptic behaviour, mobile RFID telemetry is beneficial for shallow rivers accessible by foot, but not beneficial for deep rivers where it can be replaced by radiotelemetry. Radiotelemetry offers the advantage of continuous detection over a long distance, but it has the disadvantage of high equipment cost, the impossibility of tagging eels early and a shorter duration [39].
We did not detect >80% of tagged eels in 2022. There are several hypotheses for this non-detection, including that there is eel movement to areas far from the scanned sectors, to seek more productive cryptic habitats favourable for their survival, growth and fat accumulation for future downstream migration towards the sea. The flood events of 14–16 July 2021 destroyed fish habitats, possibly causing displacement and/or emigration of eels to seek new shelters after modification/destruction of their habitats. Another reason could be the very low detection range (maximum of 33 cm) of the mobile RFID telemetry system used, limiting the detection of eels deeply buried in cavities and shelters [12,28]. Predation by piscivorous fish and birds and eel removal by illegal fishing may have also caused eel mortality and therefore tagged eel loss [47,48,49]. Even if it is very unlikely, the loss of tags and their displacement far from the scanned area is another possible explanation for the non-detection of tagged eels [50,51].
Despite the destructive flooding events of fish habitats that occurred in July 2021 during the 6-year study period, there was an absence of any significant relationships between the time/age and the relative abundance or the detection rate of eels after restocking. This could reveal the good quality of the host riverine ecosystems in this study: these rivers may offer eels effective shelter during extreme flow events. It could also be considered a sign of strong species resilience after catastrophic events such as floods that have severely altered rivers. This is supported by the lack of significant differences in the detection rate before and after the flood events. We observed eels 5+ in all the restocked rivers despite typological differences in terms of their post-flooding habitat degradation classes and water physicochemical and hydromorphological characteristics. This suggests that the species has a good ability to colonise a wide range of continental aquatic ecosystems and to live in upstream riverine environments, even when habitats are degraded by flood events. This strong species resilience would be favoured by very rapid exploitation of a new available aquatic environment and easy use of cryptic substitute microhabitats. Moreover, the floods occurred during the developmental stage where the species displays very cryptic life habits and hides in narrow cavities between blocks [52], which could have contributed to reducing the intensity of individual dispersal. Some eels have demonstrated ecological flexibility in terms of habitat use. These eels have gone from using a microhabitat consisting of the assembly of blocks (the situation before the floods) to a microhabitat consisting of roots located in the under-banks (after the floods). In addition, by detecting more than half of eels 5+ in the same river, we have revealed the characteristics of the habitat suitable for this stage as well as for the species. These results provide insights regarding the macrohabitat/river types that should be favoured during restocking operations to obtain maximum eel recruitment. According to Helfman et al. [53], flexibility in habitat use is a quality that has facilitated the wide geographic distribution of the species. However, high abundance in rivers has demonstrated that eels also exhibit specific microhabitat preferences and requirements [54]. Factors that determined habitat selection in this study include abiotic characteristics such as habitat heterogeneity, water depth and pH, substrate roughness and vegetal cover, and biotic characteristics such as age, body size, prey availability and the threat of predation [9,54,55,56,57,58].
Thanks to long-term tracking, we have accurately determined the age at which the TD became larger than the HR, namely, 3+. This information could indicate the age from which there is better exploitation of habitat resources like spaces and foods and, therefore, the beginning of the sedentary lifestyle of the restocked eels. Eels 3+ post-restocking had a mean TL of 306 mm, which can also be considered the mean body size at which there is acquisition of sedentary lifestyle. This length is in the range (230–350 mm) of body size reported using the mark-recapture method in the wild eels of a Mediterranean river in southern Europe during the process of acquiring a sedentary lifestyle [59]. After age 3+, eels became resident or sedentary individuals, as revealed by the highest EI (Figure 3A), and they had high site fidelity as revealed by the low mobility observed in eels tagged at age 4+ (Figure 3B). Home-site fidelity is a behaviour commonly observed in large wild eels [38,39,46]. The complex process of site fidelity involves physiological and ethological changes leading to the development of a sensory system able to unequivocally recognise their own territory [60,61]. Eel sedentarisation offers the benefit of a significant bioenergetic gain due to a reduction in mobility and better resource use (space and trophic). This leads to better accumulation of fats needed for the return migration for reproduction at sea. At age 3+, an eel begins to reach a large size and its energy demand increases, with a shift from a diet based on macroinvertebrates to one based on fish [56,62,63,64]. An eel also develops more cryptic behaviour, requiring habitats that are more adapted to this behaviour and to better hiding its morphology as its body length increases. Habitat use changes with ontogenetic stage: small eels exhibit strong habitat selection that favours habitats with low water velocity and depth [11,57,58]. All these factors could explain why large eels mostly occupy deeper habitats with vegetal cover and blocks as the bottom substrate. With increasing occupation of deep areas, shallow areas are freed up by older eels. These findings have strong management implications in terms of successive restocking events, as the liberated areas/habitats by sedentary yellow eels could once again host new glass eels. From the standpoint of restocking management strategy, this means, according to our experimental conditions, that an aquatic environment could accommodate a new cohort of glass eels from a new restocking operation as early as 4 years after the release of the previous glass eel cohort. Such a restocking management plan should lead to the production of eel stocks that are well-structured in body size as well as to the optimal occupation of the aquatic space resource during eel restocking operations.
As the age of the eels increased, their mobility decreased. This is an important observation that should be considered when studying the colonisation fluxes, movements, migrations and habitat use of the species during its continental life phase [23,46]. Consequently, early eel tagging during the first 2 years (eels 0+ and 1+) after restocking glass eels would be scientifically beneficial and strongly recommended. However, the tag-to-body weight ratio must not exceed 2% to ensure the eels’ welfare [36]. Early eel tagging would provide more useful information about the above-mentioned topics than late eel tagging carried out from 4 years of age (eels 3+) when individuals become sedentary. Otherwise, based on the differences in the intensity of mobility parameters between the rivers, we consider that the typology, attractiveness and carrying capacity of recipient rivers influence the movement of eels.
The dominant downstream position observed in eels 5+ showed that flooding events had also affected the restocked eel mobility. In riverine ecosystems, differences in mobility as well as in eel abundance are caused by different abiotic factors (habitat availability, typology of rivers in terms of hydromorphology, physicochemistry, catastrophic weather events and food resources), and biotic factors (fish population density and intra- and inter-specific competition) [9,39]. There was significantly higher mobility of eels in river C, which had been heavily degraded by the floods. Flood action on fish habitat alteration in the studied part of the river C was aggravated by the inappropriate civil engineering interventions that occurred directly in the riverbed to repair the destroyed banks with its riparian vegetation cover, which is nevertheless useful for fish habitat. These interventions also caused the loss of fish habitat diversity by standardising the bottom substrate through loss of blocks in favour of fine-grained materials and by homogenising the flow and water depth, which impede good burial for this cryptic eel stage. This loss of habitat heterogeneity has likely forced eels to move long distances to find new functional habitats such as novel cryptic shelters that are favourable for survival and growth [38]. This could explain the low values of the EI and relative abundance as well as the very high values of the mobility parameters (TD, HR, ND and LD) reported in the highly degraded river C. All of these findings confirm what has already been reported: habitat loss, alteration and access are major threats to eels [54,65,66].

5. Conclusions

Our study provides new insights into eel biology and ecology during its continental life phase. We have demonstrated the ecological flexibility/plasticity of eels regarding habitat use and their great capacity for resilience, particularly in restocked eels after habitat destruction episodes such as floods. Ecological flexibility and high resilience could be necessary for eels colonising continental waters wherein catastrophic events such as flooding that destroy fish habitats may become frequent due to global warming. The eel is a hardy fish species, which can tolerate aquatic conditions that few other species can survive [67]. We have identified the post-restocking age for eel sedentary stage initiation, which could serve as the duration between two glass eel release cohorts in rivers to implement more effective conservation strategies that effectively enhance local eel stocks. We have also identified the ideal macro- and micro-habitat at each age of the species for a 6-year study period (2017–2022), which could be favoured when selecting rivers to restock to achieve high eel recruitment. The carrying capacity of a river and the quality and heterogeneity of fish habitats play a key role in the mobility and abundance of eels. Consequently, any alteration and/or destruction of aquatic ecosystems should be accompanied by habitat restoration measures [12,16,56]. In the case of the eels in our study, these measures should relate to the supply of new shelters to compensate for lost blocks and to riverbank restoration with revegetation actions to restore the altered riverbank and lost riparian plants that provide vegetal cover for fish habitats. These scientific achievements could help to improve management plans for the species.

Author Contributions

B.N.M. and M.O. designed the restocking experiments, participated in electrofishing and telemetry sessions, analysed the data, performed the statistical analyses and wrote the manuscript; X.R. and F.D. helped in the restocking experiments design, data analysis and manuscript revision; L.B., G.D., G.A. and A.A.O. participated in the telemetry sessions and helped in the data analysis; J.-P.B., A.D., J.G. and S.R. helped in the capture and tagging of restocked eels during electrofishing sessions and the manuscript revision. All authors have read and agreed to the published version of the manuscript.

Funding

This research was funded by the ‘Definition of the scientific and technical bases for an optimisation and evaluation of the efficiency of European glass eel (Anguilla anguilla) restocking practices’ project financially supported by the European Maritime Affairs and Fisheries Fund and the Wallonia Public Service, grant number FEAMP No. 44-1604-008.

Data Availability Statement

The data applied in this study will be available upon request with permission from the corresponding author.

Acknowledgments

The authors sincerely thank the Editor in Chief, the Special Issue Editor and the three anonymous reviewers, whose valuable comments helped us to improve the quality of this manuscript.

Conflicts of Interest

The authors declare no conflict of interest.

References

  1. Pedersen, M.I. Long-term survival and growth of stocked eel, Anguilla anguilla (L.), in a small eutrophic lake. Dana 2000, 12, 71–76. [Google Scholar]
  2. Prigge, E.; Marohn, L.; Hanel, R. Tracking the migratory success of stocked European eels Anguilla anguilla in the Baltic Sea. J. Fish Biol. 2013, 82, 686–699. [Google Scholar] [CrossRef] [PubMed]
  3. Simon, J.; Dörner, H.; Scott, R.D.; Schreckenbach, K.; Knösche, R. Comparison of growth and condition of European eels stocked as glass and farm sourced eels in lakes in the first four years after stocking. J. Appl. Ichthyol. 2013, 29, 323–330. [Google Scholar] [CrossRef]
  4. Desprez, M.; Crivelli, A.J.; Lebel, I.; Massez, G.; Gimenez, O. Demographic assessment of a stocking experiment in European eels. Ecol. Freshw. Fish 2013, 22, 412–420. [Google Scholar] [CrossRef]
  5. Pedersen, M.I.; Rasmussen, C.H. Yield per recruit from stocking two different sizes of eel (Anguilla anguilla) in the brackish Roskilde Fjord. ICES J. Mar. Sci. 2016, 73, 158–164. [Google Scholar] [CrossRef] [Green Version]
  6. Kullmann, B.; Thiel, R. Bigger is better in eel stocking measures? Comparison of growth performance, body condition, and benefit-cost ratio of simultaneously stocked glass and farmed eels in a brackish fjord. Fish. Res. 2018, 205, 132–140. [Google Scholar] [CrossRef]
  7. Félix, P.M.; Costa, J.L.; Monteiro, R.; Castro, N.; Quintella, B.R.; Almeida, P.R.; Domingos, I. Can a restocking event with European (glass) eels cause early changes in local biological communities and its ecological status? Glob. Ecol. Conserv. 2020, 21, e00884. [Google Scholar] [CrossRef]
  8. Félix, P.M.; Costa, J.L.; Quintella, B.R.; Almeida, P.R.; Monteiro, R.; Santos, J.; Portela, T.; Domingos, I. Early settlement and growth of stocked European glass eels in a fragmented watercourse. Fish. Manag. Ecol. 2020, 28, 91–100. [Google Scholar] [CrossRef]
  9. Nzau Matondo, B.; Benitez, J.P.; Dierckx, A.; Renardy, S.; Rollin, X.; Colson, D.; Baltus, L.; Romain, V.R.M.; Ovidio, M. What are the best upland river characteristics for glass eel restocking practice? Sci. Total Environ. 2021, 784, 147042. [Google Scholar] [CrossRef]
  10. Nzau Matondo, B.; Delrez, N.; Bardonnet, A.; Vanderplasschen, A.; Joaquim-Justo, C.; Rives, J.; Benitez, J.P.; Dierckx, A.; Séleck, E.; Rollin, X.; et al. A complete check-up of European eel after eight years of restocking in an upland river: Trends in growth, lipid content, sex ratio and health status. Sci. Total Environ. 2022, 807, 151020. [Google Scholar] [CrossRef]
  11. Ovidio, M.; Tarrago-Bès, F.; Nzau Matondo, B. Short-term responses of glass eels transported from UK to small Belgian streams. Ann. Limnol. Int. J. Limnol. 2015, 51, 219–226. [Google Scholar] [CrossRef] [Green Version]
  12. Nzau Matondo, B.; Séleck, E.; Dierckx, A.; Benitez, J.-P.; Rollin, X.; Ovidio, M. What happens to glass eels after restocking in upland rivers? A long-term study on their dispersal and behavioural traits. Aquat. Conserv. Mar. Freshw. Ecosyst. 2019, 29, 374–388. [Google Scholar] [CrossRef]
  13. Tesch, F.W.; Thorpe, J.E. The Eel, 3rd ed.; Blackwell Science: Oxford, UK, 2003. [Google Scholar]
  14. Wright, M.R.; Piper, A.T.; Aarestrup, K.; Azevedo, J.M.N.; Cowan, G.; Don, A.; Gollock, M.; Ramallo, R.S.; Velterop, R.; Walker, A.; et al. First direct evidence of adult European eels migrating to their breeding place in the Sargasso Sea. Sci. Rep. 2022, 12, 15362. [Google Scholar] [CrossRef] [PubMed]
  15. Hanel, R.; Marohn, L.; Westerberg, H. No new evidence for anAtlantic eels spawning area outside the Sargasso Sea. Sci. Rep. 2022, 12, 11778. [Google Scholar] [CrossRef]
  16. Feunteun, E. Management and restoration of European eel population (Anguilla anguilla): An impossible bargain. Ecol. Eng. 2002, 18, 575–591. [Google Scholar] [CrossRef]
  17. Robinet, T.; Feunteun, E. Sublethal effects of exposure to chemical compounds: A cause for the decline in Atlantic eels? Ecotoxicology 2002, 11, 265–277. [Google Scholar] [CrossRef]
  18. Haenen, O.L.M.; Mladineo, I.; Konecny, R.; Yoshimizu, M.; Groman, D.; Munoz, P. Diseases of eels in an international perspective: Workshop on eel diseases at the 15th international conference on the diseases of fish and shellfish, Split, Croatia, 2011. Bull. Eur. Assoc. Fish Pathol. 2012, 32, 109–115. [Google Scholar]
  19. Muñoz, P.; Barcala, E.; Peñalver, J.; Romero, D. Can inorganic elements affect herpesvirus infections in European eels? Environ. Sci. Pollut. Res. 2019, 26, 35266–35269. [Google Scholar] [CrossRef]
  20. Delrez, N.; Zhang, H.; Lieffrig, F.; Mélard, C.; Farnir, F.; Boutier, M.; Donohoe, O.; Vanderplasschen, A. European eel restocking programs based on wild-caught glass eels: Feasibility of quarantine stage compatible with implementation of prophylactic measures prior to scheduled reintroduction to the wild. J. Nat. Conserv. 2021, 59, 125933. [Google Scholar] [CrossRef]
  21. Haro, D.; Gollock, M. Anguilla anguilla. The IUCNRed List of Threatened Species. Version 2014.2. 2014. Available online: www.iucnredlist.org (accessed on 28 May 2013).
  22. Ibbotson, A.; Smith, J.; Scarlett, P.; Aprahamian, M.W. Colonisation of freshwater habitats by the European eel Anguilla anguilla. Freshw. Biol. 2002, 47, 1696–1706. [Google Scholar] [CrossRef]
  23. Nzau Matondo, B.; Ovidio, M. Decreased stock entering the Belgian Meuse is associated with the loss of colonisation behaviour in yellow-phase European eels. Aquat. Living Resour. 2018, 31, 7. [Google Scholar] [CrossRef]
  24. Baras, E.; Philippart, J.C.; Salmon, B. Estimation of migrant yellow eels stock in large rivers through the survey of fish passes: A preliminary in the River Meuse (Belgium). In Stock Assessment in Inland Fisheries; Cowx, I.G., Ed.; Oxford Fishing News Books (Blackwell): London, UK, 1996; pp. 314–325. [Google Scholar]
  25. Philippart, J.C. L’érosion de la Biodiversité: Les Poissons; Université de Liège: Liège, Belgium, 2006; 306p. [Google Scholar]
  26. Philippart, J.C.; Ovidio, M.; Rimbaud, G.; Dierckx, A.; Poncin, P. Bilan des observations sur les populations de l’anguille dans les sous-bassins hydrographiques Meuse aval, Ourthe, Amblève et Vesdre; Commission provinciale de Liège du Fonds piscicole du Service Public de Wallonie: Liège, Belgium, 2010; 161p. [Google Scholar]
  27. Nzau Matondo, B.; Ovidio, M. Dynamics of upstream movements of the European eel Anguilla Anguilla in an inland area of the river Meuse over the last 20 years. Environ. Biol. Fish 2016, 99, 223–235. [Google Scholar] [CrossRef] [Green Version]
  28. Nzau Matondo, B.; Benitez, J.P.; Dierckx, A.; Rollin, X.; Ovidio, M. An evaluation of restocking practice and demographic stock assessment methods for cryptic juvenile European eel in upland rivers. Sustainability 2020, 12, 1124. [Google Scholar] [CrossRef] [Green Version]
  29. ICES. Joint EIFAAC/ICES/GFCM Working Group on Eels (WGEEL); ICES Scientific Reports: Copenhagen, Denmark, 2020; 223p. [Google Scholar]
  30. Council of the European Communities. Council regulation (EC) no 1100/207 of 18 September 2007 establishing measures for the recovery of the stock of European eel. O. J. Eur. Union 2007, 248, 17–23. [Google Scholar]
  31. Shiao, J.C.; Lozys, L.; Iizuka, Y.; Tzeng, W.N. Migratory patterns and contribution of stocking to the population of European eel in Lithuanian waters as indicated by otolith Sr:Ca ratios. J. Fish Biol. 2006, 69, 749–769. [Google Scholar] [CrossRef]
  32. Simon, J.; Dörner, H. Survival and growth of European eels stocked as glass- and farm-sourced eels in five lakes in the first years after stocking. Ecol. Freshw. Fish 2014, 23, 40–48. [Google Scholar] [CrossRef]
  33. Sadler, K. Effects of temperature on the growth and survival of the European eel, Anguilla anguilla L. J. Fish Biol. 1979, 15, 499–507. [Google Scholar] [CrossRef]
  34. Morin, A.; Lamoureux, W.; Busnarda, J. Empirical models predicting primary productivity from chlorophyll and water temperature for stream periphyton and lake and ocean phytoplankton. J. N. Am. Benthol. Soc. 1999, 18, 299–307. [Google Scholar] [CrossRef]
  35. Huet, M. Aperçu de la relation entre la pente et les populations piscicoles des eaux courantes. Schweiz. Z. Hydrol. 1949, 11, 332–351. [Google Scholar] [CrossRef]
  36. Jepsen, N.; Koed, A.; Thorstad, E.B.; Baras, E. Surgical implantation of telemetry transmitters in fish: How much have we learned? Hydrobiologia 2002, 483, 239–248. [Google Scholar] [CrossRef]
  37. Wentworth, C.K. A scale of grade and class terms for clastic sediments. J. Geol. 1922, 30, 377–392. [Google Scholar] [CrossRef]
  38. Baras, E.; Jeandrain, D.; Serouge, B.; Philippart, J.C. Seasonal variations in time and space utilization by radio-tagged yellow eels Anguilla anguilla (L.) in A Small Stream. Hydrobiologia 1998, 371/372, 187–198. [Google Scholar] [CrossRef]
  39. Ovidio, M.; Seredynski, A.; Philippart, J.C.; Nzau Matondo, B. A bit of quiet between the migrations: The resting life of the European eel during their freshwater growth phase in a small stream. Aquat. Ecol. 2013, 47, 291–301. [Google Scholar] [CrossRef] [Green Version]
  40. R Development Core Team. R: A Language and Environment for Statistical Computing. R Foundation for Statistical Computing, Vienna, Austria. 2016. Available online: https://www.R-project.org/ (accessed on 20 December 2022).
  41. Fox, J. Using the R Commander: A Point-and-Click Interface for R; Chapman and CRC Press: Boca Raton, FL, USA, 2017; Available online: http://socserv.mcmaster.ca/jfox/Books/RCommander/ (accessed on 20 December 2022).
  42. Harrell, F.E., Jr. Hmisc: Harrell miscellaneous (Version 4.1-1). Cran. 2018. Available online: http://CRAN.Rproject.org/package=Hmisc (accessed on 20 December 2022).
  43. Naismith, I.A.; Knights, B. Studies of sampling methods and of techniques for estimating populations of eels, Anguilla anguilla L. Aquac. Res. 1990, 21, 357–368. [Google Scholar] [CrossRef]
  44. White, E.M.; Knights, B. Environmental factors affecting migration of the European eel in the Rivers Severn and Avon, England. J. Fish Biol. 1997, 50, 1104–1116. [Google Scholar] [CrossRef]
  45. Pedersen, M.I. Recapture rate, growth and sex of stocked cultured eels Anguilla anguilla (L.). Bull. Français Pêche Piscic. 1998, 349, 153–162. [Google Scholar] [CrossRef] [Green Version]
  46. Nzau Matondo, B.; Benitez, J.P.; Dierckx, A.; Philippart, J.C.; Ovidio, M. Assessment of the entering stock, migration dynamics and fish pass fidelity of European eel in the Belgian Meuse River. River Res. Appl. 2017, 33, 292–301. [Google Scholar] [CrossRef]
  47. Kennedy, M.; Fitzmaurice, P. Growth and food of brown Trout Salmo trutta (L.) in Irish waters. P. Roy. Irish Acad. B 1971, 71, 269–352. [Google Scholar]
  48. Laffaille, P.; Acou, A.; Guillouet, J. The yellow European eel (Anguilla anguilla L.) may adopt a sedentary lifestyle in inland freshwaters. Ecol. Freshw. Fish 2005, 14, 191–196. [Google Scholar] [CrossRef]
  49. Oehm, J.; Thalinger, B.; Eisenkölbl, S.; Traugott, M. Diet analysis in piscivorous birds: What can the addition of molecular tools offer? Ecol. Evol. 2017, 7, 1984–1995. [Google Scholar] [CrossRef]
  50. Baisez, A. Optimisation des Suivis des Indices D’abondances et des Structure de Taille de L’anguille Européenne (Anguilla anguilla, L.) dans un Marais Endigué de la Côte Atlantique: Relations Espèce Habitat. PhD Thesis, University of Toulouse, Toulouse, France, 2001; 396p. [Google Scholar]
  51. Feunteun, E.; Acou, A.; Laffaille, P.; Legault, A. European eel (Anguilla anguilla): Prediction of spawner escapement from continental population parameters. Can. J. Fish. Aquat. Sci. 2000, 57, 1627–1635. [Google Scholar] [CrossRef]
  52. Baras, E.; Jeandrain, D. Evaluation of surgery procedures for tagging eel Anguilla anguilla (L.) with biotelemetry transmitters. Hydrobiologia 1998, 371, 107–111. [Google Scholar] [CrossRef]
  53. Helfman, G.S.; Facey, D.E.; Stanton Hales, L.; Bozeman, E.L. Reproductive ecology of the American eel. Am. Fish. Soc. Symp. 1987, 1, 42–56. [Google Scholar]
  54. Righton, D.; Piper, A.; Aarestrup, K.; Amilhat, E.; Belpaire, C.; Casselman, J.; Castonguay, M.; Díaz, E.; Dörner, H.; Faliex, E.; et al. Important questions to progress science and sustainable management of anguillid eels. Fish Fish. 2021, 22, 1–27. [Google Scholar] [CrossRef]
  55. Greene, K.E.; Zimmerman, J.L.; Laney, R.W.; Thomas-Blate, J.C. Atlantic Coast Diadromous Fish Habitat: A Review of Utilization, Threats, Recommendations for Conservation, and Research Needs; Atlantic States Marine Fisheries Commission Habitat Management: Washington, DC, USA, 2009; 68p. Available online: https://www3.epa.gov/region1/npdes/merrimackstation/pdfs/ar/AR-56.pdf (accessed on 10 January 2023).
  56. Laffaille, P.; Feunteun, E.; Baisez, A.; Robinet, T.; Acou, A.; Legault, A.; Lek, S. Spatial organisation of European eel (Anguilla anguilla L.) in a small catchment. Ecol. Freshw. Fish 2003, 12, 254–264. [Google Scholar] [CrossRef]
  57. Laffaille, P.; Baisez, A.; Rigaud, C.; Feunteun, E. Habitat preferences of different European eel size classes in a reclaimed marsh: A contribution to species and ecosystem conservation. Wetlands 2004, 24, 642–651. [Google Scholar] [CrossRef] [Green Version]
  58. Jellyman, D.J.; Arai, T. Juvenile eels: Upstream migration and habitat use. In Biology and Ecology of Anguillid Eels; Arai, T., Ed.; CRC Press: Boca Raton, FL, USA, 2016; pp. 171–191. [Google Scholar]
  59. Herrera, M.; Moreno-Valcárcel, R.; Rubio, R.D.M.; Fernández-Delgado, C. From Transient to Sedentary? Changes in the Home Range Size and Environmental Patterns of Movements of European Eels (Anguilla anguilla) in a Mediterranean River. Fishes 2019, 4, 43. [Google Scholar] [CrossRef] [Green Version]
  60. Edeline, E.; Dufour, S.; Elie, P. Proximate and Ultimate Control of Eel Continental Dispersal. In Spawning Migration of the European Eel; Van den Thillart, G., Dufour, S., Rankin, J.C., Eds.; Springer: Berlin/Heidelberg, Germany, 2009; pp. 433–461. [Google Scholar]
  61. Braithwhaite, V.A.; De Perera, B. Short-range orientation in fish: How fish map space. Mar. Fresh. Behav. Physiol. 2006, 39, 37–47. [Google Scholar] [CrossRef]
  62. Jellyman, D.J.J. Diet of two species of freshwater eel (Anguilla spp.) in Lake Pounui. New Zealand. N. Z. J. Mar. Freshwater Res. 1989, 23, 1–10. [Google Scholar] [CrossRef] [Green Version]
  63. Fjellheim, A.; Raddum, G.G. Acidification and liming of River Vikedal, western Norway. A 20 year study of responses in the benthic invertebrate fauna. Water Air Soil Pollut. 2001, 130, 1379–1384. [Google Scholar] [CrossRef]
  64. Larsen Bjørn, M.; Hesthagen, T.; Thorstad, E.B.; Diserud, O.H. Increased abundance of European eel (Anguilla anguilla) in acidified Norwegian rivers after liming. Ecol. Freshw. Fish 2015, 24, 575–583. [Google Scholar] [CrossRef]
  65. Haro, A.; Richkus, W.; Whalen, K.; Hoar, A.; Busch, W.-D.; Lary, S.; Brush, T.; Dixon, D. Population decline of the American eel: Implications for research and management. Fisheries 2000, 25, 7–16. [Google Scholar] [CrossRef]
  66. Jacoby, D.M.P.; Casselman, J.M.; Crook, V.; DeLucia, M.-B.; Ahn, H.; Kaifu, K.; Kurwie, T.; Sasal, P.; Silfvergrip, A.M.C.; Smith, K.G.; et al. Synergistic patterns of threat and the challenges facing global anguillid eel conservation. Glob. Ecol. Conserv. 2015, 4, 321–333. [Google Scholar] [CrossRef]
  67. Jellyman, D.J. An enigma: How can freshwater eels (Anguilla spp.) be such a successful genus yet be universally threatened? Rev. Fish Biol. Fish. 2022, 32, 701–718. [Google Scholar] [CrossRef]
Figure 1. Location of the study sites in Southern Belgium (A) and the morphology of the scanned areas (B). * in black indicates glass eel release sites. * in red indicates fishing and tagging eel sites. * in green indicates unrelease site of glass eels. The rivers are A, B, C, D, E and F.
Fishes 08 00137 g001
Figure 2. Development over time of the relative abundance and the detection rate of the tagged eels detected from the sessions in 2018 (1+) to 2022 (5+) (A). Repartition of the relative abundance (B) and the detection rate (C) of eels 5+ between rivers. (n) indicates the cumulative number of eels tagged during all fall electrofishing sessions performed prior to each spring detection session. Age is relative to the age of eels after restocking in 2017. The mean total length represents the cumulative total length of eels tagged since 2017 (0+) for each detection session. The rivers are A, B, C, D, E and F. Rivers sharing at least one common letter are not significantly different (Fisher’s exact test: p < 0.05).
Fishes 08 00137 g002
Figure 3. Mean development over time of the total distance travelled (TD), the home range (HR) and the exploitation index (EI) of HR of the tagged eels detected from the sessions in 2018 (1+) to 2022 (5+) (A). TD and HR are presented according to age and the total length at tagging for eels age 5+ (n = 159) detected during the 2022 session (B). (n) indicates the number of detected eels. Age is relative to the age of the eels after restocking in 2017. The mean total length represents the total length at tagging for eels detected at each detection session. Green lines mark the area where the HR is less than the TD.
Fishes 08 00137 g003
Figure 4. Mean evolution over time of the microhabitat characteristics used by the restocked eels (A). Utilisation of bottom substrate in eels 5+ (B) (n = 159 during the 2022 detection session). Particle sizes (in cm, the diameter perpendicular to the longest axis) are: boulders (>102.4), blocks (26–102) and large stones (13–25) [37]. Roots are submerged roots of riparian trees. *** Kruskal–Wallis followed by Dunn’s test: p < 0.00001 for water depth. ** Fisher’s exact test: p < 0.001 for block use).
Fishes 08 00137 g004aFishes 08 00137 g004b
Figure 5. The total distance travelled (TD) (A), the home range (HR) (B) and the exploitation index (EI) (C) of the HR in eels 5+ (based on the spring 2022 telemetry session) according to the rivers. Longitudinal dispersal (LD) (E) during the 2022 session, net distance travelled (ND) (F) under flood events and the total length (TL) (D) of eels at tagging. n indicates number of eels 5+. The rivers are A (n = 93), B (n = 14), C (n = 6), D (n = 15), E (n = 25) and F (n = 6). For ND, the numbers are 86 for river A, 12 for river B, 6 for river C, 10 for river D, 16 for river E and 5 for river F. Boxplots are presented with median values; the hinges indicate the first and third quartiles and the circles indicate outliers. Rivers sharing the same letter are not significantly different (Kruskal–Wallis test followed by Dunn’s test: p < 0.05).
Fishes 08 00137 g005
Table 1. Description of the study areas. The bottom substrate particle sizes (in cm, the diameter perpendicular to the longest axis) are: boulders (>102.4), blocks (26–102), large stones (13–25), fine stones (6.4–12.8), coarse pebbles (3.2–6.4) and coarse gravel (0.8–1.6). The river width and depth were measured in September. SE means standard error; ind. indicates individuals. The daily and monthly values were calculated based on data collected from 2017 to 2022.
Rivers
ParametersABCDEF
Altitude (m)144155178100172221
Catchment area (km²)118.0380.0128.945.397.0
Direct tributaryMeuseMeuseVesdreMeuseHoegneWayai
River length (km)25563412158
Distance from the North Sea (km)341324376366376381
Distance from the River Meuse (km)18433633438
Distance from the River mouth (km)184311.530.350.09
Fish zoneBrown troutLower GraylingUpper Brown troutBrown troutLower Brown troutBrown trout
Width (mean ± SE, in m)4.7 ± 1.47.5 ± 1.07.4 ± 1.34.8 ± 1.16.7 ± 1.24.8 ± 1.0
Depth (mean ± SE, in m)18.4 ± 10.036.6 ± 19.922.2 ± 12.216.8 ± 8.421.4 ± 11.620.7 ± 12,9
Species richness (number)121898107
Density of brown trout
(mean ± SE, in ind. m−2)
0.185 ± 0.0810.995 ± 0.5554.243 ± 1.4572.048 ± 0.7703.971 ± 2.1323.893 ± 0.373
Vegetation cover (mean ± SE, in %)56.3 ± 35.036.3 ± 25.884.0 ± 19.887.1 ± 16.359.8 ± 31.664.7 ± 34.0
Daily water temperature (mean ± SE, in °C)11.3 ± 3.611.2 ± 3.510.5 ± 3.910.7 ± 3.411.0 ± 3.510.3 ± 4.0
Monthly pH (mean ± SE)7.8 ± 0.38.0 ± 0.36.8 ± 0.48.0 ± 0.37.4 ± 0.36.8 ± 0.4
Monthly calcium carbonate
(mean ± SE, in mg L−1)
108 ± 2694 ± 2722 ± 9105 ± 2531 ± 2021 ± 5
Monthly conductivity (mean ± SE, μs cm−1)600 ± 125572 ± 67161 ± 50541 ± 55221 ± 75116 ± 24
Monthly total hardness (mean ± SE, °GH)14 ± 213 ± 23 ± 113 ± 24 ± 22 ± 1
Monthly carbonate hardness
(mean ± SE, °KH)
8 ± 310 ± 22 ± 19 ± 24 ± 22 ± 1
Bottom substrates
(in decreasing abundance order)
Predominant substratumLarge stone + BlockBlock + Large stone + BoulderBlock + Large stone + BoulderLarge stone + Fine stone + Coarse pebbleBoulder + Large stone + Coarse gravel + BlockBoulder + Coarse pebble
Abundance (%)43.9 + 20.9 = 64.430.1 + 29.0 + 20.0 = 79.130.1 + 29.0 + 20.0 = 79.130.6 + 26.6 + 14.0 = 71.228.8 + 18.6 + 16.4 + 14.4 = 78.346.8 + 36.7 = 83.5
Flow features
(in decreasing abundance order)
Predominant flow featuresRun, pool and RiffleRun, Lentic Channel and RiffleRun and RapidRun, pool and RiffleRun and RapidRun and pool
Abundance (%)48.5 + 32.0+17.0 = 97.538.6 + 27.9 + 13.2 = 79.758.7 + 32.5 = 91.264.0 + 16.9 + 12.5 = 93.458.8 + 28.6 = 87.472.0 + 16.4 = 88.4
Trophic statusEutrophicEutrophicOligotrophicOligotrophicOligotrophicOligotrophic
The rivers are A, B, C, D, E and F.
Table 2. Mobility of eels 5+ (based on the spring 2022 telemetry session) according to both age and total length at the time of tagging and characteristics of their microhabitats. The values are the mean and standard error. RO means boulders, B indicates block, PG refers to large stones and RA is submerged roots. The rivers are A, B, C, D, E and F. Floods occurred in July 2021 and eels 4+ were tagged in autumn 2021 after flooding events.
Age at TaggingRiverSectorn detectedTotal Length at Tagging (mm)Net Distance Travelled after Floods (m)Total Distance Travelled (m)Home Range (m)Exploitation Index of Home RangeMicrohabitat
Bottom SubstrateWater Depth (cm)
0+ (2017)A211125 ± 15290 ± 291344 ± 225321 ± 2301.07 ± 0.1311B44.3 ± 19.2
E31134 ± 06 ± 0349 ± 0349 ± 01.00 ± 0.001B50.0 ± 0.0
81123 ± 0349 ± 0191 ± 0150 ± 01.27 ± 0.001B24.0 ± 0.0
1+ (2018)A230192 ± 63140 ± 194188 ± 207176 ± 1971.10 ± 0.1530B39.7 ± 22.3
1010187 ± 419 ± 1167 ± 8250 ± 661.50 ± 0.359B+1PG34.1 ± 12.8
B11193 ± 04 ± 027 ± 027 ± 01.00 ± 0.001RA26.0 ± 0.0
21167 ± 06 ± 06 ± 06 ± 01.00 ± 0.001RA58.0 ± 0.0
C34173 ± 18508 ± 290585 ± 263541 ± 2921.23 ± 0.384B33.5 ± 14.6
D24159 ± 2918 ± 1862 ± 5451 ± 521.37 ± 0.554B36.0 ± 9.1
E81199 ± 01 ± 0145 ± 0144 ± 01.00 ± 0.001B24.0 ± 0.0
93188 ± 28138 ± 123278 ± 123194 ± 371.40 ± 0.393B44.7 ± 28.9
F12162 ± 35493 ± 18493 ± 18493 ± 181.00 ± 0.001RA+1RO49.0 ± 4.2
2+ (2019)A216233 ± 7599 ± 139147 ± 136126 ± 1301.24 ± 0.3116B40.6 ± 15.0
108229 ± 5811 ± 1347 ± 6234 ± 391.3 ± 0.418B27.5 ± 7.7
B12207 ± 330.5 ± 0.726 ± 3626 ± 361.00 ± 0.002RA46.5 ± 26.2
23229 ± 311.3 ± 0.664 ± 4645 ± 351.60 ± 0.523RA57.3 ± 9.2
E83238 ± 4562 ± 92453 ± 127234 ± 571.92 ± 0.093B22 ± 6.9
91214 ± 02 ± 02 ± 02 ± 01.00 ± 0.001B62.0 ± 0.0
D24207 ± 3941 ± 7443 ± 7242 ± 731.16 ± 0.311B+3RA32.0 ± 8.5
3+ (2020)A210302 ± 12346 ± 12048 ± 11947 ± 1191.06 ± 0.189B+1RA36.6 ± 15.6
102249 ± 813 ± 1718 ± 1016 ± 141.42 ± 0.592B42.5 ± 3.5
B11297 ± 048 ± 048 ± 048 ± 01.00 ± 0.001RA94.0 ± 0.0
24306 ± 725 ± 16 ± 35 ± 0,51.25 ± 0.501B+3RA63.8 ± 18.9
C32302 ± 8262 ± 349262 ± 349262 ± 3491.00 ± 0.002B33.0 ± 12.7
D22378 ± 1494 ± 631 ± 431 ± 41.00 ± 0.002B56.0 ± 11.3
E84318 ± 2113 ± 2129 ± 2125 ± 231.31 ± 0.534B27.5 ± 9.6
92328 ± 88135 ± 27197 ± 33164 ± 141.21 ± 0.302B21.5 ± 7.8
F13269 ± 65225 ± 390233 ± 385231 ± 3841.33 ± 0.582B+1RA29.7 ± 15.9
4+ (2021)A26310 ± 100-104 ± 107104 ± 1071.00 ± 0.006B42.5 ± 26.4
B22328 ± 46-14 ± 514 ± 51.00 ± 0.002B75.0 ± 10.8
D25286 ± 65-39 ± 4439 ± 441.00 ± 0.005B35.4 ± 12.0
E85364 ± 59 19 ± 2119 ± 211.00 ± 0.005B29.8 ± 7.9
94406 ± 11-239 ± 16239 ± 161.00 ± 0.002B+1RA29.6 ± 6.8
F11387 ± 0-71 ± 071 ± 01.00 ± 0.001B22.0 ± 0.0
Disclaimer/Publisher’s Note: The statements, opinions and data contained in all publications are solely those of the individual author(s) and contributor(s) and not of MDPI and/or the editor(s). MDPI and/or the editor(s) disclaim responsibility for any injury to people or property resulting from any ideas, methods, instructions or products referred to in the content.

