

Effects of Different Culture Densities on the Acoustic Characteristics of Micropterus salmoide Feeding

Abstract

1. Introduction
2. Material and Methods
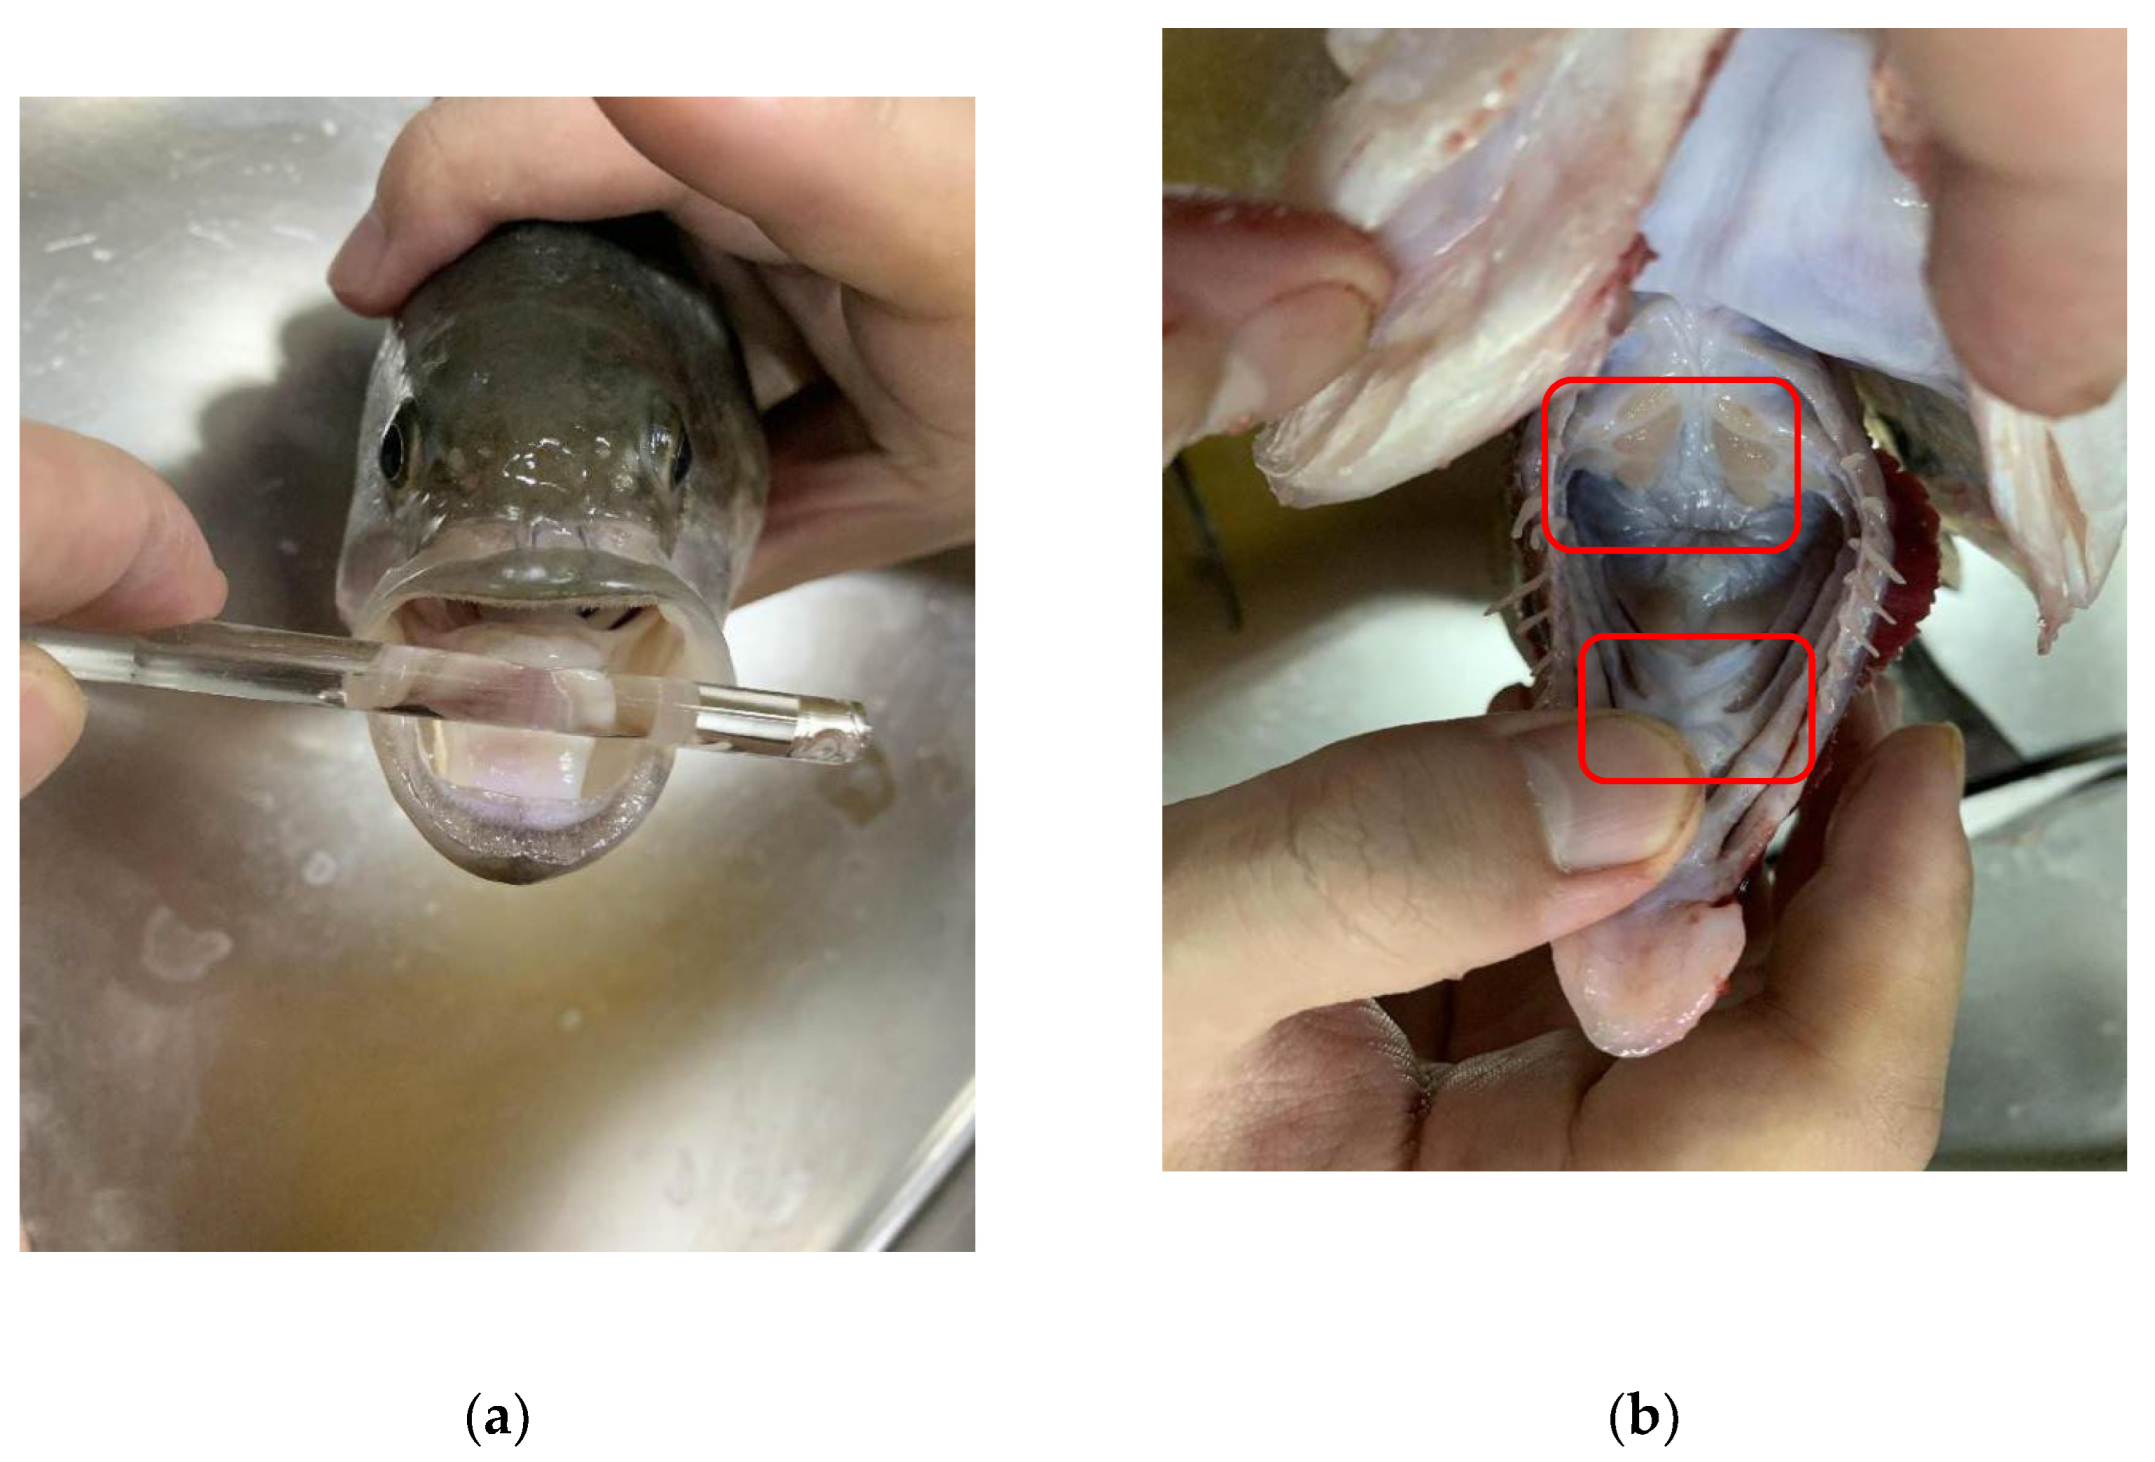
2.1. Test Subjects
2.2. Acoustic Signal and Video Capture
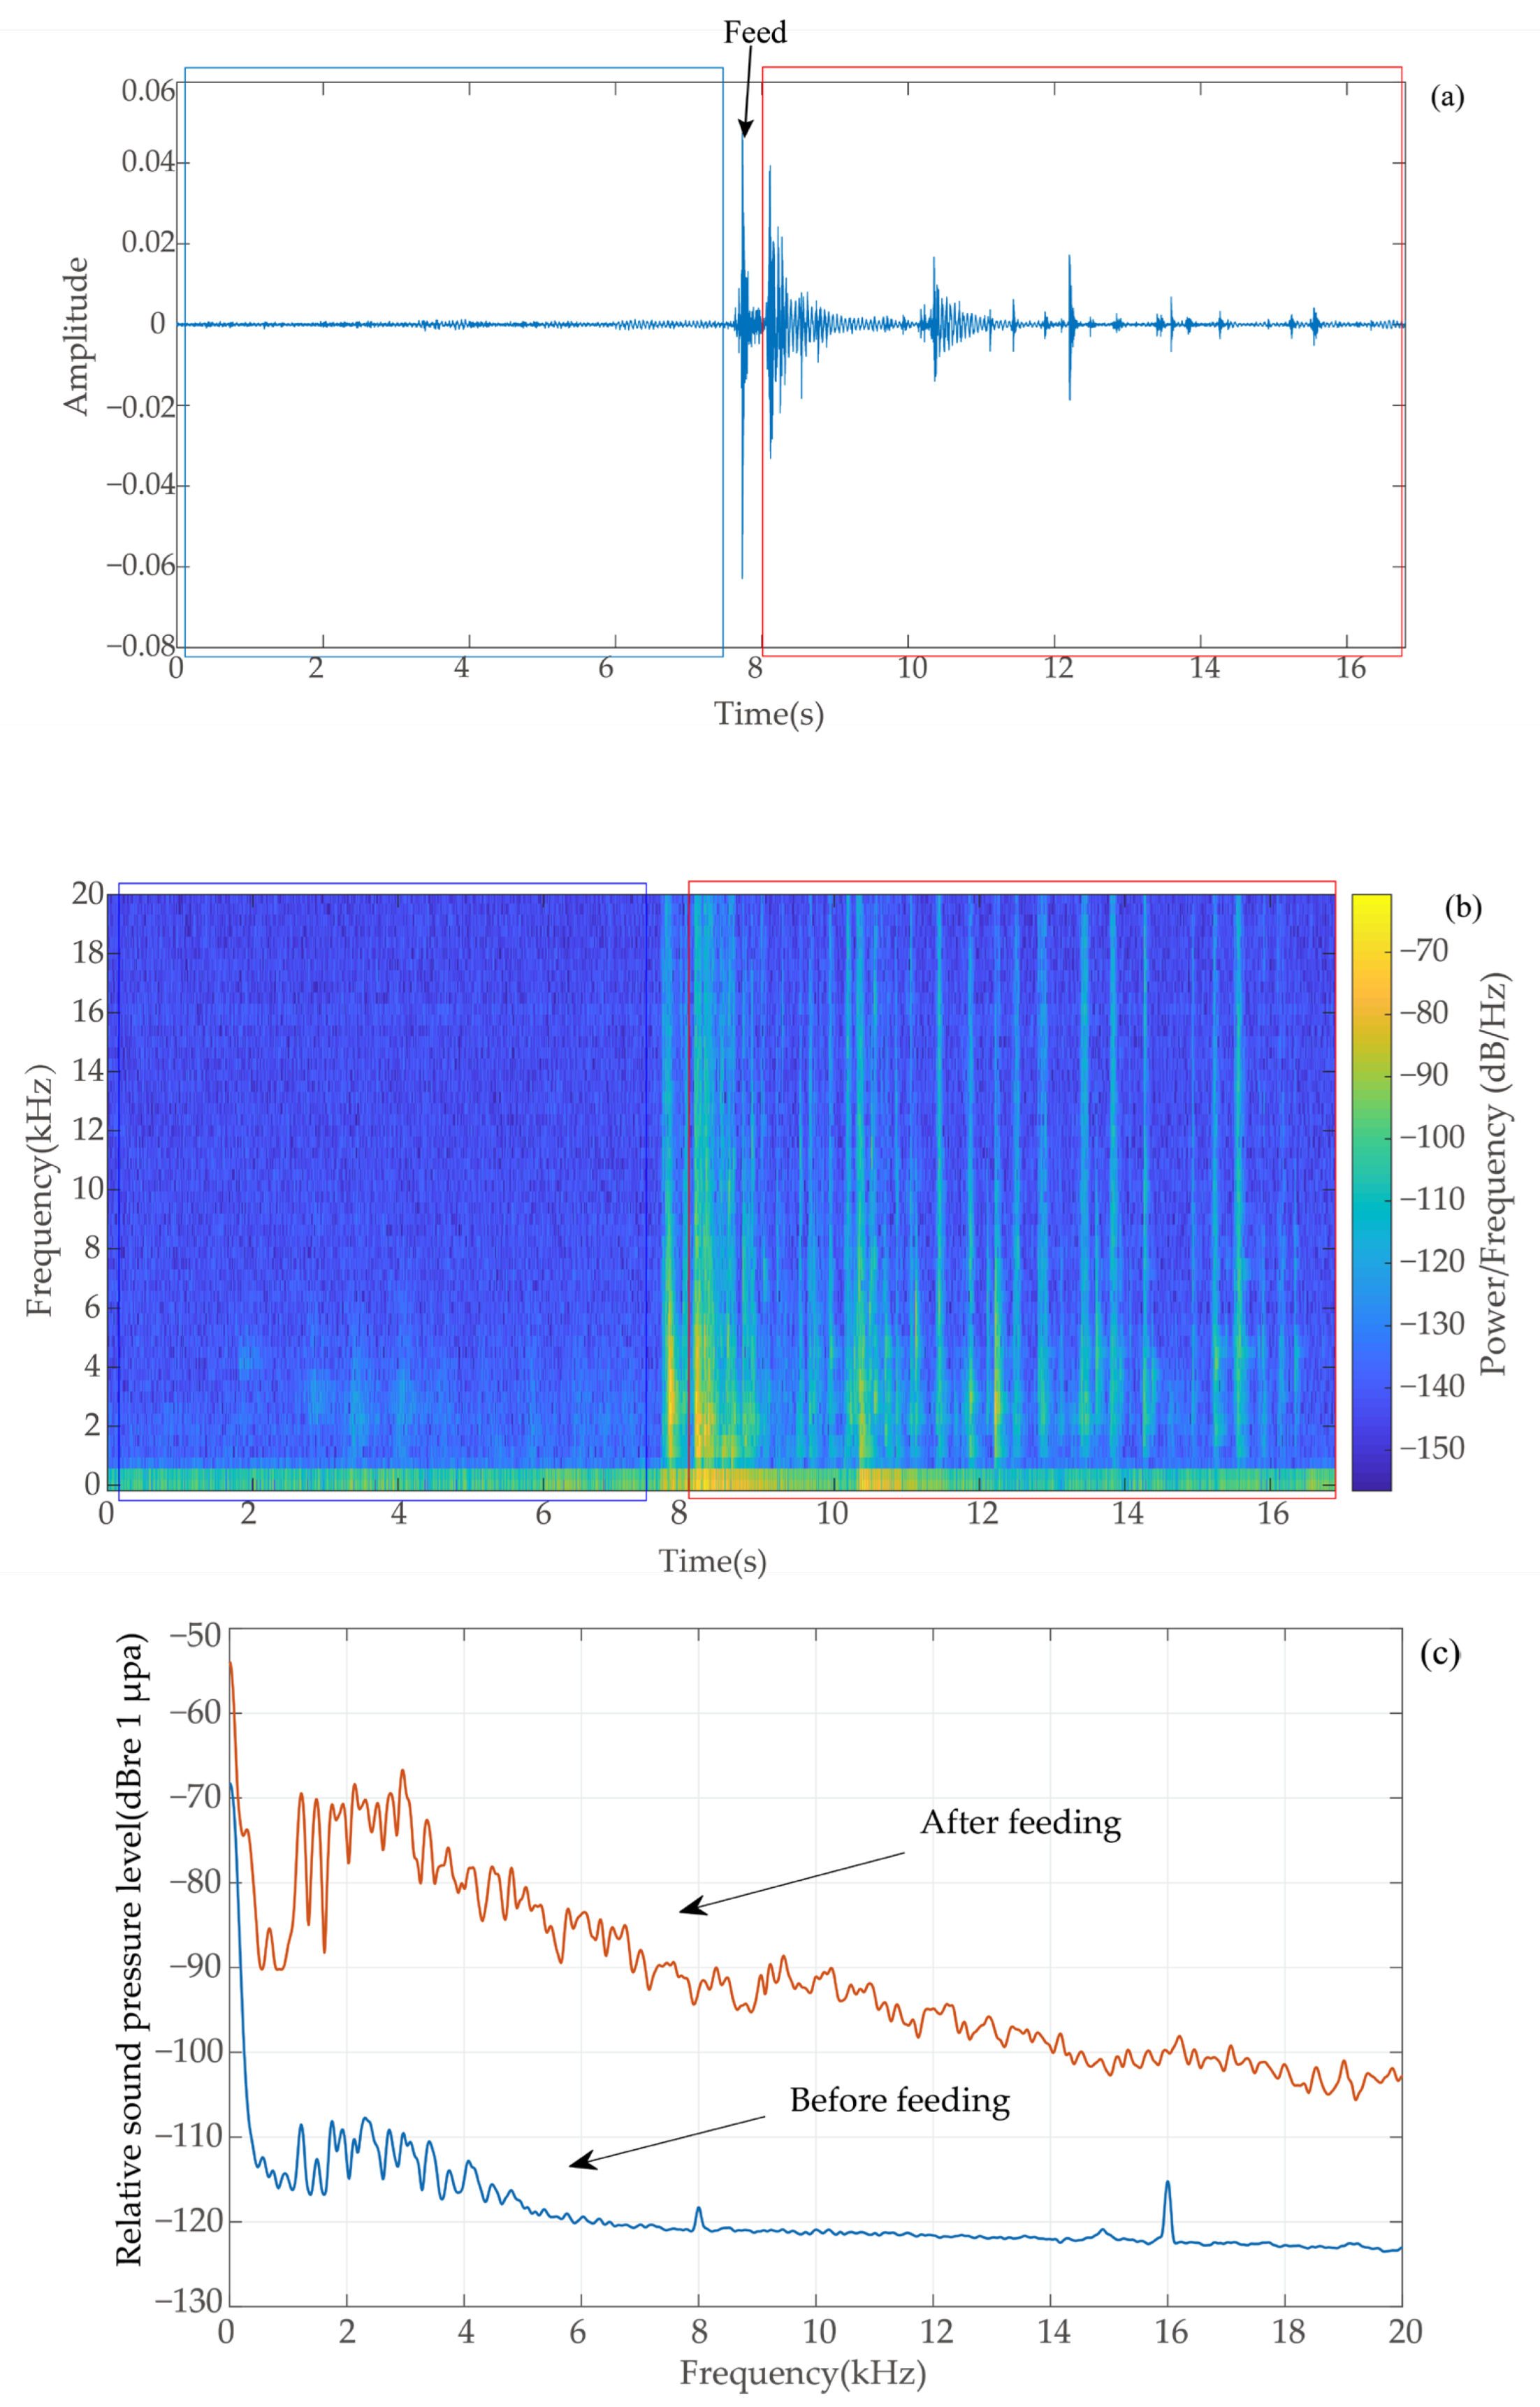
2.3. Determination of Feeding Signals
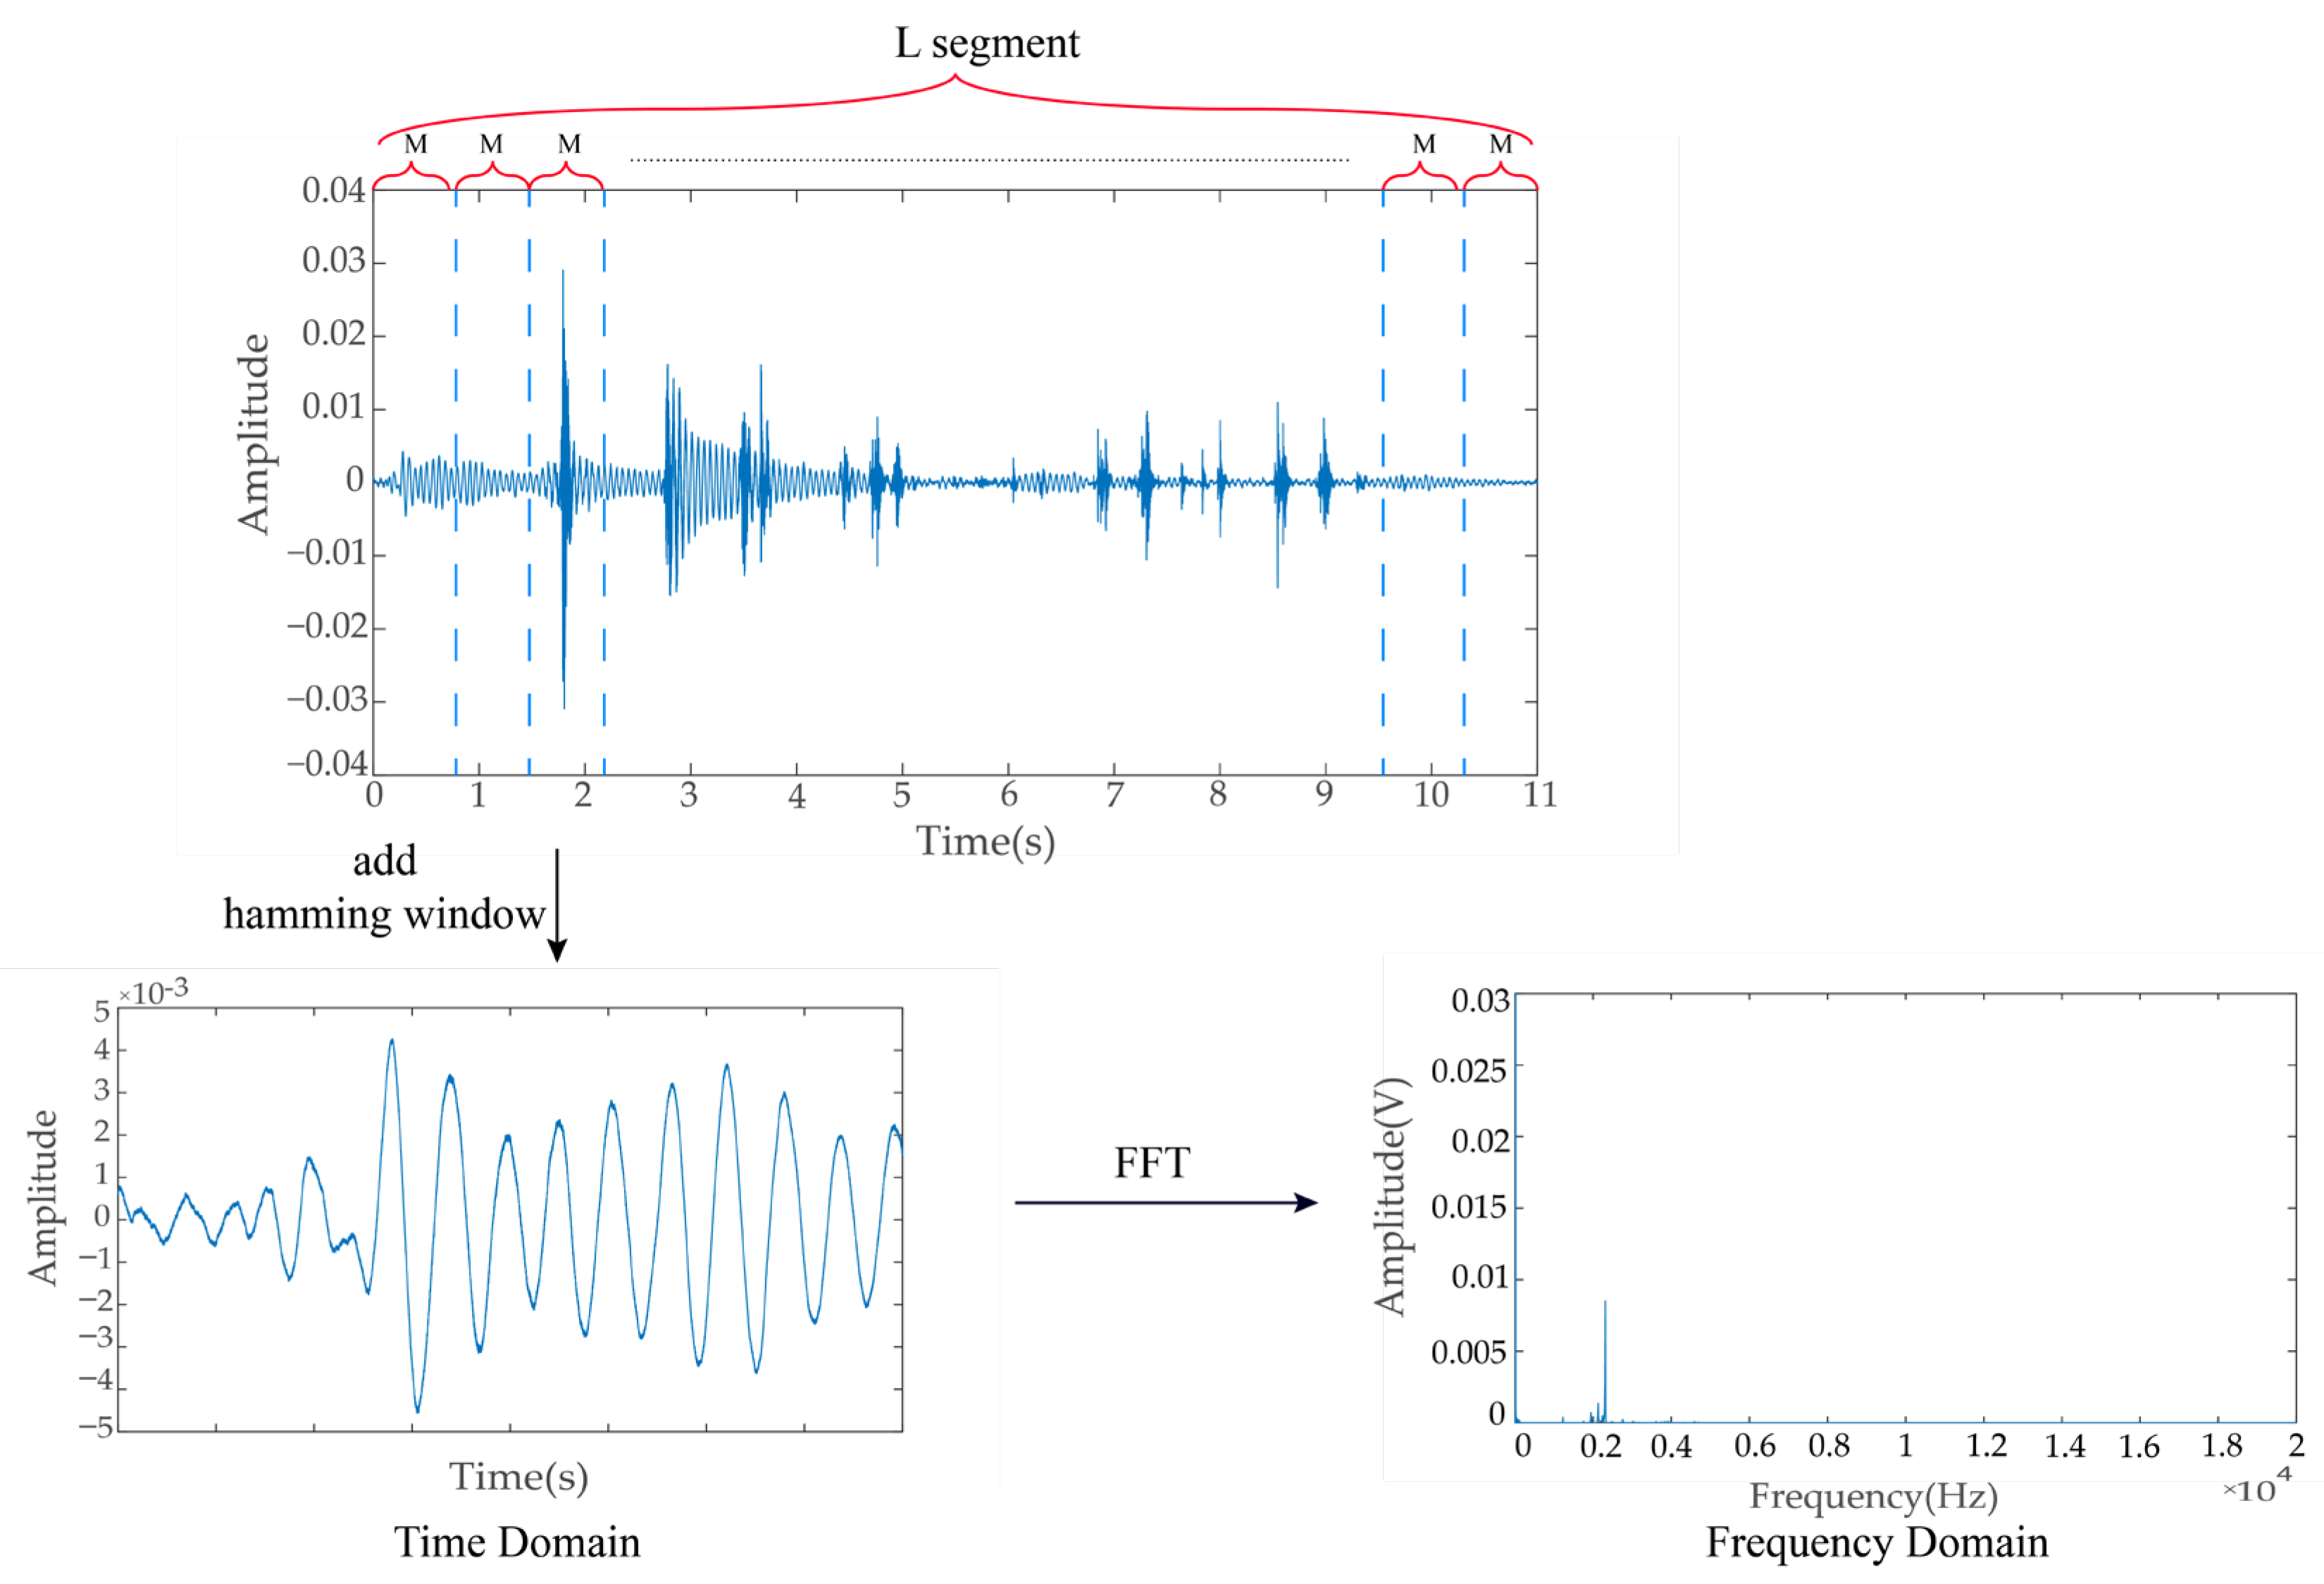
2.4. Acoustic Signal Preprocessing
2.5. Extraction of Ingestion Sound Signal Features
2.5.1. Power Spectrum
2.5.2. Short-Time Zero-Crossing Rate
2.5.3. Short-Time Average Amplitude
2.5.4. Spectral Entropy
2.6. Statistical Analysis
3. Results
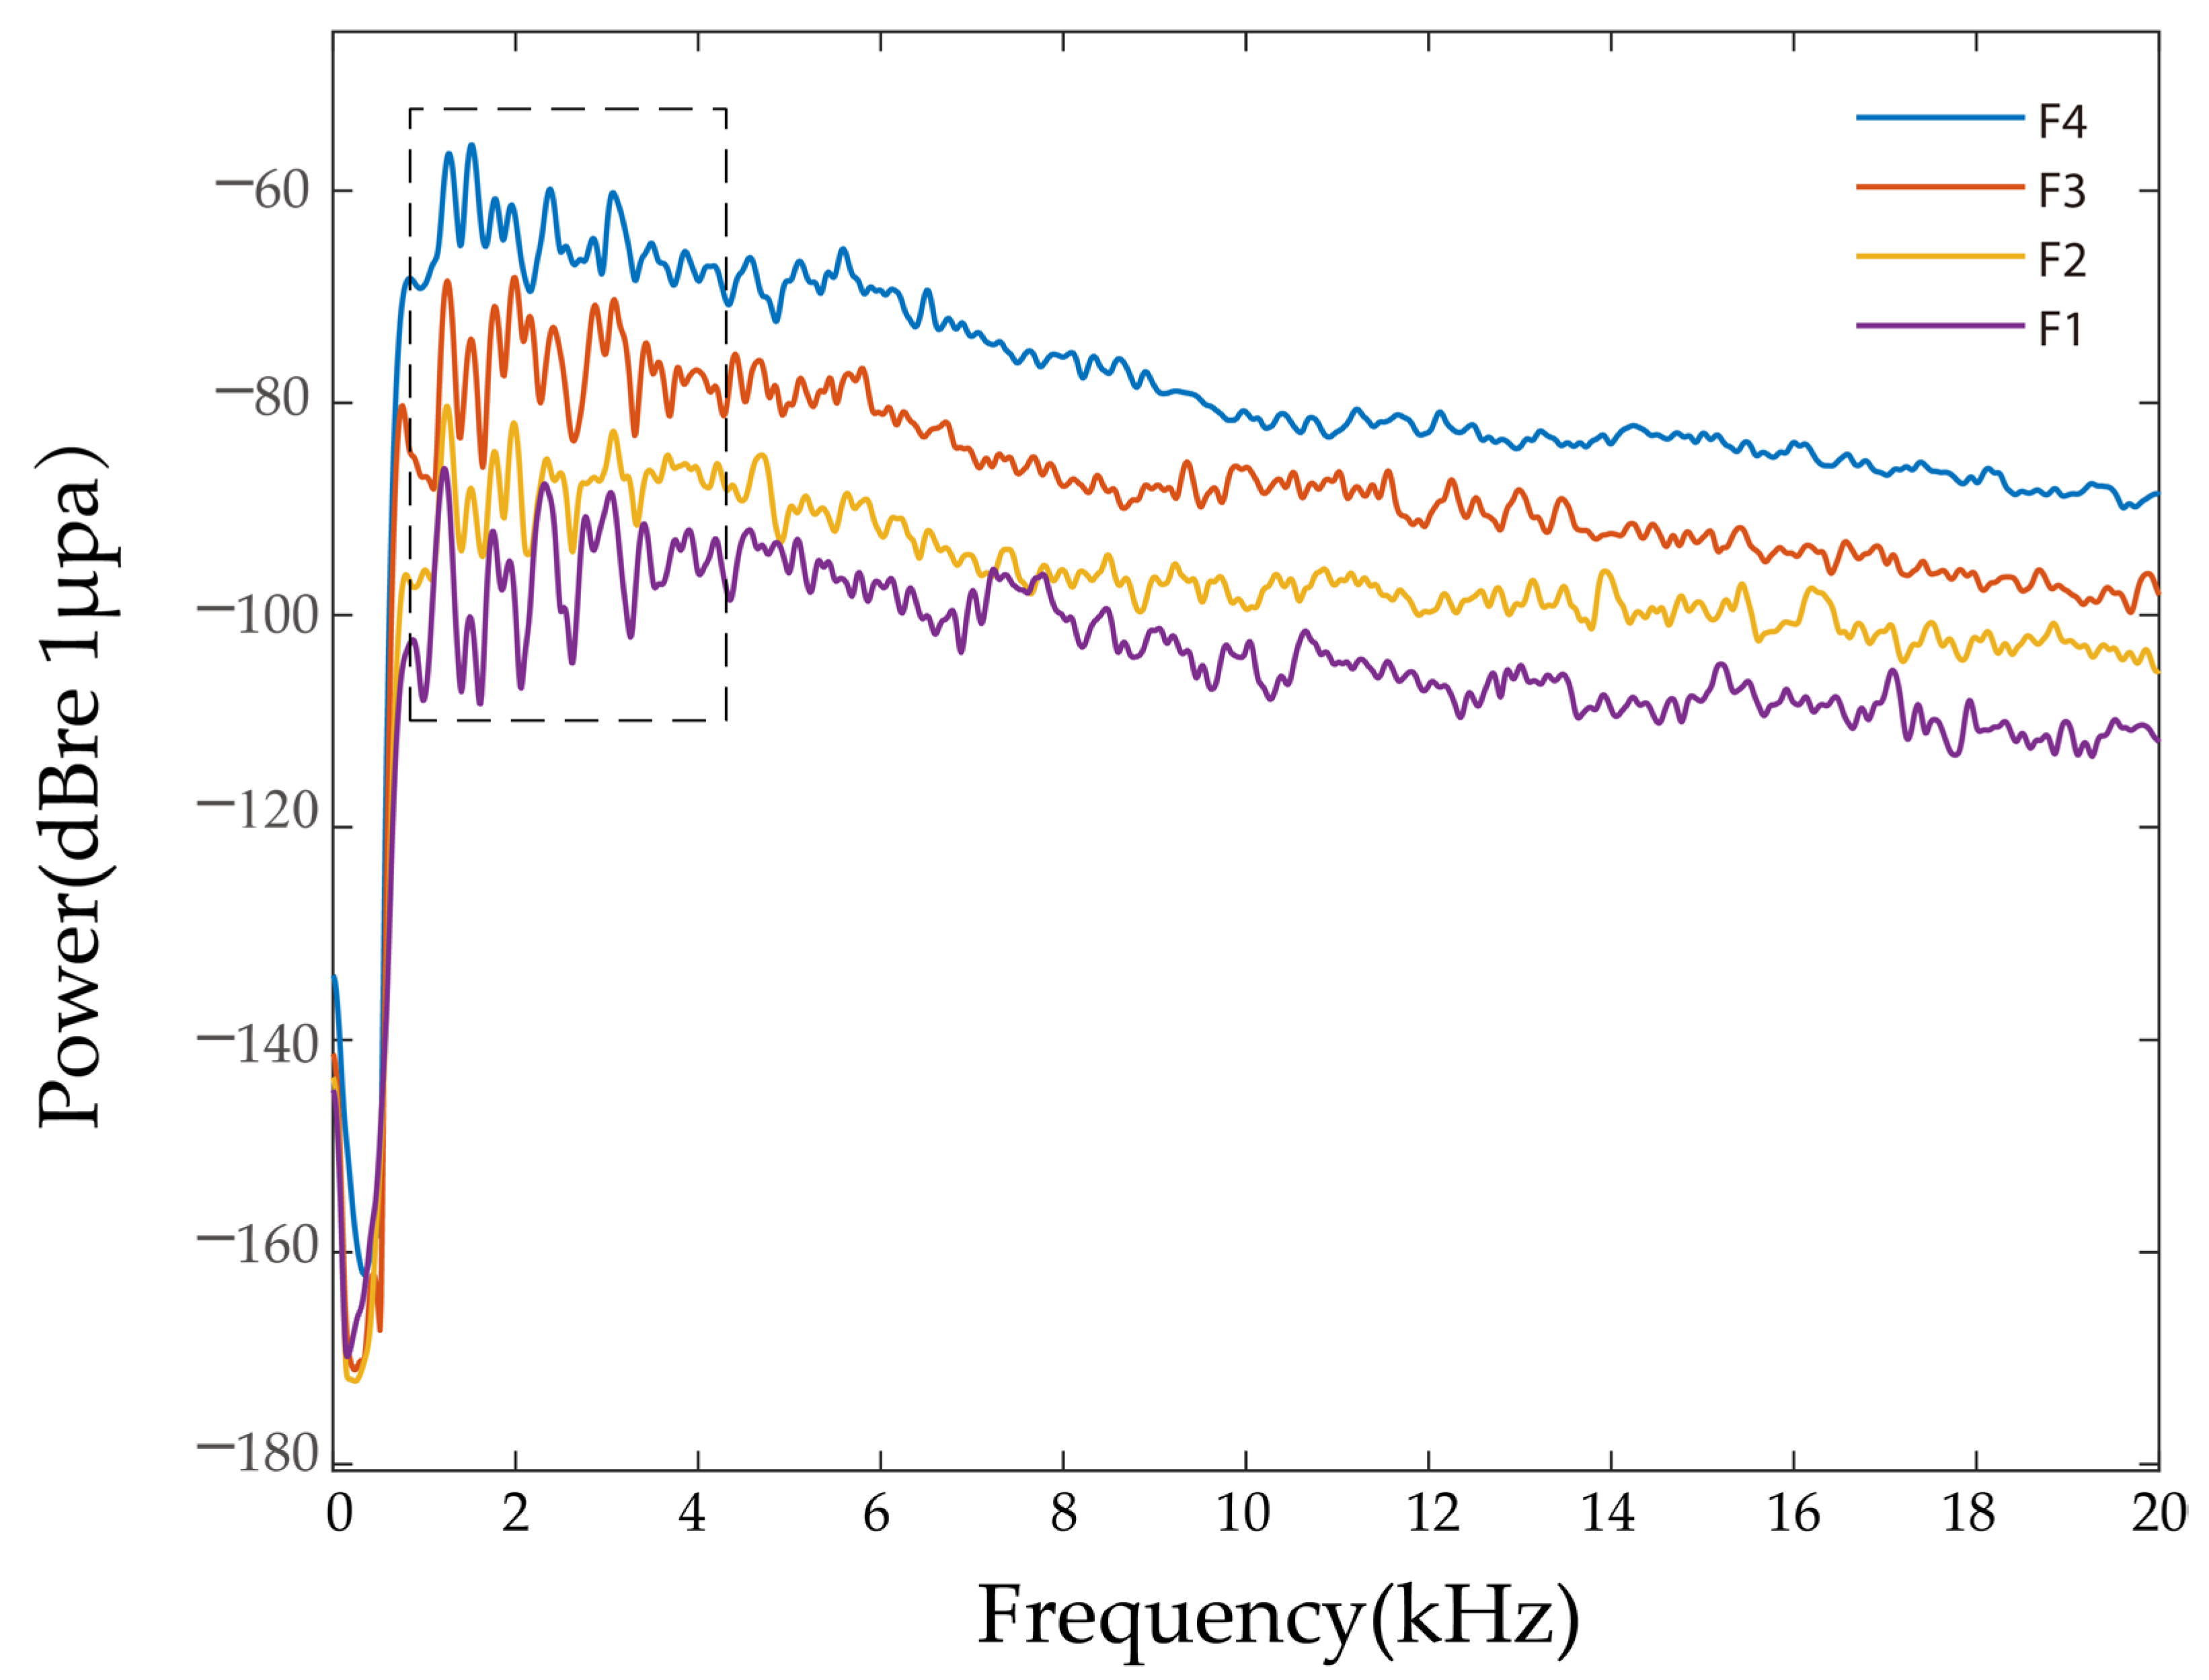
3.1. Power Spectrum
3.2. Short-Time Zero Crossing Rate
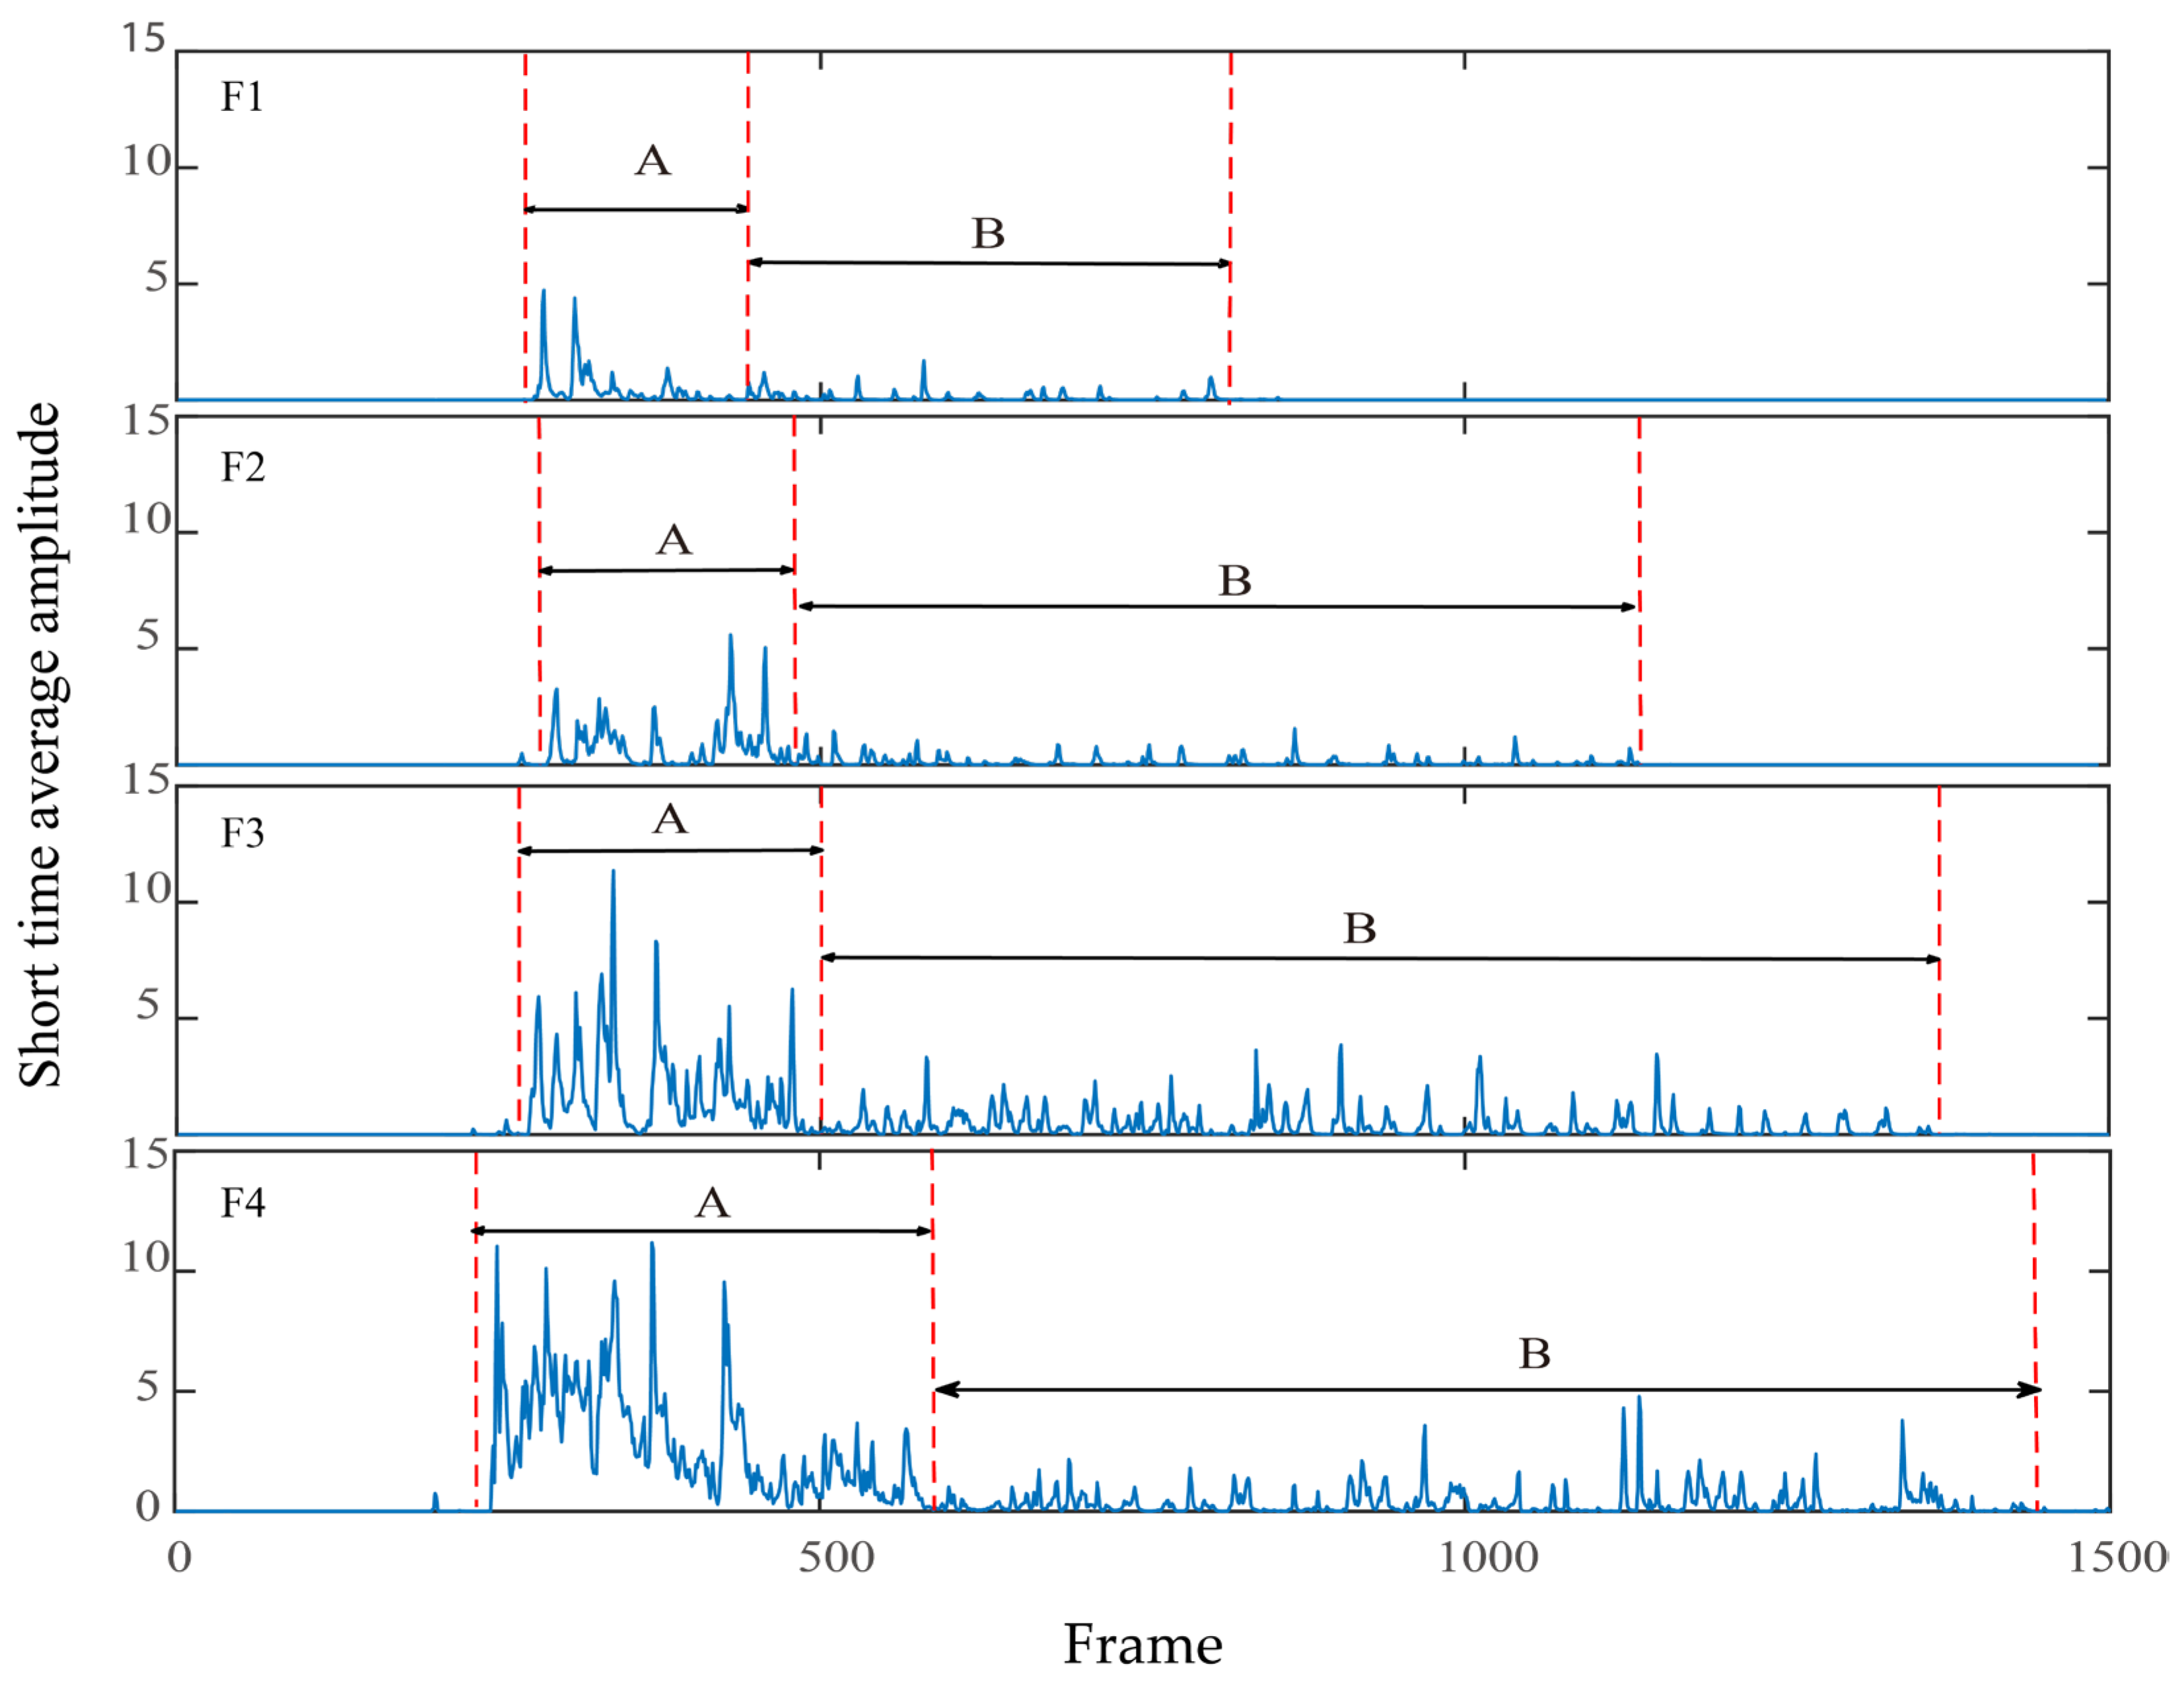
3.3. Short-Time Average Amplitude
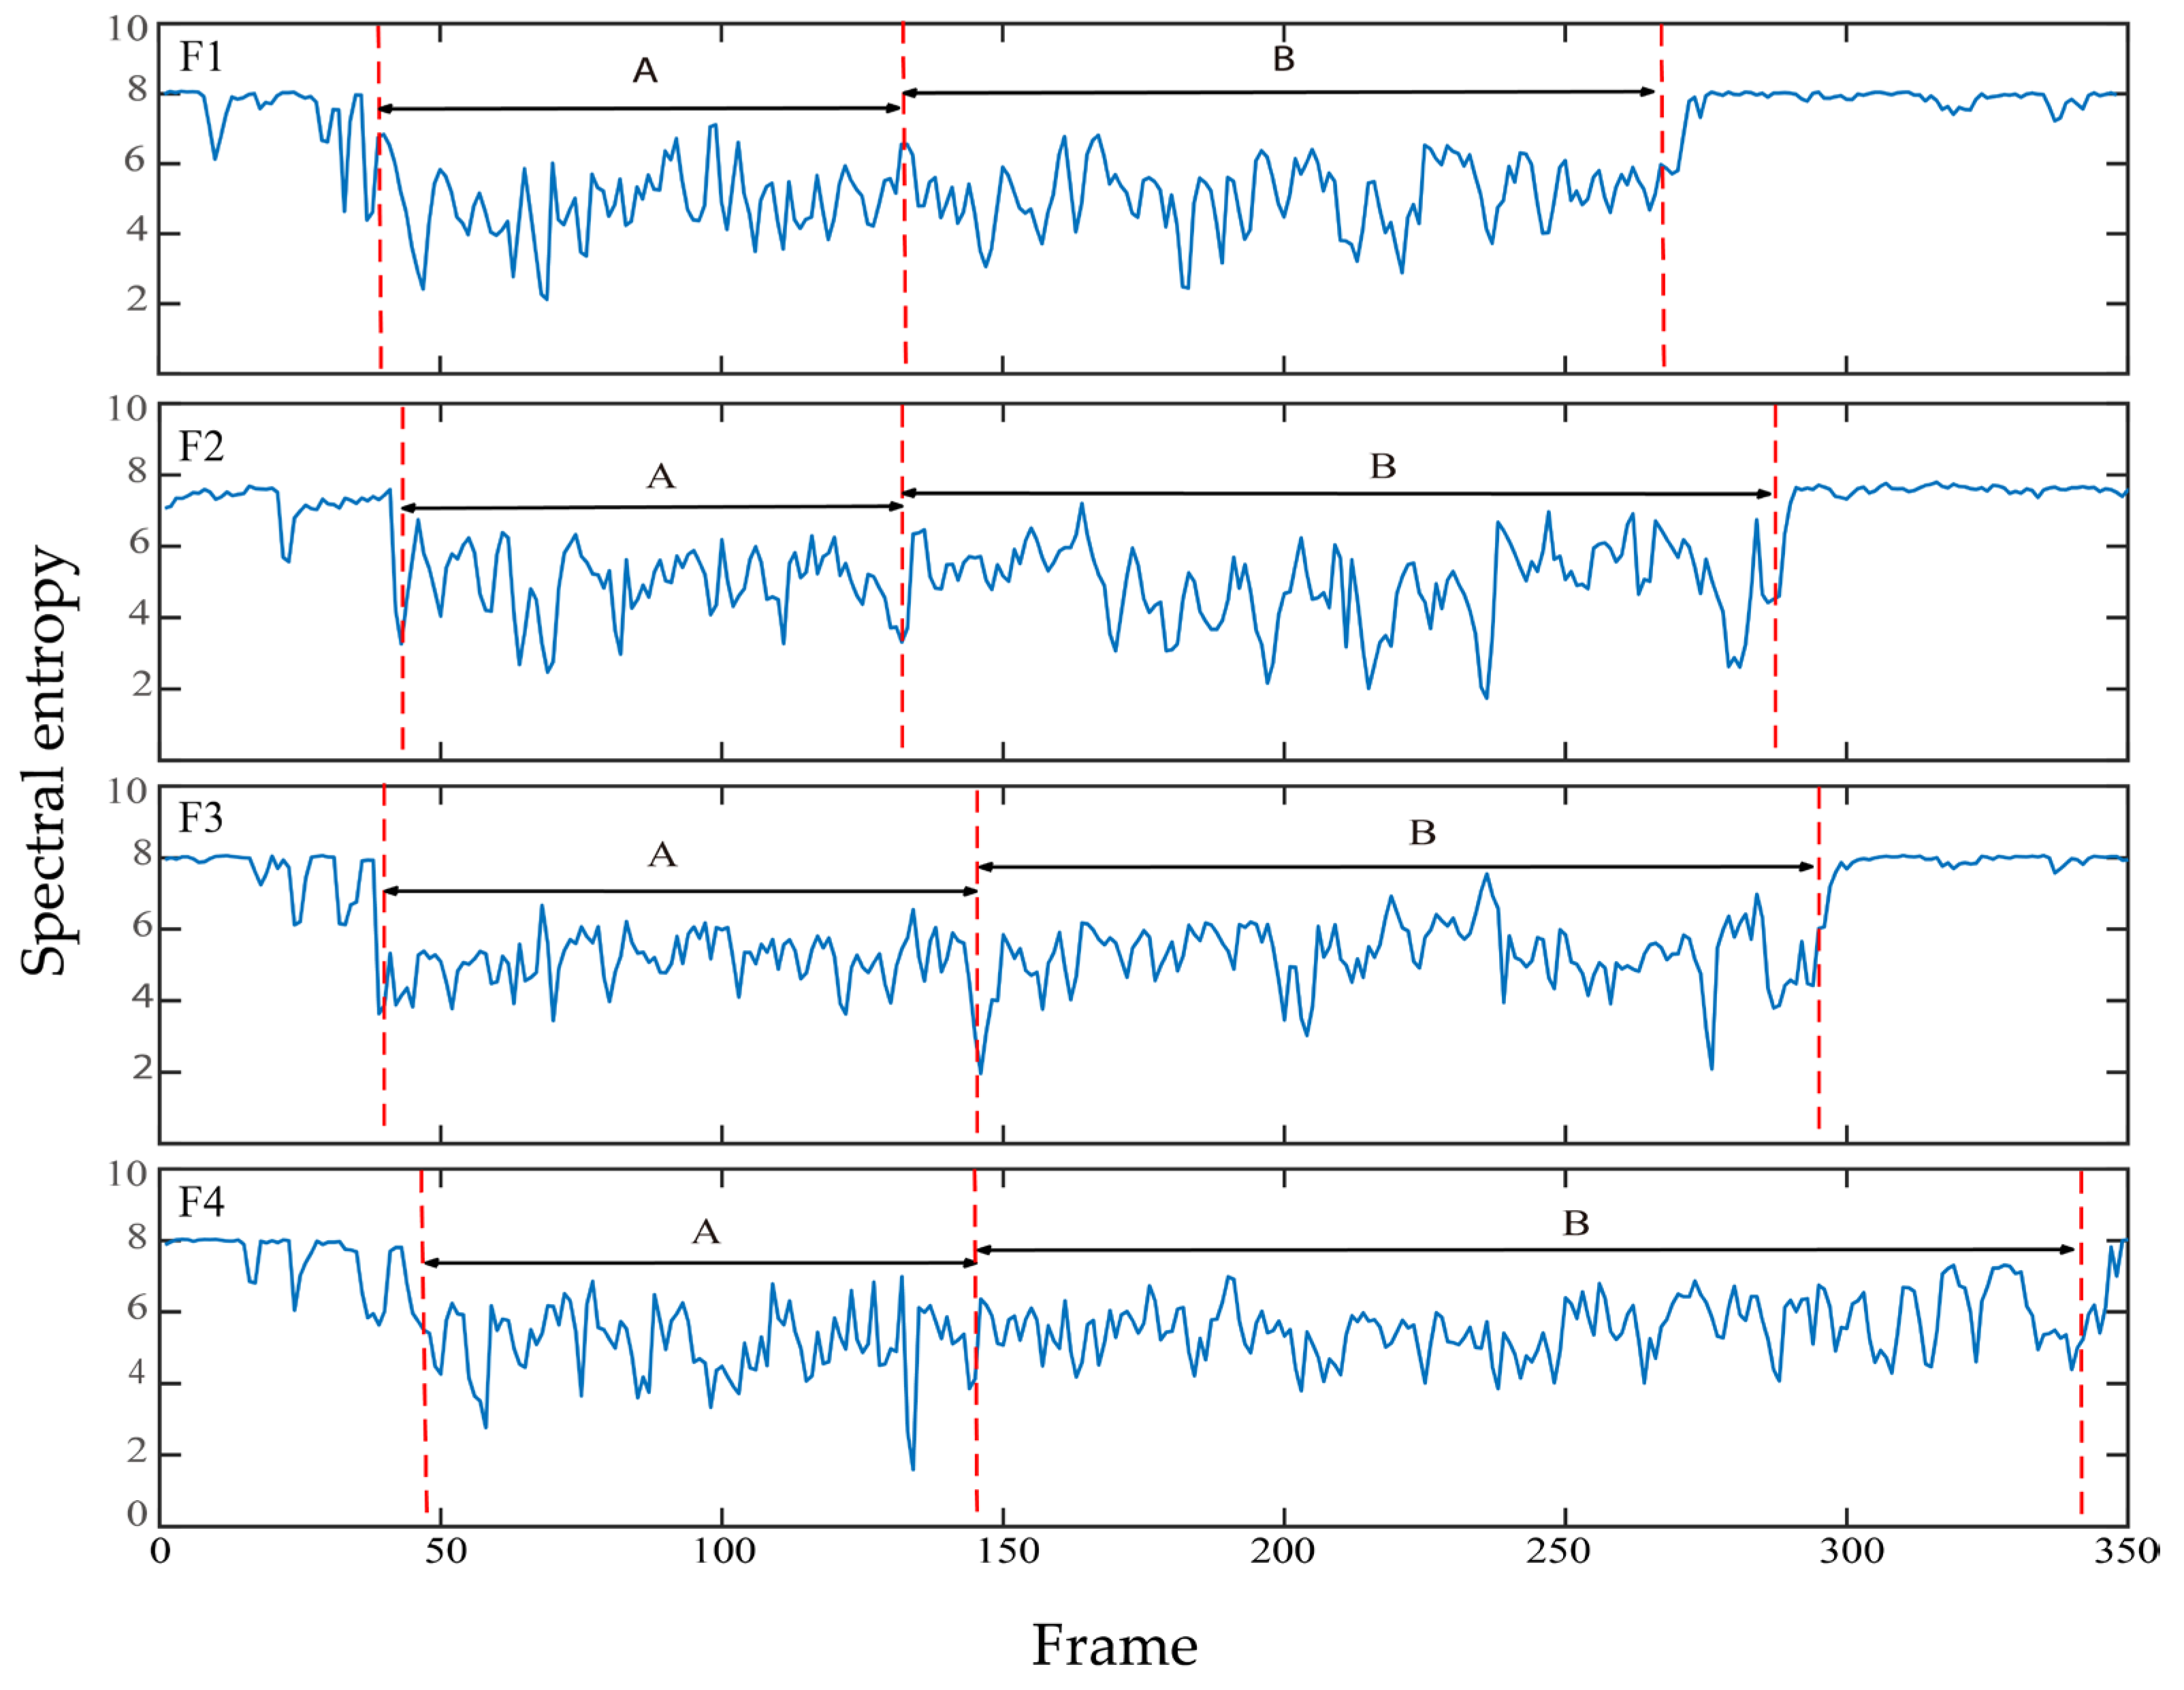
3.4. Spectral Entropy
4. Discussion
5. Conclusions
Author Contributions
Funding
Institutional Review Board Statement
Informed Consent Statement
Data Availability Statement
Acknowledgments
Conflicts of Interest
References
- Wu, Y.; Wang, X.; Zhang, X.; Shi, Y.; Li, W. Locomotor posture and swimming-intensity quantification in starvation-stress behavior detection of individual fish. Comput. Electron. Agric. 2022, 202, 107399. [Google Scholar] [CrossRef]
- Zeng, Y.; Yang, X.; Pan, L.; Zhu, W.; Wang, D.; Zhao, Z.; Liu, J.; Sun, C.; Zhou, C. Fish school feeding behavior quantification using acoustic signal and improved Swin Transformer. Comput. Electron. Agric. 2023, 204, 107580. [Google Scholar] [CrossRef]
- Zhaohui, Z.; Yuan, P. Study on the characteristics of dolphins click signal. In Proceedings of the 2020 5th International Conference on Communication, Image and Signal Processing (CCISP), Chengdu, China, 13–15 November 2020. [Google Scholar]
- Zhou, Y.L.; Xu, X.M.; Zhang, X.H.; Huang, L.F.; Xiao, F.G.; He, Y.W. Vocalization behavior differs across reproductive stages in cultured large yellow croaker Larimichthys crocea (Perciformes: Sciaenidae). Aquaculture 2022, 556, 738267. [Google Scholar] [CrossRef]
- Ladich, F. Sound Production and acoustic communication. In The Senses of Fish. Adaptations for the Reception of Natural Stimuli; Springer: Berlin/Heidelberg, Germany, 2004; pp. 210–230. [Google Scholar]
- Lindseth, A.; Lobel, P.S. Underwater Soundscape Monitoring and Fish Bioacoustics: A Review. Fishes 2018, 3, 36. [Google Scholar] [CrossRef]
- Fengdeng, Z. Study on Adaptive System Based on Feedback of Feeding Behavior of Micropterus salmoides in Recirculating Aquaculture System; Zhejiang University: Hangzhou, China, 2019. [Google Scholar]
- Michaelis, P.; Thierry, B. A comparative study of automatic feeding and automatic feeding and self-feeding in juvenile Atlantic salmon (Salmo salar) fed diets of different energy levels. Aquaculture 1996, 145, 245–257. [Google Scholar]
- Li, D.L.; Liu, C. Recent Advances and Future Outlook for Artificial Intelligence in Aquaculture. Smart Aquac. 2020, 2, 1–20. [Google Scholar]
- Le, Z.Y. Exploration and suggestions for effective protection of offshore fishery resources based on acoustic technology. China Aquac. 2022, 5, 58–60. [Google Scholar]
- Smith, D.V.; Tabrett, S. The use of passive acoustics to measure feed consumption by Penaeus monodon (giant tiger prawn) in cultured systems. Aquac. Eng. 2013, 57, 38–47. [Google Scholar] [CrossRef]
- Christopher, L. The Use of Feeding Noises to Determine the Algal Foods Being Consumed by Individual Intertidal Molluscs. Oecologia 1979, 40, 1–17. [Google Scholar]
- Li, D.; Wang, Z.; Wu, S.; Miao, Z.; Du, L.; Duan, Y. Automatic recognition methods of fish feeding behavior in aquaculture: A review. Aquaculture 2020, 528, 735508. [Google Scholar] [CrossRef]
- Cao, Z.L.; Shen, M.T.; Li, Z.C.; Wang, Z.H.; Wang, X.X. Characteristics of feeding acoustic of Litopenaeus vannamei fed with pellets of different sizes. South China Fish. 2022, 19, 26–33. [Google Scholar]
- Lagardère, J.P.; Mallekh, R.; Mariani, A. Acoustic characteristics of two feeding modes used by brown trout (Salmo trutta), rainbow trout (Oncorhynchus mykiss) and turbot (Scophthalmus maximus). Aquaculture 2004, 240, 607–616. [Google Scholar] [CrossRef]
- Mallekh, R.; Lagardère, J.P.; Eneau, J.P.; Cloutour, C. An acoustic detector of turbot feeding activity. Aquaculture 2003, 221, 481–489. [Google Scholar] [CrossRef]
- Tang, T.L.; Tang, R.; Liu, S.J.; Chen, J.; Miao, L.; Zhou, R. Acoustic control of feeding in Tilapia culture. Prog. Fish. Sci. 2014, 35, 40–43. [Google Scholar]
- Qu, R.; Liu, H.; Liu, J.W.; Zhang, Y.L. Acoustic signal characteristics of Largemouth bass (Micropterus salmoides) in feeding process and the effects of breeding density. Fish. Mod. 2021, 48, 55–63. [Google Scholar]
- Cao, X.H.; Liu, H.; Qi, R.Y.; Zhang, C.L.; Liu, S.J. Acoustic characteristics of the feeding pellets for Micropterus salmoides in circulating aquaculture. Trans. Chin. Soc. Agric. Eng. 2021, 37, 219–225. [Google Scholar]
- Li, X.Y.; Guan, Y.H.; Luo, M.X.; Wu, B.Y. Modal parameter identification of covariance-based stochastic subspace identification based on Welch method. Chin. J. Theor. Appl. Mech. 2022, 54, 2850–2860. [Google Scholar]
- Farheen, S.; Awwab, M.; Sameena, N. Deep neural network for EEG signal-based subject-independent imaginary mental task classification. J. Ichthyol. 2008, 48, 640. [Google Scholar]
- Marco, R.; Daniel, J.; Johan, P. Soft-output signal detection for cetacean vocalizations using spectral entropy, K-means clustering and the continuous wavelet transform. Ecol. Inform. 2023, 74, 101990. [Google Scholar] [CrossRef]
- Yubiry, G.; Ronaldo, P. Similarity of muscial timbres using FFT-acoustic descriptor analysis and machine learning. Eng 2023, 4, 555–568. [Google Scholar]
- Kasumyan, A.O. Sounds and sound production in fishes. J. Ichthyol. 2008, 48, 981–1030. [Google Scholar] [CrossRef]
- Yu, Y.J.; Wu, Y.F. Comparative Studies of the Oral-Cavity Teeth of Several Perciform Fishes. J. Ocean. Univ. China 2004, 34, 29–36. [Google Scholar]
- Scholz, K.; Ladich, F. Sound production, hearing and possible interception under ambientnoise conditions in the topmouth minnow Pseudorasbora parva. J. Fish Biol. 2006, 69, 892–906. [Google Scholar] [CrossRef]
- Ren, X.M.; Gao, D.Z.; Yao, Y.l.; Yang, F.; Liu, J.F.; Xie, F.J. Study on the vocalization and signal characteristics of rhododendron. J. Dalian Fish. Univ. 2007, 22, 124–128. [Google Scholar]
- Lagardere, J.P.; Mallekh, R. Feeding sounds of turbot (Scophthalmus maximus) and their potential use in the control of food supply in aquaculture. Aquaculture 2000, 189, 251–258. [Google Scholar] [CrossRef]
- Liu, C. An improved speech endpointed detection algorithm analyses based on short-time average amplitude. J. Northwest Univ. Natl. (Nat. Sci.) 2009, 30, 56–59. [Google Scholar]
- Liu, B.; Hao, X.H.; Cai, X. Classification method of radio fuze target and interference signal based on power spectrum entropy. J. Beijing Univ. Aeronaut. Astronaut. 2022, 48, 1–10. [Google Scholar] [CrossRef]
- Ladich, F.; Anderw, H. Sonic/Vocal-Acousticolateralis Pathways in Teleost Fishes: A Transneuronal Biocytin Study in Mochokid Catfish. J. Comp. Neurol. 1996, 374, 493–505. [Google Scholar] [CrossRef]
- Yang, L.H.; He, D.Y.; Fang, L.; He, L.G. The Detection Method of Dolphin Vocal Endpoint Based on Time-Frequency Characteristics. J. Appl. Acoust. 2022, 13, 1–10. Available online: http://kns.cnki.net/kcms/detail/11.2121.o4.20220811.1518.004.html (accessed on 12 August 2022).
- Li, L.; Tu, Q.Z.; Huang, H.Y.; Zhao, S.M.; Xiong, S.B.; Ma, Z.Y. Freshwater Fish Identification Based on Passive Underwater Acoustic Signals. Trans. Chin. Soc. Agric. Mach. 2017, 48, 166–171. [Google Scholar]
- Huang, H.Y.; Yang, Y.W.; Li, L.; Zhao, S.M.; Xiong, S.B.; Tu, Q.Z. Mixed Proportion Identification of Freshwater Fish Based on Passive Underwater Acoustic Signals. Trans. Chin. Soc. Agric. Mach. 2019, 50, 215–221. [Google Scholar]
- Yang, Y.W.; Huang, H.Y.; Feng, W.X.; Li, L.; Xiong, S.B.; Zhao, S.M. Mixed quantities prediction of freshwater fish based on passive underwater acoustic signals. Trans. Chin. Soc. Agric. Mach. 2020, 39, 147–152. [Google Scholar]


| Group | Quantity (Fish) | Body Length (cm) | Body Weight (g) | Breeding Density (Fish·m−3) |
|---|---|---|---|---|
| F1 | 4 | 26.25 ± 2.63 | 308.75 ± 26.93 | 4 |
| F2 | 8 | 27.13 ± 2.41 | 310.86 ± 23.21 | 8 |
| F3 | 12 | 27.42 ± 2.97 | 319.25 ± 34.68 | 12 |
| F4 | 16 | 27.00 ± 2.76 | 314.50 ± 31.57 | 16 |
| Group | Breeding Density (Fish·m−3) | Frequency Range of Feeding Vocalizations (kHz) | Power Spectrum Main Peak Frequency (kHz) | Main Power Value (dBre 1 μPa) |
|---|---|---|---|---|
| F1 | 4 | 1–20 | 2.21 ± 1.31 a | −72.61 ± 3.34 d |
| F2 | 8 | 1–20 | 1.96 ± 0.99 a | −66.54 ± 3.69 c |
| F3 | 12 | 1–20 | 1.72 ± 0.56 a | −63.81 ± 2.89 b |
| F4 | 16 | 1–20 | 1.76 ± 0.58 a | −59.07 ± 1.89 a |
| Group | Breeding Density (Fish·m−3) | Acoustic Signal | |
|---|---|---|---|
| Swallowing | Chewing | ||
| F1 | 4 | 0.18 ± 0.06 d | 0.07 ± 0.03 b |
| F2 | 8 | 0.43 ± 0.23 c | 0.17 ± 0.08 a |
| F3 | 12 | 0.80 ± 0.17 b | 0.14 ± 0.05 a |
| F4 | 16 | 2.50 ± 0.31 a | 0.16 ±0.11 a |
| Correlation coefficient | 0.880 | 0.487 | |
Disclaimer/Publisher’s Note: The statements, opinions and data contained in all publications are solely those of the individual author(s) and contributor(s) and not of MDPI and/or the editor(s). MDPI and/or the editor(s) disclaim responsibility for any injury to people or property resulting from any ideas, methods, instructions or products referred to in the content. |
© 2023 by the authors. Licensee MDPI, Basel, Switzerland. This article is an open access article distributed under the terms and conditions of the Creative Commons Attribution (CC BY) license (https://creativecommons.org/licenses/by/4.0/).
Share and Cite
Qi, R.; Liu, H.; Liu, S. Effects of Different Culture Densities on the Acoustic Characteristics of Micropterus salmoide Feeding. Fishes 2023, 8, 126. https://doi.org/10.3390/fishes8030126
Qi R, Liu H, Liu S. Effects of Different Culture Densities on the Acoustic Characteristics of Micropterus salmoide Feeding. Fishes. 2023; 8(3):126. https://doi.org/10.3390/fishes8030126
Chicago/Turabian StyleQi, Renyu, Huang Liu, and Shijing Liu. 2023. "Effects of Different Culture Densities on the Acoustic Characteristics of Micropterus salmoide Feeding" Fishes 8, no. 3: 126. https://doi.org/10.3390/fishes8030126
APA StyleQi, R., Liu, H., & Liu, S. (2023). Effects of Different Culture Densities on the Acoustic Characteristics of Micropterus salmoide Feeding. Fishes, 8(3), 126. https://doi.org/10.3390/fishes8030126