

Bioeconomic Analysis of In-Pond Raceway System Production of Foodsize and Stocker Hybrid Catfish (Channel Catfish Ictalurus punctatus ♀ × Blue Catfish, I. furcatus ♂)


Abstract
:1. Introduction
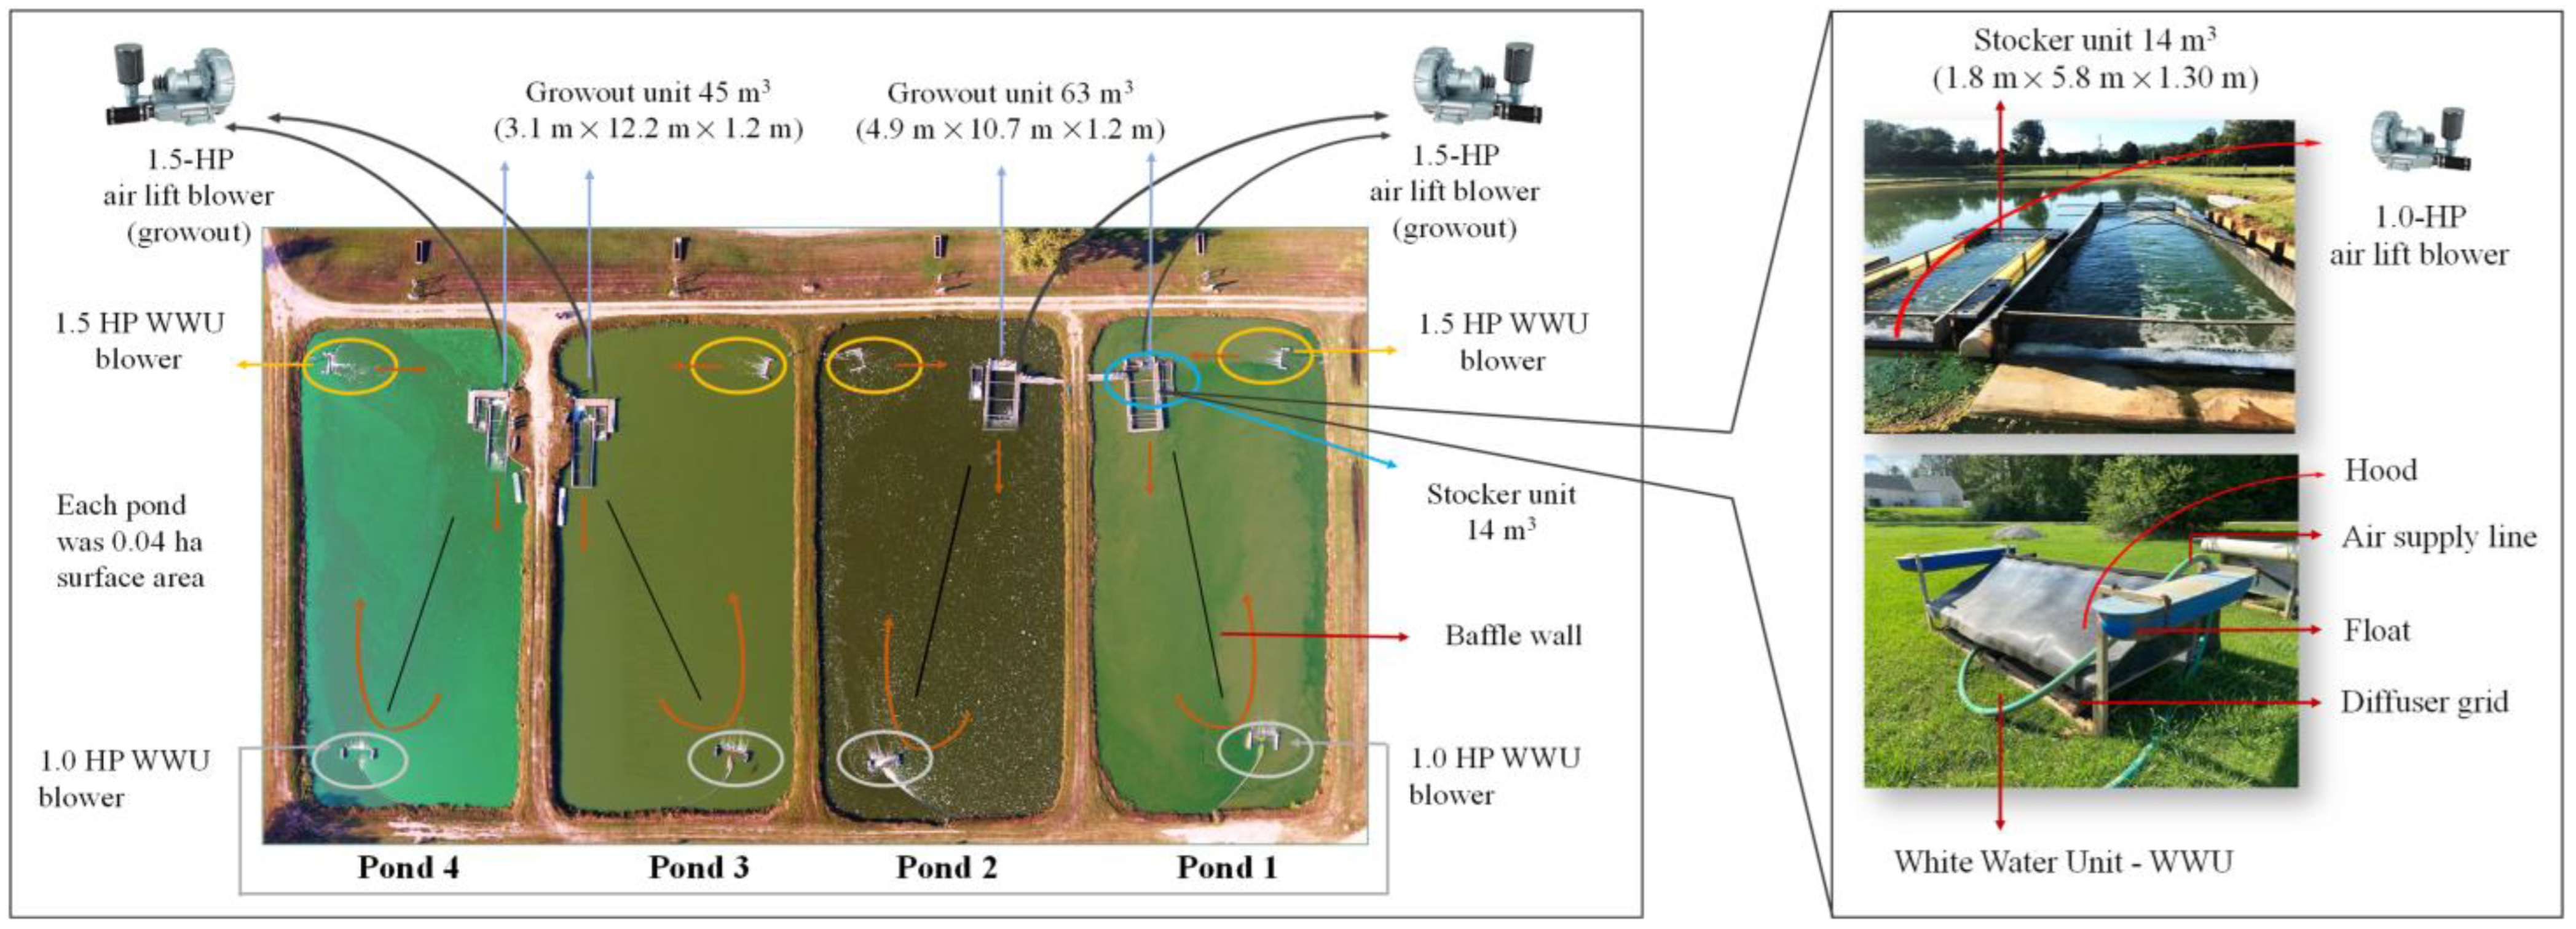
2. Materials and Methods
2.1. Performance Analysis
2.2. Economic Analysis
2.3. Sensitivity Analyses
3. Results
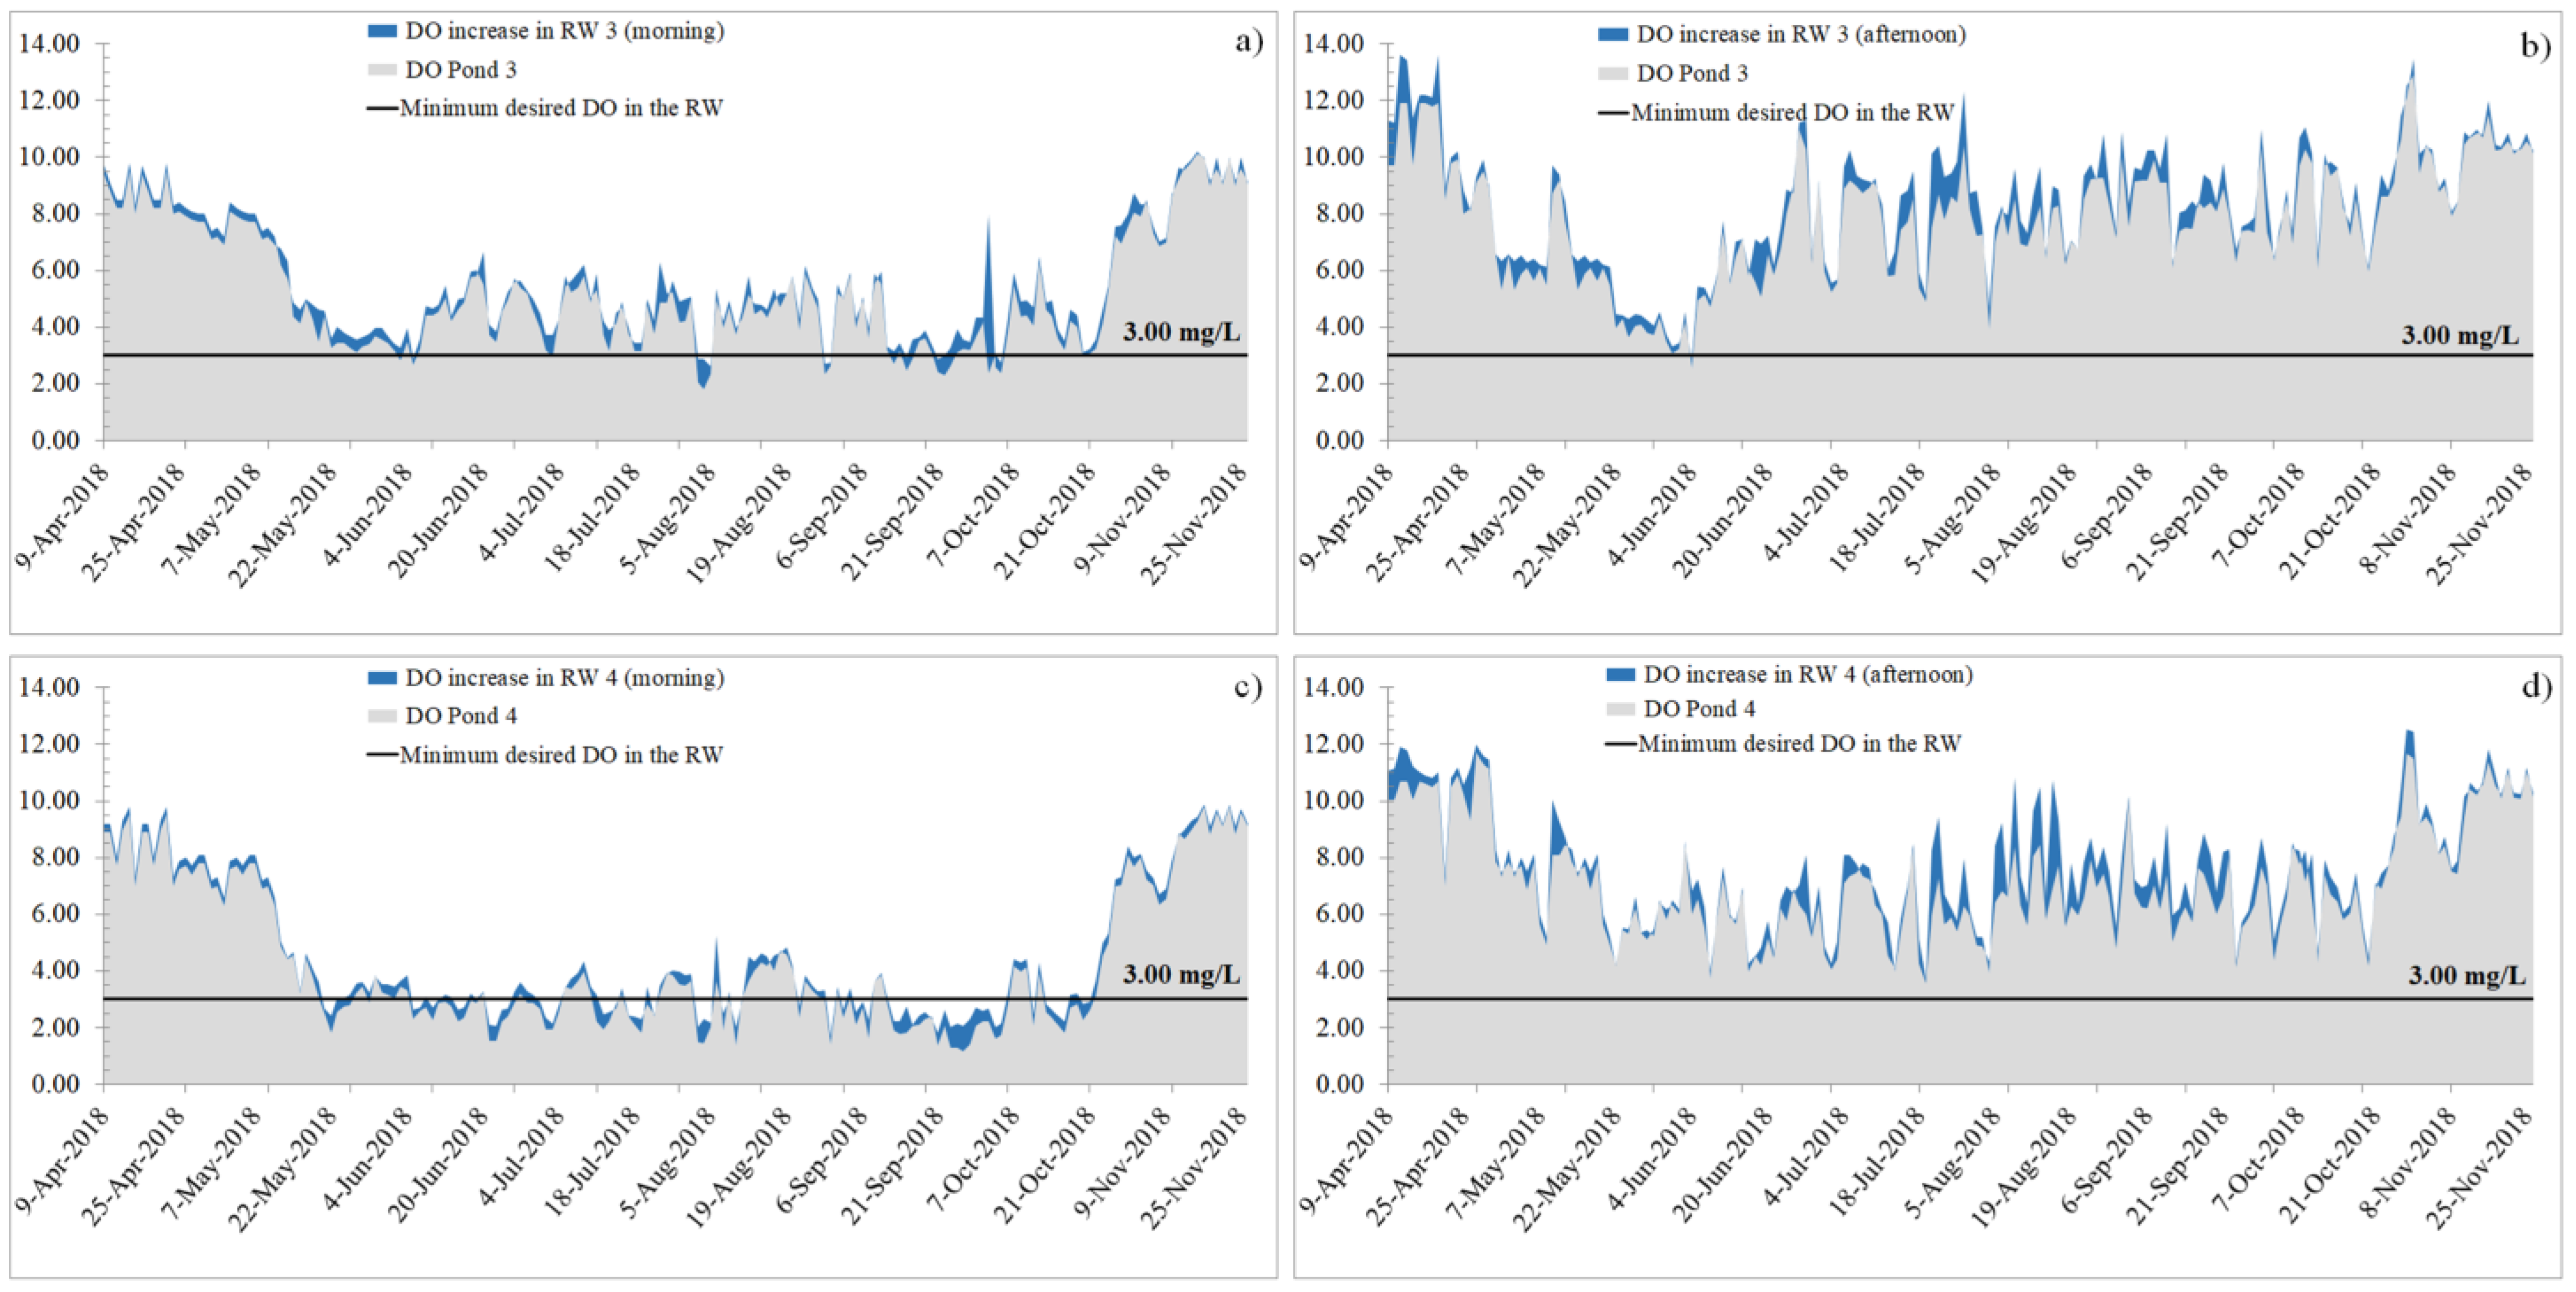
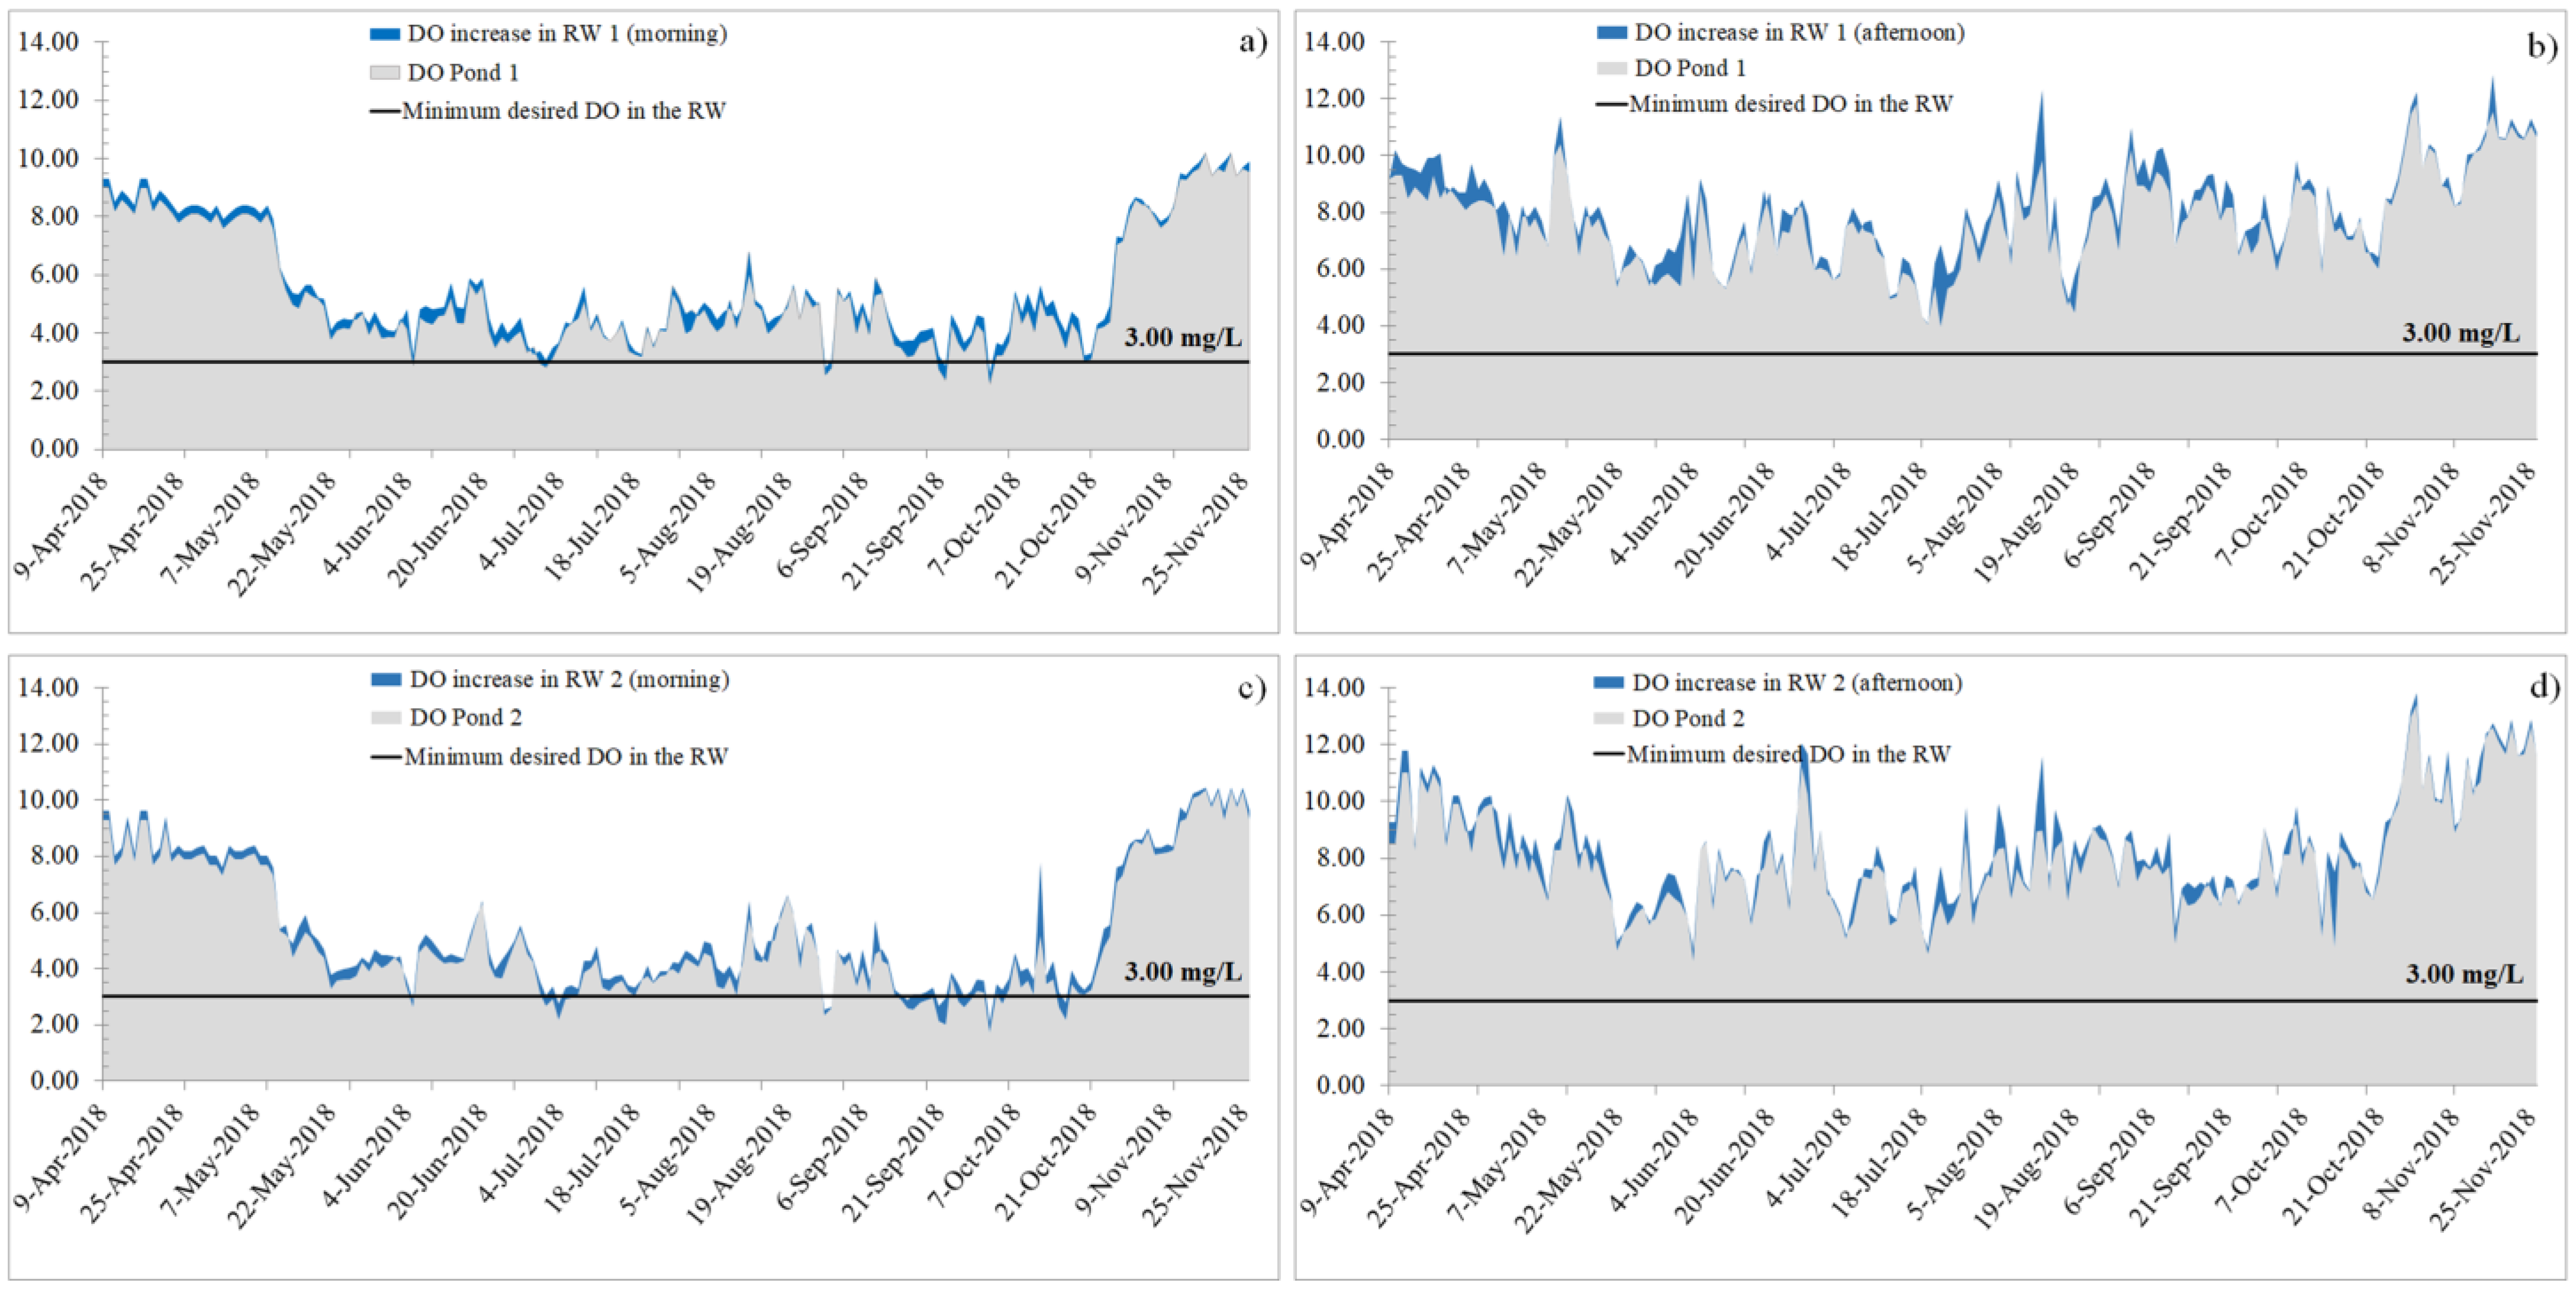
3.1. Water Quality
3.2. Fish Performance
3.3. Economic Analysis
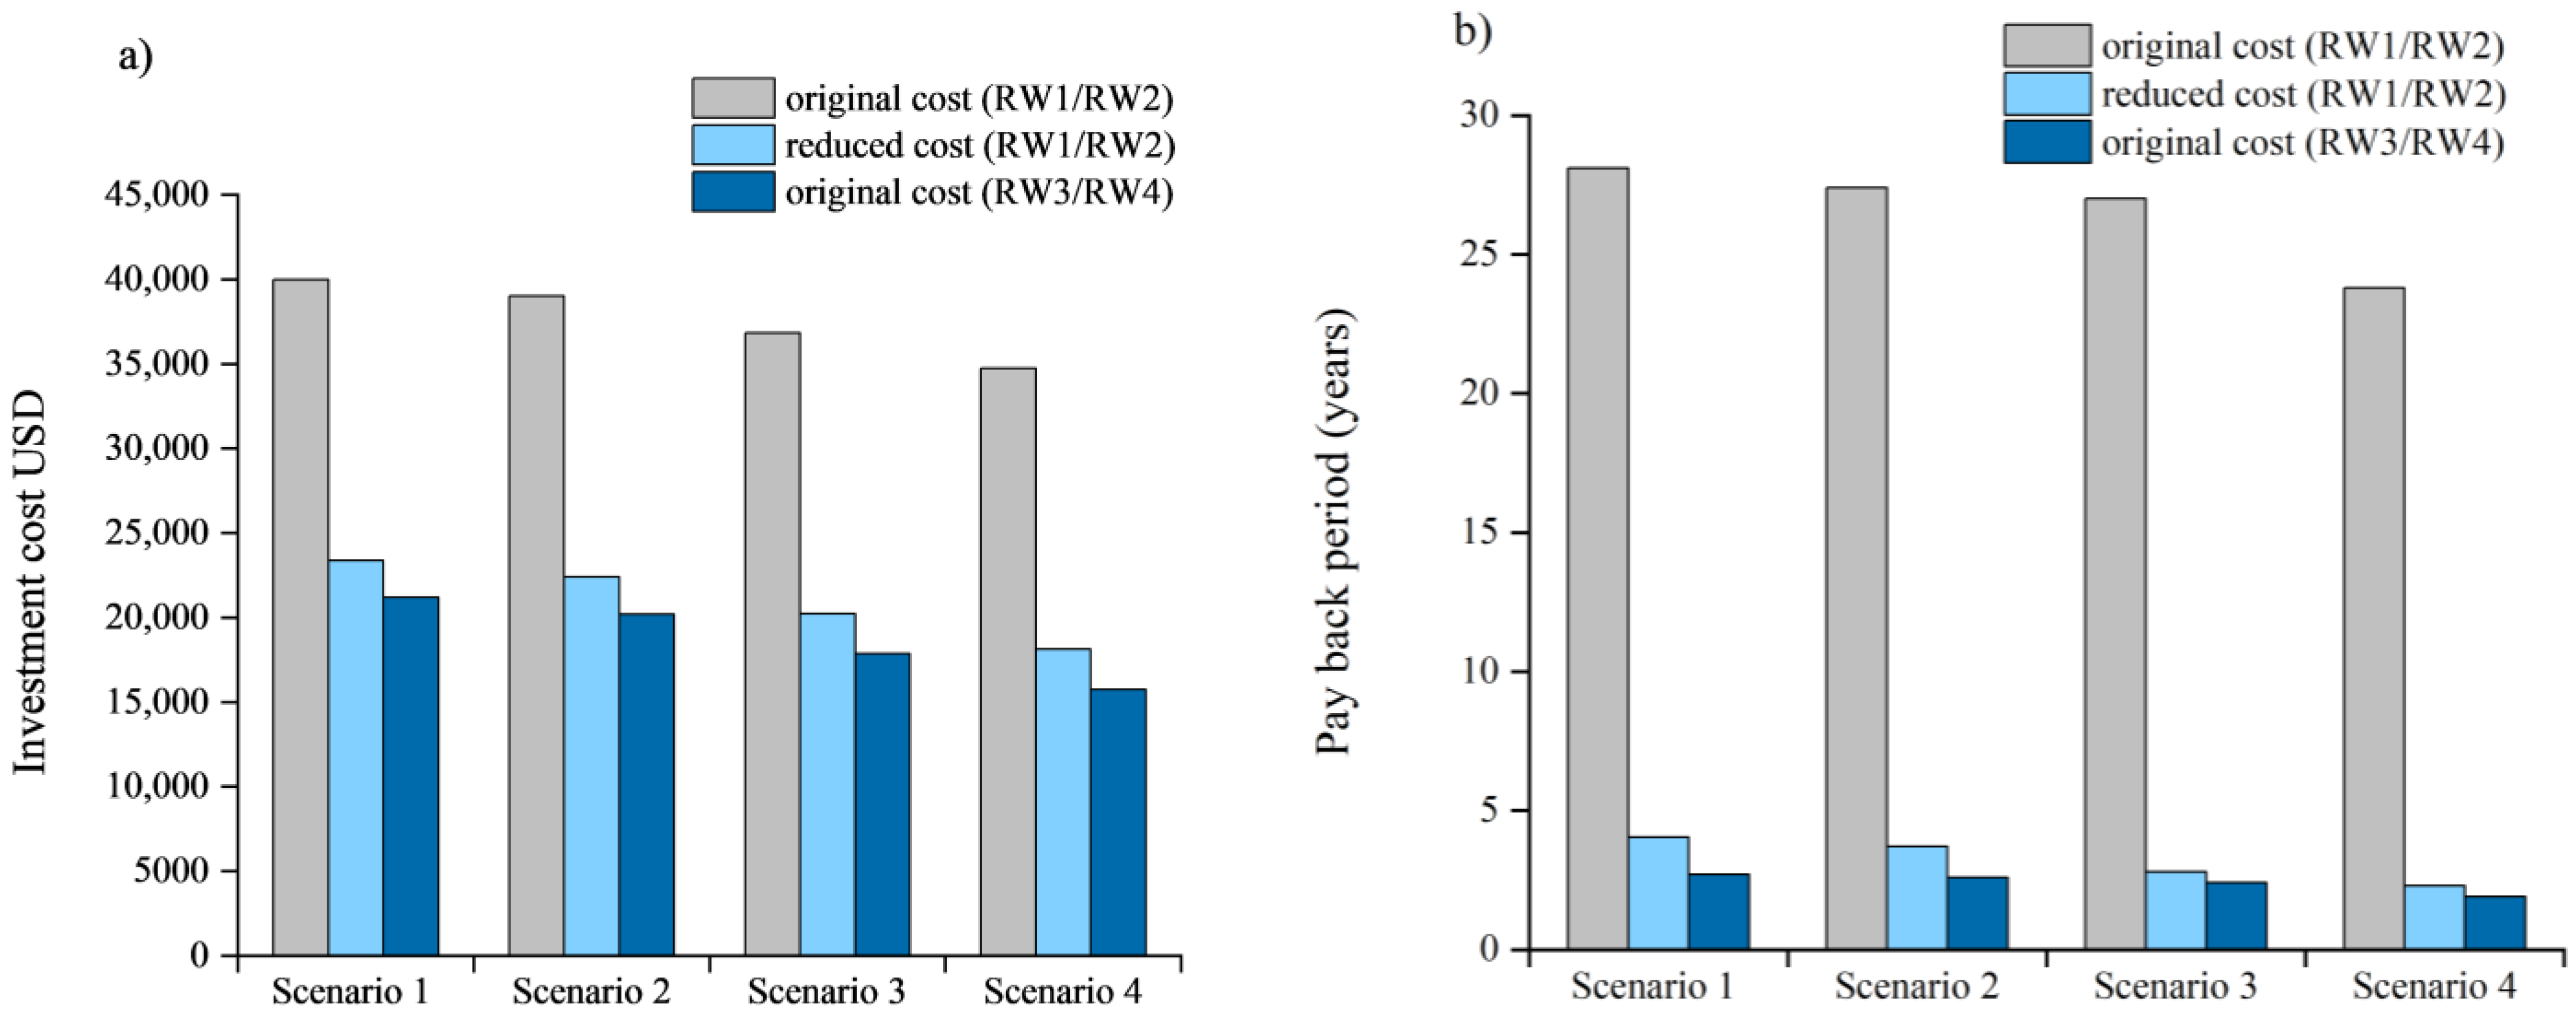
3.4. Sensitivity Analyses
4. Discussion
4.1. Water Quality
4.2. Fish Performance
4.3. Economic Analysis
5. Conclusions
Author Contributions
Funding
Institutional Review Board Statement
Data Availability Statement
Acknowledgments
Conflicts of Interest
References
- NMFS F of the US. 2020 Fisheries of the United States. National Marine Fisheries Service Office of Science and Technology Fisheries Statistics Division; NOAA National Marine Fisheries Service: Silver Spring, MD, USA, 2022; p. 28. Available online: https://media.fisheries.noaa.gov/2022-05/Fisheries-of-the-United-States-2020-Report-FINAL.pdf (accessed on 1 January 2023).
- Hanson, T. Catfish Processing—December 2022. January through December 2022 Processing Up 5 Percent from Same Period in 2021; Released 17 January 2022; The Catfish Institute: Jackson, MS, USA, 2022; p. 9. [Google Scholar]
- USDA, United States Department of Agriculture. Catfish Production. Catfish Value of Sales Up 12 Percent from 2020 [Internet]; National Agricultural Statistics Service (NASS): Washington, DC, USA, 2022. Available online: https://downloads.usda.library.cornell.edu/usda-esmis/files/bg257f046/8c97ms16p/n296z193k/cfpd0222.pdf (accessed on 1 January 2023).
- Hegde, S.; Kumar, G.; Engle, C.; Hanson, T.; Roy, L.A.; Cheatham, M.; Avery, J.; Aarattuthodiyil, S.; Senten, J.; Johnson, J.; et al. Technological progress in the US catfish industry. J. World Aquac. Soc. 2022, 53, 367–383. [Google Scholar] [CrossRef]
- Engle, C.R.; Hanson, T.; Kumar, G. Economic history of U.S. catfish farming: Lessons for growth and development of aquaculture. Aquac. Econ. Manag. 2021, 26, 1–35. [Google Scholar] [CrossRef]
- Boyd, C.E.; Torrans, E.L.; Tucker, C.S. Dissolved Oxygen and Aeration in Ictalurid Catfish Aquaculture: Dissolved oxygen and aeration. J. World Aquac. Soc. 2017, 49, 7–70. [Google Scholar] [CrossRef]
- Kumar, G.; Engle, C.R.; Hanson, T.R.; Tucker, C.S.; Brown, T.W.; Bott, L.B.; Roy, L.A.; Boyd, C.E.; Recsetar, M.S.; Park, J.; et al. Economics of alternative catfish production technologies. J. World Aquac. Soc. 2018, 49, 1039–1057. [Google Scholar] [CrossRef]
- Engle, C.R.; Christie, T.W.; Dorr, B.S.; Kumar, G.; Davis, B.; Roy, L.A.; Kelly, A.M. Principal economic effects of cormorant predation on catfish farms. J. World Aquac. Soc. 2020, 52, 41–56. [Google Scholar] [CrossRef]
- Kumar, G.; Gaunt, P. Medicated-Feed Intervention in Catfish Farming: An Economic Perspective. N. Am. J. Aquac. 2020, 82, 190–199. [Google Scholar] [CrossRef]
- Peterman, M.A.; Posadas, B.C. Direct Economic Impact of Fish Diseases on the East Mississippi Catfish Industry. N. Am. J. Aquac. 2019, 81, 222–229. [Google Scholar] [CrossRef]
- Wu, G.; Saoud, I.P.; Miller, C.; Davis, D.A. The Effect of Feeding Regimen on Mixed-Size Pond-Grown Channel Catfish, Ictalurus punctatus. J. Appl. Aquac. 2004, 15, 115–125. [Google Scholar] [CrossRef]
- Engle, C.R.; Valderrama, D. An Economic Analysis of the Performance of Three Sizes of Catfish Ictalurus punctatus Fingerlings Understocked in Multiple-Batch Production. J. World Aquac. Soc. 2001, 32, 393–401. [Google Scholar] [CrossRef]
- Kumar, G.; Wise, D.; Li, M.; Aarattuthodiyil, S.; Hegde, S.; Rutland, B.; Pruitt, S.; Griffin, M.; Khoo, L. Effect of understocking density of channel catfish fingerlings in intensively aerated multiple-batch production. J. World Aquac. Soc. 2020, 52, 30–40. [Google Scholar] [CrossRef]
- Hanson, T.R.; Bott, L.B.; Chappell, J.A.; Whitis, G.N.; Kelly, A.M.; Roy, L.A. Research Verification of Single- and Multiple-Batch Production Practices at Two Channel Catfish Farms in Western Alabama. N. Am. J. Aquac. 2020, 82, 1–10. [Google Scholar] [CrossRef]
- Bott, L.B.; Roy, L.A.; Hanson, T.R.; Chappell, J.; Whitis, G.N. Research Verification of Production Practices Using Intensive Aeration at a Hybrid Catfish Operation. N. Am. J. Aquac. 2015, 77, 460–470. [Google Scholar] [CrossRef]
- Kaliba, A.R.; Engle, C.R. Economic Impact of the Catfish Yield Verification Trials. J. Appl. Aquac. 2005, 17, 25–45. [Google Scholar] [CrossRef]
- Roy, L.A.; Brown, T.W. In-pond raceway systems: Are they a good alternative for U.S. catfish farmers? Ark. Aquafarm. 2016, 33, 6–7. [Google Scholar]
- Engle, C.R. Aquaculture Economics and Financing: Management and Analysis; Wiley-Blackwell: Hoboken, NJ, USA, 2010; p. 260. [Google Scholar]
- Kay, R.D.; Edwards, W.M.; Duffy, P.A. Farm Management, 9th ed.; McGraw Hill Education: New York, NY, USA, 2020; p. 480. [Google Scholar]
- Hall, J. What Is EBITDA and Why Does It Matter? The Motley Fool. 2021. Available online: https://www.fool.com/investing/how-to-invest/stocks/ebitda/ (accessed on 30 November 2021).
- Gallo, A.; A Refresher on Net Present Value. Harvard Business Review—Finance and Investing. 2014. Available online: https://hbr.org/2014/11/a-refresher-on-net-present-value (accessed on 30 November 2021).
- Shaner, W.W. Project Planning for Developing Economies; Praeger: New York, NY, USA, 1979; p. 235. [Google Scholar]
- Federal Reserve Bank of Kansas City. Average Effective Interest Rate on Non-Real Estate Bank Loans Made to Farmers. [Internet]. Available online: https://www.kansascityfed.org/agriculture/agfinance-updates/ (accessed on 1 January 2023).
- Boyd, C.E. Water Quality: An Introduction, 2nd ed.; Springer: Boston, MA, USA, 2015; 357p. [Google Scholar]
- Brown, T.W.; Chappell, J.A.; Boyd, C.E. A commercial-scale, in-pond raceway system for Ictalurid catfish production. Aquac. Eng. 2011, 44, 72–79. [Google Scholar] [CrossRef]
- Kumar, G.; Li, M.H.; Wise, D.J.; Mischke, C.C.; Rutland, B.; Tiwari, A.; Aarattuthodiyil, S.; Griffin, M.J.; Khoo, L.H.; Ott, B.; et al. Performance of Channel Catfish and Hybrid Catfish in Single-Batch, Intensively Aerated Ponds. N. Am. J. Aquac. 2019, 81, 406–416. [Google Scholar] [CrossRef]
- Roy, L.A.; Hanson, T.R.; Bott, L.B.; Chappell, J.A. Production and economic comparison of single versus multiple harvests of hybrid catfish in a commercial In-pond raceway system in West Alabama targeting two market outlets. JSAFWA 2019, 6, 58–66. [Google Scholar]
- Tucker, C.S.; Robinson, E.H. Channel Catfish Farming Handbook; Kluwer Academic Publishers: Boston, MA, USA; Dordrecht, The Netherlands; London, UK, 2002; 454p. [Google Scholar]
- Torrans, L.; Ott, B. Effects of Density on Production of Hybrid Catfish in Intensively Aerated Earthen Ponds where Dissolved Oxygen is Not a Limiting Factor. N. Am. J. Aquac. 2019, 81, 417–423. [Google Scholar] [CrossRef]
- Bott, L.B.; Roy, L.A.; Hanson, T. Chemical treatment costs reduced with in- pond raceway systems. Glob. Seaf. Alliance 2014, 17, 62–64. [Google Scholar]
- Brown, T.W.; Hanson, T.R.; Chappell, J.A.; Boyd, C.E.; Wilson, D.S. Economic Feasibility of an In-Pond Raceway System for Commercial Catfish Production in West Alabama. N. Am. J. Aquac. 2013, 76, 79–89. [Google Scholar] [CrossRef]
- Yuan, J.; Ni, M.; Liu, M.; Wang, H.; Zhang, C.; Mi, G.; Gu, Z. Analysis of the growth performances, muscle quality, blood biochemistry and antioxidant status of Micropterus salmoides farmed in in-pond raceway systems versus usual-pond systems. Aquaculture 2019, 511, 734241. [Google Scholar] [CrossRef]
- Wang, Y.; Xu, P.; Nie, Z.; Li, Q.; Shao, N.; Xu, G. Growth, digestive enzymes activities, serum biochemical parameters and antioxidant status of juvenile genetically improved farmed tilapia (Oreochromis niloticus) reared at different stocking densities in in-pond raceway recirculating culture system. Aquac. Res. 2019, 50, 1338–1347. [Google Scholar] [CrossRef]
- Wang, Y.; Xu, G.; Nie, Z.; Shao, N.; Li, Q.; Xu, P. Growth Performance of Bluntnose Black Bream, Channel Catfish, Yellow Catfish, and Largemouth Bass Reared in the In-Pond Raceway Recirculating Culture System. N. Am. J. Aquac. 2019, 81, 153–159. [Google Scholar] [CrossRef]
- Engle, C.R. Determining the Profitability of an Aquaculture Business: Using Income Statements and Enterprise Budgets; Southern Regional Aquaculture Center, SRAC: Stoneville, MS, USA, 2012; p. 6. [Google Scholar]
- Kumar, G.; Engle, C.; Avery, J.; Dorman, L.; Whitis, G.; Roy, L.A.; Xie, L. Characteristics of early adoption and non-adoption of alternative catfish production technologies in the U.S. Aquac. Econ. Manag. 2020, 25, 70–88. [Google Scholar] [CrossRef]
- Hanson, T. January through June 2021 Processing down 8 Percent from Same Period in 2020; Catfish Processing Report; Released 16 July 2021; The Catfish Institute: Jackson, MS, USA, 2021; p. 9. [Google Scholar]
- Hanson, T.; Roy, L.A.; Kelly, A.M. 2020 Alabama Farm-Raised Catfish Industry Highlights. Alabama Cooperative Station [Internet]. 2021, p. 2. Available online: https://www.aces.edu/blog/topics/aquaculture/alabama-farm-raised-catfish-industry-highlights/?cn-reloaded=1 (accessed on 30 November 2022).
- D’Abramo, L.R.; Steeby, J.A.; Hanson, T.R.; Gerard, P.D. Evaluation of a Fingerling-to-Stocker Phase as Part of a New Production Strategy for the Commercial Farming of Channel Catfish. N. Am. J. Aquac. 2007, 69, 22–35. [Google Scholar] [CrossRef]


| Description | Unit | Value per Unit |
|---|---|---|
| Catfish price | ||
| Fingerlings | ||
| - Used in growout raceways | USD/each | 0.17 |
| - Used in stocker raceways | USD/each | 0.16 |
| Harvest size sales price | ||
| - Small < 0.454 kg | USD/kg | 2.40 |
| - Premium: 0.454–1.82 kg | USD/kg | 2.46 |
| Stocker inventory value price | USD/kg | |
| - Stocker < 0.454 kg | USD/kg | 2.40 |
| - Stocker > 0.454 kg | USD/kg | 2.46 |
| Feed | ||
| 32% crude protein | USD/metric ton | 430 |
| Management and labor | ||
| Management | USD/ha/year | 600 |
| Hired labor | USD/hour | 10.00 |
| Chemicals | ||
| Lime, agricultural | USD/metric ton | 50.00 |
| Lime, hydrated | USD/kg | 0.62 |
| Salt | USD/metric ton | 135.00 |
| Copper sulfate | USD/22.68-kg bag USD/kg | 65.00 2.87 |
| Rotenone | USD/L | 13.00 |
| Formalin | USD/208.19 L drum USD/L | 440 2.11 |
| Diquat | USD/L | 3.00 |
| Potassium permanganate | USD/kg | 11.63 |
| Fuel | ||
| Gasoline off-road price for agriculture | USD/L | 0.72 |
| Diesel price off-road | USD/L | 0.79 |
| Electricity, per kWhr at off-peak rate | USD/kW-hour | 0.07 |
| Other | ||
| Insurance | USD/ha | 2.53 |
| Miscellaneous expenses | USD/cycle | 200.00 |
| Bird netting for two raceways | USD/roll | 163.00 |
| Investment | |||||
|---|---|---|---|---|---|
| Items | USD | Quantity | 63 m3 IPRS | Quantity | 45 m3 IPRS |
| Capital items | |||||
| Land, USD/ha | 2031 | 0.49 | 986 | 0.49 | 986 |
| Pond construction a, USD/ha | 3830 | 0.40 | 1550 | 0.40 | 1550 |
| Growout RW1 and RW2, placed in ponds 1 and 2 (4.9 m × 10.7 m × 1.2 m = 63 m3) | 25,000 | 1 | 25,000 | - | - |
| Growout RW3 and RW4, placed in ponds 3 and 4 (3.0 m × 12.2 m × 1.2 m = 45 m3) | 6000 | - | - | 1 | 6000 |
| Stocker unit RWs, placed in ponds 1, 2, 3, and 4 (1.8 m × 5.8 m × 1.30 m = 14 m3) | 1867 | 1 | 1867 | 1 | 1867 |
| Subtotal | 29,403 | 10,403 | |||
| Machinery and Equipment | |||||
| Equipment b, USD/ha | 3739 | 0.40 | 1513 | 0.40 | 1513 |
| 1.0 HP blower for white water unit | 880 | 1 | 880 | 1 | 880 |
| 1.5 HP blower for raceway unit | 1200 | 1 | 1200 | 1 | 1200 |
| 1.5 HP blower for white water unit | 1200 | 1 | 1200 | 1 | 1200 |
| 1.0 HP blower for small RW unit | 900 | 1 | 900 | 1 | 900 |
| White water unit (large RWs) | 2500 | 1 | 2500 | 1 | 2500 |
| White water unit (small RWs) | 1200 | 1 | 1200 | 1 | 1200 |
| Baffle fencing and floats | 200 | 1 | 200 | 1 | 200 |
| Boardwalks—raceways 1 and 2 | 1000 | 1 | 1000 | - | - |
| Boardwalks—raceways 3 and 4 | 1200 | - | - | 1 | 1200 |
| Subtotal | 10,593 | 10,793 | |||
| TOTAL | 39,996 | 21,196 | |||
| Pond 1 | RW 1 | Pond 2 | RW 2 | Pond 3 | RW 3 | Pond 4 | RW 4 | |
|---|---|---|---|---|---|---|---|---|
| DO range, mg/L | 2.3–12.9 | 2.6–11.8 | 1.7–13.8 | 2.4–13.4 | 1.8–13.4 | 2.4–12.9 | 1.2–12.5 | 1.7–12.0 |
| Temperature °C | 12.0–33.3 | 12.0–33.1 | 12.0–33.6 | 12.0–33.6 | 12.0–33.5 | 12.0–33.4 | 12.0–33.2 | 12.0–32.4 |
| Total alkalinity | – | 80–110 | – | 60–95 | – | 60–100 | – | 70–80 |
| Total hardness | – | 70–90 | – | 45–70 | – | 50–70 | – | 60–80 |
| Chloride | – | 240–380 | – | 120–400 | – | 120–400 | – | 140–400 |
| pH | – | 7.2–8.3 | – | 7.2–9.5 | – | 7.1–9.5 | – | 6.9–9.1 |
| TAN mg/L | – | 0.2–2.0 | – | 0.0–3.0 | – | 0.0–3.0 | – | 0.2–1.0 |
| NH3 mg/L | – | 0.0–0.8 | – | 0.0–2.1 | – | 0.0–1.2 | – | 0.0–0.2 |
| NO2- mg/L | – | 0.1–0.3 | – | 0.0–0.6 | – | 0.0–0.3 | – | 0.0–0.8 |
| Secchi disk (m) | 0.18–0.35 | – | 0.23–0.33 | – | 0.18–0.32 | – | 0.18–0.28 | – |
| Raceway 1 63 m3 | Raceway 2 63 m3 | Average Raceways 1 and 2 (Standard Error) | Raceway 3 45 m3 | Raceway 4 45 m3 | Average Raceways 3 and 4 (Standard Error) | |
|---|---|---|---|---|---|---|
| Production cycle (days) | 228 | 228 | 228 | 228 | 228 | 228 |
| Number of fish stocked | 8714 | 8657 | 8686 (29) | 8603 | 8592 | 8597 (6) |
| Stocking density (fish/m3) | 138 | 137 | 138 (0.5) | 191 | 191 | 191 (0.1) |
| Stocking density (fish/ha) | 21,533 | 21,391 | 21,462 (71) | 21,258 | 21,230 | 21,244 (14) |
| Stocking density (kg/m3) | 4.4 | 4.2 | 4.3 (0.1) | 5.9 | 6.2 | 6.0 (0.1) |
| Mean weight at stocking (g) | 31.8 | 30.4 | 31.1 (0.7) | 30.9 | 32.2 | 31.6 (0.7) |
| Stocking biomass (kg) | 277 | 263 | 270 (6.8) | 266 | 277 | 271 (5.7) |
| Mean weight at harvest (g) | 625 | 602 | 613 (11.8) | 661 | 564 | 613 (48.9) |
| Total harvested (kg) | 4508 | 5132 | 4820 (311.8) | 5277 | 4385 | 4831 (446.1) |
| Total harvest (number) | 7218 | 8539 | 7878 (660) | 7978 | 7779 | 7878 (99) |
| Feed fed (kg) | 7321 | 8298 | 7809 (488.5) | 7363 | 7722 | 7543 (179.9) |
| Net FCR a | 1.73 | 1.70 | 1.72 (0.01) | 1.47 | 1.88 | 1.67 (0.21) |
| Standing crop at harvest (kg/m3) | 71.6 | 81.5 | 76.5 (4.9) | 117.3 | 97.4 | 107.4 (9.9) |
| Yield b (kg/ha) | 11,271 | 12,830 | 12,050 (780) | 13,193 | 10,963 | 12,078 (1115) |
| Net Yield c (kg/ha) | 10,578 | 12,172 | 11,375 (797) | 12,529 | 10,271 | 11,400 (1129) |
| Average feeding rate (kg/ha/day) | 80.3 | 91.0 | 85.6 (5.4) | 80.7 | 84.7 | 82.7 (2.0) |
| SGR d (g/fish/day) | 2.60 | 2.50 | 2.55 (0.05) | 2.77 | 2.33 | 2.55 (0.2) |
| Survival (%) | 82.8 | 98.6 | 90.7 (8.3) | 92.7 | 90.5 | 91.6 (0.01) |
| Raceway 1 14 m3 | Raceway 2 14 m3 | Average Raceway 1 and 2 (Standard Error) | Raceway 3 14 m3 | Raceway 4 14 m3 | Average Raceway 3 and 4 (Standard Error) | |
|---|---|---|---|---|---|---|
| Production cycle (days) | 143 | 143 | 143 | 143 | 143 | 143 |
| Number of fish stocked | 10,000 | 10,159 | 10,079 (79) | 10,147 | 10,735 | 10,441 (294) |
| Stocking density (fish/m3) | 714 | 726 | 720 (5.7) | 725 | 767 | 746 (21.0) |
| Stocking density (fish/ha) | 24,710 | 25,102 | 24,906 (196) | 25,073 | 26,527 | 25,800 (727) |
| Stocking density (kg/m3) | 18.5 | 20.8 | 19.6 (1.1) | 22.4 | 23.7 | 23.0 (0.6) |
| Mean weight at stocking (g) | 25.9 | 28.6 | 27.2 (1.4) | 30.9 | 30.9 | 30.9 (0.0) |
| Stocking biomass (kg) | 259 | 291 | 275 (15.9) | 313 | 331 | 322 (9.08) |
| Mean weight at harvest (g) | 201 | 123 | 162 (39.3) | 133 | 234 | 183 (50.4) |
| Total harvested (kg) | 1415 | 1709 | 1562 (147.0) | 1755 | 1603 | 1679 (76.3) |
| Total harvest (number) | 7041 | 10,039 | 8540 (1499) | 8919 | 6989 | 7954 (964) |
| Feed fed (kg) | 2004 | 2296 | 2150 (146.0) | 2335 | 2255 | 2295 (40.2) |
| Net FCR a | 1.73 | 1.62 | 1.67 (0.06) | 1.62 | 1.77 | 1.70 (0.08) |
| Standing crop at harvest (kg/m3) | 101.1 | 122.0 | 111.6 (10.5) | 125.4 | 114.5 | 119.9 (5.4) |
| Yield b (kg/ha) | 3537 | 4272 | 3904 (367.4) | 4388 | 4007 | 4197 (190.7) |
| Net Yield c (kg/ha) | 2890 | 3545 | 3218 (327.7) | 3605 | 3178 | 3391 (213.4) |
| Average feeding rate (kg/ha/day) | 35.0 | 40.1 | 37.59 (2.6) | 40.8 | 39.4 | 40.1 (0.7) |
| SGR d (g/fish/day) | 1.23 | 0.66 | 0.94 (0.3) | 0.71 | 1.42 | 1.07 (0.4) |
| Survival (%) | 70.4 | 98.8 | 84.6 (14.2) | 87.9 | 65.1 | 76.5 (11.4) |
| Raceway 1 63 m3 | Raceway 2 63 m3 | Average Raceway 1 and 2 | Raceway 3 45 m3 | Raceway 4 45 m3 | Average Raceway 3 and 4 | |||||||
|---|---|---|---|---|---|---|---|---|---|---|---|---|
| Value or Cost | Value or Cost/kg | Value or Cost | Value or Cost/kg | Value or Cost | Value or Cost/kg | Value or Cost | Value or Cost/kg | Value or Cost | Value or Cost/kg | Value or Cost | Value or Cost/kg | |
| Catfish sales receipts | ||||||||||||
| Small, <0.454 kg | 2782 | 2.40 | 2811 | 2.40 | 2797 | 2.40 | 1484 | 2.40 | 3000 | 2.40 | 2242 | 2.40 |
| Primium:0.454–1.82 kg | 8244 | 2.46 | 9749 | 2.46 | 8996 | 2.46 | 11,455 | 2.46 | 7708 | 2.46 | 9581 | 2.46 |
| Total receipts | 11,026 | 2.45 | 12,560 | 2.45 | 11,793 | 2.45 | 12,939 | 2.45 | 10,708 | 2.44 | 11,823 | 2.45 |
| Variable costs | ||||||||||||
| Feed, 32% protein | 3143 | 0.70 | 3562 | 0.69 | 3353 | 0.70 | 2760 | 0.52 | 3315 | 0.76 | 3038 | 0.64 |
| Labor and management | 1452 | 0.32 | 1432 | 0.28 | 1442 | 0.30 | 1432 | 0.27 | 1398 | 0.32 | 1415 | 0.30 |
| Catfish fingerlings | 1438 | 0.32 | 1428 | 0.28 | 1433 | 0.30 | 1419 | 0.27 | 1418 | 0.32 | 1419 | 0.30 |
| Carp fingerlings | 49 | 0.01 | 49 | 0.01 | 49 | 0.01 | 49 | 0.01 | 48 | 0.01 | 48 | 0.01 |
| Harvest and transportation | 497 | 0.11 | 566 | 0.11 | 531 | 0.11 | 581 | 0.11 | 483 | 0.11 | 532 | 0.11 |
| Fuel (diesel and gas) | 47 | 0.01 | 46 | 0.01 | 46 | 0.01 | 46 | 0.01 | 45 | 0.01 | 46 | 0.01 |
| Repairs and maintenance | 200 | 0.04 | 200 | 0.04 | 200 | 0.04 | 400 | 0.08 | 400 | 0.09 | 400 | 0.08 |
| Electricity, aeration | 1191 | 0.26 | 1180 | 0.23 | 1185 | 0.25 | 1180 | 0.22 | 1162 | 0.27 | 1171 | 0.24 |
| Chemicals | 1061 | 0.24 | 1045 | 0.20 | 1053 | 0.22 | 1144 | 0.22 | 1113 | 0.25 | 1129 | 0.24 |
| Miscellaneous | 100 | 0.02 | 90 | 0.02 | 95 | 0.02 | 99 | 0.02 | 96 | 0.02 | 97 | 0.02 |
| Interest on operating capital | 386 | 0.09 | 404 | 0.08 | 395 | 0.08 | 383 | 0.07 | 399 | 0.09 | 391 | 0.08 |
| Total variable cost | 9564 | 2.12 | 10,001 | 1.95 | 9782 | 2.03 | 9494 | 1.80 | 9876 | 2.25 | 9685 | 2.03 |
| Income above variable costs | 1462 | 0.32 | 2559 | 0.50 | 2010 | 0.42 | 3445 | 0.65 | 832 | 0.19 | 2138 | 0.44 |
| Fixed costs | ||||||||||||
| Land charge | 493 | 0.11 | 493 | 0.10 | 493 | 0.10 | 493 | 0.09 | 493 | 0.11 | 493 | 0.10 |
| Depreciation on capital items | 761 | 0.17 | 761 | 0.15 | 761 | 0.16 | 375 | 0.07 | 375 | 0.09 | 375 | 0.08 |
| Depreciation on machinery and equipment items | 649 | 0.14 | 649 | 0.13 | 649 | 0.14 | 655 | 0.12 | 655 | 0.15 | 655 | 0.14 |
| Interest on capital loans | 757 | 0.17 | 757 | 0.15 | 757 | 0.16 | 199 | 0.04 | 199 | 0.05 | 199 | 0.04 |
| Interest on equipment loans | 183 | 0.04 | 183 | 0.04 | 183 | 0.04 | 186 | 0.04 | 186 | 0.04 | 186 | 0.04 |
| Repairs and maintenance | 10 | 0.00 | 10 | 0.00 | 10 | 0.00 | 10 | 0.00 | 10 | 0.00 | 10 | 0.00 |
| Taxes | 606 | 0.13 | 606 | 0.12 | 606 | 0.13 | 326 | 0.06 | 326 | 0.07 | 326 | 0.07 |
| Insurance | 2 | 0.00 | 2 | 0.00 | 2 | 0.00 | 2 | 0.00 | 2 | 0.00 | 4 | 0.00 |
| Total fixed costs | 3461 | 0.77 | 3461 | 0.67 | 3461 | 0.72 | 2247 | 0.43 | 2247 | 0.51 | 2249 | 0.47 |
| Total costs | 13,025 | 2.89 | 13,461 | 2.62 | 13,243 | 2.76 | 11,741 | 2.23 | 12,124 | 2.77 | 11,934 | 2.50 |
| Net return above all costs | −1999 | −0.44 | −902 | −0.18 | −1450 | −0.31 | 1198 | 0.23 | −1416 | −0.32 | −110 | −0.05 |
| Raceway 1 14 m3 | Raceway 2 14 m3 | Average Raceway 1 and 2 | Raceway 3 14 m3 | Raceway 4 14 m3 | Average Raceway 3 and 4 | |||||||
|---|---|---|---|---|---|---|---|---|---|---|---|---|
| Value or Cost | Value or Cost/kg | Value or Cost | Value or Cost/kg | Value or Cost | Value or Cost/kg | Value or Cost | Value or Cost/kg | Value or Cost | Value or Cost/kg | Value or Cost | Value or Cost/kg | |
| Inventory/sale value | ||||||||||||
| Catfish stocker <0.454 kg | 3232 | 2.40 | 4104 | 2.40 | 3668 | 2.40 | 4212 | 2.40 | 3402 | 2.40 | 3807 | 2.40 |
| Catfish stocker > 0.454 kg | 170 | 2.46 | 0 | 2.46 | 85 | 2.46 | 0 | 2.46 | 454 | 2.46 | 227 | 2.46 |
| Total | 3402 | 2.40 | 4104 | 2.40 | 3753 | 2.40 | 4212 | 2.40 | 3857 | 2.41 | 4034 | 2.41 |
| Variable costs | ||||||||||||
| Feed, 32% protein | 861 | 0.61 | 986 | 0.58 | 923 | 0.59 | 1002 | 0.57 | 968 | 0.60 | 985 | 0.59 |
| Labor and management | 456 | 0.32 | 477 | 0.28 | 466 | 0.30 | 476 | 0.27 | 511 | 0.32 | 494 | 0.30 |
| Catfish fingerlings | 1610 | 1.14 | 1636 | 0.96 | 1623 | 1.05 | 1634 | 0.93 | 1728 | 1.08 | 1681 | 1.01 |
| Carp fingerlings | 16 | 0.01 | 16 | 0.01 | 16 | 0.01 | 16 | 0.01 | 17 | 0.01 | 17 | 0.01 |
| Fuel (diesel and gas) | 15 | 0.01 | 16 | 0.01 | 15 | 0.01 | 15 | 0.01 | 16 | 0.01 | 16 | 0.01 |
| Repairs and maintenance | 50 | 0.04 | 50 | 0.03 | 50 | 0.03 | 50 | 0.03 | 50 | 0.03 | 50 | 0.03 |
| Electricity, aeration | 419 | 0.30 | 430 | 0.25 | 424 | 0.27 | 429 | 0.24 | 442 | 0.28 | 436 | 0.26 |
| Chemicals | 315 | 0.22 | 329 | 0.19 | 322 | 0.21 | 329 | 0.19 | 388 | 0.24 | 358 | 0.21 |
| Miscellaneous | 31 | 0.02 | 33 | 0.02 | 32 | 0.02 | 33 | 0.02 | 35 | 0.02 | 34 | 0.02 |
| Interest on operating capital | 159 | 0.11 | 167 | 0.10 | 163 | 0.10 | 168 | 0.10 | 175 | 0.11 | 171 | 0.10 |
| Total variable cost | 3930 | 2.78 | 4138 | 2.42 | 4034 | 2.60 | 4152 | 2.37 | 3315 | 0.76 | 4242 | 2.54 |
| Income above variable cost | −528 | −0.37 | −35 | −0.02 | −197 | −0.12 | 59 | 0.03 | −474 | −0.30 | −207 | −0.12 |
| Fixed costs | ||||||||||||
| Land charge | 493 | 0.35 | 493 | 0.29 | 493 | 0.32 | 493 | 0.28 | 493 | 0.31 | 493 | 0.29 |
| Depreciation on capital items | 197 | 0.14 | 197 | 0.12 | 197 | 0.13 | 197 | 0.11 | 197 | 0.12 | 197 | 0.12 |
| Depreciation for machinery and equipment items | 415 | 0.29 | 415 | 0.24 | 415 | 0.27 | 421 | 0.24 | 421 | 0.26 | 421 | 0.25 |
| Interest on capital loans | 78 | 0.05 | 78 | 0.05 | 78 | 0.05 | 78 | 0.04 | 78 | 0.05 | 78 | 0.05 |
| Interest on equipment loans | 137 | 0.10 | 137 | 0.08 | 137 | 0.09 | 140 | 0.08 | 140 | 0.09 | 140 | 0.08 |
| Repairs and maintenance | 10 | 0.01 | 10 | 0.01 | 10 | 0.01 | 10 | 0.01 | 10 | 0.01 | 10 | 0.01 |
| Taxes | 144 | 0.10 | 144 | 0.08 | 144 | 0.09 | 146 | 0.08 | 146 | 0.09 | 146 | 0.09 |
| Insurance | 2 | 0.00 | 2 | 0.00 | 2 | 0.00 | 2 | 0.00 | 2 | 0.00 | 2 | 0.00 |
| Total fixed costs | 1477 | 1.04 | 1477 | 0.86 | 1477 | 0.95 | 1488 | 0.85 | 1488 | 0.93 | 1488 | 0.89 |
| Total costs | 5407 | 3.82 | 5615 | 3.29 | 5511 | 3.55 | 5640 | 3.22 | 5819 | 3.63 | 5730 | 3.43 |
| Net return above all costs | −2005 | −0.48 | −1511 | −0.22 | −1758 | −0.35 | −1428 | 0.17 | −1962 | −0.36 | −1695 | −0.09 |
| Pond 1 | Pond 2 | Average Pond 1 and 2 | Pond 3 | Pond 4 | Average Pond 3 and 4 | |||||||
|---|---|---|---|---|---|---|---|---|---|---|---|---|
| Value or Cost | Cost per kg | Value or Cost | Cost per kg | Value or Cost | Cost per kg | Value or Cost | Cost per kg | Value or Cost | Cost per kg | Value or Cost | Cost per kg | |
| Growout IPRS | ||||||||||||
| Catfish sales receipts | ||||||||||||
| Small, <0.454 kg | 2782 | 2.40 | 2811 | 2.40 | 2797 | 2.40 | 1484 | 2.40 | 3000 | 2.40 | 2242 | 2.40 |
| Primium: 0.454–1.82 kg | 8244 | 2.46 | 9749 | 2.46 | 8996 | 2.46 | 11,455 | 2.46 | 7708 | 2.46 | 9581 | 2.46 |
| Total receipts | 11,026 | 2.45 | 12,560 | 2.45 | 11,793 | 2.45 | 12,939 | 2.45 | 10,708 | 2.44 | 11,823 | 2.45 |
| Variable costs | 9564 | 2.12 | 10,001 | 1.95 | 9782 | 2.04 | 9494 | 1.80 | 9876 | 2.25 | 9685 | 2.03 |
| Income above variable costs | 1462 | 0.32 | 2559 | 0.50 | 2010 | 0.42 | 3445 | 0.65 | 832 | 0.19 | 2138 | 0.44 |
| Fixed costs | 3461 | 0.77 | 3461 | 0.67 | 3461 | 0.72 | 2247 | 0.43 | 2247 | 0.51 | 2249 | 0.47 |
| Total costs | 13,025 | 2.89 | 13,461 | 2.62 | 13,243 | 2.76 | 11,741 | 2.23 | 12,124 | 2.77 | 11,934 | 2.50 |
| Net return above all costs | −1999 | −0.44 | −902 | −0.18 | −1450 | −0.31 | 1198 | 0.23 | −1416 | −0.32 | −110 | −0.05 |
| Stocker inventory/sale value | ||||||||||||
| Catfish stocker <0.454 kg | 3232 | 2.40 | 4104 | 2.40 | 3668 | 2.40 | 4212 | 2.40 | 3402 | 2.40 | 3807 | 2.40 |
| Catfish stocker > 0.454 kg | 170 | 2.46 | 0 | 2.46 | 85 | 2.46 | 0 | 2.46 | 454 | 2.46 | 227 | 2.46 |
| Total sales value | 3402 | 2.40 | 4104 | 2.40 | 3753 | 2.40 | 4212 | 2.40 | 3857 | 2.41 | 4034 | 2.41 |
| Variable costs | 3930 | 2.78 | 4138 | 2.42 | 4034 | 2.60 | 4152 | 2.37 | 3315 | 0.76 | 4242 | 2.54 |
| Income above variable costs | −528 | −0.37 | −35 | −0.02 | −281 | −0.18 | 59 | 0.03 | −474 | −0.30 | −207 | −0.12 |
| Fixed costs | 1477 | 1.04 | 1477 | 0.86 | 1477 | 0.95 | 1488 | 0.85 | 1488 | 0.93 | 1488 | 0.89 |
| Total costs | 5407 | 3.82 | 5615 | 3.29 | 5511 | 3.55 | 5640 | 3.22 | 5819 | 3.63 | 5730 | 3.43 |
| Net return above all costs | −2005 | −0.48 | −1511 | −0.22 | −1758 | −0.35 | −1428 | 0.17 | −1962 | −0.36 | −1695 | −0.09 |
| Combined growout and stocker | ||||||||||||
| Catfish sales receipts | ||||||||||||
| Total receipts | 14,428 | 2.44 | 16,664 | 2.44 | 15,546 | 2.44 | 17,150 | 2.44 | 14,565 | 2.43 | 15,857 | 2.44 |
| Variable costs | 13,495 | 4.90 | 14,139 | 4.37 | 13,817 | 4.64 | 13,646 | 4.17 | 14,207 | 4.96 | 13,926 | 4.56 |
| Income above variable costs | 933 | 0.16 | 2525 | 0.37 | 1729 | 0.26 | 3505 | 0.50 | 357 | 0.06 | 1931 | 0.28 |
| Fixed costs | 4938 | 1.81 | 4938 | 1.54 | 4938 | 1.68 | 3735 | 1.27 | 3735 | 1.44 | 3735 | 1.36 |
| Total costs | 18,432 | 6.71 | 19,077 | 5.91 | 18,754 | 6.31 | 17,381 | 5.44 | 17,942 | 6.40 | 17,662 | 5.92 |
| Net return above all costs | −4004 | −4.28 | −2413 | −3.47 | −3209 | −3.87 | −231 | −3.00 | −3378 | −3.97 | −1804 | −3.48 |
| RW 1 63 m3 | RW 2 63 m3 | Average RW 1 and 2 | RW 3 45 m3 | RW 4 45 m3 | Average RW 3 and 4 | |
|---|---|---|---|---|---|---|
| Economic Profit | ||||||
| Net return above all costs, USD | −1999 | −902 | −1450 | 1198 | −1416 | −109 |
| - NR USD/kg | −0.44 | −0.18 | −0.31 | 0.23 | −0.32 | −0.05 |
| Total cost, USD/kg | 2.89 | 2.62 | 2.76 | 2.23 | 2.77 | 2.50 |
| Accounting Profit | ||||||
| EBITDA a, USD | 2682 | 3776 | 3229 | 4920 | 2288 | 3604 |
| - NR USD/kg | 0.59 | 0.74 | 0.67 | 0.93 | 0.52 | 0.73 |
| Total cost, USD/kg | 1.85 | 1.71 | 1.78 | 1.52 | 1.92 | 1.72 |
| RW 1 14 m3 | RW 2 14 m3 | Average RW 1 and 2 | RW 3 14 m3 | RW 4 14 m3 | Average RW 3 and 4 | |
|---|---|---|---|---|---|---|
| Economic Profit | ||||||
| Net return above all costs, USD | −2005 | −1511 | −1758 | −1428 | −1962 | −1695 |
| - NR USD/kg | −0.48 | −0.22 | −0.35 | 0.17 | −0.36 | −0.09 |
| Total cost, USD/kg | 3.82 | 3.29 | 3.55 | 3.22 | 3.63 | 3.43 |
| Accounting Profit | ||||||
| EBITDA a, USD | −70 | 452 | 191 | 545 | 53 | 299 |
| - NR USD/kg | 0.55 | 0.69 | 0.62 | 0.88 | 0.49 | 0.68 |
| Total cost, USD/kg | 2.45 | 2.14 | 2.30 | 2.09 | 2.38 | 2.23 |
| Items | Investment Required per Scenario a | |||||||
|---|---|---|---|---|---|---|---|---|
| 1 | 2 | 3 | 4 | |||||
| 63 m3 IPRS | 45 m3 IPRS | 63 m3 IPRS | 45 m3 IPRS | 63 m3 IPRS | 45 m3 IPRS | 63 m3 IPRS | 45 m3 IPRS | |
| Capital items | ||||||||
| Land, USD/ha b | 986 | 986 | 0 | 0 | 0 | 0 | 0 | 0 |
| Pond construction c, USD | 1550 | 1550 | 1550 | 1550 | 1550 | 1550 | 0 | 0 |
| RW 1 and 2 (4.9 × 10.7 × 1.2 m = 63 m3) | 25,000 | - | 25,000 | - | 25,000 | - | 25,000 | - |
| RW 3 and 4 (3.0 × 12.2 × 1.2 m = 45 m3) | - | 6000 | - | 6000 | - | 6000 | - | 6000 |
| RW 1, 2, 3 and 4 (1.8 m × 5.8 m × 1.30 m = 14 m3) | 1867 | 1867 | 1867 | 1867 | 1867 | 1867 | 1867 | 1867 |
| Subtotal | 29,403 | 10,403 | 28,417 | 9417 | 28,417 | 9417 | 26,867 | 7867 |
| Machinery and equipment | ||||||||
| Equipment d, USD/ha | 1513 | 1513 | 1513 | 1513 | 303 | 303 | 0 | 0 |
| 1.0 HP blowers for water movers | 880 | 880 | 880 | 880 | 880 | 880 | 880 | 880 |
| 1.5 HP blower’s raceway units | 1200 | 1200 | 1200 | 1200 | 1200 | 1200 | 1200 | 1200 |
| 1.5 HP blowers for water movers | 1200 | 1200 | 1200 | 1200 | 1200 | 1200 | 1200 | 1200 |
| 1.0 HP blowers for small RW units | 900 | 900 | 900 | 900 | 900 | 900 | 900 | 900 |
| Water mover units (large RWs) | 2500 | 2500 | 2500 | 2500 | 2500 | 2500 | 2500 | 2500 |
| Water mover units (small RWs) | 1200 | 1200 | 1200 | 1200 | 1200 | 1200 | 1200 | 1200 |
| Baffle fencing and floats | 200 | 200 | 200 | 200 | 40 | 40 | 0 | 0 |
| Boardwalks—raceways 1 and 2 | 1000 | - | 1000 | - | 200 | - | 0 | - |
| Boardwalks—raceways 3 and 4 | - | 1200 | - | 1200 | - | 240 | - | 0 |
| Subtotal | 10,593 | 10,793 | 10,593 | 10,793 | 8423 | 8463 | 7880 | 7880 |
| TOTAL 2018 | 39,996 | 21,196 | 39,010 | 20,210 | 36,839 | 17,879 | 34,747 | 15,747 |
| RW1/RW2 (Growout +Stocker Unit) | RW3/RW4 (Growout +Stocker Unit) | ||||||||
|---|---|---|---|---|---|---|---|---|---|
| Feed Price | Fish Price | Scenario a | Scenario a | ||||||
| 1 | 2 | 3 | 4 | 1 | 2 | 3 | 4 | ||
| USD 370/MT | 1.95 | (5385) | (4691) | (4431) | (4253) | (4390) | (3386) | (3108) | (2890) |
| 2.19 | (3830) | (3136) | (2876) | (2698) | (2805) | (1800) | (1522) | (1305) | |
| 2.44 | (2275) | (1582) | (1322) | (1144) | (1219) | (214) | 63 | 281 | |
| 2.85 | (721) | (27) | 233 | 411 | 367 | 1372 | 1649 | 1867 | |
| 2.92 | 834 | 1528 | 1787 | 1966 | 1937 | 2941 | 3219 | 3437 | |
| USD 400/MT | 1.95 | (5696) | (4691) | (4742) | (4564) | (4683) | (3678) | (3401) | (3183) |
| 2.19 | (4141) | (3136) | (3187) | (3009) | (3097) | (2092) | (1815) | (1597) | |
| 2.44 | (2586) | (1582) | (1633) | (1455) | (1512) | (507) | (229) | (12) | |
| 2.85 | (1032) | (27) | (78) | 100 | 74 | 1079 | 1357 | 1574 | |
| 2.92 | 523 | 1528 | 1476 | 1654 | 1644 | 2649 | 2926 | 3144 | |
| USD 430/MT | 1.95 | (6318) | (5313) | (5053) | (4875) | (4976) | (3971) | (3693) | (3476) |
| 2.19 | (4763) | (3758) | (3499) | (3320) | (3390) | (2385) | (2108) | (1890) | |
| 2.44 | (3209) | (2204) | (1944) | (1766) | (1804) | (799) | (522) | (304) | |
| 2.85 | (1654) | (649) | (389) | (211) | (219) | 786 | 1064 | 1282 | |
| 2.92 | (99) | 905 | 1165 | 1343 | 1351 | 2356 | 2634 | 2851 | |
| USD 460/MT | 1.95 | (6836) | (5624) | (5364) | (5186) | (5268) | (4264) | (3986) | (3768) |
| 2.19 | (5282) | (4069) | (3810) | (3631) | (3683) | (2678) | (2400) | (2183) | |
| 2.44 | (3727) | (2515) | (2255) | (2077) | (2097) | (1092) | (815) | (597) | |
| 2.85 | (2172) | (960) | (700) | (522) | (511) | 494 | 771 | 989 | |
| 2.92 | (618) | 594 | 854 | 1032 | 1059 | 2063 | 2341 | 2559 | |
| USD 490/MT | 1.95 | (7355) | (5935) | (5675) | (5497) | (5561) | (4556) | (4279) | (4061) |
| 2.19 | (5800) | (4380) | (4121) | (3943) | (3975) | (2971) | (2693) | (2475) | |
| 2.44 | (4246) | (2826) | (2566) | (2388) | (2390) | (1385) | (1107) | (890) | |
| 2.85 | (2691) | (1271) | (1012) | (833) | (804) | 201 | 479 | 696 | |
| 2.92 | (1136) | 283 | 543 | 721 | 766 | 1771 | 2048 | 2266 | |
| Item | Investment Scenarios a | |||||||
|---|---|---|---|---|---|---|---|---|
| 1 | 2 | 3 | 4 | |||||
| Average Pond 1 and 2 | Average Pond 3 and 4 | Average Pond 1 and 2 | Average Pond 3 and 4 | Average Pond 1 and 2 | Average Pond 3 and 4 | Average Pond 1 and 2 | Average Pond 3 and 4 | |
| Financial net return, USD | 1421 | 7732 | 1421 | 7732 | 1737 | 8794 | 1928 | 9700 |
| Investment cost, USD | 39,996 | 21,196 | 39,010 | 20,210 | 36,839 | 17,879 | 34,747 | 15,747 |
| Payback period, year | 28.1 | 2.7 | 27.4 | 2.6 | 21.2 | 2.0 | 18.0 | 1.6 |
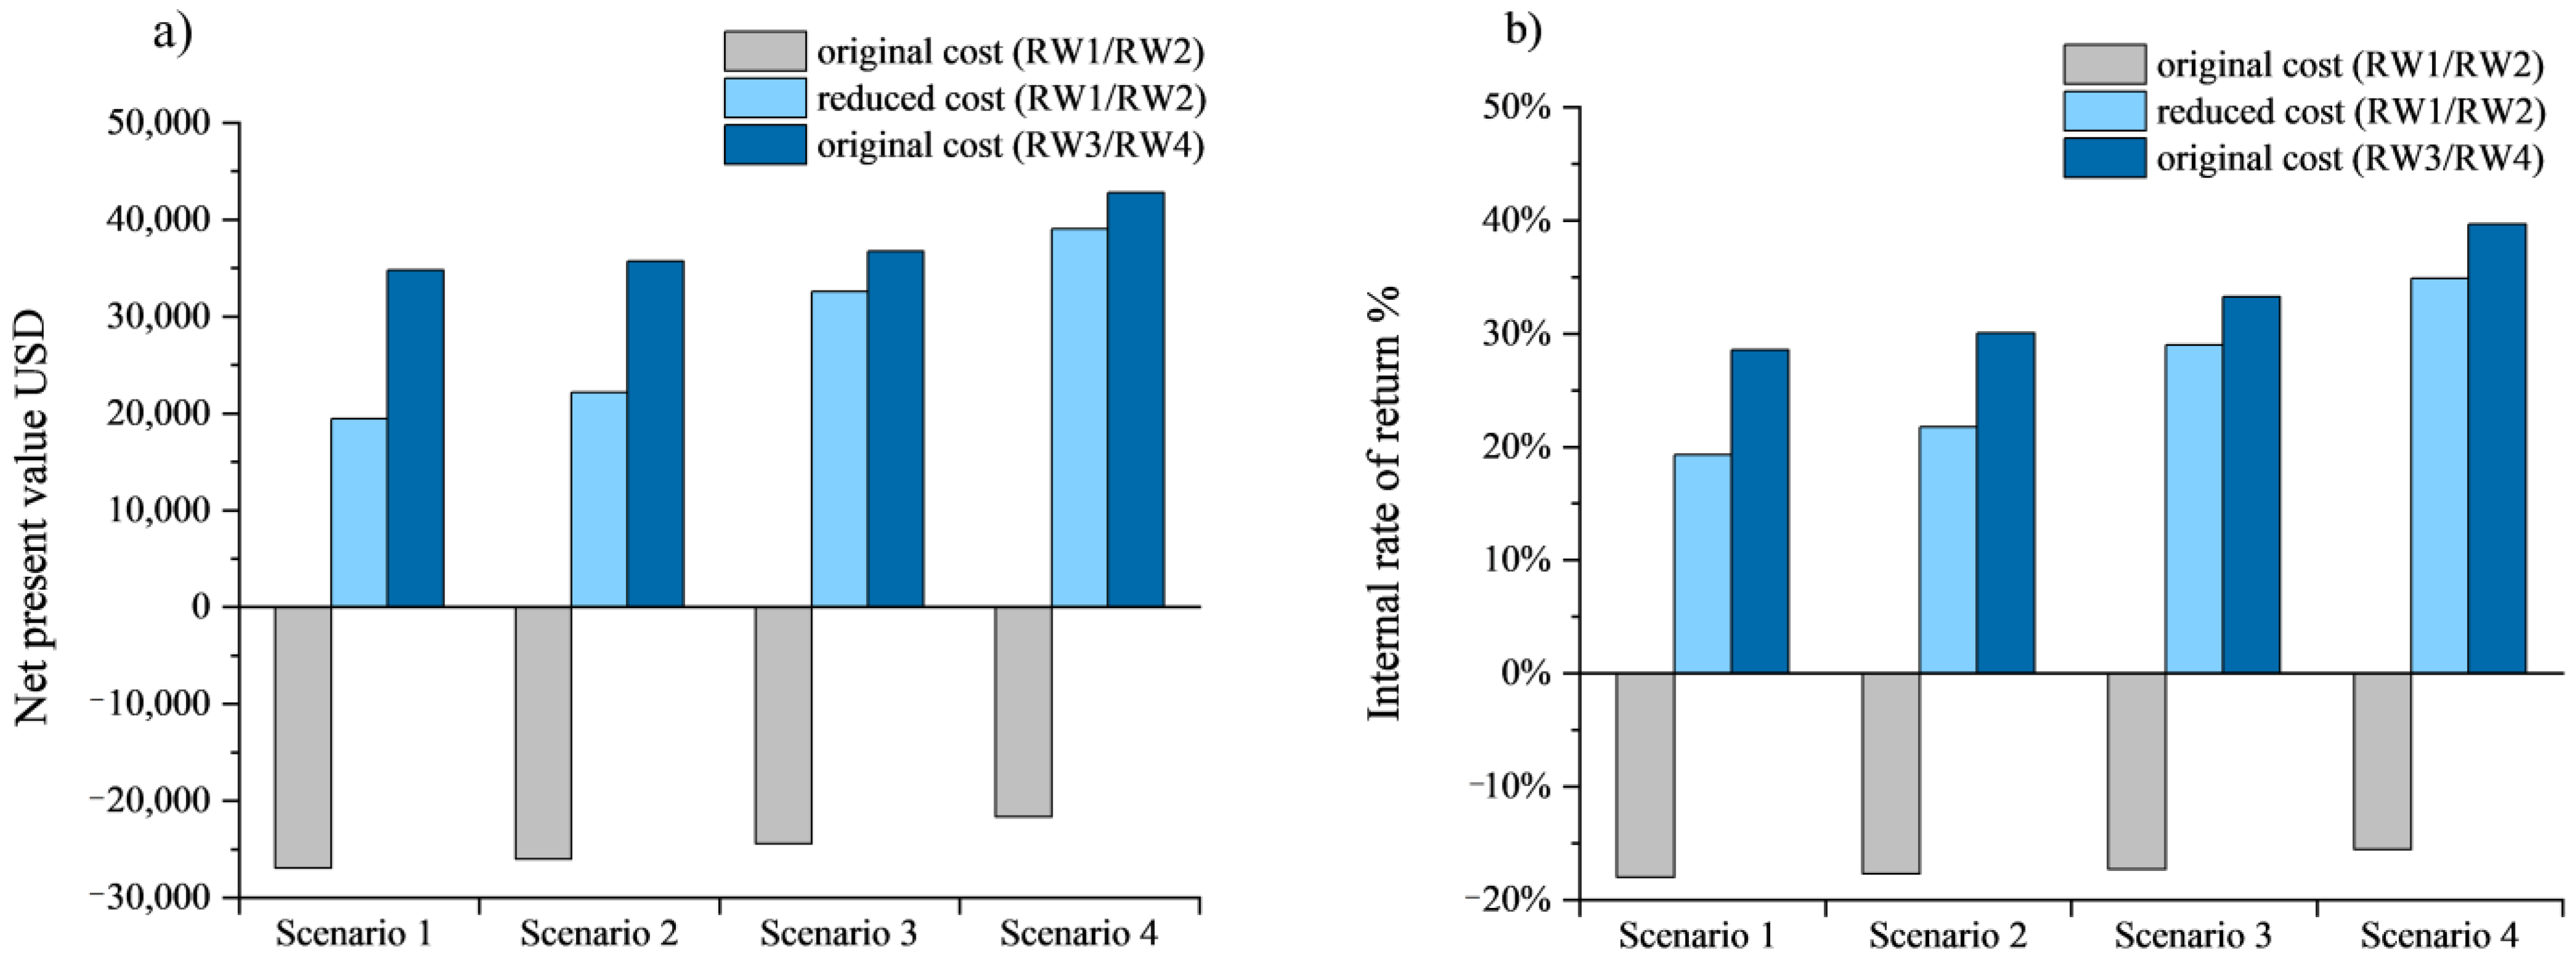
| Net present value, USD | −26,938 | 34,797 | −25,998 | 35,737 | −21,509 | 45,226 | −18,028 | 53,424 |
| Internal rate of return, % | −18.0% | 28.6% | −17.7% | 30.1% | −14.1% | 37.5% | −11.6% | 45.0% |
Disclaimer/Publisher’s Note: The statements, opinions and data contained in all publications are solely those of the individual author(s) and contributor(s) and not of MDPI and/or the editor(s). MDPI and/or the editor(s) disclaim responsibility for any injury to people or property resulting from any ideas, methods, instructions or products referred to in the content. |
© 2023 by the authors. Licensee MDPI, Basel, Switzerland. This article is an open access article distributed under the terms and conditions of the Creative Commons Attribution (CC BY) license (https://creativecommons.org/licenses/by/4.0/).
Share and Cite
Fantini-Hoag, L.; Hanson, T.; Chappell, J. Bioeconomic Analysis of In-Pond Raceway System Production of Foodsize and Stocker Hybrid Catfish (Channel Catfish Ictalurus punctatus ♀ × Blue Catfish, I. furcatus ♂). Fishes 2023, 8, 96. https://doi.org/10.3390/fishes8020096
Fantini-Hoag L, Hanson T, Chappell J. Bioeconomic Analysis of In-Pond Raceway System Production of Foodsize and Stocker Hybrid Catfish (Channel Catfish Ictalurus punctatus ♀ × Blue Catfish, I. furcatus ♂). Fishes. 2023; 8(2):96. https://doi.org/10.3390/fishes8020096
Chicago/Turabian StyleFantini-Hoag, Leticia, Terry Hanson, and Jesse Chappell. 2023. "Bioeconomic Analysis of In-Pond Raceway System Production of Foodsize and Stocker Hybrid Catfish (Channel Catfish Ictalurus punctatus ♀ × Blue Catfish, I. furcatus ♂)" Fishes 8, no. 2: 96. https://doi.org/10.3390/fishes8020096
APA StyleFantini-Hoag, L., Hanson, T., & Chappell, J. (2023). Bioeconomic Analysis of In-Pond Raceway System Production of Foodsize and Stocker Hybrid Catfish (Channel Catfish Ictalurus punctatus ♀ × Blue Catfish, I. furcatus ♂). Fishes, 8(2), 96. https://doi.org/10.3390/fishes8020096